airasia x berhad third quarter 2013 analysts...
TRANSCRIPT

AirAsia X Berhad Third Quarter 2013 Analysts Presentation

Disclaimer
Information contained in our presentation is intended solely for your reference. Such information is subject to change without notice, its accuracy is not guaranteed and it may not contain all material information concerning the Company. Neither we nor our advisors make any representation regarding, and assumes no responsibility or liability for, the accuracy or completeness of, any errors or omissions in, any information contained herein. In addition, the information may contain projections and forward-looking statements that reflect the company’s current views with respect to future events and financial performance. These views are based on current assumptions which are subject to various risk factors and which may change over time. No assurance can be given that future events will occur, that projections will be achieved, or that the company’s assumptions are correct. Actual results may differ materially from those projected. This presentation can be distributed without any consent of the Company as this is a publicly available announcement.
2

1 3Q13 Key Financial Highlights
3

3Q13 – Key Highlights 3-month ended 30 September 2013
Network Consolidation
ASK Capacity Number of Routes Average Weekly Frequency
0
5
10
15
20
3Q2012 3Q2013
17
13
0
2
4
6
8
3Q2012 3Q2013
6.8
6.0
0
2,000
4,000
6,000
3Q2012 3Q2013
(MM)
3,895
5,137
4

3Q13 – Key Highlights 3-month ended 30 September 2013
Topline Growth
Revenue
(RM MM)
RASK
(sen)
Ancillary Revenue per Passenger
0
200
400
600
800
3Q2012 3Q2013
486.6
601.5
0
5
10
15
3Q2012 3Q2013
12.2 12.0
-1.6%
0
60
120
180
3Q2012 3Q2013
139.2 144.3
+3.7%
(RM)
5

3Q13 – Key Highlights 3-month ended 30 September 2013
(%)
Improved Margins
EBITDAR margin
(%)
Operating Profit margin Net Operating Profit margin
(%)
0
5
10
15
20
3Q2012 3Q2013
16.1 17.4
0
2
4
6
3Q2012 3Q2013
2.8
4.1
0
0.2
0.4
0.6
0.8
1
3Q2012 3Q2013
0.2
0.8
6

3Q13 – Key Highlights 3-month ended 30 September 2013
Revenue, EBITDAR Margin, ASK Breakdown by Region
Revenue (RM MM)
ASK Capacity (MM)
EBITDAR Margin (%)
0
100
200
300
400
Australia North Asia Others
3Q2012 3Q2013
0
10
20
30
40
50
Australia North Asia Others
3Q2012 3Q2013
0
1000
2000
3000
4000
Australia North Asia Others
3Q2012 3Q2013
+18.2%
+35.1%
+16.5% -2.7ppt
+2.0ppt
unchanged
+30.6% +38.0%
+3.3%
7
181 214 232
313
64 75 10 7
17 19
42 42
1608 2100 1949
2689
337 348

2 YTD13 Key Financial Highlights Cumulative period ended 30 September 2013
8

YTD13 – Key Highlights 9-month ended 30 September 2013
Network Consolidation
Number of Routes Average Weekly Frequency ASK Capacity
0
5
10
15
20
25
9M2012 9M2013
17
-5.6%
0
2
4
6
8
9M2012 9M2013
5.2
6.0 +15.4%
0
2,000
4,000
6,000
8,000
10,000
12,000
14,000
16,000
9M2012 9M2013
12,196
13,296
+9.0%
18
(MM)
9

YTD13 – Key Highlights 9-month ended 30 September 2013
Topline Growth
Revenue
(RM MM)
RASK
(sen)
Ancillary Revenue per Passenger
0
500
1,000
1,500
2,000
9M2012 9M2013
1,428.5
1,627.9 +14.0%
0
5
10
15
9M2012 9M2013
11.5 12.4
+7.3%
0
50
100
150
200
9M2012 9M2013
133.9 145.3
+8.5%
(RM)
10

YTD13 – Key Highlights 9-month ended 30 September 2013
Improved Margins
(%)
EBITDAR margin Operating Profit/(Loss) margin
(%)
Net Operating Profit/(Loss) margin
(%)
0
5
10
15
20
9M2012 9M2013
14.2
17.7
0
2
4
6
9M2012 9M2013
0.6
4.4
(4)
(2)
0
2
4
9M2012 9M2013
(2.0)
1.3
11

YTD13 – Key Highlights 9-month ended 30 September 2013
Revenue, EBITDAR Margin, ASK Breakdown by Region
Revenue (RM MM)
ASK Capacity (MM)
EBITDAR Margin (%)
0
200
400
600
800
1000
Australia North Asia Others
9M2012
9M2013
0
10
20
30
40
Australia North Asia Others
9M2012 9M2013
0
2000
4000
6000
8000
Australia North Asia Others
9M2012 9M2013
+21.9% +32.5%
+62.6%
-4.5ppt unchanged
unchanged
+27.1% +28.9%
-63.5%
12
513 625 623
826
109 177
18 14
17 17
37 37
4309 5477 5350
6895
2537
925
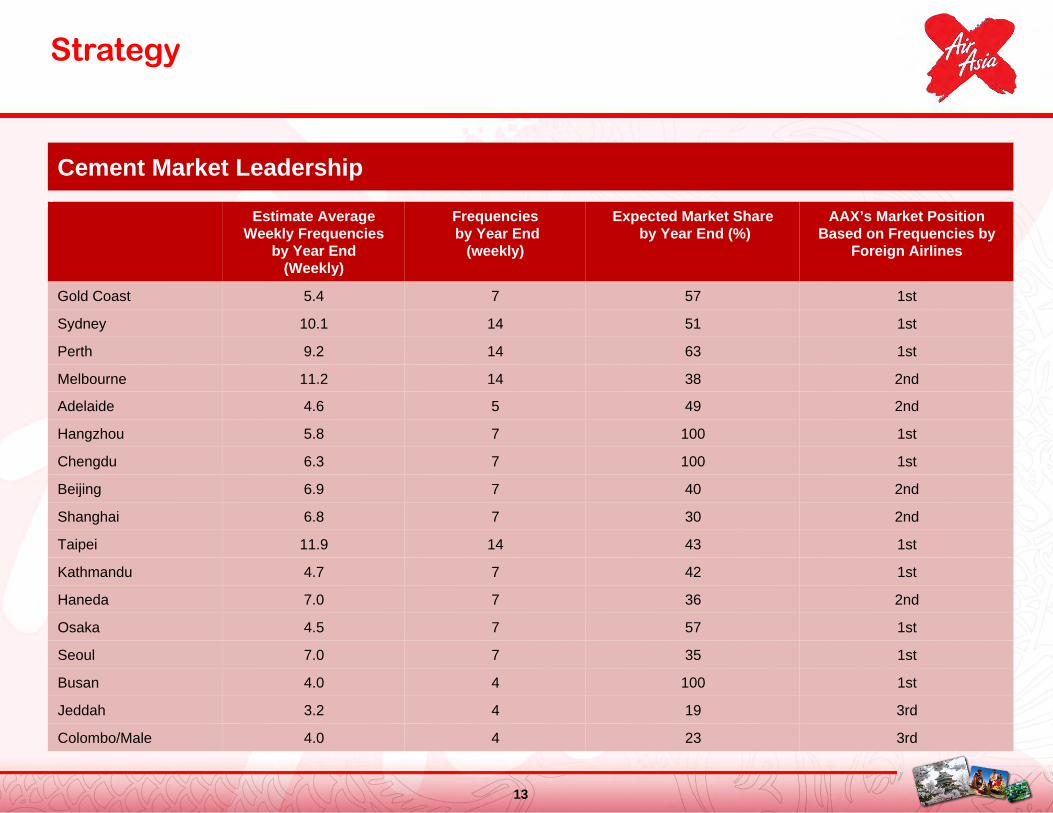
Strategy
Cement Market Leadership
13
Estimate Average Weekly Frequencies
by Year End (Weekly)
Frequencies by Year End
(weekly)
Expected Market Share by Year End (%)
AAX’s Market Position Based on Frequencies by
Foreign Airlines
Gold Coast 5.4 7 57 1st
Sydney 10.1 14 51 1st
Perth 9.2 14 63 1st
Melbourne 11.2 14 38 2nd
Adelaide 4.6 5 49 2nd
Hangzhou 5.8 7 100 1st
Chengdu 6.3 7 100 1st
Beijing 6.9 7 40 2nd
Shanghai 6.8 7 30 2nd
Taipei 11.9 14 43 1st
Kathmandu 4.7 7 42 1st
Haneda 7.0 7 36 2nd
Osaka 4.5 7 57 1st
Seoul 7.0 7 35 1st
Busan 4.0 4 100 1st
Jeddah 3.2 4 19 3rd
Colombo/Male 4.0 4 23 3rd

4Q13 Outlook
§ Fuel Hedging Strategy – Average of 29% at an average of USD123.13/bbl
§ Fleet Size – Total 18 (16 A330-300 + 2 A340-300)
§ New and Existing Routes – Total 18 routes § Update on Hubs – Thai AirAsia X to start operations by 1Q14
- Bali, Indonesia submitted application for AOL
§ Ancillary Income – Remains flat with an average of RM144 per passenger
14