airbus group 2014 fs ev
DESCRIPTION
Airbus Group 2014 Fs EvTRANSCRIPT

FINANCIAL STATEMENTS
AIR
BU
S G
RO
UP
– FINA
NC
IAL S
TATEM
EN
TS2
014
2014
ANNUAL REPORT


FINANCIAL STATEMENTS2014
2014
ANNUAL REPORT

AIRBUS GROUP FINANCIAL STATEMENTS 201402

AIRBUS GROUP FINANCIAL STATEMENTS 2014 03
2014
FINANCIALSTATEMENTS
1
2
3
4
5
Airbus Group N.V. — Consolidated
Financial Statements (IFRS)
Notes to the Consolidated Financial
Statements (IFRS)
Company Financial Statements
Notes to the Company Financial
Statements
Other Supplementary Information
including the Independent
Auditor’s report
Back to Contents54321 Q

AIRBUS GROUP FINANCIAL STATEMENTS 201404
1

AIRBUS GROUP FINANCIAL STATEMENTS 2014 05
1
Airbus Group N.V. — IFRS Consolidated Income Statements for the years ended 31 December 2014 and 2013 06
Airbus Group N.V. — IFRS Consolidated Statements of Comprehensive Income for the years ended 31 December 2014 and 2013 07
Airbus Group N.V. — IFRS Consolidated Statements of Financial Position at 31 December 2014, 2013 and adjusted opening 1 January 2013 08
Airbus Group N.V. — IFRS Consolidated Statements of Cash Flows for the years ended 31 December 2014 and 2013 10
Airbus Group N.V. — IFRS Consolidated Statements of Changes in Equity for the years ended 31 December 2014 and 2013 11
Airbus Group N.V. — Consolidated Financial Statements (IFRS)
Back to Contents54321 Q

AIRBUS GROUP FINANCIAL STATEMENTS 201406
Airbus Group N.V. — Consolidated Financial Statements (IFRS)
Airbus Group N.V. — IFRS Consolidated Income Statements for the y ears e nded 31 December 2014 and 2013
(In € million) Note 2014 2013(1)
Revenues 5, 6 60,713 57,567
Cost of sales 7 (51,776) (49,613)
Gross margin 8,937 7,954
Selling expenses (1,063) (1,140)
Administrative expenses (1,538) (1,622)
Research and development expenses 8 (3,391) (3,118)
Other income 9 330 272
Other expenses 10 (179) (259)
Share of profit from investments accounted for under the equity method 16 840 434
Other income from investments 17 55 49
Profit before finance costs and income taxes 5 3,991 2,570
Interest income 142 161
Interest expense (462) (493)
Other financial result (458) (278)
Total finance costs 11 (778) (610)
Income taxes 12 (863) (477)
Profit for the period 2,350 1,483
Attributable to:
Equity owners of the parent (Net income) 2,343 1,473
Non-controlling interests 7 10
Earnings per share € €
Basic 37 2.99 1.86
Diluted 37 2.99 1.85
(1) Previous year figures are adjusted due to the application of IFRS 10 and IFRS 11.
The accompanying notes are an integral part of these Consolidated Financial Statements (IFRS).
Back to Contents54321 Q

AIRBUS GROUP FINANCIAL STATEMENTS 2014 07
1Airbus Group N.V. — Consolidated Financial Statements (IFRS)
Airbus Group N.V. — IFRS Consolidated Statements of Comprehensive Income for the y ears e nded 31 December 2014 and 2013
(In € million) 2014 2013(1)
Profit for the period 2,350 1,483
Other comprehensive income
Items that will not be reclassified to profit or loss:
Remeasurement of the defined benefit liability (asset) (2,034) (67)
Remeasurement of the defined benefit liability (asset) from investments using the equity method (131) (1)
Related tax on items that will not be reclassified to profit or loss 577 20
Items that will be reclassified to profit or loss:
Foreign currency translation differences for foreign operations 244 (138)
Effective portion of changes in fair value of cash flow hedges (6,748) 1,841
Net change in fair value of cash flow hedges transferred to profit or loss 358 425
Net change in fair value of available-for-sale financial assets 90 12
Net change in fair value of available-for-sale financial assets transferred to profit or loss (19) (30)
Changes in other comprehensive income from investments accounted for using the equity method (22) (12)
Related tax on income and expense recognised directly in equity 1,961 (702)
Other comprehensive income, net of tax (5,724) 1,348
Total comprehensive income of the period (3,374) 2,831
Attributable to:
Equity owners of the parent (3,362) 2,829
Non-controlling interests (12) 2
(1) Previous year figures are adjusted due to the application of IFRS 10 and IFRS 11.
The accompanying notes are an integral part of these Consolidated Financial Statements (IFRS).
Back to Contents54321 Q
AIRBUS GROUP FINANCIAL STATEMENTS 201408
Airbus Group N.V. — Consolidated Financial Statements (IFRS)
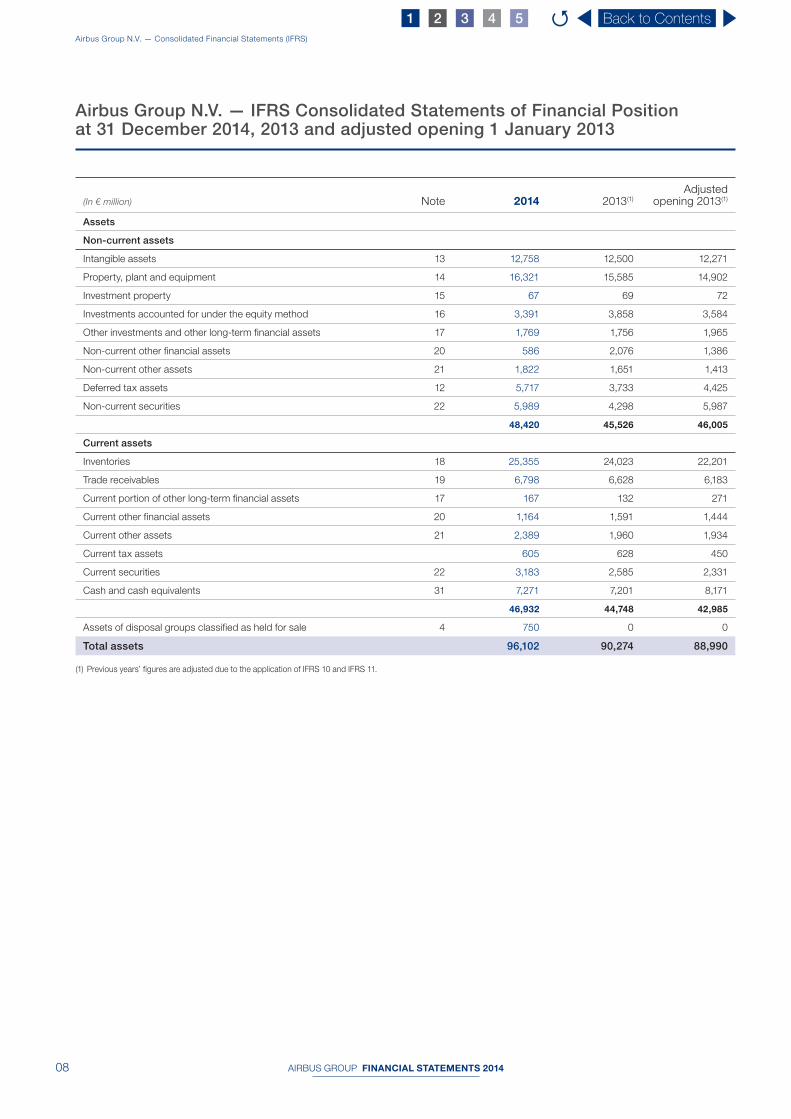
Airbus Group N.V. — IFRS Consolidated Statements of Financial Position at 31 December 2014, 2013 and a djusted o pening 1 January 2013
(In € million) Note 2014 2013(1)
Adjusted opening 2013(1)
Assets
Non-current assets
Intangible assets 13 12,758 12,500 12,271
Property, plant and equipment 14 16,321 15,585 14,902
Investment property 15 67 69 72
Investments accounted for under the equity method 16 3,391 3,858 3,584
Other investments and other long-term financial assets 17 1,769 1,756 1,965
Non-current other financial assets 20 586 2,076 1,386
Non-current other assets 21 1,822 1,651 1,413
Deferred tax assets 12 5,717 3,733 4,425
Non-current securities 22 5,989 4,298 5,987
48,420 45,526 46,005
Current assets
Inventories 18 25,355 24,023 22,201
Trade receivables 19 6,798 6,628 6,183
Current portion of other long-term financial assets 17 167 132 271
Current other financial assets 20 1,164 1,591 1,444
Current other assets 21 2,389 1,960 1,934
Current tax assets 605 628 450
Current securities 22 3,183 2,585 2,331
Cash and cash equivalents 31 7,271 7,201 8,171
46,932 44,748 42,985
Assets of disposal groups classified as held for sale 4 750 0 0
Total assets 96,102 90,274 88,990
(1) Previous years’ figures are adjusted due to the application of IFRS 10 and IFRS 11.
Back to Contents54321 Q

AIRBUS GROUP FINANCIAL STATEMENTS 2014 09
1Airbus Group N.V. — Consolidated Financial Statements (IFRS)
(In € million) Note 2014 2013(1)
Adjusted opening 2013(1)
Equity and liabilities
Equity attributable to equity owners of the parent
Capital stock 785 783 827
Share premium 4,500 5,049 7,253
Retained earnings 2,989 2,167 753
Accumulated other comprehensive income (1,205) 2,915 1,511
Treasury shares (8) (50) (84)
7,061 10,864 10,260
Non-controlling interests 18 42 16
Total equity 23 7,079 10,906 10,276
Non-current liabilities
Non-current provisions 25 10,400 9,604 9,411
Long-term financing liabilities 26 6,278 3,804 3,312
Non-current other financial liabilities 27 9,922 7,154 7,454
Non-current other liabilities 28 12,849 10,764 10,496
Deferred tax liabilities 12 1,130 1,454 1,459
Non-current deferred income 30 267 237 211
40,846 33,017 32,343
Current liabilities
Current provisions 25 5,712 5,222 5,940
Short-term financing liabilities 26 1,073 1,826 1,463
Trade liabilities 29 10,183 9,668 9,271
Current other financial liabilities 27 3,480 1,465 1,712
Current other liabilities 28 25,222 26,570 26,485
Current tax liabilities 738 616 441
Current deferred income 30 1,089 984 1,059
47,497 46,351 46,371
Liabilities of disposal groups classified as held for sale 4 680 0 0
Total liabilities 89,023 79,368 78,714
Total equity and liabilities 96,102 90,274 88,990
(1) Previous years’ figures are adjusted due to the application of IFRS 10 and IFRS 11.
The accompanying notes are an integral part of these Consolidated Financial Statements (IFRS).
Back to Contents54321 Q

AIRBUS GROUP FINANCIAL STATEMENTS 201410
Airbus Group N.V. — Consolidated Financial Statements (IFRS)
Airbus Group N.V. — IFRS Consolidated Statements of Cash Flows for the y ears e nded 31 December 2014 and 2013
(In € million) Note 2014 2013(1)
Profit for the period attributable to equity owners of the parent (Net income) 2,343 1,473
Profit for the period attributable to non-controlling interests 7 10
Adjustments to reconcile profit for the period to cash provided by operating activities:
Interest income (142) (161)
Interest expense 462 493
Interest received 99 99
Interest paid (303) (304)
Income tax expense 863 477
Income taxes paid (115) (243)
Depreciation and amortisation 2,150 1,927
Valuation adjustments 562 48
Results on disposals of non-current assets (93) (58)
Results of investments accounted for by the equity method (840) (434)
Change in current and non-current provisions 415 816
Reimbursement from / contribution to plan assets (462) (223)
Change in other operating assets and liabilities: (2,386) (2,091)
■ Inventories (3,252) (3,102)
■ Trade receivables (700) (83)
■ Trade liabilities 130 522
■ Advance payments received 1,715 580
■ Other assets and liabilities (387) 311
■ Customer financing assets 124 (327)
■ Customer financing liabilities (16) 8
Cash provided by operating activities 2,560 1,829
Investments:
■ Purchases of intangible assets, property, plant and equipment, investment property (2,548) (2,918)
■ Proceeds from disposals of intangible assets, property, plant and equipment, investment property 232 48
■ Acquisitions of subsidiaries, joint ventures, businesses and non-controlling interests (net of cash) 31 (47) (16)
■ Proceeds from disposals of subsidiaries (net of cash) 31 (34) 0
■ Payments for investments in associates, joint ventures, other investments and other long-term financial assets (36) (293)
■ Proceeds from disposals of associates, joint ventures, other investments and other long-term financial assets 1,083 154
■ Dividends paid by companies valued at equity 143 146
Payments for investments in securities (5,526) (1,398)
Proceeds from disposals of securities 3,510 2,665
Cash (used for) investing activities (3,223) (1,612)
Increase in financing liabilities 2,038 1,667
Repayment of financing liabilities (1,108) (534)
Cash distribution to Airbus Group N.V. shareholders (587) (467)
Dividends paid to non-controlling interests (2) (2)
Changes in capital and non-controlling interests 52 171
Change in treasury shares 102 (1,915)
Cash provided by (used for) financing activities 495 (1,080)
Effect of foreign exchange rate changes and other valuation adjustments on cash and cash equivalents 256 (107)
Net increase (decrease) in cash and cash equivalents 88 (970)
Cash and cash equivalents at beginning of period 7,201 8,171
Cash and cash equivalents at end of period 7,289 7,201
Thereof presented as cash and cash equivalents 7,271 7,201
Thereof presented as part of disposal groups classified as held for sale 18 0
(1) Previous year figures are adjusted due to the application of IFRS 10 and IFRS 11.
The accompanying notes are an integral part of these Consolidated Financial Statements (IFRS).
Back to Contents54321 Q

AIRBUS GROUP FINANCIAL STATEMENTS 2014 11
1Airbus Group N.V. — Consolidated Financial Statements (IFRS)
Airbus Group N.V. — IFRS Consolidated Statements of Changes in Equity for the y ears e nded 31 December 2014 and 2013
Equity attributable to equity holders of the parent
Non-controlling
interestsTotal
equity
Capital stock
Share premium
Retained earnings
Accumulated other comprehensive income
Treasury shares Total(In € million) Note
Available-for-sale
financial assets
Cash flow
hedges
Foreign currency
translation adjustments
Balance at 31 December 2012, as reported 827 7,253 894 563 (417) 1,367 (84) 10,403 17 10,420
Adjustments(1) 0 0 (141) 31 (7) (26) 0 (143) (1) (144)
Balance at 1 January 2013, adjusted(1) 827 7,253 753 594 (424) 1,341 (84) 10,260 16 10,276
Profit for the period(1) 0 0 1,473 0 0 0 0 1,473 10 1,483
Other comprehensive income(1) 0 0 (48) 31 1,525 (152) 0 1,356 (8) 1,348
Total comprehensive income of the period(1) 0 0 1,425 31 1,525 (152) 0 2,829 2 2,831
Capital increase 23 9 233 0 0 0 0 0 242 2 244
Capital decrease 23 0 (74) 0 0 0 0 0 (74) 0 (74)
Share-based Payment (IFRS 2) 35 0 0 107 0 0 0 0 107 0 107
Cash distribution to Airbus Group N.V. s hareholders / dividends paid to non- controlling interests 0 (467) 0 0 0 0 0 (467) (2) (469)
Equity transaction (IAS 27) 0 0 (118) 0 0 0 0 (118) 24 (94)
Change in non-controlling interests 0 0 0 0 0 0 0 0 0 0
Change in treasury shares 23 0 0 0 0 0 0 0 0 0 0
Cancellation of treasury shares 23 (53) (1,896) 0 0 0 0 34 (1,915) 0 (1,915)
Balance at 31 December 2013, adjusted(1) 783 5,049 2,167 625 1,101 1,189 (50) 10,864 42 10,906
Profit for the period 0 0 2,343 0 0 0 0 2,343 7 2,350
Other comprehensive income 0 0 (1,585) 45 (4,411) 246 0 (5,705) (19) (5,724)
Total comprehensive income of the period 0 0 758 45 (4,411) 246 0 (3,362) (12) (3,374)
Capital increase 23 2 50 0 0 0 0 0 52 0 52
Capital decrease 23 0 (12) 0 0 0 0 0 (12) 0 (12)
Share-based Payment (IFRS 2) 35 0 0 (5) 0 0 0 0 (5) 0 (5)
Cash distribution to Airbus Group N.V. s hareholders / dividends paid to non- controlling interests 0 (587) 0 0 0 0 0 (587) (2) (589)
Equity transaction (IAS 27) 0 0 (3) 0 0 0 0 (3) 7 4
Change in non-controlling interests 0 0 0 0 0 0 0 0 (17) (17)
Change in treasury shares 23 0 0 72 0 0 0 0 72 0 72
Cancellation of treasury shares 23 0 0 0 0 0 0 42 42 0 42
Balance at 31 December 2014 785 4,500 2,989 670 (3,310) 1,435 (8) 7,061 18 7,079
(1) Previous years’ figures are adjusted due to the application of IFRS 10 and IFRS 11.
The accompanying notes are an integral part of these Consolidated Financial Statements (IFRS).
Back to Contents54321 Q

AIRBUS GROUP FINANCIAL STATEMENTS 201412
2
AIRBUS GROUP FINANCIAL STATEMENTS 2014 13
2
2.1 Basis of Presentation 15
2.2 Notes to the Consolidated Income Statements 37
2.3 Notes to the Consolidated Statements
of Financial Position 46
2.4 Notes to the Consolidated Statements of Cash Flows 73
2.5 Other Notes to the Consolidated Financial Statements 75
2.6 Appendix “Information on Principal Investments”
– Consolidation Scope 103
Notes to the Consolidated Financial Statements (IFRS)
Back to Contents54321 Q
AIRBUS GROUP FINANCIAL STATEMENTS 201414
Notes to the Consolidated Financial Statements (IFRS)
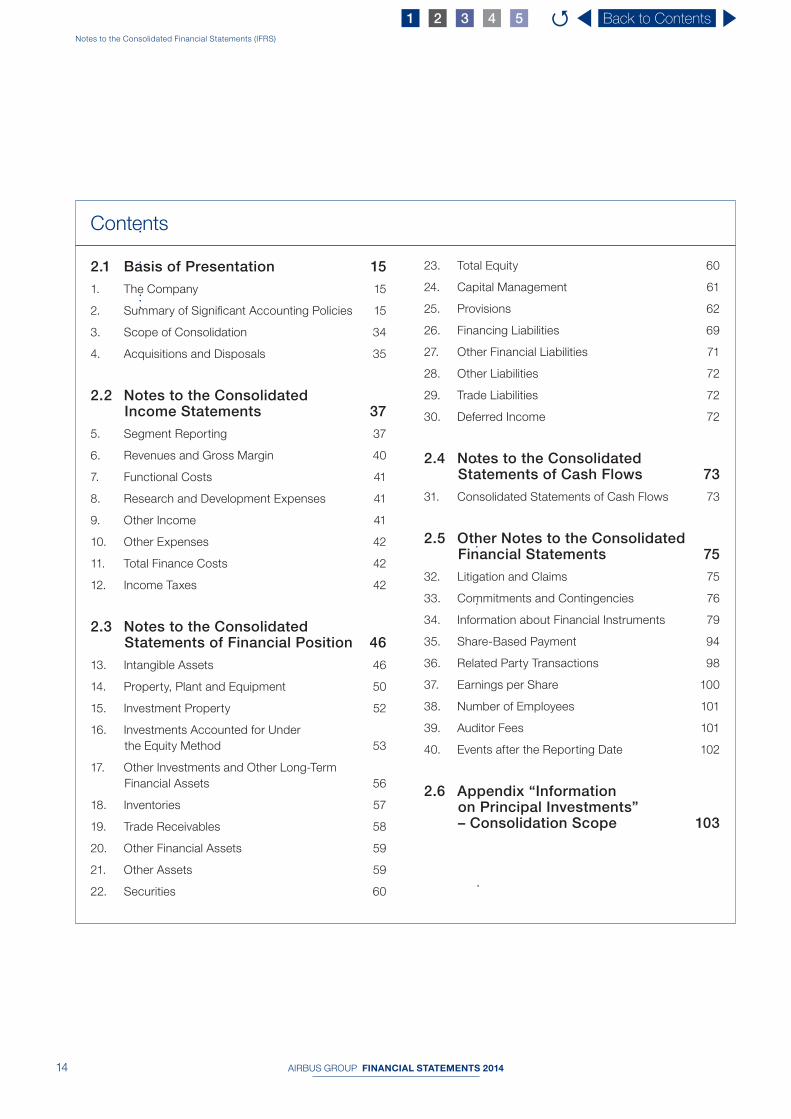
Contents
2.1 Basis of Presentation 15
1. The Company 15
2. Summary of Signifi cant Accounting Policies 15
3. Scope of Consolidation 34
4. Acquisitions and Disposals 35
2.2 Notes to the Consolidated Income Statements 37
5. Segment Reporting 37
6. Revenues and Gross Margin 40
7. Functional Costs 41
8. Research and Development Expenses 41
9. Other Income 41
10. Other Expenses 42
11. Total Finance Costs 42
12. Income Taxes 42
2.3 Notes to the Consolidated Statements of Financial Position 46
13. Intangible Assets 46
14. Property, Plant and Equipment 50
15. Investment Property 52
16. Investments Accounted for Under
the Equity Method 53
17. Other Investments and Other Long-Term
Financial Assets 56
18. Inventories 57
19. Trade Receivables 58
20. Other Financial Assets 59
21. Other Assets 59
22. Securities 60
23. Total Equity 60
24. Capital Management 61
25. Provisions 62
26. Financing Liabilities 69
27. Other Financial Liabilities 71
28. Other Liabilities 72
29. Trade Liabilities 72
30. Deferred Income 72
2.4 Notes to the Consolidated Statements of Cash Flows 73
31. Consolidated Statements of Cash Flows 73
2.5 Other Notes to the Consolidated Financial Statements 75
32. Litigation and Claims 75
33. Commitments and Contingencies 76
34. Information about Financial Instruments 79
35. Share-Based Payment 94
36. Related Party Transactions 98
37. Earnings per Share 100
38. Number of Employees 101
39. Auditor Fees 101
40. Events after the Reporting Date 102
2.6 Appendix “Information on Principal Investments” – Consolidation Scope 103
Back to Contents54321 Q

2.1 Basis of Presentation
AIRBUS GROUP FINANCIAL STATEMENTS 2014 15
2
Notes to the Consolidated Financial Statements (IFRS)
2 .1 Basis of Presentation
1. The Company
The accompanying IFRS Consolidated Financial Statements present
the fi nancial position and the result of the operations of Airbus
Group N.V. (formerly European Aeronautic Defence and Space
Company EADS N.V.) and its subsidiaries (the “Group”), a Dutch
public limited liability company (Naamloze Vennootschap) legally
seated in Amsterdam (current registered offi ce at Mendelweg 30,
2333 CS Leiden, The Netherlands). On 1 January 2014, the Group
has been rebranded from EADS to Airbus Group as part of a wider
reorganisation including integration of the Group’s defence and
space activities. The Group’s core business is the manufacturing
of commercial aircraft, civil and military helicopters, commercial
space launch vehicles, missiles, military aircraft, satellites, defence
systems, defence electronics and the rendering of services related
to these activities. Airbus Group has its listings at the European
Stock Exchanges in Paris, Frankfurt am Main, Madrid, Barcelona,
Valencia and Bilbao. The IFRS Consolidated Financial Statements
were authorised for issue by the Group’s Board of Directors on
26 February 2015. They are prepared and reported in euro (“€”),
and all values are rounded to the nearest million appropriately.
2. Summary of Signifi cant Accounting Policies
Basis of preparation — The Group’s Consolidated Financial
Statements are prepared in accordance with International
Financial Reporting Standards (“IFRS”), issued by the International
Accounting Standards Board (“IASB”) as endorsed by the European
Union (“EU”) and with Part 9 of Book 2 of the Netherlands Civil
Code. The Consolidated Financial Statements have been prepared
on a historical cost basis, except for certain items for which other
measurement models are used in accordance with the applicable
Standards’ requirements. The measurement models used when
the historical cost model does not apply (mainly in the area of
fair value measurement of derivative fi nancial instruments and
employee benefi ts) are further described below.
In accordance with Article 402 Book 2 of the Netherlands Civil
Code the Statement of Income of the Airbus Group N.V. c ompany
financial statements is presented in abbreviated form.
The preparation of financial statements in conformity with
IFRS requires the use of certain critical accounting estimates. It
also requires management to exercise its judgment in the process
of applying the Group’s accounting policies. The areas involving
a higher degree of judgment or complexity, or areas where
assumptions and estimates are significant to the Consolidated
Financial Statements are disclosed in the last subsection
“Management judgment and use of Accounting Estimates” of
this Note 2.
The Group changed the presentation of its Consolidated Financial
Statements to one comparison period in line with prevailing practice
of other European public companies.
New, r evised or a mended IFRS Standards
The IFRS accounting principles applied by the Group for preparing
its 2014 year-end Consolidated Financial Statements are the same
as for the previous fi nancial year except for the application of new
or amended Standards as detailed below.
The application of the following amendments to IFRS is mandatory
for the Group for the fi scal year starting 1 January 2014. Their
application did not have a material impact on the Group’s
Consolidated Financial Statements as well as its basic and diluted
earnings per share.
Amendments to IAS 32 “Financial Instruments: Presentation”
clarifying the IASB’s requirements for offsetting financial
instruments.
Amendments to IAS 39 “Financial Instruments: Recognition
and Measurement” provide an exception to the requirement for
the discontinuation of hedge accounting in IAS 39 and IFRS 9
in circumstances when a hedging instrument is required to be
novated to a central counterparty as a result of laws or regulations.
In 2011, the IASB issued IFRS 10 “Consolidated Financial
Statements”, IFRS 11 “Joint Arrangements”, IFRS 12
“Disclosure of Interests in Other Entities” and consequential
amendments to IAS 27 “Separate Financial Statements” and
to IAS 28 “Investments in Associates and Joint Ventures”. In
2012, the IASB issued the Transition Guidance (Amendments for
IFRS 10, IFRS 11 and IFRS 12). The main purpose of the new set of
standards is the introduction of (i) one consistent principle of control
applicable for the consolidation assessment of all kinds of entities,
(ii) the distinction between two types of joint arrangement, joint
ventures and joint operations based on the rights and obligations
Back to Contents54321 Q

AIRBUS GROUP FINANCIAL STATEMENTS 201416
Notes to the Consolidated Financial Statements (IFRS)2.1 Basis of Presentation
arising from the underlying arrangement, (iii) termination of the
proportionate method for recognition of joint ventures and (iv)
disclosure requirements for all forms of interests in other entities,
including subsidiaries, joint arrangements, associates, structured
entities (formerly referred to as “special purpose entities”) and off-
balance sheet vehicles in one single standard (see “Consolidation”).
The fi rst time application of IFRS 10 and IFRS 11 had an impact on
Airbus Group’s Consolidated Financial Statements: t he application
of the new control concept as defi ned by IFRS 10 resulted in the
exclusion of fi ve structured entities which were previously fully
consolidated from the consolidation scope (see Note 3 “Scope of
consolidation”). Additionally, twelve entities which were previously
classifi ed as joint ventures under IAS 31 and consolidated using the
proportional consolidation method in accordance with the Airbus
Group accounting policy choice under IAS 31 are now accounted
for using the equity method (see signifi cant policy relative to
joint arrangements). Accordingly, application of IFRS 11 had a
material impact on the Group’s fi nancial statements. The fi rst time
application of IFRS 11 did not result in any reassessment regarding
the classifi cation of Airbus Group entities as joint ventures.
Back to Contents54321 Q
AIRBUS GROUP FINANCIAL STATEMENTS 2014 17
2
Notes to the Consolidated Financial Statements (IFRS)2.1 Basis of Presentation
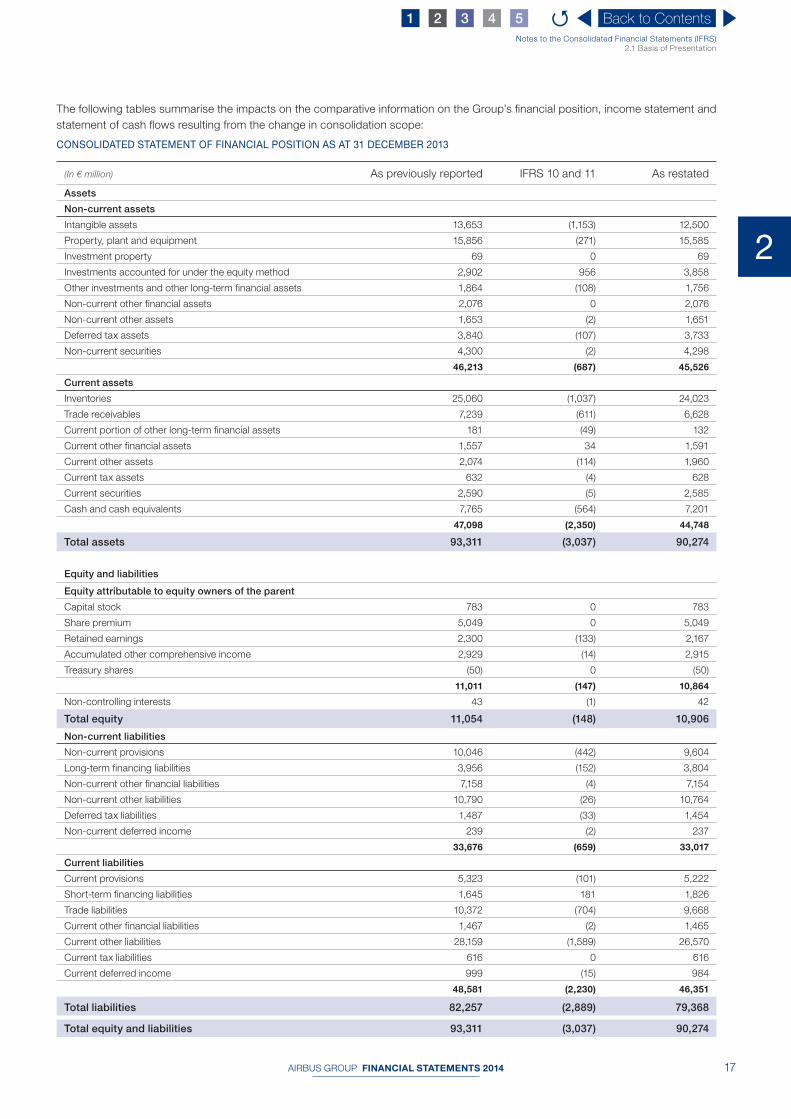
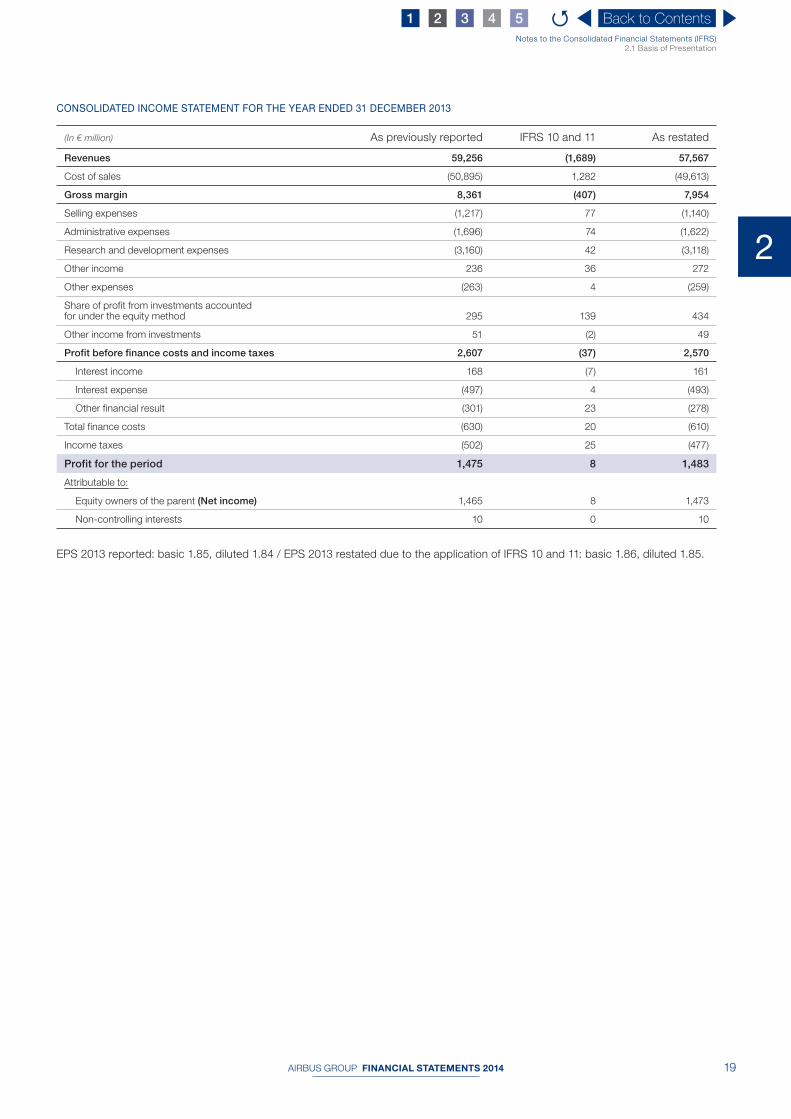
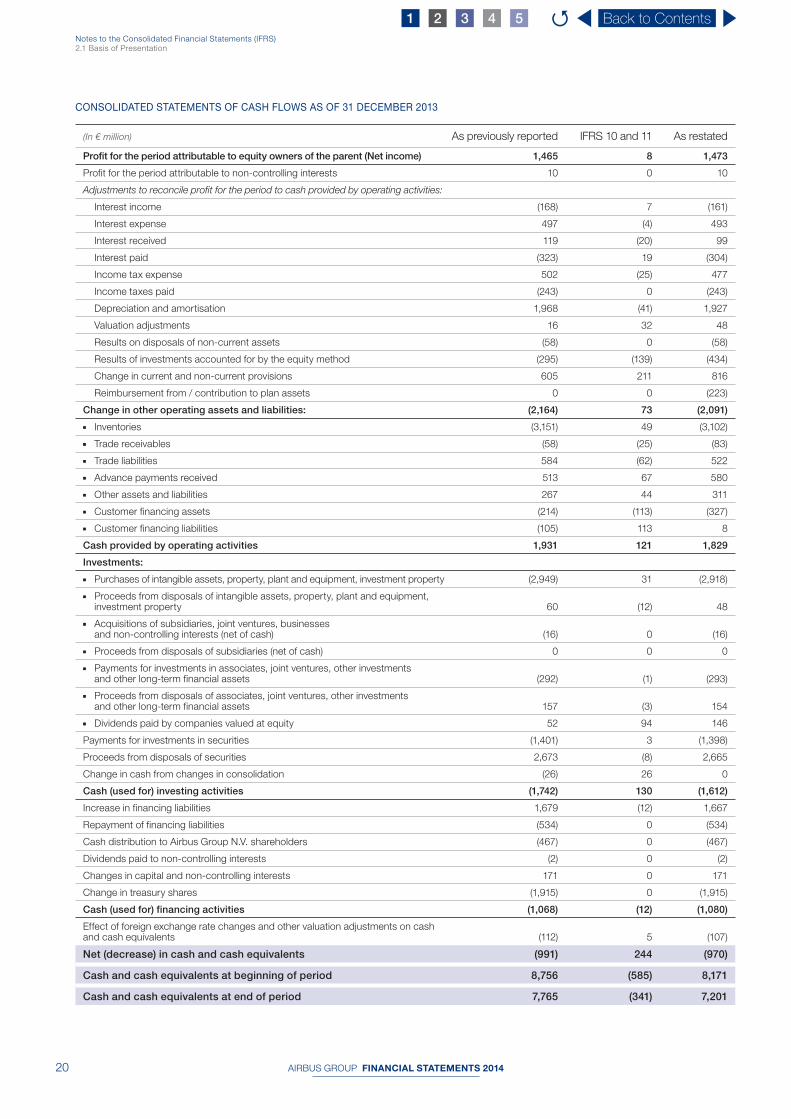
The following tables summarise the impacts on the comparative information on the Group’s fi nancial position, income statement and
statement of cash fl ows resulting from the change in consolidation scope:
CONSOLIDATED STATEMENT OF FINANCIAL POSITION AS AT 31 DECEMBER 2013
(In € million) As previously reported IFRS 10 and 11 As restated
Assets
Non-current assets
Intangible assets 13,653 (1,153) 12,500
Property, plant and equipment 15,856 (271) 15,585
Investment property 69 0 69
Investments accounted for under the equity method 2,902 956 3,858
Other investments and other long-term financial assets 1,864 (108) 1,756
Non-current other financial assets 2,076 0 2,076
Non-current other assets 1,653 (2) 1,651
Deferred tax assets 3,840 (107) 3,733
Non-current securities 4,300 (2) 4,298
46,213 (687) 45,526
Current assets
Inventories 25,060 (1,037) 24,023
Trade receivables 7,239 (611) 6,628
Current portion of other long-term financial assets 181 (49) 132
Current other financial assets 1,557 34 1,591
Current other assets 2,074 (114) 1,960
Current tax assets 632 (4) 628
Current securities 2,590 (5) 2,585
Cash and cash equivalents 7,765 (564) 7,201
47,098 (2,350) 44,748
Total assets 93,311 (3,037) 90,274
Equity and liabilities
Equity attributable to equity owners of the parent
Capital stock 783 0 783
Share premium 5,049 0 5,049
Retained earnings 2,300 (133) 2,167
Accumulated other comprehensive income 2,929 (14) 2,915
Treasury shares (50) 0 (50)
11,011 (147) 10,864
Non-controlling interests 43 (1) 42
Total equity 11,054 (148) 10,906
Non-current liabilities
Non-current provisions 10,046 (442) 9,604
Long-term financing liabilities 3,956 (152) 3,804
Non-current other financial liabilities 7,158 (4) 7,154
Non-current other liabilities 10,790 (26) 10,764
Deferred tax liabilities 1,487 (33) 1,454
Non-current deferred income 239 (2) 237
33,676 (659) 33,017
Current liabilities
Current provisions 5,323 (101) 5,222
Short-term financing liabilities 1,645 181 1,826
Trade liabilities 10,372 (704) 9,668
Current other financial liabilities 1,467 (2) 1,465
Current other liabilities 28,159 (1,589) 26,570
Current tax liabilities 616 0 616
Current deferred income 999 (15) 984
48,581 (2,230) 46,351
Total liabilities 82,257 (2,889) 79,368
Total equity and liabilities 93,311 (3,037) 90,274
Back to Contents54321 Q

AIRBUS GROUP FINANCIAL STATEMENTS 201418
Notes to the Consolidated Financial Statements (IFRS)2.1 Basis of Presentation
CONSOLIDATED STATEMENT OF FINANCIAL POSITION AS AT 1 JANUARY 2013
(In € million) As previously reported IFRS 10 and 11 As restated
Assets
Non-current assets
Intangible assets 13,429 (1,158) 12,271
Property, plant and equipment 15,196 (294) 14,902
Investment property 72 0 72
Investments accounted for under the equity method 2,662 922 3,584
Other investments and other long-term financial assets 2,115 (150) 1,965
Non-current other financial assets 1,386 0 1,386
Non-current other assets 1,415 (2) 1,413
Deferred tax assets 4,532 (107) 4,425
Non-current securities 5,987 0 5,987
46,794 (789) 46,005
Current assets
Inventories 23,216 (1,015) 22,201
Trade receivables 6,788 (605) 6,183
Current portion of other long-term financial assets 287 (16) 271
Current other financial assets 1,448 (4) 1,444
Current other assets 2,046 (112) 1,934
Current tax assets 458 (8) 450
Current securities 2,328 3 2,331
Cash and cash equivalents 8,756 (585) 8,171
45,327 (2,342) 42,985
Total assets 92,121 (3,131) 88,990
Equity and liabilities
Equity attributable to equity owners of the parent
Capital stock 827 0 827
Share premium 7,253 0 7,253
Retained earnings 894 (141) 753
Accumulated other comprehensive income 1,513 (2) 1,511
Treasury shares (84) 0 (84)
10,403 (143) 10,260
Non-controlling interests 17 (1) 16
Total equity 10,420 (144) 10,276
Non-current liabilities
Non-current provisions 9,850 (439) 9,411
Long-term financing liabilities 3,506 (194) 3,312
Non-current other financial liabilities 7,458 (4) 7,454
Non-current other liabilities 10,524 (28) 10,496
Deferred tax liabilities 1,502 (43) 1,459
Non-current deferred income 212 (1) 211
33,052 (709) 32,343
Current liabilities
Current provisions 6,039 (99) 5,940
Short-term financing liabilities 1,273 190 1,463
Trade liabilities 9,921 (650) 9,271
Current other financial liabilities 1,715 (3) 1,712
Current other liabilities 28,183 (1,698) 26,485
Current tax liabilities 458 (17) 441
Current deferred income 1,060 (1) 1,059
48,649 (2,278) 46,371
Total liabilities 81,701 (2,987) 78,714
Total equity and liabilities 92,121 (3,131) 88,990
Back to Contents54321 Q
AIRBUS GROUP FINANCIAL STATEMENTS 2014 19
2
Notes to the Consolidated Financial Statements (IFRS)2.1 Basis of Presentation
CONSOLIDATED INCOME STATEMENT FOR THE YEAR ENDED 31 DECEMBER 2013
(In € million) As previously reported IFRS 10 and 11 As restated
Revenues 59,256 (1,689) 57,567
Cost of sales (50,895) 1,282 (49,613)
Gross margin 8,361 (407) 7,954
Selling expenses (1,217) 77 (1,140)
Administrative expenses (1,696) 74 (1,622)
Research and development expenses (3,160) 42 (3,118)
Other income 236 36 272
Other expenses (263) 4 (259)
Share of profit from investments accounted for under the equity method 295 139 434
Other income from investments 51 (2) 49
Profit before finance costs and income taxes 2,607 (37) 2,570
Interest income 168 (7) 161
Interest expense (497) 4 (493)
Other financial result (301) 23 (278)
Total finance costs (630) 20 (610)
Income taxes (502) 25 (477)
Profit for the period 1,475 8 1,483
Attributable to:
Equity owners of the parent (Net income) 1,465 8 1,473
Non-controlling interests 10 0 10
EPS 2013 reported: basic 1.85, diluted 1.84 / EPS 2013 restated due to the application of IFRS 10 and 11: basic 1.86, diluted 1.85.
Back to Contents54321 Q
AIRBUS GROUP FINANCIAL STATEMENTS 201420
Notes to the Consolidated Financial Statements (IFRS)2.1 Basis of Presentation
CONSOLIDATED STATEMENTS OF CASH FLOWS AS OF 31 DECEMBER 2013
(In € million) As previously reported IFRS 10 and 11 As restated
Profit for the period attributable to equity owners of the parent (Net income) 1,465 8 1,473
Profit for the period attributable to non-controlling interests 10 0 10
Adjustments to reconcile profit for the period to cash provided by operating activities:
Interest income (168) 7 (161)
Interest expense 497 (4) 493
Interest received 119 (20) 99
Interest paid (323) 19 (304)
Income tax expense 502 (25) 477
Income taxes paid (243) 0 (243)
Depreciation and amortisation 1,968 (41) 1,927
Valuation adjustments 16 32 48
Results on disposals of non-current assets (58) 0 (58)
Results of investments accounted for by the equity method (295) (139) (434)
Change in current and non-current provisions 605 211 816
Reimbursement from / contribution to plan assets 0 0 (223)
Change in other operating assets and liabilities: (2,164) 73 (2,091)
■ Inventories (3,151) 49 (3,102)
■ Trade receivables (58) (25) (83)
■ Trade liabilities 584 (62) 522
■ Advance payments received 513 67 580
■ Other assets and liabilities 267 44 311
■ Customer financing assets (214) (113) (327)
■ Customer financing liabilities (105) 113 8
Cash provided by operating activities 1,931 121 1,829
Investments:
■ Purchases of intangible assets, property, plant and equipment, investment property (2,949) 31 (2,918)
■ Proceeds from disposals of intangible assets, property, plant and equipment, investment property 60 (12) 48
■ Acquisitions of subsidiaries, joint ventures, businesses and non-controlling interests (net of cash) (16) 0 (16)
■ Proceeds from disposals of subsidiaries (net of cash) 0 0 0
■ Payments for investments in associates, joint ventures, other investments and other long-term financial assets (292) (1) (293)
■ Proceeds from disposals of associates, joint ventures, other investments and other long-term financial assets 157 (3) 154
■ Dividends paid by companies valued at equity 52 94 146
Payments for investments in securities (1,401) 3 (1,398)
Proceeds from disposals of securities 2,673 (8) 2,665
Change in cash from changes in consolidation (26) 26 0
Cash (used for) investing activities (1,742) 130 (1,612)
Increase in financing liabilities 1,679 (12) 1,667
Repayment of financing liabilities (534) 0 (534)
Cash distribution to Airbus Group N.V. shareholders (467) 0 (467)
Dividends paid to non-controlling interests (2) 0 (2)
Changes in capital and non-controlling interests 171 0 171
Change in treasury shares (1,915) 0 (1,915)
Cash (used for) financing activities (1,068) (12) (1,080)
Effect of foreign exchange rate changes and other valuation adjustments on cash and cash equivalents (112) 5 (107)
Net (decrease) in cash and cash equivalents (991) 244 (970)
Cash and cash equivalents at beginning of period 8,756 (585) 8,171
Cash and cash equivalents at end of period 7,765 (341) 7,201
Back to Contents54321 Q

AIRBUS GROUP FINANCIAL STATEMENTS 2014 21
2
Notes to the Consolidated Financial Statements (IFRS)2.1 Basis of Presentation
New, r evised or a mended IFRS Standards and Interpretations i ssued but not y et a pplied
A number of new or revised standards, amendments and improvements to standards as well as interpretations are not yet effective
for the year ended 31 December 2014 and have not been applied in preparing these Consolidated Financial Statements and early
adoption is not planned:
Standards and amendments
IASB effective date for annual reporting periods
beginning on or after Endorsement status
IFRS 9 Financial instruments 1 January 2018 Not yet endorsed
IFRS 15 Revenue from contracts with customers 1 January 2017 Not yet endorsed
Amendment to IAS 1 Disclosure initiative 1 January 2016 Not yet endorsed
Amendments to IFRS 10 & IAS 28 Sale or contribution of assets between an investor and its associate or Joint Venture 1 January 2016 Not yet endorsed
Amendments to IFRS 11 Accounting for acquisition of interests in joint operations 1 January 2016 Not yet endorsed
Amendments to IAS 16 & IAS 38 Clarification of acceptable methods of depreciation and amortisation 1 January 2016 Not yet endorsed
Amendments to IAS 19 Defined Benefit Plans: Employee Contribution 1 July 2014 17 December 2014
Annual improvements to IFRSs:
■ 2010-2012 Cycle, IFRSs 2011-2013 Cycle 1 July 2014 17 December 2014
■ 2012-2014 Cycle 1 January 2016 18 December 2014
IFRIC 21 Levies 1 January 2014 13 June 2014
The potential impacts from the application of those newly issued
standards and amendments are currently under investigation. If
not otherwise stated, these new, revised or amended IFRS are not
expected to have a material impact on the Group’s Consolidated
Financial Statements as well as its basic and diluted earnings
per share.
IFRS 9 – “Financial instruments”
IFRS 9, published in July 2014, replaces the existing guidance in
IAS 39 “Financial Instruments: Recognition and Measurement”.
IFRS 9 includes revised guidance on the classification and
measurement of fi nancial instruments, including a new expected
credit loss model for calculating impairment on fi nancial assets,
and the new general hedge accounting requirements. It also carries
forward the guidance on recognition and derecognition of fi nancial
instruments from IAS 39.
Assessment of materiality of IFRS 9 impact on the Group’s Financial
Statements is currently being performed.
IFRS 15 – “Revenue from contracts with customers”
In May 2014, the IASB issued IFRS 15 which establishes a single
comprehensive framework for determining when to recognise
revenue and how much revenue to recognise. IFRS 15 will replace
the current revenue recognition standards IAS 18 Revenue and
IAS 11 Construction contracts and related interpretations when
it becomes effective.
The implementation of the Standard is expected to considerably
impact the Group’s Financial Statements and is currently under
assessment.
Amendments to IAS 1 – Disclosure initiative
These amendments to IAS 1 Presentation of Financial Statements
address some of the concerns expressed about existing
presentation and disclosure requirements and ensure that entities
are able to use judgment when applying IAS 1.
Amendments to IFRS 10 & IAS 28 –
“Sale or contribution of assets between an investor
and its associate or Joint Venture”
The amendments address an acknowledged inconsistency
between the respective requirements in IFRS 10 and in IAS 28,
when determining impacts from the sale or contribution of assets
between an investor and its associate or joint venture in exchange
for shares in the associate or Joint Venture.
Amendments to IFRS 11 – “Accounting for acquisition
of interests in joint operations”
These amendments provide guidance on the accounting for the
acquisition of a joint operation that constitutes a business as
defi ned under IFRS 3 “Business combinations” and the creation
of a joint operation from an existing business which is contributed
to the joint operation by one of the parties which participates
in the joint operation. The amendments state that the principles
on accounting for business combinations in IFRS 3 and other
standards should be applied.
Amendments to IAS 16 & IAS 38 –
“Clarification of acceptable methods of depreciation
and amortisation”
The amendments of IAS 16 prohibit entities from using a revenue-
based depreciation method for items of property, plant and
equipment. The amendments of IAS 38 introduce a presumption
that revenue is not an appropriate basis for amortisation except
in limited circumstances.
Back to Contents54321 Q

AIRBUS GROUP FINANCIAL STATEMENTS 201422
Notes to the Consolidated Financial Statements (IFRS)2.1 Basis of Presentation
Amendment to IAS 19 – “Defined Benefit Plans:
Employee Contribution”
The amendments clarify which employee (or third party)
contributions may be accounted for as a reduction of the service
cost in the period in which the related service is rendered.
IFRIC 21 – “Levies”
This interpretation sets out the accounting for an obligation to pay
a levy that is not income tax. The interpretation addresses what is
the obligating event that gives rise to pay a levy and when should
a liability be recognised.
Signifi cant Accounting Policies
The principal accounting policies applied in the preparation of
these Consolidated Financial Statements are set out below.
These policies have been consistently applied to all fi nancial years
presented, unless otherwise stated.
Consolidation — The Group’s Consolidated Financial Statements
include the fi nancial statements of all material entities controlled
by the Group. An entity is controlled by the Group regardless the
level of the Group’s equity interest in the entity, when the Group
has power over the entity, when it is exposed, or has rights to
variable returns from its involvement with the entity and has the
ability to use its power to affect those returns.
In determining whether control exists, the Group considers all
relevant facts and circumstances to assess its control over an
entity such as contractual commitments and potential voting rights
held by the Group if they are substantive.
“Subsidiaries” are all kind of entities controlled by the Group
including so-called Structured Entities (“SE”) which are created
to accomplish a narrow and well-defi ned objective and for which
control is usually not purely assessed by majority of voting rights
but based on assessment of contractual arrangements.
Subsidiaries are fully consolidated from the date control has been
transferred to the Group and de-consolidated from the date control
ceases. The Group’s subsidiaries prepare their fi nancial statements
at the same reporting date as the Group’s Consolidated Financial
Statements and apply the same accounting policies for similar
transactions.
Business c ombinations — Business combinations are accounted
for under the acquisition method of accounting as at the acquisition
date, which is the date on which control is transferred to the Group.
Goodwill is measured at the acquisition date as:
■ the fair value of the consideration transferred; plus ■ the recognised amount of any non-controlling interests in the
acquiree; plus ■ if the business combination is achieved in stages, the fair value
of the existing equity interest in the acquiree; less ■ the net recognised amount (generally fair value) of the identifi able
assets acquired and liabilities assumed.
Before recognising a gain on a purchase in the Consolidated
Income Statement, a reassessment is made of whether all of
the assets acquired and all of the liabilities assumed have been
correctly identifi ed and a review is undertaken of the measurement
procedures used.
Any non-controlling interest will be measured at either fair value (full
goodwill method), or at its proportionate interest in the identifi able
assets and liabilities of the acquiree (partial goodwill method), on
a transaction-by-transaction basis.
The consideration transferred does not include amounts related
to the settlement of pre-existing relationships. Such amounts
are recognised separately in profi t or loss. Costs related to the
acquisition, other than those associated with the issue of debt
or equity securities, that the Group incurs in connection with a
business combination are expensed as incurred.
Any contingent consideration payable is recognised at fair value
at the acquisition date. If the contingent consideration is classifi ed
as equity, it is not remeasured and settlement is accounted for
within equity. Otherwise, subsequent changes to the fair value
of the contingent consideration are recognised in profi t or loss.
Impacts of the replacement of share-based payments awards
are included in the measurement of the consideration transferred
in a business combination in accordance with the measurement
method of IFRS 2 Share-based Payment at the acquisition date.
Goodwill is tested for impairment in the fourth quarter of each
fi nancial year and whenever there is an indication for impairment.
After initial recognition goodwill is measured at cost less
accumulated impairment losses. For impairment testing purpose,
goodwill is allocated to those Cash Generating Units (“CGUs”) or
group of CGUs that are expected to benefi t from the synergies
arising from the business combination.
Interests in equity-accounted investees — Airbus Group’s
interest in equity-accounted investees comprise interests in
associates and joint ventures.
Associates are those entities in which Airbus Group exercises
its signifi cant infl uence over an entity when it has the power to
participate in the fi nancial and operating policy decisions of the
entity but it does not have the power to control or jointly control
the entity. Signifi cant infl uence in an entity is presumed to exist
when the Group owns 20% or more of the entity’s voting rights.
A joint venture is a joint arrangement whereby the parties that have
joint control of the arrangement (i.e. joint venturers) have rights to
the net assets of the arrangement, rather than rights to its assets
and obligations for its liabilities.
Investments in associate and a joint venture are accounted for
using the equity method and are initially recognised at cost. The
investments in associates include goodwill as recognised at the
acquisition date net of any accumulated impairment loss. The entire
carrying amount of the investments is tested for impairment when
required (see “Impairment of financial assets”).
Back to Contents54321 Q

AIRBUS GROUP FINANCIAL STATEMENTS 2014 23
2
Notes to the Consolidated Financial Statements (IFRS)2.1 Basis of Presentation
The investments’ carrying amount is adjusted by the cumulative
movements in recognised income, expense and other
comprehensive income. When the Group’s share in losses equals
or exceeds its interest in an associate or joint venture, including
any other unsecured receivables, no further losses are recognised,
unless the Group has incurred obligations or made payments on
behalf of the associate or joint venture respectively.
The fi nancial statements of the Group’s investments in associates
and joint ventures are generally prepared for the same reporting
period as for the parent company. Adjustments are made where
necessary to bring the accounting policies and accounting periods
in line with those of the Group.
Joint operations — A joint operation is a joint arrangement
where the parties that have joint control (i.e. joint operators) have
direct rights to the assets and obligations for the liabilities of
the arrangement. The joint operator will have direct access and
exposure to the income and expenses generated by the use of
the assets and liabilities it makes available throughout the entire
terms of the arrangement. IFRS 11 requires a joint operator to
recognise and measure the assets and liabilities (and recognise
the related revenues and expenses) in relation to its interest in
the arrangement applicable to the particular assets, liabilities,
revenues and expenses.
Foreign currency translation — The Consolidated Financial
Statements are presented in euro. A legal entity’s functional
currency is the currency of the primary economic environment
in which the entity operates. The assets and liabilities of foreign
entities, whose functional currency is other than euro, are
translated using period-end exchange rates, whilst the statements
of income are translated using average exchange rates during the
period, approximating the foreign exchange rate at the dates of the
transactions. All resulting translation differences are recognised
as a separate component of total equity (“Accumulated other
comprehensive income” or “AOCI”). If a foreign subsidiary is a
not wholly owned, then the relevant proportionate share of the
translation difference is allocated to the non-controlling interests.
Transactions in currencies other than the functional currency are
translated into the functional currency at the foreign exchange
rate prevailing at transaction date. Monetary assets and liabilities
denominated in foreign currencies at the end of the reporting
period are translated into the functional currency at the exchange
rate in effect at that date. These foreign exchange gains and losses
arising from translation are recognised in the Consolidated Income
Statement except when deferred in equity as qualifying cash fl ow
hedges.
Non-monetary assets and liabilities denominated in foreign
currencies that are stated at historical cost are translated into
functional currency at the foreign exchange rate in effect at the
date of the transaction. Translation differences on non-monetary
fi nancial assets and liabilities that are measured at fair value are
reported as part of the fair value gain or loss. However, translation
differences of non-monetary fi nancial assets measured at fair value
and classifi ed as available for sale are included in AOCI.
When a foreign operation is disposed of such that control, signifi cant
infl uence or joint control is lost, the cumulative amount in the
translation reserve related to that foreign operation is reclassifi ed
to profi t or loss as part of the gain or loss on disposal. When the
Group disposes of only part of its interest in a subsidiary that
includes a foreign operation while retaining control, the relevant
proportion of the cumulative translation reserve is allocated to
non-controlling interests. When the Group disposes of only part
of its investment in an associate or in a joint arrangement that
includes a foreign operation while retaining signifi cant infl uence or
joint control, the relevant proportion of the cumulative translation
reserve is reclassifi ed to profi t or loss.
Current and non-current assets and liabilities — The
classifi cation of an asset or liability as current or non-current in
general depends on whether the item is related to serial production
or subject to long-term production. In the serial production
business, an asset or liability is classifi ed as current when the
item is realised or settled within 12 months after the reporting
period, and as non-current otherwise. In the construction contract
business, an asset or liability is classifi ed as current when the item
is realised or settled within the Group’s normal operating cycle for
such contracts, and as non-current otherwise. As a result, assets
and liabilities relating to the construction contract business, such
as inventories, trade receivables and payables and receivables
from Percentage of Completion (“PoC”), that are sold, consumed
or settled as part of the normal operating cycle are classifi ed as
current even when they are not expected to be realised within
12 months after the reporting period.
Revenue recognition — Revenue is recognised to the extent that
it is probable that the economic benefi t arising from the ordinary
activities of the Group will fl ow to Airbus Group, that revenue can
be measured reliably and that the recognition criteria, as stated
below for each type of revenue-generating activity, have been
met. Revenue is measured at the fair value of the consideration
received or receivable after deducting any discounts, rebates,
liquidated damages and value added tax. For the preparation of
the Consolidated Income Statement intercompany revenues are
eliminated.
Revenues from the sale of goods are recognised upon the transfer
of risks and rewards of ownership to the buyer which is generally
on delivery and acceptance of the goods.
Revenues from services rendered are recognised in proportion
to the stage of completion of the transaction at the end of the
reporting period.
Interest income from fi nancing activities undertaken by the Group’s
fi nancial service providers are recognised using the effective
interest rate method and are reported as revenues.
When the Group entities provide more than one element of revenue
in a contract (goods and/or services), the consideration received
is allocated by reference to the relative fair values of the separate
elements of revenue when the amounts are separately identifi able.
Back to Contents54321 Q

AIRBUS GROUP FINANCIAL STATEMENTS 201424
Notes to the Consolidated Financial Statements (IFRS)2.1 Basis of Presentation
For construction contracts, when the outcome can be estimated
reliably, revenues and contract costs are recognised as revenue
and expenses respectively by reference to the stage of completion
of the contract activity at the end of the reporting period.
Contract revenues includes the purchase price agreed with the
customer considering escalation formulas, contract amendments
and claims and penalties when assessed probable.
Depending on the nature of the contract, the percentage
of completion is determined, and revenue recognised, as
contractually agreed technical milestones are reached, as units
are delivered or as the work progresses. Whenever the outcome of
a construction contract cannot be estimated reliably – for example
during the early stages of a contract or when this outcome can
no longer be estimated reliably during the course of a contract’s
completion – all related contract costs that are incurred are
immediately expensed and revenues are recognised only to the
extent of those costs being recoverable (“early stage method of
accounting”). Once the outcome of such contracts can (again) be
estimated reliably, revenue is accounted for according to the PoC
method henceforward, without restating the revenues previously
recorded under the early stage method of accounting. The effects
of a change in the estimate of contract revenue or contract cost,
or the effect of a change in the estimate of the outcome of a
contract are recognised in profi t or loss in the period in which
the changes are made and in subsequent periods. Contracts
are reviewed regularly and in case of probable losses, loss-at-
completion provisions are recorded. For construction contracts
such loss-at-completion provisions are not discounted.
Construction contract accounting is applied for military
programmes, space projects as well as for launch customer
contracts in the civil aircraft business if customers have signifi cantly
infl uenced the structural design and technology of the aircraft
type under the contract. Considering certain airline customer’s
increasing involvement in the development and production
process of the A350 XWB programme, Airbus applies IAS 11 to
a fi xed number of launch customer contracts of the A350 XWB
programme for existing backlog. This change in accounting policy
has no material effect on Airbus Group Financial Statements and
is thus applied prospectively.
Sales of aircraft that include asset value guarantee commitments
are accounted for as operating leases when these commitments
are considered substantial compared to the fair value of the
related aircraft. Revenues then comprise lease income from such
operating leases.
Revenue related to construction or upgrade services under a
service concession arrangement is recognised based on the
stage of completion of the work performed, consistent with the
Group’s accounting policy on recognising revenue on construction
contracts.
Interest income — Interest income derived from the Group’s
asset management and lending activities is recognised as interest
accrues, using the effective interest rate method.
Dividend income / distributions — Dividend income as well as
the obligation to distribute dividends to the Group’s shareholders
is recognised when the shareholders’ right to receive payment is
established (see “Available for sale fi nancial assets”).
Leasing — The determination of whether an arrangement is or
contains a lease is based on the substance of the arrangement
and requires an assessment of (i) whether the fulfi lment of the
arrangement is dependent on the use of a specifi c asset or assets,
and (ii) the arrangement conveys a right to use the asset(s).
The Group is a lessor and a lessee of assets, primarily in
connection with commercial aircraft sales financing. Lease
transactions where substantially all risks and rewards incident
to ownership are transferred from the lessor to the lessee are
accounted for as fi nance leases. All other leases are accounted
for as operating leases.
Assets leased out under operating leases are included in property,
plant and equipment at cost less accumulated depreciation
(see Note 14 “Property, plant and equipment”). Rental income
from operating leases (e.g. aircraft) is recorded as revenue on a
straight-line basis over the term of the lease. Assets leased out
under fi nance leases cease to be recognised in the Consolidated
Statement of Financial Position after the inception of the lease.
Instead, a fi nance lease receivable representing the discounted
future lease payments to be received from the lessee plus any
discounted unguaranteed residual value is recorded as part of
other long-term fi nancial assets (see Note 17 “Other investments
and other long-term fi nancial assets”). Unearned fi nance income is
recorded over time in “Interest income”. Revenues and the related
cost of sales are recognised at the inception of the fi nance lease.
Assets obtained under fi nance leases are included in property,
plant and equipment at cost less accumulated depreciation and
impairment if any (see Note 14 “Property, plant and equipment”),
and give rise to an associated liability from fi nance leases. If such
assets are further leased out to customers, they are classifi ed
either as an operating lease or as a fi nance lease, with the
Group being the lessor (headlease-sublease transactions), and
accounted for accordingly. When the Group is the lessee under
an operating lease contract, rental payments are recognised on a
straight line basis over the lease term (see Note 33 “Commitments
and contingencies” for future operating lease commitments). An
operating lease may also serve as a headlease in a headlease-
sublease transaction. If so, the related sublease is an operating
lease as well. Headlease-sublease transactions typically form part
of commercial aircraft customer fi nancing transactions.
Product-related expenses — Expenses for advertising, sales
promotion and other sales-related expenses are charged to
expense as incurred. Provisions for estimated warranty costs
are recorded at the time the related sale is recorded.
Research and development expenses — Research and
development activities can be (i) contracted or (ii) self-initiated.
(i) Costs for contracted research and development activities,
carried out in the scope of externally financed research and
development contracts, are expensed when the related
revenues are recorded.
Back to Contents54321 Q
AIRBUS GROUP FINANCIAL STATEMENTS 2014 25
2
Notes to the Consolidated Financial Statements (IFRS)2.1 Basis of Presentation
(ii) Costs for self-initiated research and development activities
are assessed whether they qualify for recognition as internally
generated intangible assets. An intangible asset may only
be recognised if technical as well as commercial feasibility
can be demonstrated and cost can be measured reliably. It
must also be probable that the intangible asset will generate
future economic benefits and that it is clearly identifiable and
allocable to a specific product.
Further to meeting these criteria, only such costs that relate solely
to the development phase of a self-initiated project are capitalised.
Any costs that are classifi ed as part of the research phase of a self-
initiated project are expensed as incurred. If the research phase
cannot be clearly distinguished from the development phase,
the respective project related costs are treated as if they were
incurred in the research phase only.
Capitalised development costs are generally amortised over
the estimated number of units produced. In case the number
of units produced cannot be estimated reliably capitalised
development cost are amortised over the estimated useful life
of the internally generated intangible asset. Amortisation of
capitalised development costs is recognised in cost of sales.
Internally generated intangible assets are reviewed for impairment
annually when the asset is not yet in use and further on whenever
events or changes in circumstances indicate that the carrying
amount may not be recoverable.
Income tax credits granted for research and development activities
are deducted from corresponding expenses or from capitalised
amounts when earned.
Borrowing costs — Borrowing costs directly attributable to the
acquisition, construction or production of an asset that necessarily
takes a substantial period of time (generally more than 12 months)
to get ready for its intended use or sale are capitalised as part of
the cost of the respective assets. All other borrowing costs are
expensed in the period they occur. Borrowing costs consist of
interest and other costs that the Group incurs in connection with
the borrowing of funds. The Group capitalises borrowing costs
for qualifying assets where construction was commenced on or
after 1 January 2009.
Intangible assets — Intangible assets comprise (i) internally
generated intangible assets, i.e. internally developed software and
other internally generated intangible assets (see above: “Research
and development expenses”), (ii) acquired intangible assets, and
(iii) goodwill (see above: “Consolidation”).
Separately acquired intangible assets are initially recognised
at cost. Intangible assets acquired in a business combination
are recognised at their fair value at acquisition date. Acquired
intangible assets with fi nite useful lives are generally amortised on
a straight- line basis over their respective estimated useful lives
(3 to 10 years) to their estimated residual values. The amortisation
expense on intangible assets with fi nite lives is recognised in the
Consolidated Income Statement within the expense category
consistent with the function of the related intangible asset. The
amortisation method and the estimate of the useful lives of the
separately acquired intangible asset is reviewed at least annually
and changed if appropriate.
Intangible assets having an indefi nite useful life are not amortised
but tested for impairment at the end of each fi nancial year as
well as whenever there is an indication that the carrying amount
exceeds the recoverable amount of the respective asset (see below
“Impairment of non-fi nancial assets”). For such intangible assets
the assessment for the indefi nite useful life is reviewed annually on
whether it remains supportable. A change from indefi nite to fi nite
useful life assessment is accounted for as change in estimate.
Gains or losses arising from the derecognition of an intangible
asset are measured as the difference between the net disposal
proceeds and the carrying amount of the asset and are recognised
in the Consolidated Income Statement when the asset is
derecognised.
Property, plant and equipment — Property, plant and
equipment is valued at acquisition or manufacturing costs less
accumulated depreciation and impairment losses. Such costs
include the estimated cost of replacing, servicing and restoring
part of such property, plant and equipment. Items of property,
plant and equipment are generally depreciated on a straight-
line basis. The costs of internally produced equipment and
facilities include direct material and labour costs and applicable
manufacturing overheads, including depreciation charges. The
following useful lives are assumed: buildings 10 to 50 years; site
improvements 6 to 30 years; technical equipment and machinery
3 to 20 years; and other equipment, factory and offi ce equipment
2 to 10 years. The useful lives, depreciation methods and residual
values applying to property, plant and equipment are reviewed at
least annually and in case they change signifi cantly, depreciation
charges for current and future periods are adjusted accordingly.
If the carrying amount of an asset exceeds its recoverable
amount an impairment loss is recognised immediately in profi t
or loss. At each end of the reporting period, it is assessed
whether there is any indication that an item of property, plant
and equipment may be impaired (see also below “Impairment
of non-fi nancial assets”).
When a major inspection is performed, its cost is recognised in the
carrying amount of the plant and/or equipment as a replacement
if the recognition criteria are satisfi ed. The carrying amount of the
replaced part is derecognised. All other repairs and maintenance
are recognised as an expense in the Consolidated Income
Statement of the period in which they are incurred. Cost of an
item of property, plant and equipment initially recognised comprise
the initial estimate of costs of dismantling and removing the item
and restoring the site on which it is located at the end of the useful
life of the item on a present value basis. A provision presenting the
asset retirement obligation is recognised in the same amount at
the same date in accordance with IAS 37 “Provisions, Contingent
Liabilities and Contingent Assets”.
Property, plant and equipment also includes capitalised
development costs for tangible developments of specialised tooling
for production such as jigs and tools, design, construction and
testing of prototypes and models. In case recognition criteria are
met, these costs are capitalised and generally depreciated using
the straight-line method over fi ve years or, if more appropriate,
using the number of production or similar units expected to be
obtained from the tools (sum-of-the-units method). Especially for
Back to Contents54321 Q
AIRBUS GROUP FINANCIAL STATEMENTS 201426
Notes to the Consolidated Financial Statements (IFRS)2.1 Basis of Presentation
aircraft production programmes such as the Airbus A380 with an
estimated number of aircraft to be produced using such tools, the
sum-of-the-units method effectively allocates the diminution of
value of specialised tools to the units produced. Property, plant
and equipment is derecognised when it has been disposed of or
when the asset is permanently withdrawn from use. The difference
between the net disposal proceeds and the carrying amount of
such assets is recognised in the Consolidated Income Statement
in the period of derecognition.
Investment property — Investment property is property, i.e.
land or buildings, held to earn rentals or for capital appreciation
or both. The Group accounts for investment property at cost less
accumulated depreciation and impairment losses, similar to other
items of property, plant and equipment.
Inventories — Inventories are measured at the lower of acquisition
cost (generally the average cost) or manufacturing cost and net
realisable value. Manufacturing costs comprise all costs that are
directly attributable to the manufacturing process, such as direct
material and labor, and production related overheads (based on
normal operating capacity and normal consumption of material,
labour and other production costs), including depreciation
charges. Net realisable value is the estimated selling price in the
ordinary course of the business less applicable variable selling
expenses.
Impairment of non-fi nancial assets — The Group assesses at
each end of the reporting period whether there is an indication that
a non-fi nancial asset or the Cash Generating Unit (“CGU”) to which
the asset belongs may be impaired. In addition, intangible assets
with an indefi nite useful life, intangible assets not yet available for
use and goodwill are tested for impairment in the fourth quarter of
each fi nancial year irrespective of whether there is any indication
for impairment. An impairment loss is recognised in the amount
by which the asset’s or the CGU’s carrying amount to which the
asset belongs exceeds its recoverable amount. For the purpose of
impairment testing any goodwill is allocated to the CGU or Group
of CGU that refl ects the way goodwill is monitored for internal
management purposes.
The recoverable amount of an asset or CGU is the higher of its
fair value less costs to sell or its value in use. The recoverable
amount is determined for an individual asset, unless the asset
does not generate cash infl ows that are largely independent of
those from other assets or group of assets. In such a case the
recoverable amount is determined for the CGU the asset belongs
to. Where the recoverable amount of a CGU to which goodwill
has been allocated is lower than the CGU’s carrying amount,
fi rstly the related goodwill is impaired. Any exceeding amount
of impairment is recognised on a pro rata basis of the carrying
amount of each asset in the respective CGU.
The value in use is assessed by the present value of the future
cash fl ows expected to be derived from an asset or a CGU. Cash
fl ows are projected based on a detailed forecast approved by
management over a period refl ecting the operating cycle of the
specifi c business. The discount rate used for determining an
asset’s value in use is the pre-tax rate refl ecting current market
assessment of (i) the time value of money and (ii) the risk specifi c
to the asset for which the future cash fl ow estimates have not
been adjusted.
An asset’s fair value less costs to sell refl ects the price the Group
would obtain at its end of the reporting period from the asset’s
disposal in an orderly transaction between market participants
after deducting the costs of disposal. If there is no binding sales
agreement or active market for the asset, its fair value is assessed
by the use of appropriate valuation models dependent on the
nature of the asset, such as by the use of discounted cash fl ow
models. These calculations are corroborated by available fair
value indicators such as quoted market prices or sector-specifi c
valuation multiples.
Impairment losses of assets used in continuing operations are
recognised in the Consolidated Income Statement in those
expense categories consistent with the function of the impaired
asset.
Impairment losses recognised for goodwill are not reversed in
future periods. For any other non-fi nancial assets an assessment
is made at each end of the reporting period as to whether there
is any indication that previously recognised impairment losses
may no longer exist or may have decreased. If such indication
exists, the Group estimates the asset’s or cash-generating unit’s
recoverable amount. A previously recognised impairment loss
is reversed only if there has been a change in the assumptions
used to determine the asset’s recoverable amount since the
last impairment loss was recognised. The reversal is limited
so that the carrying amount of the asset does not exceed its
recoverable amount, nor exceed the carrying amount that would
have been determined, net of depreciation, had no impairment
loss been recognised for the asset in prior years. Such a reversal
is recognised in the Consolidated Income Statement.
Financial instruments — A fi nancial instrument is any contract,
including a derivative contract, that gives rise to a fi nancial asset
of one entity and a fi nancial liability or equity instrument of another
entity. The Group’s fi nancial assets mainly consist in cash, short
to medium-term deposits and securities. The Group’s fi nancial
liabilities include trade liabilities, obligations towards fi nancial
institutions, issued bonds and refundable advances from European
governments. The Group recognises a fi nancial instrument on its
Consolidated Statement of Financial Position when it becomes
party to the contractual provision of the instrument. All purchases
and sales of fi nancial assets are recognised on settlement date
according to market conventions. The settlement date is the date
an asset is delivered to or by an entity. Financial instruments are
initially recognised at fair value plus, in the case the fi nancial
instruments are not measured at fair value through profi t or loss,
directly attributable transaction costs. Financial instruments at fair
value through profi t or loss are initially recognised at fair value,
transaction costs are recognised in the Consolidated Income
Statement. Finance lease receivables are recognised at an amount
equal to the net investment in the lease. The Group assesses at
each end of the reporting period whether there is any objective
evidence that a fi nancial asset or a group of fi nancial assets may
Back to Contents54321 Q

AIRBUS GROUP FINANCIAL STATEMENTS 2014 27
2
Notes to the Consolidated Financial Statements (IFRS)2.1 Basis of Presentation
be impaired. The Group derecognises a fi nancial asset when
the contractual rights to the asset’s cash fl ows expire or the
fi nancial asset has been transferred and the transfer qualifi es for
derecognition under IAS 39. The Group derecognises a fi nancial
liability when the obligation specifi ed in the contract is discharged,
cancelled or expired. When an existing fi nancial liability is replaced
by another from the same lender on substantially different terms,
or the terms of an existing liability are substantially modifi ed, such
an exchange or modifi cation is treated as a derecognition of the
original liability and the recognition of a new liability, and the
difference in the respective carrying amounts is recognised in
the income statement.
Fair value of fi nancial instruments — The fair value of quoted
investments is based on current market prices. If the market for
fi nancial assets is not active or in the case of unlisted fi nancial
instruments, the Group determines fair values by using generally
accepted valuation techniques on the basis of market information
available at the end of the reporting period. Such techniques
consist of discounted cash fl ow analysis or option pricing and
other valuation models. Inputs to such techniques may include
prices achieved in recent arm’s length market transactions for
the same or a similar instrument, or inputs, other than quoted or
traded prices, that are observable for the fi nancial instrument.
Such input includes interest rates, foreign currency rates, credit
spreads and volatilities.
Derivative instruments are generally managed on the basis of
the Group’s net exposure to the credit risk of each particular
counterparty, and fair value information is provided to the Group’s
key management personnel on that basis. For these derivative
instruments, the fair value is measured based on the price that
would be received to sell a net long position, or transfer a net short
position, for a particular credit risk exposure as further described
in Note 34 “Information about fi nancial instruments” b).
Available-for-sale equity investments that do not have a quoted
market price in an active market and whose fair value cannot
be reliably estimated by alternative valuation methods, such as
a discounted cash fl ow model, are measured at cost, less any
accumulated impairment losses.
Investments and other financial assets — The Group’s
investments comprise investments in associates accounted for
under the equity method, other investments and other long-term
fi nancial assets as well as current and non-current securities and
cash equivalents. Except for investments accounted for under
the equity method, the Group classifi es its fi nancial assets in
the following three categories: (i) at fair value through profi t or
loss, (ii) loans and receivables and (iii) available-for-sale fi nancial
assets. Their classifi cation is determined by management when
fi rst recognised and depends on the purpose for their acquisition.
Within the Group, all investments in entities which do not qualify
for consolidation or equity-method accounting are classifi ed as
non-current available-for-sale fi nancial assets. They are included in
the line other investments and other long-term financial assets
in the Consolidated Statement of Financial Position.
The majority of the Group’s securities consists of debt securities
and are classifi ed as available-for-sale fi nancial assets.
Available for sale fi nancial assets — Financial assets classifi ed
as available-for-sale are accounted for at fair value. Changes
in the fair value subsequent to the recognition of available-for-
sale fi nancial assets – other than impairment losses and foreign
exchange gains and losses on monetary items classifi ed as
available-for-sale – are recognised directly within AOCI, a separate
component of equity, net of applicable deferred income taxes.
As soon as such fi nancial assets are sold or otherwise disposed
of, or are determined to be impaired, the cumulative gain or loss
previously recognised in equity is recorded as part of “other
income (expense) from investments” in the Consolidated Income
Statement for the period. Interest earned on the investment
is presented as interest income in the Consolidated Income
Statement using the effective interest method. Dividends earned
on investment are recognised as “Other income (expense) from
investments” in the Consolidated Income Statement when the
right to the payment has been established.
Financial assets at fair value through profit or loss —
Financial assets at fair value through profi t or loss include fi nancial
assets held for trading and fi nancial assets designated at initial
recognition at fair value through profi t or loss. Within the Group,
only derivatives not designated as hedges are categorised as held
for trading. Furthermore, the Group designates certain fi nancial
assets (such as investments in accumulated Money Market Funds)
at fair value through profi t or loss at initial recognition if they
are part of a group of fi nancial assets that is managed and its
performance is evaluated on a fair value basis, in accordance with
a documented risk management or investment strategy.
Loans and receivables — Loans and receivables are non-
derivative fi nancial assets with fi xed or determinable payments
that are not quoted in an active market. They arise when the Group
provides money, goods or services directly to a debtor with no
intention of trading the receivable. Loans and receivables are
classifi ed as trade receivables, other investments and other
current / long-term financial assets. Other fi nancial assets
include short-term and long-term loans advanced by Airbus
Group Bank to its customers or to other fi nancial institutions.
After initial recognition loans and receivables are measured at
amortised cost using the effective interest rate method less any
allowance for impairment. Gains and losses are recognised in
the Consolidated Income Statement at disposal of the loans and
receivables, through the amortisation process as well as in case
of any impairment.
Trade receivables — Trade receivables include claims arising
from revenue recognition that are not yet settled by the debtor
as well as receivables relating to construction contracts. Trade
receivables are initially recognised at fair value and, provided
they are not expected to be realised within one year, are
subsequently measured at amortised cost using the effective
interest method less any allowance for impairment. Gains and
losses are recognised in the Consolidated Income Statement
when the receivables are derecognised or impaired as well as
through the amortisation process.
Back to Contents54321 Q

AIRBUS GROUP FINANCIAL STATEMENTS 201428
Notes to the Consolidated Financial Statements (IFRS)2.1 Basis of Presentation
Current / non-current other fi nancial assets — Current /
non-current other fi nancial assets mainly include derivatives with
positive fair values, receivables from related companies and loans,
which are presented separately from current / non-current other
assets.
Cash and cash equivalents — Cash and cash equivalents
consist of cash on hand, cash in bank, checks, fi xed deposits and
securities having maturities of three months or less from the date of
acquisition, that are readily convertible to known amounts of cash
and which are subject to an insignifi cant risk of changes in value.
Impairment of fi nancial assets — The Group assesses at each
end of the reporting period whether there is any objective evidence
that a fi nancial asset or a group of fi nancial assets is impaired.
After application of the at equity method to an investment in an
associate or a joint venture, the Group determines whether
it is necessary to recognise an impairment loss of the Group’s
investment in its associates. The Group determines at each end
of the reporting period whether there is any objective evidence
that the investment in associate is impaired. Any reversal of the
impairment loss is recognised as an adjustment to the investment in
the associate or the joint venture to the extent that the recoverable
amount of the investment or the joint venture increases. As such,
the goodwill related to the Group’s associates or joint venture is
not individually tested for impairment.
For financial assets carried at amortised cost, at cost and for
those classifi ed as available-for-sale, a fi nancial asset or a group
of fi nancial assets is deemed to be impaired if, and only if, there
is objective evidence of impairment as a result of one or more
events that has occurred after the initial recognition of the asset
(an incurred “loss event”) and that loss event has an impact on
the estimated future cash fl ows of the fi nancial asset or the group
of fi nancial assets that can be reliably estimated.
Equity investments classified as available-for-sale are
considered for impairment in addition to the indicators stated above
in case of a signifi cant or prolonged decline of their fair value
below their cost. If any such evidence exists for available-for-sale
fi nancial assets, the cumulative loss – measured as the difference
between the acquisition cost and the current fair value, less any
impairment loss on that fi nancial asset previously recognised in
the Consolidated Income Statement – is removed from AOCI and
recognised in the Consolidated Income Statement. Impairment
losses recognised in the Consolidated Income Statement on equity
instruments are not reversed through the Consolidated Income
Statement; increases in their fair value are recognised directly in
AOCI.
In case of the impairment of debt instruments classified as
available-for-sale, interest continues to be accrued at the original
effective interest rate on the reduced carrying amount of the asset
and is recorded in fi nancial result. If, in a subsequent year, the
fair value of a debt instrument increases and the increase can
be objectively related to an event occurring after the impairment
loss was recognised in the Consolidated Income Statement, the
impairment loss is reversed through the Consolidated Income
Statement.
If there is objective evidence regarding loans and receivables that
the Group is not able to collect all amounts due according to the
original terms of the fi nancial instrument, an impairment charge has
to be recognised. The amount of the impairment loss is equal to
the difference between the fi nancial asset’s carrying amount and
the present value of estimated future cash fl ows, discounted at the
original effective interest rate, i.e. the rate that exactly discounts
the expected stream of future cash payments through maturity
to the current net carrying amount of the fi nancial asset. The
carrying amount of the trade receivable is reduced through use of
an allowance account. The loss is recognised in the Consolidated
Income Statement. If in a subsequent period, the amount of
impairment decreases and the decrease is objectively related
to an event occurring after the impairment was recognised, the
recognised impairment loss is reversed through the Consolidated
Income Statement.
Non-current assets / disposal groups classifi ed as held for
sale — Non-current assets / disposal groups classifi ed as assets
held for sale are stated at the lower of carrying amount and fair value
less costs to sell if their carrying amount is recovered principally
through a sale transaction rather than through a continuing use.
Whilst classifi ed as held for sale or part of a disposal group, the
Group does not depreciate or amortise a non-current asset. In
addition, equity accounting of investments in associates ceases
once classifi ed as held for sale or distribution. Liabilities directly
associated with non-current assets held for sale in a disposal
group are presented separately on the face of the Consolidated
Statement of Financial Position. Interest and other expenses
attributable to the liabilities of a disposal group classifi ed as held
for sale is continued to be recognised.
To be classifi ed as held for sale the non-current assets (or disposal
group) must be available for immediate sale in its present condition
subject only to terms that are usual and customary for sales of such
assets (or disposal group) and its sale must be highly probable.
If a component of the Group has either been disposed of or is
classifi ed as held for sale and (i) represents a separate major line
of business or geographical area of operations, (ii) is part of a
single co-ordinated plan to dispose of a separate major line of
business or geographical area of operations or (iii) is a subsidiary
acquired exclusively with a view to resale the component is a
discontinued operation.
Derivative fi nancial instruments — Within the Group derivative
fi nancial instruments are (i) used for hedging purposes in micro-
hedging strategies to offset the Group’s exposure to identifi able
transactions or are (ii) a component of hybrid fi nancial instruments
that include both the derivative and host contract (“Embedded
Derivatives”).
Back to Contents54321 Q

AIRBUS GROUP FINANCIAL STATEMENTS 2014 29
2
Notes to the Consolidated Financial Statements (IFRS)2.1 Basis of Presentation
In accordance with IAS 39 “Financial Instruments: Recognition and
Measurement”, derivative fi nancial instruments are recognised and
subsequently measured at fair value. The method of recognising
resulting gains or losses depends on whether the derivative fi nancial
instrument has been designated as hedging instrument, and if so,
on the nature of the item being hedged. While derivative fi nancial
instruments with positive fair values are recorded in “current / non-
current other fi nancial assets”, such derivative fi nancial instruments
with negative fair values are recorded as “current / non-current
other fi nancial liabilities”.
a) Hedging: The Group seeks to apply hedge accounting to
all its Hedging Activities. Hedge accounting recognises
symmetrically the offsetting effects on net profit or loss of
changes in the fair values of the hedging instrument and
the related hedged item. The conditions for such a hedging
relationship to qualify for hedge accounting include: the hedge
transaction is expected to be highly effective in achieving
offsetting changes in fair value or cash flows attributable to
the hedged risk, the effectiveness of the hedge can be reliably
measured and there is formal designation and documentation
of the hedging relationships and the Group’s risk management
objective and strategy for undertaking the hedge at the
inception of the hedge. The Group further documents
prospectively at the inception of the hedge as well as at each
closing retrospectively and prospectively its assessment of
whether the derivatives used in hedging transactions are highly
effective in offsetting changes in fair values or cash flows of
hedged items with regard to the hedged risk.
Depending on the nature of the item being hedged, the
Group classifies hedging relationships that qualify for hedge
accounting as either (i) hedges of the fair value of recognised
assets or liabilities or unrecognised firm commitments (“Fair
Value Hedges”), or (ii) hedges of the variability of cash flows
attributable to recognised assets or liabilities, or highly
probable forecast transactions (“Cash Flow Hedges”).
(i) Fair value hedge: Fair value hedge accounting is mainly
applied to certain interest rate swaps hedging the exposure
to changes in the fair value of recognised assets and liabilities.
For derivative financial instruments designated as fair value
hedges, changes in the fair value of the hedging instrument
and changes in the fair value of the hedged asset or liability
attributable to the hedged risk are simultaneously recognised
in the Consolidated Income Statement.
(ii) Cash flow hedge: The Group applies cash flow hedge
accounting generally to foreign currency derivative contracts
on future sales, to certain interest rate swaps hedging the
variability of cash flows attributable to recognised assets and
liabilities, as well as to equity swaps that hedge the equity
price risk inherent in cash-settled share based payments
(LTIP). Changes in fair value of the hedging instruments
related to the effective part of the hedge are reported in
AOCI, a separate component of total equity, net of applicable
income taxes and recognised in the Consolidated Income
Statement in conjunction with the result of the underlying
hedged transaction, when realised. The ineffective portion
is immediately recorded in “Profit for the period”. Amounts
accumulated in equity are recognised in the Consolidated
Income Statement in the periods when the hedged transaction
affects the Consolidated Income Statement, such as when the
forecast sale occurs or when the finance income or finance
expense is recognised in the Consolidated Income Statement.
If hedged transactions are cancelled, gains and losses on the
hedging instrument that were previously recorded in equity
are generally recognised in “Profit for the period”. Apart from
derivative financial instruments, the Group also uses financial
liabilities denominated in a foreign currency to hedge foreign
currency risk inherent in forecast transactions. If the hedging
instrument expires or is sold, terminated or exercised, or if
its designation as hedging instrument is revoked, amounts
previously recognised in equity remain in equity until the
forecasted transaction or firm commitment occurs.
In addition, the Group uses certain foreign currency derivatives
to mitigate its foreign currency exposure arising from changes in
the fair value of recognised assets and liabilities (natural hedge).
To refl ect the largely natural offset those derivatives provide to
the remeasurement gains or losses of specifi c foreign currency
balance sheet items, the Group accordingly presents the gains or
losses of those foreign exchange rate derivatives as well as the fair
value changes of the relating recognised assets and liabilities in
the Group’s Consolidated Profi t before fi nance costs and income
taxes (EBIT) insofar as certain formal requirements are met.
Finally, in case certain derivatives or portions of these derivatives
do not qualify for hedge accounting under the specifi c rules of
IAS 39 “Financial Instruments: Recognition and Measurement”
(for example, the non-designated time value of options or
de-designated derivatives in general) or do not belong to a
Natural Hedge, changes in fair value of such derivative fi nancial
instruments or its portions are recognised immediately as part
of the fi nancial result.
The fair values of various derivative fi nancial instruments used as
hedging instruments are disclosed in Note 34 “Information about
fi nancial instruments”. Periodical movements in the AOCI, the
separate component of total equity in which the effective portion
of cash fl ow hedges are recognised, are disclosed in Note 34e ).
b) Embedded derivatives: Derivative components embedded in
a non-derivative host contract are separately recognised and
measured at fair value if they meet the definition of a derivative
and their economic risks and characteristics are not clearly
and closely related to those of the host contract. Changes in
the fair value of the derivative component of these instruments
are recorded in “Other financial result”, unless bifurcated
foreign currency embedded derivatives are designated as
hedging instruments.
Back to Contents54321 Q

AIRBUS GROUP FINANCIAL STATEMENTS 201430
Notes to the Consolidated Financial Statements (IFRS)2.1 Basis of Presentation
See Note 34 “Information about fi nancial instruments” for a
description of the Group’s fi nancial risk management strategies,
the fair values of the Group’s derivative fi nancial instruments as
well as the methods used to determine such fair values.
Income taxes — Tax expense (tax income) is the aggregate
amount included in the determination of net profi t or loss for the
period in respect of (i) Current tax and (ii) Deferred tax.
(i) Current tax is the amount of income taxes payable or
recoverable in a period. Current income taxes are calculated
applying respective tax rates on the periodic taxable profit or
tax loss that is determined in accordance with rules established
by the competent taxation authorities. Current tax liabilities
are recognised for current tax to the extent unpaid for current
and prior periods. A current tax asset is recognised in case
the tax amount paid exceeds the amount due to current and
prior periods. The benefit of a tax loss that can be carried back
to recover current taxes of a previous period is recognised
as an asset provided that the related benefit is probable and
can be measured reliably.
(ii) Deferred tax assets and liabilities are generally recognised
on temporary valuation differences between the carrying
amounts of assets and liabilities and their respective tax
bases, as well as for net operating losses and tax credit carry
forwards. Deferred tax assets and liabilities are measured
using enacted tax rates to be applied to taxable income in
the years in which those temporary differences are expected
to be recovered or settled. The effect on deferred tax assets
and liabilities of a change in tax rates is recognised in the
period the new rates are enacted or substantially enacted.
As deferred tax assets anticipate potential future tax benefits,
they are recorded in the Consolidated Financial Statements
of the Group only to the extent that it is probable that future
taxable profits will be available against which deferred tax
assets will be utilised. In principle, the recoverability test
of deferred tax assets is assessed based on the Group’s
latest 5 year operative planning also taking into account
existing deferred tax liabilities and certain qualitative aspects
regarding the nature of the temporary dif ferences. The
carrying amount of deferred tax assets is reviewed at each
financial year-end.
Deferred income tax assets and deferred income tax liabilities
are offset, if a legally enforceable right exists to set off current
tax assets against current income tax liabilities and the
deferred income taxes relate to the same taxable entity and
the same taxation authority.
As the Group controls the dividend policy of its subsidiaries
it controls the timing of the reversal of temporary differences
associated with that investment (usually referred to as “outside
basis differences”) arising from yet undistributed profits and
changes in foreign exchange rates. In general, the Group
has determined not to distribute those profits generated by
its subsidiaries in the foreseeable future and accordingly
does not recognise a deferred tax liability. For temporary
differences arising from investments in associates the Group
recognises deferred tax liabilities. The rate used reflects the
assumptions that these differences will be recovered from
dividend distribution unless a management resolution for
the divestment of the investment exists at the closing date.
For joint ventures, the Group assesses its ability to control
the distribution of dividends based on existing shareholder
agreements and recognises deferred tax liabilities accordingly.
Share capital — Ordinary shares are classified as equity.
Incremental costs directly attributable to the issue of new shares
or options are shown directly in equity – as a deduction – net of
any tax effects. Own equity instruments which are reacquired are
deducted from total equity and remain recognised as treasury
shares until they are either cancelled or reissued. Any gains or
losses net of taxes which are associated with the purchase, sale,
issue or cancellation of the Group’s own shares are recognised
within equity.
Provisions — Provisions are recognised when the Group has a
present obligation (legal or constructive) as a result of a past event,
it is probable that an outfl ow of resources embodying economic
benefi ts will be required to settle the obligation and a reliable
estimate of the obligation’s amount can be made. When the effect
of the time value of money is material, provisions are measured
at the present value of the expenditure expected to be required
to settle the Group’s present obligation. As discount factor, a
pre-tax rate is used that refl ects current market assessments of
the time value of money and the risks specifi c to the obligation.
The provision’s increase in each period refl ecting the passage of
time is recognised as fi nance cost.
Provisions are reviewed at each closing and adjusted as
appropriate to refl ect the respective current best estimate. The
change in the measurement of a provision for an asset retirement
obligation (see above “Property, plant and equipment”) is added
or deducted from the cost of the respective asset that has to be
dismantled and removed at the end of its useful life and the site
on which it is located restored.
Provisions for guarantees corresponding to aircraft sales are
recorded to refl ect the underlying risk to the Group in respect of
guarantees given when it is probable that an outfl ow of resources
embodying economic benefits will be required to settle the
obligation and reliable estimates can be made of the amount
of the obligation. The amount of these provisions is calculated
to cover the difference between the Group’s exposure and the
estimated value of the collateral.
Insurance indemnification or reimbursements are recognised
when it is virtually certain that they will be received. They are
recognised as separable assets. In the statement of comprehensive
income, the expense relating to a provision is presented net of
the amount of the recognised reimbursement.
Outstanding costs are provided for at the best estimate of future
cash outfl ows. Provision for other risks and charges relates to
identifi able risks representing amounts expected to be realised.
Back to Contents54321 Q
AIRBUS GROUP FINANCIAL STATEMENTS 2014 31
2
Notes to the Consolidated Financial Statements (IFRS)2.1 Basis of Presentation
Provisions for contract losses are recorded when it becomes
probable that estimated contract costs based on a total cost
approach will exceed total contract revenues. Contractual
penalties are included in the contractual margin calculation.
Provisions for loss making contracts are recorded as write downs
of work-in-process for that portion of the work which has already
been completed, and as provisions for the remainder. Losses are
determined on the basis of estimated results on completion of
contracts and include foreign currency effects. Provisions for loss
making contracts are updated regularly.
Provisions for (i) constructive obligations and liquidated damages
caused by delays in delivery and for (ii) terminating existing
customer orders are based on best estimates of future cash
outfl ows for anticipated payments to customers. Provisions for
litigation and claims are set in case legal actions, governmental
investigations, proceedings and other claims are pending or may
be instituted or asserted in the future against the Group which
are a result of past events, where it is probable that an outfl ow
of resources embodying economic benefi ts will be required for
the settlement and a reliable estimate of the obligation’s amount
can be made.
Restructuring provisions are only recognised when a detailed
formal plan for the restructuring – including the concerned
business or part of the business, the principal locations affected,
details regarding the employees affected, the restructuring’s
timing and expenditures that will have to be undertaken – has
been developed and the restructuring has either commenced or
the plan’s main features have already been publicly announced
to those affected by it.
Employee benefi ts — The valuation of pension and post-
retirement benefits classifi ed as defi ned benefi t plans is based
upon the projected unit credit method in accordance with IAS 19
“Employee Benefi ts”.
The Group recognises remeasurements of the net defi ned benefi t
liability in full immediately in retained earnings and presents them
in its Consolidated Statements of Comprehensive Income.
Past service costs and settlement gains (losses) are immediately
recognised as an expense in the Group’s Consolidated Income
Statements when the plan amendment, curtailment or settlement
occurs.
The Group applies defi ned benefi t accounting for its defi ned
benefi t multi-employer plan. Accordingly, the Group accounts
for its share in the related defi ned benefi t plan.
Contributions to defi ned contribution plans are recognised as
expenses in the Consolidated Income Statement when they are
due.
Several German Group companies provide life time working
account models, being employee benefi t plans with a promised
return on contributions or notional contributions that qualify
as other long-term employee benefits under IAS 19. The
employees’ periodical contributions into their life time working
accounts result in corresponding personnel expense in that period
in the Consolidated Income Statement while plan assets and
corresponding provisions are offset in the Consolidated Statement
of Financial Position.
Termination benefits are payable whenever an employee’s
employment is terminated before the normal retirement date
or whenever an employee accepts voluntary redundancy in
exchange for these benefi ts. The Group recognises termination
benefi ts when it is demonstrably committed to either terminate the
employment of current employees according to a detailed formal
plan without possibility of withdrawal or to provide termination
benefi ts as a result of an offer made to encourage voluntary
redundancy.
Share based compensation — In 2007, the Group also introduced
a P erformance and Restricted Unit plan (LTIP) which qualifi es as
cash settled share-based payment plan under IFRS 2. For this
type of plans, associated services received are measured at fair
value and are calculated by multiplying the number of options (or
units) expected to vest with the fair value of one LTIP unit as of
grant date (end of the reporting period). The fair value of each
LTIP unit is determined using a forward pricing model.
The fair value of the services is recognised as personnel expense.
In case of equity settled share based payment plans the personnel
expense results in a corresponding increase in consolidated
retained earnings over the vesting period of the respective plan.
For cash settled share based payment plans a corresponding
liability is recognised. Until the liability is settled its fair value is
remeasured at each end of the reporting period through the
Consolidated Income Statement.
Part of the grant of both types of share-base payment plans is
conditional upon the achievement of non-market performance
conditions and will only vest provided that the performance
conditions are met. If it becomes obvious during the vesting period
of an equity-settled share-based payment plan that some of the
performance conditions will not be met and, hence, the number
of equity instruments expected to vest differs from that originally
expected, the expense is adjusted accordingly.
The Group offers its employees under the employee stock
ownership plan (ESOP) Airbus Group shares at fair value matched
with a number of free shares based on a determining ratio. The
number of free shares is recognised at fair value as personnel
expenses in the Group’s Consolidated Income Statements at
grant date.
Trade liabilities — Trade liabilities are initially recorded at fair
value. Trade liabilities having a maturity of more than 12 months
are subsequently measured at amortised cost using the effective
interest rate method.
Financing liabilities — Financing liabilities comprise obligations
towards fi nancial institutions, issued corporate bonds, deposits
made by customers of Airbus Group Bank, borrowings received
from joint ventures and other parties as well as fi nance lease
liabilities. Financing liabilities are recorded initially at the fair value
of the proceeds received, net of transaction costs incurred.
Back to Contents54321 Q

AIRBUS GROUP FINANCIAL STATEMENTS 201432
Notes to the Consolidated Financial Statements (IFRS)2.1 Basis of Presentation
Subsequently, fi nancing liabilities are measured at amortised
cost using the effective interest rate method with any difference
between proceeds (net of transaction costs) and redemption
amount being recognised in “total fi nance income (cost)” over
the period of the fi nancing liability.
Financing liabilities to fi nancial institutions include liabilities from
securities lending transactions. In a securities lending transaction
Airbus Group receives cash from its counterparty and transfers
the securities subject to the lending transaction as collateral. The
amount of cash received is recognised as a fi nancing liability. The
securities lent are not derecognised, but remain on the Group’s
balance sheet. Their carrying amount is disclosed in Note 22
“Securities”.
Current / non-current other fi nancial liabilities — Current /
non-current other fi nancial liabilities mainly include refundable
advances and derivatives with a negative market value. Refundable
advances from European Governments are provided to the Group
to fi nance research and development activities for certain projects
on a risk-sharing basis, i.e. they have to be repaid to the European
Governments subject to the success of the project.
The Group designates certain fi nancial liabilities representing
payment obligations towards airlines denominated in USD as
hedging instruments to hedge the foreign currency risk inherent
in future aircraft sales under a cash fl ow hedge.
Current / non-current other liabilities — Current / non-current
other liabilities mainly consist of advance payments received from
customers.
Liabil ity for puttable instruments — Under cer tain
circumstances, the Group records a fi nancial liability rather than
an equity instrument for the exercise price of a written put option
on an entity’s equity. Re-measurement of any written put options
on non-controlling interest after initial recognition is recognised
in equity.
Litigation and claims — Various legal actions, governmental
investigations, proceedings and other claims are pending or
may be instituted or asserted in the future against the Group.
Litigation is subject to many uncertainties, and the outcome of
individual matters is not predictable with assurance. The Group
believes that it has made adequate provisions to cover current
or contemplated litigation risks. It is reasonably possible that the
fi nal resolution of some of these matters may require the Group
to make expenditures, in excess of established reserves, over an
extended period of time and in a range of amounts that cannot
be reasonably estimated. The term “reasonably possible” is used
herein to mean that the chance of a future transaction or event
occurring is more than remote but less than likely. For further
details please refer to Note 32 “Litigation and claims”.
Management Judgment and Use of Accounting
Estimates
The Group’s signifi cant accounting policies, as described above,
are essential for the understanding of the Group’s results of
operations, fi nancial positions and cash fl ows. Certain of these
accounting policies require accounting estimates that involve
complex and subjective judgment s and the use of assumptions,
some of which may be for matters that are inherently uncertain
and susceptible to change.
Judgment s have to be made in particular when assessing whether
a contract with a customer qualifi es as a construction contract
and in determining the amount of loss making contract provisions
as well as in the area of assessing provisions and contingent
liabilities for litigations and claims.
Accounting estimates could change from period to period and
might have a material impact on the Group’s results of operations,
fi nancial positions and cash fl ows. The assumptions and estimates
used by the Group’s management are based on parameters
which are derived from the knowledge at the time of preparing
the Consolidated Financial Statements.
In particular, the circumstances prevailing at this time and
assumptions as to the expected future development of the global
and industry specifi c environment were used to estimate the
Company’s future business performance. Where these conditions
develop differently than assumed, and beyond the control of the
Company, the actual fi gures may differ from those anticipated.
In such cases, the assumptions, and if necessary, the carrying
amounts of the assets and liabilities concerned, are adjusted
accordingly.
These estimates and underlying assumptions are reviewed on an
ongoing basis. Revisions to accounting estimates are recognised
in the period in which the estimate is revised if the revision affects
only that period, or in the period of the revision and future periods
if the revision affects both current and future periods.
Subjects that involve assumptions and estimates and that have
a signifi cant infl uence on the amounts recognised in the Group’s
Consolidated Financial Statements are further described or are
disclosed in the respective notes mentioned below.
Revenue recognition on construction contracts — The Group
conducts a signifi cant portion of its business under construction
contracts with customers, for example within aerospace related
governmental programmes. The Group generally accounts for
construction projects using the PoC method, recognising revenue
as performance on a contract progresses measured either on
a milestone or on a cost-to-cost basis depending on contract
terms. This method places considerable importance on accurate
estimates at completion as well as on the extent of progress
towards completion. For the determination of the progress of the
construction contract signifi cant estimates include total contract
costs, remaining costs to completion, total contract revenues,
contract risks and other judgment s. The Management of the
operating Divisions continually review all estimates involved in
such construction contracts and adjusts them as necessary. See
Note 19 “Trade receivables” for further information.
Back to Contents54321 Q

AIRBUS GROUP FINANCIAL STATEMENTS 2014 33
2
Notes to the Consolidated Financial Statements (IFRS)2.1 Basis of Presentation
Business combinations — In a business combination, all
identifi able assets, liabilities and contingent liabilities acquired
are recorded at the date of acquisition at their respective fair value.
One of the most signifi cant estimates relates to the determination
of the fair value of these assets and liabilities. Land, buildings and
equipment are usually independently appraised while marketable
securities are valued at market prices. If any intangible assets
are identifi ed, depending on the type of intangible asset and the
complexity of determining its fair value, the Group either consults
with an independent external valuation expert or develops the fair
value internally, using appropriate valuation techniques which are
generally based on a forecast of the total expected future net cash
fl ows. These evaluations are linked closely to the assumptions
made by management regarding the future performance of the
assets concerned and any changes in the discount rate applied.
See Note 4 “Acquisitions and disposals” and Note 13 “Intangible
assets” for further information.
Goodwill impairment test and recoverability of assets —
The Group tests at least annually whether goodwill has suffered
any impairment, in accordance with its accounting policies. The
determination of the recoverable amount of a Cash Generating Unit
(CGU) or the group of CGUs to which goodwill is allocated involves
the use of estimates by management. The outcome predicted by
these estimates is infl uenced by several assumptions including
for example growth assumptions of CGUs, availability and
composition of future defence and institutional budgets, foreign
exchange fl uctuations or implications arising from the volatility of
capital markets. The Group generally uses discounted cash fl ow
based methods to determine these values. These discounted
cash fl ow calculations basically use fi ve-year projections that are
based on the operative plans approved by management. Cash
fl ow projections take into account past experience and represent
management’s best estimate about future developments. Cash
fl ows after the planning period are extrapolated using estimated
growth rates. Key assumptions on which management has based
its determination of fair value less costs to sell and value in use
include estimated growth rates, WACC, tax rates and foreign
exchange rates. These estimates, including the methodology
used, can have a material impact on the respective values and
ultimately the amount of any goodwill impairment. Likewise,
whenever property, plant and equipment and other intangible
assets are tested for impairment, the determination of the assets’
recoverable amount involves the use of estimates by management
and can have a material impact on the respective values and
ultimately the amount of any impairment. See Note 13 “Intangible
assets” for further information.
Trade and other receivables — The allowance for doubtful
accounts involves significant management judgment and
review of individual receivables based on individual customer
creditworthiness, current economic trends including potential
impacts from the EU sovereign debt crisis and analysis of historical
bad debts. See Note 19 “Trade receivables” for further information.
Employee benefi ts — The Group accounts for pension and other
post-retirement benefi ts in accordance with actuarial valuations.
These valuations rely on statistical and other factors in order
to anticipate future events. These factors include key actuarial
assumptions including the discount rate, expected salary increases
and mortality rates. In determining the appropriate discount rate,
the Group considers the interest rates of high quality corporate
bonds with an AA rating. These actuarial assumptions may differ
materially from actual developments due to changing market
and economic conditions and therefore result in a signifi cant
change in post-retirement employee benefi t obligations and the
related future expense. See Note 25 “Provisions” b) for further
information.
Provisions — The determination of provisions, for example for
onerous contracts, warranty costs, restructuring measures and
legal proceedings is based on best available estimates. Onerous
sales contracts are identifi ed by monitoring the progress of the
contract as well as the underlying programme and updating
the estimate of contract costs, which also requires signifi cant
judgment related to achieving certain performance standards as
well as estimates involving warranty costs. Depending on the size
and nature of the Group’s contracts and related programmes,
the extent of assumptions, judgment s and estimates in these
monitoring processes differs. In particular, the introduction of
new commercial aircraft programmes (such as the A350 XWB)
or major derivative aircraft programmes particularly involves an
increased level of estimates and judgment s associated with the
expected development, production and certifi cation schedules
and expected cost components. A commercial aircraft contract
or amendment to a contract may include option clauses for
extension as well as termination of full or part of the contract.
The assessment of the probability of execution of these options
is based on management’s best estimates. Estimates and
judgment s are subject to change based on new information as
contracts and related programmes progress. Furthermore, the
complex design and manufacturing processes of the Group’s
industry require challenging integration and coordination along
the supply chain including an on-going assessment of suppliers’
assertions which may additionally impact the outcome of these
monitoring processes. See Note 25 “Provisions” c) for further
information.
Legal contingencies — Group companies are parties to
litigations related to a number of matters as described in Note 32
“Litigation and claims”. The outcome of these matters may have
a material effect on the fi nancial position, results of operations or
cash fl ows of the Group. Management regularly analyses current
information about these matters and provides provisions for
probable cash outfl ows, including the estimate of legal expenses
to resolve the matters. Internal and external lawyers are used for
these assessments. In making the decision regarding the need
for provisions, management considers the degree of probability
of an unfavourable outcome and the ability to make a suffi ciently
reliable estimate of the amount of loss. The fi ling of a suit or formal
assertion of a claim against Group companies or the disclosure
of any such suit or assertions, does not automatically indicate
that a provision may be appropriate. See Note 32 “Litigation and
claims” for further information.
Back to Contents54321 Q

AIRBUS GROUP FINANCIAL STATEMENTS 201434
Notes to the Consolidated Financial Statements (IFRS)2.1 Basis of Presentation
3. Scope of Consolidation
Perimeter of consolidation (31 December 2014) – The
Consolidated Financial Statements include, in addition to
Airbus Group N.V.:
■ 2014: 286 (2013 adjusted: 257) companies which are fully
consolidated; ■ 2014: 50 (2013: 47) investments in joint ventures, accounted for
using the equity method; ■ 2014: 17 (2013 adjusted: 19) investments in associates accounted
for using the equity method. The number of investments in
associates only comprises the respective parent company.
Non-controlling interests do not have a material interest in the
Group’s activities and cash fl ows (please refer to Note 23 “Total
equity” b). The Group holds interests in certain Structured Entities
(“SE”), in particular with respect to its aircraft fi nancing activities.
The nature and extent of these interests and the risks associated
with interests in SE that the Group does not consolidate are further
described in the Note 33 “Commitments and c ontingencies”.
Signifi cant subsidiaries, associates and joint ventures are listed
in the Appendix entitled “Information on principal investments”.
Income taxes — The Group operates and earns income in
numerous countries and is subject to changing tax laws in multiple
jurisdictions within these countries. Signifi cant judgment s are
necessary in determining the worldwide income tax liabilities.
Although management believes that it has made reasonable
estimates about the final outcome of tax uncertainties, no
assurance can be given that the fi nal tax outcome of these
matters will be consistent with what is refl ected in the historical
income tax provisions. Such differences could have an effect on
the current income tax liabilities and deferred income tax liabilities
in the period in which such determinations are made. At each
end of the reporting period, the Group assesses whether the
realisation of future tax benefi ts is probable to recognise deferred
tax assets. This assessment requires the exercise of judgment
on the part of management with respect to, among other things,
benefi ts that could be realised from available tax strategies and
future taxable income, as well as other positive and negative
factors. The recorded amount of total deferred tax assets could
be reduced if estimates of projected future taxable income and
benefi ts from available tax strategies are lowered, or if changes in
current tax regulations are enacted that impose restrictions on the
timing or extent of the Group’s ability to utilise future tax benefi ts.
In principle, the basis for the recoverability test of deferred tax
assets is the same as the Group’s latest 5 year operative planning
also taking into account certain qualitative aspects regarding the
nature of the temporary differences. The further looking into the
future is necessary to seek suffi cient taxable profi ts, the more
subjective the projections become. However, as a general cut off
of the lookout period would be arbitrary, the Group determines the
lookout period applied for an entity also considering qualitative
factors. Consideration of such qualitative factors could result
in not applying the full 5 year operative planning period for the
deferred tax asset recoverability assessment as well as the
contrary, i.e. extending the period to the strategic planning period.
Qualitative factors include but are not limited to an entity’s history
of planning accuracy, performance records, business model,
backlog, existence of long-term contracts as well as the nature
of temporary differences. See Note 12 “Income taxes” for further
information.
Back to Contents54321 Q

AIRBUS GROUP FINANCIAL STATEMENTS 2014 35
2
Notes to the Consolidated Financial Statements (IFRS)2.1 Basis of Presentation
4. Acquisitions and Disposals
a) Acquisitions and other M&A Transactions
On 25 July 2014, Airbus Group N.V., Leiden (Netherlands) acquired 100% shares in Salzburg München Bank AG from Raiffeisenverband
Salzburg. The Salzburg München Bank AG is a fully-licensed bank based in Munich (Germany) with around € 300 million of total assets
serving small and medium enterprises and private clients. The acquisition of Salzburg München Bank AG aims to provide additional
fi nancing options for the Group’s businesses. Between the acquisition date and year-end 2014, Salzburg München Bank AG reported
revenues of € 4.7 million.
On 28 July 2014, Airbus Operations S.L.U., Getafe (Spain), acquired additional 58.49% shares in Alestis Aerospace S.L., La Rinconada
(Spain) for a total consideration of € 28 million including € 6 million due to the separate recognition of settlements of pre-existing
relationships. This provides Airbus Group with a majority shareholding of in total 60.16% in Alestis Aerospace S.L. Airbus’ investment
is intended to secure the supply chain for civil and military programmes. Alestis Aerospace S.L. reported revenues of € 148 million for
the full year 2014.
The following table summarises for the individually and collectively insignifi cant M&A transactions mentioned above the consideration
transferred, the fair value of identifi able assets acquired, liabilities assumed and any non-controlling interest as at the acquisition date.
Fair value recognised on acquisition 2014 individually and collectively insignificant acquisitions
(In € million)
Intangible assets
Technologies(1) 95
Other 1
Property, plant and equipment 107
Financial assets 315
Inventories 25
Trade receivables 21
Deferred tax assets 13
Other assets 16
Cash 14
Total assets acquired 607
Provisions and contingent liabilities(2) 22
Trade liabilities 23
Financial liabilities (on which liabilities to banks and customer deposits) 542
Tax liabilities and other liabilities 27
Total liabilities assumed 614
Net liabilities assumed (7)
Non-controlling interests(3) (17)
Consideration transferred 63
Preliminary goodwill arising on acquisition(4) 54
Gain on acquisition 1
(1) The technologies acquired are expected to be amortised over a period between 5-7 years.
(2) Includes contingent liabilities for € 2.4 million.
(3) Non-controlling interests portion related to acquisition of Alestis, measured at their proportional share in net assets.
(4) None of the goodwill of the Group’s 2014 M&A transactions is considered to be tax deductible in the respective local tax accounts.
Back to Contents54321 Q
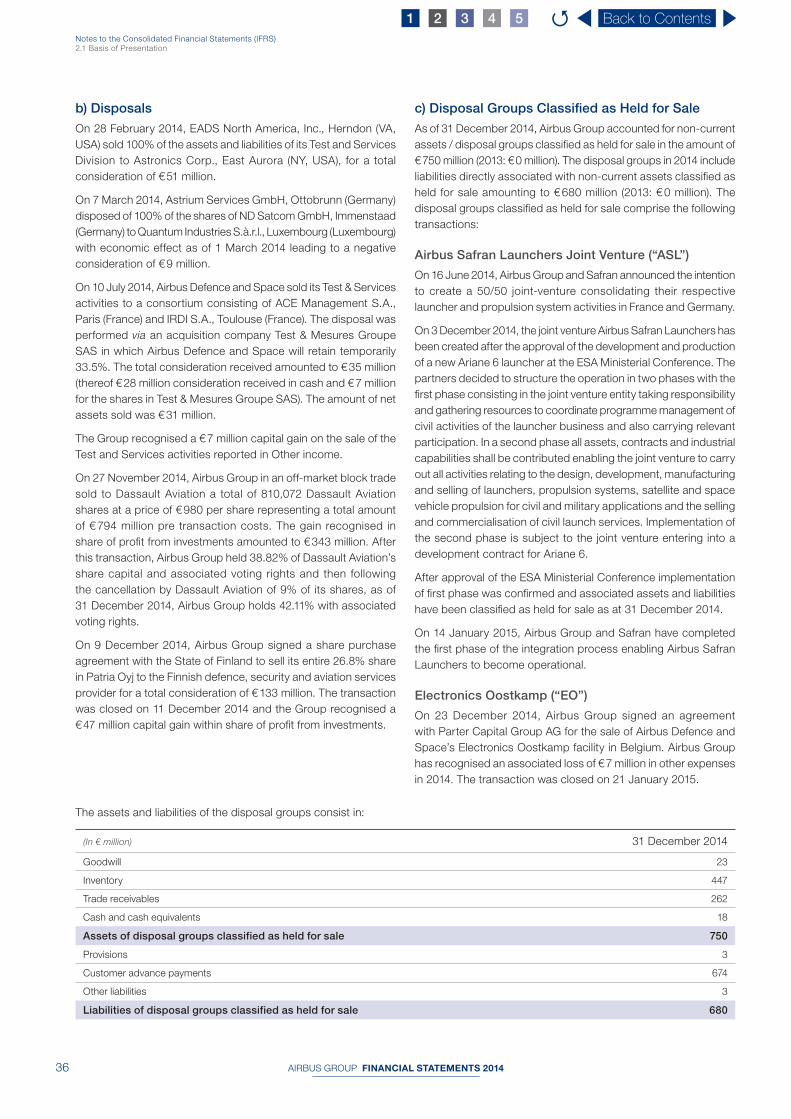
AIRBUS GROUP FINANCIAL STATEMENTS 201436
Notes to the Consolidated Financial Statements (IFRS)2.1 Basis of Presentation
The assets and liabilities of the disposal groups consist in:
(In € million) 31 December 2014
Goodwill 23
Inventory 447
Trade receivables 262
Cash and cash equivalents 18
Assets of disposal groups classified as held for sale 750
Provisions 3
Customer advance payments 674
Other liabilities 3
Liabilities of disposal groups classified as held for sale 680
b) Disposals
On 28 February 2014, EADS North America, Inc., Herndon (VA,
USA) sold 100% of the assets and liabilities of its Test and Services
Division to Astronics Corp., East Aurora (NY, USA), for a total
consideration of € 51 million.
On 7 March 2014, Astrium Services GmbH, Ottobrunn (Germany)
disposed of 100% of the shares of ND Satcom GmbH, Immenstaad
(Germany) to Quantum Industries S.à.r.l., Luxembourg (Luxembourg)
with economic effect as of 1 March 2014 leading to a negative
consideration of € 9 million.
On 10 July 2014, Airbus Defence and Space sold its Test & Services
activities to a consortium consisting of ACE Management S.A.,
Paris (France) and IRDI S.A., Toulouse (France). The disposal was
performed via an acquisition company Test & Mesures Groupe
SAS in which Airbus Defence and Space will retain temporarily
33.5%. The total consideration received amounted to € 35 million
(thereof € 28 million consideration received in cash and € 7 million
for the shares in Test & Mesures Groupe SAS). The amount of net
assets sold was € 31 million.
The Group recognised a € 7 million capital gain on the sale of the
Test and Services activities reported in Other income.
On 27 November 2014, Airbus Group in an off-market block trade
sold to Dassault Aviation a total of 810,072 Dassault Aviation
shares at a price of € 980 per share representing a total amount
of € 794 million pre transaction costs. The gain recognised in
share of profi t from investments amounted to € 343 million. After
this transaction, Airbus Group held 38.82% of Dassault Aviation’s
share capital and associated voting rights and then following
the cancellation by Dassault Aviation of 9% of its shares, as of
31 December 2014, Airbus Group holds 42.11% with associated
voting rights.
On 9 December 2014, Airbus Group signed a share purchase
agreement with the State of Finland to sell its entire 26.8% share
in Patria Oyj to the Finnish defence, security and aviation services
provider for a total consideration of € 133 million. The transaction
was closed on 11 December 2014 and the Group recognised a
€ 47 million capital gain within share of profi t from investments.
c) Disposal Groups Classifi ed as Held for Sale
As of 31 December 2014, Airbus Group accounted for non-current
assets / disposal groups classifi ed as held for sale in the amount of
€ 750 million (2013: € 0 million). The disposal groups in 2014 include
liabilities directly associated with non-current assets classifi ed as
held for sale amounting to € 680 million (2013: € 0 million). The
disposal groups classifi ed as held for sale comprise the following
transactions:
Airbus Safran Launchers Joint Venture (“ASL”)
On 16 June 2014, Airbus Group and Safran announced the intention
to create a 50/50 joint-venture consolidating their respective
launcher and propulsion system activities in France and Germany.
On 3 December 2014, the joint venture Airbus Safran Launchers has
been created after the approval of the development and production
of a new Ariane 6 launcher at the ESA Ministerial Conference. The
partners decided to structure the operation in two phases with the
fi rst phase consisting in the joint venture entity taking responsibility
and gathering resources to coordinate programme management of
civil activities of the launcher business and also carrying relevant
participation. In a second phase all assets, contracts and industrial
capabilities shall be contributed enabling the joint venture to carry
out all activities relating to the design, development, manufacturing
and selling of launchers, propulsion systems, satellite and space
vehicle propulsion for civil and military applications and the selling
and commercialisation of civil launch services. Implementation of
the second phase is subject to the joint venture entering into a
development contract for Ariane 6.
After approval of the ESA Ministerial Conference implementation
of fi rst phase was confi rmed and associated assets and liabilities
have been classifi ed as held for sale as at 31 December 2014.
On 14 January 2015, Airbus Group and Safran have completed
the fi rst phase of the integration process enabling Airbus Safran
Launchers to become operational.
Electronics Oostkamp (“EO”)
On 23 December 2014, Airbus Group signed an agreement
with Parter Capital Group AG for the sale of Airbus Defence and
Space’s Electronics Oostkamp facility in Belgium. Airbus Group
has recognised an associated loss of € 7 million in other expenses
in 2014. The transaction was closed on 21 January 2015.
Back to Contents54321 Q
AIRBUS GROUP FINANCIAL STATEMENTS 2014 37
2
Notes to the Consolidated Financial Statements (IFRS)2.2 Notes to the Consolidated Income Statements
2 .2 Notes to the Consolidated Income Statements
5. Segment Reporting
Having conducted a strategy review and in order to improve
competitiveness and better adapt to shrinking traditional markets,
the Group’s defence and space businesses are combined into
one segment from 1 January 2014 onwards. Improving access
to international customers, creating cost and market synergies in
the Group’s operations and product portfolio and better focusing
the Group’s research and development activities are among the
goals of this reorganisation.
The Group operates in three reportable segments which refl ect
the internal organisational and management structure according
to the nature of the products and services provided.
■ Airbus (before 1 January 2014: Airbus Commercial) —
Development, manufacturing, marketing and sale of commercial
jet aircraft of more than 100 seats; aircraft conversion and related
services; development, manufacturing, marketing and sale of
regional turboprop aircraft and aircraft components. ■ Airbus Helicopters (before 1 January 2014: Eurocopter) —
Development, manufacturing, marketing and sale of civil and
military helicopters; provision of helicopter related services. ■ Airbus Defence and Space — Military combat aircraft and
training aircraft; provision of defence electronics and of global
security market solutions such as integrated systems for global
border security and secure communications solutions and
logistics; training, testing, engineering and other related services;
development, manufacturing, marketing and sale of missiles
systems; development, manufacturing, marketing and sale of
satellites, orbital infrastructures and launchers; provision of space
related services; development, manufacturing, marketing and
sale of military transport aircraft and special mission aircraft and
related services. The former reportable segments Cassidian,
Astrium and Airbus Military form the new reportable segment
Airbus Defence and Space.
The following table presents information with respect to the
Group’s business segments. As a rule, inter-segment transfers
are carried out on an arm’s length basis. Inter-segment sales
predominantly take place between Airbus and Airbus Defence and
Space and between Airbus Helicopters and Airbus. The Group’s
activities managed in the US, the holding function of the Group’s
Headquarters such as the newly acquired bank and other activities
not allocable to the reportable segments, combined together with
consolidation effects, are disclosed in the column “Others / HQ /
Conso.”. The corresponding prior period information has been
restated.
Airbus Group uses EBIT pre-goodwill impairment and exceptionals
as a key indicator of its economic performance. The term
“exceptionals” refers to such items as depreciation expenses of
fair value adjustments relating to the former EADS merger and
the Airbus combination, as well as impairment charges thereon.
It also comprises disposal impacts related to goodwill and fair
value adjustments from these transactions. EBIT pre-goodwill
impairment and exceptionals is treated by management as a key
indicator to measure the segments’ economic performance.
Back to Contents54321 Q

AIRBUS GROUP FINANCIAL STATEMENTS 201438
Notes to the Consolidated Financial Statements (IFRS)2.2 Notes to the Consolidated Income Statements
a) Business Segment Information
Business segment information for the year ended the 31 December 2014 is as follows:
(In € million) AirbusAirbus
Helicopters
Airbus Defence
and SpaceTotal
Segments
Others / HQ /
Conso. Consolidated
Total revenues 42,280 6,524 13,025 61,829 482 62,311
Internal revenues (749) (528) (297) (1,574) (24) (1,598)
Revenues 41,531 5,996 12,728 60,255 458 60,713
EBIT pre-goodwill impairment and exceptionals 2,671 413 409 3,493 547 4,040
thereof:
depreciation and amortisation (1,419) (157) (540) (2,116) (34) (2,150)
research and development expenses (2,667) (325) (360) (3,352) (39) (3,391)
share of profit from investments accounted for under the equity method 62 4 176 242 598 840
additions to other provisions (see Note 25c) 1,148 523 1,580 3,251 178 3,429
Disposal of goodwill 0 0 (6) (6) 0 (6)
Exceptionals depreciation / disposal (25) 0 (16) (41) (2) (43)
Profit before finance costs and income taxes 2,646 413 387 3,446 545 3,991
Interest result (320)
Other financial result (458)
Income taxes (863)
Profit for the period 2,350
Business segment information for the year ended the 31 December 2013 is as follows:
(In € million)(1) Airbus(2)
Airbus Helicopters
Airbus Defence
and Space(2)
Total Segments
Others / HQ /
Conso.(2) Consolidated
Total revenues 39,494 6,297 13,121 58,912 457 59,369
Internal revenues (933) (486) (382) (1,801) (1) (1,802)
Revenues 38,561 5,811 12,739 57,111 456 57,567
EBIT pre-goodwill impairment and exceptionals 1,593 397 659 2,649 (25) 2,624
thereof:
depreciation and amortisation (1,208) (136) (521) (1,865) (62) (1,927)
research and development expenses (2,433) (306) (344) (3,083) (35) (3,118)
share of profit from investments accounted for under the equity method 59 3 121 183 251 434
additions to other provisions (see Note 25c)(3) (1,043) (533) (1,150) (2,726) (513) (3,239)
Impairment and disposal of goodwill 0 0 0 0 (15) (15)
Exceptionals depreciation / disposal (26) (1) (11) (38) (1) (39)
Profit before finance costs and income taxes 1,567 396 648 2,611 (41) 2,570
Interest result (332)
Other financial result (278)
Income taxes (477)
Profit for the period 1,483
(1) Previous year figures are adjusted due to the new segment structure.
(2) Previous year figures are adjusted due to the application of IFRS 10 and IFRS 11.
(3) Includes (€ 292 million adjusted) expenses for restructuring provisions associated to the Group’s reorganisation mainly in the defence and space business.
Back to Contents54321 Q

AIRBUS GROUP FINANCIAL STATEMENTS 2014 39
2
Notes to the Consolidated Financial Statements (IFRS)2.2 Notes to the Consolidated Income Statements
Segment Capital Expenditures(1) 2014 2013
(In € million)
Airbus(2) 1,713 2,116
Airbus Helicopters 303 279
Airbus Defence and Space(2) 497 466
Others / HQ / Conso. 35 57
Total capital expenditures(2) 2,548 2,918
(1) Excluding expenditure for leased assets.
(2) Previous year figures are adjusted due to the application of IFRS 10 and IFRS 11.
Segment Assets 2014 2013
(In € million)
Airbus(1) 41,342 39,812
Airbus Helicopters 10,248 9,775
Airbus Defence and Space(1) 17,660 18,678
Others / HQ / Conso.(1) 3,337 3,564
Total segment assets(1) 72,587 71,829
Unallocated
Deferred and current tax assets(1) 6,322 4,361
Securities(1) 9,172 6,883
Cash and cash equivalents(1) 7,271 7,201
Assets classified as held for sale 750 0
Total assets(1) 96,102 90,274
(1) Previous year figures are adjusted due to the application of IFRS 10 and IFRS 11.
b) Revenues by Geographical Area
(In € million) 2014 2013(1)
Germany 4,448 4,297
France 4,294 4,585
United Kingdom 3,540 2,967
Spain 1,493 1,512
Other European Countries 6,479 6,948
Asia / Pacific 19,379 19,252
North America 9,731 8,670
Middle East 6,520 5,118
Latin America 3,844 3,398
Other Countries 985 820
Revenues by geographical area 60,713 57,567
(1) Previous year figures are adjusted due to the application of IFRS 10 and IFRS 11.
Revenues are allocated to geographical areas based on the location of the customer.
Back to Contents54321 Q

AIRBUS GROUP FINANCIAL STATEMENTS 201440
Notes to the Consolidated Financial Statements (IFRS)2.2 Notes to the Consolidated Income Statements
c) Property, Plant and Equipment by Geographical Area
31 December
(In € million) 2014 2013
France(1) 6,438 6,037
Germany(1) 4,428 4,411
United Kingdom(1) 2,891 2,778
Spain 1,534 1,364
Other Countries(1) 817 644
Property, plant and equipment by geographical area(1) 16,108 15,234
(1) Previous year figures are adjusted due to the application of IFRS 10 and IFRS 11.
Property, plant and equipment split by geographical area excludes leased assets of € 213 million (2013 adjusted: € 351 million).
6. Revenues and Gross Margin
Revenues are mainly comprised of sales of goods and services,
as well as of revenues associated with construction contracts
accounted for under the percentage-of-completion method,
contracted research and development and customer fi nancing
revenues.
For a breakdown of revenues by business segment and
geographical area, refer to Note 5 “Segment reporting”.
Details of Revenues:
(In € million) 2014 2013(1)
Revenues from construction contracts 7,916 8,854
Other revenues 52,797 48,713
Total 60,713 57,567
Thereof service revenues including sale of spare parts 8,279 7,517
(1) Previous year figures are adjusted due to the application of IFRS 10 and IFRS 11.
Revenues of € 60,713 million (2013 adjusted: € 57,567 million)
increase by € +3,146 million (5%) mainly at Airbus (€ +2,786 million).
The revenue growth in Airbus results from a more favourable
delivery mix. Airbus delivered more aircraft (629 with revenue
recognition versus 626 in the previous year). Airbus Helicopters
contributed also positively. Airbus Defence and Space revenues
decrease slightly and include revenues related to the A400M of
€ 1,561 million (2013: € 1,006 million).
The Gross Margin increases by € +983 million to € 8,937 million
compared to € 7,954 million (adjusted) in 2013 with contribution
mainly from Airbus. Gross margin rate increased from 13.8%
to 14.7%. In Airbus, the increase was driven by operational
improvement including A380 progress towards breakeven and
the favourable evolution of maturing hedges, partially offset by
increased A350 XWB support costs. In the last quarter 2013, a
negative charge of € 434 million was recorded on the A350 XWB
programme contributing to the improvement seen in 2014.
The A350 XWB E ntry-into-service occurred at the end of 2014,
with the fi rst A350 XWB being delivered to Qatar Airways on
22 December. Despite this important achievement, signifi cant
challenges remain. The industrial ramp up preparation is underway
and associated risks will continue to be closely monitored in line
with the schedule, aircraft performance and overall cost envelope,
as per customer’s commitment.
After eight aircraft deliveries in 2014, the A400M programme is in
a phase of progressive enhancement of military capabilities with
delays incurred. The sequence of progressive enhancements and
associated deliveries are under negotiation with the customers to
refl ect revised programme baseline and delivery schedule.
In the last quarter of 2014, Management has reviewed the
programme evolution mostly driven by military functionality
challenges and industrial ramp-up together with associated
mitigation actions. As a result of this review, Airbus Defence
and Space has recorded based on Management best estimate
an additional net charge of € 551 million for the period ended
31 December 2014.
Back to Contents54321 Q

AIRBUS GROUP FINANCIAL STATEMENTS 2014 41
2
Notes to the Consolidated Financial Statements (IFRS)2.2 Notes to the Consolidated Income Statements
Personnel expenses are:
(In € million) 2014 2013(1)
Wages, salaries and social contributions 12,291 12,147
Net periodic pension cost (see Note 25 “Provisions” b) 549 536
Total 12,840 12,683
(1) Previous year figures are adjusted due to the application of IFRS 10 and IFRS 11.
Research and development expenses in 2014 amount to
€ 3,391 million compared to € 3,118 million (adjusted) in 2013,
primarily refl ecting R&D activities at Airbus. The main contribution
to the expenses comes from the A350 XWB programme. In
addition, an amount of € 58 million of development costs for the
A350 XWB programme has been capitalised.
9. Other Income
(In € million) 2014 2013
Other income(1) 330 272
Thereof income from sale of fixed assets(1) 108 66
Thereof rental income(1) 67 14
Thereof release of allowances 2 5
(1) Previous year figures are adjusted due to the application of IFRS 10 and IFRS 11.
Other income increased by € +58 million mainly as a result of the sale of the Paris Headquarters building.
7. Functional Costs
Inventories recognised as an expense during the period amount
to € 41,523 million (2013 adjusted: € 39,385 million).
Further included in cost of sales are amortisation expenses of
fair value adjustments of non-current assets in the amount of
€ 43 million (2013 adjusted: € 39 million).
The A400M SOC 1 milestone remains to be achieved. SOC 1 fell
due end October 2013, and the termination right related thereto
became exercisable by OCCAR / Nations on 1 November 2014
after a 12-month grace period. It has not at the date hereof been
exercised. Management judges that it is highly unlikely that this
termination right will be exercised.
The A400M programme remains in a critical phase and associated
risks will continue to be closely monitored.
8. Research and Development Expenses
Back to Contents54321 Q

AIRBUS GROUP FINANCIAL STATEMENTS 201442
Notes to the Consolidated Financial Statements (IFRS)2.2 Notes to the Consolidated Income Statements
12. Income Taxes
The expense for income taxes is comprised of the following:
(In € million) 2014 2013(1)
Current tax expense (546) (430)
Deferred tax expense (317) (47)
Total (863) (477)
(1) Previous year figures are adjusted due to the application of IFRS 10 and IFRS 11.
11. Total Finance Costs
Interest result in 2014 comprises interest income of € 142 million
(2013 adjusted: € 161 million) and interest expense of € -462 million
(2013 adjusted: € -493 million). Included in interest income is the
return on cash and cash equivalents, securities and fi nancial
assets such as loans and fi nance leases. Interest expense includes
interests on fi nancing liabilities and on European Government
refundable advances of € -205 million (2013: € -254 million).
Other financial result in 2014 amounts to € -458 million (2013
adjusted: € -278 million) and mainly includes charges from the
unwinding of discounts by € -117 million (2013: € -171 million), the
negative impact from foreign exchange translation of monetary
items of € -121 million (2013: € -64 million) and the negative
revaluation of fi nancial instruments of € -240 million (2013 adjusted:
€ -31 million).
In 2014, the Group capitalised € 20 million of borrowing cost on
the production of qualifying assets (2013: € 12 million). The Group’s
borrowing rate at the end of 2014 was 2.12% (2013: 2.24%).
10. Other Expenses
(In € million) 2014 2013
Other expenses(1) 179 259
Thereof goodwill impairment charge 0 15
Thereof loss from disposal of fixed assets(1) 20 5
(1) Previous year figures are adjusted due to the application of IFRS 10 and IFRS 11.
The Group’s parent company, Airbus Group N.V., legally seated
in Amsterdam, The Netherlands, applies Dutch tax law using
an income tax rate of 25.0% for 31 December 2014 and for
31 December 2013.
In France a tax law has been enacted in December 2013 changing
the rate for income taxes to 38% for the years 2013 and 2014. This
change has been prolonged for the year 2015. For subsequent
years the tax rate should go down again to 34.43%. Deferred taxes
are calculated accordingly.
Regarding German subsidiaries, the German federal corporate
tax rate amounts to 15%. In addition, there is a surcharge
(Solidaritätszuschlag) of 5.5% on the amount of federal corporate
taxes. In addition to corporate taxation, the trade taxes amount
to 14.2% on average. In aggregate, the enacted tax rate which
has been applied to German deferred taxes amounts to 30% in
2014 and 2013.
With respect to the Spanish subsidiaries, the corporate income
tax rate amounts to 30% in 2014 and 2013. In November 2014, a
tax law has been enacted changing the rate from income tax to
28% for the year 2015 and to 25% thereafter. Deferred taxes are
calculated accordingly.
All other foreign subsidiaries apply their national tax rates.
Back to Contents54321 Q
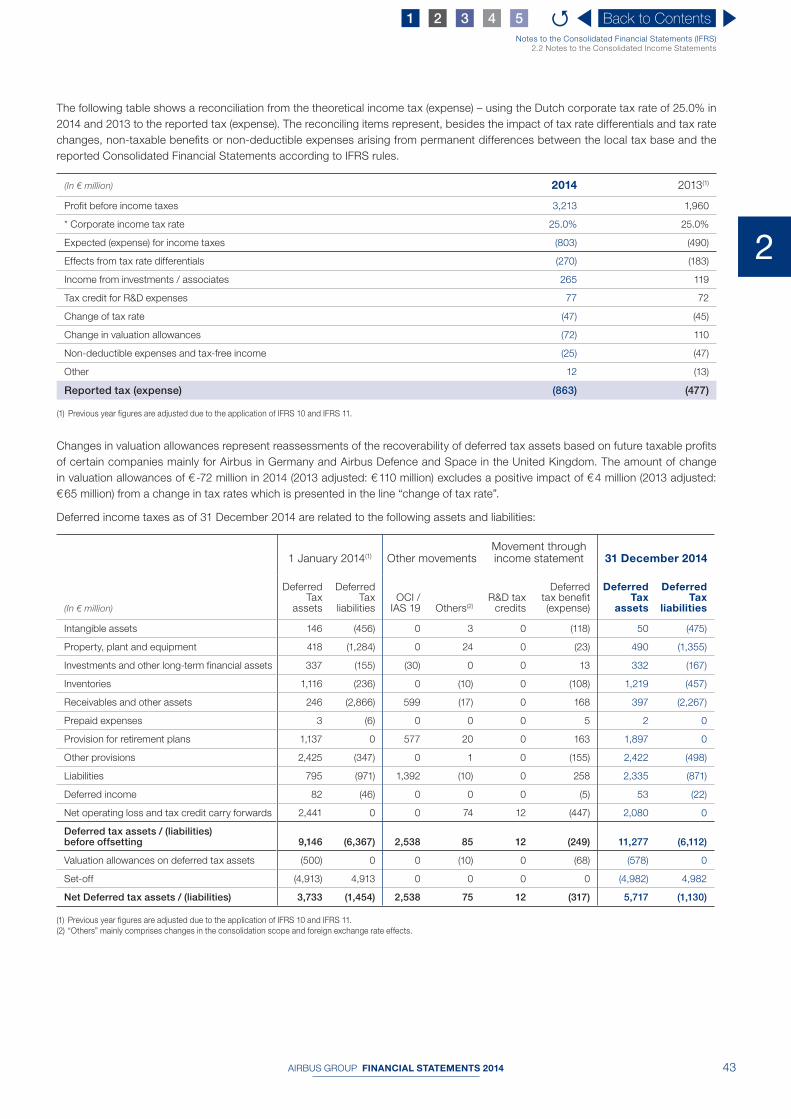
AIRBUS GROUP FINANCIAL STATEMENTS 2014 43
2
Notes to the Consolidated Financial Statements (IFRS)2.2 Notes to the Consolidated Income Statements
The following table shows a reconciliation from the theoretical income tax (expense) – using the Dutch corporate tax rate of 25.0% in
2014 and 2013 to the reported tax (expense). The reconciling items represent, besides the impact of tax rate differentials and tax rate
changes, non-taxable benefi ts or non-deductible expenses arising from permanent differences between the local tax base and the
reported Consolidated Financial Statements according to IFRS rules.
(In € million) 2014 2013(1)
Profit before income taxes 3,213 1,960
* Corporate income tax rate 25.0% 25.0%
Expected (expense) for income taxes (803) (490)
Effects from tax rate differentials (270) (183)
Income from investments / associates 265 119
Tax credit for R&D expenses 77 72
Change of tax rate (47) (45)
Change in valuation allowances (72) 110
Non-deductible expenses and tax-free income (25) (47)
Other 12 (13)
Reported tax (expense) (863) (477)
(1) Previous year figures are adjusted due to the application of IFRS 10 and IFRS 11.
Changes in valuation allowances represent reassessments of the recoverability of deferred tax assets based on future taxable profi ts
of certain companies mainly for Airbus in Germany and Airbus Defence and Space in the United Kingdom. The amount of change
in valuation allowances of € -72 million in 2014 (2013 adjusted: € 110 million) excludes a positive impact of € 4 million (2013 adjusted:
€ 65 million) from a change in tax rates which is presented in the line “change of tax rate”.
Deferred income taxes as of 31 December 2014 are related to the following assets and liabilities:
1 January 2014(1) Other movementsMovement through income statement 31 December 2014
(In € million)
Deferred Tax
assets
Deferred Tax
liabilitiesOCI /
IAS 19 Others(2)R&D tax
credits
Deferred tax benefit (expense)
Deferred Tax
assets
Deferred Tax
liabilities
Intangible assets 146 (456) 0 3 0 (118) 50 (475)
Property, plant and equipment 418 (1,284) 0 24 0 (23) 490 (1,355)
Investments and other long-term financial assets 337 (155) (30) 0 0 13 332 (167)
Inventories 1,116 (236) 0 (10) 0 (108) 1,219 (457)
Receivables and other assets 246 (2,866) 599 (17) 0 168 397 (2,267)
Prepaid expenses 3 (6) 0 0 0 5 2 0
Provision for retirement plans 1,137 0 577 20 0 163 1,897 0
Other provisions 2,425 (347) 0 1 0 (155) 2,422 (498)
Liabilities 795 (971) 1,392 (10) 0 258 2,335 (871)
Deferred income 82 (46) 0 0 0 (5) 53 (22)
Net operating loss and tax credit carry forwards 2,441 0 0 74 12 (447) 2,080 0
Deferred tax assets / (liabilities) before offsetting 9,146 (6,367) 2,538 85 12 (249) 11,277 (6,112)
Valuation allowances on deferred tax assets (500) 0 0 (10) 0 (68) (578) 0
Set-off (4,913) 4,913 0 0 0 0 (4,982) 4,982
Net Deferred tax assets / (liabilities) 3,733 (1,454) 2,538 75 12 (317) 5,717 (1,130)
(1) Previous year figures are adjusted due to the application of IFRS 10 and IFRS 11.
(2) “Others” mainly comprises changes in the consolidation scope and foreign exchange rate effects.
Back to Contents54321 Q

AIRBUS GROUP FINANCIAL STATEMENTS 201444
Notes to the Consolidated Financial Statements (IFRS)2.2 Notes to the Consolidated Income Statements
Deferred income taxes as of 31 December 2013 are related to the following assets and liabilities:
1 January 2013(1) Other movements(1)Movement through income statement(1) 31 December 2013(1)
(In € million)
Deferred Tax
assets
Deferred Tax
liabilitiesOCI /
IAS 19 Others(2)R&D tax
credits
Deferred tax benefit (expense)
Deferred Tax
assets
Deferred Tax
liabilities
Intangible assets 153 (402) 0 1 0 (62) 146 (456)
Property, plant and equipment 380 (1,137) 0 1 0 (110) 418 (1,284)
Investments and other long-term financial assets 313 (107) 13 0 0 (37) 337 (155)
Inventories 1,690 (37) 0 3 0 (776) 1,116 (236)
Receivables and other assets 85 (2,292) (391) (3) 0 (19) 246 (2,866)
Prepaid expenses 1 (9) 0 0 0 5 3 (6)
Provision for retirement plans 1,078 0 20 0 0 39 1,137 0
Other provisions 2,366 (262) 0 (2) 0 (24) 2,425 (347)
Liabilities 677 (1,276) (324) (1) 0 748 795 (971)
Deferred income 224 (36) 0 (96) 0 (56) 82 (46)
Net operating loss and tax credit carry forwards 2,376 0 0 (56) 51 70 2,441 0
Deferred tax assets / (liabilities) before offsetting 9,343 (5,558) (682) (153) 51 (222) 9,146 (6,367)
Valuation allowances on deferred tax assets (819) 0 0 144 0 175 (500) 0
Set-off (4,099) 4,099 0 0 0 0 (4,913) 4,913
Net Deferred tax assets / (liabilities) 4,425 (1,459) (682) (9) 51 (47) 3,733 (1,454)
(1) Previous year figures are adjusted due to the application of IFRS 10 and IFRS 11.
(2) “Others” mainly comprises changes in the consolidation scope and foreign exchange rate effects.
Companies in defi cit situations in two or more subsequent years recorded a total deferred tax asset balance of € 115 million (in 2013
adjusted: € 12 million). Assessments show that these deferred tax assets will be recovered in future through either (i) own projected
profi ts, or (ii) profi ts of other companies integrated in the same fi scal group (régime d’intégration fiscale in France, steuerliche Organschaft
in Germany) or (iii) via the “loss surrender-agreement” in Great Britain.
Deferred taxes on Net Operating Losses and Tax Credit carry forwards:
(In € million) France Germany Spain UKOther
countries31 December
201431 December
2013(1)
Net Operating Losses (NOL) 900 1,903 167 2,982 458 6,410 7,347
Trade tax loss carry forwards 0 2,240 0 0 0 2,240 2,217
Tax credit carry forwards 0 0 393 0 5 398 369
Tax effect 342 617 435 596 90 2,080 2,441
Valuation allowances (6) (234) (95) (90) (15) (440) (395)
Deferred tax assets on NOL’s and tax credit carry forwards 336 383 340 506 75 1,640 2,046
(1) Previous year figures are adjusted due to the application of IFRS 10 and IFRS 11.
NOLs, capital losses and trade tax loss carry forwards are indefi nitely usable in France, Germany, Great Britain and in Spain. In Spain,
tax credit carry forwards still expire after 18 years. The fi rst tranche of tax credit carry forwards (€ 3 million) will expire in 2021.
Back to Contents54321 Q

AIRBUS GROUP FINANCIAL STATEMENTS 2014 45
2
Notes to the Consolidated Financial Statements (IFRS)2.2 Notes to the Consolidated Income Statements
Roll forward of deferred taxes:
(In € million) 2014 2013(1)
Net deferred tax asset beginning of the year 2,279 2,966
Deferred tax (expense) in income statement (317) (47)
Deferred tax recognised directly in AOCI (IAS 39) 1,961 (702)
Deferred tax on remeasurement of the net defined benefit liability 577 20
Others 87 42
Net deferred tax asset at year end 4,587 2,279
(1) Previous year figures are adjusted due to the application of IFRS 10 and IFRS 11.
Details of deferred taxes recognised cumulatively in equity are as follows:
(In € million) 2014 2013(1)
Available-for-sale investments (51) (21)
Cash flow hedges 1,465 (526)
Deferred tax on remeasurement of the net defined benefit liability 1,548 971
Total 2,962 424
(1) Previous year figures are adjusted due to the application of IFRS 10 and IFRS 11.
Back to Contents54321 Q

AIRBUS GROUP FINANCIAL STATEMENTS 201446
Notes to the Consolidated Financial Statements (IFRS)2.3 Notes to the Consolidated Statements of Financial Position
2 .3 Notes to the Consolidated Statements of Financial Position
13. Intangible Assets
A schedule detailing gross values, accumulated depreciation and impairment and net values of intangible assets as of 31 December
2014 is as follows:
Cost
(In € million)
Balance at 1 January
2014(1)
Exchange differences Additions
Changes in consolidation
scope(2) Reclassification(3) Disposals
Balance at 31 December
2014
Goodwill 11,061 90 0 54 (23) (105) 11,077
Capitalised development costs 2,280 27 225 (16) (5) (4) 2,507
Other intangible assets 2,900 55 195 117 35 (37) 3,265
Total 16,241 172 420 155 7 (146) 16,849
(1) Previous year figures are adjusted due to the application of IFRS 10 and IFRS 11.
(2) Includes intangible assets related to Alestis acquisition (see Note 4 “Acquisitions and disposals”).
(3) Includes intangible assets reclassified to assets of disposal groups classified as held for sale.
Amortisation / Impairment
(In € million)
Balance at 1 January
2014(1)
Exchange differences Additions
Changes in consolidation
scope Reclassification Disposals
Balance at 31 December
2014
Goodwill (1,189) (8) 0 0 0 99 (1,098)
Capitalised development costs (683) (12) (137) 12 (1) 2 (819)
Other intangible assets (1,869) (21) (282) (23) (8) 29 (2,174)
Total (3,741) (41) (419) (11) (9) 130 (4,091)
(1) Previous year figures are adjusted due to the application of IFRS 10 and IFRS 11.
Net Book Value
(In € million)
Balance at 1 January
2014(1)
Balance at 31 December
2014
Goodwill 9,872 9,979
Capitalised development costs 1,597 1,688
Other intangible assets 1,031 1,091
Total 12,500 12,758
(1) Previous year figures are adjusted due to the application of IFRS 10 and IFRS 11.
Back to Contents54321 Q
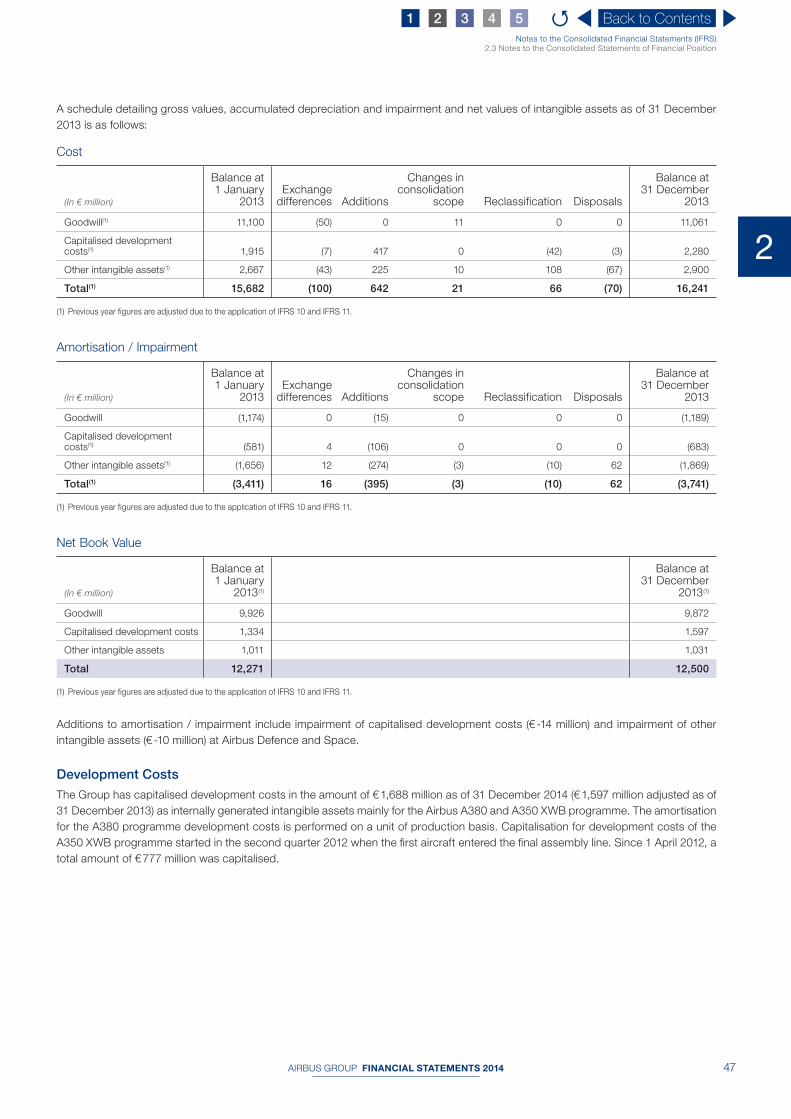
AIRBUS GROUP FINANCIAL STATEMENTS 2014 47
2
Notes to the Consolidated Financial Statements (IFRS)2.3 Notes to the Consolidated Statements of Financial Position
A schedule detailing gross values, accumulated depreciation and impairment and net values of intangible assets as of 31 December
2013 is as follows:
Cost
(In € million)
Balance at 1 January
2013Exchange
differences Additions
Changes in consolidation
scope Reclassification Disposals
Balance at 31 December
2013
Goodwill(1) 11,100 (50) 0 11 0 0 11,061
Capitalised development costs(1) 1,915 (7) 417 0 (42) (3) 2,280
Other intangible assets(1) 2,667 (43) 225 10 108 (67) 2,900
Total(1) 15,682 (100) 642 21 66 (70) 16,241
(1) Previous year figures are adjusted due to the application of IFRS 10 and IFRS 11.
Amortisation / Impairment
(In € million)
Balance at 1 January
2013Exchange
differences Additions
Changes in consolidation
scope Reclassification Disposals
Balance at 31 December
2013
Goodwill (1,174) 0 (15) 0 0 0 (1,189)
Capitalised development costs(1) (581) 4 (106) 0 0 0 (683)
Other intangible assets(1) (1,656) 12 (274) (3) (10) 62 (1,869)
Total(1) (3,411) 16 (395) (3) (10) 62 (3,741)
(1) Previous year figures are adjusted due to the application of IFRS 10 and IFRS 11.
Net Book Value
(In € million)
Balance at 1 January
2013(1)
Balance at 31 December
2013(1)
Goodwill 9,926 9,872
Capitalised development costs 1,334 1,597
Other intangible assets 1,011 1,031
Total 12,271 12,500
(1) Previous year figures are adjusted due to the application of IFRS 10 and IFRS 11.
Additions to amortisation / impairment include impairment of capitalised development costs (€ -14 million) and impairment of other
intangible assets (€ -10 million) at Airbus Defence and Space.
Development Costs
The Group has capitalised development costs in the amount of € 1,688 million as of 31 December 2014 (€ 1,597 million adjusted as of
31 December 2013) as internally generated intangible assets mainly for the Airbus A380 and A350 XWB programme. The amortisation
for the A380 programme development costs is performed on a unit of production basis. Capitalisation for development costs of the
A350 XWB programme started in the second quarter 2012 when the fi rst aircraft entered the fi nal assembly line. Since 1 April 2012, a
total amount of € 777 million was capitalised.
Back to Contents54321 Q

AIRBUS GROUP FINANCIAL STATEMENTS 201448
Notes to the Consolidated Financial Statements (IFRS)2.3 Notes to the Consolidated Statements of Financial Position
Due to the fi rst time application of IFRS 11 and in accordance
with the IFRS 11 transition guidance, Goodwill in the total amount
of € 1,090 million (including € 658 million for MBDA) has been
allocated to Airbus Group joint ventures, that are now accounted
for by using the equity method and is therefore no longer allocated
to Airbus Group CGUs. As part of the re-branding of EADS to
Airbus Group, and the accompanied reorganisation including
the integration of the Group’s defence and space activities in the
beginning of 2014, the business activities and related former CGUs
of former Cassidian, Astrium and Airbus Military were merged into
the CGU of Airbus Defence and Space.
General Assumptions Applied in the Planning
Process
The discounted cash fl ow method has been applied as a primary
valuation approach to determine the value in use of the CGUs.
Generally, cash fl ow projections used for the Group’s impairment
testing are based on operative planning.
The operative planning takes into account general economic data
derived from external macroeconomic and fi nancial studies and
covers a planning horizon of fi ve years. The operative planning
assumptions refl ect for the periods under review specifi c infl ation
rates and future labour expenses in the European countries where
the major production facilities are located. Regarding the expected
future labour expenses, an increase of 2% was implied. In addition,
future interest rates are also projected per geographical market,
for the European Monetary Union, Great Britain and the USA.
The Group follows an active policy of foreign exchange risk hedging.
As of 31 December 2014, the total hedge portfolio with maturities
up to 2022 amounts to US$ 88 billion and covers a major portion
of the foreign exchange exposure expected over the period of the
operative planning (2015 to 2019). The average US$/€ hedge rate
of the US$/€ hedge portfolio until 2022 amounts to 1.33 US$/€ and
for the US$/GBP hedge portfolio until 2020 amounts to 1.59 US$/
GBP. For the determination of the operative planning in the CGUs,
management assumed future exchange rates of 1.35 US$/€ from
2015 onwards to convert in € the portion of future US$ which are
not hedged. Foreign exchange exposure arises mostly from Airbus
and to a lesser extent from the other Airbus Group segments.
The assumption for the perpetuity growth rate used to calculate the
terminal values as of 31 December 2014 has been determined with
1% (previous year: 1%). This assumption is lower than experienced
in past economic cycles in order to refl ect current uncertainty
regarding market developments in the long-term.
The main assumptions and the total of the recoverable amounts
obtained have been compared for reasonableness to market data.
Key assumptions on which management has based its
determination of value in use include amongst others, weighted
average cost of capital pre-tax (WACC) and estimated growth rates
as well as the underlying foreign exchange rates. These estimates,
including the methodology used, can have a material impact on the
respective values and hence are subject to uncertainties.
Airbus
The goodwill allocated to Airbus mainly relates to the creation of
the Group in 2000 and the Airbus Combination in 2001.
The assessment was based on the following key specific
assumptions, which represent management’s current best
assessment as of the date of these Consolidated Financial
Statements:
■ projected cash fl ows for the next fi ve years were presented to
the Group’s Board of Directors in the frame of the operative
plan. This planning scenario takes into account the decision to
ramp-up the production of the A320 programme to 50 a/c per
month in 2017, and to adapt the production rate on the Long
Range-programme at rate to 6 a/c per month in 2016, and to
stabilise A380 production at the current level. In the absence of
long-term fi nancial reference, expected cash fl ows generated
beyond the planning horizon are considered through a terminal
value. The terminal value refl ects management’s assessment of a
normative operating year based on an outlook of a full aeronautic
cycle over the next decade; ■ long-term commercial assumptions are based on General
Market Forecast updated in 2014. The development of market
share per segment considers enlargement of the competition
as per current best assessment. Current market evolutions are
considered through sensitivities; ■ cash fl ows are discounted using a euro weighted WACC of 9.4%
(in 2013: 10.1%); ■ carrying value as well as planned cash fl ows include impacts
from the existing hedge portfolio.
Impairment Tests
The Group performed impairment tests for goodwill and capitalised development costs not yet available for use in the fourth quarter
of the fi nancial year on Cash Generating Unit (“CGU”) level.
As of 31 December 2014 and 2013, goodwill was allocated to CGUs or Group of CGUs, which is summarised in the following schedule
on segment level:
(In € million) AirbusAirbus
HelicoptersAirbus Defence
and Space(1)
Others / HQ / Conso.(1) Consolidated(1)
Goodwill as of 31 December 2014 6,768 310 2,887 14 9,979
Goodwill as of 31 December 2013 6,680 302 2,876 14 9,872
(1) Previous year figures are adjusted due to the application of IFRS 10 and IFRS 11 and the Group’s reorganisation that resulted in the merger of Airbus defence business into Airbus
Defence and Space.
Back to Contents54321 Q
AIRBUS GROUP FINANCIAL STATEMENTS 2014 49
2
Notes to the Consolidated Financial Statements (IFRS)2.3 Notes to the Consolidated Statements of Financial Position
With regard to the assessment of the value in use for the CGU
Airbus, management believes that the likelihood of a change in
the above key assumptions to an extent that would cause the
recoverable amount to fall below the carrying value is remote.
The recoverable amount is particularly sensitive to the following
areas:
■ change of the euro against the US$ (reference scenario at
1.35 US$/€): A change by 10 cents, + or - would not imply an
impairment charge in the Group’s accounts; ■ change of the WACC: An increase of 50 basis points in the WACC
would not imply an impairment charge in the Group accounts.
The current positive difference between the recoverable value and
the carrying value of Airbus’ net assets indicates that the assessed
(negative) impacts of the sum of these sensitivities would not imply
an impairment charge in Group accounts.
Airbus Helicopters
In order to refl ect the different underlying business risks, a segment
specifi c WACC factor has been applied. For Airbus Helicopters
the projected cash fl ows were discounted using a WACC of 9.0%
(in 2013: 9.5%).
The main key achievements in 2014 are the certifi cation and entry-
into-service of new products (EC175, EC145 T2, EC135P3/T3), the
full return to service of EC225, the continuing deliveries of NH90 in
Europe (Sweden, Greece, Italy, Belgium, Finland, Germany), and
of Super Puma throughout the world. Following continued efforts
for globalisation and product renewal, the Division continuously
expects an increasing performance over the next years thanks to
a renewed range planned for entry-into-service, to the ramp-up
of transformation plan setup this year, to the cost effi ciency
improvements on key programmes and to capitalise on the Airbus
Helicopters brand.
Airbus Defence and Space
In order to refl ect the different underlying business risks, a segment
specifi c WACC factor has been applied. Airbus Defence and Space
applied a WACC of 8.7% (in 2013: 8.7% for Cassidian and Airbus
Military and 9.6% for Astrium). Cash fl ow projections are based on
operative planning covering a fi ve-year planning period.
The main key achievements in 2014 are related to order intakes
at Space Systems (Ariane 5PB+, Falcon Eye and several
telecommunications satellites) as well as at Military Aircraft
(International Light & Medium aircraft orders, A400M UK ISS
Contract and Eurofi ghter E-Scan radar). The main deliveries in
2014 were related to A400M ramp-up and continuing Tanker and
Light & Medium deliveries, successful Ariane 5 and further satellites
launches. Based on these achievements, the planning period
is characterised by further order intake in home countries and
export market in key areas such as Tankers, Combat Air systems,
Earth Observation, launchers and Satellite Communications. The
profi tability is assumed to increase over the operating planning
period, leading to improved performance and also cost synergies
(costs reductions).
Back to Contents54321 Q
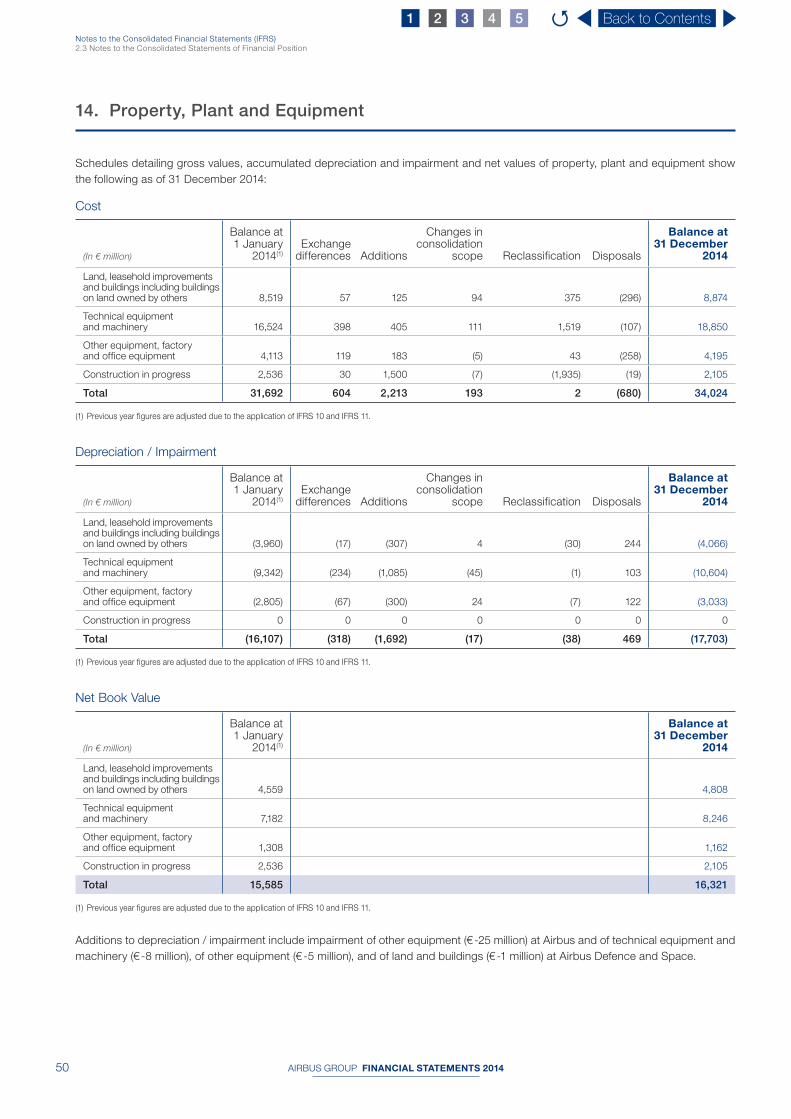
AIRBUS GROUP FINANCIAL STATEMENTS 201450
Notes to the Consolidated Financial Statements (IFRS)2.3 Notes to the Consolidated Statements of Financial Position
14. Property, Plant and Equipment
Schedules detailing gross values, accumulated depreciation and impairment and net values of property, plant and equipment show
the following as of 31 December 2014:
Cost
(In € million)
Balance at 1 January
2014(1)
Exchange differences Additions
Changes in consolidation
scope Reclassification Disposals
Balance at 31 December
2014
Land, leasehold improvements and buildings including buildings on land owned by others 8,519 57 125 94 375 (296) 8,874
Technical equipment and machinery 16,524 398 405 111 1,519 (107) 18,850
Other equipment, factory and office equipment 4,113 119 183 (5) 43 (258) 4,195
Construction in progress 2,536 30 1,500 (7) (1,935) (19) 2,105
Total 31,692 604 2,213 193 2 (680) 34,024
(1) Previous year figures are adjusted due to the application of IFRS 10 and IFRS 11.
Depreciation / Impairment
(In € million)
Balance at 1 January
2014(1)
Exchange differences Additions
Changes in consolidation
scope Reclassification Disposals
Balance at 31 December
2014
Land, leasehold improvements and buildings including buildings on land owned by others (3,960) (17) (307) 4 (30) 244 (4,066)
Technical equipment and machinery (9,342) (234) (1,085) (45) (1) 103 (10,604)
Other equipment, factory and office equipment (2,805) (67) (300) 24 (7) 122 (3,033)
Construction in progress 0 0 0 0 0 0 0
Total (16,107) (318) (1,692) (17) (38) 469 (17,703)
(1) Previous year figures are adjusted due to the application of IFRS 10 and IFRS 11.
Net Book Value
(In € million)
Balance at 1 January
2014(1)
Balance at 31 December
2014
Land, leasehold improvements and buildings including buildings on land owned by others 4,559 4,808
Technical equipment and machinery 7,182 8,246
Other equipment, factory and office equipment 1,308 1,162
Construction in progress 2,536 2,105
Total 15,585 16,321
(1) Previous year figures are adjusted due to the application of IFRS 10 and IFRS 11.
Additions to depreciation / impairment include impairment of other equipment (€ -25 million) at Airbus and of technical equipment and
machinery (€ -8 million), of other equipment (€ -5 million), and of land and buildings (€ -1 million) at Airbus Defence and Space.
Back to Contents54321 Q
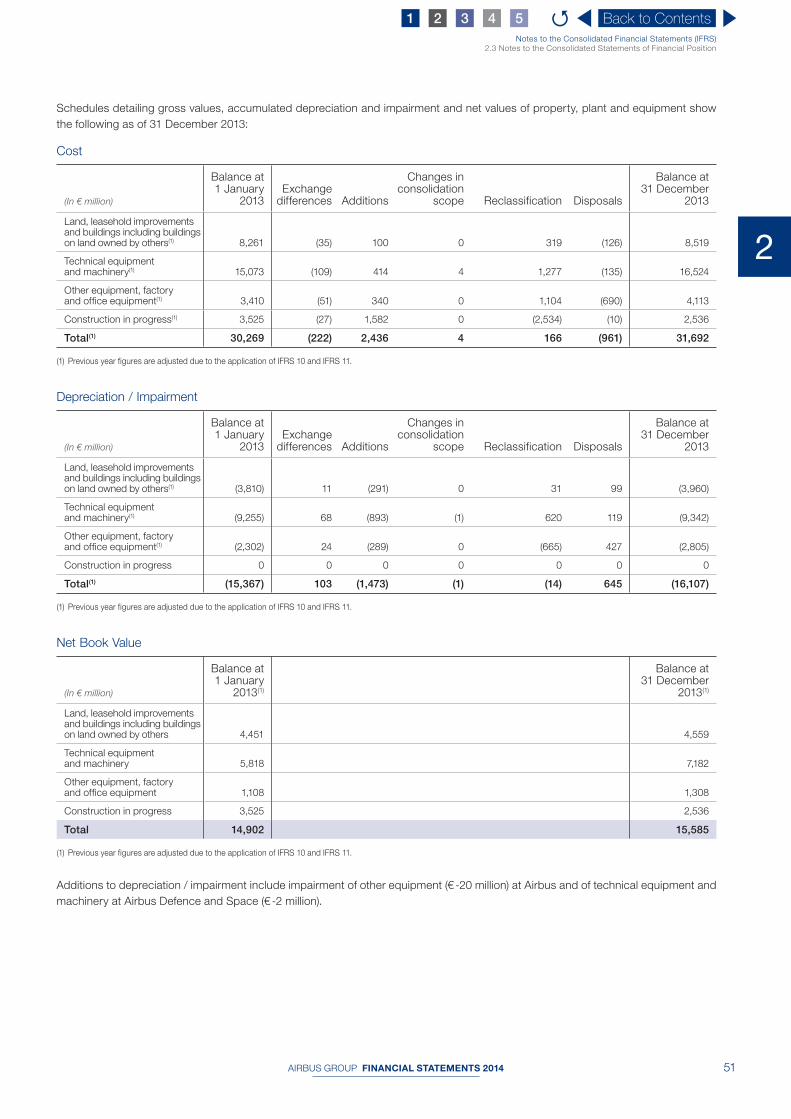
AIRBUS GROUP FINANCIAL STATEMENTS 2014 51
2
Notes to the Consolidated Financial Statements (IFRS)2.3 Notes to the Consolidated Statements of Financial Position
Schedules detailing gross values, accumulated depreciation and impairment and net values of property, plant and equipment show
the following as of 31 December 2013:
Cost
(In € million)
Balance at 1 January
2013Exchange
differences Additions
Changes in consolidation
scope Reclassification Disposals
Balance at 31 December
2013
Land, leasehold improvements and buildings including buildings on land owned by others(1) 8,261 (35) 100 0 319 (126) 8,519
Technical equipment and machinery(1) 15,073 (109) 414 4 1,277 (135) 16,524
Other equipment, factory and office equipment(1) 3,410 (51) 340 0 1,104 (690) 4,113
Construction in progress(1) 3,525 (27) 1,582 0 (2,534) (10) 2,536
Total(1) 30,269 (222) 2,436 4 166 (961) 31,692
(1) Previous year figures are adjusted due to the application of IFRS 10 and IFRS 11.
Depreciation / Impairment
(In € million)
Balance at 1 January
2013Exchange
differences Additions
Changes in consolidation
scope Reclassification Disposals
Balance at 31 December
2013
Land, leasehold improvements and buildings including buildings on land owned by others(1) (3,810) 11 (291) 0 31 99 (3,960)
Technical equipment and machinery(1) (9,255) 68 (893) (1) 620 119 (9,342)
Other equipment, factory and office equipment(1) (2,302) 24 (289) 0 (665) 427 (2,805)
Construction in progress 0 0 0 0 0 0 0
Total(1) (15,367) 103 (1,473) (1) (14) 645 (16,107)
(1) Previous year figures are adjusted due to the application of IFRS 10 and IFRS 11.
Net Book Value
(In € million)
Balance at 1 January
2013(1)
Balance at 31 December
2013(1)
Land, leasehold improvements and buildings including buildings on land owned by others 4,451 4,559
Technical equipment and machinery 5,818 7,182
Other equipment, factory and office equipment 1,108 1,308
Construction in progress 3,525 2,536
Total 14,902 15,585
(1) Previous year figures are adjusted due to the application of IFRS 10 and IFRS 11.
Additions to depreciation / impairment include impairment of other equipment (€ -20 million) at Airbus and of technical equipment and
machinery at Airbus Defence and Space (€ -2 million).
Back to Contents54321 Q
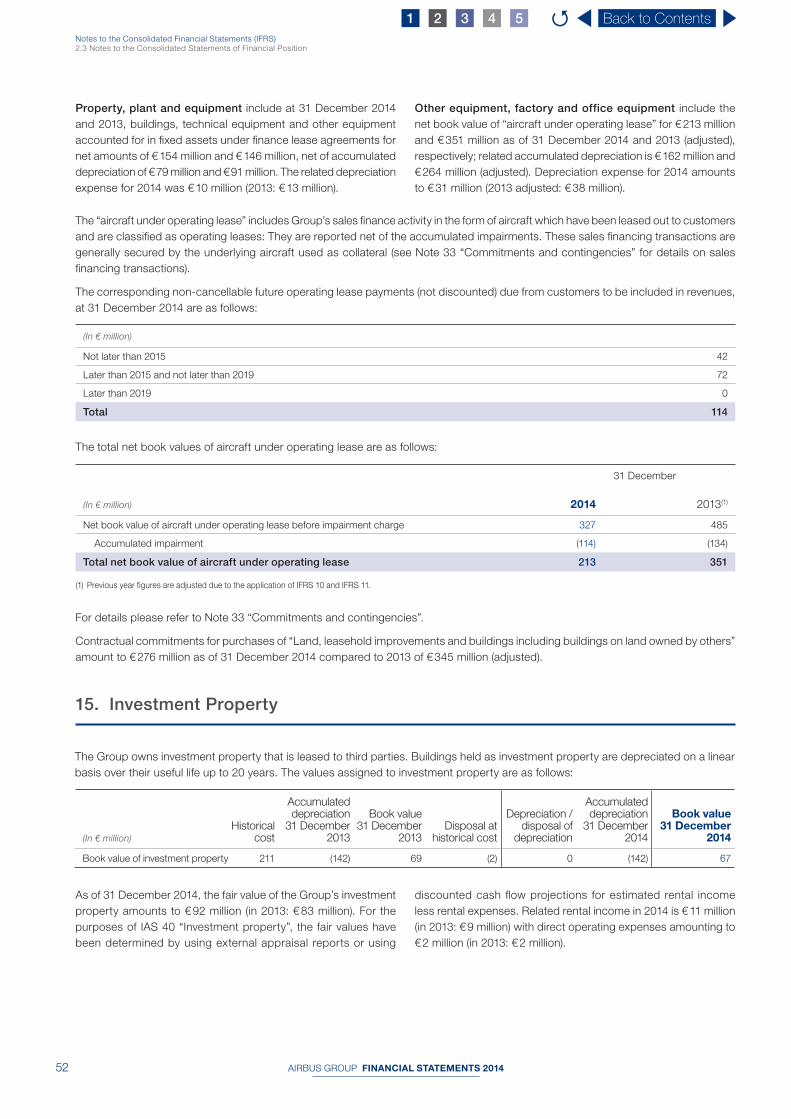
AIRBUS GROUP FINANCIAL STATEMENTS 201452
Notes to the Consolidated Financial Statements (IFRS)2.3 Notes to the Consolidated Statements of Financial Position
Property, plant and equipment include at 31 December 2014
and 2013, buildings, technical equipment and other equipment
accounted for in fi xed assets under fi nance lease agreements for
net amounts of € 154 million and € 146 million, net of accumulated
depreciation of € 79 million and € 91 million. The related depreciation
expense for 2014 was € 10 million (2013: € 13 million).
Other equipment, factory and office equipment include the
net book value of “aircraft under operating lease” for € 213 million
and € 351 million as of 31 December 2014 and 2013 (adjusted),
respectively; related accumulated depreciation is € 162 million and
€ 264 million (adjusted). Depreciation expense for 2014 amounts
to € 31 million (2013 adjusted: € 38 million).
The “aircraft under operating lease” includes Group’s sales fi nance activity in the form of aircraft which have been leased out to customers
and are classifi ed as operating leases: They are reported net of the accumulated impairments. These sales fi nancing transactions are
generally secured by the underlying aircraft used as collateral (see Note 33 “Commitments and contingencies” for details on sales
fi nancing transactions).
The corresponding non-cancellable future operating lease payments (not discounted) due from customers to be included in revenues,
at 31 December 2014 are as follows:
(In € million)
Not later than 2015 42
Later than 2015 and not later than 2019 72
Later than 2019 0
Total 114
The total net book values of aircraft under operating lease are as follows:
31 December
(In € million) 2014 2013(1)
Net book value of aircraft under operating lease before impairment charge 327 485
Accumulated impairment (114) (134)
Total net book value of aircraft under operating lease 213 351
(1) Previous year figures are adjusted due to the application of IFRS 10 and IFRS 11.
For details please refer to Note 33 “Commitments and contingencies”.
Contractual commitments for purchases of “Land, leasehold improvements and buildings including buildings on land owned by others”
amount to € 276 million as of 31 December 2014 compared to 2013 of € 345 million (adjusted).
15. Investment Property
As of 31 December 2014, the fair value of the Group’s investment
property amounts to € 92 million (in 2013: € 83 million). For the
purposes of IAS 40 “Investment property”, the fair values have
been determined by using external appraisal reports or using
discounted cash fl ow projections for estimated rental income
less rental expenses. Related rental income in 2014 is € 11 million
(in 2013: € 9 million) with direct operating expenses amounting to
€ 2 million (in 2013: € 2 million).
The Group owns investment property that is leased to third parties. Buildings held as investment property are depreciated on a linear
basis over their useful life up to 20 years. The values assigned to investment property are as follows:
(In € million)
Historical cost
Accumulated depreciation
31 December 2013
Book value 31 December
2013Disposal at
historical cost
Depreciation / disposal of
depreciation
Accumulated depreciation
31 December 2014
Book value 31 December
2014
Book value of investment property 211 (142) 69 (2) 0 (142) 67
Back to Contents54321 Q

AIRBUS GROUP FINANCIAL STATEMENTS 2014 53
2
Notes to the Consolidated Financial Statements (IFRS)2.3 Notes to the Consolidated Statements of Financial Position
16. Investments Accounted for Under the Equity Method
The following table sets forth the composition of investments in associates and joint ventures accounted for under the equity method:
31 December
(In € million) 2014 2013(1)
Investments in associates 2,506 2,894
Investments in joint ventures 885 964
Investments accounted for under the equity method 3,391 3,858
(1) Previous year figures are adjusted due to the application of IFRS 10 and IFRS 11.
The following table shows the composition of the related share of profi t from investments accounted for under the equity method:
(In € million) 2014 2013(1)
Share of profit from investments in associates 721 295
Share of profit from investments in joint ventures 119 139
Share of profit from investments accounted for under the equity method 840 434
(1) Previous year figures are adjusted due to the application of IFRS 10 and IFRS 11.
The share of profi t from investments in associates includes a gain of € 343 million from the partial sale of shares of Dassault Aviation
and a gain of € 47 million from the disposal of shares of Patria (for more details, please see Note 4 “Acquisitions and disposals”).
A list of major investments in associates and joint ventures and the proportion of ownership is included in Appendix “Information on
principal investments”.
a) Investments in Associates
The Group’s only individually material investment in associates is
Dassault Aviation (42.11% and 46.32% at 31 December 2014 and
2013) of € 2,429 million and € 2,747 million (for the disposal of a part
of this investment in 2014, see Note 4 “Acquisitions and disposals”).
Dassault Aviation, Paris (France) is active in the market for military
jet aircraft and business jets. The Group’s 42.11% interest in
Dassault Aviation’s market capitalisation (2013: 46.32%), derived
from an observable free fl oat of 3.5%, amounts to € 4,124 million
as of 31 December 2014 (as of 31 December 2013: € 4,352 million).
The most recent available financial information of Dassault
Aviation is the published consolidated IFRS fi nancial statements
as of 30 June 2014 (as of 31 December 2013: the published
consolidated IFRS fi nancial statements as of 30 June 2013). As
there is no published Dassault Aviation fi nancial information for
the second half-year 2014 at the date of authorisation for issue
of the Airbus Group 2014 fi nancial statements, best estimates
have been used based on the available Dassault Aviation fi nancial
information as of 31 December 2014. Thus, adjustments for the
effects of signifi cant transactions or events that occurred between
the 1 July 2014 and the 31 December 2014 are included. The
equity investment in Dassault Aviation includes IFRS catch-up
adjustments for income and other comprehensive income for
prior periods.
Back to Contents54321 Q

AIRBUS GROUP FINANCIAL STATEMENTS 201454
Notes to the Consolidated Financial Statements (IFRS)2.3 Notes to the Consolidated Statements of Financial Position
The following table refl ects summarised fi nancial information of Dassault Aviation, based on its most recent published Consolidated
Financial Statements in accordance with IFRS:
(In € million) 2014 2013
Revenues 1,514 4,593
Profit for the period 220 459
Other comprehensive income (62) (31)
Total comprehensive income (100%) 158 428
Non-current assets 5,262 5,457
Current assets 4,816 4,611
Non-current liabilities 201 205
Current liabilities 4,699 4,751
Total equity (100%) 5,178 5,112
The development of the investment is as follows:
(In € million) 2014 2013
Group’s interest in equity on investee at beginning of the year 2,747 2,519
Profit from continuing operations attributable to the Group(1) 255 247
Other comprehensive income attributable to the Group(1) (29) 25
Dividends received during the year (42) (44)
Disposal of shares(2) (502) 0
Carrying amount of the investment at 31 December 2,429 2,747
(1) Includes adjustments and estimates as defined above.
(2) For more details on the partial sale of Dassault Aviation shares, please see Note 4 “Acquisitions and disposals”.
Furthermore, the Group has interests in a number of individually immaterial associates, being accounted for under the equity method.
They are stated in aggregate in the following table:
(In € million) 2014 2013
Group’s interest in equity on investee at beginning of the year 147 135
Profit from continuing operations attributable to the Group 76 48
Other comprehensive income attributable to the Group (35) (28)
Dividends received during the year (20) (8)
Disposal of shares(1) (91) 0
Carrying amount of the investment at 31 December 77 147
(1) For more details, please see Note 4 “Acquisitions and disposals”.
The cumulative unrecognised comprehensive loss amounts to € -147 million and € -55 million as of 31 December 2014 and 2013,
respectively (thereof € -92 million for the period).
b) Investments in Joint Ventures
The joint ventures in which the Group holds interests are structured
in separate incorporated companies. Under the joint arrangement
agreements, unanimous consent is required from all parties to the
agreement for all relevant activities. The Group and its partners
have rights to the net assets of the Company through the terms
of the contractual agreements.
The Group’s material joint ventures are MBDA S.A.S., Paris (France)
and Atlas Elektronik GmbH (“Atlas”), Bremen (Germany) as parent
companies of their respective groups. Both groups are not publicly
listed.
The Group holds a 37.5% stake in MBDA at 31 December 2014 and
2013, which is a joint venture between the Group, BAE Systems
and Finmeccanica. MBDA offers missile systems capabilities that
cover the whole range of solutions for air dominance, ground-
based air defence and maritime superiority, as well as advanced
technological solutions for battlefi eld engagement.
Atlas is a joint venture of Thyssen Krupp and the Group (49%
at 31 December 2014 and 2013). It provides maritime and naval
solutions above and below the ocean surface and holds a leading
position in all fi elds of maritime high technology from command
and control systems to coastal surveillance systems and in in-
house support.
The carrying amount and the respective results of both, MBDA and
Atlas, are reported in the Defence and Space segment.
Back to Contents54321 Q
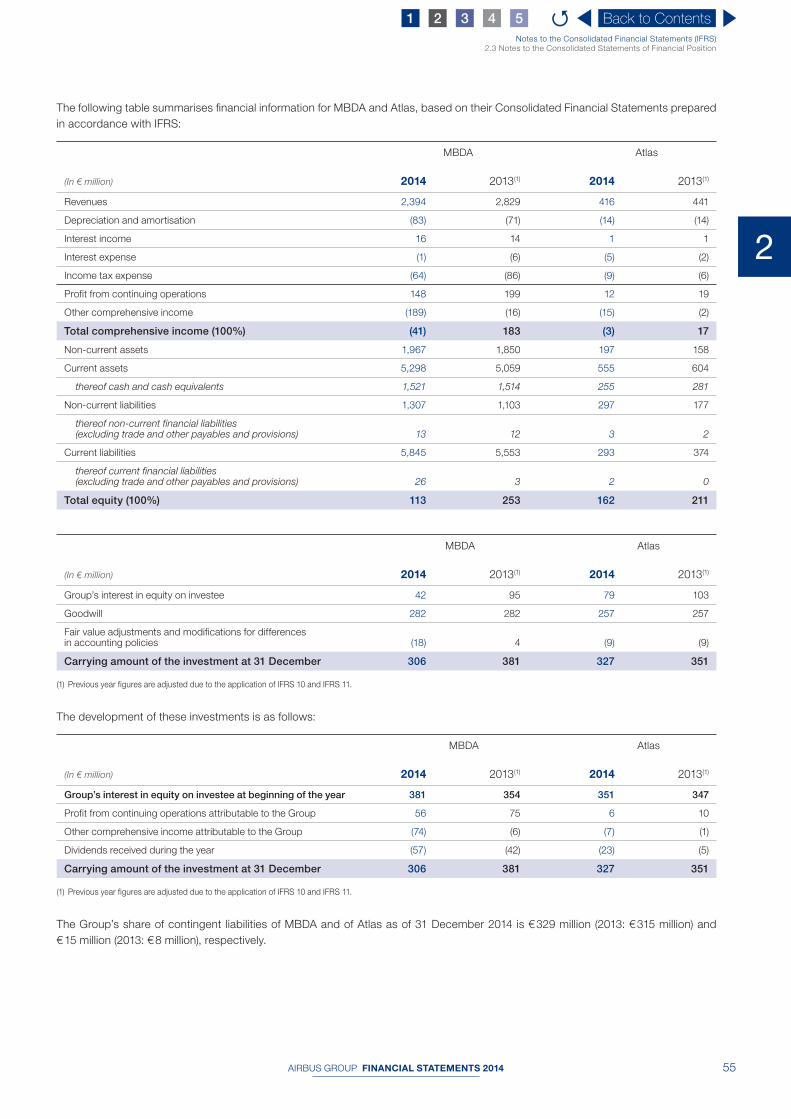
AIRBUS GROUP FINANCIAL STATEMENTS 2014 55
2
Notes to the Consolidated Financial Statements (IFRS)2.3 Notes to the Consolidated Statements of Financial Position
The following table summarises fi nancial information for MBDA and Atlas, based on their Consolidated Financial Statements prepared
in accordance with IFRS:
MBDA Atlas
(In € million) 2014 2013(1) 2014 2013(1)
Revenues 2,394 2,829 416 441
Depreciation and amortisation (83) (71) (14) (14)
Interest income 16 14 1 1
Interest expense (1) (6) (5) (2)
Income tax expense (64) (86) (9) (6)
Profit from continuing operations 148 199 12 19
Other comprehensive income (189) (16) (15) (2)
Total comprehensive income (100%) (41) 183 (3) 17
Non-current assets 1,967 1,850 197 158
Current assets 5,298 5,059 555 604
thereof cash and cash equivalents 1,521 1,514 255 281
Non-current liabilities 1,307 1,103 297 177
thereof non-current financial liabilities (excluding trade and other payables and provisions) 13 12 3 2
Current liabilities 5,845 5,553 293 374
thereof current financial liabilities (excluding trade and other payables and provisions) 26 3 2 0
Total equity (100%) 113 253 162 211
MBDA Atlas
(In € million) 2014 2013(1) 2014 2013(1)
Group’s interest in equity on investee 42 95 79 103
Goodwill 282 282 257 257
Fair value adjustments and modifications for differences in accounting policies (18) 4 (9) (9)
Carrying amount of the investment at 31 December 306 381 327 351
(1) Previous year figures are adjusted due to the application of IFRS 10 and IFRS 11.
The development of these investments is as follows:
MBDA Atlas
(In € million) 2014 2013(1) 2014 2013(1)
Group’s interest in equity on investee at beginning of the year 381 354 351 347
Profit from continuing operations attributable to the Group 56 75 6 10
Other comprehensive income attributable to the Group (74) (6) (7) (1)
Dividends received during the year (57) (42) (23) (5)
Carrying amount of the investment at 31 December 306 381 327 351
(1) Previous year figures are adjusted due to the application of IFRS 10 and IFRS 11.
The Group’s share of contingent liabilities of MBDA and of Atlas as of 31 December 2014 is € 329 million (2013: € 315 million) and
€ 15 million (2013: € 8 million), respectively.
Back to Contents54321 Q

AIRBUS GROUP FINANCIAL STATEMENTS 201456
Notes to the Consolidated Financial Statements (IFRS)2.3 Notes to the Consolidated Statements of Financial Position
Furthermore, the Group has interests in a number of individually immaterial joint ventures, being accounted for under the equity method.
They are stated in aggregate in the following table:
(In € million) 2014 2013(1)
Group’s interest in equity on investee at beginning of the year 232 229
Profit from continuing operations attributable to the Group 57 54
Other comprehensive income attributable to the Group 16 (5)
Dividends received during the year (53) (48)
FX impact 0 2
Carrying amount of the investment at 31 December 252 232
(1) Previous year figures are adjusted due to the application of IFRS 10 and IFRS 11.
The Group’s share of contingent liabilities of its joint ventures as of 31 December 2014 amounts to € 2 million (2013: € 6 million).
17. Other Investments and Other Long-Term Financial Assets
The following table sets forth the composition of other investments and other long-term fi nancial assets:
31 December
(In € million) 2014 2013(1)
Non-current other investments and other long-term financial assets
Other investments 617 607
Other long-term financial assets 1,152 1,149
Total non-current other investments and other long-term financial assets 1,769 1,756
Current portion of other long-term financial assets 167 132
(1) Previous year figures are adjusted due to the application of IFRS 10 and IFRS 11.
Other investments mainly comprise the Group’s participations,
the most signifi cant being at 31 December 2014 the participations
in CARMAT SAS (Group share: 24.2%, 2013: 27.3%) amounting to
€ 68 million (2013: € 136 million) and AviChina (Group share: 5.0%)
amounting to € 140 million (2013: € 116 million).
As of 31 December 2014, other income from investments
amounts to € 55 million (€ 49 million adjusted as of 31 December
2013).
Other long-term financial assets of € 1,152 million (2013 adjusted:
€ 1,149 million) and the current portion of other long-term
financial assets of € 167 million (2013 adjusted: € 132 million)
encompass other loans in the amount of € 876 million and
€ 767 million (adjusted) as of 31 December 2014 and 2013, and
the Group’s sales fi nance activities in the form of fi nance lease
receivables and loans from aircraft fi nancing. They are reported net
of accumulated impairments. These sales fi nancing transactions
are generally secured by the underlying aircraft used as collateral
(see Note 33 “Commitments and contingencies” for details on
sales fi nancing transactions).
Loans from aircraft fi nancing are provided to customers to fi nance
the sale of aircraft. These loans are long-term and normally have a
maturity which is linked to the use of the aircraft by the customer.
The calculation of the net book value is:
31 December
(In € million) 2014 2013(1)
Outstanding gross amount of loans to customers 605 478
Accumulated impairment (179) (156)
Total net book value of loans 426 322
(1) Previous year figures are adjusted due to the application of IFRS 10 and IFRS 11.
Back to Contents54321 Q

AIRBUS GROUP FINANCIAL STATEMENTS 2014 57
2
Notes to the Consolidated Financial Statements (IFRS)2.3 Notes to the Consolidated Statements of Financial Position
18. Inventories
Inventories at 31 December 2014 and 2013 consist of the following:
31 December
(In € million) 2014 2013(1)
Raw materials and manufacturing supplies 2,717 2,575
Work in progress 17,255 16,070
Finished goods and parts for resale 2,196 2,049
Advance payments to suppliers 3,187 3,329
Total 25,355 24,023
(1) Previous year figures are adjusted due to the application of IFRS 10 and IFRS 11.
The increase in work in progress of € +1,185 million is mainly driven
by Airbus programmes, partly offset by Airbus Helicopters and
Airbus Defence and Space programmes. Raw materials were
built-up at Airbus and at Airbus Defence and Space. Finished
goods and parts for resale increased at Airbus.
The fi nished goods and parts for resale before write down to
net realisable value amount to € 2,964 million in 2014 (2013
adjusted: € 2,733 million) and work in progress before write
down to net realisable value amounts to € 21,667 million (2013
adjusted: € 19,032 million). Write downs for inventories are
recorded when it becomes probable that total estimated contract
costs will exceed total contract revenues. In 2014, write downs
of inventories in the amount of € -501 million (2013 adjusted:
€ -374 million) are recognised in cost of sales, whereas reversal of
write downs amounts to € 160 million (2013 adjusted: € 62 million).
At 31 December 2014 € 5,563 million of work in progress and
€ 1,706 million of fi nished goods and parts for resale were carried
at net realisable value.
Finance lease receivables from aircraft fi nancing are as follows:
31 December
(In € million) 2014 2013(1)
Minimum lease payments receivables 21 212
Unearned finance income (4) (17)
Accumulated impairment 0 (3)
Total net book value of finance lease receivables 17 192
(1) Previous year figures are adjusted due to the application of IFRS 10 and IFRS 11.
Future minimum lease payments from investments in fi nance leases to be received are as follows (not discounted):
(In € million)
not later than 2015 3
later than 2015 and not later than 2019 12
later than 2019 6
Total 21
Back to Contents54321 Q
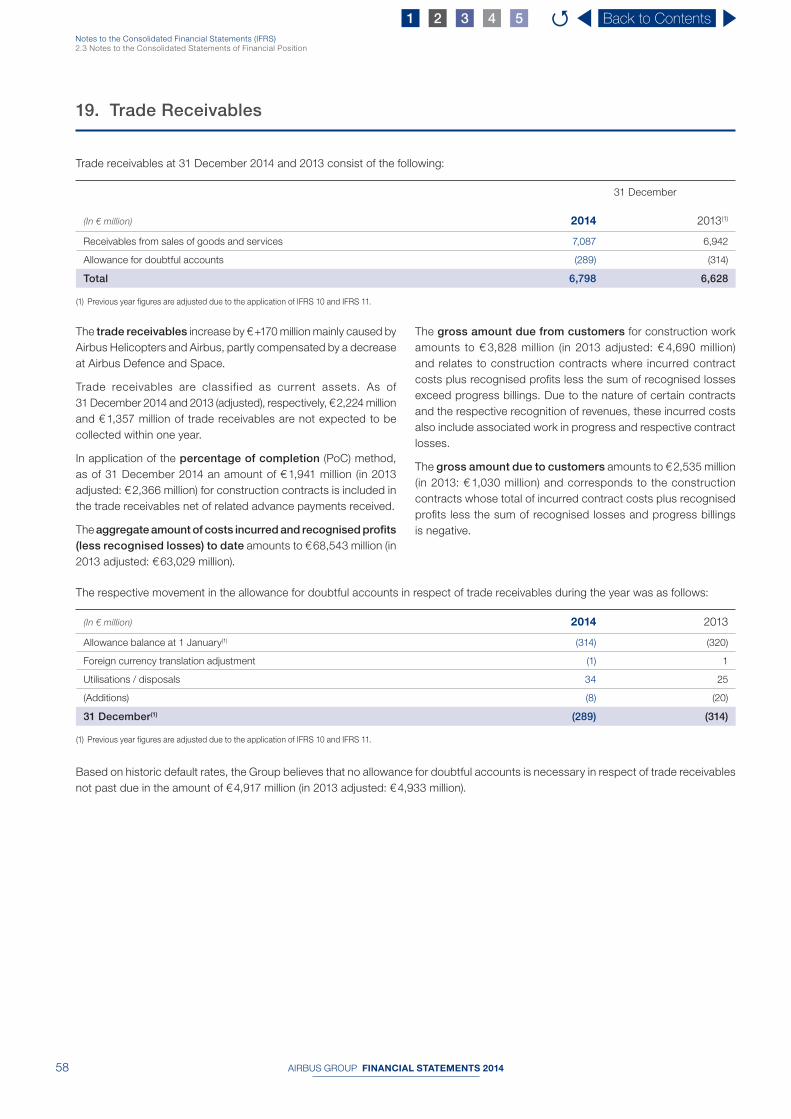
AIRBUS GROUP FINANCIAL STATEMENTS 201458
Notes to the Consolidated Financial Statements (IFRS)2.3 Notes to the Consolidated Statements of Financial Position
19. Trade Receivables
Trade receivables at 31 December 2014 and 2013 consist of the following:
31 December
(In € million) 2014 2013(1)
Receivables from sales of goods and services 7,087 6,942
Allowance for doubtful accounts (289) (314)
Total 6,798 6,628
(1) Previous year figures are adjusted due to the application of IFRS 10 and IFRS 11.
The trade receivables increase by € +170 million mainly caused by
Airbus Helicopters and Airbus, partly compensated by a decrease
at Airbus Defence and Space.
Trade receivables are classified as current assets. As of
31 December 2014 and 2013 (adjusted), respectively, € 2,224 million
and € 1,357 million of trade receivables are not expected to be
collected within one year.
In application of the percentage of completion (PoC) method,
as of 31 December 2014 an amount of € 1,941 million (in 2013
adjusted: € 2,366 million) for construction contracts is included in
the trade receivables net of related advance payments received.
The aggregate amount of costs incurred and recognised profits
(less recognised losses) to date amounts to € 68,543 million (in
2013 adjusted: € 63,029 million).
The gross amount due from customers for construction work
amounts to € 3,828 million (in 2013 adjusted: € 4,690 million)
and relates to construction contracts where incurred contract
costs plus recognised profi ts less the sum of recognised losses
exceed progress billings. Due to the nature of certain contracts
and the respective recognition of revenues, these incurred costs
also include associated work in progress and respective contract
losses.
The gross amount due to customers amounts to € 2,535 million
(in 2013: € 1,030 million) and corresponds to the construction
contracts whose total of incurred contract costs plus recognised
profi ts less the sum of recognised losses and progress billings
is negative.
The respective movement in the allowance for doubtful accounts in respect of trade receivables during the year was as follows:
(In € million) 2014 2013
Allowance balance at 1 January(1) (314) (320)
Foreign currency translation adjustment (1) 1
Utilisations / disposals 34 25
(Additions) (8) (20)
31 December(1) (289) (314)
(1) Previous year figures are adjusted due to the application of IFRS 10 and IFRS 11.
Based on historic default rates, the Group believes that no allowance for doubtful accounts is necessary in respect of trade receivables
not past due in the amount of € 4,917 million (in 2013 adjusted: € 4,933 million).
Back to Contents54321 Q

AIRBUS GROUP FINANCIAL STATEMENTS 2014 59
2
Notes to the Consolidated Financial Statements (IFRS)2.3 Notes to the Consolidated Statements of Financial Position
20. Other Financial Assets
Other fi nancial assets at 31 December 2014 and 2013 consist of the following:
31 December
(In € million) 2014 2013
Non-current other financial assets
Positive fair values of derivative financial instruments 502 1,993
Others 84 83
Total 586 2,076
Current other financial assets
Positive fair values of derivative financial instruments(1) 208 716
Receivables from related companies(1) 582 593
Loans 28 2
Others 346 280
Total(1) 1,164 1,591
(1) Previous year figures are adjusted due to the application of IFRS 10 and IFRS 11.
21. Other Assets
Other assets at 31 December 2014 and 2013 consist of the following:
31 December
(In € million) 2014 2013
Non-current other assets
Prepaid expenses 1,603 1,480
Others(1) 219 171
Total(1) 1,822 1,651
Current other assets
Value added tax claims(1) 1,371 1,082
Prepaid expenses(1) 487 429
Others(1) 531 449
Total(1) 2,389 1,960
(1) Previous year figures are adjusted due to the application of IFRS 10 and IFRS 11.
Back to Contents54321 Q

AIRBUS GROUP FINANCIAL STATEMENTS 201460
Notes to the Consolidated Financial Statements (IFRS)2.3 Notes to the Consolidated Statements of Financial Position
22. Securities
The Group’s security portfolio amounts to € 9,172 million and
€ 6,883 million (adjusted) as of 31 December 2014 and 2013,
respectively. The security portfolio contains a non-current portion
of available-for-sale-securities of € 5,985 million (in 2013 adjusted:
€ 4,294 million) and securities designated at fair value through profi t
and loss of € 4 million (in 2013: € 4 million) as well as a current
portion of available-for-sale-securities of € 3,183 million (in 2013
adjusted: € 2,585 million).
Included in the securities portfolio as of 31 December 2014
and 2013, respectively, are corporate and government bonds
bearing either fi xed rate coupons (€ 8,666 million nominal value;
comparably in 2013: € 6,374 million) or fl oating rate coupons
(€ 250 million nominal value; comparably in 2013: € 387 million)
and foreign currency Funds of Hedge Funds (€ 8 million nominal
value; 2013: € 8 million).
When the Group enters into securities lending activities, the
securities pledged as collateral continue to be recognised on the
balance sheet. The carrying amount of such securities pledged
as of 31 December 2014, including accrued coupon interest, was
€ 0 million (2013: € 613 million).
23. Total Equity
a) Equity Attributable to Equity Ow ners of the Parent
The following table shows the development of the number of shares outstanding:
(In number of shares) 2014 2013
Issued as at 1 January 783,157,635 827,367,945
Issued for ESOP 0 2,113,245
Issued for exercised options 1,871,419 6,873,677
Cancelled (248,469) (53,197,232)
Issued as at 31 December 784,780,585 783,157,635
Treasury shares as at 31 December (431,832) (2,835,121)
Outstanding as at 31 December 784,348,753 780,322,514
Airbus Group’s shares are exclusively ordinary shares with
a par value of € 1.00. The authorised share capital consists of
3,000,000,000 shares.
On 27 May 2014, the Shareholders’ General Meeting of Airbus
Group delegated the authorisation to the Board of Directors to
issue shares and to grant rights to subscribe for shares in the
Company’s share capital for the purpose of employee share
ownership plans and share related Long-Term Incentive Plans
(such as stock option, performance and restricted share plans),
provided that such powers shall be limited to an aggregate of 0.2%
of the Company’s authorised capital from time to time and to limit or
exclude preferential subscription rights, in both cases for a period
expiring at the Annual General Meeting to be held in 2015. The
mentioned powers include the granting of rights to subscribe for
shares which can be exercised at such time as may be specifi ed
in or pursuant to such plans and the issue of shares to be paid up
from freely distributable reserves. However, such powers shall not
extend to issuing shares or granting rights to subscribe for shares
(i) if there is no preferential subscription right (by virtue of Dutch
law, or because it has been excluded by means of a resolution
of the competent corporate body) and (ii) for an aggregate issue
price in excess of € 500 million per share issuance.
Furthermore, the Shareholders’ General Meeting authorised the
Board of Directors to issue shares and to grant rights to subscribe
for shares in the Company’s share capital for the purpose of
funding the Company and its Group companies, provided that
such powers shall be limited to an aggregate of 0.3% of the
Company’s authorised capital from time to time and to limit or
exclude preferential subscription rights, in both cases for a period
expiring at the Annual General Meeting to be held in 2015. The
mentioned powers include the issue of fi nancial instruments,
including but not limited to convertible bonds, which instruments
may grant the holders thereof rights to acquire shares in the capital
of the Company, exercisable at such time as may be determined
by the fi nancial instrument, and the issue of shares to be paid up
from freely distributable reserves. However, such powers shall not
extend to issuing shares or granting rights to subscribe for shares
(i) if there is no preferential subscription right (by virtue of Dutch
law, or because it has been excluded by means of a resolution
of the competent corporate body) and (ii) for an aggregate issue
price in excess of € 500 million per share issuance.
The Shareholders’ General Meeting on 27 May 2014 renewed
the authorisation given to the Board of Directors for a new period
of 18 months from the date of the Annual General Meeting to
repurchase shares of the Company, by any means, including
derivative products, on any stock exchange or otherwise, as long
Back to Contents54321 Q
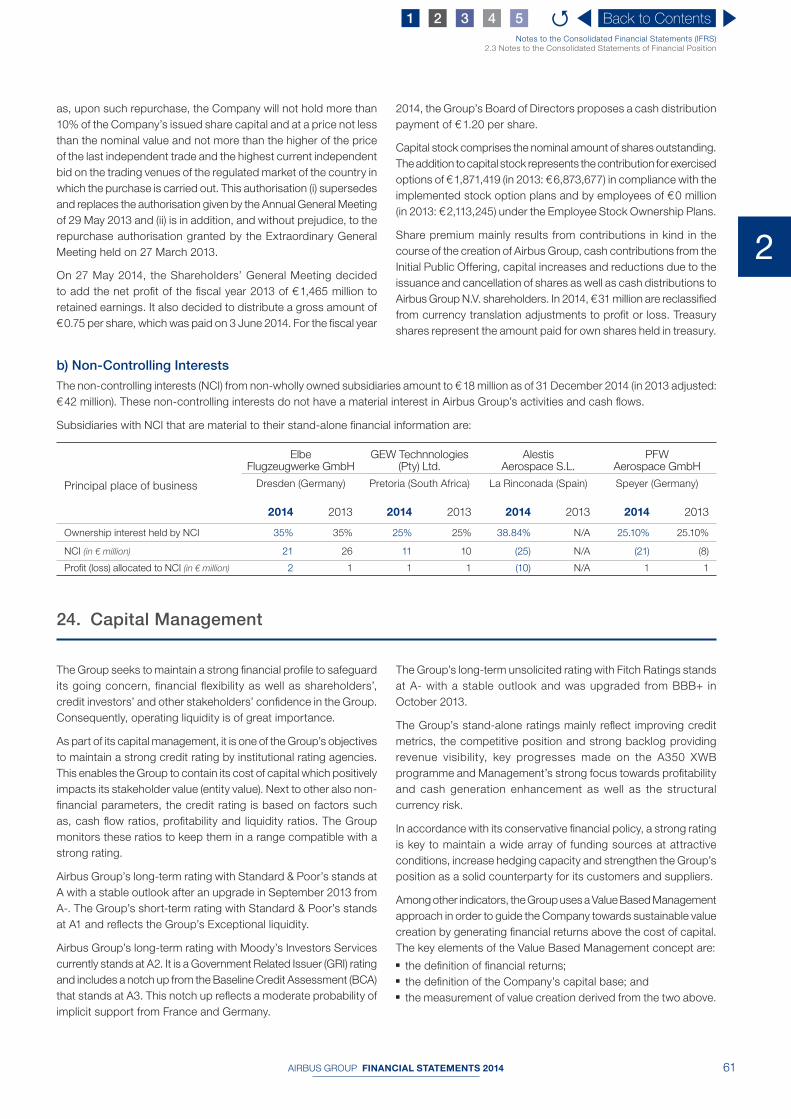
AIRBUS GROUP FINANCIAL STATEMENTS 2014 61
2
Notes to the Consolidated Financial Statements (IFRS)2.3 Notes to the Consolidated Statements of Financial Position
as, upon such repurchase, the Company will not hold more than
10% of the Company’s issued share capital and at a price not less
than the nominal value and not more than the higher of the price
of the last independent trade and the highest current independent
bid on the trading venues of the regulated market of the country in
which the purchase is carried out. This authorisation (i) supersedes
and replaces the authorisation given by the Annual General Meeting
of 29 May 2013 and (ii) is in addition, and without prejudice, to the
repurchase authorisation granted by the Extraordinary General
Meeting held on 27 March 2013.
On 27 May 2014, the Shareholders’ General Meeting decided
to add the net profi t of the fi scal year 2013 of € 1,465 million to
retained earnings. It also decided to distribute a gross amount of
€ 0.75 per share, which was paid on 3 June 2014. For the fi scal year
2014, the Group’s Board of Directors proposes a cash distribution
payment of € 1.20 per share.
Capital stock comprises the nominal amount of shares outstanding.
The addition to capital stock represents the contribution for exercised
options of € 1,871,419 (in 2013: € 6,873,677) in compliance with the
implemented stock option plans and by employees of € 0 million
(in 2013: € 2,113,245) under the Employee Stock Ownership Plans.
Share premium mainly results from contributions in kind in the
course of the creation of Airbus Group, cash contributions from the
Initial Public Offering, capital increases and reductions due to the
issuance and cancellation of shares as well as cash distributions to
Airbus Group N.V. shareholders. In 2014, € 31 million are reclassifi ed
from currency translation adjustments to profi t or loss. Treasury
shares represent the amount paid for own shares held in treasury.
24. Capital Management
The Group seeks to maintain a strong fi nancial profi le to safeguard
its going concern, fi nancial fl exibility as well as shareholders’,
credit investors’ and other stakeholders’ confi dence in the Group.
Consequently, operating liquidity is of great importance.
As part of its capital management, it is one of the Group’s objectives
to maintain a strong credit rating by institutional rating agencies.
This enables the Group to contain its cost of capital which positively
impacts its stakeholder value (entity value). Next to other also non-
fi nancial parameters, the credit rating is based on factors such
as, cash fl ow ratios, profi tability and liquidity ratios. The Group
monitors these ratios to keep them in a range compatible with a
strong rating.
Airbus Group’s long-term rating with Standard & Poor’s stands at
A with a stable outlook after an upgrade in September 2013 from
A-. The Group’s short-term rating with Standard & Poor’s stands
at A1 and refl ects the Group’s Exceptional liquidity.
Airbus Group’s long-term rating with Moody’s Investors Services
currently stands at A2. It is a Government Related Issuer (GRI) rating
and includes a notch up from the Baseline Credit Assessment (BCA)
that stands at A3. This notch up refl ects a moderate probability of
implicit support from France and Germany.
The Group’s long-term unsolicited rating with Fitch Ratings stands
at A- with a stable outlook and was upgraded from BBB+ in
October 2013.
The Group’s stand-alone ratings mainly refl ect improving credit
metrics, the competitive position and strong backlog providing
revenue visibility, key progresses made on the A350 XWB
programme and Management’s strong focus towards profi tability
and cash generation enhancement as well as the structural
currency risk.
In accordance with its conservative fi nancial policy, a strong rating
is key to maintain a wide array of funding sources at attractive
conditions, increase hedging capacity and strengthen the Group’s
position as a solid counterparty for its customers and suppliers.
Among other indicators, the Group uses a Value Based Management
approach in order to guide the Company towards sustainable value
creation by generating fi nancial returns above the cost of capital.
The key elements of the Value Based Management concept are:
■ the defi nition of fi nancial returns; ■ the defi nition of the Company’s capital base; and ■ the measurement of value creation derived from the two above.
b) Non-Controlling Interests
The non-controlling interests (NCI) from non-wholly owned subsidiaries amount to € 18 million as of 31 December 2014 (in 2013 adjusted:
€ 42 million). These non-controlling interests do not have a material interest in Airbus Group’s activities and cash fl ows.
Subsidiaries with NCI that are material to their stand-alone fi nancial information are:
Elbe Flugzeugwerke GmbH
GEW Technnologies (Pty) Ltd.
Alestis Aerospace S.L.
PFW Aerospace GmbH
Principal place of business Dresden (Germany) Pretoria (South Africa) La Rinconada (Spain) Speyer (Germany)
2014 2013 2014 2013 2014 2013 2014 2013
Ownership interest held by NCI 35% 35% 25% 25% 38.84% N/A 25.10% 25.10%
NCI (in € million) 21 26 11 10 (25) N/A (21) (8)
Profit (loss) allocated to NCI (in € million) 2 1 1 1 (10) N/A 1 1
Back to Contents54321 Q
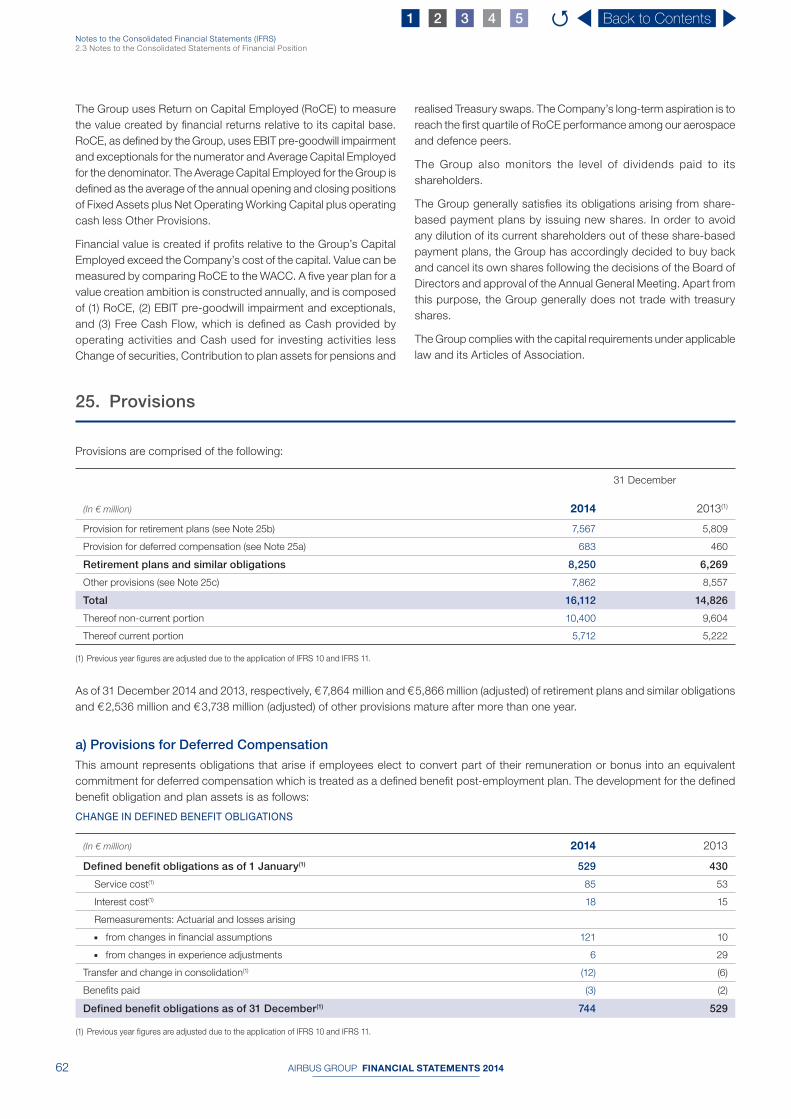
AIRBUS GROUP FINANCIAL STATEMENTS 201462
Notes to the Consolidated Financial Statements (IFRS)2.3 Notes to the Consolidated Statements of Financial Position
25. Provisions
Provisions are comprised of the following:
31 December
(In € million) 2014 2013(1)
Provision for retirement plans (see Note 25b) 7,567 5,809
Provision for deferred compensation (see Note 25a) 683 460
Retirement plans and similar obligations 8,250 6,269
Other provisions (see Note 25c) 7,862 8,557
Total 16,112 14,826
Thereof non-current portion 10,400 9,604
Thereof current portion 5,712 5,222
(1) Previous year figures are adjusted due to the application of IFRS 10 and IFRS 11.
As of 31 December 2014 and 2013, respectively, € 7,864 million and € 5,866 million (adjusted) of retirement plans and similar obligations
and € 2,536 million and € 3,738 million (adjusted) of other provisions mature after more than one year.
a) Provisions for Deferred Compensation
This amount represents obligations that arise if employees elect to convert part of their remuneration or bonus into an equivalent
commitment for deferred compensation which is treated as a defi ned benefi t post-employment plan. The development for the defi ned
benefi t obligation and plan assets is as follows:
CHANGE IN DEFINED BENEFIT OBLIGATIONS
(In € million) 2014 2013
Defined benefit obligations as of 1 January(1) 529 430
Service cost(1) 85 53
Interest cost(1) 18 15
Remeasurements: Actuarial and losses arising
■ from changes in financial assumptions 121 10
■ from changes in experience adjustments 6 29
Transfer and change in consolidation(1) (12) (6)
Benefits paid (3) (2)
Defined benefit obligations as of 31 December(1) 744 529
(1) Previous year figures are adjusted due to the application of IFRS 10 and IFRS 11.
The Group uses Return on Capital Employed (RoCE) to measure
the value created by fi nancial returns relative to its capital base.
RoCE, as defi ned by the Group, uses EBIT pre-goodwill impairment
and exceptionals for the numerator and Average Capital Employed
for the denominator. The Average Capital Employed for the Group is
defi ned as the average of the annual opening and closing positions
of Fixed Assets plus Net Operating Working Capital plus operating
cash less Other Provisions.
Financial value is created if profi ts relative to the Group’s Capital
Employed exceed the Company’s cost of the capital. Value can be
measured by comparing RoCE to the WACC. A fi ve year plan for a
value creation ambition is constructed annually, and is composed
of (1) RoCE, (2) EBIT pre-goodwill impairment and exceptionals,
and (3) Free Cash Flow, which is defi ned as Cash provided by
operating activities and Cash used for investing activities less
Change of securities, Contribution to plan assets for pensions and
realised Treasury swaps. The Company’s long-term aspiration is to
reach the fi rst quartile of RoCE performance among our aerospace
and defence peers.
The Group also monitors the level of dividends paid to its
shareholders.
The Group generally satisfi es its obligations arising from share-
based payment plans by issuing new shares. In order to avoid
any dilution of its current shareholders out of these share-based
payment plans, the Group has accordingly decided to buy back
and cancel its own shares following the decisions of the Board of
Directors and approval of the Annual General Meeting. Apart from
this purpose, the Group generally does not trade with treasury
shares.
The Group complies with the capital requirements under applicable
law and its Articles of Association.
Back to Contents54321 Q

AIRBUS GROUP FINANCIAL STATEMENTS 2014 63
2
Notes to the Consolidated Financial Statements (IFRS)2.3 Notes to the Consolidated Statements of Financial Position
The portion of the obligation, which is not protected by the pension
guarantee association or PSV (Pensions-Sicherungs Verein) in
case of an insolvency of the Group companies concerned, is
covered by securities. On 31 January 2013, a new trust agreement
(Treuhandvereinbarung) between the trust and the participant
companies was concluded qualifying these securities as plan
assets from this date onwards. The securities, which were
accounted before as available-for-sale fi nancial assets, were
reclassifi ed on this date and deduct the related provision. The
trustee agreements stipulate that some portions of the obligation
must be covered with securities in the same amount, while other
portions must be covered by 115% leading to an overfunding of
the related part of the obligation. These amounts are recognised
as other non-current and current assets.
b) Provisions for Retirement Plans
When Group employees retire, they receive indemnities as
stipulated in retirement agreements, in accordance with regulations
and practices of the countries in which the Group operates.
In France — The French pension system is operated on a “pay as
you go” basis. Besides the basic pension from the Social Security,
each employee is entitled to receive a complementary pension from
defi ned contribution schemes ARRCO (Association pour le régime
de retraite complémentaire des salariés) and AGIRC (Association
générale des institutions de retraite des cadres). Moreover, French
law stipulates that employees are paid retirement indemnities in
form of lump sums on the basis of the length of service, which are
considered as defi ned obligations.
In Germany — The Group has a pension plan (P3) for executive
and non-executive employees in place. Under this plan, the
employer provides contributions for the services rendered by the
employees, which are dependent on their salaries in the respective
service period. These contributions are converted into components
which become part of the accrued pension liability at the end of
the year. Total benefi ts are calculated as a career average over the
entire period of service. Certain employees that are not covered by
this plan receive retirement indemnities based on salary earned in
the last year or on an average of the last three years of employment.
For some executive employees, benefi ts are depending on fi nal
salary at the date of retirement and the time period as executive.
Parts of the pension obligation in Germany are funded by assets
invested in specific funding vehicles. Besides a relief fund
(Unterstützungskasse), the Group has implemented a Contractual
Trust Arrangement (CTA). The CTA structure is that of a bilateral
trust arrangement. Assets that are transferred to the relief fund
and the CTA qualify as plan assets under IAS 19.
In the United Kingdom — T he Airbus Group UK Pension Scheme
was implemented by Airbus Defence and Space Ltd, Stevenage
(UK) as the principal employer. This plan comprises all eligible
employees of Airbus Defence and Space Ltd as well as all
personnel, who were recruited by one of the Group companies
located in the UK and participating in the scheme. The majority of
the Scheme’s liabilities relate to Airbus Defence and Space Ltd.
The major part of the obligation is funded by scheme assets due
to contributions of the participating companies. The Scheme is
a registered pension scheme under the Finance Act 2004. The
Trustee’s only formal funding objective is the statutory funding
objective under the Pensions Act part 6 2004, which is to have
suffi cient and appropriate assets to cover the Scheme’s obligations.
Since 1 November 2013, this plan is generally closed for new
joiners, who participate in a separate defi ned contribution plan.
Moreover, the Group participates in the UK in several funded trustee-
administered pension plans for both executive and non-executive
employees with BAE Systems being the principal employer. These
plans qualify as multi-employer defi ned benefi t plans under IAS 19
“Employee Benefi ts”. The Group’s most signifi cant investments
in terms of employees participating in these BAE Systems UK
pension plans is Airbus Operations Ltd (before the application of
IFRS 11: Airbus Operations Ltd and MBDA UK Ltd). Participating
Airbus Operations Ltd employees have continued to remain
Members in the BAE Systems UK pension plans due to the UK
pension agreement between the Group and BAE Systems and a
change in UK pensions legislation enacted in April 2006.
CHANGE IN PLAN ASSETS
(In € million) 2014 2013
Fair value of plan assets as of 1 January 74 0
Additions (Reclassification) 3 73
Interest income from plan assets 3 2
Remeasurement of plan assets 1 (1)
Fair value of plan assets as of 31 December 81 74
RECOGNISED AS
(In € million) 2014 2013
Provision(1) 683 460
Other non-current and current assets 20 5
Total(1) 663 455
(1) Previous year figures are adjusted due to the application of IFRS 10 and IFRS 11.
Back to Contents54321 Q

AIRBUS GROUP FINANCIAL STATEMENTS 201464
Notes to the Consolidated Financial Statements (IFRS)2.3 Notes to the Consolidated Statements of Financial Position
The weighted-average assumptions used in calculating the actuarial values of the most signifi cant retirement plans as of 31 December
are as follows:
Pension plans in
Germany France UK Multi-employer (UK)
Assumptions in % 2014 2013 2014 2013 2014 2013 2014 2013
Discount rate 1.9 3.6 2.1 3.4 3.8 4.6 3.6 4.5
Rate of compensation increase 3.25 3.25 2.5 3.1 3.0 3.5 3.2 3.0
Rate of pension payment increase 1.7 2.0 - / 2.0 - / 2.0 2.8 3.0 2.3-3.2 1.9-3.7
Inflation rate 1.7 2.0 1.7 2.0 2.9 3.2 3.2 3.4
Based on the funding situation of the respective pension schemes,
the pension plan trustees determine the contribution rates to be paid
by the participating employers to adequately fund the schemes.
The different UK pension plans in which the Group investments
participate are currently underfunded. BAE Systems has agreed
with the trustees various measures designed to make good the
underfunding. These include (i) regular contribution payments for
active employees well above such which would prevail for funded
plans and (ii) extra employers’ contributions.
Due to the contractual arrangements between the Group and
BAE Systems, Airbus Group’s contributions in respect of its
investments for the most significant pension scheme (Main
Scheme) were capped until July 2011 for Airbus Operations Ltd.
Contributions exceeding the respective capped amounts were
paid by BAE Systems. Even after the expiry of the contribution
cap the unique funding arrangements between BAE Systems and
the Group create a situation for the Group different from common
UK multi-employer plans with special regulations limiting regular
contributions that have to be paid by Airbus Operations Ltd to
rates applicable to all participating employers.
Based on detailed information about the different multi-employer
pension schemes provided by BAE Systems, the Group is able to
appropriately and reliably estimate the share of its participation in
the schemes, i.e. its share in plan assets, defi ned benefi t obligations
(DBO) and pension costs. The information enables the Group
to derive keys per plan to allocate for accounting purposes an
appropriate proportion in plan assets, defi ned benefi t obligations
and pension costs to its UK investments as of the reporting date,
taking into account the impact of the capped contributions as
well as future extra contributions agreed by BAE Systems with
the Trustees. Therefore, the Group accounts for its participation
in BAE Systems’ UK defi ned benefi t schemes under the defi ned
benefi t accounting approach in accordance with IAS 19.
In 2014, the share of Airbus in BAE Systems’ main schemes
amounts to 19.65% (in 2013: 19.45%). The impact of this change
is mainly refl ected in the remeasurements of the period.
In the event that an employer who participates in the BAE pension
schemes fails or cannot be compelled to fulfi l its obligations as a
participating employer, the remaining participating employers are
obliged to collectively take on its obligations. The Group considers
the likelihood of this event as remote.
Risks
The defi ned benefi t obligation exposes the Group to actuarial risks,
including the following ones:
Market price risk: The return on plan assets is assumed to be the
discount rate derived from AA-rated corporate bonds. If the actual
return rate of plan assets is lower than the applied discount rate,
the net defi ned benefi t liability increases accordingly. Moreover,
the market values of the plan assets are subject to volatility, which
also impacts the net liability.
Interest rate risk: The level of the defi ned benefi t obligation is
signifi cantly impacted by the applied discount rate. The low interest
rates, particular in the €-denominated market environment, lead
to a relatively high net pension liability. If the decline in returns of
corporate bonds will continue, the defi ned benefi t obligation will
further increase in future periods, which can only be offset partially
by the positive development of market values of those corporate
bonds included in plan assets. Generally, the pension obligation
is sensitive to movements in the interest rate leading to volatile
results in the valuation.
Inflation risk: The pension liabilities can be sensitive to movements
in the infl ation rate, whereby a higher infl ation rate could lead to an
increasing liability. Since some pension plans are directly related
to salaries, increases in compensations could result in increasing
pension obligations. A fi xed interest rate has been agreed for
the deferred compensation plan P3, which is fi nanced by the
employees.
Longevity risk: The pension liabilities are sensitive to the life
expectancy of its Members. Rising life expectancies lead to an
increase in the valuation of the pension liability.
Actuarial assessments are regularly made to determine the amount
of the Group’s commitments with regard to retirement indemnities.
These assessments include an assumption concerning changes in
salaries, retirement ages and long-term interest rates. It comprises
all the expenses the Group will be required to pay to meet these
commitments.
Back to Contents54321 Q
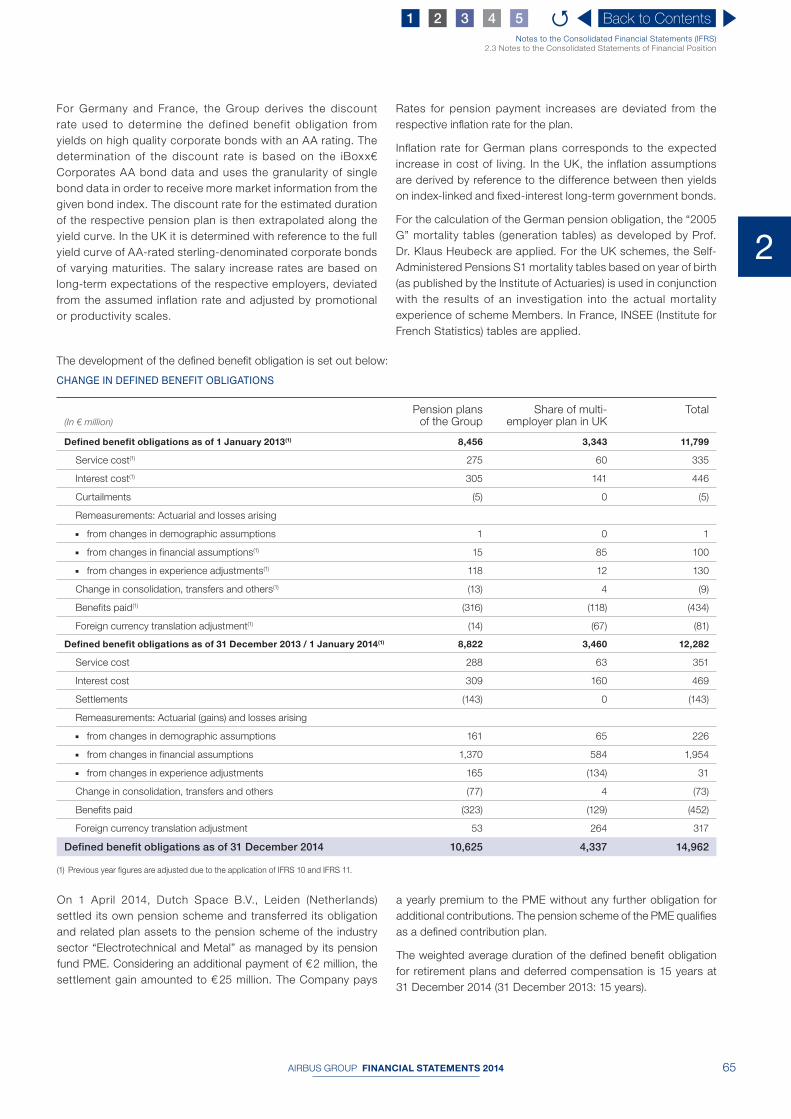
AIRBUS GROUP FINANCIAL STATEMENTS 2014 65
2
Notes to the Consolidated Financial Statements (IFRS)2.3 Notes to the Consolidated Statements of Financial Position
The development of the defi ned benefi t obligation is set out below:
CHANGE IN DEFINED BENEFIT OBLIGATIONS
(In € million)
Pension plans of the Group
Share of multi- employer plan in UK
Total
Defined benefit obligations as of 1 January 2013(1) 8,456 3,343 11,799
Service cost(1) 275 60 335
Interest cost(1) 305 141 446
Curtailments (5) 0 (5)
Remeasurements: Actuarial and losses arising
■ from changes in demographic assumptions 1 0 1
■ from changes in financial assumptions(1) 15 85 100
■ from changes in experience adjustments(1) 118 12 130
Change in consolidation, transfers and others(1) (13) 4 (9)
Benefits paid(1) (316) (118) (434)
Foreign currency translation adjustment(1) (14) (67) (81)
Defined benefit obligations as of 31 December 2013 / 1 January 2014(1) 8,822 3,460 12,282
Service cost 288 63 351
Interest cost 309 160 469
Settlements (143) 0 (143)
Remeasurements: Actuarial (gains) and losses arising
■ from changes in demographic assumptions 161 65 226
■ from changes in financial assumptions 1,370 584 1,954
■ from changes in experience adjustments 165 (134) 31
Change in consolidation, transfers and others (77) 4 (73)
Benefits paid (323) (129) (452)
Foreign currency translation adjustment 53 264 317
Defined benefit obligations as of 31 December 2014 10,625 4,337 14,962
(1) Previous year figures are adjusted due to the application of IFRS 10 and IFRS 11.
On 1 April 2014, Dutch Space B.V., Leiden (Netherlands)
settled its own pension scheme and transferred its obligation
and related plan assets to the pension scheme of the industry
sector “Electrotechnical and Metal” as managed by its pension
fund PME. Considering an additional payment of € 2 million, the
settlement gain amounted to € 25 million. The Company pays
a yearly premium to the PME without any further obligation for
additional contributions. The pension scheme of the PME qualifi es
as a defi ned contribution plan.
The weighted average duration of the defi ned benefi t obligation
for retirement plans and deferred compensation is 15 years at
31 December 2014 (31 December 2013: 15 years).
For Germany and France, the Group derives the discount
rate used to determine the defined benefit obligation from
yields on high quality corporate bonds with an AA rating. The
determination of the discount rate is based on the iBoxx€
Corporates AA bond data and uses the granularity of single
bond data in order to receive more market information from the
given bond index. The discount rate for the estimated duration
of the respective pension plan is then extrapolated along the
yield curve. In the UK it is determined with reference to the full
yield curve of AA-rated sterling-denominated corporate bonds
of varying maturities. The salary increase rates are based on
long-term expectations of the respective employers, deviated
from the assumed inflation rate and adjusted by promotional
or productivity scales.
Rates for pension payment increases are deviated from the
respective infl ation rate for the plan.
Infl ation rate for German plans corresponds to the expected
increase in cost of living. In the UK, the infl ation assumptions
are derived by reference to the difference between then yields
on index-linked and fi xed-interest long-term government bonds.
For the calculation of the German pension obligation, the “2005
G” mortality tables (generation tables) as developed by Prof.
Dr. Klaus Heubeck are applied. For the UK schemes, the Self-
Administered Pensions S1 mortality tables based on year of birth
(as published by the Institute of Actuaries) is used in conjunction
with the results of an investigation into the actual mortality
experience of scheme Members. In France, INSEE (Institute for
French Statistics) tables are applied.
Back to Contents54321 Q

AIRBUS GROUP FINANCIAL STATEMENTS 201466
Notes to the Consolidated Financial Statements (IFRS)2.3 Notes to the Consolidated Statements of Financial Position
Sensitivities are calculated based on the same method (present
value of the defi ned benefi t obligation calculated with the projected
unit method) as applied when calculating the post-employment
benefi t obligations. The sensitivity analyses are based on a change
of one assumption while holding all other assumptions constant.
This is unlikely to occur in practice and changes of more than one
assumption may be correlated leading to different impacts on DBO
than disclosed above. If the assumptions change at a different
level, the effect on the DBO is not necessarily in a linear relation.
The split of the defi ned benefi t obligation for retirement plans and deferred compensation between active, deferred and pensioner
m embers for the most signifi cant plans is as follows (as of 31 December 2014 unless otherwise noted):
Active Deferred Pensioner
Germany 46% 6% 48%
France 99% 1% 0%
UK(1) 69% 12% 19%
Share of multi-employer scheme in UK (Main Scheme)(2) 32% 19% 49%
(1) As of 5 April 2013.
(2) As of 31 March 2014.
The following table shows how the present value of the defi ned benefi t obligations of retirement plans and deferred compensation
would have been infl uenced by changes in the actuarial assumptions as set out for 31 December 2014:
Change in actuarial assumptions Impact on defined benefit obligations
Change as of 31 December
2014 2013(1)
Present value of the obligation 15,706 12,812
Discount rate Increase by 0.5%-point (1,333) (840)
Decrease by 0.5%-point 1,416 834
Salary growth Increase by 0.25%-point 356 213
Decrease by 0.25%-point (457) (214)
Pension growth Increase by 0.25%-point 345 237
Decrease by 0.25%-point (452) (237)
Life expectancy Increase by 1 year 421 296
Reduction by 1 year (537) (299)
(1) Previous year figures are adjusted due to the application of IFRS 10 and IFRS 11.
Back to Contents54321 Q

AIRBUS GROUP FINANCIAL STATEMENTS 2014 67
2
Notes to the Consolidated Financial Statements (IFRS)2.3 Notes to the Consolidated Statements of Financial Position
The development of plan assets is as follows:
CHANGE IN PLAN ASSETS
(In € million)
Pension plans of the Group
Share of multi- employer plan in UK Total
Fair value of plan assets as of 1 January 2013(1) 3,602 2,497 6,099
Interest income from plan assets(1) 138 107 245
Remeasurement of plan assets(1) 15 176 191
Contributions by employer(1) 138 88 226
Contributions by other plan participants 7 4 11
Transfers 2 0 2
Benefits paid(1) (124) (119) (243)
Foreign currency translation adjustments(1) (10) (48) (58)
Fair value of plan assets as of 31 December 2013 / 1 January 2014(1) 3,768 2,705 6,473
Interest income from plan assets 144 127 271
Remeasurement of plan assets 140 162 302
Contributions by employer 372 90 462
Contributions by other plan participants 8 4 12
Settlements (116) 0 (116)
Benefits paid (130) (129) (259)
Foreign currency translation adjustments 51 199 250
Fair value of plan assets as of 31 December 2014 4,237 3,158 7,395
(1) Previous year figures are adjusted due to the application of IFRS 10 and IFRS 11.
In 2014, contributions in the amount of € 372 million (2013: € 138 million) are made into the pension plans of the Group, mainly relating
to the relief fund in Germany with € 50 million (2013: € 74 million), the Airbus Group UK scheme with € 50 million (2013: € 49 million) and
the CTA with € 265 million (2013: € 10 million).
Contributions of approximately € 200 million are expected to be made in 2015.
The fair value of the plan assets for retirement plans and deferred compensation can be allocated to the following classes:
31 December 2014 31 December 2013
(In € million)
Quoted prices
Unquoted prices Total
Quoted prices
Unquoted prices Total
Equity securities
Europe(1) 1,086 0 1,086 1,195 0 1,195
Rest of the world 102 0 102 569 0 569
Emerging markets 248 0 248 256 0 256
Global(1) 1,452 0 1,452 594 0 594
Bonds
Corporates(1) 2,289 0 2,289 1,317 0 1,317
Governments(1) 1,317 0 1,317 1,575 0 1,575
Covered 0 0 0 60 0 60
Pooled Investment Vehicles(1) 310 15 325 237 19 256
Commodities 176 0 176 167 0 167
Hedge Funds 121 0 121 86 0 86
Derivatives 0 (47) (47) 6 (6) 0
Property(1) 346 5 351 257 5 262
Cash and Money Market Funds(1) 197 0 197 252 0 252
Others(1) 2 (143) (141) 41 (83) (42)
7,646 (170) 7,476 6,612 (65) 6,547
(1) Previous year figures are adjusted due to the application of IFRS 10 and IFRS 11.
Back to Contents54321 Q

AIRBUS GROUP FINANCIAL STATEMENTS 201468
Notes to the Consolidated Financial Statements (IFRS)2.3 Notes to the Consolidated Statements of Financial Position
As a rule, quoted prices are available on active markets.
The majority of funded plans apply broadly an asset-liability
matching (ALM) framework. The strategic asset allocation (SAA)
of the plans takes into account the characteristics of the underlying
obligations. Investments are widely diversifi ed, such that the failure
of any single investment would not have a material impact on the
overall level of assets. A large portion of assets in 2014 consists of
fi xed income instruments, equities, and although the Group also
invests in property, commodities and hedge funds. The Group is
reassessing the characteristics of the pension obligations from time
to time or as required by the applicable regulation or governance
framework. This typically triggers a subsequent review of the SAA.
The defi ned benefi t obligation at the end of the year is the present value, without deducting any plan assets, of expected future payments
required to settle the obligation resulting from employee service in the current and prior periods. Related plan assets are deducted
from the obligation leading to the funded status which corresponds to the recognised provision. The amount recorded as provision in
the Consolidated Statement of Financial Position can be allocated to the signifi cant countries as follows:
RECOGNISED PROVISION FOR RETIREMENT PLANS
Pension plans of the GroupShare of multiemployer
plan in the UK(1) Total
(In € million) Germany France UK Others
Defined benefit obligation(1) 6,637 1,352 691 142 3,460 12,282
Plan assets(1) 2,997 17 644 110 2,705 6,473
Recognised in the statements of financial position as of 31 December 2013(1) 3,640 1,335 47 32 755 5,809
Defined benefit obligation 8,144 1,561 909 11 4,337 14,962
Plan assets 3,392 17 828 0 3,158 7,395
Recognised in the statements of financial position as of 31 December 2014 4,752 1,544 81 11 1,179 7,567
(1) Previous year figures are adjusted due to the application of IFRS 10 and IFRS 11.
The movements during the year are as follows:
Balance at 31 December 2013(1)
Service and net interest
costRemea-
surements Settlement
Contribution (employer and
other plan participants)
Benefits paid
Change in consolidation, transfers and
others
Foreign currency
translation adjustments
Balance at 31 December
2014
5,809 549 1,909 (27) (474) (193) (73) 67 7,567
(1) Previous year figures are adjusted due to the application of IFRS 10 and IFRS 11.
The components of the net periodic pension cost, included in “Profi t before fi nance costs and income taxes”, are as follows:
(In € million) 2014 2013(1)
Service cost 351 335
Interest cost 469 446
Interest income (271) (245)
Net periodic pension cost 549 536
(1) Previous year figures are adjusted due to the application of IFRS 10 and IFRS 11.
Employer’s contribution to state and private pension plans, mainly in Germany and France, are to be considered as defi ned contribution
plans. Contributions in 2014 amount to € 674 million (in 2013 adjusted: € 671 million).
Back to Contents54321 Q

AIRBUS GROUP FINANCIAL STATEMENTS 2014 69
2
Notes to the Consolidated Financial Statements (IFRS)2.3 Notes to the Consolidated Statements of Financial Position
c) Other Provisions
Movements in provisions during the year were as follows:
(In € million)
Balance at 1 January
2014(1)
Exchange differences
Increase from
passage of time Additions
Reclassification / Change in
consolidated group Used Released
Balance at 31 December
2014
Contract losses 1,780 2 0 823 (1,398) (249) (58) 900
Outstanding costs 2,479 47 0 838 146 (895) (246) 2,369
Aircraft financing risks 671 123 43 3 0 (125) (28) 687
Personnel charges 954 3 4 329 (3) (344) (113) 830
Obligation from services and maintenance agreements 346 3 7 395 1 (124) (30) 598
Warranties 559 1 3 110 (6) (189) (40) 438
Restructuring measures / pre-retirement part-time work 496 2 7 57 9 (129) (17) 425
Litigations and claims 154 8 0 19 (5) (12) (20) 144
Asset retirement 121 1 3 6 0 0 (1) 130
Other risks and charges 997 18 4 849 (144) (254) (129) 1,341
Total 8,557 208 71 3,429 (1,400) (2,321) (682) 7,862
(1) Previous year figures are adjusted due to the application of IFRS 10 and IFRS 11.
In 2014, provision for contract losses mainly includes A350 XWB
(€ 627 million). The additions to the contract losses provision
include the net charge of € 551 million for the A400 M.
“Reclassifi cation / Change in consolidated group” mainly relates
to offsetting of A400M and A350 XWB contract provisions to
respective inventories.
The majority of the addition to provisions for outstanding
costs relates to Airbus Defence and Space (€ 400 million) and
corresponds among others to the Eurofi ghter programme and to
diverse tasks to complete on construction contracts, as well as to
Airbus Helicopters (€ 359 million), mainly for the NH90 programme.
The provision for aircraft fi nancing risks fully covers, in line with
the Group’s policy for sales fi nancing risk, the net exposure to
aircraft fi nancing of € 69 million (€ 82 million at 31 December 2013
adjusted) and asset value risks of € 618 million (€ 589 million at
31 December 2013) related to Airbus and Airbus Helicopters
(see Note 33 “Commitments and contingencies”).
Included in provision for obligation from service and maintenance
agreements are costs for the A380 programme related to in
service technical issues identifi ed and with solutions defi ned,
which refl ects the latest facts and circumstances. Airbus is
contractually liable for the repair or replacement of the defective
parts but not for any other damages whether direct, indirect,
incidental or consequential (including loss of revenue, profi t
or use). However, in view of overall commercial relationships,
contract adjustments may occur, and be considered on a case
by case basis.
In general, as the contractual and technical parameters to be
considered for provisions in the aerospace sector are rather
complex, uncertainty exists with regard to the timing and amounts
of expenses to be taken into account.
The majority of the Company’s other provisions are generally
expected to result in cash outfl ows during the next 1 to 12 years.
26. Financing Liabilities
The Group has issued under its EMTN Programme (Euro
Medium Term Note Programme) four currently outstanding euro
denominated bonds. The fi rst currently outstanding bond was
issued in September 2003 for a total of € 0.5 billion and matures in
September 2018. It carries a coupon of 5.5% (effective interest rate
5.58%) and was swapped into variable rate of 3M-Euribor +1.72%
in 2005. The second currently outstanding bond was issued in
August 2009 for a total of € 1 billion. It matures in August 2016
and carries a coupon of 4.625% (effective interest rate 4.68%),
which was swapped into variable rate of 3M-Euribor +1.57%. The
third currently outstanding bond was issued in April 2014 for a
total of € 1 billion and matures in April 2024. It carries a coupon
of 2.375% (effective interest rate 2.394%). The fourth and last
currently outstanding bond was issued in October 2014 for a total
of € 0.5 billion and matures in October 2029. It carries a coupon
of 2.125% (effective interest rate 2.194%).
Furthermore, on 17 April 2013, the Group placed an inaugural
US$ 1 billion issue on the US institutional market under 144A /
Reg S format. The bond carries a fi xed coupon of 2.70% (effective
interest rate 2.73%) and matures in April 2023.
The Group can issue commercial paper under the so called
billet de trésorerie programme at fl oating or fi xed interest rates
corresponding to the individual maturities ranging from 1 day
Back to Contents54321 Q

AIRBUS GROUP FINANCIAL STATEMENTS 201470
Notes to the Consolidated Financial Statements (IFRS)2.3 Notes to the Consolidated Statements of Financial Position
31 December
(In € million) 2014 2013
Bonds 3,917 2,340
thereof due in more than five years: 2,374 (31 December 2013: 780)
Liabilities to financial institutions(1) 1,751 1,070
thereof due in more than five years: 1,225 (31 December 2013: 754)
Loans(1) 424 232
thereof due in more than five years: 181 (31 December 2013: 30)
Liabilities from finance leases 186 159
thereof due in more than five years: 116 (31 December 2013: 97)
Others 0 3
thereof due in more than five years: 0 (31 December 2013: 3)
Long-term financing liabilities(1) 6,278 3,804
Bonds 1 0
Liabilities to financial institutions(1) 22 923
Loans 285 116
Liabilities from finance leases 12 13
Others(1) 753 774
Short-term financing liabilities (due within one year)(1) 1,073 1,826
Total(1) 7,351 5,630
(1) Previous year figures are adjusted due to the application of IFRS 10 and IFRS 11.
Included in “Others” are fi nancing liabilities to joint ventures.
The aggregate amounts of fi nancing liabilities maturing during the next fi ve years and thereafter are as of 31 December 2014 as follows:
(In € million)
2015 1,073
2016 1,240
2017 196
2018 723
2019 223
Thereafter 3,896
Total 7,351
to 12 months. The programme has been set up in 2003 with a
maximum volume of € 2 billion, increased in 2013 to a maximum
volume of € 3 billion.
In 2004, the EIB (European Investment Bank) granted a long-
term loan to the Group in the amount of US$ 421 million and
bearing a fixed interest rate of 5.11% (effective interest rate
5.11%). This loan was maturing and has been consequently fully
repaid in August 2014. In January 2011, the Group entered into
a US$ 300 million loan agreement maturing in January 2021 with
the Development Bank of Japan with a variable interest rate of 3
month USD Libor +1.15%. Concurrently, the Group swapped the
variable interest rate into a fi xed rate of 4.76%. In August 2011,
the Group entered into a US$ 721 million loan agreement with
EIB maturing in August 2021 with a variable interest rate of 3
month USD Libor +0.85%. Concurrently, the Group swapped the
variable interest rate into fi xed rate of 3.2%. In February 2013,
the Group entered into a US$ 406 million loan agreement with
EIB maturing in February 2020 with a variable interest rate of 3
month USD Libor +0.93%. In December 2014, the Group entered
into a US$ 627 million loan agreement with the EIB maturing in
December 2024 with a fi xed 2.52% interest rate.
Furthermore, Airbus received in 1999 a Reinvestment Note from
Deutsche Bank AG in the amount of US$ 800 million, bearing a
fi xed interest rate of 9.88% with an outstanding debt of € 147 million
(2013: € 157 million).
Liabilities from fi nancial institutions at 31 December 2014 include
no short-term liabilities from securities lending activities (2013:
€ 608 million).
Financing liabilities include liabilities connected with sales fi nancing
transactions amounting to € 46 million (2013 adjusted: € 50 million),
mainly at variable interest rates.
Non-recourse Airbus fi nancing liabilities (risk is supported by
external parties) amount to € 46 million (2013 adjusted: € 50 million).
Back to Contents54321 Q

AIRBUS GROUP FINANCIAL STATEMENTS 2014 71
2
Notes to the Consolidated Financial Statements (IFRS)2.3 Notes to the Consolidated Statements of Financial Position
The aggregate amounts of fi nancing liabilities maturing during the next fi ve years and thereafter are as of 31 December 2013 as follows:
(In € million)
2014(1) 1,826
2015(1) 157
2016(1) 1,222
2017(1) 136
2018(1) 625
Thereafter 1,664
Total 5,630
(1) Previous year figures are adjusted due to the application of IFRS 10 and IFRS 11.
27. Other Financial Liabilities
31 December
(In € million) 2014 2013
Non-current other financial liabilities
European Governments refundable advances(1) 6,020 5,907
Liabilities for derivative financial instruments 3,271 671
Others 631 576
Total(1) 9,922 7,154
Current other financial liabilities
European Governments refundable advances 508 455
Liabilities for derivative financial instruments(1) 2,232 302
Liabilities to related companies 50 52
Others(1) 690 656
Total(1) 3,480 1,465
(1) Previous year figures are adjusted due to the application of IFRS 10 and IFRS 11.
Regarding the interest expenses on European Governments
refundable advances see Note 11 “Total fi nance costs”. Due to
their specifi c nature, namely their risk-sharing features and the
fact that such advances are generally granted to the Group on the
basis of signifi cant development projects, European Governments
refundable advances are accounted for by the Group within
“Non-current / current other fi nancial liabilities” on the statement
of fi nancial position including accrued interests and presented
within “cash provided by operating activities” in the Consolidated
Statements of Cash Flows.
Included in “Other fi nancial liabilities” are € 3,470 million (2013
adjusted: € 1,495 million) due within one year and € 4,402 million
(2013: € 4,237 million) maturing after more than fi ve years.
Back to Contents54321 Q

AIRBUS GROUP FINANCIAL STATEMENTS 201472
Notes to the Consolidated Financial Statements (IFRS)2.3 Notes to the Consolidated Statements of Financial Position
28. Other Liabilities
31 December
(In € million) 2014 2013(1)
Non-current other liabilities
Customer advance payments 12,231 10,203
Others 618 561
Total 12,849 10,764
Current other liabilities
Customer advance payments 22,174 23,723
Tax liabilities (excluding income tax) 675 573
Others 2,373 2,274
Total 25,222 26,570
(1) Previous year figures are adjusted due to the application of IFRS 10 and IFRS 11.
Included in “Other liabilities” are € 24,291 million (2013 adjusted: € 23,172 million) due within one year and € 4,531 million (2013 adjusted:
€ 4,295 million) maturing after more than fi ve years.
Advance payments received relating to construction contracts amount to € 7,840 million (2013 adjusted: € 9,746 million) mainly resulting
from Airbus Defence and Space (€ 6,499 million) and Airbus Helicopters (€ 1,273 million).
29. Trade Liabilities
As of 31 December 2014, trade liabilities amounting to € 280 million (€ 184 million adjusted as of 31 December 2013) mature after more
than one year.
30. Deferred Income
31 December
(In € million) 2014 2013(1)
Non-current deferred income 267 237
Current deferred income 1,089 984
Total 1,356 1,221
(1) Previous year figures are adjusted due to the application of IFRS 10 and IFRS 11.
Back to Contents54321 Q

AIRBUS GROUP FINANCIAL STATEMENTS 2014 73
2
Notes to the Consolidated Financial Statements (IFRS)2.4 Notes to the Consolidated Statements of Cash Flows
2 .4 Notes to the Consolidated Statements of Cash Flows
31. Consolidated Statements of Cash Flows
Cash and cash equivalents are composed of the following elements:
31 December
(In € million) 2014 2013
Bank account & petty cash(1) 2,280 2,126
Short-term securities (at fair value through profit & loss) 3,261 2,933
Short-term securities (available for sale) 1,744 2,130
Others(1) 4 12
Total cash and cash equivalents(1) 7,289 7,201
Thereof presented as cash and cash equivalents 7,271 7,201
Thereof presented as part of disposal groups classified as held for sale 18 0
(1) Previous year figures are adjusted due to the application of IFRS 10 and IFRS 11.
As of 31 December 2014, bank account and petty cash are mostly
denominated in €, USD and GBP.
Derivative instruments recognised in the Group’s statement of
fi nancial position consist in (a) instruments that are entered into
as hedges of the Group’s operating activities or interest result,
and (b) in embedded foreign currency derivatives that arise from
separating the foreign currency component from certain operating
contracts. Cash fl ows resulting from the settlement of these
derivatives are therefore recorded as part of Group cash fl ow
from operations. Similarly, fi nancial assets and liabilities arising
from customer fi nancing activities, and refundable advances
from European Governments are considered part of the Group’s
operating activities and related cash fl ows are hence recognised
as cash fl ows from operating activities.
The following chart provides details on cash fl ow for acquisitions (resulting in additional assets and liabilities acquired) of subsidiaries,
joint ventures and businesses:
(In € million) 2014 2013
Total purchase price (61) (17)
thereof paid in cash and cash equivalents (61) (17)
Cash and cash equivalents included in the acquired subsidiaries, joint ventures and businesses 14 1
Cash flow for acquisitions, net of cash (47) (16)
In 2014, the aggregate cash fl ow for acquisitions, net of cash of € -47 million, relates mainly to the acquisition of Alestis Aerospace S.L.
(€ -22 million) and of Salzburg München Bank AG (€ -21 million).
In 2013, the aggregate cash fl ow for acquisitions, net of cash of € -16 million relates mainly to the acquisition of Arkoon Network Security
S.A. (€ -15 million).
Back to Contents54321 Q

AIRBUS GROUP FINANCIAL STATEMENTS 201474
Notes to the Consolidated Financial Statements (IFRS)2.4 Notes to the Consolidated Statements of Cash Flows
(In € million) 2014 2013
Intangible assets, property, plant and equipment 207 4
Financial assets 315 0
Inventories 25 0
Trade receivables 21 1
Other assets 29 8
Cash and cash equivalents 14 1
Assets 611 14
Provisions (22) (1)
Trade liabilities (23) 0
Financing liabilities (542) (1)
Tax liabilities and other liabilities (27) (9)
Liabilities (614) (11)
Fair value of total net (liabilities) assets (3) 3
Increase in non-controlling interests due to acquisitions (17) 0
Fair value of net assets acquired (20) 3
Goodwill arising on acquisitions 54 11
Total consideration 34 14
Gains related to business combinations (1) 0
Consideration 28 0
Linked non-controlling interests squeeze out transactions 0 3
Less cash and cash equivalents of acquired subsidiaries, joint ventures and businesses (14) (1)
Cash flow for acquisitions, net of cash 47 16
The following chart provides details on cash fl ow from disposals (resulting in assets and liabilities disposed) of subsidiaries:
(In € million) 2014
Total selling price 20
thereof received by cash and cash equivalents 20
Cash and cash equivalents included in the disposed subsidiaries (54)
Cash flow from disposals, net of cash (34)
The aggregate cash fl ow from disposals, net of cash, in 2014 of € -34 million, results from the sale of ND Satcom GmbH (€ -24 million)
and Test and Services (€ -10 million).
(In € million) 2014
Intangible assets, property, plant and equipment (11)
Financial assets (2)
Inventories (31)
Trade receivables (52)
Other assets (17)
Cash and cash equivalents (54)
Assets (167)
Provisions 57
Trade liabilities 27
Other liabilities 59
Liabilities 143
Book value of net assets (24)
Related disposal of goodwill (5)
Result from disposal of subsidiaries 2
Non-cash effective consideration 7
Less cash and cash equivalents of disposed subsidiaries 54
Cash flow from disposals, net of cash 34
In 2013, no disposal had a signifi cant impact on the cash fl ow.
Back to Contents54321 Q
AIRBUS GROUP FINANCIAL STATEMENTS 2014 75
2
Notes to the Consolidated Financial Statements (IFRS)2.5 Other Notes to the Consolidated Financial Statements
Airbus Group is involved from time to time in various legal and
arbitration proceedings in the ordinary course of its business,
the most signifi cant of which are described below. Other than
as described below, Airbus Group is not aware of any material
governmental, legal or arbitration proceedings (including any
such proceedings which are pending or threatened), during a
period covering at least the previous twelve months which may
have, or have had in the recent past signifi cant effects on Airbus
Group N.V.’s or the Group’s fi nancial position or profi tability.
If the Group concludes that the disclosures relative to contingent
liabilities can be expected to prejudice seriously its position in a
dispute with other parties, the Group limits its disclosures to the
nature of the dispute.
WTO
Although Airbus Group is not a party, Airbus Group is supporting
the European Commission in litigation before the WTO. Following
its unilateral withdrawal from the 1992 EU-US Agreement on Trade
in Large Civil Aircraft, the US lodged a request on 6 October 2004
to initiate proceedings before the WTO. On the same day, the EU
launched a parallel WTO case against the US in relation to its
subsidies to Boeing. On 19 December 2014, the European Union
requested WTO consultations on the extension until the end of
2040 of subsidies originally granted by the State of Washington
to Boeing and other US aerospace fi rms until 2024.
On 1 June 2011, the WTO adopted the Appellate Body’s fi nal report
in the case brought by the US assessing funding to Airbus from
European governments. On 1 December 2011, the EU informed
the WTO that it had taken appropriate steps to bring its measures
fully into conformity with its WTO obligations, and to comply with
the WTO’s recommendations and rulings. Because the US did
not agree, the matter is now under WTO panel review pursuant
to WTO rules.
On 23 March 2012, the WTO adopted the Appellate Body’s fi nal
report in the case brought by the EU assessing funding to Boeing
from the US. On 23 September 2012, the US informed the WTO
that it had taken appropriate steps to bring its measures fully into
conformity with its WTO obligations, and to comply with the WTO’s
recommendations and rulings. Because the EU did not agree, the
matter is now under WTO panel review pursuant to WTO rules.
Exact timing of further steps in the WTO litigation process is subject
to further rulings and to negotiations between the US and the EU.
Unless a settlement, which is currently not under discussion, is
reached between the parties, the litigation is expected to continue
for several years.
Securities Litigation
Following the dismissal of charges brought by the French Autorité
des marchés financiers for alleged breaches of market regulations
and insider trading rules with respect primarily to the A380 delays
announced in 2006, a French investigating judge decided in
November 2013 to send the case to trial (renvoi devant le tribunal
correctionnel) against seven current and former executives that
exercised their stock options in March 2006 as well as two former
shareholders. On 3 October 2014 the criminal court suspended
the case on the merits and decided to request a preliminary ruling
(question prioritaire de constitutionnalité) from the French Supreme
Court on the constitutionality of the French dual prosecution
system (AMF and judicial proceedings). On 17 December 2014,
the French Supreme Court agreed to transmit the constitutional
challenge to the Conseil Constitutionnel who are scheduled to
make their ruling by the end of March 2015. After being directed
by the criminal court to correct inaccuracies in the charges, the
investigating magistrate issued revised charge in January 2015. It
is unlikely that the case will resume before the second half of 2015.
GPT
Prompted by a whistleblower’s allegations, Airbus Group
conducted internal audits and retained PricewaterhouseCoopers
(“PwC”) to conduct an independent review relating to GPT Special
Project Management Ltd. (“GPT”), a subsidiary that Airbus Group
acquired in 2007. The allegations called into question a service
contract entered into by GPT prior to its acquisition by Airbus
Group, relating to activities conducted by GPT in Saudi Arabia.
PwC’s report was provided by Airbus Group to the UK Serious
Fraud Offi ce (the “SFO”) in March 2012. In the period under review
and based on the work it undertook, nothing came to PwC’s
attention to suggest that improper payments were made by GPT.
In August 2012, the SFO announced that it had opened a formal
criminal investigation into the matter. Airbus Group is cooperating
fully with the authorities.
Eurofi ghter Austria
In March 2012, the German public prosecutor, following a request
for assistance by the Austrian public prosecutor, launched a criminal
investigation into alleged bribery, tax evasion and breach of trust
by current and former employees of EADS Deutschland GmbH
(renamed on 1 July 2014 Airbus Defence and Space GmbH) and
Eurofi ghter Jagdfl ugzeug GmbH as well as by third parties relating
to the sale of Eurofi ghter aircraft to Austria in 2003. After having
been informed on the investigation in 2012, Airbus Group retained
law fi rm Clifford Chance to conduct a fact fi nding independent
review. Upon concluding its review, Clifford Chance presented
2 .5 Other Notes to the Consolidated Financial Statements
32. Litigation and Claims
Back to Contents54321 Q

AIRBUS GROUP FINANCIAL STATEMENTS 201476
Notes to the Consolidated Financial Statements (IFRS)2.5 Other Notes to the Consolidated Financial Statements
its fact fi nding report to Airbus Group in December 2013. Airbus
Group provided the report to the public prosecutors in Germany.
Airbus Group is cooperating fully with the authorities.
Other Investigations
Following the publication of investigations by the Romanian
authorities relating to the border surveillance project in Romania in
mid-October 2014 Airbus Group confi rms that Airbus Defence and
Space GmbH has been informed that also the German prosecution
offi ce investigates with respect to potential irregularities in relation
to this project, a project in Saudi Arabia and a project of Tesat-
Spacecom GmbH & Co. KG. No legal entity of the Airbus Group
is subject of any accusations.
Public prosecutors in Greece and Germany launched investigations
into a current employee and former offi cers and employees of Atlas
Elektronik GmbH, a joint company of ThyssenKrupp and Airbus
Group, on suspicion of bribing foreign offi cials and tax evasion.
The public prosecutor in Germany has launched an administrative
proceeding for alleged organisational and supervisory shortfalls.
The authorities in Greece have launched civil claims against
Atlas Elektronik GmbH. With the support of its shareholders,
the Company is cooperating fully with the authorities and in
consultation with the public prosecutor is assisting the further
clarifi cation of the matter through its own internal investigation.
Commercial disputes
In May 2013, the Group has been notifi ed of a commercial dispute
following the decision taken by the Group to cease a partnership
for sales support activities in some local markets abroad. The
Group believes it has solid grounds to legally object to the alleged
breach of a commercial agreement. However, the consequences
of this dispute and the outcome of the proceedings cannot be
fully assessed at this stage. The arbitration is not expected to be
completed before the end of 2016.
In the course of another commercial dispute, the Group has
received in the third quarter 2013 a statement of claim alleging
liability for refunding part of the purchase price of a large contract
which the customer claims it was not obliged to pay. The Group
believes that this claim which goes back many years ago should
be dismissed in principle. Options to resolve the dispute are
under review but eventually it may be decided in the course of
the arbitration.
In July 2013, the Group became the subject of a commercial dispute
following the expiry of a partnership study for winglet devices with
a US supplier. The Group believes it has solid grounds to legally
object to the alleged breach of a commercial non-disclosure
agreement. However, the outcome and consequences of this
dispute cannot be assessed at this stage.
33. Commitments and Contingencies
Sales fi nancing — With a view to facilitating aircraft sales for
Airbus and Airbus Helicopters, the Group enters into sales
fi nancing transactions with selected customers. These transactions
may take the form of operating leases, fi nance leases or loans.
Sometimes, group-external investors share in the fi nancing and
if so, the transactions usually involve the creation of a Structured
Entity (“SE”). Apart from investor interest protection, interposing an
SE offers advantages such as fl exibility, bankruptcy remoteness,
liability containment and facilitating sell downs of the aircraft
fi nanced. An aircraft fi nancing SE is typically funded, on a non-
recourse basis, by a senior lender and one or more providers of
subordinated fi nancing. When Airbus Group acts as investor to
such SEs it may take the role of the senior lender or the provider
of subordinated fi nancing. Airbus Group consolidates an aircraft
fi nancing SE if it is exposed to the SE’s variable returns and has
the ability to direct the relevant remarketing activities. Otherwise,
it recognises its share in the SE fi nancing as a loan from aircraft
fi nancing under Other long-term fi nancial assets. At 31 December
2014 the carrying amount of its loans from aircraft fi nancing
amounts to € 426 million. This amount also represents the Group’s
maximum exposure to loss from its interest in unconsolidated
aircraft fi nancing SEs.
Sales fi nancing transactions, including those that are structured
through SEs, are generally collateralised by the underlying aircraft.
Additionally, Airbus and Airbus Helicopters benefi t from protective
covenants and from security packages tailored according to the
perceived risk and the legal environment. The Group believes that
the estimated fair value of the aircraft securing such commitments
will substantially offset any potential losses from the commitments.
Any remaining difference between the amount of financing
commitments given and the collateral value of the aircraft fi nanced
is provided for as an impairment to the relating asset, if assignable,
or as a provision for aircraft fi nancing risk. The basis for this write
down is a risk-pricing-model, which is applied at every closing to
closely monitor the remaining value of the aircraft.
Depending on which party assumes the risks and rewards of
ownership of a fi nanced aircraft, the assets relating to sales
fi nancing are accounted for on the statement of financial position
either as (i) an operating lease (see Note 14 “Property, plant and
equipment”) or (ii) a loan from aircraft fi nancing or (iii) a fi nance
lease receivable (see Note 17 “Other investments and other long-
term fi nancial assets”) or (iv) inventory. As of 31 December 2014,
related accumulated impairment amounts to € 114 million (2013
adjusted: € 134 million) for operating lease, to € 179 million (2013
adjusted: € 159 million) for loans and fi nance lease receivables and
€ 42 million for inventories (2013 adjusted: € 10 million). As part of
provisions for aircraft fi nancing risks € 47 million (2013 adjusted:
€ 43 million) are recorded (see Note 25 “Provisions” c).
Certain sales fi nancing transactions include the sale and lease
back of the aircraft with a third party lessor under operating
lease. Unless the Group has sold down the relating operating
lease commitments to third parties, who assume liability for the
payments, it is exposed to future lease payments.
Back to Contents54321 Q
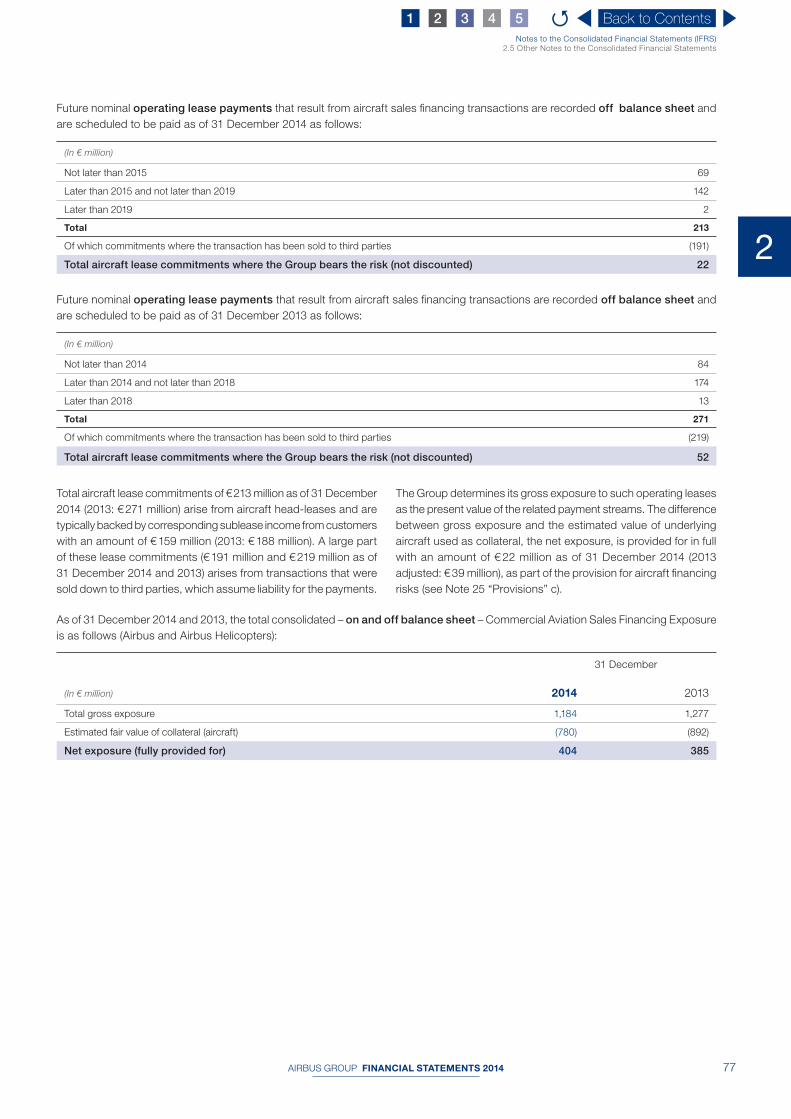
AIRBUS GROUP FINANCIAL STATEMENTS 2014 77
2
Notes to the Consolidated Financial Statements (IFRS)2.5 Other Notes to the Consolidated Financial Statements
Total aircraft lease commitments of € 213 million as of 31 December
2014 (2013: € 271 million) arise from aircraft head-leases and are
typically backed by corresponding sublease income from customers
with an amount of € 159 million (2013: € 188 million). A large part
of these lease commitments (€ 191 million and € 219 million as of
31 December 2014 and 2013) arises from transactions that were
sold down to third parties, which assume liability for the payments.
The Group determines its gross exposure to such operating leases
as the present value of the related payment streams. The difference
between gross exposure and the estimated value of underlying
aircraft used as collateral, the net exposure, is provided for in full
with an amount of € 22 million as of 31 December 2014 (2013
adjusted: € 39 million), as part of the provision for aircraft fi nancing
risks (see Note 25 “Provisions” c).
As of 31 December 2014 and 2013, the total consolidated – on and off balance sheet – Commercial Aviation Sales Financing Exposure
is as follows (Airbus and Airbus Helicopters):
31 December
(In € million) 2014 2013
Total gross exposure 1,184 1,277
Estimated fair value of collateral (aircraft) (780) (892)
Net exposure (fully provided for) 404 385
Future nominal operating lease payments that result from aircraft sales fi nancing transactions are recorded off balance sheet and
are scheduled to be paid as of 31 December 2014 as follows:
(In € million)
Not later than 2015 69
Later than 2015 and not later than 2019 142
Later than 2019 2
Total 213
Of which commitments where the transaction has been sold to third parties (191)
Total aircraft lease commitments where the Group bears the risk (not discounted) 22
Future nominal operating lease payments that result from aircraft sales fi nancing transactions are recorded off balance sheet and
are scheduled to be paid as of 31 December 2013 as follows:
(In € million)
Not later than 2014 84
Later than 2014 and not later than 2018 174
Later than 2018 13
Total 271
Of which commitments where the transaction has been sold to third parties (219)
Total aircraft lease commitments where the Group bears the risk (not discounted) 52
Back to Contents54321 Q
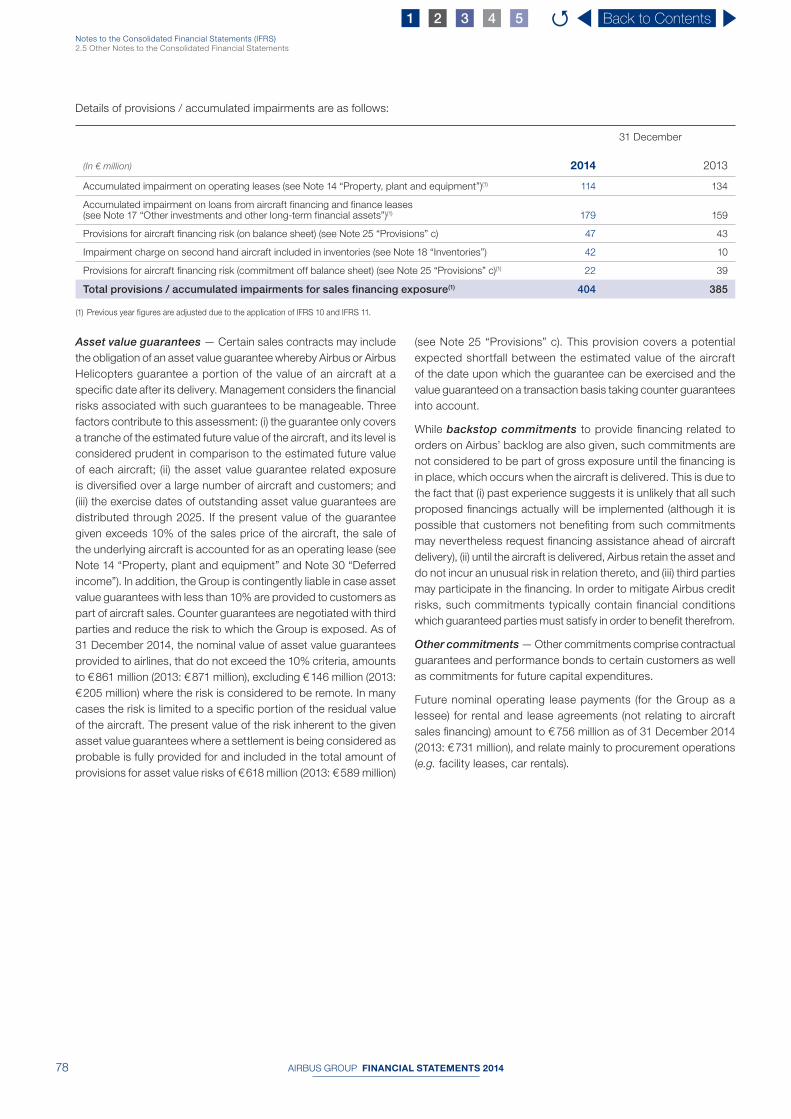
AIRBUS GROUP FINANCIAL STATEMENTS 201478
Notes to the Consolidated Financial Statements (IFRS)2.5 Other Notes to the Consolidated Financial Statements
Asset value guarantees — Certain sales contracts may include
the obligation of an asset value guarantee whereby Airbus or Airbus
Helicopters guarantee a portion of the value of an aircraft at a
specifi c date after its delivery. Management considers the fi nancial
risks associated with such guarantees to be manageable. Three
factors contribute to this assessment: (i) the guarantee only covers
a tranche of the estimated future value of the aircraft, and its level is
considered prudent in comparison to the estimated future value
of each aircraft; (ii) the asset value guarantee related exposure
is diversifi ed over a large number of aircraft and customers; and
(iii) the exercise dates of outstanding asset value guarantees are
distributed through 2025. If the present value of the guarantee
given exceeds 10% of the sales price of the aircraft, the sale of
the underlying aircraft is accounted for as an operating lease (see
Note 14 “Property, plant and equipment” and Note 30 “Deferred
income”). In addition, the Group is contingently liable in case asset
value guarantees with less than 10% are provided to customers as
part of aircraft sales. Counter guarantees are negotiated with third
parties and reduce the risk to which the Group is exposed. As of
31 December 2014 , the nominal value of asset value guarantees
provided to airlines, that do not exceed the 10% criteria, amounts
to € 861 million (2013: € 871 million), excluding € 146 million (2013:
€ 205 million) where the risk is considered to be remote. In many
cases the risk is limited to a specifi c portion of the residual value
of the aircraft. The present value of the risk inherent to the given
asset value guarantees where a settlement is being considered as
probable is fully provided for and included in the total amount of
provisions for asset value risks of € 618 million (2013: € 589 million)
(see Note 25 “Provisions” c). This provision covers a potential
expected shortfall between the estimated value of the aircraft
of the date upon which the guarantee can be exercised and the
value guaranteed on a transaction basis taking counter guarantees
into account.
While backstop commitments to provide fi nancing related to
orders on Airbus’ backlog are also given, such commitments are
not considered to be part of gross exposure until the fi nancing is
in place, which occurs when the aircraft is delivered. This is due to
the fact that (i) past experience suggests it is unlikely that all such
proposed fi nancings actually will be implemented (although it is
possible that customers not benefi ting from such commitments
may nevertheless request fi nancing assistance ahead of aircraft
delivery), (ii) until the aircraft is delivered, Airbus retain the asset and
do not incur an unusual risk in relation thereto, and (iii) third parties
may participate in the fi nancing. In order to mitigate Airbus credit
risks, such commitments typically contain fi nancial conditions
which guaranteed parties must satisfy in order to benefi t therefrom.
Other commitments — Other commitments comprise contractual
guarantees and performance bonds to certain customers as well
as commitments for future capital expenditures.
Future nominal operating lease payments (for the Group as a
lessee) for rental and lease agreements (not relating to aircraft
sales fi nancing) amount to € 756 million as of 31 December 2014
(2013: € 731 million), and relate mainly to procurement operations
(e.g. facility leases, car rentals).
Details of provisions / accumulated impairments are as follows:
31 December
(In € million) 2014 2013
Accumulated impairment on operating leases (see Note 14 “Property, plant and equipment”)(1) 114 134
Accumulated impairment on loans from aircraft financing and finance leases (see Note 17 “Other investments and other long-term financial assets”)(1) 179 159
Provisions for aircraft financing risk (on balance sheet) (see Note 25 “Provisions” c) 47 43
Impairment charge on second hand aircraft included in inventories (see Note 18 “Inventories”) 42 10
Provisions for aircraft financing risk (commitment off balance sheet) (see Note 25 “Provisions” c)(1) 22 39
Total provisions / accumulated impairments for sales financing exposure(1) 404 385
(1) Previous year figures are adjusted due to the application of IFRS 10 and IFRS 11.
Back to Contents54321 Q

AIRBUS GROUP FINANCIAL STATEMENTS 2014 79
2
Notes to the Consolidated Financial Statements (IFRS)2.5 Other Notes to the Consolidated Financial Statements
Maturities as of 31 December 2014 are as follows:
(In € million)
Not later than 2015 150
Later than 2015 and not later than 2019 347
Later than 2019 259
Total 756
The respective maturities as of 31 December 2013 are as follows:
(In € million)
Not later than 2014 150
Later than 2014 and not later than 2018 377
Later than 2018 204
Total 731
34. Information about Financial Instruments
a) Financial Risk Management
By the nature of its activities, the Group is exposed to a variety
of fi nancial risks, as explained below: (i) market risks, especially
foreign currency exchange rate risks, interest rate risks, equity
price risks and commodity price risks, (ii) liquidity risk and (iii) credit
risk. The Group’s overall fi nancial risk management programme
focuses on mitigating unpredictable fi nancial market risks and
their potential adverse effects on the Group’s operational and
fi nancial performance.
The fi nancial risk management of the Group is generally carried out
by the Central Treasury department at Airbus Group under policies
approved by the Board of Directors or by the Chief Financial Offi cer.
The identifi cation, evaluation and hedging of the fi nancial risks is in
the responsibility of established treasury committees jointly with
the Group’s Divisions.
Market Risk
Currency risk — Foreign exchange risk arises when future
commercial transactions or firm commitments, recognised
assets and liabilities and net investments in foreign operations
are denominated in a currency that is not the entity’s functional
currency.
The Group manages a long-term hedge portfolio with a maturity of
several years covering its net exposure to US dollar sales, mainly
from the activities of Airbus. This hedge portfolio covers to a large
extent the Group’s fi rm commitments and highly probable forecast
transactions.
Signifi cant parts of Group revenues are denominated in US dollars,
whereas a major portion of its costs are incurred in euros and to a
smaller extent in GBP. Consequently, to the extent that the Group
does not use fi nancial instruments to cover its current and future
foreign currency exchange rate exposure, its profi ts are affected
by changes in the euro-US dollar exchange rate. As the Group
intends to generate profi ts only from its operations and not through
speculation on foreign currency exchange rate movements, it
uses hedging strategies to manage and minimise the impact of
exchange rate fl uctuations on these profi ts. The Group applies
hedge accounting for a signifi cant portion of its hedging portfolio.
For products such as aircraft, the Group typically hedges fi rmly
committed sales in US dollar. The hedged items are defi ned as
fi rst fi rmly committed future cash infl ows for a given month based
upon fi nal payments at delivery. Usually, the Group designates a
portion of the total monthly cash infl ows as the hedged position to
cover its expected foreign currency exposure. Therefore, as long as
the actual gross foreign currency cash infl ows (per month) exceed
the portion designated as being hedged, a postponement or
cancellation of sales transactions and corresponding cash infl ows
have no impact on the hedging relationship. Similarly, though to
a lesser extent the Group hedges its expected foreign currency
exposure arising from US dollar cash outfl ows in the commercial
aircraft business on a fi rst outfl ow basis. For the non-commercial
aircraft business the Group hedges in- and outfl ows in foreign
currencies from fi rmly committed or highly probable forecast sales
and purchase contracts. In the non-aircraft business, hedges are
typically contracted in lower volumes but follow similar fi rst fl ow
logic or are designated based on agreed milestone payments. The
amount of the expected fl ows to be hedged can cover up to 100%
of the equivalent of the net US dollar exposure at inception. The
coverage ratio is adjusted to take into account macroeconomic
movements affecting the spot rates and interest rates as well as the
robustness of the commercial cycle. As hedging instruments, the
Group primarily uses foreign currency forwards, foreign currency
options, some synthetic forwards and to a minor extent non-
derivative fi nancial instruments.
In addition, the Group hedges currency risk arising from fi nancial
transactions in other currencies than euro, such as funding
transactions or securities.
Back to Contents54321 Q
AIRBUS GROUP FINANCIAL STATEMENTS 201480
Notes to the Consolidated Financial Statements (IFRS)2.5 Other Notes to the Consolidated Financial Statements
The Company also has foreign currency derivative instruments
which are embedded in certain purchase and lease contracts
denominated in a currency other than the functional currency of any
substantial party to the contract, principally USD and GBP. Gains
or losses relating to such embedded foreign currency derivatives
are reported in other fi nancial result unless the derivatives are
designated as a hedging instrument.
Interest rate risk — The Group uses an asset-liability management
approach with the objective to limit its interest rate risk. The
Group undertakes to match the risk profi le of its assets with a
corresponding liability structure. The remaining net interest rate
exposure is managed through several types of interest rate
derivatives, primarily interest rate swaps and to a lesser extent
interest rate futures contracts, in order to minimise risks and
fi nancial impacts. The vast majority of related interest rate hedges
qualify for hedge accounting as either fair value hedges or cash
fl ow hedges.
The Group invests in fi nancial instruments such as overnight
deposits, certifi cates of deposits, commercial papers, other money
market instruments and short-term as well as mid-term bonds.
For its fi nancial instruments portfolio, the Group holds on a regular
basis an Asset Management Committee which aims at limiting
the interest rate risk on a fair value basis through a value-at-risk
approach.
Commodity price risk — The Group is exposed to risk relating to
fl uctuations in the prices of commodities used in the supply chain.
The Group manages these risks in the procurement process and
to a certain extent uses derivative instruments in order to mitigate
the risks associated with the purchase of raw materials.
Equity Price risk — The Group is to a small extent invested in
equity securities mainly for operational reasons. The Group’s
exposure to equity price risk is hence limited. Further the Group
is exposed under its Long-Term Incentive Plans (LTIP) to the risk of
Airbus Group share price increases. The Group limits these risks
through the use of equity derivatives that have been designated
as hedging instruments in a cash fl ow hedge.
Sensitivities of Market Risks — The approach used to measure
and control market risk exposure within the Group’s fi nancial
instrument portfolio is amongst other key indicators the value-at-
risk (“VaR”). The VaR of a portfolio is the estimated potential loss
that will not be exceeded on the portfolio over a specifi ed period
of time (holding period) from an adverse market movement with a
specifi ed confi dence level. The VaR used by the Group is based
upon a 95% confi dence level and assumes a 5-day holding period.
The VaR model used is mainly based on the so called “Monte-
Carlo-Simulation” method. Deriving the statistical behaviour of
the markets relevant for the portfolio out of market data from the
previous two years and observed interdependencies between
different markets and prices, the model generates a wide range
of potential future scenarios for market price movements.
The Group’s VaR computation includes the Group’s fi nancial
debt, short-term and long-term investments, foreign currency
forwards, swaps and options, commodity contracts, fi nance
lease receivables and liabilities, foreign currency trade payables
and receivables, including intra-group payables and receivables
affecting Group profi t and loss.
Although VaR is an important tool for measuring market risk,
the assumptions on which the model is based give rise to some
limitations, including the following:
■ A fi ve-day holding period assumes that it is possible to hedge
or dispose of positions within that period. This is considered to
be a realistic assumption in almost all cases but may not be the
case in situations in which there is severe market illiquidity for
a prolonged period; ■ A 95% confi dence level does not refl ect losses that may occur
beyond this level. Even within the model used there is a 5%
statistical probability that losses could exceed the calculated
VaR; ■ T he use of historical data as a basis for estimating the statistical
behaviour of the relevant markets and fi nally determining the
possible range of future outcomes out of this statistical behaviour
may not always cover all possible scenarios, especially those of
an exceptional nature.
The Group uses VaR amongst other key figures in order to
determine the riskiness of its fi nancial instrument portfolio and in
order to optimise the risk-return ratio of its fi nancial asset portfolio.
Further, the Group’s investment policy defi nes a VaR limit for the
total portfolio of cash, cash equivalents and securities. The total
VaR as well as the different risk-factor specifi c VaR fi gures of this
portfolio are measured and serve amongst other measures as
a basis for the decisions of the Asset Management Committee.
Back to Contents54321 Q

AIRBUS GROUP FINANCIAL STATEMENTS 2014 81
2
Notes to the Consolidated Financial Statements (IFRS)2.5 Other Notes to the Consolidated Financial Statements
A summary of the VaR position of the Group’s fi nancial instruments portfolio at 31 December 2014 and 2013 is as follows:
(In € million) Total VaR Equity price VaR Currency VaR Commodity price VaR Interest rate VaR
31 December 2014
FX hedges for forecast transactions or firm commitments 1,052 0 1,135 0 122
Financing liabilities, financial assets (incl. cash, cash equivalents, securities and related hedges) 407 401 33 0 32
Finance lease receivables and liabilities, foreign currency trade payables and receivables 55 0 19 0 57
Commodity contracts 9 0 2 9 0
Equity swaps 17 17 0 0 0
Diversification effect (489) (17) (74) 0 (27)
All financial instruments 1,051 401 1,115 9 184
31 December 2013
FX hedges for forecast transactions or firm commitments 577 0 615 0 46
Financing liabilities, financial assets (incl. cash, cash equivalents, securities and related hedges) 156 161 16 0 19
Finance lease receivables and liabilities, foreign currency trade payables and receivables 28 0 4 0 28
Commodity contracts 13 0 1 12 0
Diversification effect (157) 0 (18) 0 (38)
All financial instruments 617 161 618 12 55
The increase of total VaR compared to 31 December 2013 is mainly
attributable to a strong increase of market volatilities, in particular FX
and equity volatilities in combination with an increased net foreign
exchange portfolio in comparison to year end 2013. The Group
uses its derivative instruments entirely for hedging purposes. As
a result, the respective market risks of these hedging instruments
are – depending on the hedges’ actual effectiveness – offset by
corresponding opposite market risks of the underlying forecast
transactions, assets or liabilities. Under IFRS 7 the underlying
forecast transactions do not qualify as fi nancial instruments and
are therefore not included in the tables shown above. Accordingly,
the VaR of the FX hedging portfolio in the amount of € 1,052 million
(2013: € 577 million) cannot be considered as a risk indicator for
the Group in the economic sense.
Liquidity Risk
The Group’s policy is to maintain sufficient cash and cash
equivalents at any time to meet its present and future commitments
as they fall due. The Group manages its liquidity by holding
adequate volumes of liquid assets and maintains a committed
credit facility (€ 3.0 billion as of 31 December 2014 and 2013) in
addition to the cash infl ow generated by its operating business.
The liquid assets typically consist of cash and cash equivalents.
The Group continues to keep within the asset portfolio the focus
on low counterparty risk. In addition, the Group maintains a set of
other funding sources. Depending on its cash needs and market
conditions, the Group may issue bonds, notes and commercial
papers and may enter into security lending agreements. Adverse
changes in the capital markets could increase the Group’s funding
costs and limit its fi nancial fl exibility.
Further, the management of the vast majority of the Group’s
liquidity exposure is centralised by a daily cash concentration
process. This process enables the Group to manage its liquidity
surplus as well as its liquidity requirements according to the actual
needs of its subsidiaries. In addition, Management monitors the
Group’s liquidity reserve as well as the expected cash fl ows from
its operations.
Back to Contents54321 Q
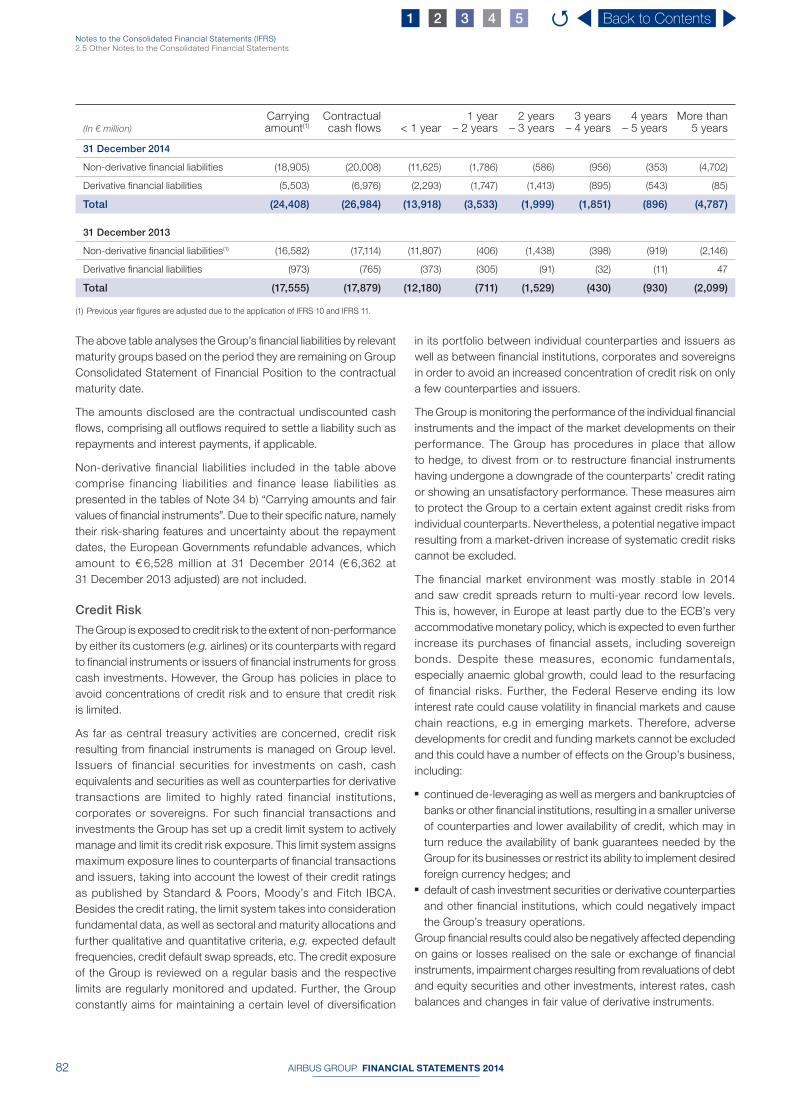
AIRBUS GROUP FINANCIAL STATEMENTS 201482
Notes to the Consolidated Financial Statements (IFRS)2.5 Other Notes to the Consolidated Financial Statements
(In € million)
Carrying amount(1)
Contractual cash flows < 1 year
1 year– 2 years
2 years– 3 years
3 years– 4 years
4 years– 5 years
More than 5 years
31 December 2014
Non-derivative financial liabilities (18,905) (20,008) (11,625) (1,786) (586) (956) (353) (4,702)
Derivative financial liabilities (5,503) (6,976) (2,293) (1,747) (1,413) (895) (543) (85)
Total (24,408) (26,984) (13,918) (3,533) (1,999) (1,851) (896) (4,787)
31 December 2013
Non-derivative financial liabilities(1) (16,582) (17,114) (11,807) (406) (1,438) (398) (919) (2,146)
Derivative financial liabilities (973) (765) (373) (305) (91) (32) (11) 47
Total (17,555) (17,879) (12,180) (711) (1,529) (430) (930) (2,099)
(1) Previous year figures are adjusted due to the application of IFRS 10 and IFRS 11.
The above table analyses the Group’s fi nancial liabilities by relevant
maturity groups based on the period they are remaining on Group
Consolidated Statement of Financial Position to the contractual
maturity date.
The amounts disclosed are the contractual undiscounted cash
fl ows, comprising all outfl ows required to settle a liability such as
repayments and interest payments, if applicable.
Non-derivative fi nancial liabilities included in the table above
comprise financing liabilities and finance lease liabilities as
presented in the tables of Note 34 b) “Carrying amounts and fair
values of fi nancial instruments”. Due to their specifi c nature, namely
their risk-sharing features and uncertainty about the repayment
dates, the European Governments refundable advances, which
amount to € 6,528 million at 31 December 2014 (€ 6,362 at
31 December 2013 adjusted) are not included.
Credit Risk
The Group is exposed to credit risk to the extent of non-performance
by either its customers (e.g. airlines) or its counterparts with regard
to fi nancial instruments or issuers of fi nancial instruments for gross
cash investments. However, the Group has policies in place to
avoid concentrations of credit risk and to ensure that credit risk
is limited.
As far as central treasury activities are concerned, credit risk
resulting from fi nancial instruments is managed on Group level.
Issuers of fi nancial securities for investments on cash, cash
equivalents and securities as well as counterparties for derivative
transactions are limited to highly rated financial institutions,
corporates or sovereigns. For such fi nancial transactions and
investments the Group has set up a credit limit system to actively
manage and limit its credit risk exposure. This limit system assigns
maximum exposure lines to counterparts of fi nancial transactions
and issuers, taking into account the lowest of their credit ratings
as published by Standard & Poors, Moody’s and Fitch IBCA.
Besides the credit rating, the limit system takes into consideration
fundamental data, as well as sectoral and maturity allocations and
further qualitative and quantitative criteria, e.g. expected default
frequencies, credit default swap spreads, etc. The credit exposure
of the Group is reviewed on a regular basis and the respective
limits are regularly monitored and updated. Further, the Group
constantly aims for maintaining a certain level of diversifi cation
in its portfolio between individual counterparties and issuers as
well as between fi nancial institutions, corporates and sovereigns
in order to avoid an increased concentration of credit risk on only
a few counterparties and issuers.
The Group is monitoring the performance of the individual fi nancial
instruments and the impact of the market developments on their
performance. The Group has procedures in place that allow
to hedge, to divest from or to restructure fi nancial instruments
having undergone a downgrade of the counterparts’ credit rating
or showing an unsatisfactory performance. These measures aim
to protect the Group to a certain extent against credit risks from
individual counterparts. Nevertheless, a potential negative impact
resulting from a market-driven increase of systematic credit risks
cannot be excluded.
The fi nancial market environment was mostly stable in 2014
and saw credit spreads return to multi-year record low levels.
This is, however, in Europe at least partly due to the ECB’s very
accommodative monetary policy, which is expected to even further
increase its purchases of fi nancial assets, including sovereign
bonds. Despite these measures, economic fundamentals,
especially anaemic global growth, could lead to the resurfacing
of fi nancial risks. Further, the Federal Reserve ending its low
interest rate could cause volatility in fi nancial markets and cause
chain reactions, e.g in emerging markets. Therefore, adverse
developments for credit and funding markets cannot be excluded
and this could have a number of effects on the Group’s business,
including:
■ continued de-leveraging as well as mergers and bankruptcies of
banks or other fi nancial institutions, resulting in a smaller universe
of counterparties and lower availability of credit, which may in
turn reduce the availability of bank guarantees needed by the
Group for its businesses or restrict its ability to implement desired
foreign currency hedges; and ■ default of cash investment securities or derivative counterparties
and other fi nancial institutions, which could negatively impact
the Group’s treasury operations.
Group fi nancial results could also be negatively affected depending
on gains or losses realised on the sale or exchange of fi nancial
instruments, impairment charges resulting from revaluations of debt
and equity securities and other investments, interest rates, cash
balances and changes in fair value of derivative instruments.
Back to Contents54321 Q

AIRBUS GROUP FINANCIAL STATEMENTS 2014 83
2
Notes to the Consolidated Financial Statements (IFRS)2.5 Other Notes to the Consolidated Financial Statements
Sales of products and services are made to customers after having
conducted appropriate internal credit risk assessment. In order to
support sales, primarily at Airbus and ATR, the Group may agree
to participate in the fi nancing of customers, on a case-by-case
basis, directly or through guarantees provided to third parties. In
determining the amount and terms of the fi nancing transaction,
Airbus and ATR take into account the airline’s credit rating and
economic factors refl ecting the relevant fi nancial market conditions,
together with appropriate assumptions as to the anticipated future
value of the fi nanced asset.
The booked amount of fi nancial assets represents the maximum
credit exposure. The credit quality of fi nancial assets can be
assessed by reference to external credit rating (if available) or internal
assessment of customers’ (such as airlines’) creditworthiness by
way of internal risk pricing methods.
The following table breaks down the carrying amounts of the Group’s non-cash loans and receivables including the fi nance leases
separately showing those that are impaired, renegotiated or past due:
(In € million) 2014 2013(1)
Receivables, neither past due nor impaired 6,592 6,479
Not past due following negotiations and not impaired 94 27
Receivables impaired individually 405 351
Receivables not impaired and past due ≤ 3 months 1,173 1,173
Receivables not impaired and past due >3 and ≤ 6 months 271 122
Receivables not impaired and past due >6 and ≤ 9 months 95 165
Receivables not impaired and past due >9 and ≤ 12 months 141 165
Receivables not impaired and past due > 12 months 387 385
Total 9,158 8,867
(1) Previous year figures are adjusted due to the application of IFRS 10 and IFRS 11.
The management believes that the unimpaired amounts that are past due are still collectible in full, based on historic payment behaviour
and analysis of customer credit risk, including underlying customers’ credit ratings if they are available.
At year-end there was no indication that any fi nancial assets carried at fair value were impaired.
Back to Contents54321 Q

AIRBUS GROUP FINANCIAL STATEMENTS 201484
Notes to the Consolidated Financial Statements (IFRS)2.5 Other Notes to the Consolidated Financial Statements
Airbus Group assigns its fi nancial instruments into classes based on their balance sheet category. The following tables present the carrying
amounts and fair values of fi nancial instruments by class and by IAS 39 measurement category as of 31 December 2014 and 2013:
31 December 2014Fair Value through
profit or loss
Fair Value for hedge relations
Available for Sale
Loans and Receivables and Financial liabilities at amortised cost Other(3)
Financial Instruments
Total
(In € million)Held for trading Designated
Fair value
Book value
Fair value
Amortised Cost
Fair value
Book Value
Fair value
AssetsOther investments and other long-term financial assets
■ Equity investments(1), (2) 0 0 0 617 617 0 0 0 617 617
■ Customer financings(3) 0 0 0 0 0 426 426 17 443 443
■ Other loans 0 0 0 0 0 876 876 0 876 876
Trade receivables 0 0 0 0 0 6,798 6,798 0 6,798 6,798
Other financial assets
■ Derivative instruments(6) 266 0 444 0 0 0 0 0 710 710
■ Non-derivative instruments 0 0 0 0 0 1,040 1,040 0 1,040 1,040
Securities 0 4 0 9,168 9,168 0 0 0 9,172 9,172
Cash and cash equivalents 0 3,261 0 1,744 1,744 2,266 2,266 0 7,271 7,271
Total 266 3,265 444 11,529 11,529 11,406 11,406 17 26,927 26,927
LiabilitiesFinancing liabilities
■ Issued bonds & commercial papers 0 0 0 0 0 (3,918) (4,227) 0 (3,918) (4,227)
■ Liabilities to banks & other financing liabilities 0 0 0 0 0 (3,235) (3,291) 0 (3,235) (3,291)
■ Finance lease liabilities(4) 0 0 0 0 0 0 0 (198) (198) (198)
Other financial liabilities
■ Derivative instruments(7) (370) 0 (5,133) 0 0 0 0 0 (5,503) (5,503)
■ European Governments refundable advances(5) 0 0 0 0 0 (6,528) (6,528) 0 (6,528) (6,528)
■ Other (137) 0 0 0 0 (1,234) (1,234) 0 (1,371) (1,371)
Trade liabilities 0 0 0 0 0 (10,183) (10,183) 0 (10,183) (10,183)
Total (507) 0 (5,133) 0 0 (25,098) (25,463) (198) (30,936) (31,301)
(1) Other than those accounted for under the equity method.
(2) For certain unlisted equity investments price quotes are not available and fair values may not be reliably measurable using valuation techniques because the range of reasonable
fair value estimates is significant and the probabilities of the various estimates within the range cannot be reasonably assessed. These equity investments are accounted for at cost,
and their fair values as reported in the table above equal their carrying amounts. As of 31 December 2014, the aggregate carrying amount of these investments was € 409 million.
(3) This includes finance lease receivables, which are not assigned to an IAS 39 measurement category, but reported as “Other”.
(4) Finance lease liabilities are accounted for in accordance with IAS 17 in a manner that is similar, though not identical in all respects, to amortised-cost accounting under IAS 39.
They are therefore assigned to the category “Other”.
(5) The European Governments refundable advances of € 6,528 million are measured at amortised cost. Fair values cannot be reliably measured because their risk sharing nature and
the uncertainty of the repayment dates give rise to a broad range of reasonable fair value estimates and make it impossible to reasonably assess the probabilities of the various
estimates within the range. This may change and reliable fair value measures become available as the related programmes approach the end of production.
(6) This includes credit value adjustments of € -18 million, of which € -7 million is recognised in OCI.
(7) This includes debit value adjustments of € 31 million, of which € 18 million is recognised in OCI.
b) Carrying A mounts and F air V alues of Financial
Instruments
The fair value of a fi nancial instrument is the price at which one party
would assume the rights and/or duties of another party. Fair values
of fi nancial instruments have been determined with reference to
available market information at the end of the reporting period
and the valuation methodologies discussed below. Considering
the variability of their value-determining factors and the volume of
fi nancial instruments, the fair values presented herein may not be
indicative of the amounts that the Group could realise in a current
market environment.
Back to Contents54321 Q
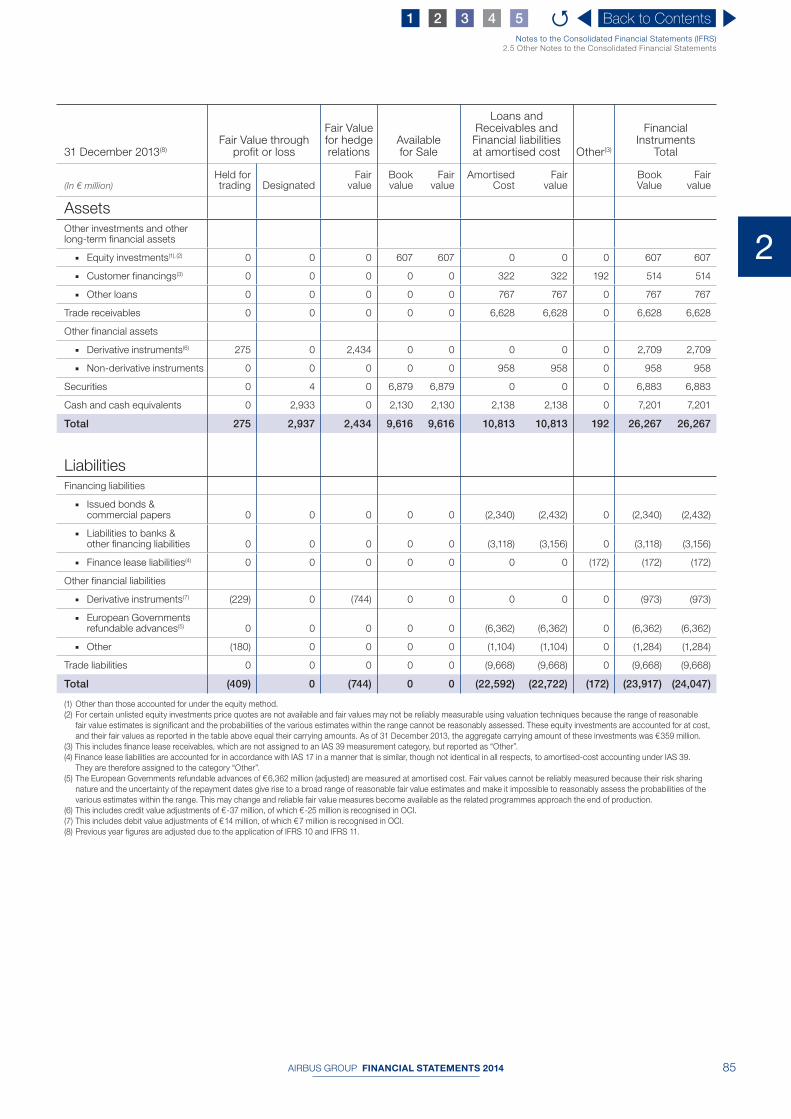
AIRBUS GROUP FINANCIAL STATEMENTS 2014 85
2
Notes to the Consolidated Financial Statements (IFRS)2.5 Other Notes to the Consolidated Financial Statements
31 December 2013(8)
Fair Value through profit or loss
Fair Value for hedge relations
Available for Sale
Loans and Receivables and Financial liabilities at amortised cost Other(3)
Financial Instruments
Total
(In € million)Held for trading Designated
Fair value
Book value
Fair value
Amortised Cost
Fair value
Book Value
Fair value
AssetsOther investments and other long-term financial assets
■ Equity investments(1), (2) 0 0 0 607 607 0 0 0 607 607
■ Customer financings(3) 0 0 0 0 0 322 322 192 514 514
■ Other loans 0 0 0 0 0 767 767 0 767 767
Trade receivables 0 0 0 0 0 6,628 6,628 0 6,628 6,628
Other financial assets
■ Derivative instruments(6) 275 0 2,434 0 0 0 0 0 2,709 2,709
■ Non-derivative instruments 0 0 0 0 0 958 958 0 958 958
Securities 0 4 0 6,879 6,879 0 0 0 6,883 6,883
Cash and cash equivalents 0 2,933 0 2,130 2,130 2,138 2,138 0 7,201 7,201
Total 275 2,937 2,434 9,616 9,616 10,813 10,813 192 26,267 26,267
LiabilitiesFinancing liabilities
■ Issued bonds & commercial papers 0 0 0 0 0 (2,340) (2,432) 0 (2,340) (2,432)
■ Liabilities to banks & other financing liabilities 0 0 0 0 0 (3,118) (3,156) 0 (3,118) (3,156)
■ Finance lease liabilities(4) 0 0 0 0 0 0 0 (172) (172) (172)
Other financial liabilities
■ Derivative instruments(7) (229) 0 (744) 0 0 0 0 0 (973) (973)
■ European Governments refundable advances(5) 0 0 0 0 0 (6,362) (6,362) 0 (6,362) (6,362)
■ Other (180) 0 0 0 0 (1,104) (1,104) 0 (1,284) (1,284)
Trade liabilities 0 0 0 0 0 (9,668) (9,668) 0 (9,668) (9,668)
Total (409) 0 (744) 0 0 (22,592) (22,722) (172) (23,917) (24,047)
(1) Other than those accounted for under the equity method.
(2) For certain unlisted equity investments price quotes are not available and fair values may not be reliably measurable using valuation techniques because the range of reasonable
fair value estimates is significant and the probabilities of the various estimates within the range cannot be reasonably assessed. These equity investments are accounted for at cost,
and their fair values as reported in the table above equal their carrying amounts. As of 31 December 2013, the aggregate carrying amount of these investments was € 359 million.
(3) This includes finance lease receivables, which are not assigned to an IAS 39 measurement category, but reported as “Other”.
(4) Finance lease liabilities are accounted for in accordance with IAS 17 in a manner that is similar, though not identical in all respects, to amortised-cost accounting under IAS 39.
They are therefore assigned to the category “Other”.
(5) The European Governments refundable advances of € 6,362 million (adjusted) are measured at amortised cost. Fair values cannot be reliably measured because their risk sharing
nature and the uncertainty of the repayment dates give rise to a broad range of reasonable fair value estimates and make it impossible to reasonably assess the probabilities of the
various estimates within the range. This may change and reliable fair value measures become available as the related programmes approach the end of production.
(6) This includes credit value adjustments of € -37 million, of which € -25 million is recognised in OCI.
(7) This includes debit value adjustments of € 14 million, of which € 7 million is recognised in OCI.
(8) Previous year figures are adjusted due to the application of IFRS 10 and IFRS 11.
Back to Contents54321 Q

AIRBUS GROUP FINANCIAL STATEMENTS 201486
Notes to the Consolidated Financial Statements (IFRS)2.5 Other Notes to the Consolidated Financial Statements
Financial Assets and Liabilities — Generally, fair values are
determined by using quoted prices in active markets for the same
or substantially the same instrument or if such prices are not
available, by applying a valuation method, such as discounted
cash fl ow analysis, using inputs other than quoted prices (such as
interest rates, foreign exchange rates, credit spreads or volatilities)
that are observable for the asset or liability.
For the fair value measurement of some instruments (such as
written puts on non-controlling-interest), it may not be possible
to derive all the inputs required for applying a valuation method
from observable market data. In these situations, the fair value
measurements perforce refl ect estimates partly derived from
the Group’s own data and are based on assumptions that are
inherently judgment al and involve various limitations.
The methodologies used are as follows:
Equity instruments — The fair values of listed equity instruments
refl ect quoted market prices. The fair values of unlisted equity
instruments may not be reliably measured because the range of
reasonable fair value estimates is signifi cant and the probabilities
of the various estimates within the range cannot be reasonably
assessed. Those instruments are measured at cost, and their
carrying amounts used as a proxy for fair value.
Customer fi nancing assets and other loans — The carrying
amounts refl ected in the annual accounts are used as a proxy
for fair value.
Part-time retirement and deferred compensation assets —
The fair values of these instruments refl ect the quoted market price
at the end of the reporting period.
Trade receivables and other receivables — The carrying
amounts refl ected in the annual accounts are used as reasonable
estimates of fair value because of the relatively short period
between the receivables’ origination and their maturity.
Securities — The fair values of securities refl ect their quoted
market price at the end of the reporting period.
Cash and cash equivalents — Cash and cash equivalents
include cash in hand, cash in banks, checks, fi xed deposits
as well as commercial papers and money market funds. The
carrying amounts refl ected in the annual accounts are used as
reasonable estimates of fair value because of the relatively short
period between the origination of the instrument and its maturity
or due date. Fair value of commercial papers is determined by
discounting future cash fl ows using appropriate interest rates. The
fair values of money market funds are determined by reference to
their quoted market price.
Derivatives — The fair values of derivative instruments refl ect
quoted market prices, where available, but in most cases are
determined using recognised valuation techniques such as option-
pricing models and discounted cash fl ow models. The valuation is
based on observable market data such as currency rates, currency
forward rates, interest rates and yield curves, commodity forward
prices as well as price and rate volatilities obtained from recognised
vendors of market data. Furthermore, to the extent that these
instruments are subject to master netting arrangements and similar
agreements and managed on the basis of net credit exposure,
their fair values refl ect credit and debit value adjustments based
on the net long or net short position that the Group has with each
counterparty.
Financing liabilities — The fair values disclosed for fi nancing
liabilities, other than those of issued bonds and issued commercial
papers, are determined based on Level 2 input by discounting
scheduled or expected cash fl ows using appropriate market
interest rates. The fair values disclosed for the issued EMTN and
US$ bonds refl ect public price quotations that qualify as Level 1
input. For issued commercial papers, the carrying amounts
refl ected in the annual accounts are used as reasonable estimates
of fair value because of the relatively short period between the
origination of these instruments and their maturity.
Trade Liabilities and Current Other Financial Liabilities — For
the same reason, carrying amounts are used as reasonable fair
value approximations for trade liabilities and current other fi nancial
liabilities.
Back to Contents54321 Q

AIRBUS GROUP FINANCIAL STATEMENTS 2014 87
2
Notes to the Consolidated Financial Statements (IFRS)2.5 Other Notes to the Consolidated Financial Statements
Fair Value Hierarchy
The fair value hierarchy consists of the following levels:
■ Level 1: quoted prices (unadjusted) in active markets for identical assets and liabilities; ■ Level 2: inputs other than quoted prices that are observable for the asset or liability, either directly (i.e. as prices) or indirectly (i.e.
derived from prices); and ■ Level 3: inputs for the asset or liability that are not based on observable market data.
The fair values disclosed for fi nancial instruments accounted for at amortised cost refl ect Level 2 input. Otherwise, fair values are
determined mostly based on Level 1 and Level 2 input and to a minor extent on Level 3 input. The following tables present the carrying
amounts of the fi nancial instruments held at fair value across the three levels of the fair value hierarchy as of 31 December 2014 and
2013, respectively:
31 December 2014 Level 1 Level 2 Level 3 Total
(In € million)
Financial assets measured at fair value
Equity instruments 208 0 0 208
Derivative instruments 0 708 2 710
Securities 7,784 1,388 0 9,172
Cash equivalents 3,563 1,442 0 5,005
Total 11,555 3,538 2 15,095
Financial liabilities measured at fair value
Derivative instruments 0 (5,503) 0 (5,503)
Other liabilities 0 0 (137) (137)
Total 0 (5,503) (137) (5,640)
The development of fi nancial instruments of Level 3 is as follows:
Total gains or losses in
(In € million)
Balance at 1 January
2014Profit
or loss
Other comprehensive
income Purchases Issues Settlements Reclassification
Balance at 31 December
2014
Financial assets
Derivative Instruments
■ Commodity swap agreements 26 (1) 0 0 0 (23) 0 2
■ Other derivative instruments 8 0 0 0 0 (8) 0 0
Total(1) 34 (1) 0 0 0 (31) 0 2
Financial liabilities
Other liabilities
■ Written put options on non-controlling interests (129) 2 0 0 0 0 0 (127)
■ Earn-out agreements (51) 38 0 0 0 3 0 (10)
Total(2) (180) 40 0 0 0 3 0 (137)
(1) The profit of the period impact attributable to Level 3 Financial assets which are still held by the Group as of 31 December 2014 was a gain of € 1 million.
(2) The profit of the period impact attributable to Level 3 Financial liabilities which are still held by the Group as of 31 December 2014 was a gain of € 24 million.
Back to Contents54321 Q

AIRBUS GROUP FINANCIAL STATEMENTS 201488
Notes to the Consolidated Financial Statements (IFRS)2.5 Other Notes to the Consolidated Financial Statements
31 December 2013 Level 1 Level 2 Level 3 Total
(In € million)
Financial assets measured at fair value
Equity instruments(1) 248 0 0 248
Derivative instruments(1) 0 2,675 34 2,709
Securities(1) 6,876 7 0 6,883
Cash equivalents 3,777 1,286 0 5,063
Total 10,901 3,968 34 14,903
Financial liabilities measured at fair value
Derivative Instruments(1) 0 (973) 0 (973)
Other liabilities 0 0 (180) (180)
Total 0 (973) (180) (1,153)
(1) Previous year figures are adjusted due to the application of IFRS 10 and IFRS 11.
The year before, the development of fi nancial instruments of Level 3 was as follows:
Total gains or losses in
(In € million)
Balance at 1 January
2013Profit
or loss
Other comprehensive
income Purchases Issues Settlements Reclassification
Balance at 31 December
2013
Financial assets
Derivative Instruments
■ Commodity swap agreements 41 35 0 0 0 (50) 0 26
■ Other derivative instruments 8 (1) 1 0 0 0 0 8
Total(3) 49 34 1 0 0 (50) 0 34
Financial liabilities
Other liabilities
■ Written put options on non-controlling interests(1) 0 0 1 0 (101) 3 (32) (129)
■ Earn-out agreements(2) 0 1 0 0 0 0 (52) (51)
■ Other (5) 0 0 0 0 5 0 0
Total(4) (5) 1 1 0 (101) 8 (84) (180)
(1) Reclassification of € 32 million for written put options on non-controlling interest issued in 2012 from financial liabilities recognised at amortised cost during 2013.
(2) € 52 million of earn-outs for entities acquired in 2012 have been recorded within other provisions of 2012 Consolidated Financial Statements and have been reclassified to Level 3
financial liabilities at fair value through profit or loss.
(3) The profit of the period impact attributable to Level 3 Financial assets which are still held by the Group as of 31 December 2013 was € 26 million.
(4) The profit of the period impact attributable to Level 3 Financial liabilities which are still held by the Group as of 31 December 2013 was € 1 million.
Financial Assets classified as Level 3
The Financial assets measured at fair value that are classifi ed
as Level 3 mainly consist of short-term commodity contracts
whose notional amounts vary with the actual volumes of certain
commodity purchases made by the Group in specifi c months.
For fair value measurement purposes, the notional amounts,
being the unobservable input, are set with reference to monthly
commodity volumes that management expects to purchase based
on planning forecasts. The fair values are otherwise determined
using observable market data including quoted interest rates and
pricing information obtained from recognised vendors of market
data.
A deviation of 10% of actual monthly volumes purchased from
expected monthly volumes purchased would increase or decrease
(depending on whether actual volumes are 10% more or 10% less
than expected volumes) the total Level 3 fair value of these short-
term commodity contracts by less than € 1 million.
Financial Liabilities classified as Level 3
The Financial liabilities measured at fair value that are classifi ed as
Level 3 consist of several written put options on non-controlling
interest (“NCI puts”) of Group subsidiaries. The fair values of these
NCI puts (i.e. the net present value of their redemption amount on
exercise) are derived from a discounted cash fl ow analysis of the
latest operating planning fi gures of the respective entities.
Back to Contents54321 Q

AIRBUS GROUP FINANCIAL STATEMENTS 2014 89
2
Notes to the Consolidated Financial Statements (IFRS)2.5 Other Notes to the Consolidated Financial Statements
The fair value measurements are performed on an annual basis
in line with the operative planning cycle. For interim fi nancial
statements an analysis of the input parameters is performed for
determination of signifi cant changes since the last measurement
date that would call for an adjustment of the value of the put options.
Apart from the detailed fi ve-year operating planning fi gures, there
are two unobservable inputs that signifi cantly affect the values of
the NCI puts: the WACC used to discount the forecasted cash fl ows
and the growth rate used to determine the terminal value. WACC
and growth rates as well as operating planning fi gures that were
used for the determination of the level 3 fair values are derived
from the input perimeters as applied for the impairment test as
disclosed in Note 13 “Intangible assets – Goodwill impairment
tests”. An increase (decrease) of the discount rates by 50 basis
points results in a decrease (increase) of the NCI put values by
€ 11 million (€ 13 million adjusted). An increase (decrease) in the
growth rates by 50 basis points increases (decreases) the NCI put
values by € 11 million (€ 9 million adjusted) respectively.
Another element of fi nancial liabilities measured at fair value
classifi ed as Level 3 are earn-out payments that have been agreed
with former shareholders of entities acquired by the Group in
business combinations. Fair Value measurement is based on the
expectation regarding the achievement of defi ned target fi gures
by the acquired entity or its ability to close identifi ed customer
contracts.
Financial Assets designated at fair value through profit or loss
The following types of financial assets held at 31 December 2014 and 2013 respectively are designated at fair value through profi t or loss:
(In € million)
Nominal amount at initial recognition as of 31 December 2014
Fair value as of 31 December 2014
Nominal amount at initial recognition as of
31 December 2013Fair value as of
31 December 2013
Designated at fair value through profit or loss at recognition:
Money Market Funds (accumulating) 3,261 3,261 2,933 2,933
Foreign currency Funds of Hedge Funds 8 4 8 4
Total 3,269 3,265 2,941 2,937
The accumulating Money Market Funds have been designated at fair value through profi t or loss as their portfolio is managed and their
performance is measured on a fair value basis.
In addition, the Group invests in Money Market Funds paying interest on a monthly basis. The fair value of those funds corresponds to
their nominal amount at initial recognition date amounting to € 302 million (2013: € 844 million).
Investments in foreign currency Funds of Hedge Funds have been designated at fair value through profi t or loss.
Back to Contents54321 Q
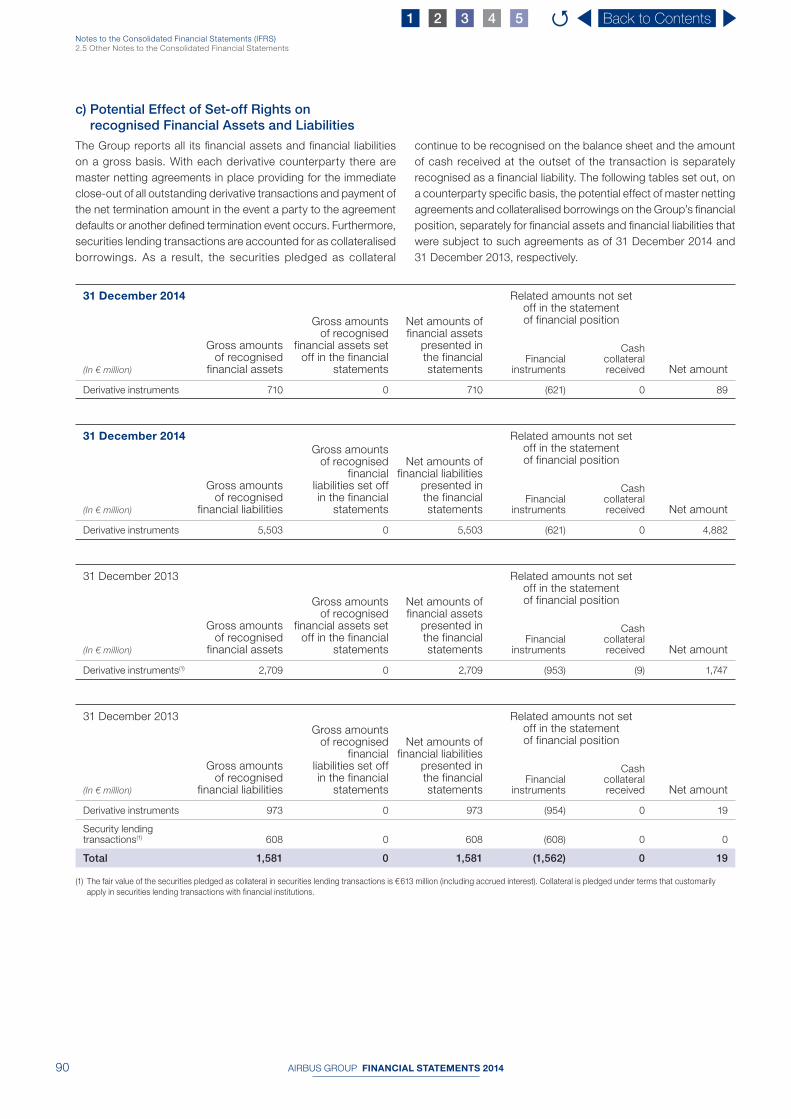
AIRBUS GROUP FINANCIAL STATEMENTS 201490
Notes to the Consolidated Financial Statements (IFRS)2.5 Other Notes to the Consolidated Financial Statements
c) Potential E ffect of S et-off Rights on
recognised Financial Assets and Liabilities
The Group reports all its fi nancial assets and fi nancial liabilities
on a gross basis. With each derivative counterparty there are
master netting agreements in place providing for the immediate
close-out of all outstanding derivative transactions and payment of
the net termination amount in the event a party to the agreement
defaults or another defi ned termination event occurs. Furthermore,
securities lending transactions are accounted for as collateralised
borrowings. As a result, the securities pledged as collateral
continue to be recognised on the balance sheet and the amount
of cash received at the outset of the transaction is separately
recognised as a fi nancial liability. The following tables set out, on
a counterparty specifi c basis, the potential effect of master netting
agreements and collateralised borrowings on the Group’s fi nancial
position, separately for fi nancial assets and fi nancial liabilities that
were subject to such agreements as of 31 December 2014 and
31 December 2013, respectively.
31 December 2014
Gross amounts of recognised
financial assets
Gross amounts of recognised
financial assets set off in the financial
statements
Net amounts of financial assets
presented in the financial statements
Related amounts not set off in the statement of financial position
(In € million)Financial
instruments
Cash collateral received Net amount
Derivative instruments 710 0 710 (621) 0 89
31 December 2014
Gross amounts of recognised
financial liabilities
Gross amounts of recognised
financial liabilities set off in the financial
statements
Net amounts of financial liabilities
presented in the financial statements
Related amounts not set off in the statement of financial position
(In € million)Financial
instruments
Cash collateral received Net amount
Derivative instruments 5,503 0 5,503 (621) 0 4,882
31 December 2013
Gross amounts of recognised
financial assets
Gross amounts of recognised
financial assets set off in the financial
statements
Net amounts of financial assets
presented in the financial statements
Related amounts not set off in the statement of financial position
(In € million)Financial
instruments
Cash collateral received Net amount
Derivative instruments(1) 2,709 0 2,709 (953) (9) 1,747
31 December 2013
Gross amounts of recognised
financial liabilities
Gross amounts of recognised
financial liabilities set off in the financial
statements
Net amounts of financial liabilities
presented in the financial statements
Related amounts not set off in the statement of financial position
(In € million)Financial
instruments
Cash collateral received Net amount
Derivative instruments 973 0 973 (954) 0 19
Security lending transactions(1) 608 0 608 (608) 0 0
Total 1,581 0 1,581 (1,562) 0 19
(1) The fair value of the securities pledged as collateral in securities lending transactions is € 613 million (including accrued interest). Collateral is pledged under terms that customarily
apply in securities lending transactions with financial institutions.
Back to Contents54321 Q

AIRBUS GROUP FINANCIAL STATEMENTS 2014 91
2
Notes to the Consolidated Financial Statements (IFRS)2.5 Other Notes to the Consolidated Financial Statements
d) Notional A mounts of Derivative Financial Instruments
The contract or notional amounts of derivative fi nancial instruments shown below do not necessarily represent amounts exchanged
by the parties and, thus, are not necessarily a measure for the exposure of the Group through its use of derivatives.
The notional amounts of foreign exchange derivative fi nancial instruments are as follows, specifi ed by year of expected maturity:
Year ended 31 December 2014 Remaining period Total
(In € million) 2015 2016 2017 2018 2019 2020 2021 2022+
Foreign Exchange Contracts:
Net forward sales contracts 19,834 17,852 16,479 9,328 4,556 477 (1,069) (396) 67,061
FX swap contracts 1,274 145 0 0 0 0 0 0 1,419
Year ended 31 December 2013 Remaining period Total
(In € million) 2014 2015 2016 2017 2018 2019 2020 2021+
Foreign Exchange Contracts:
Net forward sales contracts 16,925 14,429 12,072 6,942 1,797 (295) (302) (1,290) 50,278
FX swap contracts 2,000 0 128 0 0 0 0 0 2,128
The notional amounts of interest rate contracts are as follows:
Year ended 31 December 2014 Remaining period Total
(In € million) 2015 2016 2017 2018 2019 2020 2021 2022+
Interest rate contracts 833 1,376 30 918 853 0 1,070 0 5,080
Interest rate future contracts 176 0 0 0 0 0 0 0 176
Please also refer to Note 26 “Financing Liabilities”.
Year ended 31 December 2013 Remaining period Total
(In € million) 2014 2015 2016 2017 2018 2019 2020 2021+
Interest rate contracts 1,212 833 1,414 30 974 945 0 942 6,350
Interest rate future contracts 163 0 0 0 0 0 0 0 163
Notional amounts of commodity contracts are as follows:
Year ended 31 December 2014 Remaining period Total
(In € million) 2015 2016 2017 2018 2019+
Commodity contracts 319 161 105 20 10 615
Year ended 31 December 2013 Remaining period Total
(In € million) 2014 2015 2016 2017 2018+
Commodity contracts 318 164 125 82 6 695
Notional amounts of equity swaps are as follows:
Year ended 31 December 2014 Remaining period Total
(In € million) 2015 2016 2017 2018 2019+
Equity derivative contracts 209 146 75 23 0 453
The Group did not hold any equity derivative contracts at 31 December 2013.
Back to Contents54321 Q
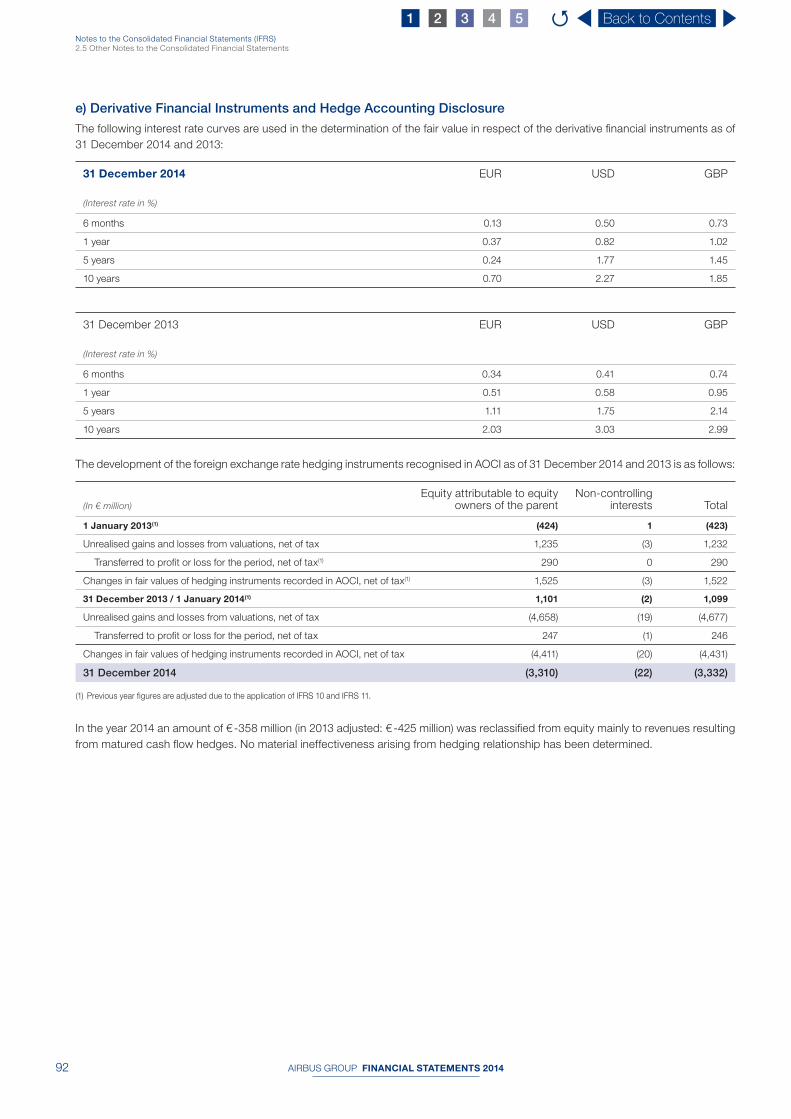
AIRBUS GROUP FINANCIAL STATEMENTS 201492
Notes to the Consolidated Financial Statements (IFRS)2.5 Other Notes to the Consolidated Financial Statements
e) Derivative Financial Instruments and Hedge Accounting D isclosure
The following interest rate curves are used in the determination of the fair value in respect of the derivative fi nancial instruments as of
31 December 2014 and 2013:
31 December 2014 EUR USD GBP
(Interest rate in %)
6 months 0.13 0.50 0.73
1 year 0.37 0.82 1.02
5 years 0.24 1.77 1.45
10 years 0.70 2.27 1.85
31 December 2013 EUR USD GBP
(Interest rate in %)
6 months 0.34 0.41 0.74
1 year 0.51 0.58 0.95
5 years 1.11 1.75 2.14
10 years 2.03 3.03 2.99
The development of the foreign exchange rate hedging instruments recognised in AOCI as of 31 December 2014 and 2013 is as follows:
(In € million)
Equity attributable to equity owners of the parent
Non-controlling interests Total
1 January 2013(1) (424) 1 (423)
Unrealised gains and losses from valuations, net of tax 1,235 (3) 1,232
Transferred to profit or loss for the period, net of tax(1) 290 0 290
Changes in fair values of hedging instruments recorded in AOCI, net of tax(1) 1,525 (3) 1,522
31 December 2013 / 1 January 2014(1) 1,101 (2) 1,099
Unrealised gains and losses from valuations, net of tax (4,658) (19) (4,677)
Transferred to profit or loss for the period, net of tax 247 (1) 246
Changes in fair values of hedging instruments recorded in AOCI, net of tax (4,411) (20) (4,431)
31 December 2014 (3,310) (22) (3,332)
(1) Previous year figures are adjusted due to the application of IFRS 10 and IFRS 11.
In the year 2014 an amount of € -358 million (in 2013 adjusted: € -425 million) was reclassifi ed from equity mainly to revenues resulting
from matured cash fl ow hedges. No material ineffectiveness arising from hedging relationship has been determined.
Back to Contents54321 Q
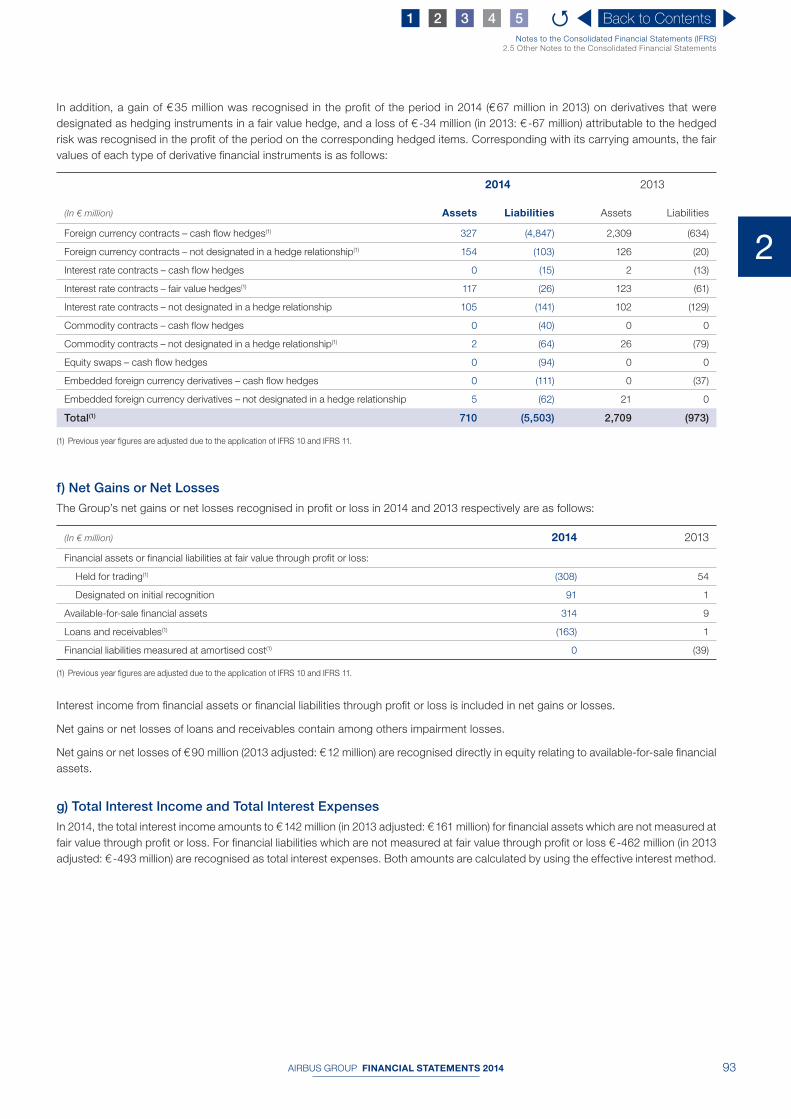
AIRBUS GROUP FINANCIAL STATEMENTS 2014 93
2
Notes to the Consolidated Financial Statements (IFRS)2.5 Other Notes to the Consolidated Financial Statements
In addition, a gain of € 35 million was recognised in the profi t of the period in 2014 (€ 67 million in 2013) on derivatives that were
designated as hedging instruments in a fair value hedge, and a loss of € -34 million (in 2013: € -67 million) attributable to the hedged
risk was recognised in the profi t of the period on the corresponding hedged items. Corresponding with its carrying amounts, the fair
values of each type of derivative fi nancial instruments is as follows:
2014 2013
(In € million) Assets Liabilities Assets Liabilities
Foreign currency contracts – cash flow hedges(1) 327 (4,847) 2,309 (634)
Foreign currency contracts – not designated in a hedge relationship(1) 154 (103) 126 (20)
Interest rate contracts – cash flow hedges 0 (15) 2 (13)
Interest rate contracts – fair value hedges(1) 117 (26) 123 (61)
Interest rate contracts – not designated in a hedge relationship 105 (141) 102 (129)
Commodity contracts – cash flow hedges 0 (40) 0 0
Commodity contracts – not designated in a hedge relationship(1) 2 (64) 26 (79)
Equity swaps – cash flow hedges 0 (94) 0 0
Embedded foreign currency derivatives – cash flow hedges 0 (111) 0 (37)
Embedded foreign currency derivatives – not designated in a hedge relationship 5 (62) 21 0
Total(1) 710 (5,503) 2,709 (973)
(1) Previous year figures are adjusted due to the application of IFRS 10 and IFRS 11.
f) Net Gains or Net Losses
The Group’s net gains or net losses recognised in profi t or loss in 2014 and 2013 respectively are as follows:
(In € million) 2014 2013
Financial assets or financial liabilities at fair value through profit or loss:
Held for trading(1) (308) 54
Designated on initial recognition 91 1
Available-for-sale financial assets 314 9
Loans and receivables(1) (163) 1
Financial liabilities measured at amortised cost(1) 0 (39)
(1) Previous year figures are adjusted due to the application of IFRS 10 and IFRS 11.
Interest income from fi nancial assets or fi nancial liabilities through profi t or loss is included in net gains or losses.
Net gains or net losses of loans and receivables contain among others impairment losses.
Net gains or net losses of € 90 million (2013 adjusted: € 12 million) are recognised directly in equity relating to available-for-sale fi nancial
assets.
g) Total Interest Income and Total Interest Expenses
In 2014, the total interest income amounts to € 142 million (in 2013 adjusted: € 161 million) for fi nancial assets which are not measured at
fair value through profi t or loss. For fi nancial liabilities which are not measured at fair value through profi t or loss € -462 million (in 2013
adjusted: € -493 million) are recognised as total interest expenses. Both amounts are calculated by using the effective interest method.
Back to Contents54321 Q

AIRBUS GROUP FINANCIAL STATEMENTS 201494
Notes to the Consolidated Financial Statements (IFRS)2.5 Other Notes to the Consolidated Financial Statements
In 2014, compensation expense for Long-Term Incentive Plans including the effect of the equity swaps amounted to € 156 million (in
2013: € 439 million). For the SOPs, expenses were neither recognised in 2014 nor 2013. The fair value of units granted per vesting date
is as follows (LTIP plan 2014):
Expected vesting date FV of R estricted and Performance Units to be settled in cash
(In € per unit granted)
June 2018 37.23
June 2019 35.18
As of 31 December 2014 provisions of € 314 million (2013: € 473 million) relating to LTIP have been recognised.
The lifetime of the P erformance and Restricted Units is contractually fi xed (see within the description of the respective tranche). The
measurement is based on a Forward Pricing Model which is, next to other market data, mainly affected by the share price as of the
end of the reporting period (€ 41.35 as of 31 December 2014) and the lifetime of the units.
35. Share-Based Payment
a) Stock Option Plans (SOP) and Long-Term
Incentive Plans (LTIP)
Based on the authorisation given to it by the Shareholders’
Meetings, the Group’s Board of Directors approved stock option
plans in 2006, 2005 and 2004 (see dates below). These plans
provide to the Members of the Executive Committee as well as
to the Group’s senior management the grant of options for the
purchase of the Group’s shares.
For all of the Group’s Stock Option Plans, the granted exercise
price was exceeding the share price at grant date.
In 2014, 2013, 2012, 2011, 2010 and 2009, the Board of Directors
of the Company approved the granting of Performance Units and
Restricted Units in the Company. The grant of so called “units” will
not physically be settled in shares (except with regard to Group
Executive Committee Members) but represents a cash settled
plan in accordance with IFRS 2.
Due to the partial conversion of LTIP plans 2009-2011 end of
December 2012 and of LTIP plan 2012 end of February 2013
as well as LTIP 2013 end of February 2014, some Performance
Units granted to the Executive Committee Members have been
transformed to equity-settled plans. The respective grant dates
are for the LTIP 2009-2011 31 December 2012, for LTIP 2012
28 February 2013 and for LTIP 2013 28 February 2014. The fair
value at grant date is derived from the closing share price at
transformation date, which corresponds to € 29.50 for LTIP 2009-
2011, € 39.70 for LTIP 2012 and € 53.39 for LTIP 2013. 368,707 units
for the LTIP 2009-2011, 75,975 units for the LTIP 2012 and 64,700
units for LTIP 2013 were transformed into shares at the respective
grant dates. These shares are outstanding as of 31 December 2014
(for details please refer to the remuneration section of Note 36
“Related party transactions”).
In 2014, the Group decided to hedge the share price risk inherent
in the cash-settled LTIP units by entering in equity swaps whose
reference price is based on the Airbus Group share price. To
the extent that LTIP units are hedged, compensation expense
recognised for these units will effectively refl ect the reference price
fi xed under the equity swaps.
h) Impairment Losses
The following impairment losses on fi nancial assets are recognised in profi t or loss in 2014 and 2013 respectively:
(In € million) 2014 2013
Other investments and other long-term financial assets
Equity instruments (14) (27)
Customer financings (16) (19)
Other loans(1) (17) (10)
Trade receivables(1) (28) (46)
Total(1) (75) (102)
(1) Previous year figures are adjusted due to the application of IFRS 10 and IFRS 11.
Back to Contents54321 Q

AIRBUS GROUP FINANCIAL STATEMENTS 2014 95
2
Notes to the Consolidated Financial Statements (IFRS)2.5 Other Notes to the Consolidated Financial Statements
The principal characteristics of the options as at 31 December 2014 are summarised in the table below:
SOP 2004 SOP 2005 SOP 2006
Date of Shareholders’ Meeting 6 May 2003 11 May 2005 4 May 2006
Grant date 8 October 2004 9 December 2005 18 December 2006
Number of options granted 7,777,280 7,981,760 1,747,500
Number of options outstanding 0 1,729,141 511,570
Total number of eligible employees 1,495 1,608 221
Vesting conditions(1)
50% of options may be exercised after a period of two years (two years and four weeks for SOP 2004) from the date of grant of the options; 50% of options may be exercised as
of the third anniversary of the date of grant of the options (subject to specific provisions contained in the Insider Trading Rules — see “Part 2/3.1.3 Governing Law — Dutch Regulations”)
Expiry date 7 October 2014 8 December 2015 16 December 2016
Conversion right One option for one share
Vested(2), (3) 100% 100% 100%
Exercise price € 24.32 € 33.91 € 25.65
Exercise price conditions 110% of fair market value of the shares at the date of grant
Number of exercised options 5,034,613 3,536,793 1,034,750
(1) As regards to the SOP 2005, part of the options granted to the Group’s top Executives are performance related.
(2) As regards the SOP 2004, vesting of part of the options granted to the Group’s top Executives was subject to performance conditions. As a result, part of these conditional options
have not vested and were therefore forfeited during the year 2007.
(3) As regards the SOP 2005, vesting of part of the options granted to the Group’s top Executives was subject to performance conditions. As a result, part of these conditional options
have not vested and were therefore forfeited during the year 2008.
The following table summarises the development of the number of stock option and shares:
Tranches Number of Options
Options grantedBalance at 1 January Exercised Forfeited
Balance at 31 December
SOP 2004
2013 0 3,316,613 (2,148,520) (10,100) 1,157,993
2014 0 1,157,993 (976,348) (181,645) 0
SOP 2005
2013 0 5,333,695 (2,836,097) (47,601) 2,449,997
2014 0 2,449,997 (700,696) (20,160) 1,729,141
SOP 2006
2013 0 1,202,000 (490,375) (5,500) 706,125
2014 0 706,125 (194,375) 0 511,750
Total options for all Tranches 17,506,540 4,314,115 (1,871,419) (201,805) 2,240,891
The weighted average share price at the date of exercise for share options exercised in 2014 was € 50.06 (2013: € 41.74).
Back to Contents54321 Q

AIRBUS GROUP FINANCIAL STATEMENTS 201496
Notes to the Consolidated Financial Statements (IFRS)2.5 Other Notes to the Consolidated Financial Statements
The principal characteristics of the P erformance and Restricted Units of the LTIPs as at 31 December 2014 are summarised below:
LTIP 2009 LTIP 2010 LTIP 2011 LTIP 2012 LTIP 2013 LTIP 2014
Grant date 13 November 2009 10 November 2010 9 November 2011 13 December 2012 17 December 2013(3) 13 November 2014
Performance and Restricted Unit plan
Units Performance Restricted Performance Restricted Performance Restricted Performance Restricted Performance Restricted Performance Restricted
Number of units granted(1), (2) 2,697,740 928,660 2,891,540 977,780 2,606,900 880,225 2,119,160 621,980 1,241,020 359,760 1,100,620 292,580
Number of units outstanding 0 0 1,919,982 456,400 2,496,688 841,950 2,065,012 600,740 1,229,660 355,640 1,100,620 292,580
Total number of eligible beneficiaries 1,749 1,711 1,771 1,797 1,709 1,621
Vesting conditions
The P erformance and Restricted Units will vest if the participant is still employed by a Group company at the respective vesting dates and, in the case of Performance Units, upon achievement of mid-term business performance.
Vesting schedule is made up of 4 payments (for the LTIP 2014 2 payments) over two years.
Vesting dates
25% each:in May 2013;
in November 2013;in May 2014;
in November 2014.
25% each:in May 2014;
in November 2014;25% each expected:
in May 2015;in November 2015.
25% each expected:in May 2015;
in November 2015;in May 2016;
in November 2016.
25% each expected:in May 2016;
in November 2016;in May 2017;
in November 2017.
25% each expected:in May 2017;
in November 2017;in May 2018;
in November 2018.
50% each expected:in June 2018;in June 2019.
Number of vested units 3,133,644 898,855 1,795,100 467,640 2,500 4,375 1,000 2,800 0 0 0 0
(1) Based on 100% target performance achievement. A minimum of 50% of Performance Units will vest; 100% in case of on-target performance achievement; up to a maximum of 150%
in case of overachievement of performance criteria. In case of absolute negative results (cumulative EBIT* of the Group) during the performance period, the Board can decide to
review the vesting of the Performance Units including the 50% portion which is not subject to performance conditions (additional vesting condition).
(2) Apart from the 150% performance achievement level, the share price at the vesting dates will be limited for performance as well as Restricted Units to € 55.66 (for LTIP 2012), € 92.34
(for LTIP 2013) and € 94.40 (for LTIP 2014), which corresponds to 200% of the respective reference share price. Overall, the pay-out for Performance Units is limited to a total amount
of 250% of the units originally granted, each valued with the respective reference share price of € 27.83 (for LTIP 2012), € 46.17 (for LTIP 2013) and € 47.45 (for LTIP 2014).
(3) Date, when the vesting conditions were determined.
Back to Contents54321 Q

AIRBUS GROUP FINANCIAL STATEMENTS 2014 97
2
Notes to the Consolidated Financial Statements (IFRS)2.5 Other Notes to the Consolidated Financial Statements
The development of the number of units (including units to be provided in shares) is set out below:
Tranches Number of Units
Units granted and add. grant
Balance at 1 January Vested Forfeited Re-evaluation
Balance at 31 December
LTIP 2009
Performance Units in 2013(1) 0 2,579,920 (1,506,438) (42,204) 592,628 1,623,906
Performance Units in 2014 0 1,623,906 (1,618,056) (5,850) 0 0
Restricted Units in 2013 0 903,820 (449,390) (6,880) 0 447,550
Restricted Units in 2014 0 447,550 (445,305) (2,245) 0 0
Total units 3,626,400 2,071,456 (2,063,361) (8,095) 0 0
LTIP 2010
Performance Units in 2013 0 2,835,240 (2,800) (73,800) 0 2,758,640
Performance Units in 2014(2) 0 2,758,640 (1,792,300) (37,454) 991,096 1,919,982
Restricted Units in 2013 0 947,160 (700) (3,400) 0 943,060
Restricted Units in 2014 0 943,060 (466,240) (20,420) 0 456,400
Total units(2) 3,869,320 3,701,700 (2,258,540) (57,874) 991,096 2,376,382
LTIP 2011
Performance Units in 2013(3) 14,900 2,574,850 (2,500) (40,300) 0 2,532,050
Performance Units in 2014(3) 3,050 2,535,100 0 (38,412) 0 2,496,688
Restricted Units in 2013(3) 2,475 879,600 (3,125) (12,325) 0 864,150
Restricted Units in 2014 0 864,150 (625) (21,575) 0 841,950
Total units 3,487,125 3,399,250 (625) (59,987) 0 3,338,638
LTIP 2012
Performance Units in 2013 0 2,119,160 (1,000) (12,000) 0 2,106,160
Performance Units in 2014 0 2,106,160 0 (41,148) 0 2,065,012
Restricted Units in 2013 0 621,980 (2,800) (2,920) 0 616,260
Restricted Units in 2014 0 616,260 0 (15,520) 0 600,740
Total units 2,741,140 2,722,420 0 (56,668) 0 2,665,752
LTIP 2013
Performance Units in 2013 1,241,020 0 0 0 0 1,241,020
Performance Units in 2014 0 1,241,020 0 (11,360) 0 1,229,660
Restricted Units in 2013 359,760 0 0 0 0 359,760
Restricted Units in 2014 0 359,760 0 (4,120) 0 355,640
Total units 1,600,780 1,600,780 0 (15,480) 0 1,585,300
(1) As re-evaluation is based on 123% performance achievement for the remaining outstanding Performance Units at 1st vesting.
(2) Re-evaluation is based on 136% performance achievement for the remaining outstanding Performance Units at 1st vesting.
(3) Units granted correspond to additional P erformance and Restricted Units granted for the LTIP 2011.
The outstanding units for the LTIP 2014 as at 31 December 2014 correspond to the number of units at grant date.
b) Employee Stock Ownership Plan (ESOP)
An ESOP for 2014 was not implemented.
In 2013, the Board of Directors approved an additional ESOP.
Eligible employees were able to purchase a fi xed number of
previously unissued shares at fair value (10, 30, 50, 100, 200 or
400 shares). The Group matched each fi xed number of shares with
a number of free Airbus Group shares based on a determining
ratio (10, 20, 30, 43, 67 and 107 free shares, respectively). During
a lockup period of at least one year or, provided the purchase took
place in the context of a mutual fund (regular saving plan), of fi ve
years, employees are restricted from selling the shares, but have
the right to receive all dividends paid. Employees who purchased
directly Airbus Group shares have in addition the ability to vote
at the Annual Shareholder Meetings. The subscription price was
equal to the closing price at the Paris stock exchange on 29 May
2013 and amounted to € 44.20. Investing through the mutual fund
led to a price which corresponds to the average price at the Paris
stock exchange during the 20 days immediately preceding 29 May
2013, resulting in a price of € 42.02. The Group issued and sold
Back to Contents54321 Q
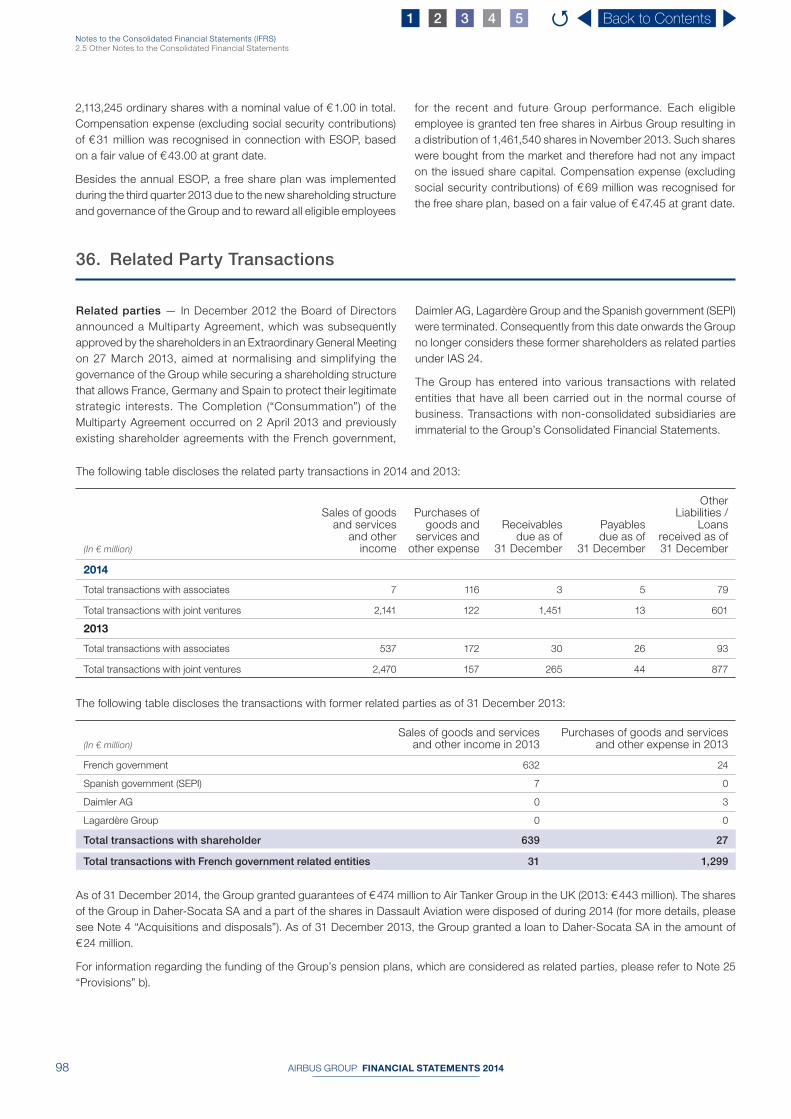
AIRBUS GROUP FINANCIAL STATEMENTS 201498
Notes to the Consolidated Financial Statements (IFRS)2.5 Other Notes to the Consolidated Financial Statements
36. Related Party Transactions
Related parties — In December 2012 the Board of Directors
announced a Multiparty Agreement, which was subsequently
approved by the shareholders in an Extraordinary General Meeting
on 27 March 2013, aimed at normalising and simplifying the
governance of the Group while securing a shareholding structure
that allows France, Germany and Spain to protect their legitimate
strategic interests. The Completion (“Consummation”) of the
Multiparty Agreement occurred on 2 April 2013 and previously
existing shareholder agreements with the French government,
Daimler AG, Lagardère Group and the Spanish government (SEPI)
were terminated. Consequently from this date onwards the Group
no longer considers these former shareholders as related parties
under IAS 24.
The Group has entered into various transactions with related
entities that have all been carried out in the normal course of
business. Transactions with non-consolidated subsidiaries are
immaterial to the Group’s Consolidated Financial Statements.
2,113,245 ordinary shares with a nominal value of € 1.00 in total.
Compensation expense (excluding social security contributions)
of € 31 million was recognised in connection with ESOP, based
on a fair value of € 43.00 at grant date.
Besides the annual ESOP, a free share plan was implemented
during the third quarter 2013 due to the new shareholding structure
and governance of the Group and to reward all eligible employees
for the recent and future Group performance. Each eligible
employee is granted ten free shares in Airbus Group resulting in
a distribution of 1,461,540 shares in November 2013. Such shares
were bought from the market and therefore had not any impact
on the issued share capital. Compensation expense (excluding
social security contributions) of € 69 million was recognised for
the free share plan, based on a fair value of € 47.45 at grant date.
The following table discloses the related party transactions in 2014 and 2013:
(In € million)
Sales of goods and services
and other income
Purchases of goods and
services and other expense
Receivables due as of
31 December
Payables due as of
31 December
Other Liabilities /
Loans received as of 31 December
2014
Total transactions with associates 7 116 3 5 79
Total transactions with joint ventures 2,141 122 1,451 13 601
2013
Total transactions with associates 537 172 30 26 93
Total transactions with joint ventures 2,470 157 265 44 877
The following table discloses the transactions with former related parties as of 31 December 2013:
(In € million)
Sales of goods and services and other income in 2013
Purchases of goods and services and other expense in 2013
French government 632 24
Spanish government (SEPI) 7 0
Daimler AG 0 3
Lagardère Group 0 0
Total transactions with shareholder 639 27
Total transactions with French government related entities 31 1,299
As of 31 December 2014, the Group granted guarantees of € 474 million to Air Tanker Group in the UK (2013: € 443 million). The shares
of the Group in Daher-Socata SA and a part of the shares in Dassault Aviation were disposed of during 2014 (for more details, please
see Note 4 “Acquisitions and disposals”). As of 31 December 2013, the Group granted a loan to Daher-Socata SA in the amount of
€ 24 million.
For information regarding the funding of the Group’s pension plans, which are considered as related parties, please refer to Note 25
“Provisions” b).
Back to Contents54321 Q

AIRBUS GROUP FINANCIAL STATEMENTS 2014 99
2
Notes to the Consolidated Financial Statements (IFRS)2.5 Other Notes to the Consolidated Financial Statements
Remuneration — The annual remuneration and related compensation costs of all of key management personnel, i.e. N on-Executive
Board Members, Executive Board Members and Members of the Executive Committee, as expensed in the respective year can be
summarised as follows:
2014 2013
(In € million) Total Total
Executive Committee, incl. Executive Board Member(s)(1)
Salaries and other short-term benefits (including bonuses)(2) 23.2 23.1
Post-employment benefit costs(3) 8.7 6.0
Share-based remuneration (“LTIP award”)(4) 16.7 24.3
Termination benefits 4.1 0.0
Other benefits (incl. company cars, insurance) 0.6 0.5
Social Charges 4.9 4.5
58.2 58.4
Non-Executive Board Members
Short-term benefits(5) 1.5 1.7
1.5 1.7
Total expense recognised 59.7 60.1
(1) The Chief Executive Officer was the sole Executive Board Member in office as at 31 December of the respective year.
(2) Amount of bonuses is based on estimated performance achievement as at the balance sheet date and difference between previous year estimation and actual pay-out in the current year.
(3) Aggregated amount of current service and interest costs as well as interest cost on employees’ contributions related to the defined benefit obligation and contributions related to
defined contribution plans accounted for during respective fiscal year.
(4) The cash settled share based payment expense includes the associated hedge result.
(5) Non-Executive Board Members’ remuneration includes social charges.
Amount of the pension defi ned benefi t obligation of the Executive
Committee, including the Chief Executive Offi cer, at 31 December
2014 was € 81.6 million (2013: € 59.4 million). The disclosed defi ned
benefi t obligation refl ects the total outstanding balance for all
Executive Committee Members subject to a defi ned benefi t plan
and in charge at the end of the respective balance sheet date.
Outstanding short-term benefi ts (bonuses) at year end 2014 for
Executive Committee Members based on estimated performance
achievement at year end was € 14.9 million (2013: € 12.1 million).
Other benefits include expenses for Executive Committee
Members’ company cars and accident insurance. There were no
outstanding liabilities at 31 December 2014 or 2013 respectively.
The share-based payment expenses result from not yet forfeited
units granted to the Executive Committee Members under the Airbus
Group Long-Term Incentive Plans (LTIP) which are re-measured to
fair value as far as they are cash settled. In 2014, the Members of
the Executive Committee were granted 190,460 Performance Units
(2013: 203,000 units); the fair value of these Performance Units
at grant date was € 9.1 million (2013: € 10.9 million). Fair value of
outstanding LTIP balances end of 2014 for all Executive Committee
Members was € 18.8 million (2013: € 24.8 million).
In order to strengthen the alignment of Airbus Group top
management with the long-term growth objectives of the
Company, the Board has requested Airbus Group Executive
Committee Members to acquire and to hold in the future Airbus
Group shares with a value equal to the individual annual contractual
remuneration consisting of “annual base salary” and “annual
variable remuneration (at 100% target level)”. The Board has not
set a specifi c time delay to acquire the requested number of Airbus
Group shares but expects Executive Committee Members to use
specifi cally gains from Airbus Group LTIP plans to achieve this
goal in a timely manner.
Also basing on the intention of the Board of Directors to increase
the long-term commitment of Executive Committee Members
to the success of the Company the Board has authorised the
Executive Committee Members to opt for partial conversion of the
otherwise cash settled LTIP plans into share settled plans at each
grant date of any new LTIP requiring a minimum conversion rate
into equity settlement of 25% of total granted Performance Units.
By end of December 2012 each Executive Committee Member
individually determined the split of equity and cash settlement for
each of the formerly granted LTIP plans 2009, 2010 and 2011. By
the end of February 2013 and end of February 2014, Executive
Committee Members made the same choice for the 2012 plan
and 2013 plan respectively. By end of February 2015, Executive
Committee Members will accordingly decide on the split for the
2014 LTIP plan. After overall performance assessment of each of
the plans, the vesting dates as determined at initial grant date apply
to all cash settled Performance Units, however, units converted
into equity settlement only vest at the last of the vesting dates of
the respective plan.
Due to the partial conversion of LTIP plans 2009-2011 end of
December 2012 and of LTIP plan 2012 end of February 2013 total
outstanding LTIP liability for Executive Committee Members of
€ 5.0 million has been reclassifi ed to equity in 2013.
Back to Contents54321 Q

AIRBUS GROUP FINANCIAL STATEMENTS 2014100
Notes to the Consolidated Financial Statements (IFRS)2.5 Other Notes to the Consolidated Financial Statements
37. Earnings per Share
Basic earnings per share — Basic earnings per share are calculated by dividing profi t for the period attributable to equity owners of
the parent (Net income) by the weighted average number of issued ordinary shares during the year, excluding ordinary shares purchased
by the Group and held as treasury shares.
2014 2013
Profit for the period attributable to equity owners of the parent (Net income)(1) € 2,343 million € 1,473 million
Weighted average number of ordinary shares 782,962,385 792,466,862
Basic earnings per share(1) € 2.99 € 1.86
(1) Previous year figures are adjusted due to the application of IFRS 10 and IFRS 11.
PARTIAL CONVERSION OF GRANTED UNITS UNDER CASH-SETTLED LTIPS INTO EQUITY-SETTLED PLANS BY EXECUTIVE COMMITTEE MEMBERS
LTIP 2009(1), (2) LTIP 2010(1), (3) LTIP 2011(1) LTIP 2012(4) LTIP 2013(5)
Total number of units granted 343,180 413,984 263,500 275,900 203,000
Number of cash-settled units 210,644 263,228 178,085 199,925 138,300
Number of equity-settled units 132,536 150,756 85,415 75,975 64,700
(1) Partial conversion of cash settled plan into equity settled plan as at 31 December 2012.
(2) Including performance achievement of 123% for Performance Units under 2009 LTIP.
(3) Based on performance achievement of 136% for Performance Units under 2010 LTIP.
(4) Partial conversion of cash settled plan into equity settled plan as at 28 February 2013.
(5) Partial conversion of cash settled plan into equity settled plan as at 28 February 2014.
As all Airbus Group Stock Option Plans (“SOP”) vested before 2012
no related personnel expense was recognised in 2014 or in 2013.
In the case of contract termination, the Executive Committee
Members, including the Chief Executive Offi cer, are entitled to an
indemnity equal to 1.5 times the Total Annual Income (defi ned as
Base Salary and target Annual Variable remuneration). This rule
does however not apply if the contractor mandate is terminated
for cause or if the Executive Committee Member has reached
retirement age.
In 2014 a termination package has been granted to one Executive
Committee Member, the termination indemnity recognised was
€ 4.1 million of which € 2.4 million were paid in 2014 and remainder
was outstanding at year end and will be paid in 2015 and 2016.
The Executive Committee Members’ contracts include a non-
competition clause which applies for one year, and can be
extended at the Company’s initiative for a further year. The Board
of Directors has the discretion to invoke the extension of the
non-competition clause. The compensation for each year that
the non-competition clause applies is equal to 50% of the last
Total Annual Income (defi ned as Base Salary and Annual Variable
remuneration most recently paid) with respect to applicable local
legal requirements if any.
Past LTIP awards are maintained for good leavers, such as in the
case of retirement or if a mandate is not renewed by the Company
without cause. The vesting of LTIP awards is not accelerated. LTIP
awards are forfeited for Executives who leave the Company of their
own initiative, but this is subject to review by the Board of Directors.
Furthermore in 2014, the Company recognised € 3.6 million (2013:
€ 2.4 million) of high salary taxes for Executive Committee Members
subject to French tax jurisdictions under the Taxe sur les Hauts
Revenus, requiring for 2013 and 2014 exceptional 50% charges on
individual annual remuneration exceeding € 1 million. This amount
refl ects the Group’s best estimate of the chargeable amount by
end of 2014.
For more information in respect of remuneration of Directors,
see “Notes to the Company Financial Statements – Note 11:
“Remuneration ”.
Back to Contents54321 Q

AIRBUS GROUP FINANCIAL STATEMENTS 2014 101
2
Notes to the Consolidated Financial Statements (IFRS)2.5 Other Notes to the Consolidated Financial Statements
38. Number of Employees
The number of employees at 31 December 2014 is 138,622 as compared to 138,404 at 31 December 2013 (adjusted).
39. Auditor Fees
With reference to Section 2:382a(1) and (2) of the Netherlands Civil Code, the following fees for the fi nancial year 2014 have been
charged by KPMG to the Company, its subsidiaries and other consolidated entities:
KPMG
In € thousand In %
Audit
Audit process, certification and examination of individual and consolidated accounts 5,812 66.5
Additional tasks(1) 2,344 26.9
Sub-total 8,156 93.4
Other services as relevant
Legal, tax, employment 573 6.6
Sub-total 573 6.6
Total 8,729 100.0
(1) Mainly transaction related work.
In 2014, the Airbus Group was audited by KPMG only. Other audit fi rms have audit fees related to audit process, certifi cation and
examination of individual and consolidated accounts of € 6 million.
Diluted earnings per share — For the calculation of the diluted
earnings per share, the weighted average number of ordinary shares
is adjusted to assume conversion of all potential ordinary shares.
The Group’s categories of dilutive potential ordinary shares are
stock options and share-settled Performance Units for Executive
Committee Members relating to Long-Term Incentive Plans for 2009
to 2013. Since in 2014 the average price of Airbus Group shares
exceeded the exercise price of the 6th, 7th and 8th stock option plan
as well as the share-settled Performance Units (in 2013: the 5th,
6th, 7th and the 8th stock option plan), 1,193,364 shares related to
stock options (in 2013: 1,660,950 shares) were considered in the
calculation of diluted earnings per share.
2014 2013
Profit for the period attributable to equity owners of the parent (Net income)(1) € 2,343 million € 1,473 million
Weighted average number of ordinary shares (diluted) 784,155,749 794,127,812
Diluted earnings per share(1) € 2.99 € 1.85
(1) Previous year figures are adjusted due to the application of IFRS 10 and IFRS 11.
Back to Contents54321 Q

AIRBUS GROUP FINANCIAL STATEMENTS 2014102
Notes to the Consolidated Financial Statements (IFRS)2.5 Other Notes to the Consolidated Financial Statements
The following fees correspond to the fi nancial year 2013:
KPMG Ernst & Young Accountants LLP
In € thousand In % In € thousand In %
Audit
Audit process, certification and examination of individual and consolidated accounts 5,201 63.6 5,931 68.8
Additional tasks(1) 2,196 26.9 2,123 24.6
Sub-total 7,397 90.5 8,054 93.4
Other services as relevant
Legal, tax, employment 769 9.4 566 6.6
Information Technology 8 0.1 0 0.0
Sub-total 777 9.5 566 6.6
Total 8,174 100.0 8,620 100.0
(1) Mainly transaction related work.
Rheinmetall AG – A400M contract
On 18 December 2014, Rheinmetall AG and Airbus Defence and
Space have agreed on the conditions of the transfer of the A400M
Loadmaster Control Contract from Rheinmetall to Cassidian
Airborne Solutions GmbH (CAS). This non material transaction
involves the termination of the service level agreement between
the two companies and allows settling the claims between the
companies in relation to the A400M application software contract.
The agreements relative to this acquisition have become effective
on 1 January 2015. The overall purchase price of € 58.9 million
was paid on 2 January 2015.
Airbus Safran Launchers
On 14 January 2015, Airbus Group and Safran have completed
the fi rst phase of the integration process enabling Airbus Safran
Launchers to become operational (see Note 4 “Acquisitions and
disposals”).
They have engaged in the requisite consultation and approval
procedures with competition authorities, Arianespace and the two
Group’s works councils. The new organisational structure initially
comprises 450 people joining Airbus Safran Launchers from Airbus
Defence and Space, Herakles and Snecma as part of phase one.
This structure will be further developed and shall eventually bring
together all Airbus Group and Safran assets relating to launchers
and propulsion systems in addition to associated personnel
and shareholdings. The Company’s head offi ce is in Issy-les-
Moulineaux, near Paris (France).
Electronics Oostkamp
On 21 January 2015, Airbus Group and Parter Capital Group
AG signed a fi nal share purchase agreement to transfer 100% of
the shares of Cassidian Belgium N.V. for a total consideration of
€ 3.1 million (see Note 4 “Acquisitions and disposals”).
40. Events after the Reporting Date
These Consolidated Financial Statements have been authorised for issuance by the Board of Directors on 26 February 2015.
Back to Contents54321 Q

AIRBUS GROUP FINANCIAL STATEMENTS 2014 103
2
Notes to the Consolidated Financial Statements (IFRS)2.6 Appendix “Information on Principal Investments” – Consolidation Scope
2014 % 2013 % Company Head office
Airbus
F 100.00 F 100.00 AD Grundstückgesellschaft mbH & Co. KG Pullach i. Isartal (Germany)
F 60.00 F 60.00 Aero Equipement S.A.S. Boulogne-Billancourt (France)
F 100.00 F 100.00 Aerolia S.A.S. Toulouse (France)
F 100.00 F 100.00 AIFS (Cayman) Ltd Cayman Islands
F 100.00 F 100.00 AIFS Cayman Liquidity Ltd Cayman Islands
F 100.00 F 100.00 AIFS Leasing Company Ltd Dublin (Ireland)
F 100.00 F 100.00 Airbus (Beijing) Engineering Centre Company Ltd Beijing (China)
F 100.00 F 100.00Airbus (China) Enterprise Management
& Services Company Ltd Beijing (China)
F 100.00 F 100.00 Airbus (Tianjin) Delivery Center Ltd Tianjin (China)
E 51.00 E 51.00 Airbus (Tianjin) Final Assembly Company Ltd Tianjin (China)
E 51.00 E 51.00 Airbus (Tianjin) Jigs & Tools Company Ltd Tianjin (China)
F 100.00 F 100.00 Airbus (Tianjin) Logistics Company Ltd Tianjin (China)
F 100.00 Airbus Alabama, Inc. Mobile , AL (USA)
F 100.00 F 100.00 Airbus Americas Customer Services, Inc. Herndon, VA (USA)
F 100.00 F 100.00 Airbus Americas Engineering, Inc. Herndon, VA (USA)
F 100.00 F 100.00 Airbus Americas Sales, Inc. Herndon, VA (USA)
F 100.00 F 100.00 Airbus Americas, Inc. Herndon, VA (USA)
F 100.00 F 100.00 Airbus China Ltd Hong Kong (China)
F 100.00 F 100.00 Airbus China Ltd, Beijing Representative Office Beijing (China)
F 100.00 F 100.00 Airbus Corporate Jet Centre S.A.S. (ACJC) Toulouse (France)
F 100.00 F 100.00 Airbus Financial Service Unlimited Dublin (Ireland)
F 100.00 F 100.00 Airbus Flight Hour Services Ltd Dublin (Ireland)
F 100.00 F 100.00 Airbus Invest S.A.S. Blagnac (France)
F 100.00 F 100.00 Airbus Operations GmbH Hamburg (Germany)
F 100.00 F 100.00 Airbus Operations Ltd Filton (United Kingdom)
F 100.00 F 100.00 Airbus Operations S.A.S. Toulouse (France)
F 100.00 F 100.00 Airbus Operations S.L. Madrid (Spain)
F 100.00 F 100.00 Airbus ProSky S.A.S. Blagnac (France)
F 100.00 F 100.00 Airbus Real Estate Premium AEROTEC Nord GmbH & Co. KG Pullach i. Isartal (Germany)
F 100.00 F 100.00 Airbus S.A.S. Blagnac (France)
F 100.00 F 100.00 Airbus Transport International S.N.C. (ATI) Blagnac (France)
F 58.00 Alestis Aerospace S.L. La Rinconada (Spain)
F 100.00 Apsys S.A. Suresnes (France)
E 50.00 E 50.00 ATR Eastern Support Pte. Ltd Singapore (Singapore)
E 50.00 E 50.00 ATR G.I.E. Blagnac (France)
F: Fully consolidated. E: At equity consolidated.
The stated percentage of ownership relates to Airbus Group N.V.
* Only the parent company is stated in this list.
** Companies consolidated in two different segments.
2 .6 Appendix “Information on Principal Investments” – Consolidation Scope
Back to Contents54321 Q

AIRBUS GROUP FINANCIAL STATEMENTS 2014104
Notes to the Consolidated Financial Statements (IFRS)2.6 Appendix “Information on Principal Investments” – Consolidation Scope
2014 % 2013 % Company Head office
E 50.00 E 50.00 ATR India Customer Support Pte. Ltd Bangalore (India)
E 50.00 E 50.00 ATR International S.A.S. Blagnac (France)
E 50.00 E 50.00 ATR North America, Inc. Washington, VA (USA)
E 50.00 E 50.00 ATR North American Training Center, Inc. Montreal (Canada)
E 50.00 E 50.00 ATR South African Training Center (Proprietary) Ltd Illovo (South Africa)
E 50.00 E 50.00 ATR Training Center S.A.R.L. Blagnac (France)
E 50.00 E 50.00 ATRiam Capital Ltd Dublin (Ireland)
E 50.00 E 50.00 ATRium Mauritius Ltd Mauritius Island
F 100.00 F 100.00 Aviateur Finance Ltd Dublin (Ireland)
F 100.00 F 100.00 Aviateur International Ltd Dublin (Ireland)
F 100.00 F 100.00 CIMPA GmbH Hamburg (Germany)
F 100.00 F 100.00 CIMPA Ltd Bristol (United Kingdom)
F 100.00 CIMPA PLM Madrid (Spain)
F 100.00 F 100.00 CIMPA S.A.S. Blagnac (France)
F 100.00 F 100.00 Composites Atlantic Ltd Lunenburg (Canada)
F 100.00 F 100.00 CTC GmbH Stade (Germany)
F 100.00 F 100.00 EADS ATR S.A. Colomiers (France)
F 100.00 F 100.00 EADS Composites Aquitaine SAS Salaunes (France)
F 100.00 F 100.00 EADS Maroc Aviation Casablanca (Morocco)
F 100.00 F 100.00EADS Real Estate Premium AEROTEC
Augsburg GmbH & Co. KG Augsburg (Germany)
F 100.00 F 100.00 EADS Sogerma SAS Rochefort (France)
F 65.00 F 65.00 Elbe Flugzeugwerke GmbH Dresden (Germany)
E 30.00 Elson Ltd Hong Kong (China)
F 100.00 F 100.00 Eltra Aeronautics Pte Ltd Singapore (Singapore)
F 99.00 F 99.00 Eltra Aeronautique S.A.S. Marseille (France)
F 49.00 F 49.00 Eltra Beijing Outou Beijing (China)
F 100.00 F 100.00 Eltra Holdings Pte Ltd Singapore (Singapore)
F 100.00 F 100.00 Eltra Services Ltd Hong Kong (China)
E 50.00 E 50.00 Hua-Ou Aviation Support Centre Ltd Beijing (China)
E 50.00 E 50.00 Hua-Ou Aviation Training Centre Ltd Beijing (China)
F 100.00 F 100.00 IFR Skeyes SAS Colomiers (France)
F 100.00 F 100.00 Metron Aviation, Inc. Dulles, VA (USA)
F 100.00 F 100.00 Metron Holdings, Inc. Dulles, VA (USA)
E 33.00 E 33.00 Pesola Ltd São José dos Campos (Brazil)
F 74.90 F 74.90 PFW Aerospace AG Speyer (Germany)
F 100.00 F 100.00 Premium AEROTEC GmbH Augsburg (Germany)
F 100.00 Sat Air Group S.A.S. (formerly Airbus Invest 11) Blagnac (France)
F 100.00 F 100.00 Satair A/S Kastrup (Denmark)
F 100.00 F 100.00 Satair Pte Ltd Beijing Representative Office Beijing (China)
F 100.00 F 100.00 Satair Pte Ltd Singapore (Singapore)
F 100.00 F 100.00 Satair UK Ltd Heston (United Kingdom)
F 100.00 F 100.00 Satair USA, Inc. Atlanta, GA (USA)
F 100.00 F 100.00 SC Premium Aerotec SRL Brasov (Romania)
F: Fully consolidated. E: At equity consolidated.
The stated percentage of ownership relates to Airbus Group N.V.
* Only the parent company is stated in this list.
** Companies consolidated in two different segments.
Back to Contents54321 Q

AIRBUS GROUP FINANCIAL STATEMENTS 2014 105
2
Notes to the Consolidated Financial Statements (IFRS)2.6 Appendix “Information on Principal Investments” – Consolidation Scope
2014 % 2013 % Company Head office
E 30.00 Sinelson Aero Tianjin (China)
E 34.00 E 34.00 Sopecaero Ltd São José dos Campos (Brazil)
F 100.00 F 100.00 Star Real Estate S.A.S. Toulouse (France)
E 29.50 E 29.50 Telair International Services Pte Ltd Singapore (Singapore)
Additionally consolidated are 39 SPEs.
Airbus Helicopters
F 100.00 F 100.00 AHD Real Estate GmbH & Co. KG Pullach i. Isartal (Germany)
F 100.00 F 100.00 Airbus Group Australia Pacific (NZ) Pty Limited Sydney (Australia)
F 100.00 F 100.00 Airbus Group Australia Pacific Holdings Pty Limited Bankstown (Australia)
F 100.00 F 100.00 Airbus Group Australia Pacific Limited Bankstown (Australia)
F 98.00 F 75.50 Airbus Helicopters (Thailand) Ltd Bangkok (Thailand)
F 100.00 F 100.00 Airbus Helicopters Canada Ltd Fort Erie, ON (Canada)
F 100.00 F 100.00 Airbus Helicopters Chile S.A. Santiago (Chile)
F 100.00 F 100.00 Airbus Helicopters Composites Pty Limited Sydney (Australia)
F 100.00 F 100.00 Airbus Helicopters Deutschland GmbH Donauwörth (Germany)
F 100.00 F 100.00 Airbus Helicopters España, SA Madrid (Spain)
F 100.00 F 100.00 Airbus Helicopters Financial Services Dublin (Ireland)
F 100.00 F 100.00 Airbus Helicopters Holding SAS Marignane (France)
F 100.00 F 100.00 Airbus Helicopters Inc. Grand Prairie, TX (USA)
F 100.00 F 100.00 Airbus Helicopters International Services Limited Dublin (Ireland)
F 100.00 F 100.00 Airbus Helicopters Japan Co. Ltd Tokyo (Japan)
F 100.00 F 100.00 Airbus Helicopters Korea Ltd Sacheon-si (South Korea)
F 100.00 F 100.00 Airbus Helicopters Malaysia SDN. BHD. Subang Selongor (Malaysia)
F 100.00 F 100.00 Airbus Helicopters Malaysia Simulation Center SDN. BHD Subang Selongor (Malaysia)
F 99.99 F 99.99 Airbus Helicopters México Querétaro, S.A. de C.V. Queré taro (Mexico)
F 100.00 F 100.00 Airbus Helicopters México, S.A. de C.V. Mexico D.F. (Mexico)
F 100.00 F 100.00 Airbus Helicopters RG Japan Co. Ltd Tokyo (Japan)
F 95.00 F 95.00 Airbus Helicopters SAS Marignane (France)
F 75.00 F 75.00 Airbus Helicopters Southeast Asia Pte Ltd Singapore (Singapore)
F 100.00 F 100.00 Airbus Helicopters Southern Africa (Pty) Limited Lanseria (South Africa)
F 100.00 F 100.00 Airbus Helicopters Training Services SAS Marignane (France)
F 100.00 F 100.00 Airbus Helicopters UK Ltd Oxford (United Kingdom)
F 100.00 F 100.00 Airbus Helicopters Vostok LLC Moscow (Russia)
F 100.00 F 100.00 Australian Aerospace Military Maintenance Brisbane (Australia)
F 100.00 F 100.00 EADS SECA Le Bourget (France)
F 100.00 F 100.00 Eurocopter Cono Sur S.A. Montevideo (Uruguay)
F 55.00 Fly Operational Curso E Formação de Pilotos Ltda Rio de Janeiro ( Braz il)
F 85.66 F 85.66 Helicopteros Do Brasil S.A. Itajuba (Brazil)
E 50.00 F 50.00 Heliescuela S.A.P.I. de C.V. Mexico D.F. (Mexico)
E 25.00 E 25.00 HFTS Helicopter Flight Training Services GmbH Hallbergmoos (Germany)
F 100.00 F 100.00 Motorflug Baden-Baden GmbH Baden-Baden (Germany)
F 100.00 Spaero Trade GmbH Rheinmünster (Germany)
F 100.00 F 100.00 The Sigma Aerospace Pension Trustee Ltd Croydon (United Kingdom)
F: Fully consolidated. E: At equity consolidated.
The stated percentage of ownership relates to Airbus Group N.V.
* Only the parent company is stated in this list.
** Companies consolidated in two different segments.
Back to Contents54321 Q
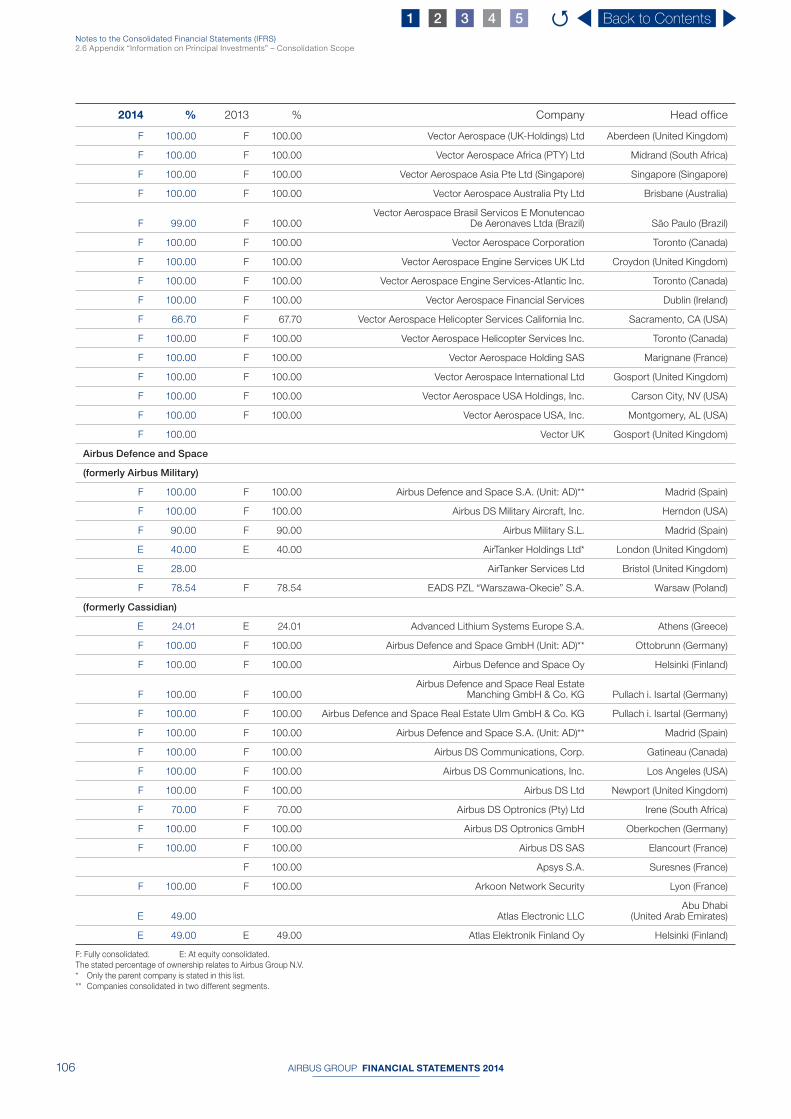
AIRBUS GROUP FINANCIAL STATEMENTS 2014106
Notes to the Consolidated Financial Statements (IFRS)2.6 Appendix “Information on Principal Investments” – Consolidation Scope
2014 % 2013 % Company Head office
F 100.00 F 100.00 Vector Aerospace (UK-Holdings) Ltd Aberdeen (United Kingdom)
F 100.00 F 100.00 Vector Aerospace Africa (PTY) Ltd Midrand (South Africa)
F 100.00 F 100.00 Vector Aerospace Asia Pte Ltd (Singapore) Singapore (Singapore)
F 100.00 F 100.00 Vector Aerospace Australia Pty Ltd Brisbane (Australia)
F 99.00 F 100.00Vector Aerospace Brasil Servicos E Monutencao
De Aeronaves Ltda (Brazil) São Paulo (Brazil)
F 100.00 F 100.00 Vector Aerospace Corporation Toronto (Canada)
F 100.00 F 100.00 Vector Aerospace Engine Services UK Ltd Croydon (United Kingdom)
F 100.00 F 100.00 Vector Aerospace Engine Services-Atlantic Inc. Toronto (Canada)
F 100.00 F 100.00 Vector Aerospace Financial Services Dublin (Ireland)
F 66.70 F 67.70 Vector Aerospace Helicopter Services California Inc. Sacramento, CA (USA)
F 100.00 F 100.00 Vector Aerospace Helicopter Services Inc. Toronto (Canada)
F 100.00 F 100.00 Vector Aerospace Holding SAS Marignane (France)
F 100.00 F 100.00 Vector Aerospace International Ltd Gosport (United Kingdom)
F 100.00 F 100.00 Vector Aerospace USA Holdings, Inc. Carson City, NV (USA)
F 100.00 F 100.00 Vector Aerospace USA, Inc. Montgomery, AL (USA)
F 100.00 Vector UK Gosport (United Kingdom )
Airbus Defence and Space
(formerly Airbus Military)
F 100.00 F 100.00 Airbus Defence and Space S.A. (Unit: AD)** Madrid (Spain)
F 100.00 F 100.00 Airbus DS Military Aircraft, Inc. Herndon (USA)
F 90.00 F 90.00 Airbus Military S.L. Madrid (Spain)
E 40.00 E 40.00 AirTanker Holdings Ltd* London (United Kingdom)
E 28.00 AirTanker Services Ltd Bristol (United Kingdom)
F 78.54 F 78.54 EADS PZL “Warszawa-Okecie” S.A. Warsaw (Poland)
(formerly Cassidian)
E 24.01 E 24.01 Advanced Lithium Systems Europe S.A. Athens (Greece)
F 100.00 F 100.00 Airbus Defence and Space GmbH (Unit: AD)** Ottobrunn (Germany)
F 100.00 F 100.00 Airbus Defence and Space Oy Helsinki (Finland)
F 100.00 F 100.00Airbus Defence and Space Real Estate
Manching GmbH & Co. KG Pullach i. Isartal (Germany)
F 100.00 F 100.00 Airbus Defence and Space Real Estate Ulm GmbH & Co. KG Pullach i. Isartal (Germany)
F 100.00 F 100.00 Airbus Defence and Space S.A. (Unit: AD)** Madrid (Spain)
F 100.00 F 100.00 Airbus DS Communications, Corp. Gatineau (Canada)
F 100.00 F 100.00 Airbus DS Communications, Inc. Los Angeles (USA)
F 100.00 F 100.00 Airbus DS Ltd Newport (United Kingdom)
F 70.00 F 70.00 Airbus DS Optronics (Pty) Ltd Irene (South Africa)
F 100.00 F 100.00 Airbus DS Optronics GmbH Oberkochen (Germany)
F 100.00 F 100.00 Airbus DS SAS Elancourt (France)
F 100.00 Apsys S.A. Suresnes (France)
F 100.00 F 100.00 Arkoon Network Security Lyon (France)
E 49.00 Atlas Electronic LLCAbu Dhabi
(United Arab Emirates)
E 49.00 E 49.00 Atlas Elektronik Finland Oy Helsinki (Finland)
F: Fully consolidated. E: At equity consolidated.
The stated percentage of ownership relates to Airbus Group N.V.
* Only the parent company is stated in this list.
** Companies consolidated in two different segments.
Back to Contents54321 Q

AIRBUS GROUP FINANCIAL STATEMENTS 2014 107
2
Notes to the Consolidated Financial Statements (IFRS)2.6 Appendix “Information on Principal Investments” – Consolidation Scope
2014 % 2013 % Company Head office
E 49.00 E 49.00 Atlas Elektronik GmbH Bremen (Germany)
E 49.00 E 49.00 Atlas Elektronik Pty. Ltd Macquarie Park (Australia)
E 49.00 E 49.00 Atlas Elektronik UK (Holdings) LtdWinfrith Newburgh
(United Kingdom)
E 49.00 E 49.00 Atlas Elektronik UK LtdWinfrith Newburgh
(United Kingdom)
E 49.00 E 49.00 Atlas Hydrographic GmbH Bremen (Germany)
E 49.00 E 49.00 Atlas Maridan ApS Horsholm (Denmark)
E 49.00 E 49.00 Atlas Naval Engineering Company Kyungnam (South Korea)
E 24.01 E 24.01 Atlas Naval Support Centre Ltd Bangkok (Thailand)
E 49.00 E 49.00 Atlas Naval Systems Malaysia Sdn. Bhd. Lumut, Perak (Malaysia)
E 49.00 E 49.00 Atlas North America LLC Virginia Beach, VA (USA)
F 43.89 F 43.89 Aviation Defense Service S.A. Saint-Gilles (France)
E 37.50 E 37.50 Bayern-Chemie Gesellschaft für flugchemische Antriebe mbH Aschau/Inn (Germany)
F 51.00 F 51.00 Cassidian Airborne Solutions GmbH Bremen (Germany)
F 100.00 F 100.00 Cassidian Aviation Training Services S.A.S. Elancourt (France)
F 100.00 F 100.00 Cassidian Belgium N.V. Oostkamp (Belgium)
F 100.00 F 100.00 Cassidian Communications GmbH Ulm (Germany)
F 100.00 F 100.00 Cassidian Cybersecurity GmbH Ottobrunn (Germany)
F 100.00 F 100.00 Cassidian Cybersecurity Limited Cheltenham (United Kingdom)
F 100.00 F 100.00 Cassidian Cybersecurity S.A.S. Elancourt (France)
F 100.00 F 100.00 Cassidian Ltd – Holding Newport (United Kingdom)
F 100.00 F 100.00 Cassidian Mexico SA de C.V. Colonia Noche Buena (Mexico)
F 100.00 F 100.00 Cassidian Saudi Ltd Riyadh (Saudi Arabia)
F 100.00 F 100.00 Cassidian Solutions S.A.U. Madrid (Spain)
F 100.00 Cassidian Test & Services Ltd Wimborne (United Kingdom)
F 100.00 Cassidian Test & Services S.A.S. Elancourt (France)
E 19.60 E 19.60 Cybicom Atlas Defence Pty. Ltd Umhlanga Rocks (South Africa)
F 100.00 F 100.00 Dornier Consulting GmbH Berlin (Germany)
F 100.00 F 100.00 EADS Operations & Services UK Ltd Newport (United Kingdom)
F 92.00 F 92.00 Equipo de Planta de Mexico, S.A. de C.V. Tijuana (Mexico)
E 30.00 E 30.00 ESG Elektroniksystem- und Logistikgesellschaft mbH Munich (Germany)
E 24.50 ET Marinesysteme GmbH Wilhelmshaven (Germany)
F 100.00 F 100.00 Fairchild Controls Corporation Frederick, MD (USA)
F 100.00 Get Electronique S.A.S. Castres (France)
F 75.00 F 75.00 GEW Integrated Systems (Pty) Ltd Silverton (South Africa)
F 75.00 F 75.00 GEW Technologies (Pty) Ltd Brummeria (South Africa)
F 100.00 F 100.00 GFD GmbH Hohn (Germany)
E 49.00 E 49.00 Hagenuk Marinekommunikation GmbH Flintbek (Germany)
E 37.50 Horizon Land Limited Stevenage (United Kingdom)
E 50.00 E 50.00 Maîtrise d’Oeuvre Système S.A.S. Issy-les-Moulineaux (France)
E 37.50 E 37.50 Matra Electronique Le Plessis-Robinson (France)
E 49.00 E 49.00 Matrium GmbH Karlsruhe (Germany)
E 37.50 E 37.50 MBDA Deutschland GmbH Schrobenhausen (Germany)
F: Fully consolidated. E: At equity consolidated.
The stated percentage of ownership relates to Airbus Group N.V.
* Only the parent company is stated in this list.
** Companies consolidated in two different segments.
Back to Contents54321 Q

AIRBUS GROUP FINANCIAL STATEMENTS 2014108
Notes to the Consolidated Financial Statements (IFRS)2.6 Appendix “Information on Principal Investments” – Consolidation Scope
2014 % 2013 % Company Head office
E 37.50 E 37.50 MBDA España S.L. Madrid (Spain)
E 37.50 E 37.50 MBDA France S.A.S. Paris (France)
E 75.00 E 75.00 MBDA Holding S.A.S. Paris (France)
E 37.50 E 37.50 MBDA Insurance Ltd Dublin (Ireland)
E 37.50 E 37.50 MBDA International Ltd Stevenage (United Kingdom)
E 37.50 E 37.50 MBDA Italy SpA Rome (Italy)
E 37.50 MBDA Middle East FZE Dubai (United Arab Emirates)
E 37.50 E 37.50 MBDA S.A.S. Paris (France)
E 37.50 E 37.50 MBDA Services S.A. Paris (France)
E 37.50 E 37.50 MBDA Treasury Ltd Jersey (United Kingdom)
E 37.50 E 37.50 MBDA UAE Ltd Stevenage (United Kingdom)
E 37.50 E 37.50 MBDA UK Ltd Stevenage (United Kingdom)
E 37.50 E 37.50 MBDA, Inc. Westlack, CA (USA)
F 99.84 F 99.84 NETASQ S.A Villeneuve d’Asq (France)
E 26.80 Patria Oyj Helsinki (Finland)
F 80.00 F 80.00 Pentastar S.A. St Gilles (France)
F 100.00 F 100.00 Plant Holdings, Inc. Temecula, CA (USA)
F 100.00 F 100.00 Regency IT Group Limited Cheltenham (United Kingdom)
F 100.00 F 100.00 Regency IT Security Limited Cheltenham (United Kingdom)
E 18.75 E 18.75 Roxel S.A. Saint-Médard en Jalles (France)
E 79.60 E 79.60 Signalis GmbH Bremen (Germany)
E 79.60 E 79.60 Signalis Holding GmbH Unterschleißheim (Germany)
E 79.60 E 79.60 Signalis S.A.S. Bezons (France)
F 99.88 E 99.88 Skyrecon Systems S.A. Malakoff (France)
E 49.00 E 49.00 Sonartech Atlas Pty. Ltd Macquarie Park (Australia)
E 25.13 E 25.13 Taurus Systems GmbH Schrobenhausen (Germany)
E 37.50 E 37.50 TDW- Ges. für verteidigungstechnische Wirksysteme GmbH Schrobenhausen (Germany)
E 50.00 E 50.00 United Monolithic Semiconductors Holding* Orsay (France)
(formerly Astrium)
F 100.00 F 100.00 Airbus Defence and Space Italy Srl Rome (Italy)
F 100.00 F 100.00 Airbus Defence and Space Limited Stevenage (United Kingdom)
F 100.00 F 100.00 Airbus Defence and Space Netherlands B.V. Leiden (Netherlands)
F 100.00 F 100.00 Airbus Defence and Space SAS Les Mureaux (France)
F 99.88 F 99.81 Airbus DS Geo Australia Pty Ltd Bradon (Australia)
F 99.90 F 98.91 Airbus DS Geo Inc Chantilly, VA (USA)
F 99.90 F 98.91 Airbus DS Geo SA Toulouse (France)
F 100.00 F 100.00 Airbus DS GmbH Munich (Germany)
F 100.00 F 100.00 Airbus DS Government Solutions, Inc. Plano, TX (USA)
F 100.00 F 100.00 Airbus DS Holding France SAS Suresnes (France)
F 100.00 F 100.00 Airbus DS Holding SAS Suresnes (France)
F 100.00 F 100.00 Airbus DS Holdings B.V. Leiden (Netherlands)
F 100.00 F 100.00 Airbus DS SatCom Government, Inc Rockville, MD (USA)
F 100.00 F 100.00 Airbus DS Systems Holdings, Inc Rockville, MD (USA)
F 100.00 F 100.00 Astrium España S.L. Madrid (Spain)
F: Fully consolidated. E: At equity consolidated.
The stated percentage of ownership relates to Airbus Group N.V.
* Only the parent company is stated in this list.
** Companies consolidated in two different segments.
Back to Contents54321 Q
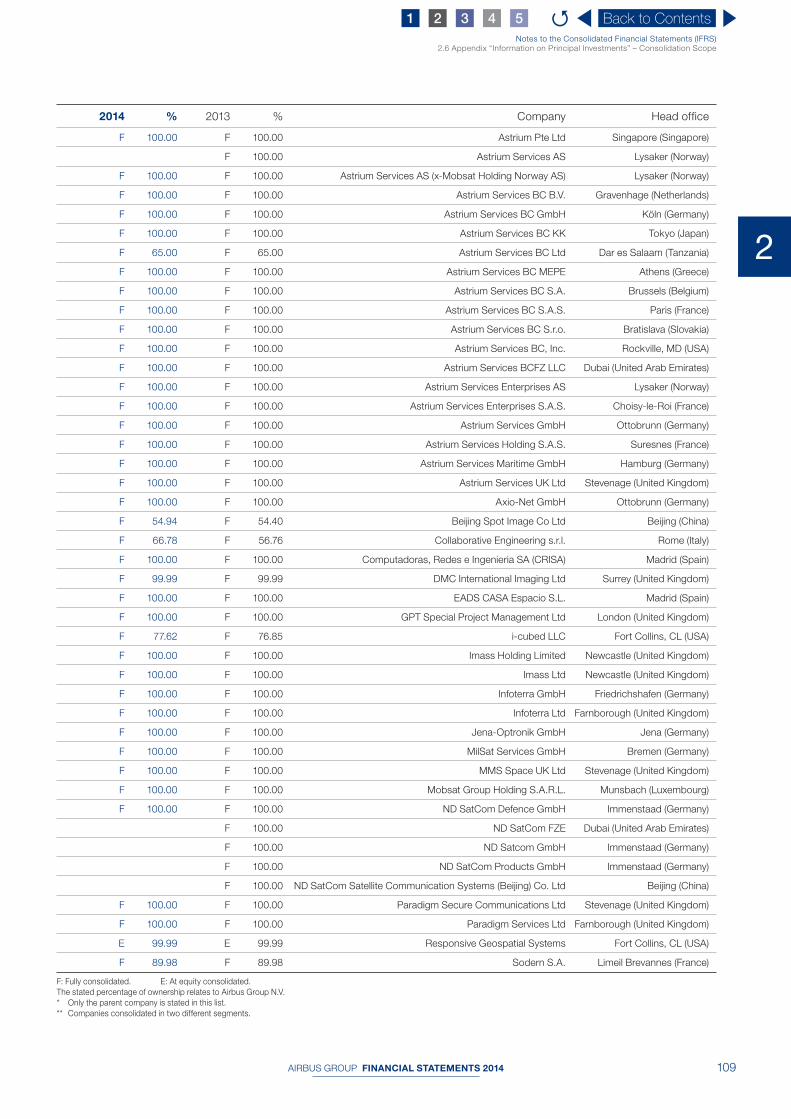
AIRBUS GROUP FINANCIAL STATEMENTS 2014 109
2
Notes to the Consolidated Financial Statements (IFRS)2.6 Appendix “Information on Principal Investments” – Consolidation Scope
2014 % 2013 % Company Head office
F 100.00 F 100.00 Astrium Pte Ltd Singapore (Singapore)
F 100.00 Astrium Services AS Lysaker (Norway)
F 100.00 F 100.00 Astrium Services AS (x-Mobsat Holding Norway AS) Lysaker (Norway)
F 100.00 F 100.00 Astrium Services BC B.V. Gravenhage (Netherlands)
F 100.00 F 100.00 Astrium Services BC GmbH Köln (Germany)
F 100.00 F 100.00 Astrium Services BC KK Tokyo (Japan)
F 65.00 F 65.00 Astrium Services BC Ltd Dar es Salaam (Tanzania)
F 100.00 F 100.00 Astrium Services BC MEPE Athens (Greece)
F 100.00 F 100.00 Astrium Services BC S.A. Brussels (Belgium)
F 100.00 F 100.00 Astrium Services BC S.A.S. Paris (France)
F 100.00 F 100.00 Astrium Services BC S.r.o. Bratislava (Slovakia)
F 100.00 F 100.00 Astrium Services BC, Inc. Rockville, MD (USA)
F 100.00 F 100.00 Astrium Services BCFZ LLC Dubai (United Arab Emirates)
F 100.00 F 100.00 Astrium Services Enterprises AS Lysaker (Norway)
F 100.00 F 100.00 Astrium Services Enterprises S.A.S. Choisy-le-Roi (France)
F 100.00 F 100.00 Astrium Services GmbH Ottobrunn (Germany)
F 100.00 F 100.00 Astrium Services Holding S.A.S. Suresnes (France)
F 100.00 F 100.00 Astrium Services Maritime GmbH Hamburg (Germany)
F 100.00 F 100.00 Astrium Services UK Ltd Stevenage (United Kingdom)
F 100.00 F 100.00 Axio-Net GmbH Ottobrunn (Germany)
F 54.94 F 54.40 Beijing Spot Image Co Ltd Beijing (China)
F 66.78 F 56.76 Collaborative Engineering s.r.l. Rome (Italy)
F 100.00 F 100.00 Computadoras, Redes e Ingenieria SA (CRISA) Madrid (Spain)
F 99.99 F 99.99 DMC International Imaging Ltd Surrey (United Kingdom)
F 100.00 F 100.00 EADS CASA Espacio S.L. Madrid (Spain)
F 100.00 F 100.00 GPT Special Project Management Ltd London (United Kingdom)
F 77.62 F 76.85 i-cubed LLC Fort Collins, CL (USA)
F 100.00 F 100.00 Imass Holding Limited Newcastle (United Kingdom)
F 100.00 F 100.00 Imass Ltd Newcastle (United Kingdom)
F 100.00 F 100.00 Infoterra GmbH Friedrichshafen (Germany)
F 100.00 F 100.00 Infoterra Ltd Farnborough (United Kingdom)
F 100.00 F 100.00 Jena-Optronik GmbH Jena (Germany)
F 100.00 F 100.00 MilSat Services GmbH Bremen (Germany)
F 100.00 F 100.00 MMS Space UK Ltd Stevenage (United Kingdom)
F 100.00 F 100.00 Mobsat Group Holding S.A.R.L. Munsbach (Luxembourg)
F 100.00 F 100.00 ND SatCom Defence GmbH Immenstaad (Germany)
F 100.00 ND SatCom FZE Dubai (United Arab Emirates)
F 100.00 ND Satcom GmbH Immenstaad (Germany)
F 100.00 ND SatCom Products GmbH Immenstaad (Germany)
F 100.00 ND SatCom Satellite Communication Systems (Beijing) Co. Ltd Beijing (China)
F 100.00 F 100.00 Paradigm Secure Communications Ltd Stevenage (United Kingdom)
F 100.00 F 100.00 Paradigm Services Ltd Farnborough (United Kingdom)
E 99.99 E 99.99 Responsive Geospatial Systems Fort Collins, CL (USA)
F 89.98 F 89.98 Sodern S.A. Limeil Brevannes (France)
F: Fully consolidated. E: At equity consolidated.
The stated percentage of ownership relates to Airbus Group N.V.
* Only the parent company is stated in this list.
** Companies consolidated in two different segments.
Back to Contents54321 Q
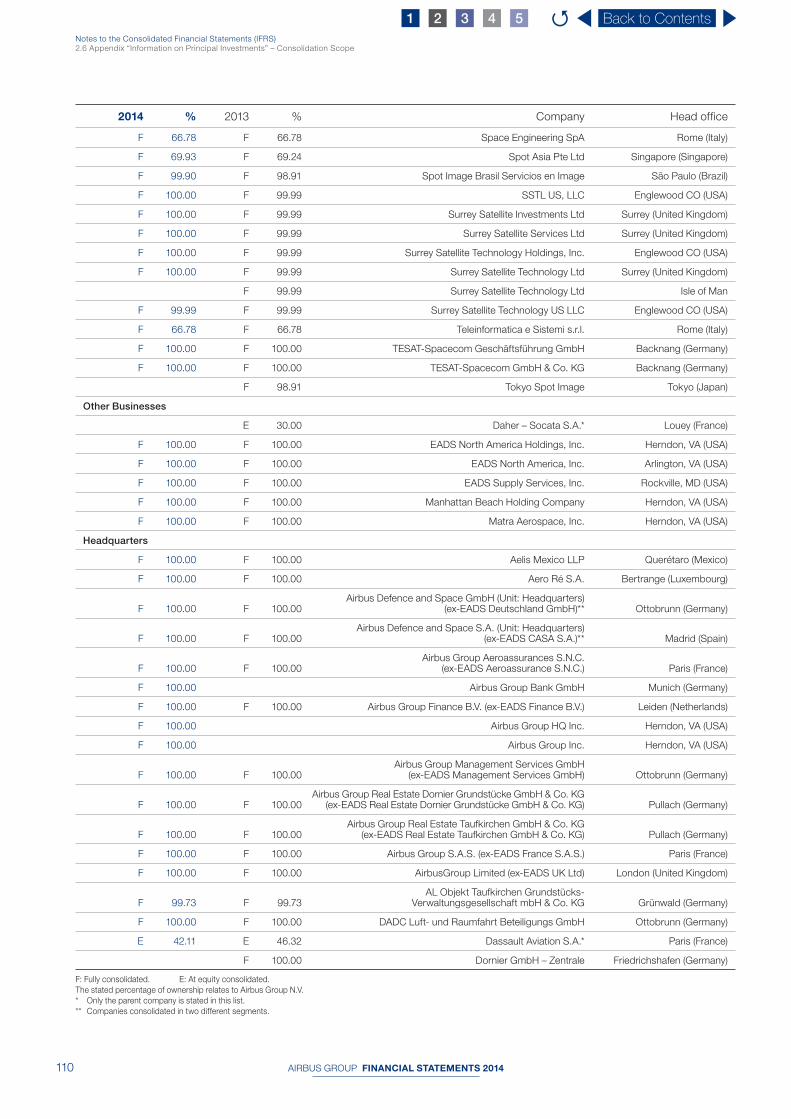
AIRBUS GROUP FINANCIAL STATEMENTS 2014110
Notes to the Consolidated Financial Statements (IFRS)2.6 Appendix “Information on Principal Investments” – Consolidation Scope
2014 % 2013 % Company Head office
F 66.78 F 66.78 Space Engineering SpA Rome (Italy)
F 69.93 F 69.24 Spot Asia Pte Ltd Singapore (Singapore)
F 99.90 F 98.91 Spot Image Brasil Servicios en Image São Paulo (Brazil)
F 100.00 F 99.99 SSTL US, LLC Englewood CO (USA)
F 100.00 F 99.99 Surrey Satellite Investments Ltd Surrey (United Kingdom)
F 100.00 F 99.99 Surrey Satellite Services Ltd Surrey (United Kingdom)
F 100.00 F 99.99 Surrey Satellite Technology Holdings, Inc. Englewood CO (USA)
F 100.00 F 99.99 Surrey Satellite Technology Ltd Surrey (United Kingdom)
F 99.99 Surrey Satellite Technology Ltd Isle of Man
F 99.99 F 99.99 Surrey Satellite Technology US LLC Englewood CO (USA)
F 66.78 F 66.78 Teleinformatica e Sistemi s.r.l. Rome (Italy)
F 100.00 F 100.00 TESAT-Spacecom Geschäftsführung GmbH Backnang (Germany)
F 100.00 F 100.00 TESAT-Spacecom GmbH & Co. KG Backnang (Germany)
F 98.91 Tokyo Spot Image Tokyo (Japan)
Other Businesses
E 30.00 Daher – Socata S.A.* Louey (France)
F 100.00 F 100.00 EADS North America Holdings, Inc. Herndon, VA (USA)
F 100.00 F 100.00 EADS North America, Inc. Arlington, VA (USA)
F 100.00 F 100.00 EADS Supply Services, Inc. Rockville, MD (USA)
F 100.00 F 100.00 Manhattan Beach Holding Company Herndon, VA (USA)
F 100.00 F 100.00 Matra Aerospace, Inc. Herndon, VA (USA)
Headquarters
F 100.00 F 100.00 Aelis Mexico LLP Querétaro (Mexico)
F 100.00 F 100.00 Aero Ré S.A. Bertrange (Luxembourg)
F 100.00 F 100.00Airbus Defence and Space GmbH (Unit: Headquarters)
(ex- EADS Deutschland GmbH)** Ottobrunn (Germany)
F 100.00 F 100.00Airbus Defence and Space S.A. (Unit: Headquarters)
(ex- EADS CASA S.A.)** Madrid (Spain)
F 100.00 F 100.00Airbus Group Aeroassurances S.N.C.
(ex- EADS Aeroassurance S.N.C.) Paris (France)
F 100.00 Airbus Group Bank GmbH Munich (Germany)
F 100.00 F 100.00 Airbus Group Finance B.V. (ex- EADS Finance B.V.) Leiden (Netherlands)
F 100.00 Airbus Group HQ Inc. Herndon, VA (USA)
F 100.00 Airbus Group Inc. Herndon, VA (USA)
F 100.00 F 100.00Airbus Group Management Services GmbH
(ex- EADS Management Services GmbH) Ottobrunn (Germany)
F 100.00 F 100.00Airbus Group Real Estate Dornier Grundstücke GmbH & Co. KG
(ex- EADS Real Estate Dornier Grundstücke GmbH & Co. KG) Pullach (Germany)
F 100.00 F 100.00Airbus Group Real Estate Taufkirchen GmbH & Co. KG
(ex- EADS Real Estate Taufkirchen GmbH & Co. KG) Pullach (Germany)
F 100.00 F 100.00 Airbus Group S.A.S. (ex- EADS France S.A.S.) Paris (France)
F 100.00 F 100.00 AirbusGroup Limited (ex- EADS UK Ltd) London (United Kingdom)
F 99.73 F 99.73AL Objekt Taufkirchen Grundstücks-
Verwaltungsgesellschaft mbH & Co. KG Grünwald (Germany)
F 100.00 F 100.00 DADC Luft- und Raumfahrt Beteiligungs GmbH Ottobrunn (Germany)
E 42.11 E 46.32 Dassault Aviation S.A.* Paris (France)
F 100.00 Dornier GmbH – Zentrale Friedrichshafen (Germany)
F: Fully consolidated. E: At equity consolidated.
The stated percentage of ownership relates to Airbus Group N.V.
* Only the parent company is stated in this list.
** Companies consolidated in two different segments.
Back to Contents54321 Q

AIRBUS GROUP FINANCIAL STATEMENTS 2014 111
2
Notes to the Consolidated Financial Statements (IFRS)2.6 Appendix “Information on Principal Investments” – Consolidation Scope
2014 % 2013 % Company Head office
F 100.00 F 100.00 EADS CASA France S.A.S. Paris (France)
F 100.00 F 100.00 Immobilière AELIS S.A.S. Paris (France)
F 100.00 F 100.00 LLC “EADS” Moscow (Russia)
F 100.00 F 100.00 Matra Défense S.A.S. Paris (France)
F 100.00 F 100.00 Matra Holding GmbH Kehl (Germany)
F 100.00 F 100.00 OBRA Grundstücks-Verwaltungsgesellschaft mbH Taufkirchen (Germany)
F: Fully consolidated. E: At equity consolidated.
The stated percentage of ownership relates to Airbus Group N.V.
* Only the parent company is stated in this list.
** Companies consolidated in two different segments.
Back to Contents54321 Q

AIRBUS GROUP FINANCIAL STATEMENTS 2014112
3
AIRBUS GROUP FINANCIAL STATEMENTS 2014 113
3Balance Sheet 114
Income Statement 115
Company Financial Statements
Back to Contents54321 Q
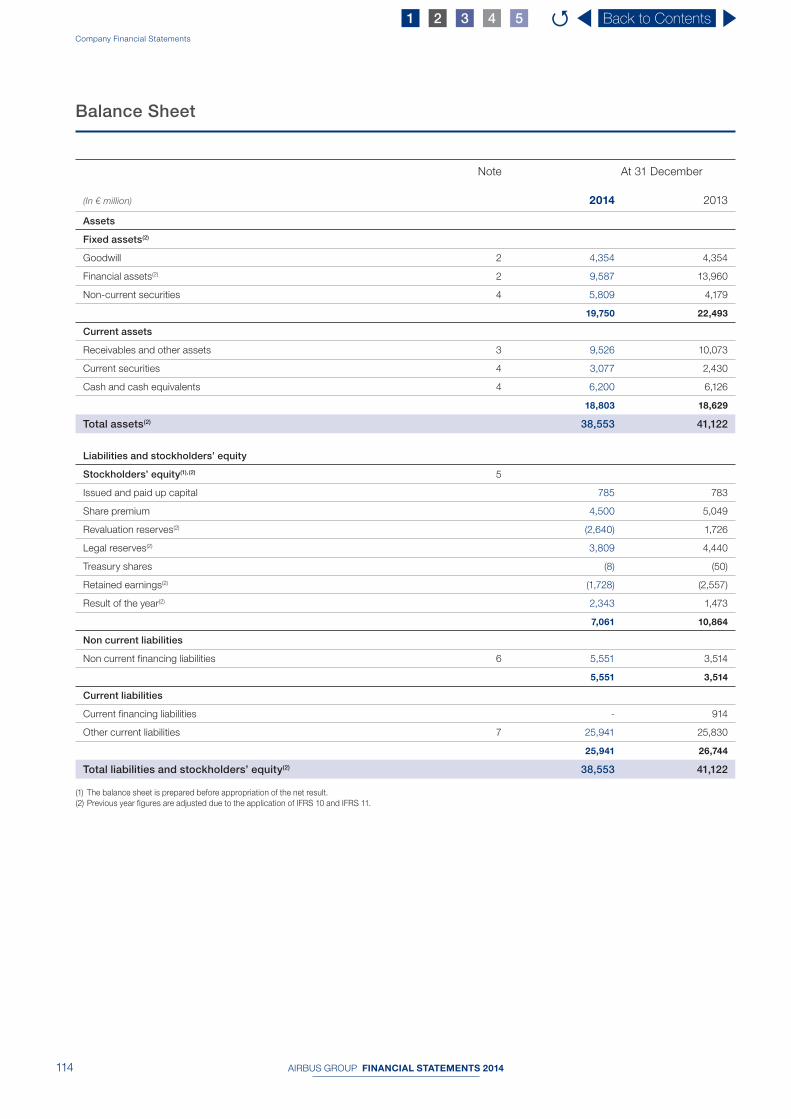
AIRBUS GROUP FINANCIAL STATEMENTS 2014114
Company Financial Statements
Balance Sheet
Note At 31 December
(In € million) 2014 2013
Assets
Fixed assets(2)
Goodwill 2 4,354 4,354
Financial assets(2) 2 9,587 13,960
Non-current securities 4 5,809 4,179
19,750 22, 493
Current assets
Receivables and other assets 3 9,526 10,073
Current securities 4 3,077 2,430
Cash and cash equivalents 4 6,200 6,126
18,803 18,629
Total assets(2) 38,553 41,122
Liabilities and stockholders’ equity
Stockholders’ equity(1), (2) 5
Issued and paid up capital 785 783
Share premium 4,500 5,049
Revaluation reserves(2) (2,640) 1,726
Legal reserves(2) 3,809 4,440
Treasury shares (8) (50)
Retained earnings(2) (1,728) (2,557)
Result of the year(2) 2,343 1,473
7,061 10,864
Non current liabilities
Non current financing liabilities 6 5,551 3,514
5,551 3,514
Current liabilities
Current financing liabilities - 914
Other current liabilities 7 25,941 25,830
25,941 26,744
Total liabilities and stockholders’ equity(2) 38,553 41,122
(1) The balance sheet is prepared before appropriation of the net result.
(2) Previous year figures are adjusted due to the application of IFRS 10 and IFRS 11.
Back to Contents54321 Q

AIRBUS GROUP FINANCIAL STATEMENTS 2014 115
3
Company Financial Statements
Income Statement
(In € million) 2014 2013
Income from investments(1 ) 2,412 1,474
Other results (69) (1)
Net result(1) 8 2,343 1,473
(1) Previous year figures are adjusted due to the application of IFRS 10 and IFRS 11.
Back to Contents54321 Q

AIRBUS GROUP FINANCIAL STATEMENTS 2014116
4
AIRBUS GROUP FINANCIAL STATEMENTS 2014 117
4
Notes to the Company Financial Statements
Back to Contents54321 Q
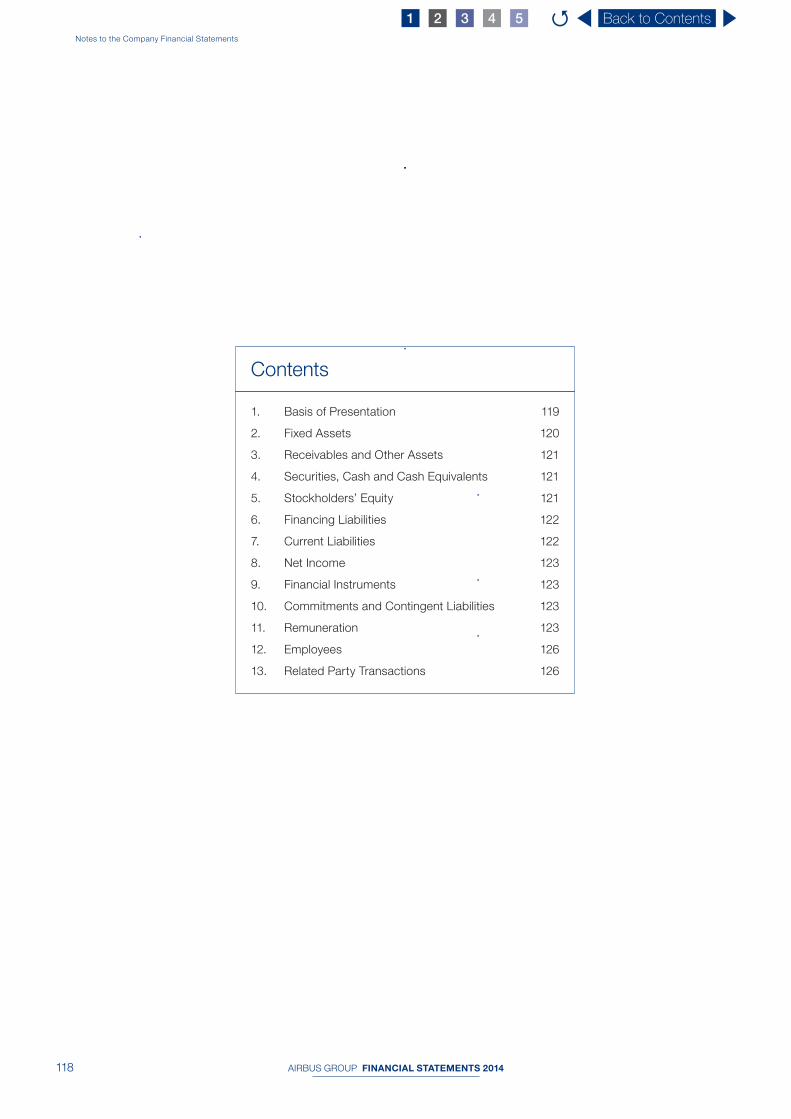
AIRBUS GROUP FINANCIAL STATEMENTS 2014118
Notes to the Company Financial Statements
1. Basis of Presentation 119
2. Fixed Assets 120
3. Receivables and Other Assets 121
4. Securities, Cash and Cash Equivalents 121
5. Stockholders’ Equity 121
6. Financing Liabilities 122
7. Current Liabilities 122
8. Net Income 123
9. Financial Instruments 123
10. Commitments and Contingent Liabilities 123
11. Remuneration 123
12. Employees 126
13. Related Party Transactions 126
Contents
Back to Contents54321 Q

AIRBUS GROUP FINANCIAL STATEMENTS 2014 119
4
Notes to the Company Financial Statements
1. Basis of P resentation
1.1 General
In the Annual General Meeting of 27 May 2014 the Company’s
Shareholders approved a resolution for amendment of Article 2,
paragraph 1 of the Company’s Articles of Association, to change
the name of the Company from European Aeronautic Defence
and Space Company EADS N.V. into Airbus Group N.V., effective
2 June 2014.
Airbus Group N.V., having its legal seat in Amsterdam, the
Netherlands, is engaged in the holding, coordinating and managing
of participations or other interests in and to fi nance and assume
liabilities, provide for security and/or guarantee debts of legal
entities, partnerships, business associations and undertakings
that are involved in the aeronautic, defence, space and/or
communication industry or activities that are complementary,
supportive or ancillary thereto.
The Company Financial Statements are part of the 2014
Consolidated Financial Statements of Airbus Group N.V.
The description of the Company’s activities and the Group
structure, as included in the Notes to the Consolidated Financial
Statements, also apply to the Company Financial Statements. In
accordance with Article 402 Book 2 of the Dutch Civil Code the
Income Statement is presented in abbreviated form.
1.2 Principles for the measurement of assets and
liabilities and the determination of the result
For setting the principles for the recognition and measurement
of assets and liabilities and determination of the result for its
Company Financial Statements, Airbus Group N.V. makes use of
the option provided in Section 2:362 (8) of the Netherlands Civil
Code. As from 2005, the Netherlands Civil Code allows that the
principles for the recognition and measurement of assets and
liabilities and determination of the result (hereinafter referred to
as principles for recognition and measurement) of the Company
Financial Statements of Airbus Group N.V. are the same as those
applied for the Consolidated EU-IFRS Financial Statements.
These Consolidated EU-IFRS Financial Statements are prepared
according to the standards laid down by the International Accounting
Standards Board and adopted by the European Union (herein
referred to as EU-IFRS). Please see Note 2 of the Consolidated
Financial Statements for a description of these principles.
Subsidiaries, over which signifi cant infl uence is exercised, are
stated on the basis of the Net Asset Value.
The share in the result of participating interests consists of the
share of Airbus Group N.V. in the result of these participating
interests. Results on transactions, where the transfer of assets and
liabilities between Airbus Group N.V. and its participating interests
and mutually between participating interests themselves, are not
incorporated insofar as they can be deemed to be unrealised.
Undistributed results from investments are included in the legal
reserves to the extent the Company cannot enforce dividend
distribution.
Back to Contents54321 Q
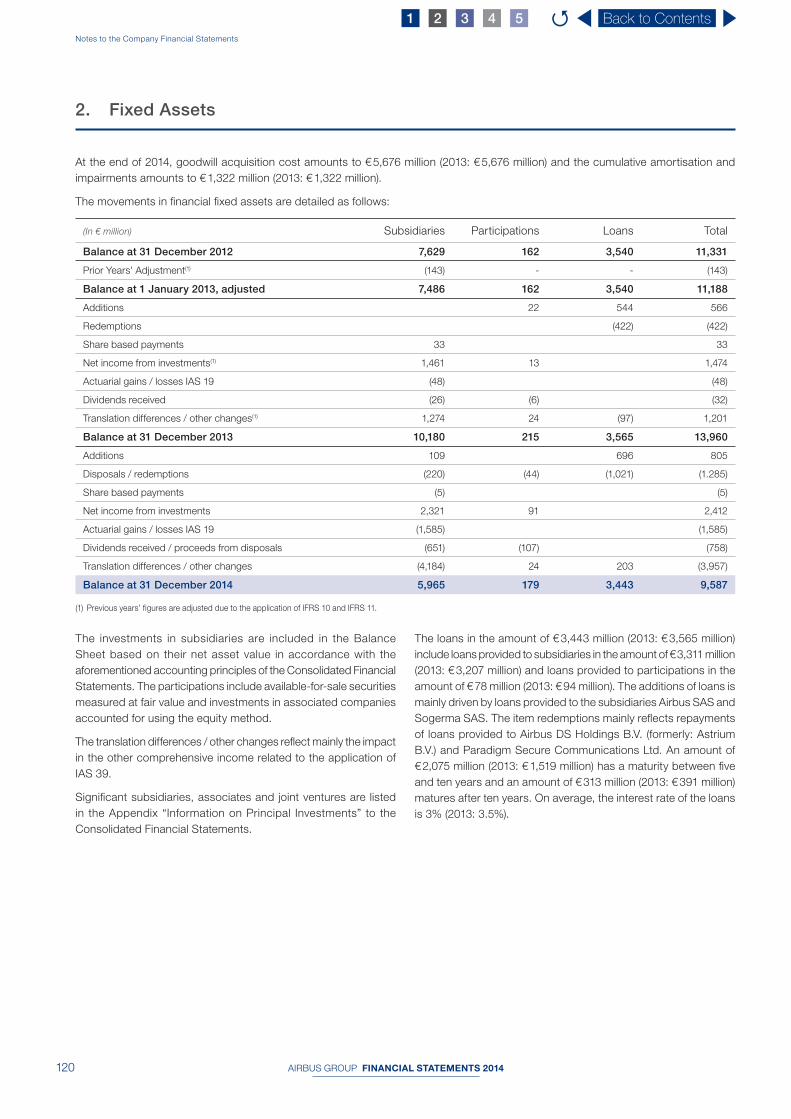
AIRBUS GROUP FINANCIAL STATEMENTS 2014120
Notes to the Company Financial Statements
The investments in subsidiaries are included in the Balance
Sheet based on their net asset value in accordance with the
aforementioned accounting principles of the Consolidated Financial
Statements. The participations include available-for-sale securities
measured at fair value and investments in associated companies
accounted for using the equity method.
The translation differences / other changes refl ect mainly the impact
in the other comprehensive income related to the application of
IAS 39.
Signifi cant subsidiaries, associates and joint ventures are listed
in the Appendix “Information on Principal Investments” to the
Consolidated Financial Statements.
The loans in the amount of € 3,443 million (2013: € 3,565 million)
include loans provided to subsidiaries in the amount of € 3,311 million
(2013: € 3,207 million) and loans provided to participations in the
amount of € 78 million (2013: € 94 million). The additions of loans is
mainly driven by loans provided to the subsidiaries Airbus SAS and
Sogerma SAS. The item redemptions mainly refl ects repayments
of loans provided to Airbus DS Holdings B.V. (formerly: Astrium
B.V.) and Paradigm Secure Communications Ltd. An amount of
€ 2,075 million (2013: € 1,519 million) has a maturity between fi ve
and ten years and an amount of € 313 million (2013: € 391 million)
matures after ten years. On average, the interest rate of the loans
is 3% (2013: 3.5%).
2. Fixed A ssets
At the end of 2014, goodwill acquisition cost amounts to € 5,676 million (2013: € 5,676 million) and the cumulative amortisation and
impairments amounts to € 1,322 million (2013: € 1,322 million).
The movements in fi nancial fi xed assets are detailed as follows:
(In € million) Subsidiaries Participations Loans Total
Balance at 31 December 2012 7,629 162 3,540 11,331
Prior Years’ Adjustment(1) (143) - - (143)
Balance at 1 January 2013, adjusted 7,486 162 3,540 11,188
Additions 22 544 566
Redemptions (422) (422)
Share based payments 33 33
Net income from investments(1) 1,461 13 1,474
Actuarial gains / losses IAS 19 (48) (48)
Dividends received (26) (6) (32)
Translation differences / other changes(1) 1,274 24 (97) 1,201
Balance at 31 December 2013 10,180 215 3,565 13,960
Additions 109 696 805
Disposals / redemptions (220) (44) (1,021) (1.285)
Share based payments (5) (5)
Net income from investments 2,321 91 2,412
Actuarial gains / losses IAS 19 (1,585) (1,585)
Dividends received / proceeds from disposals (651) (107) (758)
Translation differences / other changes (4,184) 24 203 (3,957)
Balance at 31 December 2014 5,965 179 3,443 9,587
(1) Previous years’ figures are adjusted due to the application of IFRS 10 and IFRS 11.
Back to Contents54321 Q
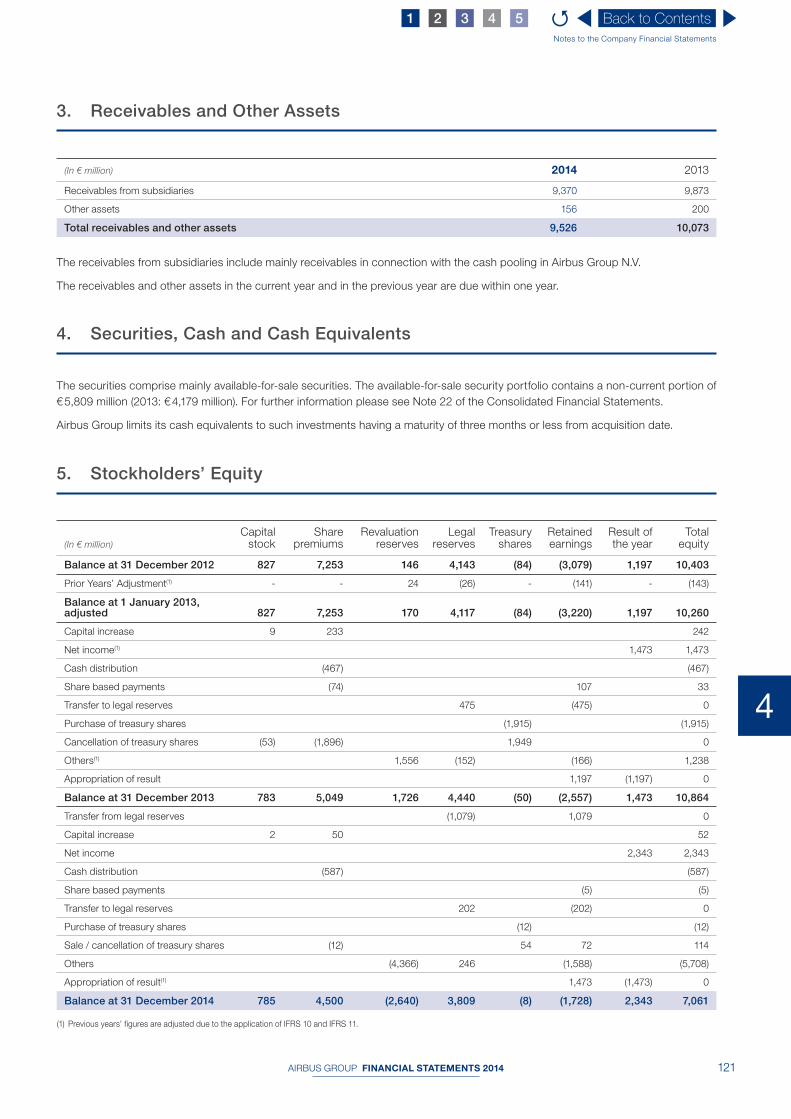
AIRBUS GROUP FINANCIAL STATEMENTS 2014 121
4
Notes to the Company Financial Statements
3. Receivables and O ther A ssets
(In € million) 2014 2013
Receivables from subsidiaries 9,370 9,873
Other assets 156 200
Total receivables and other assets 9,526 10,073
The receivables from subsidiaries include mainly receivables in connection with the cash pooling in Airbus Group N.V.
The receivables and other assets in the current year and in the previous year are due within one year.
4. Securities, Cash and C ash E quivalents
The securities comprise mainly available-for-sale securities. The available-for-sale security portfolio contains a non-current portion of
€ 5,809 million (2013: € 4,179 million). For further information please see Note 22 of the Consolidated Financial Statements.
Airbus Group limits its cash equivalents to such investments having a maturity of three months or less from acquisition date.
5. Stockholders’ E quity
(In € million)
Capital stock
Share premiums
Revaluation reserves
Legal reserves
Treasury shares
Retained earnings
Result of the year
Total equity
Balance at 31 December 2012 827 7,253 146 4,143 (84) (3,079) 1,197 10,403
Prior Years’ Adjustment(1) - - 24 (26) - (141) - (143)
Balance at 1 January 2013, adjusted 827 7,253 170 4,117 (84) (3,220) 1,197 10,260
Capital increase 9 233 242
Net income(1) 1,473 1,473
Cash distribution (467) (467)
Share based payments (74) 107 33
Transfer to legal reserves 475 (475) 0
Purchase of treasury shares (1,915) (1,915)
Cancellation of treasury shares (53) (1,896) 1,949 0
Others(1) 1,556 (152) (166) 1,238
Appropriation of result 1,197 (1,197) 0
Balance at 31 December 2013 783 5,049 1,726 4,440 (50) (2,557) 1,473 10,864
Transfer from legal reserves (1,079) 1,079 0
Capital increase 2 50 52
Net income 2,343 2,343
Cash distribution (587) (587)
Share based payments (5) (5)
Transfer to legal reserves 202 (202) 0
Purchase of treasury shares (12) (12)
Sale / cancellation of treasury shares (12) 54 72 114
Others (4,366) 246 (1,588) (5,708)
Appropriation of result(1) 1,473 (1,473) 0
Balance at 31 December 2014 785 4,500 (2,640) 3,809 (8) (1,728) 2,343 7,061
(1) Previous years’ figures are adjusted due to the application of IFRS 10 and IFRS 11.
Back to Contents54321 Q

AIRBUS GROUP FINANCIAL STATEMENTS 2014122
Notes to the Company Financial Statements
6. Financing L iabilities
The non current fi nancing liabilities in the amount of € 5,551 million
(2013: € 3,514 million) include three long-term loans, granted
by the European Investment Bank to Airbus Group for a total
amount of US$ 1,754 million, a US$ 300 million loan granted by
the Development Bank of Japan and fi ve loans granted by Airbus
Group Finance B.V. (formerly: EADS Finance B.V.) for an amount of
€ 2,986 million and US$ 1,000 million. The four EUR-loans originate
from the issuance of four EURO denominated bonds under Airbus
Group’s EMTN Programme by Airbus Group Finance B.V. The
US$-Loan originates from the issuance by Airbus Group Finance
B.V. of a US$ denominated bond in the US institutional market.
Terms and conditions of the three loans basically match those of
the underlying bonds.
For further details, please see Note 26 of the Consolidated Financial
Statements.
7. Current L iabilities
(In € million) 2014 2013
Liabilities to subsidiaries 25,102 25,029
Liabilities to participations 602 598
Other liabilities 237 203
Total 25,941 25,830
The liabilities to subsidiaries comprise mainly liabilities in connection with the cash pooling in Airbus Group N.V.
For further information to the Stockholders’ equity, please see
Note 23 of the Consolidated Financial Statements.
As of 31 December 2014, the item “Revaluation reserves” relates to
€ 670 million (adjusted 2013: € 625 million) from unrealised positive
fair values of securities classifi ed as available for sale, and fair
values of cash fl ow hedges, recognised directly in equity with a
negative amount of € 3,310 million (adjusted 2013: € 1,101 million
positive fair values). The securities classifi ed as available for sale
and cash fl ow hedges are included in the fi xed asset movement
schedule within “Subsidiaries”.
The “Legal reserves” are related to Airbus Group’s share in
the undistributed results from investments for € 1,647 million
(2013: € 1,626 million), the legal reserve affi liated companies of
€ 727 million (2013: € 1,625 million) and € 1,435 million (adjusted
2013: € 1,189 million) resulting from currency translation effects
of affi liated companies. The legal reserve “affi liated companies”,
required under Dutch law, relates to legal restrictions on the ability
of affi liated companies to distribute reserves to the parent company.
In 2014 the Company applied a different method in determining
this reserve that better refl ects the actual distributable reserves of
the Company. The internally generated capitalised development
costs are no longer a separate reserve but included within the
legal reserve “affi liated companies”. This change is applied from
1 January 2014 onwards and the opening balance of the legal
reserve has been adjusted (see movement “transfer from legal
reserves” for an amount of € 1,079 million).
The “Retained earnings” include actuarial losses arising from
defi ned benefi t plans, recognised in equity, with an amount of
€ 4,695 million negative (adjusted 2013: € 3,110 million negative).
Pursuant to Dutch law, limitation exist relating to the distribution of
stockholders’ equity with an amount of € 5,264 million (adjusted
2013: € 6,949 million). The limitations relate to capital stock
of € 785 million (2013: € 783 million) and to legal reserves of
€ 3,809 million (adjusted 2013: € 4,440 million). In 2014, unrealised
gains related to “Revaluation reserves” with an amount of
€ 670 million (adjusted 2013: € 1,726 million) were not distributable.
In general, gains related to available for sale securities, fair values
of cash fl ow hedges, currency translation effects of affi liated
companies and capitalised development costs reduce the
distributable stockholders’ equity.
Back to Contents54321 Q
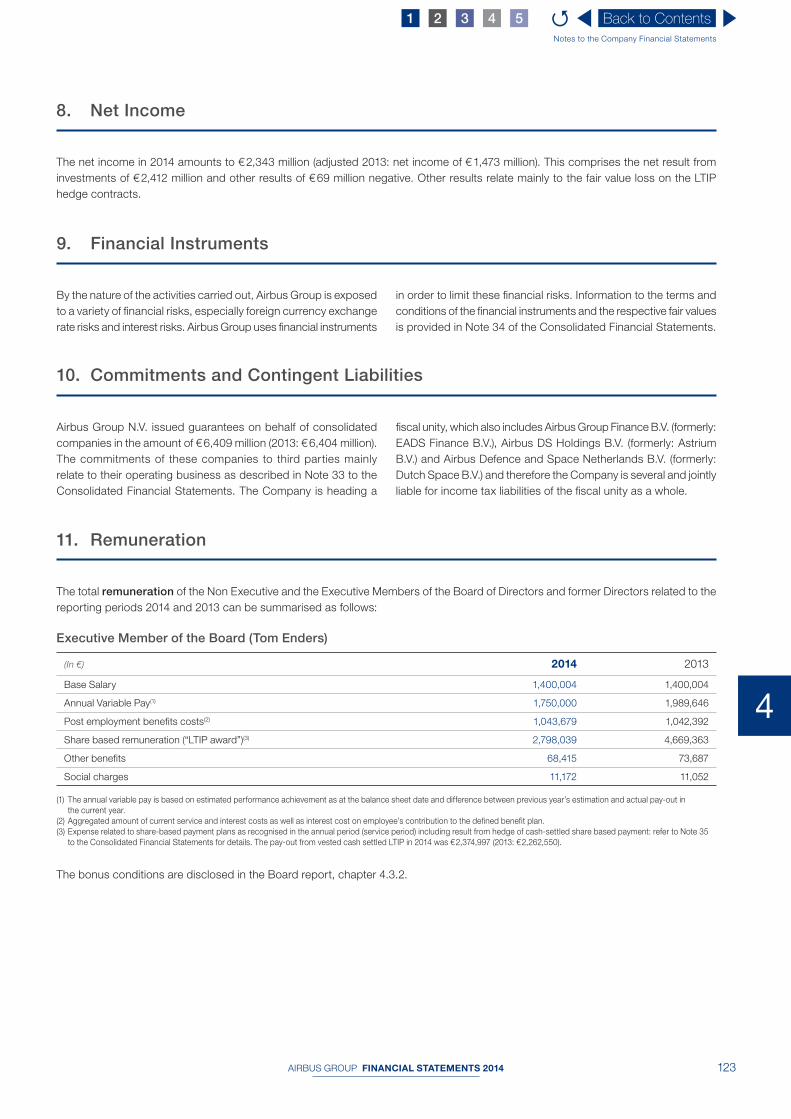
AIRBUS GROUP FINANCIAL STATEMENTS 2014 123
4
Notes to the Company Financial Statements
9. Financial I nstruments
By the nature of the activities carried out, Airbus Group is exposed
to a variety of fi nancial risks, especially foreign currency exchange
rate risks and interest risks. Airbus Group uses fi nancial instruments
in order to limit these fi nancial risks. Information to the terms and
conditions of the fi nancial instruments and the respective fair values
is provided in Note 34 of the Consolidated Financial Statements.
10. Commitments and C ontingent L iabilities
Airbus Group N.V. issued guarantees on behalf of consolidated
companies in the amount of € 6,409 million (2013: € 6,404 million).
The commitments of these companies to third parties mainly
relate to their operating business as described in Note 33 to the
Consolidated Financial Statements. The Company is heading a
fi scal unity, which also includes Airbus Group Finance B.V. (formerly:
EADS Finance B.V.), Airbus DS Holdings B.V. (formerly: Astrium
B.V.) and Airbus Defence and Space Netherlands B.V. (formerly:
Dutch Space B.V.) and therefore the Company is several and jointly
liable for income tax liabilities of the fi scal unity as a whole.
11. Remuneration
The total remuneration of the Non Executive and the Executive Members of the Board of Directors and former Directors related to the
reporting periods 2014 and 2013 can be summarised as follows:
Executive Member of the Board (Tom Enders)
(In €) 2014 2013
Base Salary 1,400,004 1,400,004
Annual Variable Pay(1) 1,750,000 1,989,646
Post employment benefits costs(2) 1,043,679 1,042,392
Share based remuneration (“LTIP award”)(3) 2,798,039 4,669,363
Other benefits 68,415 73,687
Social charges 11,172 11,052
(1) The annual variable pay is based on estimated performance achievement as at the balance sheet date and difference between previous year’s estimation and actual pay-out in
the current year.
(2) Aggregated amount of current service and interest costs as well as interest cost on employee’s contribution to the defined benefit plan.
(3) Expense related to share-based payment plans as recognised in the annual period (service period) including result from hedge of cash-settled share based payment: refer to Note 35
to the Consolidated Financial Statements for details. The pay-out from vested cash settled LTIP in 2014 was € 2,374,997 (2013: € 2,262,550).
The bonus conditions are disclosed in the Board report, chapter 4.3.2.
8. Net I ncome
The net income in 2014 amounts to € 2,343 million (adjusted 2013: net income of € 1,473 million). This comprises the net result from
investments of € 2,412 million and other results of € 69 million negative. Other results relate mainly to the fair value loss on the LTIP
hedge contracts.
Back to Contents54321 Q

AIRBUS GROUP FINANCIAL STATEMENTS 2014124
Notes to the Company Financial Statements
Summary table of the remuneration of the Non-Executive Directors
The remuneration of the N on-Executive Members of the Board of Directors was as follows:
Directors’ remuneration related to 2014* Directors’ remuneration related to 2013*
Fixum Attendance Fees Total Fixum Attendance Fees Total
(in €) (in €) (in €) (in €) (in €) (in €)
Current non-Executive Board Members*
Denis Ranque(1) 180,000 70,000 250,000 135,000 60,000 195,000
Manfred Bischoff(2) 80,000 25,000 105,000 60,000 45,000 105,000
Ralph D Crosby Jr(3) 80,000 35,000 115,000 60,000 45,000 105,000
Hans-Peter Keitel(4) 100,000 30,000 130,000 75,000 45,000 120,000
Hermann-Josef Lamberti(5) 110,000 35,000 145,000 115,000 60,000 175,000
Anne Lauvergeon(6) 100,000 30,000 130,000 75,000 45,000 120,000
Lakshmi N. Mittal(7) 100,000 30,000 130,000 95,000 35,000 130,000
Sir John Parker(8) 110,000 35,000 145,000 115,000 50,000 165,000
Michel Pébereau(9) 100,000 30,000 130,000 95,000 55,000 150,000
Josep Piqué i Camps(10) 100,000 15,000 115,000 95,000 50,000 145,000
Jean-Claude Trichet(11) 100,000 35,000 135,000 95,000 60,000 155,000
Former non-Executive Board Members
Dominique D’Hinnin(12) N/A N/A N/A 30,000 10,000 40,000
Arnaud Lagardère(13) N/A N/A N/A 45,000 20,000 65,000
Wilfried Porth(14) N/A N/A N/A 25,000 10,000 35,000
Bodo Uebber(15) N/A N/A N/A 25,000 5,000 30,000
Total 1,160,000 370,000 1,530,000 1,140,000 595,000 1,735,000
* The Fixum related to 2013 was paid in 2014; the Fixum related to 2014 will be paid in 2015.
(1) New Chairman of the Company’s Board of Directors as of 01/04/2013.
(2) New Member of the Company’s Board of Directors as of 01/04/2013.
(3) New Member of the Company’s Board of Directors as of 01/04/2013.
(4) New Member of the Company’s Board of Directors and RNC as of 01/04/2013.
(5) Member of the Company’s Board of Directors and Chairman of the Audit Committee for the entire year 2013, Member of the RNC until 31/03/2013.
(6) New Member of the Company’s Board of Directors and Audit Committee as of 01/04/2013.
(7) Member of the Company’s Board of Directors for the entire year 2013, new Member of the RNC as of 01/04/2013.
(8) Member of the Company’s Board of Directors and Chairman of the RNC for the entire year 2013, Member of the Audit Committee until 31/03/2013.
(9) Member of the Company’s Board of Directors for the entire year 2013, new Member of the Audit Committee as of 01/04/2013.
(10) Member of the Company’s Board of Directors for the entire year 2013, new Member of the Audit Committee as of 01/04/2013.
(11) Member of the Company’s Board of Directors for the entire year 2013, new Member of the RNC as of 01/04/2013.
(12) Member of the Company’s Board of Directors, Audit committee and RNC until 31/03/2013.
(13) Chairman of the Company’s Board of Directors until 31/03/2013
(14) Member of the Company’s Board of Directors and RNC until 31/03/2013.
(15) Member of the Company’s Board of Directors and Audit Committee until 31/03/2013.
The table below gives an overview of the interests of the current Executive Board Director under the various Long-Term Incentive
Plans of the Group:
Stock option plans
NUMBER OF OPTIONS
Year of planInitially
grantedAs at
1 Jan 2014Granted in
2014Exercised
during 2014As at
31 Dec 2014Exercise
price in Euro Expiry date
Tom Enders
2006 67,500 50,625 - 50,625 0 25.65 16 Dec 2016
After a recommendation of the Remuneration and Nomination
Committee and in compliance with the relevant best practice
recommendations, the Board of Directors recommended the
set-up of a “blind trust” to which the executives could sign up
after the Group’s Annual General Meeting in late May 2013. The
independence of the trust protects the integrity of the signee and
promises compliance with market regulations on such matters.
Back to Contents54321 Q

AIRBUS GROUP FINANCIAL STATEMENTS 2014 125
4
Notes to the Company Financial Statements
The Chief Executive Offi cer decided during an open trading period
to entrust the exercise of his options granted between 2003 and
until 2006 and thereby relinquished any control over the trading
decisions. Under this scheme trading decisions are scheduled in
advance by the trust, and are implemented by the relevant bank
following a substantial time buffer (of approximately three months)
without any knowledge or infl uence of the signatory.
Any exercise / sale of the Chief Executive Offi cer in 2014 was
executed in the frame of the blind trust mandates with no
unexercised stock options remaining at the end of 2014.
Performance Units plan
NUMBER OF PERFORMANCE UNITS**
Granted in 2009 Vested in 2014
Tom Enders 46,00021,217 units (vested in Cash) and 14,145 units (vested in Shares)
* (Re-evaluation of Performance Units based on 123% performance achievement)
* 46,000 of granted units increased to 56,580 in accordance with performance achievement of 123%. In line with end of 2012 implemented option of partial conversion to equity
settlement (see Notes 35 and 36 of Consolidated Financial Statements) 75% of those 56,580 units (42,435 units) have vested in cash at each of initial vesting dates.
The remaining 25% of the 56,580 units (14,145 units) have vested and been settled in shares in November 2014.There are no outstanding unvested units of 2009 plan.
Granted in 2010 Vested in 2014
Tom Enders 54,400
27,744* (Re-evaluation of Performance Units based on 136% performance achievement)
Remaining vesting schedule: ■ 25% of cash- settle d units: expected in May 2015 ■ 25% of cash- settled units, 100% of equity-settled
units: expected in November 2015
* 54,400 of granted units increased to 73,984 in accordance with performance achievement of 136%. In line with end of 2012 implemented option of partial conversion to equity
settlement (see Notes 35 and 36 of Consolidated Financial Statements) 75% of those 73,984 units (55,488 units) will vest in cash at each of initial vesting dates. The remaining 25% of
the 73,984 units (18,496 units) will vest and be settled in shares in November 2015.
End of 2012, the Chief Executive Officer opted for 75% cash settlement of all vesting Performance Units at each vesting date. Remaining 25% of units will be settled in shares at the last
vesting date.
Granted in 2011 Vesting dates
Tom Enders 51,400
Vesting schedule is made up of 4 payments over 2 years: ■ 25% of cash-settle d units: expected in May 2015 ■ 25% of cash-settled units: expected in November 2015 ■ 25% of cash-settled units: expected in May 2016 ■ 25% of cash-settled units, 100% of equity-settled
units: expected in November 2016
End of 2012, the Chief Executive Office opted for 75% cash settlement of all vesting Performance Units at each vesting date. Remaining 25% of units will be settled in shares at the last
vesting date.
Granted in 2012 Vesting dates
Tom Enders 50,300
Vesting schedule is made up of 4 payments over 2 years: ■ 25% of cash-settled units: expected in May 2016 ■ 25% of cash-settled units: expected in November 2016 ■ 25% of cash- settled units: expected in May 2017 ■ 25% of cash-settled units, 100% of equity-settled units:
expected in November 2017
End of February 2013, the Chief Executive Officer opted for 75% cash settlement of all vesting Performance Units at each vesting date. Remaining 25% of units will be settled in shares
at the last vesting date.
Granted in 2013 Vesting dates
Tom Enders 30,300
Vesting schedule is made up of 4 payments over 2 years: ■ 25% of cash-settled units: expected in May 2017 ■ 25% of cash-settled units: expected in November 2017 ■ 25% of cash-settled units: expected in May 2018 ■ 25% of cash-settled units, 100% of equity-settled units:
expected in November 2018
In February 2014, the Chief Executive Officer opted for 50% cash settlement of all vesting Performance Units at each vesting date. Remaining 50% of units will be settle d in shares at the
last vesting date.
** Vesting of all Performance Units granted to the Chief Executive Offi cer is subject to performance conditions.
Back to Contents54321 Q

AIRBUS GROUP FINANCIAL STATEMENTS 2014126
Notes to the Company Financial Statements
12. Employees
The number of persons employed by the Company at year end 2014 was 3 (2013: 2).
13. Related Party Transactions
For further information on the related party transactions, please see Note 36 of the Consolidated Financial Statements.
Stock Option Plans
To the other current Members of the Executive Committee and
to the Group’s senior management, the number of outstanding
stock options amounted to 2,240,891 at 31 December 2014 (2013:
4,314,115).
During the year 2014, the Executive Committee Members have
exercised 188,128 options granted under the various stock option
plans. 118,000 options were exercised by former Executive Board
Directors.
Performance and Restricted Unit plans
The total number of outstanding performance and Restricted Units
amounted to 11,359,272 at 31 December 2014 (2013: 13,492,556)
mostly granted to the current Members of the Executive Committee
and to the Group’s senior management. Fair Value of outstanding
LTIP balances end of 2014 for the Chief Executive Offi cer was
€ 3,287,645 (2013: € 4,232,328).
The pension benefit obligation for the Executive Committee
Members is as follows:
The Members of the Executive Committee have pension promises
as part of their employment agreements. The general policy is to
give them annual pensions of 50% of their annual base salary upon
reaching fi ve years of service in the Executive Committee of Airbus
Group, payable once they reach retirement age.
These rights can gradually increase to 60% after a second term,
usually after ten years of service in the Airbus Group Executive
Committee. However, in order to reach this 60% replacement ratio
the respective Member of the Executive Committee must also have
12 years of seniority within the Group.
These pension schemes have been implemented through collective
executive pension plans in France and Germany. These pension
promises have also separate rules e.g. for minimum length of
service and other conditions to comply with national regulations.
For the Chief Executive Offi cer, Tom Enders, the pension defi ned
benefi t obligation including deferred compensation amounted to
€ 18,584,426 as of 31 December 2014, whilst the amount of current
service and interest cost related to his pension promise accounted
for the fi scal year 2014 represented an expense of € 1,043,679.
This amount has been accrued in the Consolidated Financial
Statements. The defi ned benefi t obligation of Tom Enders results
from the Group’s Executive Committee pension policy as described
above and takes into account (1) the seniority of Tom Enders in the
Group and its Executive Committee and (2) the signifi cant lower
public pension promise derived from the German social security
pension system compared to public pensions resulting from the
m embership in the French public pension system.
Other Benefi ts
The Chief Executive Offi cer, Tom Enders, is entitled to accident
insurance coverage and a company car. In 2014 the total amount
expensed was € 68,415.
The Company has not provided any loans to/ advances to/
guarantees on behalf of Directors.
For further information on the remuneration, please see Note 35
and 36 of the Consolidated Financial Statements.
Granted in 2014 Vesting dates
Tom Enders 29,500
Vesting schedule is made up of 2 payments over 2 years: ■ 50% of cash-settled units: expected in June 2018 ■ 50% of cash-settled units, 100% of equity-settled
units: expected in June 2019
By end of February 2015, Chief Executive Officer will accordingly decide on the split for the 2014 LTIP plan.
Back to Contents54321 Q

AIRBUS GROUP FINANCIAL STATEMENTS 2014 127
4
Notes to the Company Financial Statements
Back to Contents54321 Q

AIRBUS GROUP FINANCIAL STATEMENTS 2014128
5

AIRBUS GROUP FINANCIAL STATEMENTS 2014 129
5
Other Supplementary Information including the Independent Auditor’s report
Back to Contents54321 Q
AIRBUS GROUP FINANCIAL STATEMENTS 2014130
Other Supplementary Information including the Independent Auditor’s report
2. Subsequent Events
For further information please see Note 40 of the Consolidated Financial Statements.
Other Supplementary Information
1. Appropriation o f Result
Articles 30 and 31 of the Articles of Association provide that the Board of Directors shall determine which part of the result shall
be attributed to the reserves. The General Meeting of Shareholders may dispose of a reserve only upon a proposal of the Board of
Directors and to the extent it is permitted by law and the Articles of Association. Dividends may only be paid after adoption of the annual
accounts from which it appears that the shareholders’ equity of the Company is more than the amount of the issued and paid-in part
of the capital increased by the reserves that must be maintained by law.
It will be proposed at the Annual General Meeting of Shareholders that the net income of € 2,343 million as shown in the income
statements for the fi nancial year 2014 is to be added to retained earnings and that a payment of a gross amount of € 1.20 per share
shall be made to the shareholders.
3. Independent Auditor’s report
To: The General Meeting of Shareholders of Airbus Group N.V.
Our Opinion
We have audited the accompanying fi nancial statements 2014 of Airbus Group N.V., Amsterdam. The fi nancial statements include
the Consolidated Financial Statements and the Company F inancial S tatements.
In our opinion:
■ the Consolidated Financial Statements give a true and fair view of the fi nancial position of Airbus Group N.V. as at 31 December
2014 and its result and its cash fl ows for the year then ended in accordance with International Financial Reporting Standards as
adopted by the European Union (EU-IFRS) and with Part 9 of Book 2 of the Netherlands Civil Code; ■ the Company F inancial S tatements give a true and fair view of the fi nancial position of Airbus Group N.V. as at 31 December 2014
and of its result for the year then ended in accordance with Part 9 of Book 2 of the Netherlands Civil Code.
The Consolidated Financial Statements comprise:
1. the consolidated statement of financial position as at 31 December 2014;
2. the consolidated statements of income, comprehensive income, changes in equity and cash flows for the year then ended; and
3. the notes, comprising a summary of the significant accounting policies and other explanatory information.
The Company F inancial S tatements comprise:
1. the Company balance sheet as at 31 December 2014;
2. the Company profit and loss account for the year then ended; and
3. the notes, comprising a summary of the accounting policies and other explanatory information.
Back to Contents54321 Q

AIRBUS GROUP FINANCIAL STATEMENTS 2014 131
5
Other Supplementary Information including the Independent Auditor’s report
Basis for Opinion
We conducted our audit in accordance with Dutch law, including the Dutch Standards on Auditing. Our responsibilities under
those standards are further described in the “Our responsibilities for the audit of the financial statements” section of our report.
We are independent of Airbus Group N.V. in accordance with the Verordening inzake de onafhankelijkheid van accountants bij
assurance-opdrachten (ViO) and other relevant independence regulations in the Netherlands. Furthermore we have complied
with the Verordening gedrags- en beroepsregels accountants (VGBA) and other relevant regulations.
We believe that the audit evidence we have obtained is sufficient and appropriate to provide a basis for our opinion.
Materiality
Misstatements can arise due to fraud or error and are considered to be material if, individually or in the aggregate, they could
reasonably be expected to influence the economic decisions of users taken on the basis of these financial statements. The
materiality affects the nature, timing and extent of our audit procedures and the evaluation of the effect of identified misstatements
on our opinion.
Based on our professional judgment the materiality for the Consolidated Financial Statements as a whole was set at € 222 million,
which is 6.9% of consolidated profit before income taxes. We consider profit before income taxes to be the most appropriate
benchmark given the nature of the business. We also take into account misstatements and/or possible misstatements that are
in our opinion material for qualitative reasons for users of the financial statements.
We agreed with the Board of Directors and Audit Committee to report to them individual uncorrected misstatements in excess of
€ 11 million that we identify during our audit and smaller misstatements that in our view must be reported on qualitative grounds.
Scope of our Group Audit
Airbus Group N.V. is at the head of a group of entities, hereafter referred to as “Airbus Group” or “Group”. The financial information
of this group is included in the Consolidated Financial Statements of Airbus Group N.V.
Because we are ultimately responsible for the opinion, we are also responsible for directing, supervising and performing the group
audit. A significant part of the audit is performed by other auditors within the KPMG network or by other non-KPMG audit firms.
The organisation and supervision of the audit of the Consolidated Financial Statements is a crucial part of our work.
In this context, we have determined the nature and extent of the audit procedures to be performed for the group entities, based
on the significance and/or risk profile of entities or activities. On this basis, we selected the entities for which an audit of the
complete set of the entity’s financial statements or specific items was necessary. Our group audit mainly concentrated on
significant entities. We scope entities into the group audit where they are of significant size, have significant risks to the Group
associated with them or are considered significant for other reasons. This resulted in coverage of 96% of total Group revenue
and 98% of total Group assets. For remaining entities, we performed, amongst others, analytical procedures to corroborate our
assessment that there are no significant risks of material misstatement within these entities.
The audit of the Airbus Group consolidation and the financial statements is performed at the Airbus headquarters in Toulouse,
France. Our involvement in the audit includes participation in risk assessment and planning discussions, setting the direction
of the group audit work (including instructions to the divisional and entity auditors), review and discussion of the planned audit
approach, obtaining an understanding of the financial reporting process, performing procedures on the Group consolidation,
participating in the evaluation of key accounting topics, reviewing the financial statements and participating in meetings with
Group and divisional management.
The audit of the three Airbus Group Divisions (Airbus, Airbus Defence & Space and Airbus Helicopters) is performed jointly by
KPMG network firms and other non-KPMG audit firms. Meetings were held with the divisional auditors to discuss the findings
reported to the group audit team, as well as file reviews.
By performing the procedures above, combined with additional procedures at group level, we have obtained sufficient and
appropriate audit evidence regarding the financial information of the Group to provide an opinion on the Consolidated Financial
Statements.
Back to Contents54321 Q
AIRBUS GROUP FINANCIAL STATEMENTS 2014132
Other Supplementary Information including the Independent Auditor’s report
Key Audit Matters
In the key audit matters we describe matters that, in our professional judgment , were of most significance in our audit of the
Consolidated Financial Statements. We have communicated the key audit matters with the Board of Directors and Audit Committee.
The key audit matters are not a comprehensive reflection of all matters discussed.
These matters were addressed in the context of our audit of the financial statements as a whole, and in forming our opinion
thereon, and we do not provide a separate opinion on these matters.
Accounting for Construction Contracts, Including Revenue Recognition and Loss Provisions
Refer to the disclosure on “Management judgment and use of accounting estimates”, Note 6 “Revenues and Gross Margin” and
Note 25 “Provisions” of the fi nancial statements.
The Risk
The amount of revenue and profit recognised in a year is dependent on the assessment of the stage of completion of construction
contracts as well as estimated total revenue and estimated total cost. Significant estimates are made to assess the stage of
completion based on milestones, estimated revenue and costs for the key programmes such as A400M and A350 XWB (contracts
with launch customers only). Depending on these assessments, the stage of completion is determined, revenue is recognised
and loss accruals are recorded when the contract margin is negative. Provisions for contract losses relate mainly to the A400M
and A350 XWB launch customers and are recorded when it becomes probable that estimated total contract costs will exceed
estimated total contract revenues. Updates to these provisions can have a significant impact on the Group’s result and financial
position. The determination of these provisions is based on best available estimates and require significant judgment and estimates
associated with the technical development achievement and certification schedules, production plan (including assumptions on
ramp up), performance guarantees as well as expected outcome from ongoing negotiations.
Significant estimates include total contract costs, total contract revenues and contract risks (from both the cost and revenue
perspective), which therefore require significant management judgment . Due to the inherent uncertainty involved in forecasting
future costs and interpreting contractual and commercial positions this is a key judgment al area for our audit.
Our Response
We evaluated the design and tested the effectiveness of internal controls for accounting for construction contracts. We also
performed detailed procedures on individually significant programmes, including discussions with the individual Head of
Programme, and evaluated management’s assumptions in the determination of amongst others the stage of completion of
a project, estimates to complete for both revenue and costs, and any provisions for loss making contracts. We focus on
management’s assessment of key contract risks and opportunities to determine whether these are appropriately reflected in
the cost to complete forecasts. We paid specific attention for example to technical development, delivery plan and certification
schedules. We challenged management’s assumptions by discussing and reviewing correspondence with customers, considering
the accuracy and consistency of similar estimates made in previous years and obtaining the latest contractual information.
Particular attention was paid to the increase in the loss provision for the A400M programme in light of the delays incurred,
critical phase of the programme and associated risks, challenges regarding military functionality and industrial ramp-up, and
the SOC 1.0 technical milestone which fell due end of October 2013 and remains to be achieved.
Valuation of Inventories for Non-Construction Contracts and completeness of Provisions for Contract
Losses and Customer Service Obligations
Refer to the disclosure on “Management judgment and use of accounting estimates” and Notes 18 “Inventories”, and 25 “Provisions”
of the financial statements.
The Risk
Inventories amount to € 25 billion including work in progress of € 17 billion. Key programmes in light of the risks mentioned below
are the A380 and the A350 XWB contracts with non-launch customers. Estimates of total contract costs and selling price per
aircraft are required to determine if a net realisable value impairment or provision for contract loss is required. In addition to the
risk of contract cancellations, significant costs or loss of revenue may be incurred in connection with remedial action required to
correct any performance issues detected. Due to the inherent uncertainty involved in forecasting future costs and interpreting
contractual and commercial positions in determining impairments and provisions, this is a key audit area.
Back to Contents54321 Q
AIRBUS GROUP FINANCIAL STATEMENTS 2014 133
5
Other Supplementary Information including the Independent Auditor’s report
Our Response
We evaluated the design and tested the effectiveness of internal controls for identifying and recording impairments and provisions
and performed detailed procedures including discussions with the Head of Programmes. We evaluated management’s assumptions
in the determination of the forecast revenue to be received, costs to be incurred (including any contractual penalties) and gross
margin. Our evaluation was based on our assessment of the historical accuracy of the Group’s estimates in previous periods and
included an analysis of contingencies and impact of known technical issues on cost forecasts and provisions. We also discussed the
commercial status of the A380 programme with management including the ongoing commitment of Airbus to the A380 programme.
Litigation and Compliance With Laws and Regulations
Refer to the disclosure on “Management judgment and use of accounting estimates” and Note 32 “Litigation and claims” of the
fi nancial statements.
The Risk
Litigation and claims involve amounts that are potentially significant and the estimate of the amount to be provided as a liability,
if any, is inherently subjective. The outcome of these matters may have a material effect on the Group’s result and financial
position. A part of the Group’s business is characterised by competition for individual significant contracts with customers
which are often directly or indirectly associated with governments. The process associated with these activities is susceptible
to the risk of non-compliance with laws and regulations. In addition the Group operates in a number of territories where the use
of commercial intermediaries is normal practice. Subsidiaries of Airbus Group N.V. are currently under investigation by various
law enforcement agencies (e.g. GPT and Eurofighter), including investigations started by the German and Romanian authorities
mid-October 2014 relating to the border-surveillance project in Romania and two other projects in China and Saudi Arabia.
Our Response
Our audit procedures included, among others, assessment of documents with the Group’s general counsel and the Group /
divisional compliance officers on all significant legal cases. In addition we obtained confirmation letters from the Group’s legal
counsel and external lawyers for all significant litigation. We used our own forensic specialists to assess risks and perform
procedures to identify actual and potential non-compliance with laws and regulations relevant to the Group’s business, analysed
correspondence with enforcement agencies, and monitored external sources of information. With respect to cases regarding
alleged non-compliance with laws and regulations, we assessed the adequacy of management’s response (including investigations
and corrective actions). We tested payments made to intermediaries during the year, made enquiries of appropriate personnel and
evaluated the tone set by the Board and the Group’s approach in managing these compliance risks. We also assessed whether
the Group’s disclosures detailing significant legal proceedings and suspected breach in laws and regulations adequately disclose
the contingent liabilities of the Group within Note 32.
Goodwill Impairment
Refer to the disclosure on “Management judgment and use of accounting estimates” and Note 13 “Intangible assets” of the fi nancial
statements.
The Risk
Goodwill amounts to € 10 billion and represents 10% of the balance sheet total and 141% of total equity. There is a risk of irrecoverability
of the Group’s signifi cant goodwill balance due to weak demand in certain markets and to the nature of the cost base in the aerospace
and defence industry. The Company used assumptions such as growth rates, weighted average cost of capital and underlying foreign
exchange rates. Due to the inherent uncertainty involved in forecasting and discounting future cash fl ows, which are the basis of the
assessment of recoverability, this is one of the key judgment al areas that our audit is concentrated on. These judgment s are described
in Note 13 to the fi nancial statements.
Our Response
In this area our audit procedures included, among others, testing of the Group’s budgeting procedures upon which the forecasts are
based and the principles and integrity of the Group’s discounted cash fl ow model. We used our own valuation specialist to assist us in
evaluating the assumptions and methodologies used by the Group, in particular relating to the discount rate used. We also evaluated
sensitivity analyses on the assumptions for each cash generating unit. We compared the sum of the discounted cash fl ows to the
Group’s market capitalisation to assess the reasonableness of those cash fl ows. We also assessed whether the Group’s disclosures
about the sensitivity of the outcome of the impairment assessment to changes in key assumptions refl ected the risks inherent in the
valuation of the cash generating units.
Back to Contents54321 Q

AIRBUS GROUP FINANCIAL STATEMENTS 2014134
Other Supplementary Information including the Independent Auditor’s report
Derivative Financial Instruments
Refer to Note 34 “Information about fi nancial instruments” of the fi nancial statements.
The Risk
Airbus Group inherently operates in a business environment that is exposed to currency and interest rate volatility. A signifi cant
portion of the Group’s revenue is denominated in US dollars, while a major part of its costs is incurred in Euro and, to a lesser
extent, in pounds Sterling. In response to these risks the Group uses fi nancial instruments (mainly currency forwards) to mitigate
the exposure to changes in market rates.
The magnitude of the Group’s hedge portfolio and potential signifi cant changes in the exchange rate of the US dollar versus the
Euro, could have a negative effect on its result of operations and fi nancial condition. In addition, there is a high inherent risk of error
in the Group fi nancial statements, both in the valuation of the fi nancial instruments and in the presentation and disclosure in the
fi nancial statements.
Our Response
For the audit of fi nancial instruments we used specialists that tested the controls around the Group’s central treasury system,
independently calculated the valuation of the treasury portfolio and tested the application of hedge accounting rules and the resulting
accounting treatment. We also obtained counterparty confi rmation of the outstanding fi nancial instruments to verify the existence
and ownership. Finally, we evaluated whether appropriate disclosures relating to fi nancial instruments were made in the fi nancial
statements.
Responsibilities of the Board of Directors for the Financial Statements
The Board of Directors is responsible for the preparation and fair presentation in accordance with EU-IFRS and Part 9 of Book 2 of
the Netherlands Civil Code, and for the preparation of the report of the Board of Directors in accordance with Part 9 of Book 2 of the
Netherlands Civil Code, and for such internal control as the Board of Directors determines is necessary to enable the preparation
of fi nancial statements that are free from material misstatement, whether due to fraud or error.
In preparing the fi nancial statements, the Board of Directors is responsible for assessing the Company’s ability to continue as a going
concern. Based on the fi nancial reporting frameworks mentioned, the Board of Directors should prepare the fi nancial statements
using the going concern basis of accounting unless the Board of Directors either intends to liquidate the Company or to cease
operations, or has no realistic alternative but to do so. The Board of Directors should disclose events and circumstances that may
cast signifi cant doubt on the Company’s ability to continue as a going concern.
Our responsibilities for the Audit of the Financial Statements
Our objective is to plan and perform the audit assignment in a manner that allows us to obtain suffi cient and appropriate audit
evidence for our opinion.
Our audit has been performed with a high, but not absolute, level of assurance, which means we may have not detected all errors
and fraud.
For a further description of our responsibilities in respect of an audit of fi nancial statements in general, we refer to the website of
the professional body for accountants in the Netherlands (NBA). www.nba.nl/standardtexts-auditorsreport.
Back to Contents54321 Q

AIRBUS GROUP FINANCIAL STATEMENTS 2014 135
5
Other Supplementary Information including the Independent Auditor’s report
Report on Other Legal and Regulatory Requirements
Report on the Report of the Board of Directors and the Other Information
Pursuant to the legal requirement under Part 9 of Book 2 of the Netherlands Civil Code:
■ we have no defi ciencies to report as a result of our examination whether the report of the Board of Directors, to the extent we can
assess, has been prepared in accordance with Part 9 of Book 2 of the Netherlands Civil C ode, and whether the information as
required under Part 9 of Book 2 of the Netherlands Civil Code has been annexed; ■ further we report that the report of the Board of Directors, to the extent we can assess, is consistent with the fi nancial statements.
Appointment
We were appointed before 2008 as auditor of Airbus Group N.V. and have operated as auditor since then. We were re-appointed
by the Annual General Meeting of Shareholders as auditor of Airbus Group N.V. on 27 May 2014, for the year 2014.
Amstelveen, 28 February 2015
KPMG Accountants N.V.
R.J. Aalberts RA
Back to Contents54321 Q

AIRBUS GROUP FINANCIAL STATEMENTS 2014136
Back to Contents54321 Q

Photographs:
Cover © Airbus/H. GousséBack Cover © Airbus/S. Ramadier
All rights reserved.

Airbus Group N.V.
Mendelweg 302333 CS LeidenThe Netherlands
Auriga Building4, rue du Groupe d'Or - BP 9011231703 Blagnac cedex - France
AIR
BU
S G
RO
UP
– FINA
NC
IAL S
TATEM
EN
TS2
014
www.airbusgroup.com2014
ANNUAL REPORT