aircraft performance - w5gww5gw.com/images/aircraft performance.pdf · engine power • as we...
TRANSCRIPT

Aircraft
Performance
Gary White

Engine and Propeller
• Engine - It’s What Makes the Whirly Thing Turn!
• Propeller – It Actually Produces the Thrust
Engine Power
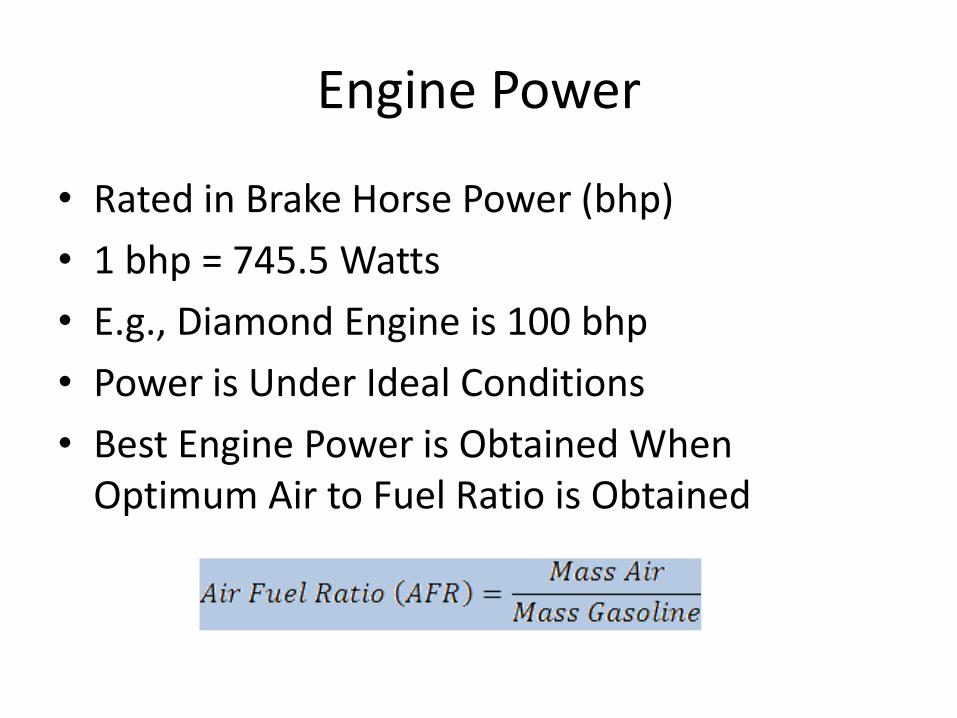
• Rated in Brake Horse Power (bhp)
• 1 bhp = 745.5 Watts
• E.g., Diamond Engine is 100 bhp
• Power is Under Ideal Conditions
• Best Engine Power is Obtained When Optimum Air to Fuel Ratio is Obtained
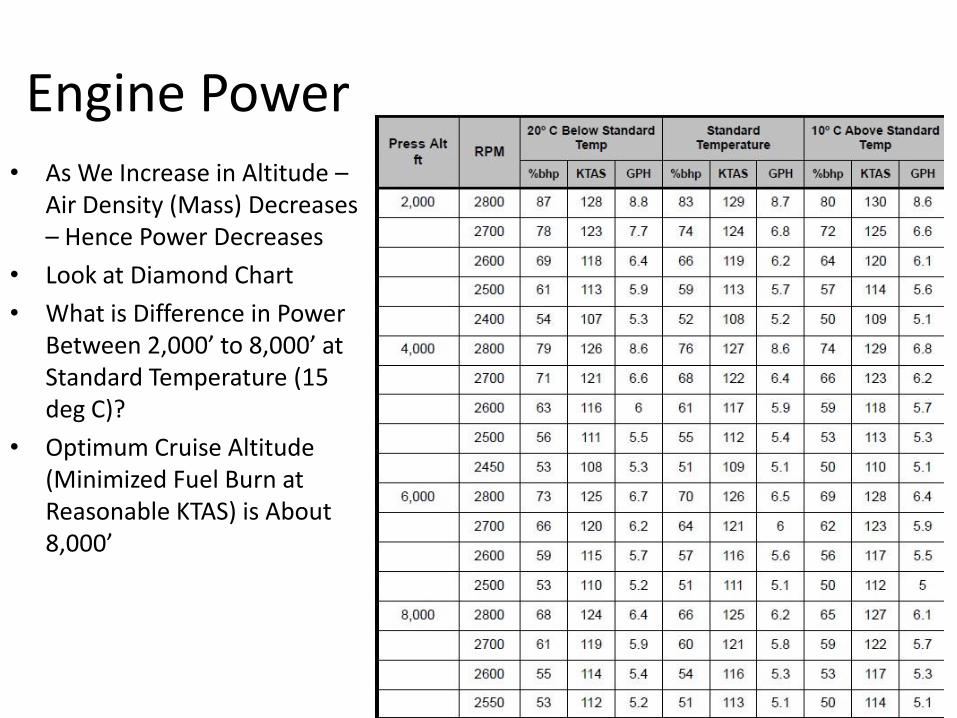
Engine Power • As We Increase in Altitude –
Air Density (Mass) Decreases – Hence Power Decreases
• Look at Diamond Chart
• What is Difference in Power Between 2,000’ to 8,000’ at Standard Temperature (15 deg C)?
• Optimum Cruise Altitude (Minimized Fuel Burn at Reasonable KTAS) is About 8,000’

Propeller Efficiency
• Typically We Fly GA Airplanes That Have Fixed or Variable Pitch
• The Prop is an Airfoil
• Pitch (Angle of Attack) Determines Performance
• There are Climb and Cruise Props
• A Variable Pitch Let’s Us Optimize Performance

Fixed vs Constant Speed
Overall Propeller Efficiency Is Perhaps 80-85% Maximum
Takeoff Performance
Landing and Roll Distance
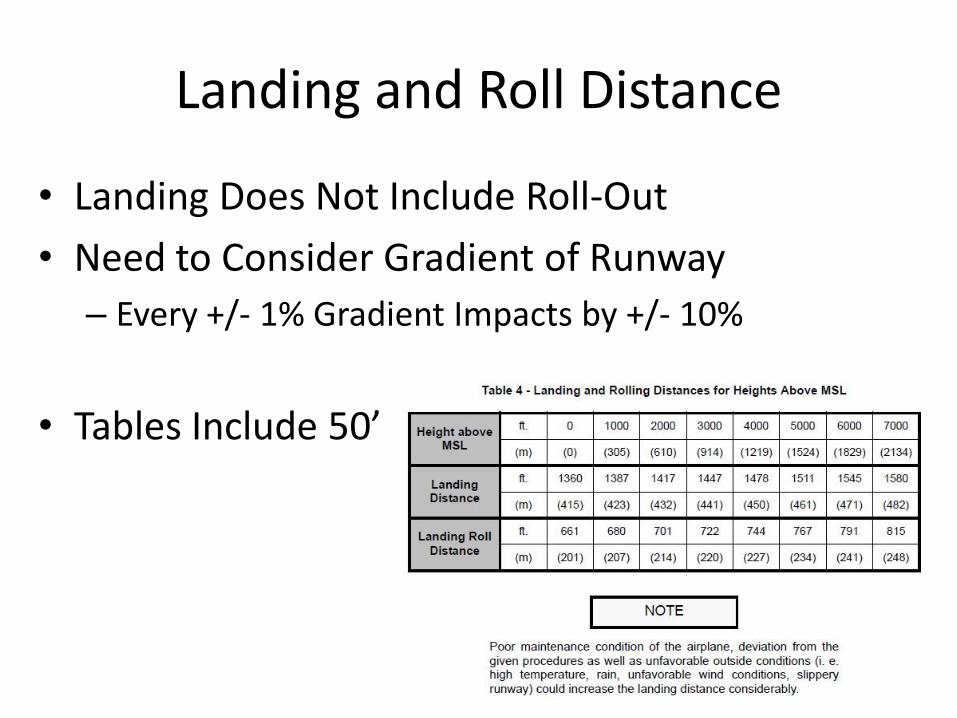
• Landing Does Not Include Roll-Out
• Need to Consider Gradient of Runway
– Every +/- 1% Gradient Impacts by +/- 10%
• Tables Include 50’
Weight
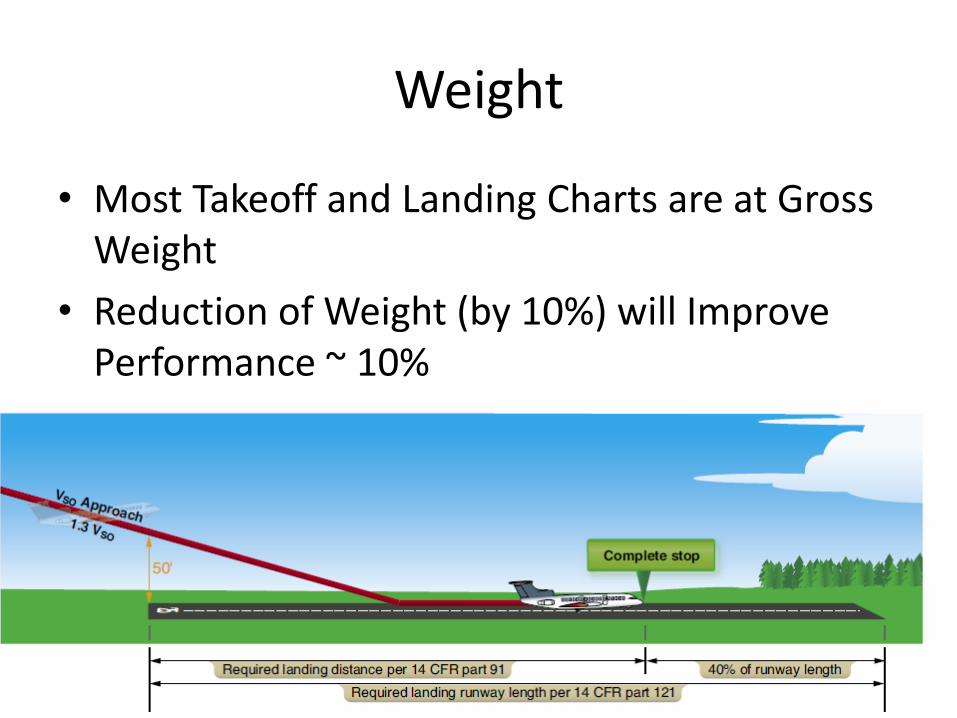
• Most Takeoff and Landing Charts are at Gross Weight
• Reduction of Weight (by 10%) will Improve Performance ~ 10%
Wind
• Headwind, Tailwind and Crosswind
• For Safety, Take Off Into the Wind – Only Excepting if Less Than 5 knots, and You Have
Sufficient Runway
– You, as PIC, have Right to Refuse Tailwind
– Always Refuse a Tailwind Landing
– Tailwind (Every 2 knots Increases Ground Roll by 10%)
• Crosswind – Airplane Has Maximum Demonstrated Crosswind
– You, Depending on Experience, Might Not be Safe at This Maximum
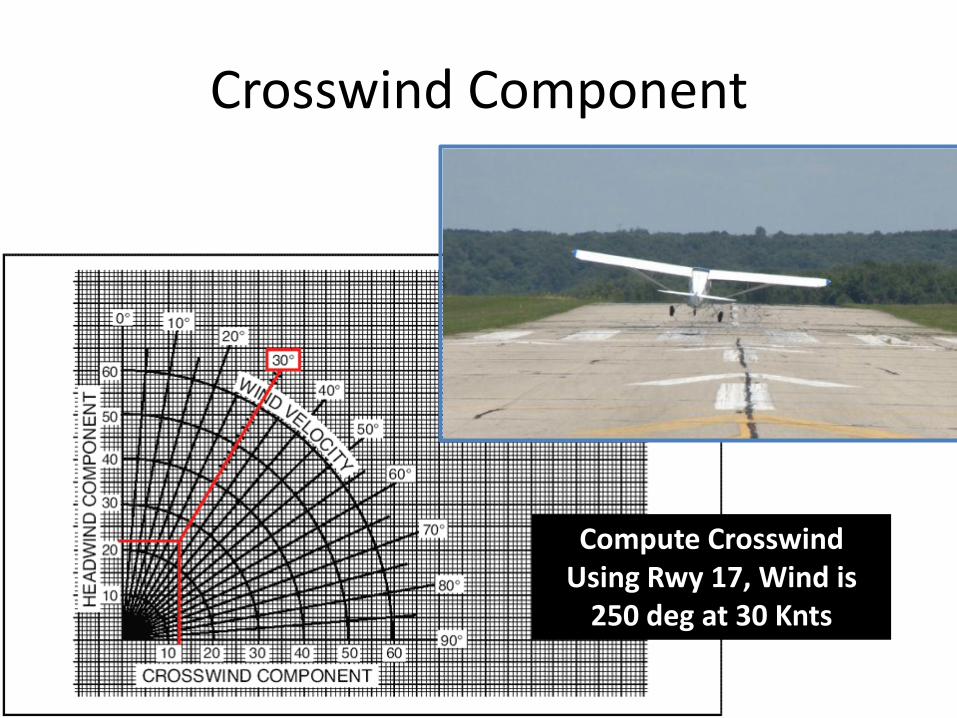
Crosswind Component
Compute Crosswind Using Rwy 17, Wind is
250 deg at 30 Knts

Climb Performance
• Factors Influencing Are:
– Weight and Balance
– Density Altitude
– Airplane Configuration (flaps, gear)

Climb Performance (cont.)
• Weight
– Increased Weight Decreases Climb Performance
• Balance
– Aft CG (Within Limits – Reduces Aircraft Effective Weight and Increases Climb Performance)
– Forward CG (Within Limits – Increases Aircraft Effective Weight and Reduces Climb Performance)
– Outside of CG Range – You Become a Test Pilot!
Climb Performance (cont.)
• Density Altitude
– Built Into Climb Charts in POH
• Aircraft Configuration
– Again – See Climb Charts
– Pay Attention to Notes
• Don’t Try to Be a Test Pilot

Climb Performance (cont.)
Be Sure to Read Notes
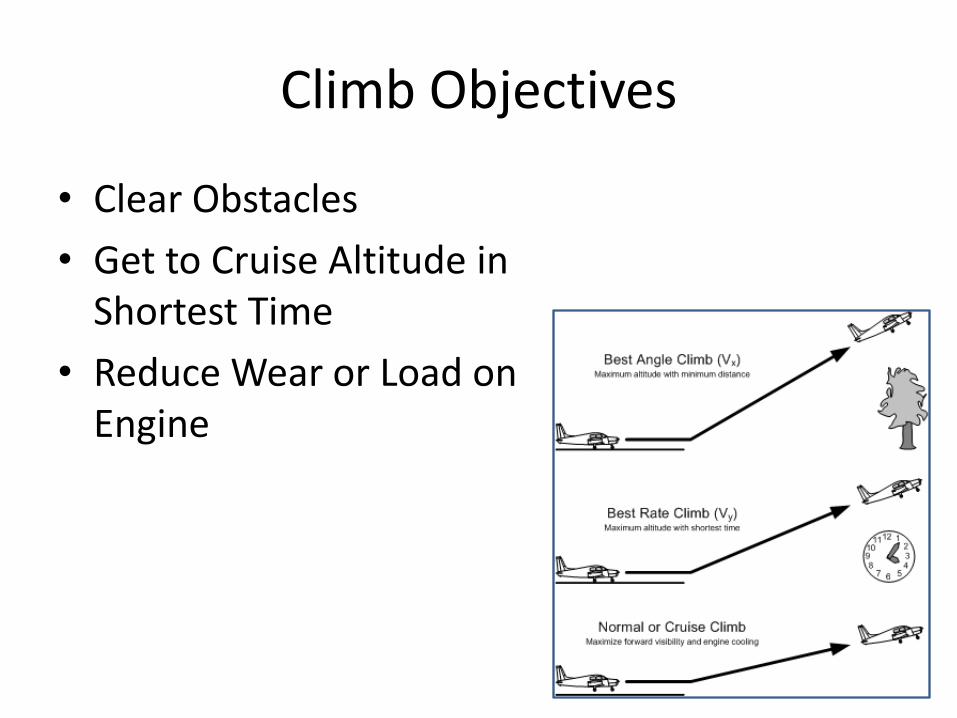
Climb Objectives
• Clear Obstacles
• Get to Cruise Altitude in Shortest Time
• Reduce Wear or Load on Engine
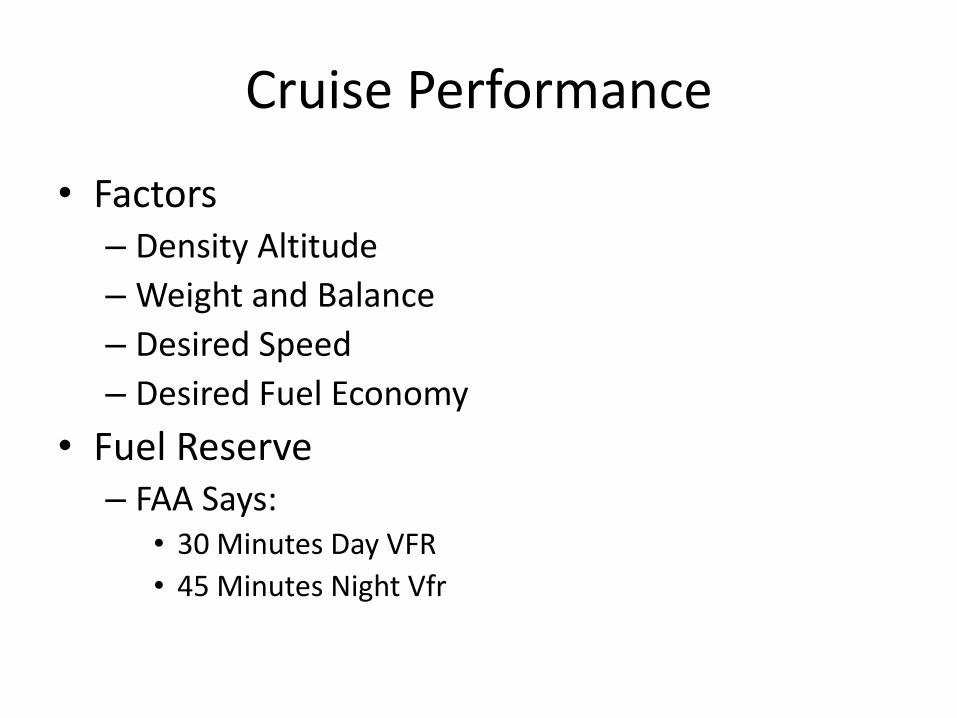
Cruise Performance
• Factors – Density Altitude
– Weight and Balance
– Desired Speed
– Desired Fuel Economy
• Fuel Reserve – FAA Says:
• 30 Minutes Day VFR
• 45 Minutes Night Vfr
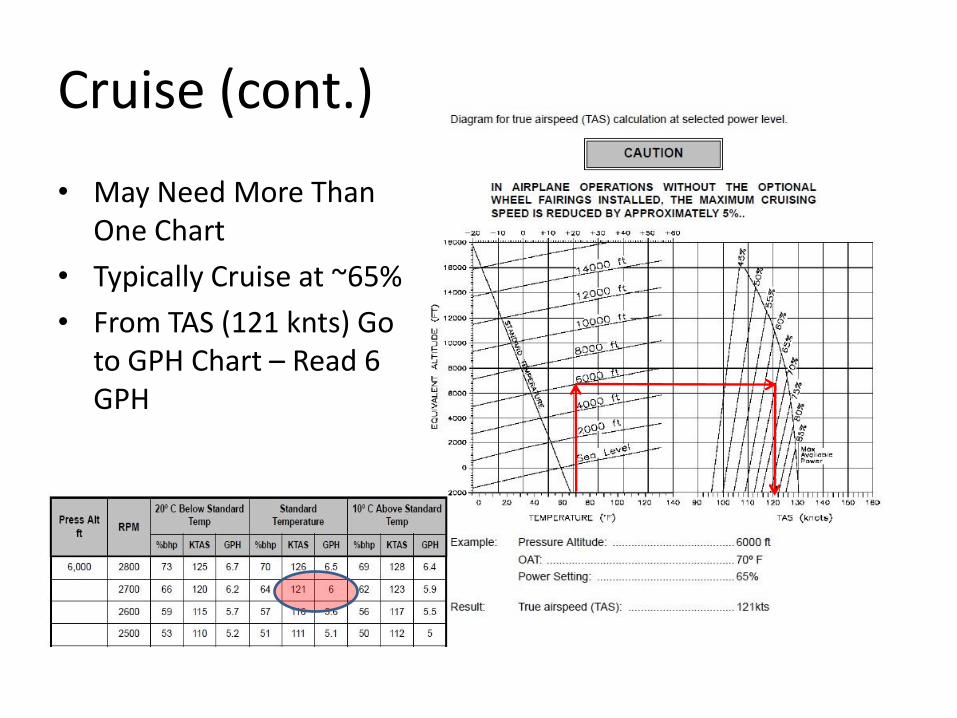
Cruise (cont.)
• May Need More Than One Chart
• Typically Cruise at ~65%
• From TAS (121 knts) Go to GPH Chart – Read 6 GPH
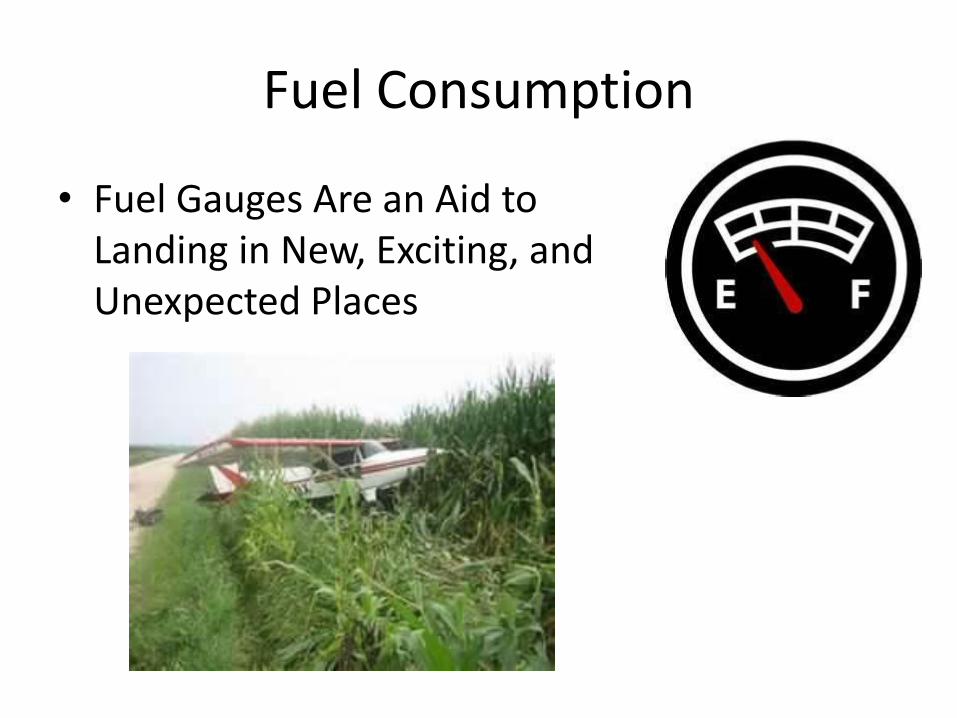
Fuel Consumption
• Fuel Gauges Are an Aid to Landing in New, Exciting, and Unexpected Places
Fuel Management
• Do’s – Keep a Log of Fuel Usage – Keep Track of Engine Run Times and Different Fuel
Consumptions (Takeoff, Enroute, Runup, Taxi, Maneuvering, Alternate)
– Know the POH – Fly at Specified Power Settings – Be Conservative – Drain and Take a Fuel Sample Before Each Flight – ‘Stick’ the Fuel Tanks – Be Conservative in Fuel Reserves

Fuel Management (cont.)
• Don’ts
– Trust the Fuel Gauge
– Push to the Limits on Range
– Assume Line Staff Filled Your Plane with Proper Fuel
Weight and Balance
• Next Session
• Read Below
• http://www.faa.gov/library/manuals/aviation/pilot_handbook/media/PHAK%20-%20Chapter%2009.pdf
• Weight and Balance Example Using Diamond DA20-C1 (online)