aircraft, satellite measurements and numerical simulations of gravity waves in the extra-tropical...
TRANSCRIPT

Aircraft, Satellite Measurements and Numerical Simulations of Gravity Waves in
the Extra-tropical UTLS Region
Meng Zhang, Fuqing Zhang and Gang Ko Penn State University
Kenneth Bowman Laura Pan Elliot Atlas Texas A&M University NCAR University of Miami
UTLS Workshop, Boulder, Oct. 2009

Outlines:
• Observational (AMSU-A) and modeling (WRF) evidences of gravity-wave activities over extra-tropical baroclinic jet-front system.
• Significant levels (UTLS) and momentum fluxes of jet-front gravity waves
• Aircraft measurements for jet-front gravity waves in Research Flight 02 (RF-02) of START08
• Sensitivity tests for the generation mechanisms of jet-front gravity waves in RF-02

Monthly Mean Gravity Waves and Jet Streak of Jan 2003MM5 Simulation AMSU-A Observation and NCEP Analysis
Monthly mean gravity-wave KE (wavelength between 200~600 km, m2 s-2 ) at 21 km (shaded)
and jet streaks at 12 km (dash line)
Monthly radiance variance (K2 ) map at channel 10 (shaded, 21 km equivalent) and NCEP analysis jet
streaks at 12 km(dash line)
*** AMSU-A data are provided by NOAA 15, 16, 17 with same specifications
2 2 21( ' ' ' )2
KE u v w
Favorite regions for gravity wave generations:• Jet-Front GW: Northwestern Atlantic• Topographic GW: The Rockies, Appalachians and Greenland
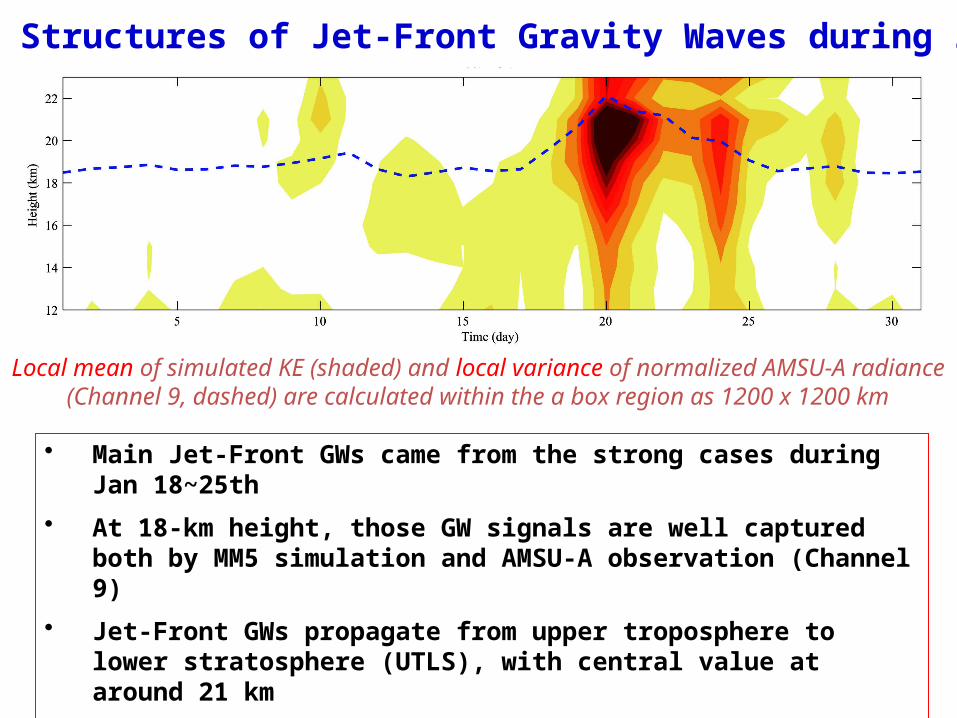
Vertical Structures of Jet-Front Gravity Waves during Jan 2003
Local mean of simulated KE (shaded) and local variance of normalized AMSU-A radiance (Channel 9, dashed) are calculated within the a box region as 1200 x 1200 km
• Main Jet-Front GWs came from the strong cases during Jan 18~25th
• At 18-km height, those GW signals are well captured both by MM5 simulation and AMSU-A observation (Channel 9)
• Jet-Front GWs propagate from upper troposphere to lower stratosphere (UTLS), with central value at around 21 km
• Reflected GWs may occur near model top

Monthly Mean Momentum Flux of Gravity Waves
Unit in x10-2 m s-2
' 'u w ' 'v w
•Positive (negative) means eastward (westward) GW propagation relative to mean flows•Positive (negative) means northward (southward) GW propagation relative to mean flows
' 'u w
' 'v w
Gravity wave breaking at upper atmosphere can impact not only mean flow structures and also trace gases mixing, hence plays an important role for atmospheric energy and species transportation over stratosphere.
Wavelength 200~600 km
Band-pass filter with cut-off wavelength at 200 and 600 km are used to extract the wave signals, respectively
Meridional componentZonal component

Flight track of RF-02 in START08: 18Z April 21 ~ 02Z April 22 20085-km WRF simulations initialized from Real-time EnKF analysis are plotted at every 10 min
Simulated divergence (-red, +blue) at 12.5 km, Jet Strength (shaded) and pressure (thick black) at 9kmFlight track is in green, and the exact flight position at every 10 min is dotted
Simulated SLP (black line), surface winds (vector) and Max Reflectivity (shaded)Two surveys of RF-02: (1) Along jet; (2) Over Rockies

Comparisons of Turbulent Components: Obs, GFS and WRFA band-pass filter with cut-off wavelength between 50~250 km is applied on all data sets, which is used to extract the turbulent components of Jet-Front GWs
Outbound flight (18:30 ~ 20:20 UTC) Inbound flight (20:30 ~ 22:30 UTC)
U’
V’
W’
T’
obs (black) against GFS analysis (green), WRF-GFS (blue) and WRF-EnKF (red)

Full physics Dry run Flat topography
Numerical Sensitivity Exp for Jet-front Gravity Waves during RF-02
22 UTC April 21 22 UTC April 21 00 UTC April 22
A
B
A
B
It was mostly dry environment over the Rockies, so that the dry-run without moist convections produced similar gravity waves over that region
Over the plains, most of the gravity waves were not shown up in dry run; and thus they are mainly convectively forced
In flat-topography Exp, the jet gravity waves were appeared 2-h later than the other two runs, likely due to modulations of the background jet by topography
B
A

Generation of Gravity Waves: imbalance in Jet Streak (Zhang 2004)
Full physics Dry run Flat topography
22 UTC April 21 22 UTC April 21 00 UTC April 22
Dry dynamic (balance adjustment) may dominate over the jet streak
Similar features were found for the gravity waves in flat-topo Exp, but at higher level. It is said that the changes of background flow may have impacts on the critical level of them.
Cross sections (A-B): Tropopause (1.5 PVU), GWs (+,-divergence) and Convections (dbz)

Summary
•Strong gravity wave activities are found both in the simulation and the AMSU-A observations over Northwestern Atlantic, which is related to the major extra-tropical baroclinic jet-front system.
•The Momentum flux impact on main flows can be significant for jet-front gravity waves over UTLS levels, which usually propagate against the main flows.
•Aircraft in-situ observations of RF-02 START08 captured considerable gravity-wave signals over extra-tropical jet-front regions, where 5-km WRF simulation also can provide consistent wave features with 50~250 km wavelength.
•Sensitivity experiments show that the imbalance adjustment over strong jet streak (Zhang 2004) may be the generation mechanism for the GWs in RF-02