airline pilot supply and demand - halldale chowdhury... · active first class medical holders by...
TRANSCRIPT

ErfanChowdhury
Airline Pilot Supply and Demand: Current State following change in Legislation
Management Consultant
Presented at The 19th World Aviation Training Conference
Orlando, Florida.
Sponsors
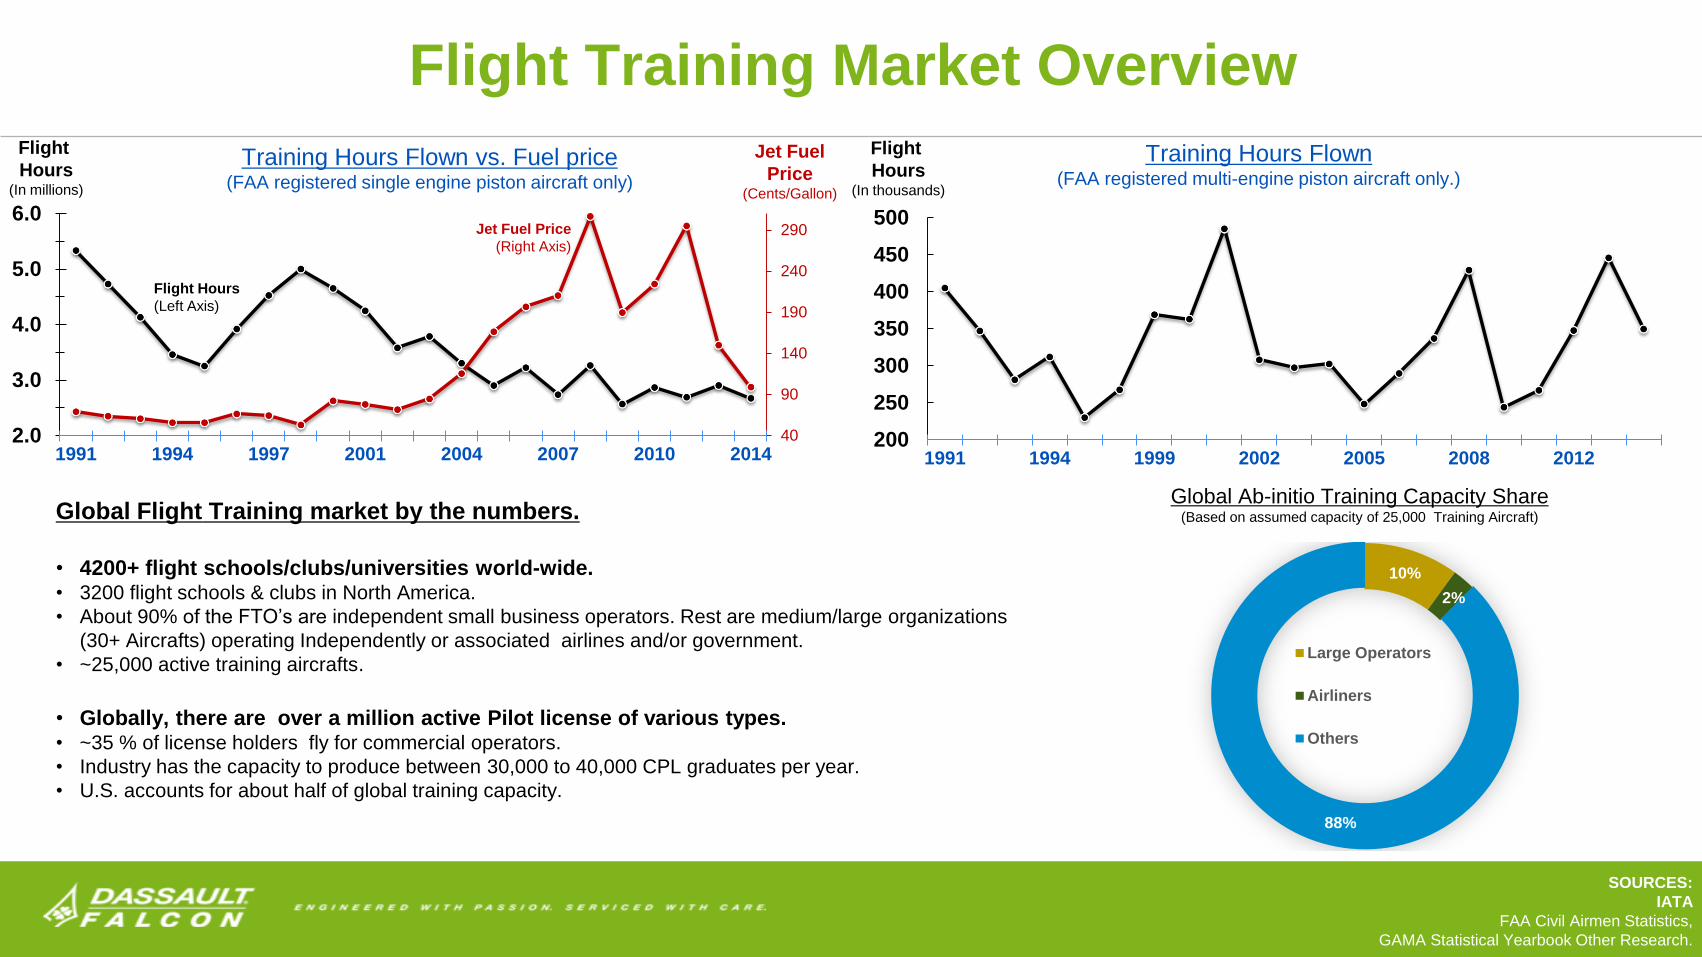
Global Flight Training market by the numbers.
• 4200+ flight schools/clubs/universities world-wide.• 3200 flight schools & clubs in North America.
• About 90% of the FTO’s are independent small business operators. Rest are medium/large organizations
(30+ Aircrafts) operating Independently or associated airlines and/or government.
• ~25,000 active training aircrafts.
• Globally, there are over a million active Pilot license of various types. • ~35 % of license holders fly for commercial operators.
• Industry has the capacity to produce between 30,000 to 40,000 CPL graduates per year.
• U.S. accounts for about half of global training capacity.
10%
2%
88%
Large Operators
Airliners
Others
Global Ab-initio Training Capacity Share(Based on assumed capacity of 25,000 Training Aircraft)
40
90
140
190
240
290
2.0
3.0
4.0
5.0
6.0
1991 1994 1997 2001 2004 2007 2010 2014
Flight
Hours(In millions)
Jet Fuel
Price(Cents/Gallon)
Training Hours Flown vs. Fuel price(FAA registered single engine piston aircraft only)
Jet Fuel Price
(Right Axis)
Flight Hours
(Left Axis)
SOURCES:
IATA
FAA Civil Airmen Statistics,
GAMA Statistical Yearbook Other Research.
200
250
300
350
400
450
500
1991 1994 1999 2002 2005 2008 2012
Training Hours Flown (FAA registered multi-engine piston aircraft only.)
Flight
Hours(In thousands)
Flight Training Market Overview
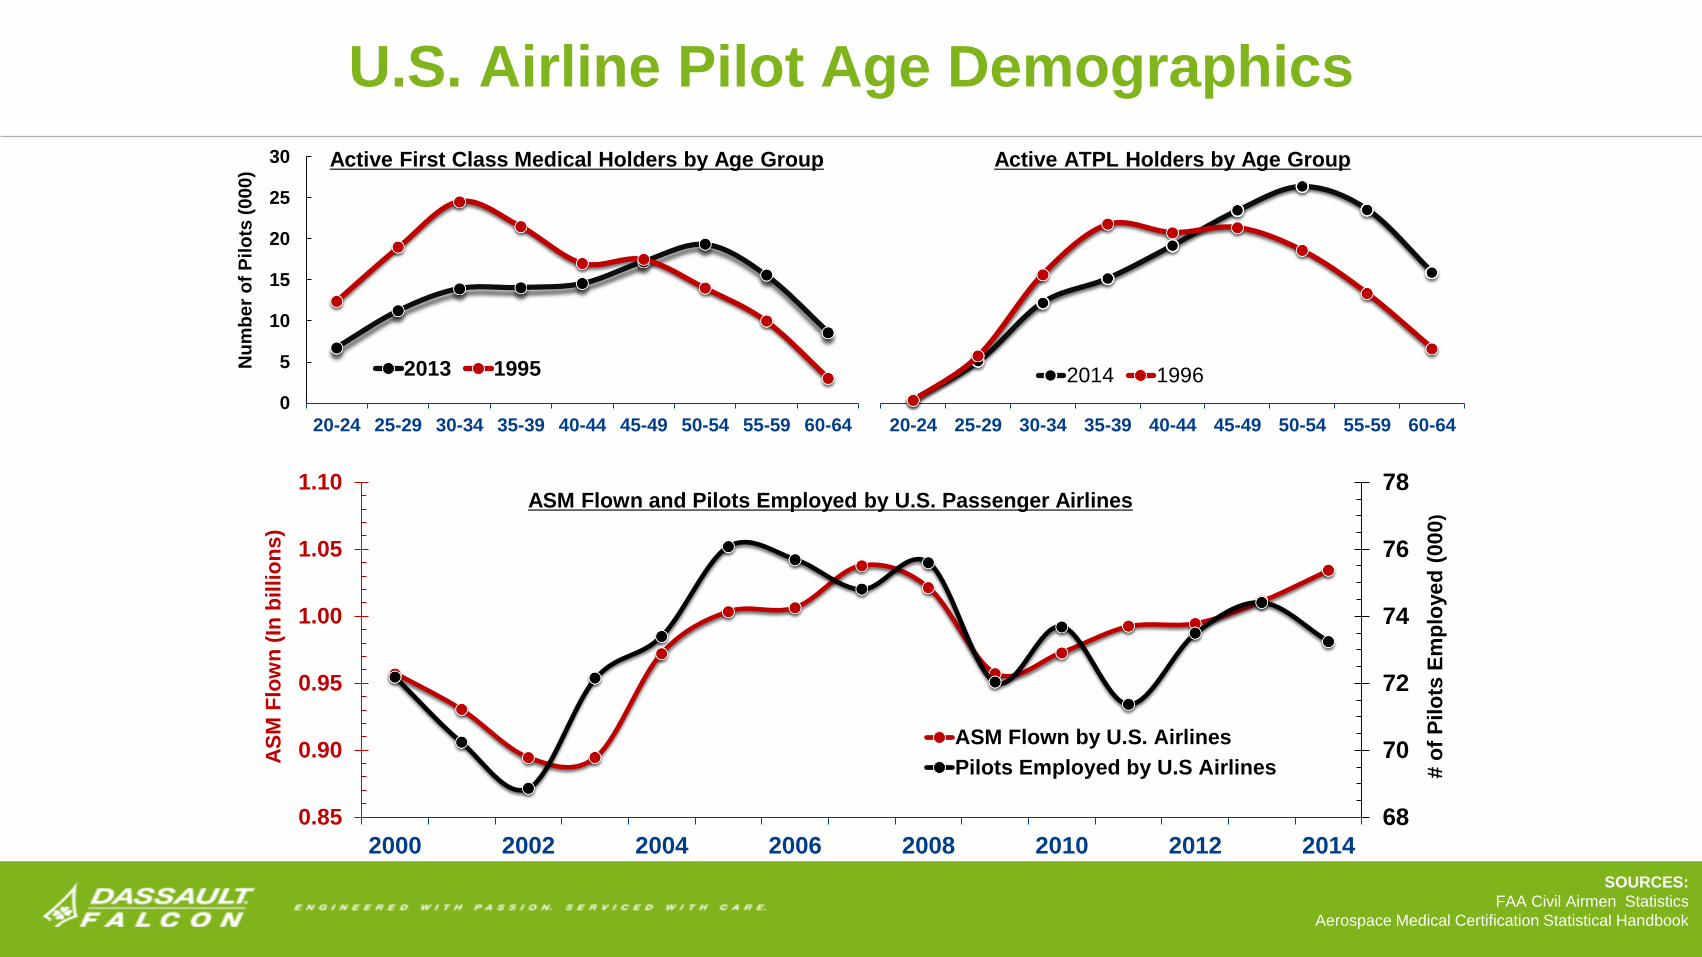
U.S. Airline Pilot Age Demographics
0
5
10
15
20
25
30
20-24 25-29 30-34 35-39 40-44 45-49 50-54 55-59 60-64
2013 1995
20-24 25-29 30-34 35-39 40-44 45-49 50-54 55-59 60-64
2014 1996
Active First Class Medical Holders by Age Group Active ATPL Holders by Age Group
68
70
72
74
76
78
0.85
0.90
0.95
1.00
1.05
1.10
2000 2002 2004 2006 2008 2010 2012 2014
ASM Flown by U.S. Airlines
Pilots Employed by U.S Airlines
ASM Flown and Pilots Employed by U.S. Passenger Airlines
Nu
mb
er
of
Pil
ots
(0
00
)
AS
M F
low
n (
In b
illio
ns)
# o
f P
ilo
ts E
mp
loyed
(000
)
SOURCES:
FAA Civil Airmen Statistics
Aerospace Medical Certification Statistical Handbook
500
1000
1500
1800
Low
Demand
High
Demand
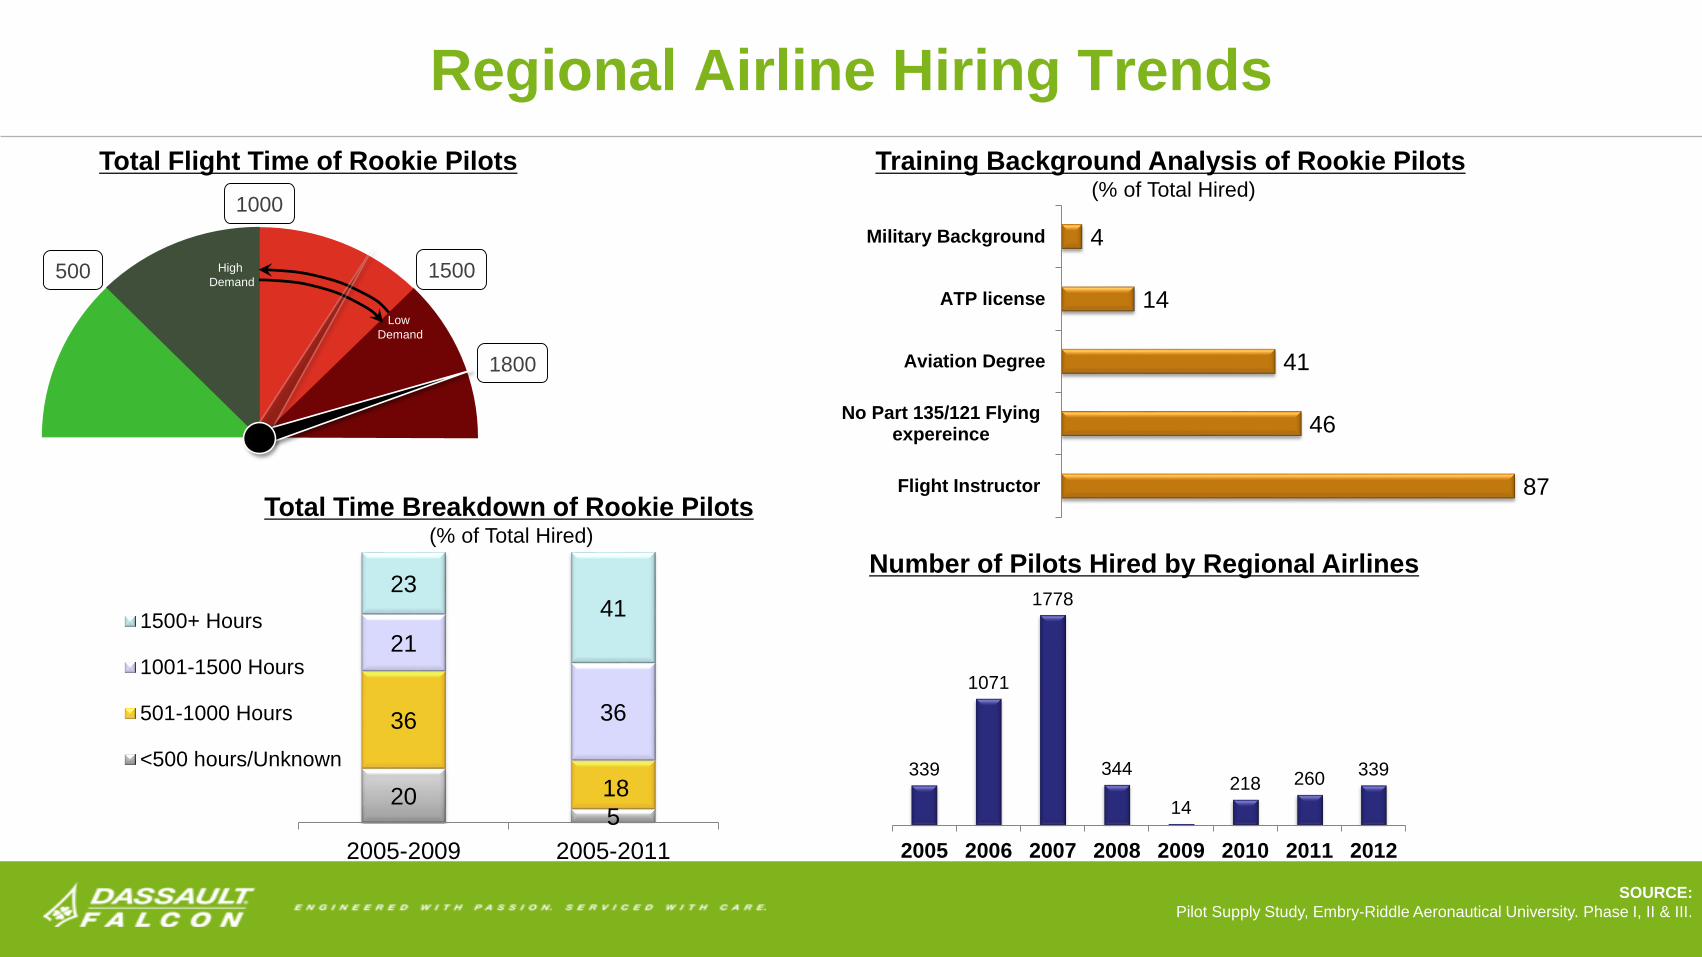
Total Flight Time of Rookie Pilots Training Background Analysis of Rookie Pilots(% of Total Hired)
339
1071
1778
344
14
218 260339
2005 2006 2007 2008 2009 2010 2011 2012
Number of Pilots Hired by Regional Airlines
87
46
41
14
4
Flight Instructor
No Part 135/121 Flyingexpereince
Aviation Degree
ATP license
Military Background
205
36
18
21
36
2341
2005-2009 2005-2011
1500+ Hours
1001-1500 Hours
501-1000 Hours
<500 hours/Unknown
Total Time Breakdown of Rookie Pilots(% of Total Hired)
SOURCE:
Pilot Supply Study, Embry-Riddle Aeronautical University. Phase I, II & III.
Regional Airline Hiring Trends
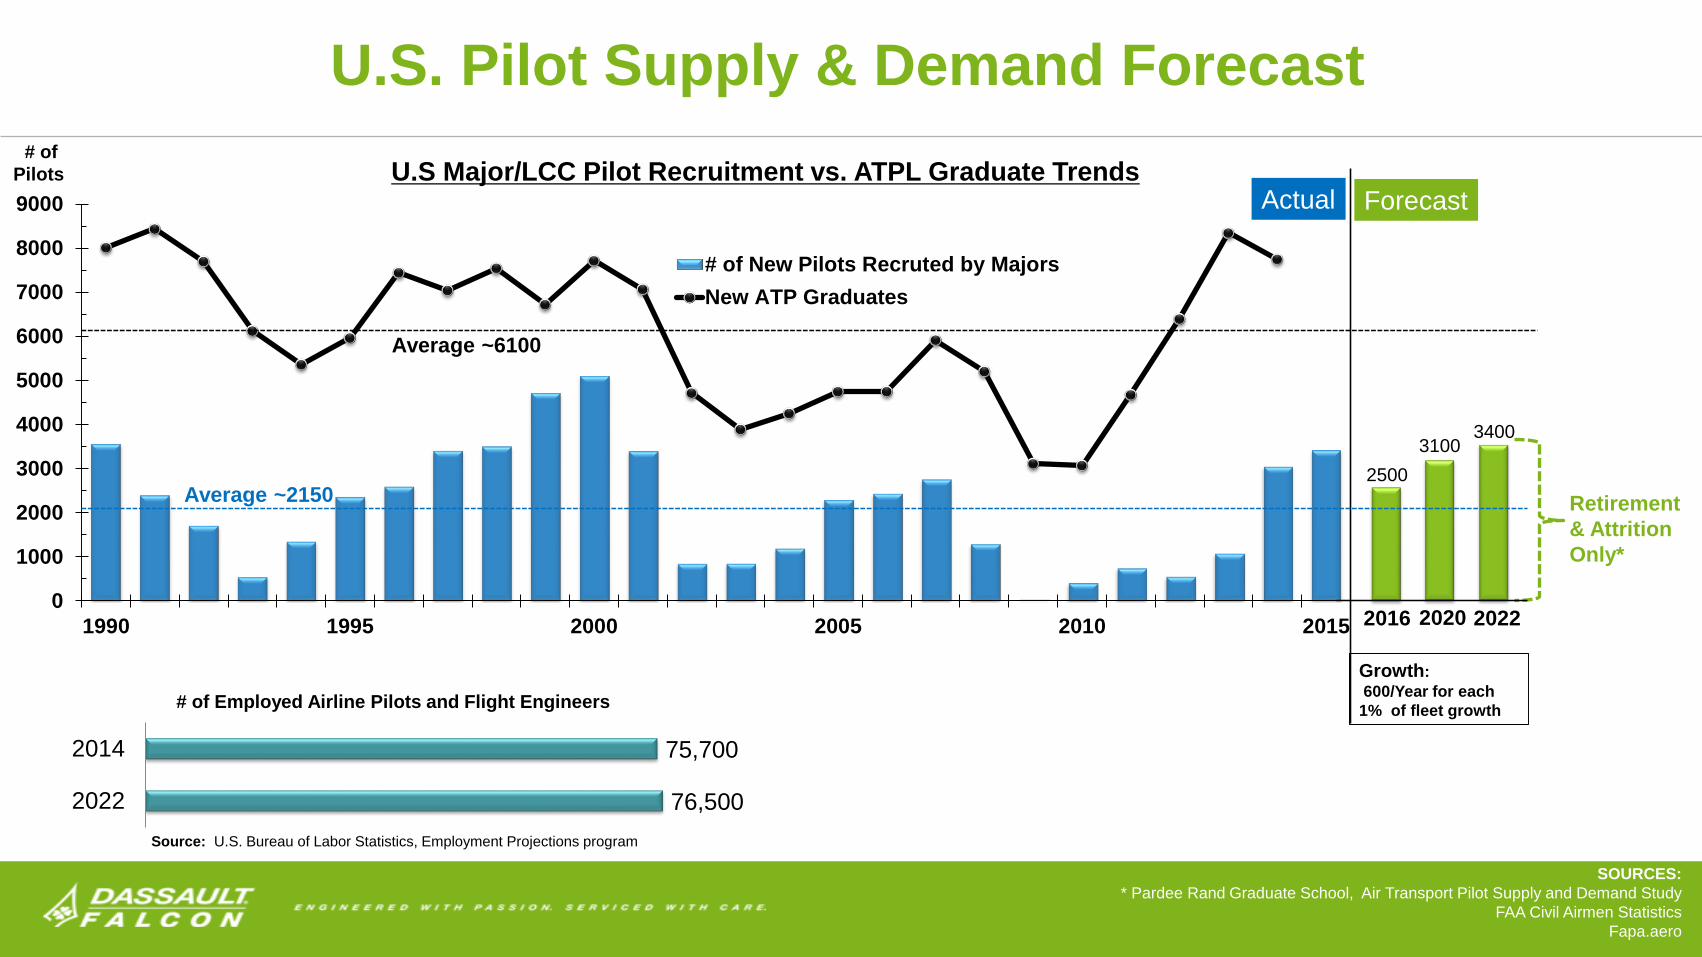
76,500
75,700
2022
2014
0
1000
2000
3000
4000
5000
6000
7000
8000
9000
1990 1995 2000 2005 2010 2015
# of New Pilots Recruted by Majors
New ATP Graduates
Average ~6100
Average ~2150
2016
Actual Forecast
# of Employed Airline Pilots and Flight Engineers
SOURCES:
* Pardee Rand Graduate School, Air Transport Pilot Supply and Demand Study
FAA Civil Airmen Statistics
Fapa.aero
2020 2022
Retirement
& Attrition
Only*
Growth:
600/Year for each
1% of fleet growth
2500
31003400
U.S. Pilot Supply & Demand Forecast
Source: U.S. Bureau of Labor Statistics, Employment Projections program
# of
Pilots U.S Major/LCC Pilot Recruitment vs. ATPL Graduate Trends
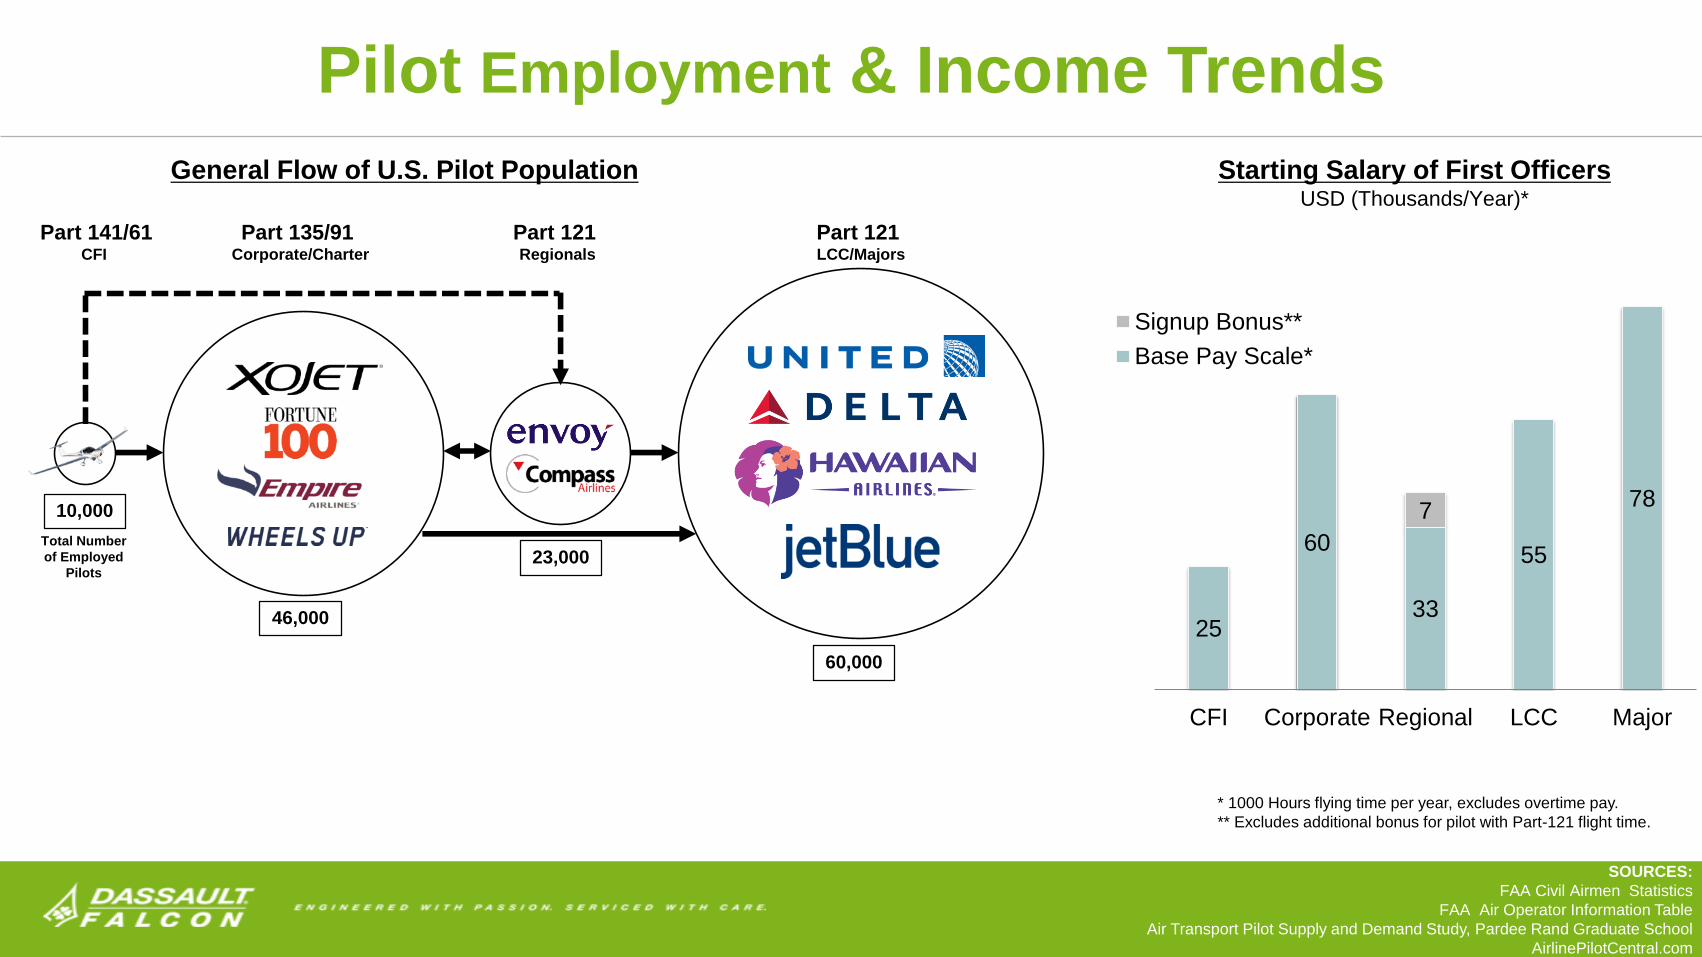
Pilot Employment & Income Trends
25
60
33
55
787
CFI Corporate Regional LCC Major
Signup Bonus**
Base Pay Scale*
General Flow of U.S. Pilot Population Starting Salary of First OfficersUSD (Thousands/Year)*
Part 141/61CFI
Part 135/91 Corporate/Charter
Part 121 Regionals
Part 121 LCC/Majors
Total Number
of Employed
Pilots
10,000
46,000
23,000
60,000
SOURCES:
FAA Civil Airmen Statistics
FAA Air Operator Information Table
Air Transport Pilot Supply and Demand Study, Pardee Rand Graduate School
AirlinePilotCentral.com
* 1000 Hours flying time per year, excludes overtime pay.
** Excludes additional bonus for pilot with Part-121 flight time.
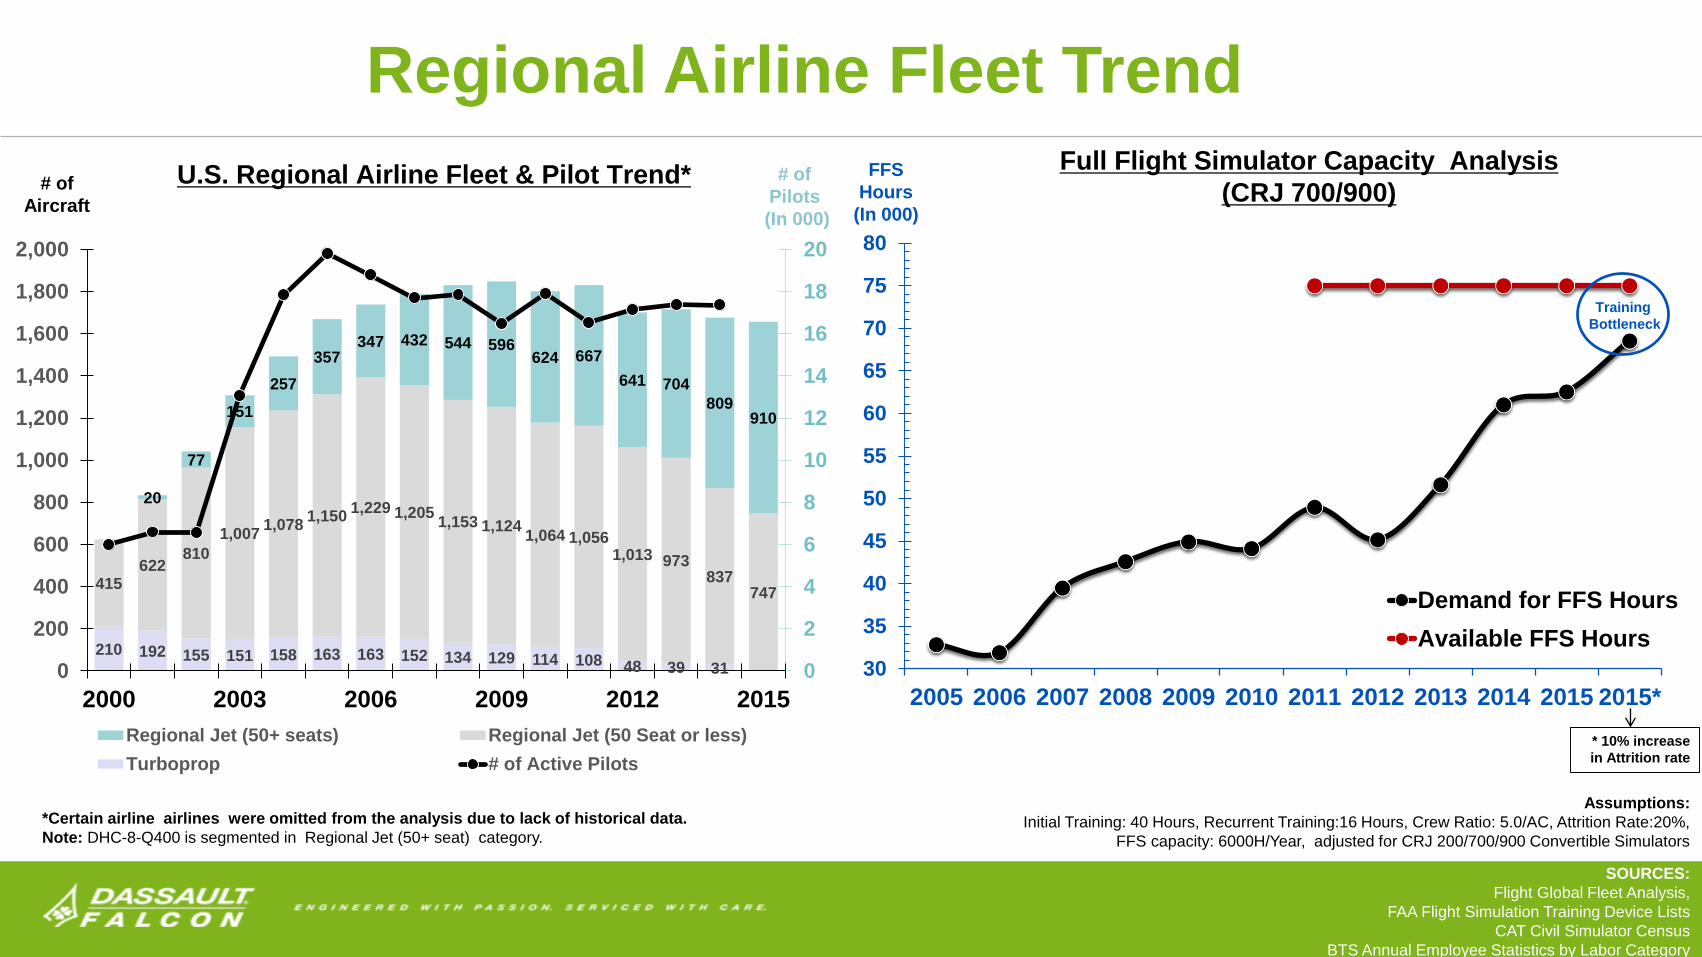
Regional Airline Fleet Trend
210 192 155 151 158 163 163 152 134 129 114 108 48 39 31
415622
810
1,0071,078
1,1501,229 1,205
1,153 1,1241,064 1,056
1,013 973837
747
20
77
151
257
357347 432 544 596
624 667
641 704
809910
0
2
4
6
8
10
12
14
16
18
20
0
200
400
600
800
1,000
1,200
1,400
1,600
1,800
2,000
2000 2003 2006 2009 2012 2015
Regional Jet (50+ seats) Regional Jet (50 Seat or less)
Turboprop # of Active Pilots
30
35
40
45
50
55
60
65
70
75
80
2005 2006 2007 2008 2009 2010 2011 2012 2013 2014 2015 2015*
Demand for FFS Hours
Available FFS Hours
Full Flight Simulator Capacity Analysis
(CRJ 700/900) FFS
Hours
(In 000)
# of
Pilots
(In 000)
# of
Aircraft
U.S. Regional Airline Fleet & Pilot Trend*
Assumptions:
Initial Training: 40 Hours, Recurrent Training:16 Hours, Crew Ratio: 5.0/AC, Attrition Rate:20%,
FFS capacity: 6000H/Year, adjusted for CRJ 200/700/900 Convertible Simulators
SOURCES:
Flight Global Fleet Analysis,
FAA Flight Simulation Training Device Lists
CAT Civil Simulator Census
BTS Annual Employee Statistics by Labor Category
Training
Bottleneck
* 10% increase
in Attrition rate
*Certain airline airlines were omitted from the analysis due to lack of historical data.
Note: DHC-8-Q400 is segmented in Regional Jet (50+ seat) category.
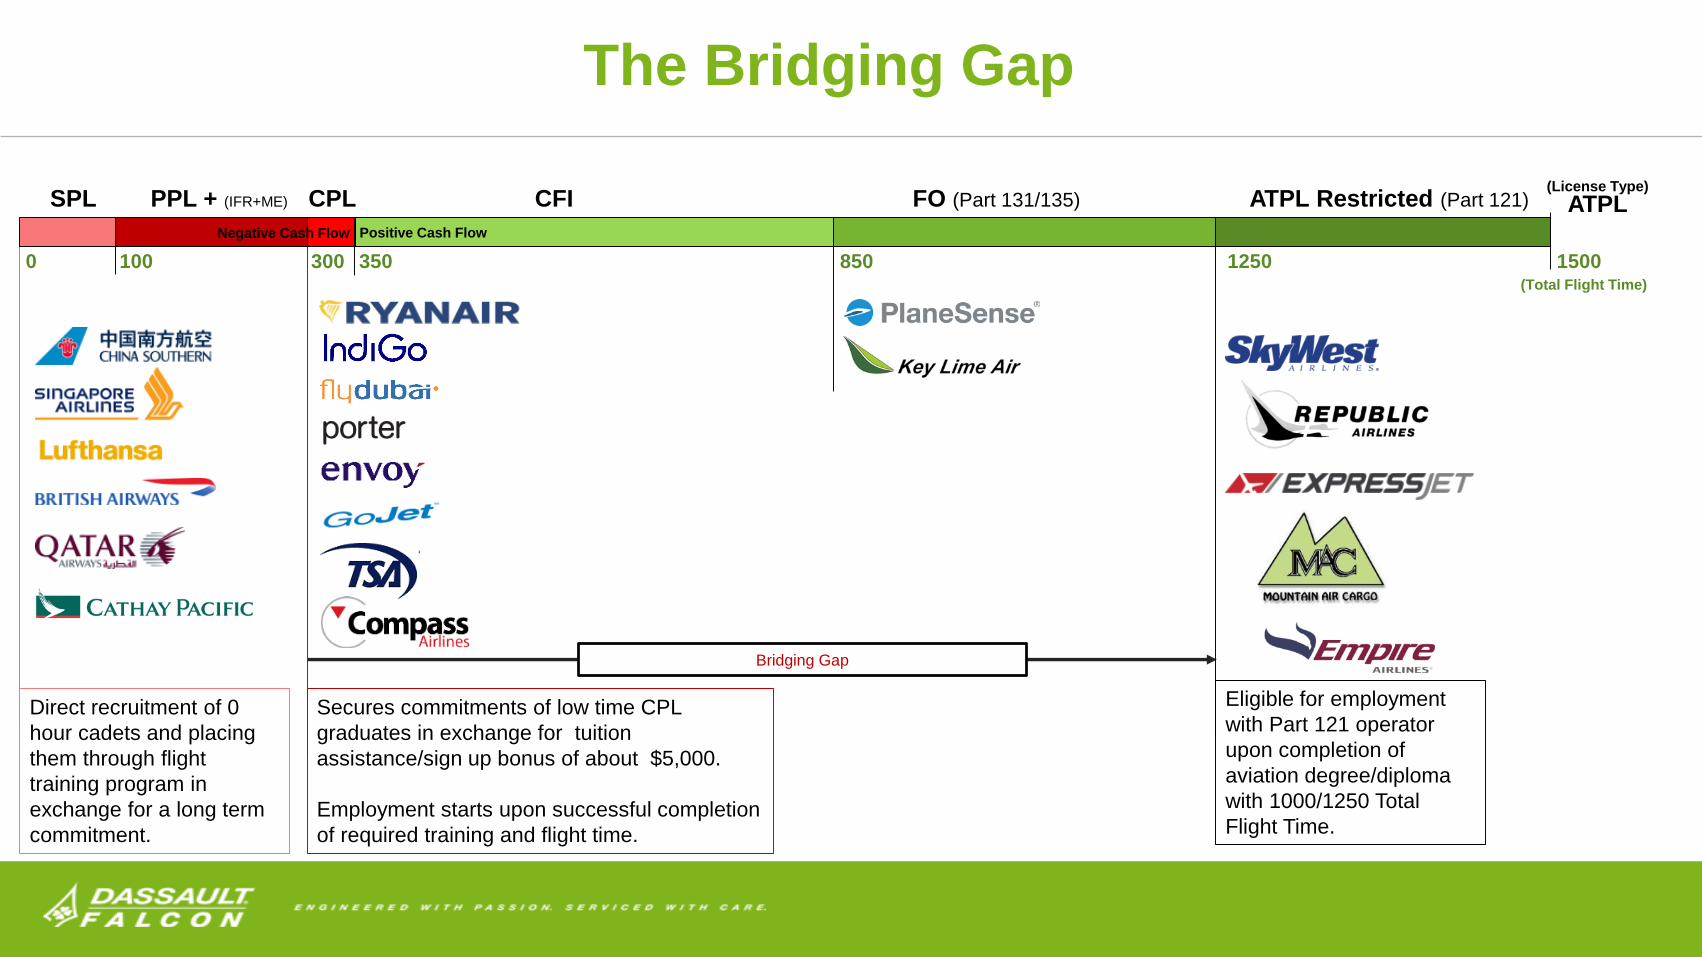
SPL PPL + (IFR+ME)
100 300
FO (Part 131/135)
8500
CFI
350
ATPL Restricted (Part 121) ATPL
Bridging Gap
1250
Direct recruitment of 0
hour cadets and placing
them through flight
training program in
exchange for a long term
commitment.
Secures commitments of low time CPL
graduates in exchange for tuition
assistance/sign up bonus of about $5,000.
Employment starts upon successful completion
of required training and flight time.
1500(Total Flight Time)
(License Type)CPL
Eligible for employment
with Part 121 operator
upon completion of
aviation degree/diploma
with 1000/1250 Total
Flight Time.
The Bridging Gap
Negative Cash Flow Positive Cash Flow
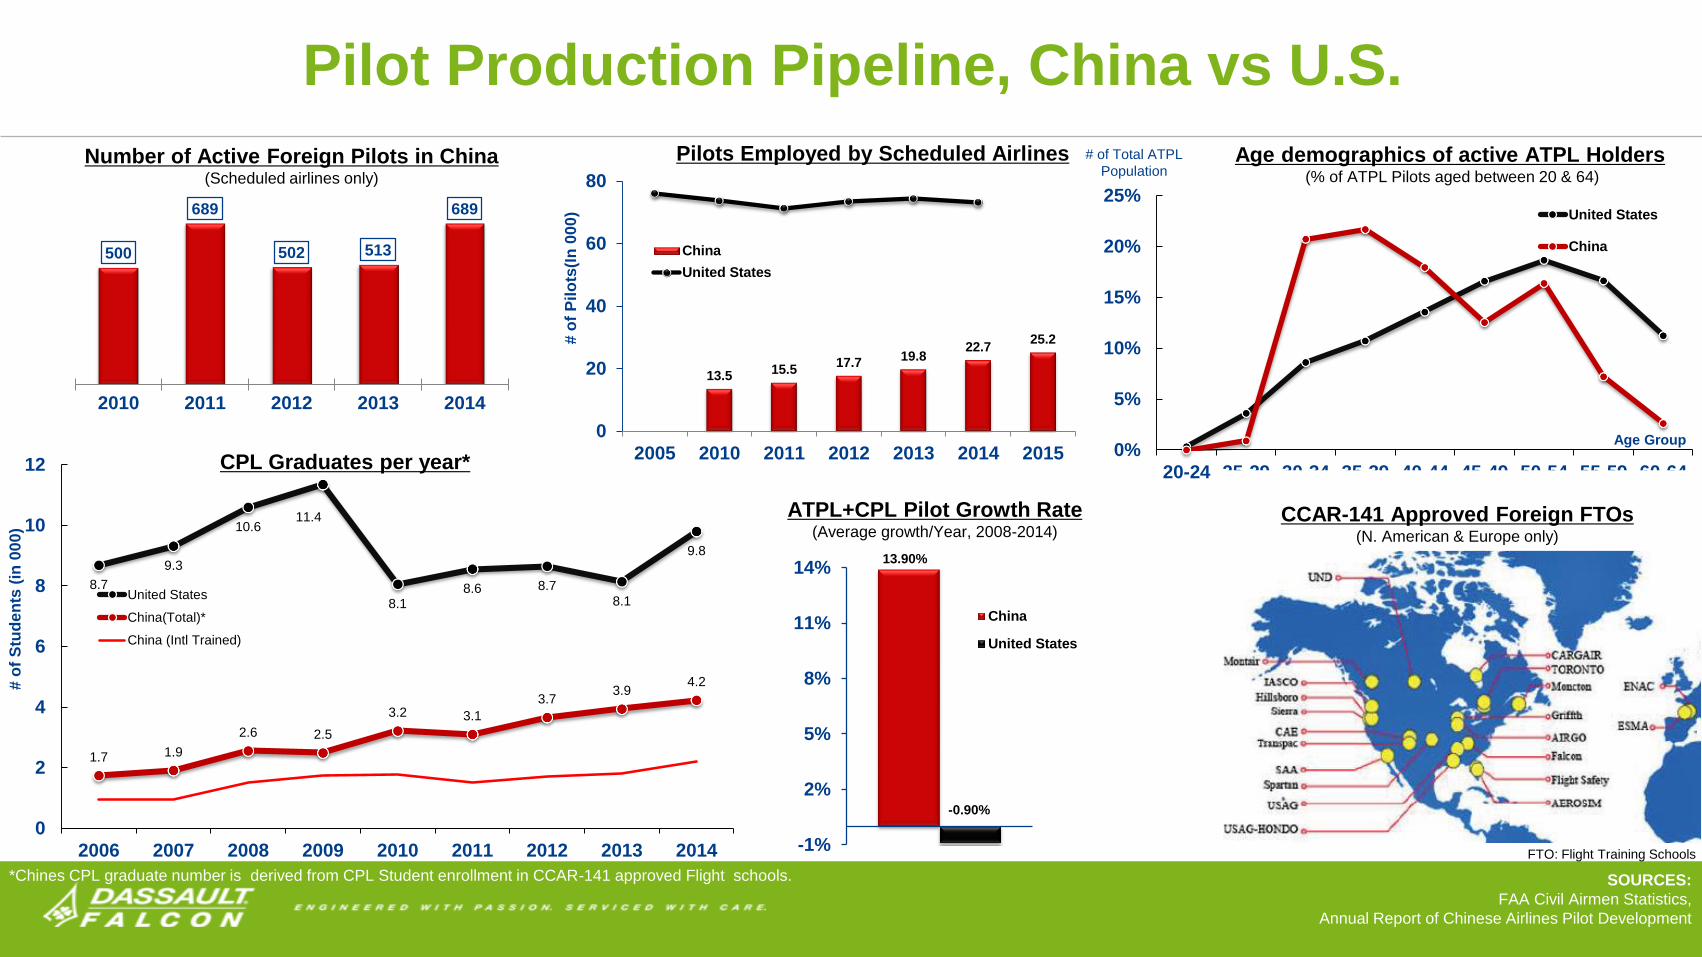
Pilot Production Pipeline, China vs U.S.
0%
5%
10%
15%
20%
25%
20-24 25-29 30-34 35-39 40-44 45-49 50-54 55-59 60-64
United States
China
Age demographics of active ATPL Holders(% of ATPL Pilots aged between 20 & 64)
Pilots Employed by Scheduled Airlines
13.90%
-0.90%
-1%
2%
5%
8%
11%
14%
China
United States
ATPL+CPL Pilot Growth Rate (Average growth/Year, 2008-2014)
500
689
502 513
689
2010 2011 2012 2013 2014
Number of Active Foreign Pilots in China(Scheduled airlines only)
# o
f P
ilo
ts(I
n 0
00
)
# of Total ATPL
Population
Age Group
CCAR-141 Approved Foreign FTOs(N. American & Europe only)
8.7
9.3
10.611.4
8.18.6 8.7
8.1
9.8
1.7 1.9
2.6 2.5
3.2 3.1
3.73.9
4.2
0
2
4
6
8
10
12
2006 2007 2008 2009 2010 2011 2012 2013 2014
United States
China(Total)*
China (Intl Trained)
13.515.5
17.719.8
22.725.2
0
20
40
60
80
2005 2010 2011 2012 2013 2014 2015
China
United States
CPL Graduates per year*
# o
f S
tud
en
ts (
in 0
00
)
SOURCES:
FAA Civil Airmen Statistics,
Annual Report of Chinese Airlines Pilot Development
*Chines CPL graduate number is derived from CPL Student enrollment in CCAR-141 approved Flight schools.
FTO: Flight Training Schools
Summary and Conclusion
Current pool and projected supply of pilots should be sufficient for the overall industry to
replace the substantial number pilots who is expected to retire of over the next 10 years.
In the short term, some regionals are finding it difficult to attract sufficient number of first
officers required to fulfill their flight schedule. This is driven mostly by a combination of
following factors:
Low pay compared alternative opportunities within the industry.
Shrinking pool of qualified flight instructors.
Lack of bridging opportunity to obtain mandatory minimum flight hours.(750 to 1,500 Total Time).
Lack of long term employment commitment from rookie pilots and subsequent high attrition rate.
However, the current supply of pilots will not be sufficient for the industry to sustain growth for
a prolong period.
A coordinated respond by all stakeholders is necessary to increase the size of qualified pool
of pilots available to the industry.

Proposed Solutions
Short term: Bridging agreement.
With Part 141/135/91/foreign/Cargo Operators.
Increase payment.
Starting salary in regionals reaching sustainable level.
Upstream recruitment.
Offer employment prior to CPL completion.
Reduction of attrition rate.
Secure long term commitment from rookie pilots.
Hire foreign trained senior captains at the top instead of
Low hour first officers at the bottom.
Long term: Offer sustainable bridging solution or reduce minimum mandatory total time requirement.
UAV Flying, Second Officers.
Coordinated effort to increase pilot pool to a sustainable level.
Cadet Programs.
Large number of un-employed/underemployed pilots are not good for the industry.
Adaptation of new training concepts like MPL.
Reduce cost of Flight Training.
Reduce cost of aircraft, Simulators and other training equipment.
Involve retired pilots in flight training.
Questionable long term sustainability! Levy on each passenger ticket sold.
May Create Oversupply of pilots,
Increase cost of training
Create additional layer of bureaucracy.
Create in-fighting between various segments of the industry.
Raise Mandatory Retirement Age
Postpone the problem instead of solving them.
Importation of foreign trained pilots.
Create large pool of unemployed domestic pilots.
Shrink the size of domestic training industry.

Questions?