airline pricing behaviour under limited intermodal competition · airline pricing behaviour under...
TRANSCRIPT
AIRLINE PRICING BEHAVIOUR UNDER
LIMITED INTERMODAL COMPETITION∗.
Angela S. Bergantino† Claudia Capozza‡
Abstract
This paper empirically analyses airline pricing for short-haul flights in contexts
with no credible threat of intermodal competition. To this end, we explore the south-
ern Italian market since it is less accessible by other transport modes and fares are,
thus, the straight outcome of air-related competition. We show that market power
matters, in fact, depending on the level of intramodal competition, airlines apply dif-
ferentiated mark-ups. Besides, consistently with the implementation of intertemporal
price discrimination (IPD), we find a non-monotonic intertemporal profile of fares with
a turning point at the 44th day before departure. Finally, we provide evidence that
airlines are more likely to engage in IPD in more competitive markets.
Key words: airfares, market structure, intertemporal price discrimination
JEL: L11, L13, L93
∗Special thanks to Marco Alderighi, Richard Arnott, Michele Bernasconi, Volodymyr Bilotkach, André dePalma, Alberto Gaggero, Andrew Goetz, Kai Hüschelrath, Marc Ivaldi, Claudio Piga and Wesley W. Wilsonfor useful insights on earlier versions. The authors would also like to thank participants at 17th ATRSConference, 5th ICEEE, 5th CRNI Conference, 39th EARIE Conference, 14th SIET Conference, RCEAWorkshop on "The economics and management of leisure, travel and tourism" and 32th AISRe Conferencefor very helpful comments and suggestions. All remaining errors are ours.†University of Bari "Aldo Moro", email: [email protected].‡University of Bari "Aldo Moro", email: [email protected].
1

I INTRODUCTION
There are three sources of competition in the airline market for short-haul flights which jointly
affect fares. Airlines compete with other airlines for the same city-pair markets (intramodal
competition). Moreover, airlines compete with other modes of transport (intermodal com-
petition) as trains, especially high speed trains, and cars, which give the advantage to travel
at any time. Finally, airlines compete with themselves by setting different fares in differ-
ent time periods prior to departure. This pricing strategy is known as intertemporal price
discrimination (IPD).
Past empirical contributions exploring pricing behaviour and competition in air trans-
portation were not able to control for the effect of intermodal competition which, we can
expect, affected the results. This paper differs from existing works as it attempts to study
airline pricing for short-haul flights in contexts with no credible threat of intermodal com-
petition in order to shed light on pricing behaviour in response to the pure air-related com-
petition. To this scope, we analyse a market, southern Italy, which definitely shows a highly
limited degree of intermodal competition. On the connections considered, in fact, services
by alternative modes, including road transport, require, on average, more than seven times
the same travelling time as airline connections. For these peripherical areas, air transport is,
thus, often the only realistic alternative. It can be assumed, therefore, that airline pricing
strategies are the straight result of air-related competition. The pricing behaviour of airline
companies show also high variability of fares per mile which unlikely can be justified by cost
differentials, while might be considered as evidence of different degrees of market power and,
thus, the capacity to determine mark-ups.
In this paper, we deal, basically, with two issues. The first is to measure the extent to
which intramodal competition determines fares. The second is to shed light on the intertem-
poral profile of fares to verify if airlines engage in IPD and whether IPD is of monopolistic-
type or competitive-type. As for the former type, market power is required to price dis-
criminate as it enhances the ability of firms to set and maintain higher mark-ups (Tirole,
2
1988). As for the latter type, market power is not required to sustain price discrimination if
consumers show heterogeneity of brand preferences (Borenstein, 1985 and Holmes, 1989) or
demand uncertainty about departure time (Dana, 1998).
The dataset we use to address the research question is unique. It covers routes that
originates in southern Italy and are operated from November 2006 to February 2011. Data
on fares were collected from airline website to replicate consumer behaviour when making
reservations. Unlike previous contributions, we simulate the purchase of round-trip fares
instead of one-way fares. In this way, we effectively replicate the demand side since travellers
use to purchase round-trip tickets rather than one-way tickets. In addition, we precisely
recreate the supply side as we can clearly see if, for each round-trip flight, a carrier is a
feasible alternative for travellers and an effective competitor.
Our results on short-haul markets with no alternative modes of transport point out
that when the intramodal competition reduces, airlines set higher fares since they exploit
the greater market power arising from a concentrated market structure. Specifically, 10%
increase of market share allows carriers to post up to 6.4% higher fares. Consistently with
the implementation of IPD, we find a non-monotonic intertemporal profile of fares - which
can be roughly approximated by a J-curve - with a turning point at the 44th day before
departure. Our claim is that, on the one hand, the non-monotonicity would be the evidence
that airlines exploit consumer bounded rationality. Actually, a common wisdom among
travellers is "the later you buy, the more you pay the ticket", thus price sensitive consumers
tend to buy in advance. Airlines, aware of this, can extract a greater surplus by setting
moderately higher fares for very-early purchasers that will buy the tickets believing to pay
the cheapest fares. On the other hand, a higher fare for very-early purchasers can be seen
as a fee for risk-aversion. Finally, we provide evidence of a competitive-type IPD as airlines
seem to be more likely to engage in IPD in more competitive markets.
The remainder of the paper unfolds as follows. In Section 2 we survey the relevant liter-
ature. In Section 3 we present the empirical strategy and in Section 4 we give a description
3
of the data. In Section 5 we discuss the results and in Section 6 we draw conclusions. The
robustness check is provided in the appendix.
II LITERATURE REVIEW
The literature on which the current work is based concerns pricing in air transportation and
the factors influencing it. We initially review papers which analyse the effect of airline market
structure on fares, then we focus on works looking at price discrimination and, in particular,
at intertemporal price discrimination (IPD). We conclude the survey with contributions
exploring the relationship between market structure and price discrimination.
The first to study the impact of market structure on fares was Borenstein (1989) on the
US airline industry. He develops a model using market share at both route and airport level.
Results indicate that market share, whatever measure adopted, influences carrier’s ability to
raise fares since the dominant presence of an airline at an airport increases its market share on
the routes included in that airport. However, Evans and Kessides (1993) point out that, when
controlling for inter-route heterogeneity, market share on the route is no longer relevant in
determining fares, which are, instead, determined by carriers’market share at the airports.
More recently, some contributions explored the European airline markets. Unlike the US
market, Carlsson (2004) finds that market power, measured by the Herfindahl index, does
not have a significant effect on fares whereas it influences flight frequencies. Consistently,
Giaume and Guillou (2004) find a negative and, often, non significant impact of market
concentration for connections from Nice Airport (France) to European destinations. Bachis
and Piga (2007a) measure the effect of market concentration at the origin airport on fares
applied by British carriers, considering either the route or the city-pair level. Their results
reveal the existence of a large degree of substitutability between the routes within a city-pair.
A greater market share at route level leads to higher fares while at city pair level it does
not. Gaggero and Piga (2010) find that higher market share and Herfindhal Index at the
4
city-pair level leads to higher fares on routes connecting the Republic of Ireland to the UK.
Finally, Brueckner et al. (2013) provide a comprehensive analysis of competition and fares
in domestic US markets, focussing on the roles of LCCs and FSCs. They find that FSC
competition in an airport-pair market has a limited effect on fares, whilst competition in a
city-pair market has no effect. In contrast, LCC competition has a strong impact on fares,
whether it occurs in airport-pair markets or in city-pair markets.
As far as concerns price discrimination, the main difference between static and intertem-
poral price discrimination is that two different markets are coverd in the former case whereas
the same market is periodically covered in the latter case. In a theoretical model with two
time periods Logfren (1971) shows that a seller applies, for the same good, higher prices to
consumers with higher purchasing power in the first period and lower prices to consumers
with lower purchasing power in the second period. Stokey (1979) implicitly extend Logfren’s
framework to a continuous of periods. She claims that IPD occurs when goods are "in-
troduced on the market at a relatively high price, at which time they are bought only by
individuals who both value them very highly and are very impatient. Over time, as the price
declines, consumers to whom the product is less valuable or who are less impatient make
their purchases".1 In her paper reference is made to commodity such books, movies, com-
puters and related programmes. The concept, however, has had application to the airline
industry where IPD consists of setting different fares for different travellers according to the
days missing to departure when the ticket is bought. However, differently from markets for
commodities, in the airline industry the intertemporal profile of fares is increasing. Using
IPD, airlines exploit travellers’varied willingness to pay and demand uncertainty about de-
parture time. Price-inelastic consumers, usually business travellers, use to purchase tickets
close to departure date, whilst price-elastic consumers, usually leisure travellers, tend to buy
tickets in advance.2 Actually, Gale and Holmes (1992, 1993) prove that through advance-
1See page 355.2Travellers’heterogeneity appears to be a necessary condition to successfully implement price discrimi-
nation strategies. In a theoretical contribution Alves and Barbot (2009) illustrates that low-high pricing isa dominant strategy for LCCs only if travellers, on a given route, show varied willingness to pay.
5
purchase discounts a monopoly airline can increase the output by smoothing demand of
consumers with weak time preferences over flight times and extract the surplus of consumers
with strong preferences. More recently, Möller and Watanabe (2010) investigate further on
advance-purchase discounts versus clearence sales, showing that the former pricing strategy
is preferred to the latter for airline tickets because their value is uncertain to buyers at the
time of purchase and resaling is costly or diffi cult to implement.
The intertemporal profile of fares has been also empirically explored. McAfee and te
Velde (2006) find out that one week before the departure there is a significant rise in fares,
which is on the top of the rise of two weeks before the departure. Bachis and Piga (2007a)
show that fares posted by British LCCs follow an increasing intertemporal profile. Instead,
Bachis and Piga (2007b), who examine UK connections to and from Europe, and Alderighi
and Piga (2010), that focussed on Ryanair pricing in the UK market, find a U-shaped fare
intertemporal profile. Gaggero and Piga (2010) show that fares for Ireland-UK connections
follows a J-curve. Gaggero (2010) argues that there are three categories of travellers: early-
bookers and middle-bookers, usually leisure travellers, and late-bookers, mostly business
travellers. Early-bookers have a slightly inelastic demand. Families planning holidays are,
for instance, willing to pay moderately higher fares to travel during vacations. Middle-
bookers exhibit the highest demand elasticity as they are more flexible and search for the
cheapest fares. Late-bookers reveal an inelastic demand. A business traveller typically books
the ticket a few days before departure, with fixed travel dates and destination. As a result,
fare intertemporal profile is J-shaped as it reflects a pattern opposite to that of travellers’
demand elasticity.3
One strand of literature explores the relationship between market structure and price
discrimination to find out whether airlines are more willing to engage in price discrimina-
tion strategies when markets are more or less competitive. Traditionally market power en-
3Abrate et al (2010) show that in the hotel industry, hoteliers undertake IPD with two opposite trends.If a room is booked for the working days, last minute prices are lower. Instead if a room is reserved for theweekend, last minute prices are higher.
6
hances the ability of firms to price discriminate. A monopolist can set and maintain higher
mark-ups.4 In the oligopolistic airline industry, when competition increases, carriers lose
this ability. Mark-ups associated with the fares paid by the less price-sensitive (business)
travellers decrease and align with the ones of the more price-sensitive (leisure) travellers.
However, Borenstein (1985) and Holmes (1989) show that market power is not required to
sustain price discrimination if consumers show heterogeneity of brand preferences. Business
travellers prefer the long-run savings given by loyalty programmes, whilst leisure travellers
disregard carriers for short-run savings. Sorting consumers based on strength of brand prefer-
ence is a successful strategy and competition does not prevent firms from pursuing it. When
competition increases, the mark-ups applied to leisure travellers decrease, whereas the mark-
ups applied to business travellers remain almost unchanged. As a result, price discrimination
increases as competition increases. Further, Gale (1993) prove that competition to conquer
less time-sensitive travellers is stronger in an oligopoly than in a monopoly. Competition
reduces fares on the lower end of the distribution thus enhancing price dispersion. Finally,
Dana (1998) shows that price discrimination, in the form of advance purchase discounts,
does not require market power to be implemented. Consumers with more certain demands
are willing to buy in advance because the presence of consumers with less certain demand
could lead to an increase in prices.
Some empirical papers consider price dispersion as the result of price discrimination.
Borenstein and Rose (1994) explore the US airline industry and provide evidence of competitive-
type price discrimination: lower price dispersion arises in more concentrated markets. Con-
sistently, Carbonneau et al. (2004) show that more competition is correlated with more
price dispersion. Later, Gerardi and Shapiro (2009) revisit the analysis of Borenstein and
Rose (1994). They find the same results when they replicate the cross-sectional model of
Borenstein and Rose (1994). However, they have opposite results when performing a panel
analysis.5 Indeed, they provide evidence of monopolistic-type price discrimination: higher
4See Tirole (1988) chapter 3.5Gerardi and Shapiro (2009) explain that the panel approach allows them to estimate the effect of compe-
7
price dispersion arises in more concentrated markets.
Stavins (2001), instead, measures price discrimination through ticket restrictions.6 Con-
sistently with Borenstein and Rose (1994), she provides evidence of competitive-type price
discrimination in the US airline industry: ticket restrictions reduce fares although the effect
is lower for more concentrated markets. Using the cross-sectional model of Stavins (2001),
Giaume and Guillou (2004) get to the same results on intra-European connections.7
Gaggero and Piga (2011) provide a seminal contribution on the effect of market structure
on intertemporal pricing dispersion focusing on the routes connecting Ireland and the UK.
Consistently with Gerardi and Shapiro (2009), they find that few companies with a relatively
large market share can easily price discriminate.
In contrast to the aforementioned contributions, Hayes and Ross (1998) find no empirical
evidence of price discrimination and market structure in the US airline industry. Price
dispersion is due to peak load pricing and it is influenced by the characteristics of the
carriers operating on a given route. Consistently, Mantin and Koo (2009) highlight that
price dispersion is not affected by the market structure. Instead, the presence of LCCs
among the competitors enhances dispersion by inducing FSCs to adopt a more aggressive
pricing behaviour.8
III EMPIRICAL STRATEGY
We define two models. The baseline model accounts for the effect of market structure and
IPD on fares. The extended model allows for IPD to vary with market structure.9
tition by accounting for changes in the competitive structure of a given route over time rather than changesin competitive structures across routes.
6Ticket restrictions are the Saturday-night stay over requirement and the advance-purchase requirement.7Besides the ticket restrictions used by Stavins (2001), Giaume and Guillou (2004) take into account some
exogenous segmentations such as families, age groups, student status, and events.8Alderighi et al (2004) find that when a LCC enters a given route, the FSC incumbent reacts by lowering
both leisure and business fares. Further, Fageda et al. (2011) note that traditional carriers are progressivelyadopting the management practices of LCCs. In particular FSCs, through their low-cost subsidiaries, areable to price more aggressively and hence successfully compete with LCCs.
9The idea of measuring the net effect of price discrimination from varying the market structure has beeninspired by the approach of Stavins (2001).
8
The baseline model:
ln (Pit) = β0 + β1MarketStructurei + β2BookingDayt (1)
+θ3FlightCharacteristicsi + θ4ControlDummiesit
+uit
The extended model:
ln (Pit) = β0 + β1MarketStructurei + β2BookingDayt (2)
+β3 (MarketStructurei ∗BookingDayt)
+θ4FlightCharacteristicsi + θ5ControlDummiesit
+uit
where i indexes the round-trip flight and t the time. Each flight i is defined by the route,
the carrier and the date of departure and return. We have a daily time dimension that goes
from 1 to 60.
The dependent variable is the log of the fares. The variable Booking Day captures the
effect of IPD and ranges from 1 to 60. In order to account for the potential non-linearity of
Booking Day, we also add Booking Day squared to the model.
We use two indices of market structure at city-pair level:10
• Market Share, the average share of the daily flights operated by an airline at the two
endpoints of a city-pair;
• Herfindahl-Hirschman Index (HHI), based on Market Share;
Flight Characteristics includes the following variables:
10We do not compute market structure variables at route-level because, working with a peripheral area,almost all the carriers could operate as a monopolist on a given route. We need the city-pair level to capturethe real competition between carriers.
9
• Holiday is a peak-period dummy equal to 1 for flights occurring during summer holi-
days, winter holidays, bank holidays and public holidays, 0 otherwise.
• LCC is a carrier dummy equal to 1 for flights provided by LCCs, 0 otherwise.
Control dummies are:
• Route dummies to capture route-specific effects, demand and cost (or price) differences;
• Year dummies to account for macroeconomic factors equally affecting all flights in each
year;
• Month dummies to capture seasonal effects;
• Departure Time and Return Time, two sets of four categorical dummies capturing
the effect of the takeoff time: Morning (6:00-10:00), Midday (10:00-14:00), Afternoon
(14:00-18:00) and Evening (18:00-24:00);11
• Stay dummies to control for the length of stay (i.e. how many days elapse between
departure and return).
Finally, uit is the composite errore term, where uit = αi + εit. Specifically, αi is the
unobserved heterogeneity and εit is the idiosyncratic error term. Standard errors are clustered
at flight level since observations on flights are not likely to be independent over time.
We assume that the market structure is exogenous. Basically, we agree with Stavins
(2001) claiming that elements such as “entry barriers prevent new carriers from entering city-
pair routes (e.g., limited gate access, incumbent airlines’hub-and-spoke systems, and scale
economies in network size)".12 Moreover, in the European Union there are the "grandfather
rights": an airline that held and used a slot last year is entitled to do so again in the same
season the following year. In the short run, then, market structure can be assumed to be
fixed. The validity of the exogeneity assumption is tested as explained in the appendix.
11Based on Gaggero and Piga (2011).12Stavins follows the approach of Graham et al. (1983).
10
We want to estimate coeffi cients of time-invariant variables, therefore we use the Random
Effects (RE) Generalised Least Square (GLS) estimator. The RE estimator to be consistent
requires the assumption that the right-hand side variables are not correlated with the unob-
served heterogeneity αi. The Robust Hausman test using the method of Wooldridge (2002)
is performed after each regression to test the validity of that assumption and, hence, the
consistency of RE estimates.13
IV DATA COLLECTION
Data on fares were collected to replicate real travellers’behaviour when making reservations.
First, we identified plausible round-trips, then we retrieve data directly from airlines’website
by simulating reservations.14 We observed fares daily starting, generally, sixty booking days
before departure. However, for some round-trip flights we have less than sixty observed fares,
thus the panel is unbalanced. We define a dataset comprising 19,605 observations on 427
round-trip flights from November 2006 to February 2011. Our sample includes 10 city-pairs
(see Table 1) and 11 airline companies.
13See Wooldridge (2002), pp. 290-91.14We avoid any potential distortion on pricing strategies caused by online travel agencies that could set
discounted fares.
11
TABLE 1List of city-pair markets
Origin Destination
Bari Milan
Bari Rome
Brindisi Milan
Brindisi Rome
Catania Milan
Catania Rome
Naples Milan
Naples Rome
Palermo Milan
Palermo Rome
Both FSCs and LCCs are considered (see Table 2); thus we chose the basic services (no
add-ons) to make carriers’supply effectively comparable.
TABLE 2
List of airline companies.
Full Service Carriers Low Cost Carriers
AirOne Alpieagles Meridiana Volare Web
Alitalia Blu Express MyAir WindJet
Lufthansa EasyJet Ryanair
We simulate the purchase of round-trip tickets, which gives us several advantages. Firstly,
we effectively replicate the consumer behaviour since travellers use to purchase round-trip
tickets rather than one-way tickets.15 In addition to that, we precisely recreate the market
structure as we can clearly see if, for each round-trip flight, a given carrier is a feasible
alternative for travellers and an effective competitor. The use of round-trip fares allows
also to account for peak-periods and to verify if airlines adjust the pricing behaviour during
15See, for instance, the analysis on airline travel demand carried out by Belobaba (1987).
12
phases of greater travel demand. Further, one-way ticket pricing differs depending on carrier
type. For FSCs a round-trip fare is lower than sum of the correspondent two one-way fares.
This pricing policy is not adopted by LCCs. To avoid distortions, previous contributions
using one-way fares limit the empirical analysis to LCCs or to a few carriers. Instead, we
do not encounter this problem and we are able to carry out a market analysis and compare
pricing behaviour of all carrier types. In Table 3 we provide descriptive statistics.
TABLE 3
Descriptive statistics
Variables Obs Mean St. Dev. Min Max
Fares 19605 153.80 84.85 11.92 690.49
Market Share 19605 0.405 0.286 0.065 1
HHI 19605 0.497 0.203 0.225 1
Booking Day 19605 24.672 14.889 1 60
Holiday 19605 0.458 0.498 0 1
LCC 19605 0.455 0.498 0 1
Our data sample has a good deal of variation in term of both fares and market structure
indices. In fact, we observe either monopolistic or more competitive markets.
Further, in Table 4 we report the average fares per mile posted by the incumbent airline
providing services for the city-pair included in the empirical analysis.
13
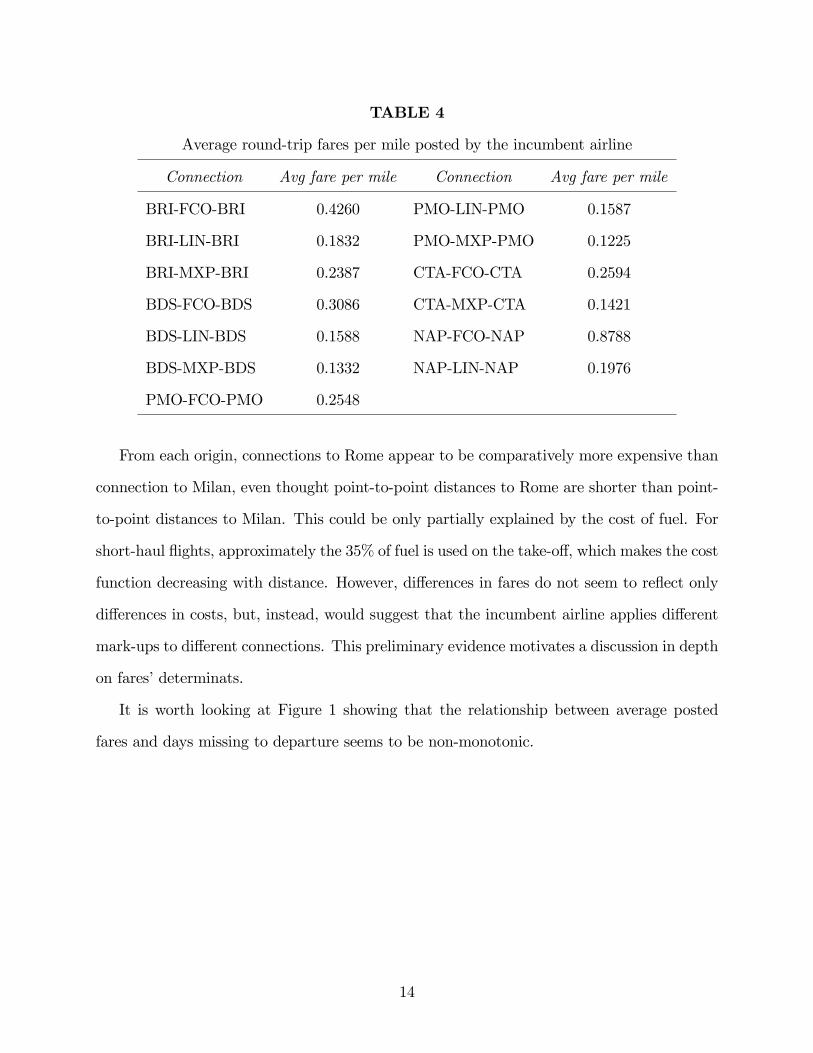
TABLE 4
Average round-trip fares per mile posted by the incumbent airline
Connection Avg fare per mile Connection Avg fare per mile
BRI-FCO-BRI 0.4260 PMO-LIN-PMO 0.1587
BRI-LIN-BRI 0.1832 PMO-MXP-PMO 0.1225
BRI-MXP-BRI 0.2387 CTA-FCO-CTA 0.2594
BDS-FCO-BDS 0.3086 CTA-MXP-CTA 0.1421
BDS-LIN-BDS 0.1588 NAP-FCO-NAP 0.8788
BDS-MXP-BDS 0.1332 NAP-LIN-NAP 0.1976
PMO-FCO-PMO 0.2548
From each origin, connections to Rome appear to be comparatively more expensive than
connection to Milan, even thought point-to-point distances to Rome are shorter than point-
to-point distances to Milan. This could be only partially explained by the cost of fuel. For
short-haul flights, approximately the 35% of fuel is used on the take-off, which makes the cost
function decreasing with distance. However, differences in fares do not seem to reflect only
differences in costs, but, instead, would suggest that the incumbent airline applies different
mark-ups to different connections. This preliminary evidence motivates a discussion in depth
on fares’determinats.
It is worth looking at Figure 1 showing that the relationship between average posted
fares and days missing to departure seems to be non-monotonic.
14
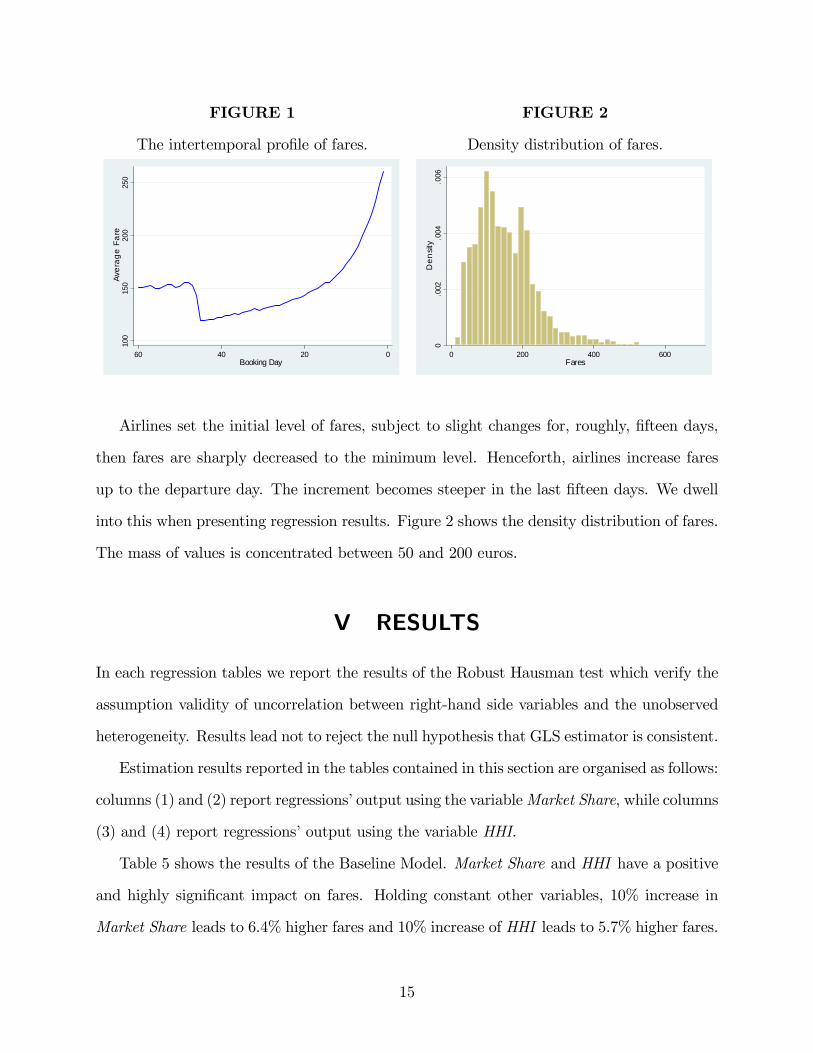
FIGURE 1 FIGURE 2
The intertemporal profile of fares. Density distribution of fares.10
015
020
025
0Av
erag
e Fa
re
0204060Booking Day
0.0
02.0
04.0
06D
ensit
y
0 200 400 600800Fares
Airlines set the initial level of fares, subject to slight changes for, roughly, fifteen days,
then fares are sharply decreased to the minimum level. Henceforth, airlines increase fares
up to the departure day. The increment becomes steeper in the last fifteen days. We dwell
into this when presenting regression results. Figure 2 shows the density distribution of fares.
The mass of values is concentrated between 50 and 200 euros.
V RESULTS
In each regression tables we report the results of the Robust Hausman test which verify the
assumption validity of uncorrelation between right-hand side variables and the unobserved
heterogeneity. Results lead not to reject the null hypothesis that GLS estimator is consistent.
Estimation results reported in the tables contained in this section are organised as follows:
columns (1) and (2) report regressions’output using the variableMarket Share, while columns
(3) and (4) report regressions’output using the variable HHI.
Table 5 shows the results of the Baseline Model. Market Share and HHI have a positive
and highly significant impact on fares. Holding constant other variables, 10% increase in
Market Share leads to 6.4% higher fares and 10% increase of HHI leads to 5.7% higher fares.
15
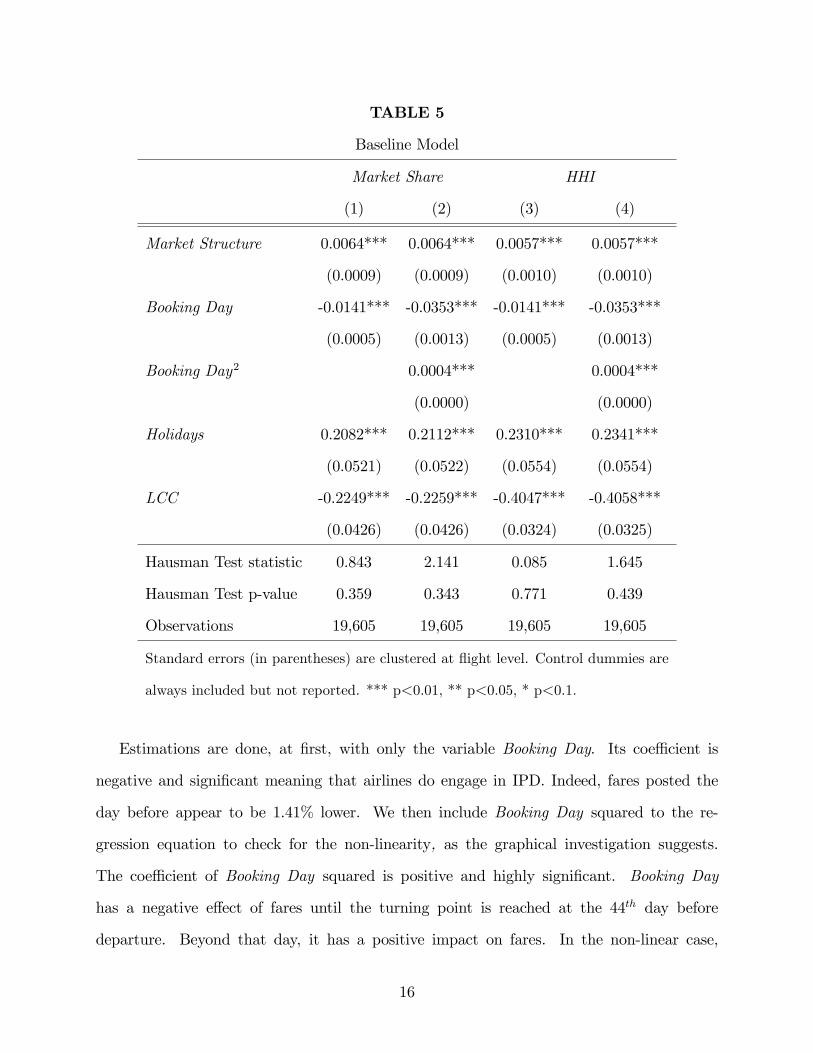
TABLE 5
Baseline Model
Market Share HHI
(1) (2) (3) (4)
Market Structure 0.0064*** 0.0064*** 0.0057*** 0.0057***
(0.0009) (0.0009) (0.0010) (0.0010)
Booking Day -0.0141*** -0.0353*** -0.0141*** -0.0353***
(0.0005) (0.0013) (0.0005) (0.0013)
Booking Day2 0.0004*** 0.0004***
(0.0000) (0.0000)
Holidays 0.2082*** 0.2112*** 0.2310*** 0.2341***
(0.0521) (0.0522) (0.0554) (0.0554)
LCC -0.2249*** -0.2259*** -0.4047*** -0.4058***
(0.0426) (0.0426) (0.0324) (0.0325)
Hausman Test statistic 0.843 2.141 0.085 1.645
Hausman Test p-value 0.359 0.343 0.771 0.439
Observations 19,605 19,605 19,605 19,605
Standard errors (in parentheses) are clustered at flight level. Control dummies are
always included but not reported. *** p<0.01, ** p<0.05, * p<0.1.
Estimations are done, at first, with only the variable Booking Day. Its coeffi cient is
negative and significant meaning that airlines do engage in IPD. Indeed, fares posted the
day before appear to be 1.41% lower. We then include Booking Day squared to the re-
gression equation to check for the non-linearity, as the graphical investigation suggests.
The coeffi cient of Booking Day squared is positive and highly significant. Booking Day
has a negative effect of fares until the turning point is reached at the 44th day before
departure. Beyond that day, it has a positive impact on fares. In the non-linear case,
16
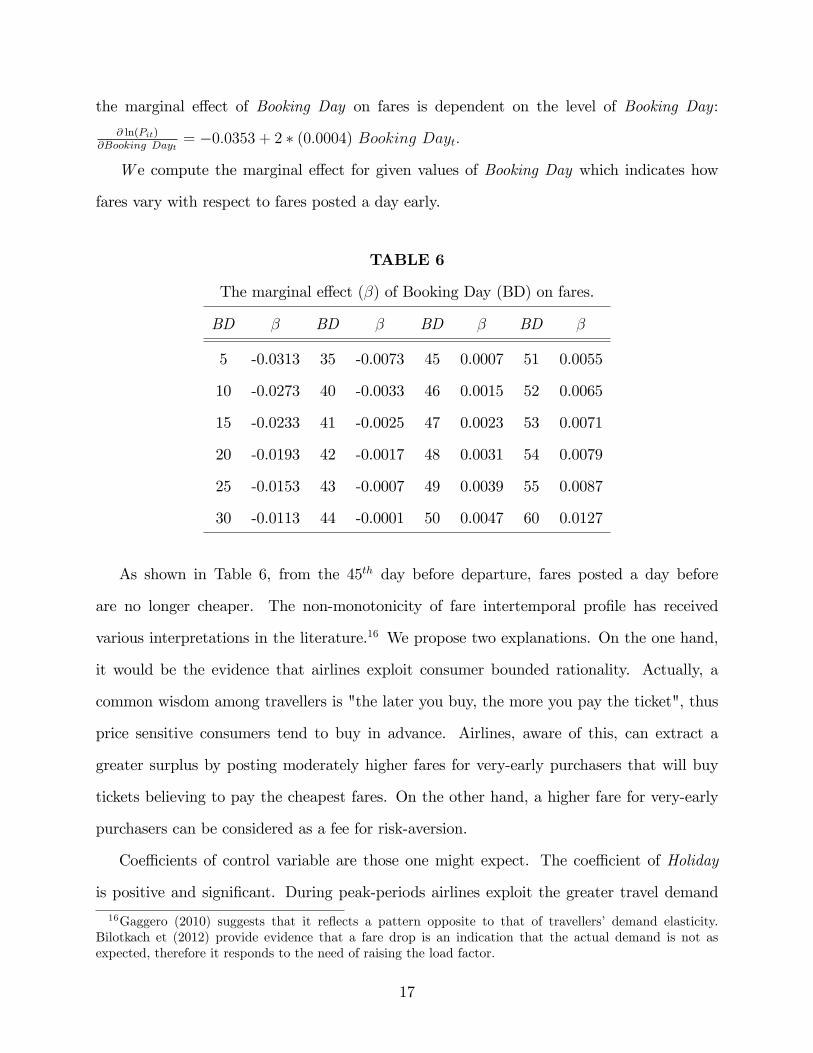
the marginal effect of Booking Day on fares is dependent on the level of Booking Day:
∂ ln(Pit)∂Booking Dayt
= −0.0353 + 2 ∗ (0.0004) Booking Dayt.
W e compute the marginal effect for given values of Booking Day which indicates how
fares vary with respect to fares posted a day early.
TABLE 6
The marginal effect (β) of Booking Day (BD) on fares.
BD β BD β BD β BD β
5 -0.0313 35 -0.0073 45 0.0007 51 0.0055
10 -0.0273 40 -0.0033 46 0.0015 52 0.0065
15 -0.0233 41 -0.0025 47 0.0023 53 0.0071
20 -0.0193 42 -0.0017 48 0.0031 54 0.0079
25 -0.0153 43 -0.0007 49 0.0039 55 0.0087
30 -0.0113 44 -0.0001 50 0.0047 60 0.0127
As shown in Table 6, from the 45th day before departure, fares posted a day before
are no longer cheaper. The non-monotonicity of fare intertemporal profile has received
various interpretations in the literature.16 We propose two explanations. On the one hand,
it would be the evidence that airlines exploit consumer bounded rationality. Actually, a
common wisdom among travellers is "the later you buy, the more you pay the ticket", thus
price sensitive consumers tend to buy in advance. Airlines, aware of this, can extract a
greater surplus by posting moderately higher fares for very-early purchasers that will buy
tickets believing to pay the cheapest fares. On the other hand, a higher fare for very-early
purchasers can be considered as a fee for risk-aversion.
Coeffi cients of control variable are those one might expect. The coeffi cient of Holiday
is positive and significant. During peak-periods airlines exploit the greater travel demand
16Gaggero (2010) suggests that it reflects a pattern opposite to that of travellers’ demand elasticity.Bilotkach et (2012) provide evidence that a fare drop is an indication that the actual demand is not asexpected, therefore it responds to the need of raising the load factor.
17
and set 21 to 24% higher fares than off-peak periods. The coeffi cient of LCC is negative
and significant.17 In regressions with Market Share, LCCs appear to price 23% lower than
FSCs, whilst in regressions with HHI as predictor, LCCs appear to price 41% lower than
FSCs. The different impact is due to coexistence of Market Share and LCC in the same
regressions. Actually, Market Share takes lower values when a carrier is a low cost, thus it
already capture the effect on fares induced by LCC.
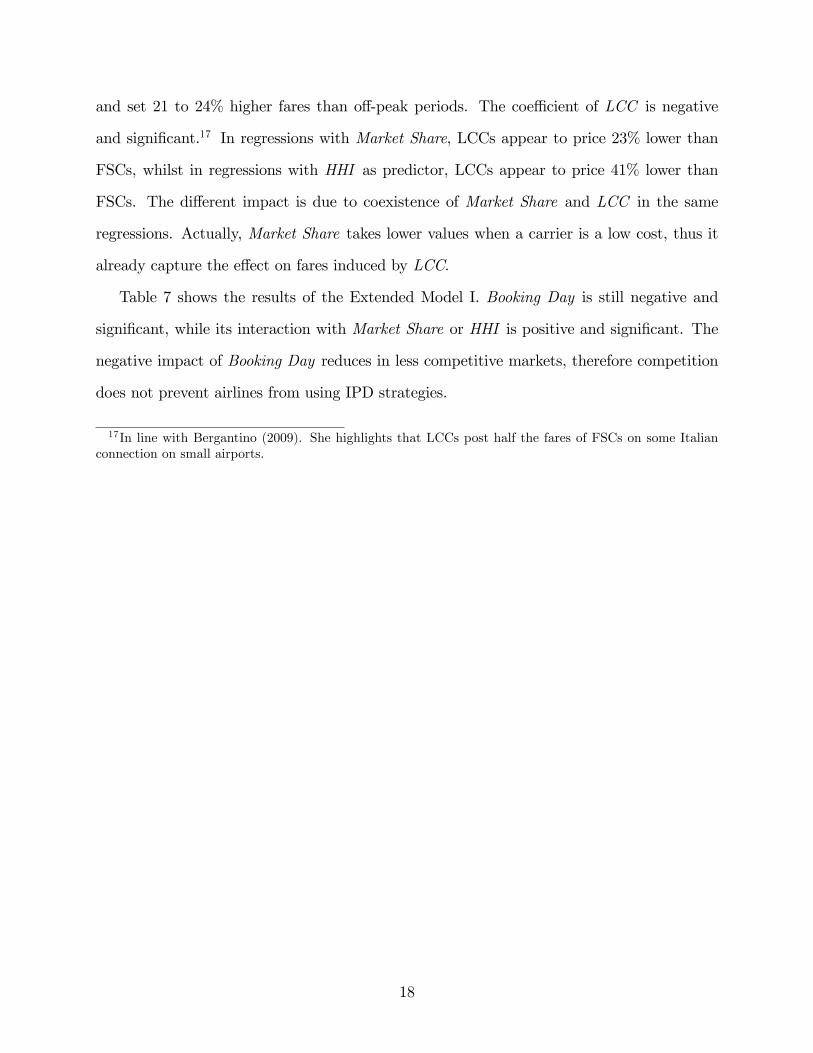
Table 7 shows the results of the Extended Model I. Booking Day is still negative and
significant, while its interaction with Market Share or HHI is positive and significant. The
negative impact of Booking Day reduces in less competitive markets, therefore competition
does not prevent airlines from using IPD strategies.
17In line with Bergantino (2009). She highlights that LCCs post half the fares of FSCs on some Italianconnection on small airports.
18
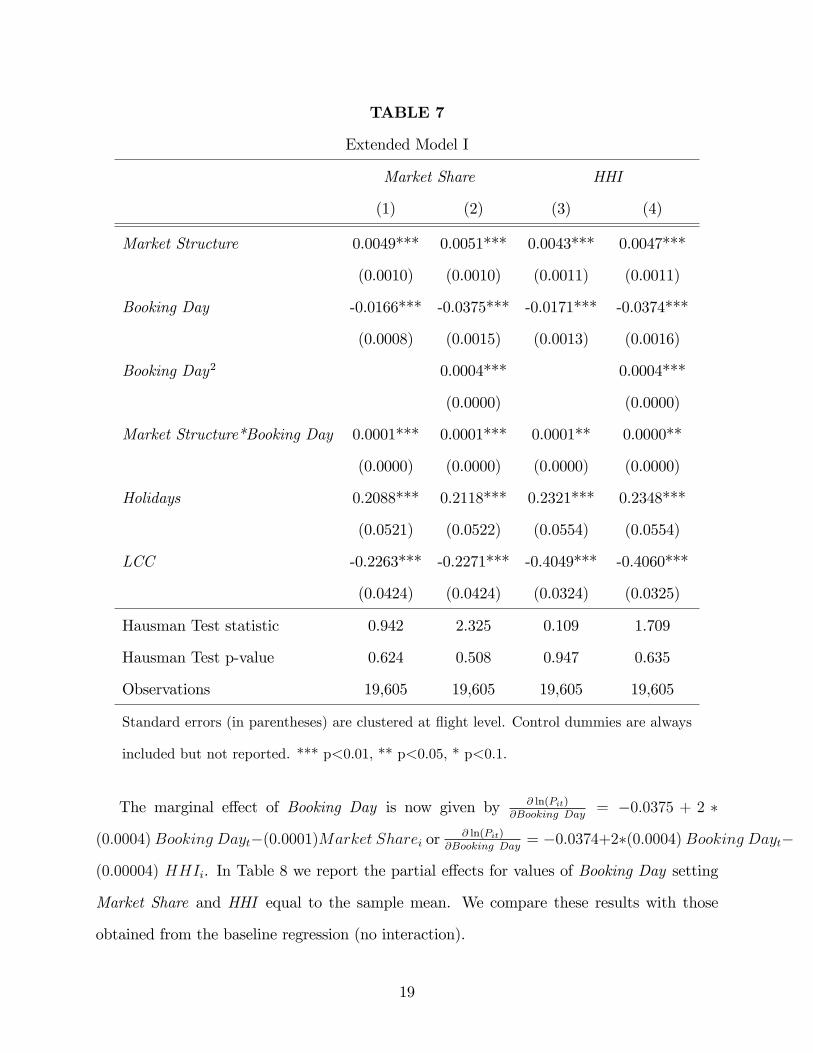
TABLE 7
Extended Model I
Market Share HHI
(1) (2) (3) (4)
Market Structure 0.0049*** 0.0051*** 0.0043*** 0.0047***
(0.0010) (0.0010) (0.0011) (0.0011)
Booking Day -0.0166*** -0.0375*** -0.0171*** -0.0374***
(0.0008) (0.0015) (0.0013) (0.0016)
Booking Day2 0.0004*** 0.0004***
(0.0000) (0.0000)
Market Structure*Booking Day 0.0001*** 0.0001*** 0.0001** 0.0000**
(0.0000) (0.0000) (0.0000) (0.0000)
Holidays 0.2088*** 0.2118*** 0.2321*** 0.2348***
(0.0521) (0.0522) (0.0554) (0.0554)
LCC -0.2263*** -0.2271*** -0.4049*** -0.4060***
(0.0424) (0.0424) (0.0324) (0.0325)
Hausman Test statistic 0.942 2.325 0.109 1.709
Hausman Test p-value 0.624 0.508 0.947 0.635
Observations 19,605 19,605 19,605 19,605
Standard errors (in parentheses) are clustered at flight level. Control dummies are always
included but not reported. *** p<0.01, ** p<0.05, * p<0.1.
The marginal effect of Booking Day is now given by ∂ ln(Pit)∂Booking Day
= −0.0375 + 2 ∗
(0.0004)Booking Dayt−(0.0001)Market Sharei or∂ ln(Pit)
∂Booking Day= −0.0374+2∗(0.0004)Booking Dayt−
(0.00004) HHIi. In Table 8 we report the partial effects for values of Booking Day setting
Market Share and HHI equal to the sample mean. We compare these results with those
obtained from the baseline regression (no interaction).
19
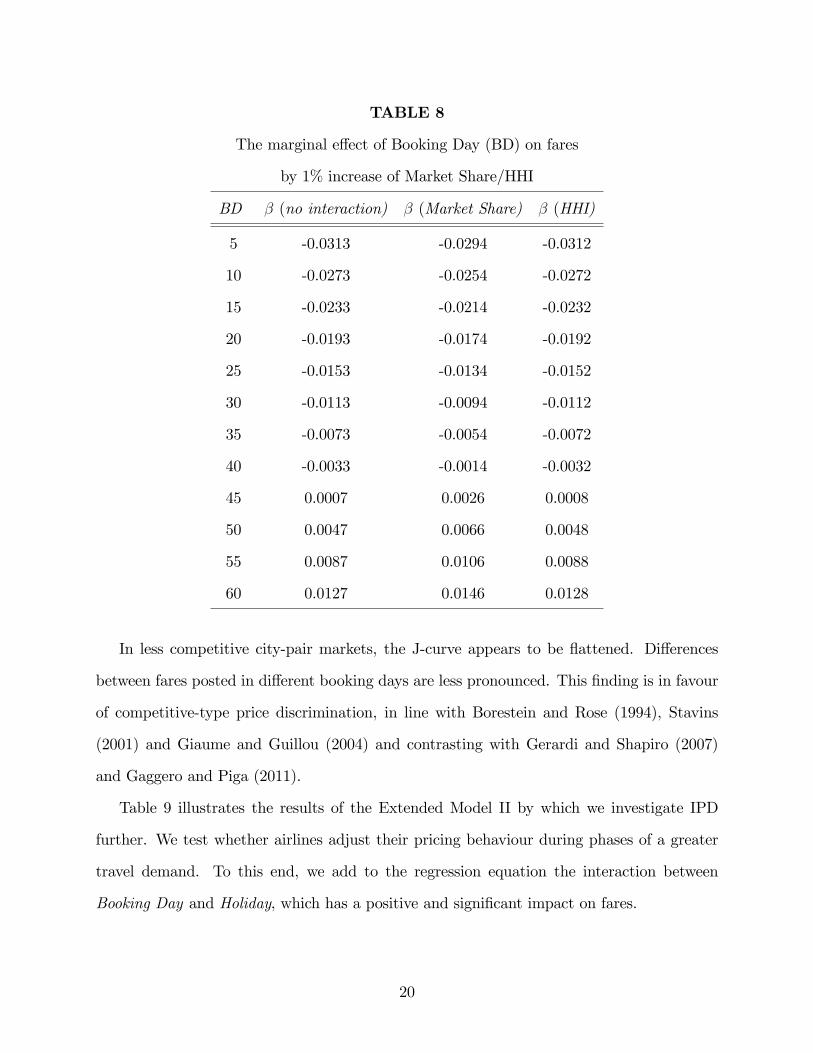
TABLE 8
The marginal effect of Booking Day (BD) on fares
by 1% increase of Market Share/HHI
BD β (no interaction) β (Market Share) β (HHI)
5 -0.0313 -0.0294 -0.0312
10 -0.0273 -0.0254 -0.0272
15 -0.0233 -0.0214 -0.0232
20 -0.0193 -0.0174 -0.0192
25 -0.0153 -0.0134 -0.0152
30 -0.0113 -0.0094 -0.0112
35 -0.0073 -0.0054 -0.0072
40 -0.0033 -0.0014 -0.0032
45 0.0007 0.0026 0.0008
50 0.0047 0.0066 0.0048
55 0.0087 0.0106 0.0088
60 0.0127 0.0146 0.0128
In less competitive city-pair markets, the J-curve appears to be flattened. Differences
between fares posted in different booking days are less pronounced. This finding is in favour
of competitive-type price discrimination, in line with Borestein and Rose (1994), Stavins
(2001) and Giaume and Guillou (2004) and contrasting with Gerardi and Shapiro (2007)
and Gaggero and Piga (2011).
Table 9 illustrates the results of the Extended Model II by which we investigate IPD
further. We test whether airlines adjust their pricing behaviour during phases of a greater
travel demand. To this end, we add to the regression equation the interaction between
Booking Day and Holiday, which has a positive and significant impact on fares.
20
TABLE 9
Extended Model II
Market Share HHI
(1) (2) (3) (4)
Market Structure 0.0064*** 0.0064*** 0.0057*** 0.0057***
(0.0009) (0.0009) (0.0010) (0.0010)
Booking Day -0.0154*** -0.0355*** -0.0154*** -0.0355***
(0.0009) (0.0015) (0.0009) (0.0015)
Booking Day2 0.0004*** 0.0004***
(0.0000) (0.0000)
Holidays 0.0544 0.0763 0.0773 0.0992*
(0.0572) (0.0564) (0.0602) (0.0594)
Holidays*Booking Day 0.0064*** 0.0056*** 0.0064*** 0.0056***
(0.0009) (0.0008) (0.0009) (0.0008)
LCC -0.1279*** -0.1462*** -0.3068*** -0.3255***
(0.0476) (0.0465) (0.0378) (0.0364)
LCC*Booking Day -0.0042*** -0.0034*** -0.0042*** -0.0034***
(0.0009) (0.0008) (0.0009) (0.0008)
Hausman Test statistic 9.329 10.809 10.505 12.133
Hausman Test p-value 0.025 0.029 0.015 0.016
Observations 19,605 19,605 19,605 19,605
Standard errors (in parentheses) are clustered at flight level. Control dummies are
always included but not reported. *** p<0.01, ** p<0.05, * p<0.1.
The effect of Booking Day on fares for peak periods is 0.56% to 0.64% lower than for
off-peak periods. Basically this is due to two facts. One the one hand, the greater travel
demand allows airlines to decrease IPD because they can sell all the seats with no need
21
of discounted fares. On the other hand, during holidays travellers are more homogeneous,
as people journey mainly for tourism. IPD, being based on the heterogeneity of travellers,
becomes less effective.
Furthermore, we focus on IPD strategies implemented by LCCs. To this end we employ
the interaction between the Booking Day and LCC, which has a negative impact on fares.
The effect of Booking Day on posted fares is 0.34% to 0.42% higher for LCCs than FSCs.
LCCs engage in a stronger IPD, in line with the more aggressive pricing behaviour of LCCs.
VI SUMMARY AND CONCLUSIONS
This paper explored pricing in air transportation for short-haul markets removing the in-
fluence of intermodal competition. To that end, we use a unique dataset on the southern
Italian market that exhibits a limited intermodal competition, thus airline pricing strategies
are the straight results of air-related competition.
Basically, we dealt with two issues. The first is to measure the extent to which intramodal
competition determines fares. The second is to shed light on the intertemporal profile of fares
to verify if airlines engage in IPD and whether IPD is of monopolistic-type or competitive-
type.
Results are robust across regressions. Further, the robust Hausman test shows that RE
GLS estimator provides consistent estimates.
We found that airlines exploit their dominant position on a city-pair. When the in-
tramodal competition reduces, airlines post higher fares. Indeed, 10% increase in Market
Share leads to 6.4% higher fares and 10% increase of HHI leads to 5.7% higher fares. Fur-
ther, we provided that airlines do undertake IPD and that fare intertemporal profile appears
to be non-monotonic, resembling a J-curve. Booking Day has a negative effect of fares until
the turning point is reached at the 44th day before departure. Beyond that day, it has a
positive impact on fares. We claim that a non-monotonic effect would be, on the one hand,
22
the evidence that airlines exploit consumer bounded rationality. Actually, a common wisdom
among travellers is "the later you buy, the more you pay the ticket", thus price sensitive
consumers tend to buy in advance. Airlines, aware of this, can extract a greater surplus by
posting moderately higher fares for very-early purchasers that will buy tickets believing to
pay the cheapest fares. On the other hand, a higher fare for very-early purchasers can be
considered as a fee for risk-aversion. The empirical evidence is in favor of competitive-type
price discrimination: a more competitive market structure fosters the implementation of
IPD. Basically, in less competitive city-pair markets, the J-curve appears to be flattened.
Finally, airline pricing strategies differ depending on carrier type. LCCs seem to adopt a
more aggressive pricing behaviuor as on average they set lower fares and undertake stronger
IPD strategies.
One might say that price discrimination is only beneficial for airlines. However, in more
competitive markets airlines charge lower fares that, together with the IPD, allow them to
target larger segments of demand, which leads to a “democratisation”of air travel. This is
very important for areas as southern Italy where the intermodal competition is limited.
Developments for future research could be an enlargement of the territorial coverage
in order to compare different exogenously determined accessibility conditions and, thus, to
measure the impact of air-related competition on accessibility. Finally, we aim to take into
account the local government subsidies often granted to airlines, to evaluate their impact on
fares and pricing strategies and, thus, on the net welfare of the area in question.
References
[1] Abrate, G., Fraquelli, G., Viglia, G. (2010). Dynamic pricing strategies and customer
heterogeneity: the case of European hotels. HERMES Working Paper, 10-7.
[2] Alderighi, M., Cento, A., Nijkamp, P., Rietveld, P. (2004). The Entry of Low-Cost
Airlines: Price Competition in the European Airline Market. Tinbergen Institute Dis-
23
cussion Paper, 04-074/3.
[3] Alderighi, M., Piga, C.A. (2010). On-line Booking and Revenue Management: Evidence
from a Low-Cost Airline. Review of Economic Analysis, 2(3): 272-286.
[4] Alves, C.F., Barbot, C. (2009). Price Discrimination Strategies of Low-Cost Carriers.
Journal of Transport Economics and Policy, 43(3): 345-363.
[5] Bachis, E., Piga, C.A. (2007a). Hub Premium, Airport Dominance and Market Power
in the European Airline Industry. Discussion Paper Series 2007_11, Department of
Economics, Loughborough University.
[6] Bachis, E., Piga, C.A. (2007b). Pricing strategies by European traditional and low cost
airlines. Or, when is it the best time to book on line?. in Darin Lee (ed.), Advances in
Airline Economics, Volume 2: The Economics of Airline Institutions, Operations and
Marketing, Elsevier: Amsterdam, ch. 10, 319-344.
[7] Belobaba, P. P. (1987).Air travel demand and airline seat inventory management. Flight
Transportation Laboratory Report R87-7. Cambridge, MA: The Massachusetts Institute
of Technology.
[8] Bilotkach, V., Gaggero, A.A., Piga, C.A. (2012). Airline Pricing under Different Mar-
ket Conditions: Evidence from European Low-Cost Carriers. Discussion Paper Series
2012_01, Department of Economics, Loughborough University.
[9] Bergantino, A.S. (2009). Le strategie di prezzo delle compagnie tradizionali e delle low
cost. Implicazioni per i sistemi aeroportuali minori: il caso della Puglia. Trasporti,
ambiente e territorio. La ricerca di un nuovo equilibrio, Franco Angeli, Milano, 77-91.
[10] Borenstein, S. (1985). Price Discrimination in Free-Entry Markets. The RAND Journal
of Economics, 16(3) 380-397.
24
[11] Borenstein, S. (1989). Hubs and High Fares: Dominance and Market Power in the U.S.
Airline Industry. The RAND Journal of Economics, 20(3): 344-365.
[12] Borenstein, S., Rose, N.L. (1994). Competition and price dispersion in the US airline
industry. The Journal of Political Economy, 102(4): 653-683.
[13] Brueckner, J.K., Lee, D., Singer, E.S. (2013). Airline competition and domestic US
airfares: A comprehensive reappraisal. Economics of Transportation, 2(1): 1-17.
[14] Carlsson, F. (2004). Prices and Departures in European Domestic Aviation Markets.
Review of Industrial Organization: 24(1): 37-49.
[15] Carbonneau, S., McAfee, R.P., Mialon, H., Mialon, S. (2004). Price Discrimination and
Market Power. Emory Economics 0413, Department of Economics, Emory University
(Atlanta)
[16] Dana, J.D. (1998). Advance-Purchase Discounts and Price Discrimination in Competi-
tive Markets. The Journal of Political Economy, 106(2): 395-422.
[17] Evans, W.N., Kessides, J.N. (1993). Localised Market Power in the U.S. Airline Industry.
Review of Economics & Statistics, 75(1): 66-75.
[18] Fageda, X., Jiménez, J.L., Perdiguero, J. (2011). Price rivalry in airline markets: a
study of a successful strategy of a network carrier against a low-cost carrier. Journal of
Transport Geography, 19(4): 658-669.
[19] Gaggero, A.A. (2010). Airline Pricing and Competition: the J-curve of airline fares.
LAP Lambert Academic Publishing.
[20] Gaggero, A.A., Piga, C.A. (2010). Airline competition in the British Isles. Transporta-
tion Research Part E, 46(2): 270-279.
[21] Gaggero, A.A., Piga, C.A. (2011). Airline Market Power and Intertemporal Price Dis-
persion. Journal of Industrial Economics, 59(4): 552-577.
25
[22] Gale, I.L. (1993). Price Dispersion in a Market with Advance-Purchases. Review of
Industrial Organization, 8(4): 451-464.
[23] Gale, I.L., Holmes, T.J. (1992). The effi ciency of advance-purchase discounts in the pres-
ence of aggregate demand uncertainty. International Journal of Industrial Organization,
10(3): 413-437.
[24] Gale, I.L., Holmes, T.J. (1993). Advance-Purchase Discounts and Monopoly Allocation
of Capacity. American Economic Review, 83(1): 135-146.
[25] Gerardi, K., Shapiro A. (2009). Does Competition Reduce Price Dispersion? New Evi-
dence From the Airline Industry. Journal of Political Economy, 117(1): 1-37.
[26] Giaume, S., Guillou, S. (2004). Price discrimination and concentration in European
airline markets. Journal of Air Transport Management, 10(5): 305-310.
[27] Graham, D. R., Kaplan D. P., Sibley D. S. (1983). Effi ciency and Competition in the
Airline Industry. Bell Journal of Economics, 14(1): 118-138.
[28] Hayes, K., Ross, L. (1998). Is Airline Price Dispersion the Result of Careful Planning
or Competitive Forces? Review of Industrial Organization, 13(5): 523-542.
[29] Holmes, T. (1989). The Effects of Third-Degree Price Discrimination in Oligopoly.
American Economic Review, 79(1): 244-250.
[30] Lofgren, K.G. (1971). The theory of intertemporal price discrimination. An outline.
Swedish Journal of Economics, 73(3): 333-343.
[31] Mantin, B., Koo, B. (2009). Dynamic price dispersion in airline market. Transportation
Research Part E, 45(6): 1020-1029.
[32] Möller, M. and Watanabe, M. (2010). Advance Purchase Discounts Versus Clearance
Sales. The Economic Journal, 120(549): 1125-1148.
26
[33] McAfee R.P., te Velde, V. (2006). Dynamic Pricing in the Airline industry. Handbook
on Economics and Information Systems, Ed: T.J. Hendershott, Elsevier, Handbooks in
Information Systems, Volume I.
[34] Stavins, J. (2001). Price Discrimination in the Airline Market: The Effect of Market
Concentration. The Review of Economics and Statistics, 83(1): 200-202.
[35] Stock, J.H., Yogo, M. (2005). Testing for Weak Instruments in IV Regression. Iden-
tification and Inference for Econometric Models: A Festschrift in Honor of Thomas
Rothenberg, Donald W.K.A., Stock, J.H. eds. Cambridge University Press, 80-108.
[36] Stokey, N. (1979). Intertemporal price discrimination. Quarterly Journal of Economics
93(3): 355-371.
[37] Tirole, J. (1988). The Theory of Industrial Organization. Cambridge, MA: The MIT
Press.
[38] Wooldridge, J. M. (2002). Econometric Analysis of Cross Section and Panel Data. Cam-
bridge, MA: The MIT Press.
27
Appendix: Robustness check
We have distinguished between carriers of two types: FSCs and LCCs. Indeed, we have
assumed similar operating characteristics and pricing behaviour within types. For robustness
check we verify whether the results hold when a more detailed distinction in made and carrier
dummies are added to the model (see Table 10 to 11).
TABLE 10
Baseline Model with carrier dummies.
Market Share HHI
(1) (2) (3) (4)
Market Structure 0.0068*** 0.0063*** 0.0051*** 0.0051***
(0.0012) (0.0011) (0.0009) (0.0009)
Booking Day -0.0141*** -0.0353*** -0.0141*** -0.0353***
(0.0005) (0.0013) (0.0005) (0.0013)
Booking Day2 0.0004*** 0.0004***
(0.0000) (0.0000)
Holidays 0.2253*** 0.2359*** 0.2307*** 0.2339***
(0.0435) (0.0442) (0.0448) (0.0449)
Hausman Test statistic 0.011 1.821 0.065 2.541
Hausman Test p-value 0.916 0.402 0.798 0.281
Observations 19,605 19,605 19,605 19,605
Standard errors (in parentheses) are clustered at flight level. Control dummies are
always included but not reported. *** p<0.01, ** p<0.05, * p<0.1.
28
TABLE 11
Extended Model I with carrier dummies.
Market Share HHI
(1) (2) (3) (4)
Market Structure 0.0047*** 0.0049*** 0.0036*** 0.0041***
(0.0012) (0.0012) (0.0010) (0.0010)
Booking Day -0.0166*** -0.0375*** -0.0171*** -0.0374***
(0.0008) (0.0015) (0.0013) (0.0016)
Booking Day2 0.0004*** 0.0004***
(0.0000) (0.0000)
Market Structure*Booking Day 0.0001*** 0.0001*** 0.0001** 0.0000**
(0.0000) (0.0000) (0.0000) (0.0000)
Holidays 0.2333*** 0.2363*** 0.2318*** 0.2346***
(0.0441) (0.0442) (0.0448) (0.0448)
Hausman Test Statistic 0.088 2.081 0.119 2.666
Hausman Test p-value 0.957 0.556 0.942 0.446
Observations 19,605 19,605 19,605 19,605
Standard errors (in parentheses) are clustered at flight level. Control dummies are always
included but not reported. *** p<0.01, ** p<0.05, * p<0.1.
Estimates do not change when we make more specific hypotheses about the behaviour of
each carrier.
As stated in section 3, we have assumed exogeneity of market structure. However, Boren-
stein (1989) argued that market structure could be a function of the fares charged. In our
model Market Share and HHI are potentially correlated with εit. We employ the GMM esti-
mator as a further robustness check to test the exogeneity of Market Share and HHI. We use
instruments designed by Borenstein (1989) and largely adopted in the related literature18.
18For a fuller description of the instruments see Borenstein (1989) pg 351-353.
29
Market Share is instrumented with GENP and Log(Distance), whilst HHI is instrumented
with QHHI and Log(Distance).
GENP is the observed carrier’s geometric mean of enplanements at the endpoints divided
by the sum across all carriers of the geometric mean of each carrier’s enplanements at the
endpoint airports:
GENP =
√ENPk,1 ∗ ENPk,2∑√ENPj,1 ∗ ENPj,2
(6)
where k is the observed airline and j refers to all airlines.
QHHI is the square of the market share fitted value plus the rescaled sum of the squares
of all other carriers’shares:
QHHI = M̂S +HHI −MS2
(1−MS)2
(1− M̂S
)2(7)
where MS stands for the Market Share and M̂S is the fitted value of MS from the first
stage regression.
Log(Distance) is the logarithm of the distance in kilometres between the two route end-
points.
In the extended model we add the interaction between Booking Day andMarket Share or
HHI. The interaction could be endogenous too, thus we include as an additional instrument
the interaction between Booking Day and GENP or QHHI, respectively.
Airport data were collected to define the daily number of flights of each company and
the data about demand. Data on the distance between the two route endpoints are taken
from the World Airport Codes web site (http://www.world-airport-codes.com).
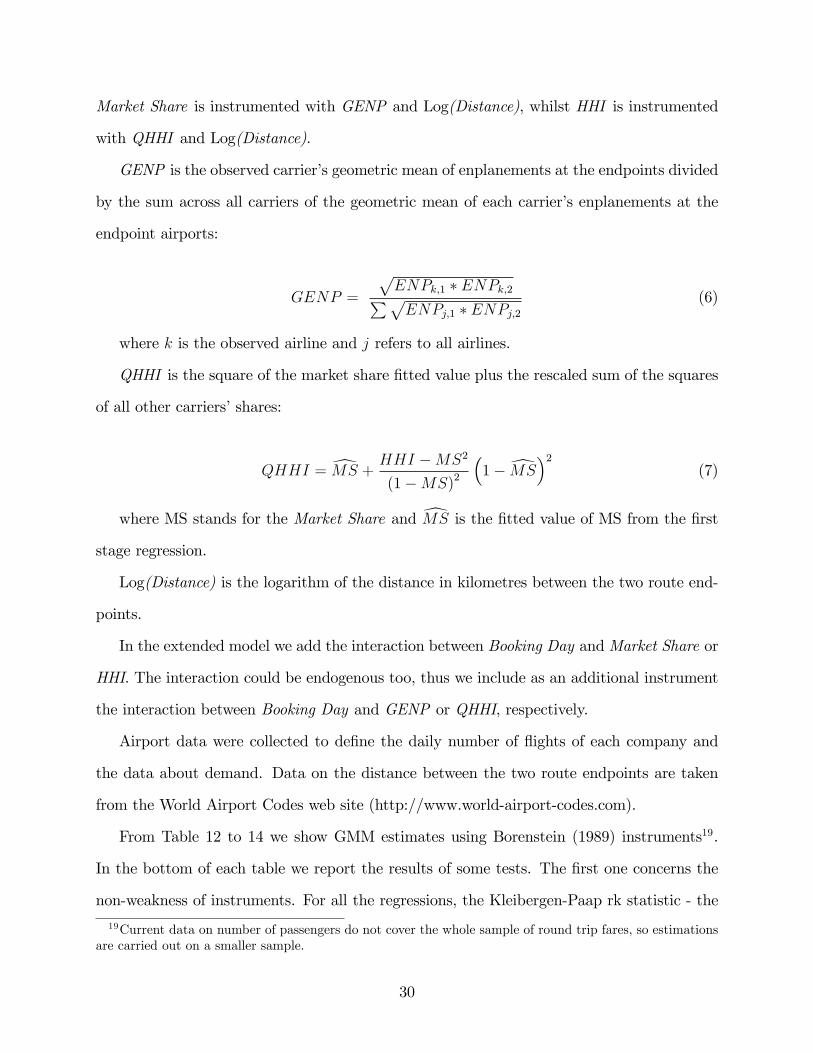
From Table 12 to 14 we show GMM estimates using Borenstein (1989) instruments19.
In the bottom of each table we report the results of some tests. The first one concerns the
non-weakness of instruments. For all the regressions, the Kleibergen-Paap rk statistic - the
19Current data on number of passengers do not cover the whole sample of round trip fares, so estimationsare carried out on a smaller sample.
30
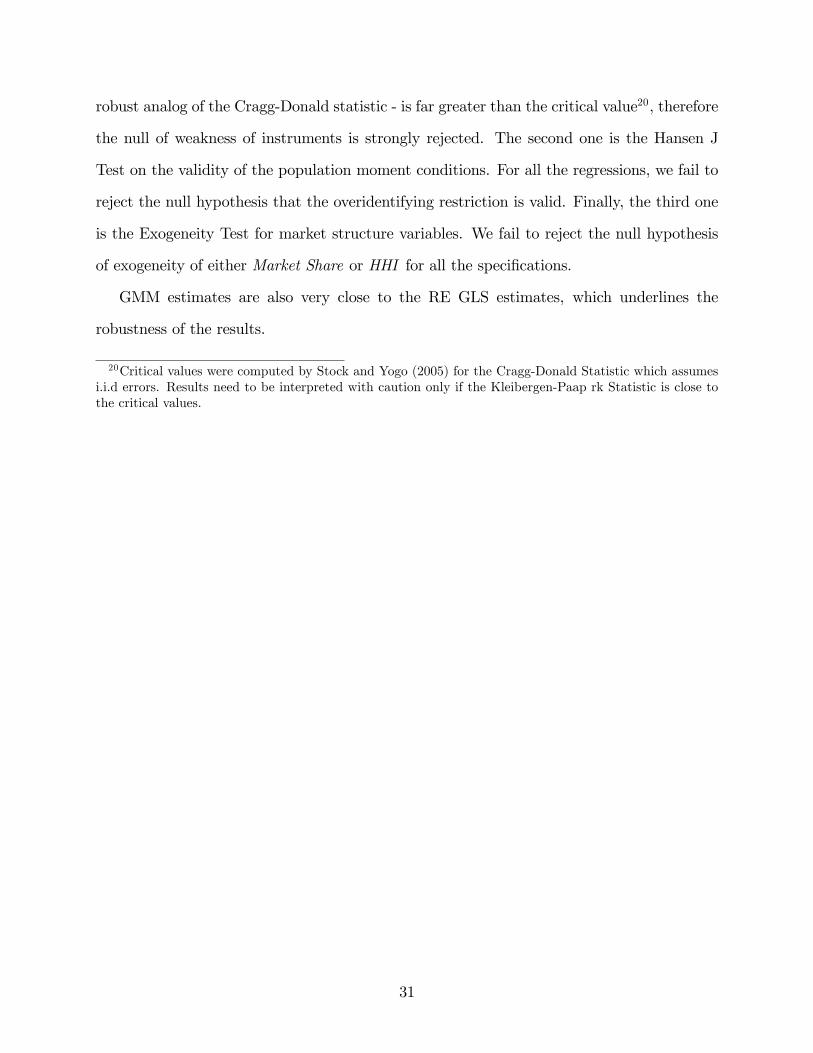
robust analog of the Cragg-Donald statistic - is far greater than the critical value20, therefore
the null of weakness of instruments is strongly rejected. The second one is the Hansen J
Test on the validity of the population moment conditions. For all the regressions, we fail to
reject the null hypothesis that the overidentifying restriction is valid. Finally, the third one
is the Exogeneity Test for market structure variables. We fail to reject the null hypothesis
of exogeneity of either Market Share or HHI for all the specifications.
GMM estimates are also very close to the RE GLS estimates, which underlines the
robustness of the results.
20Critical values were computed by Stock and Yogo (2005) for the Cragg-Donald Statistic which assumesi.i.d errors. Results need to be interpreted with caution only if the Kleibergen-Paap rk Statistic is close tothe critical values.
31
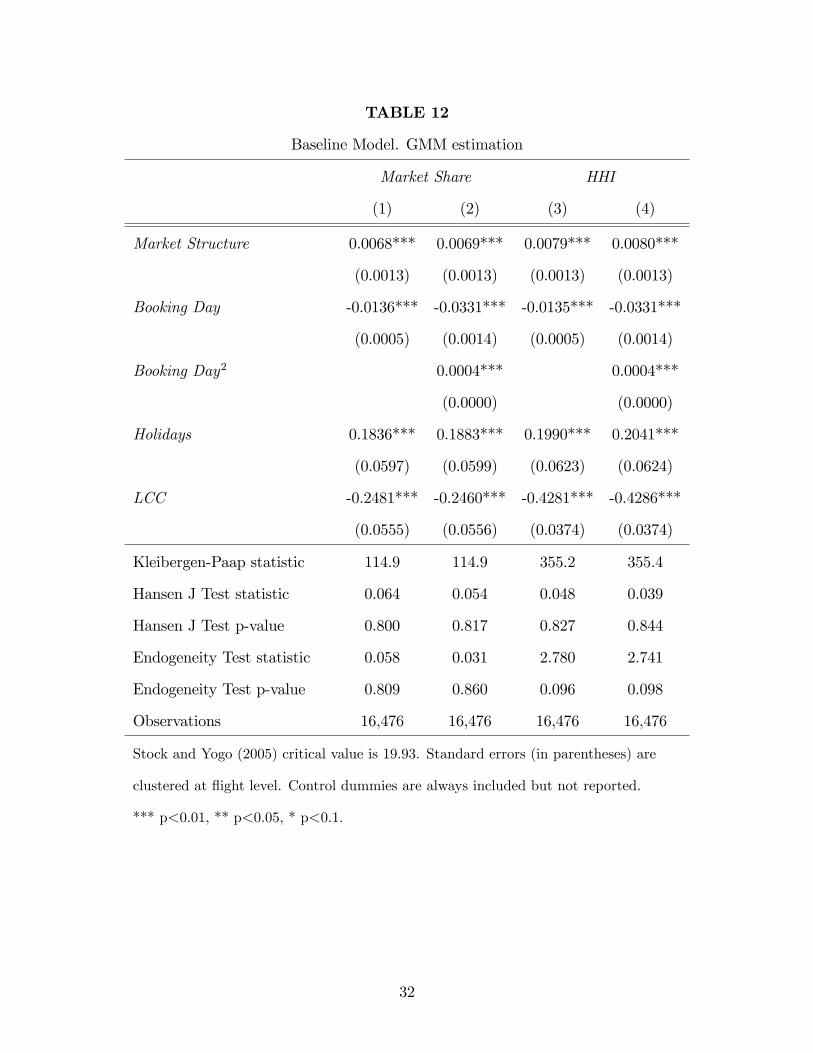
TABLE 12
Baseline Model. GMM estimation
Market Share HHI
(1) (2) (3) (4)
Market Structure 0.0068*** 0.0069*** 0.0079*** 0.0080***
(0.0013) (0.0013) (0.0013) (0.0013)
Booking Day -0.0136*** -0.0331*** -0.0135*** -0.0331***
(0.0005) (0.0014) (0.0005) (0.0014)
Booking Day2 0.0004*** 0.0004***
(0.0000) (0.0000)
Holidays 0.1836*** 0.1883*** 0.1990*** 0.2041***
(0.0597) (0.0599) (0.0623) (0.0624)
LCC -0.2481*** -0.2460*** -0.4281*** -0.4286***
(0.0555) (0.0556) (0.0374) (0.0374)
Kleibergen-Paap statistic 114.9 114.9 355.2 355.4
Hansen J Test statistic 0.064 0.054 0.048 0.039
Hansen J Test p-value 0.800 0.817 0.827 0.844
Endogeneity Test statistic 0.058 0.031 2.780 2.741
Endogeneity Test p-value 0.809 0.860 0.096 0.098
Observations 16,476 16,476 16,476 16,476
Stock and Yogo (2005) critical value is 19.93. Standard errors (in parentheses) are
clustered at flight level. Control dummies are always included but not reported.
*** p<0.01, ** p<0.05, * p<0.1.
32
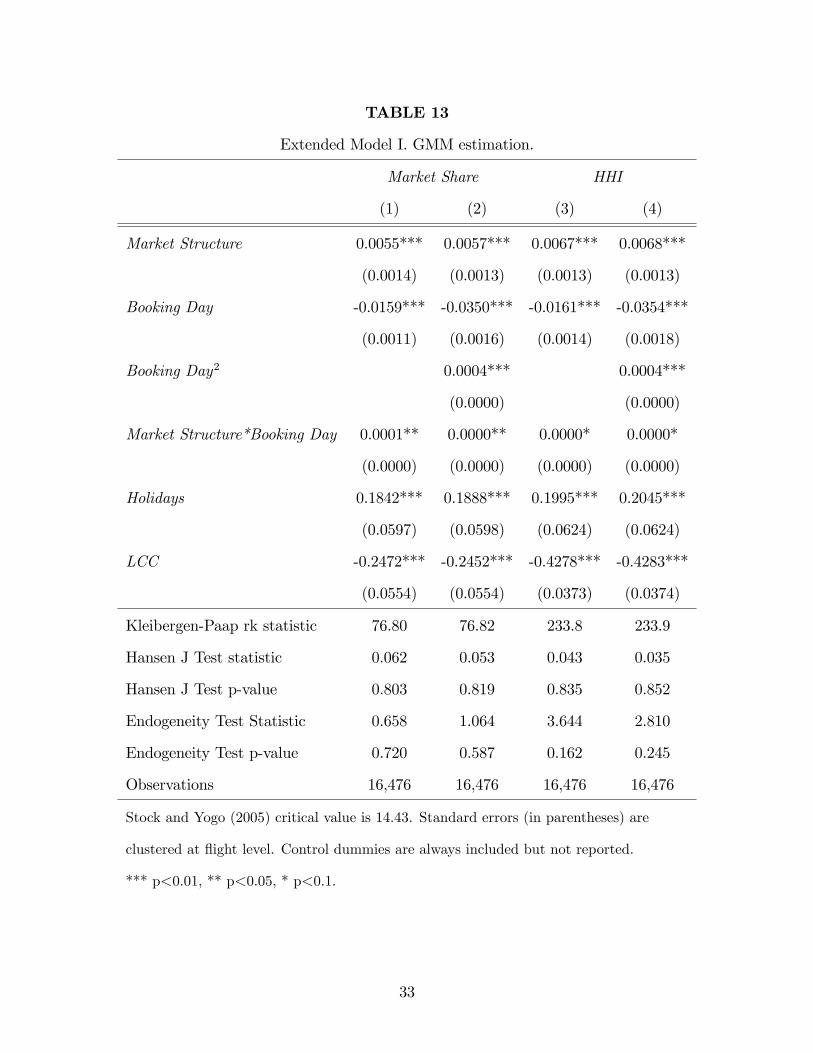
TABLE 13
Extended Model I. GMM estimation.
Market Share HHI
(1) (2) (3) (4)
Market Structure 0.0055*** 0.0057*** 0.0067*** 0.0068***
(0.0014) (0.0013) (0.0013) (0.0013)
Booking Day -0.0159*** -0.0350*** -0.0161*** -0.0354***
(0.0011) (0.0016) (0.0014) (0.0018)
Booking Day2 0.0004*** 0.0004***
(0.0000) (0.0000)
Market Structure*Booking Day 0.0001** 0.0000** 0.0000* 0.0000*
(0.0000) (0.0000) (0.0000) (0.0000)
Holidays 0.1842*** 0.1888*** 0.1995*** 0.2045***
(0.0597) (0.0598) (0.0624) (0.0624)
LCC -0.2472*** -0.2452*** -0.4278*** -0.4283***
(0.0554) (0.0554) (0.0373) (0.0374)
Kleibergen-Paap rk statistic 76.80 76.82 233.8 233.9
Hansen J Test statistic 0.062 0.053 0.043 0.035
Hansen J Test p-value 0.803 0.819 0.835 0.852
Endogeneity Test Statistic 0.658 1.064 3.644 2.810
Endogeneity Test p-value 0.720 0.587 0.162 0.245
Observations 16,476 16,476 16,476 16,476
Stock and Yogo (2005) critical value is 14.43. Standard errors (in parentheses) are
clustered at flight level. Control dummies are always included but not reported.
*** p<0.01, ** p<0.05, * p<0.1.
33
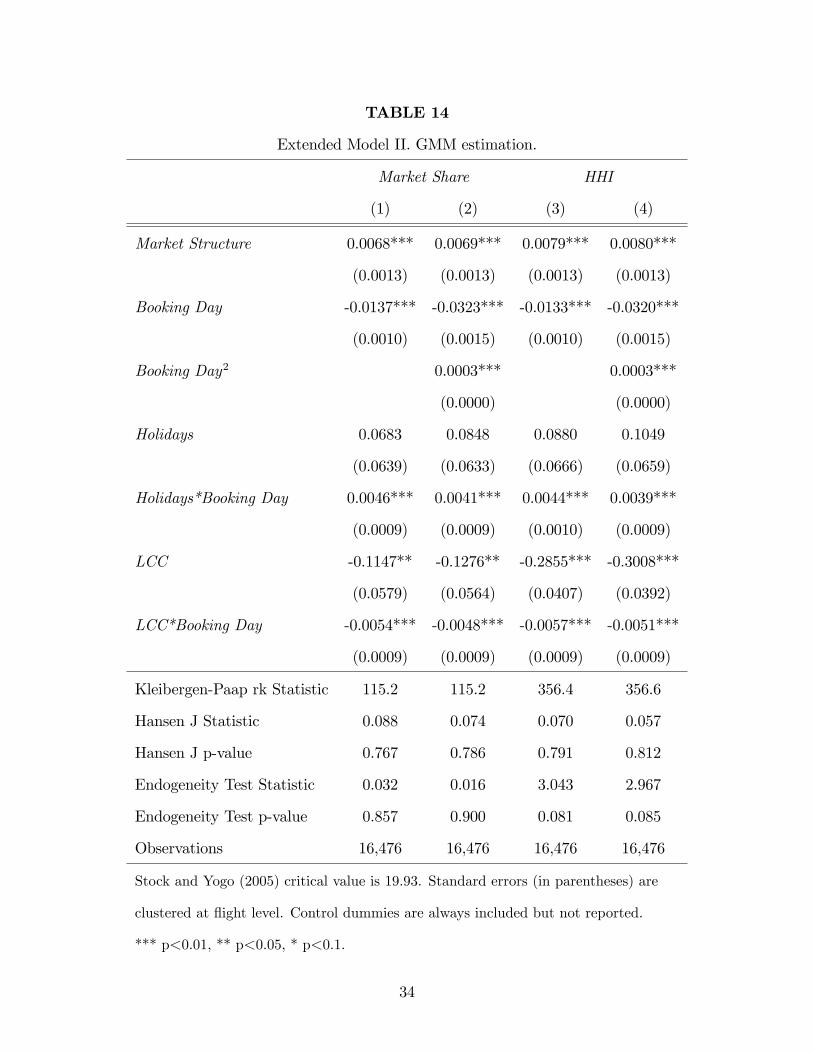
TABLE 14
Extended Model II. GMM estimation.
Market Share HHI
(1) (2) (3) (4)
Market Structure 0.0068*** 0.0069*** 0.0079*** 0.0080***
(0.0013) (0.0013) (0.0013) (0.0013)
Booking Day -0.0137*** -0.0323*** -0.0133*** -0.0320***
(0.0010) (0.0015) (0.0010) (0.0015)
Booking Day2 0.0003*** 0.0003***
(0.0000) (0.0000)
Holidays 0.0683 0.0848 0.0880 0.1049
(0.0639) (0.0633) (0.0666) (0.0659)
Holidays*Booking Day 0.0046*** 0.0041*** 0.0044*** 0.0039***
(0.0009) (0.0009) (0.0010) (0.0009)
LCC -0.1147** -0.1276** -0.2855*** -0.3008***
(0.0579) (0.0564) (0.0407) (0.0392)
LCC*Booking Day -0.0054*** -0.0048*** -0.0057*** -0.0051***
(0.0009) (0.0009) (0.0009) (0.0009)
Kleibergen-Paap rk Statistic 115.2 115.2 356.4 356.6
Hansen J Statistic 0.088 0.074 0.070 0.057
Hansen J p-value 0.767 0.786 0.791 0.812
Endogeneity Test Statistic 0.032 0.016 3.043 2.967
Endogeneity Test p-value 0.857 0.900 0.081 0.085
Observations 16,476 16,476 16,476 16,476
Stock and Yogo (2005) critical value is 19.93. Standard errors (in parentheses) are
clustered at flight level. Control dummies are always included but not reported.
*** p<0.01, ** p<0.05, * p<0.1.
34