airports commission: interim report - gov.uk
TRANSCRIPT

Airports Commission: Interim Report
December 2013

Airports Commission: Interim Report
December 2013
Airports Commission
6th Floor Sanctuary Buildings
20 Great Smith Street
London SW1P 3BT
Web: www.gov.uk/government/organisations/airports-commission
Email: [email protected]
© Crown copyright 2013, except where otherwise stated
Copyright in the typographical arrangement rests with the Crown.
You may re-use this information (not including logos or third-party material) free of charge in
any format or medium, under the terms of the Open Government Licence. To view this
licence, visit www.nationalarchives.gov.uk/doc/open-government-licence/ or write to
the Information Policy Team, The National Archives, Kew, London TW9 4DU, or
e-mail: [email protected].
Where we have identified any third-party copyright information you will need to obtain
permission from the copyright holders concerned.

3
Chair’s foreword 4
Executive summary 6
1. Background and methodology 16
2. The global aviation sector 23
3. The UK airports sector 54
4. The UK’s long-term capacity requirements 102
5. Making best use of existing capacity 136
6. Adding capacity in London and the South East 172
7. Next steps 207
Glossary 214
List of figures and tables 223
Appendices and technical reports1
Appendix 1: Supporting Appendix on short-term options
Technical Report on short-term options
Appendix 2: Supporting Appendix on long-term options
Technical Report on long-term options
Appendix 3: Technical Appendix
1 The suite of supporting documentation underpinning Chapters is available on the website, https://www.gov.uk/government/organisations/airports-commission
Contents

4
Chair’s foreword
When the Airports Commission membership was announced in November last year, my
colleagues and I received more commiserations than congratulations. Few commentators
failed to point out that ours was the latest in a long series of so far largely fruitless attempts
to grapple with the problem of airport capacity in a densely populated island.
A few supportive voices noted that the problem nonetheless needed to be solved, more
particularly at a time when, in the aftermath of the financial crisis, the country was thinking
hard about its place in the world. While that process of rethinking has not concluded, there
is a broad consensus that the UK must further develop its links with the fastest growing
regions of the world. Whether that involves growth in exports of goods and services or of
inbound tourists and students, aviation connectivity seems likely to be an important
element in the mix. And around 60 million Britons travel abroad each year, the great
majority by air.
So the economic imperative to resolve the problem is strengthening by the year, but there
is also a growing realisation that the expansion of aviation must be set in the context of a
comprehensive approach to the challenge of climate change. As the other sectors of the
economy decarbonise more rapidly, aviation emissions will become a larger proportion of
the total. And local environmental impacts, notably the nuisance and health implications of
noise, must be weighed in the balance.
My colleagues and I are not naïve enough to think that the analysis in this report will
miraculously deliver a consensus on the way forward. But we hope that the many people
who have responded to our consultations – and we are grateful to all of them – will accept
that we have made an effort to grapple with the conflicting points of view and to produce
reasonable responses to their points.
We hope we have clarified the arguments, updated earlier analysis, assessed the way the
aviation world is changing and identified a realistic set of options for future expansion.
We were conscious of the importance of avoiding unnecessary costs and anxiety for
communities across the South East, unless we saw a credible case for a commercially
viable and sustainable development at a proposed site.
Speaking personally I am very grateful to my Commission colleagues – John Armitt, Ricky
Burdett, Vivienne Cox and Julia King (and Geoff Muirhead who stood down in September)
– for their thoughtful and committed work so far. We are also grateful to our hard-working
team of officials and others, ably led by Phil Graham.

5
Chair’s foreword
In sporting terms, this is a game of two halves. The Interim Report, published here, is the
end of the beginning. In 2014 we will move on to the next phase of our work. We remain
confident that a solution can be found, which allows the UK to maintain its strong position
in world aviation, while respecting the inhabitants of those communities which most feel the
side effects.
Sir Howard Davies
Chair, Airports Commission
6
Executive summary
1 Decisions on airport location and capacity are among the most important strategic
choices a country or city can make, influencing the economic, environmental and
social development of cities and regions more than almost any other single planning
decision. They are also among the most contentious.
2 Alongside economic benefits, airports bring noise, air pollution and carbon
emissions, all of which can have significant impacts on the environment and on
the quality of life for people who live or work nearby. The planning process must
therefore ensure that decisions on airport capacity balance local considerations with
the national interest.
3 In addition, most major UK airports are – unusually in international terms – in private
ownership. This means that airport planning must also take proper account of
commercial considerations. Airports will not choose to finance and build additional
capacity unless they are confident it will be heavily utilised.
4 The question of UK airport capacity has been considered a number of times over
past decades. The Roskill Commission in 1968 recommended a new airport at
Cublington, with a minority report favouring Maplin Sands. Neither airport was built.
More recently, the 2003 White Paper The Future of Air Transport concluded that a
second runway should be built at Stansted, followed by a third at Heathrow, if
certain environmental standards could be met. That conclusion was rejected by the
incoming coalition Government after the 2010 General Election.
5 The Airports Commission (the Commission) was set up in 2012 to take a fresh
and independent look at the UK’s future airport capacity needs. It has been tasked
with producing:
●● An Interim Report (this document) by the end of 2013, setting out the nature,
scale, and timing of steps needed to maintain the UK’s status as an international
hub for aviation, alongside recommendations for making better use of the UK’s
existing runway capacity over the next five years; and,
●● A final report by summer 2015, setting out recommendations on how to meet
any need for additional airport capacity in the longer-term.

7
Executive summary
6 To facilitate the process of reaching final recommendations, and reduce uncertainty,
it has also sought to identify a list of the most credible options for new runway
capacity, which will be further developed and appraised before the final report.
7 The Commission has aimed to generate a greater consensus on airport policy by
following an approach that is:
●● Integrated: The Commission has considered a range of economic, social and
environmental factors that affect how much – and what sort of – airport capacity
is needed in the UK. It has not followed a mechanistic ‘predict and provide’
model, based on forecasting future demand for aviation and then meeting that
demand no matter the cost. It has commissioned new research and analysis and
sought to consider impacts across the whole of the system, including on air
traffic and air space, surface access to airports, cost and deliverability.
●● Collaborative: The Commission has engaged extensively with a broad range of
interested parties, through public evidence sessions, a programme of meetings
and visits, and a series of discussion papers on key topics. As the number of
responses to the discussion papers indicates, the papers were important for
advancing debate on key topics such as connectivity, climate change, aviation
noise, and airport operational models. The Commission also invited submissions
on how to make best use of existing runway capacity, and proposals for adding
new airport capacity in the longer-term. It also appointed a panel of leading
experts to advise it on key issues.
The world has changed since previous reviews of UK airport capacity
8 While the UK has debated airport policy the world has changed. Globalisation and
technological innovation are driving an increase in cross-border flows of goods,
services and people. The global economy’s centre of gravity is shifting from west to
east. Lifestyles have also changed, with many people taking advantage of European
integration to live and work outside their country of origin.
9 Aviation has had to adapt to these changes. Two parallel trends can be seen:
●● Consolidation and network integration focused on major aviation hubs.
In the most liberalised markets such as the United States and, increasingly,
Europe, significant market share has been captured by very large carriers, often
formed through mergers. Three major global ‘alliances’ between airlines have
emerged – Star Alliance, SkyTeam, and oneworld. These alliances have
developed global route networks focused on major aviation hubs in the United
States, Europe and, more recently, the Middle East and Asia.

8
●● The emergence of new competitors and new business models, especially
in the low-cost and point-to-point markets. The position of the major
American and European carriers is being challenged by rapidly growing Middle
Eastern and Asian airlines and by competition from low-cost carriers. The
low-cost sector has grown rapidly since the early 1990s, and is continuing to
expand into new markets such as business travel and long-haul services.
10 These trends are not mutually exclusive. For example, some low-cost airlines are
entering alliances and some network airlines have set up low-cost subsidiaries.
New aircraft, such as the Airbus 350 and Boeing 787, could further blur the
boundaries as they make new types of routes and services viable. The Middle
Eastern carriers are establishing significant new hubs in the Gulf.
11 As well as adapting to these new commercial realities, the industry also has to
address its environmental impacts. International negotiations on a framework to
control aviation greenhouse gas emissions are ongoing, but significant challenges
remain and the ultimate form of such a scheme remains unclear.
12 In this context, the future of the industry remains difficult to predict. Some argue
that airline alliances, and the hub-and-spoke networks that they operate, will remain
central to the way the industry works. Others maintain that a wider range of airports
will start to operate some form of hub, even where they lack a major network
carrier, by enabling passengers to ‘self-connect’ or by hosting new partnerships
between low-cost carriers and other airlines. A third view is that new aircraft with
longer ranges will make more long-haul destinations viable as point-to-point routes,
resulting in a decline in the importance of hubs.
13 The balance between the integrated network model based around major hubs, and
the growth of low-cost and other point-to-point models, may have profound effects
on the future shape of the overall aviation industry, as well as affecting the nature
and scale of any additional capacity which might be required in the UK.
So far, UK airports have adapted fairly well
14 These changes have had important impacts on the UK aviation sector. The
consolidation around major hubs has entrenched the dominance of the London
aviation market and particularly the UK’s largest airport, Heathrow, which acts
as a hub for British Airways, the country’s sole network carrier. Meanwhile, a variety
of carriers operate successful and dynamic point-to-point networks at many of the
UK’s other airports, including its second largest, Gatwick, which has also attracted
new long-haul services.
9
Executive summary
15 Alongside the impact of these global trends, developments at the national level are
changing the UK aviation sector. These include the break up of BAA Ltd, the
development of competition within the London airports system, and a new statutory
framework for reducing carbon emissions. Growth in demand for aviation has been
tempered by the economic downturn.
16 These developments were largely unforeseen by previous studies of airport
capacity.
17 The one thing that has not changed significantly is the UK’s physical airport
infrastructure, and particularly runway capacity. The only new runways built in recent
decades have been at London City and Manchester airports. The main London
airports have benefited from new terminals, but are still reliant on runways which
have been in place since the middle of the twentieth century.
18 The industry has responded well both to the constraints of the existing infrastructure
and the new, more competitive environment. Competition between major airports
may drive some further improvements over the coming years.
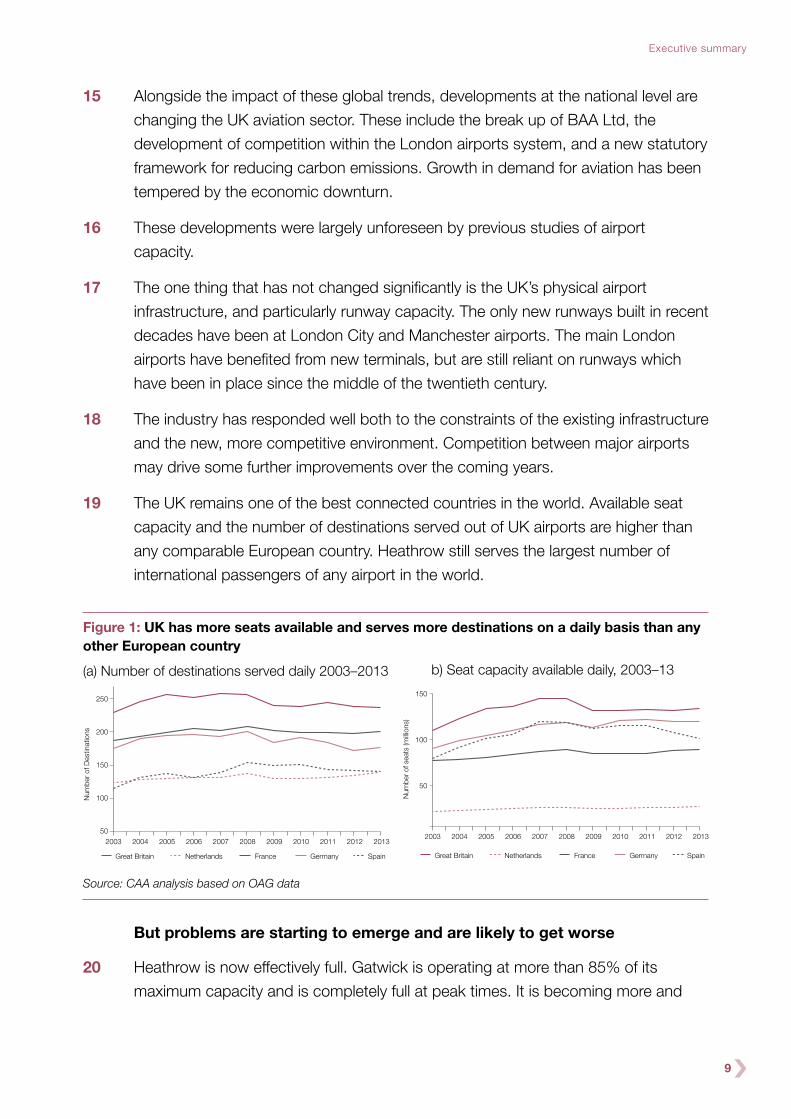
19 The UK remains one of the best connected countries in the world. Available seat
capacity and the number of destinations served out of UK airports are higher than
any comparable European country. Heathrow still serves the largest number of
international passengers of any airport in the world.
Figure 1: UK has more seats available and serves more destinations on a daily basis than any other European country
(a) Number of destinations served daily 2003–2013 b) Seat capacity available daily, 2003–13
2003
150
100
50
2004 2005
Num
ber o
f sea
ts (m
illion
s)
2006 2007 2008 2009 2010 2011 2012 2013
Great Britain Netherlands France Germany Spain
2003
250
200
150
100
502004 2005
Num
ber o
f Des
tinat
ions
2006 2007 2008 2009 2010 2011 2012 2013
Great Britain Netherlands France Germany Spain
Source: CAA analysis based on OAG data
But problems are starting to emerge and are likely to get worse
20 Heathrow is now effectively full. Gatwick is operating at more than 85% of its
maximum capacity and is completely full at peak times. It is becoming more and
10
Airports Commission: Interim Report
more difficult for airports and airlines to operate efficiently within the constraints of
their existing infrastructure. Smaller airports have been successful at attracting
some forms of traffic, but many services – particularly in long-haul markets – rely on
the volumes of demand that only exist at the country’s largest airports.
21 As a result, the UK appears to be reaching the limits of what can be achieved within
its existing airport infrastructure.
22 Passengers at Heathrow suffer from a high level of delay and unreliability, as a result
of capacity constraints limiting the airport’s day-to-day efficiency and its ability to
respond to one-off events. These issues do not only affect passengers; they also
limit the airport’s ability to offer predictable patterns of respite from noise for local
communities. As other airports reach capacity, similar impacts can be foreseen.
23 In terms of connectivity, Heathrow continues to have a dominant position amongst
European hubs on routes to North America and other established aviation markets.
However, it has not been able to build on this and establish a similar position of
strength in routes to emerging economies. And the number of domestic routes to
the airport is declining, restricting access from other UK regions to Heathrow’s
network of international services.
24 The current approach of forcing ever greater volumes of traffic through the existing
infrastructure, if continued, would therefore have increasingly detrimental effects on
the national economy, businesses, and air passengers.
25 The Commission’s analysis suggests that the costs of failing to address these
issues could amount, over a sixty-year time period, to:
●● £18-20 billion of costs to users and providers of airport infrastructure.
●● £30-45 billion of costs to the wider economy.
26 It is not possible to predict exactly when these problems will come to a head.
There are major uncertainties involved in forecasting aviation demand, and any
forecasts are sensitive to assumptions around how the economy and society will
develop in future.
27 Governments, however, have a responsibility to plan ahead for the future,
particularly in the case of long-lived infrastructure like runways, which take many
years to plan and build. To do so, policymakers need to consider a range of future
scenarios and their implications for the amount and type of infrastructure that may
be needed.
11
Executive summary
28 The Commission has developed a new set of forecasts which address many of the
key concerns about the way the Department for Transport has previously forecast
aviation demand. It has used these forecasts to test a range of scenarios for the
future of the aviation sector.
29 Across all scenarios considered, including where the UK is meeting its climate
change targets, there is significant growth in demand for aviation between now
and 2050, placing additional pressure on already stressed airport infrastructure
in London and the South East. The London airport system is forecast to be under
very substantial pressure in 2030, and by 2050 sees demand significantly in excess
of the total available capacity, even when aviation emissions are constrained to
2005 levels.
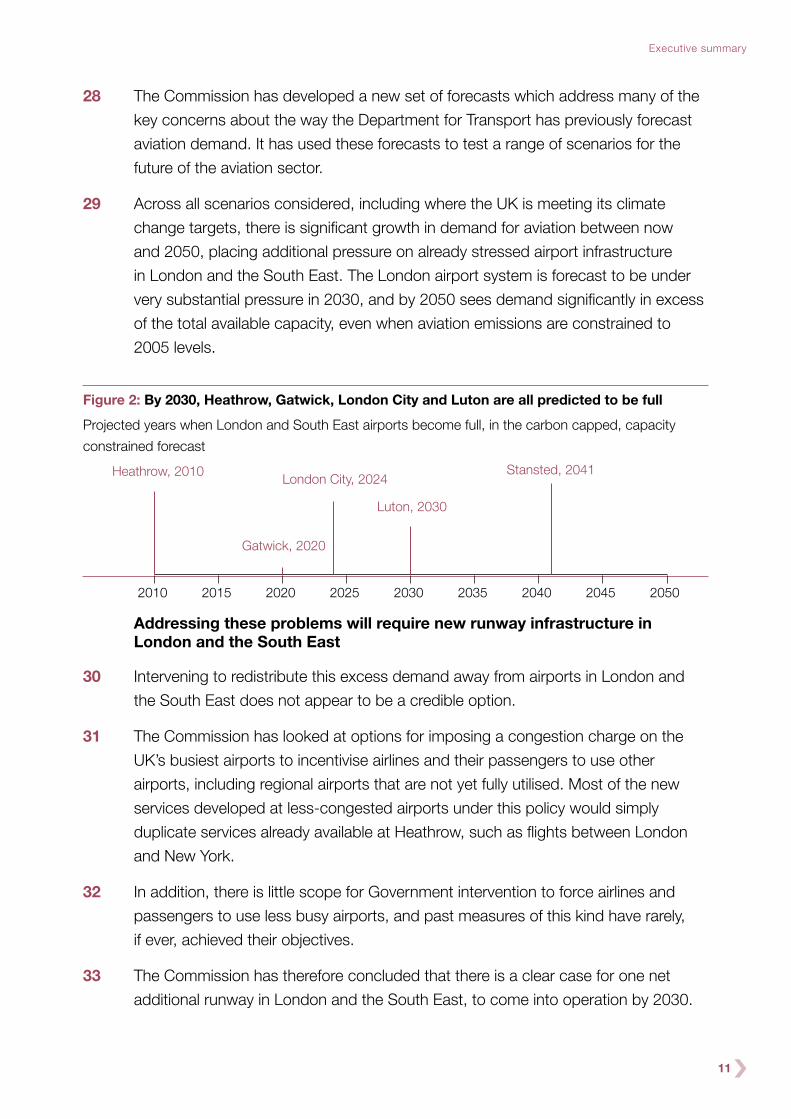
Figure 2: By 2030, Heathrow, Gatwick, London City and Luton are all predicted to be full
Projected years when London and South East airports become full, in the carbon capped, capacity
constrained forecast
Heathrow, 2010London City, 2024
Luton, 2030
Gatwick, 2020
2010 2015 2020 2025 2030 2035 2040 2045 2050
Stansted, 2041
Addressing these problems will require new runway infrastructure in London and the South East
30 Intervening to redistribute this excess demand away from airports in London and
the South East does not appear to be a credible option.
31 The Commission has looked at options for imposing a congestion charge on the
UK’s busiest airports to incentivise airlines and their passengers to use other
airports, including regional airports that are not yet fully utilised. Most of the new
services developed at less-congested airports under this policy would simply
duplicate services already available at Heathrow, such as flights between London
and New York.
32 In addition, there is little scope for Government intervention to force airlines and
passengers to use less busy airports, and past measures of this kind have rarely,
if ever, achieved their objectives.
33 The Commission has therefore concluded that there is a clear case for one net
additional runway in London and the South East, to come into operation by 2030.

12
34 In terms of the nature of the capacity that is needed, the Commission does not
believe there is a binary choice between providing additional hub capacity or
additional point-to-point capacity. Instead, the optimal approach is to continue to
invest in an airport system that caters for a range of airline business models. This is
particularly important in a competitive airports system, like London, where airlines
can choose how to use the available capacity, and the market can be expected to
respond dynamically to the provision of new infrastructure.
35 The Commission’s forecasts also indicate that there is likely to be a demand case
for a second additional runway in operation by 2050 or, in some scenarios, earlier.
The Commission will carry out further analysis on this issue in the second phase of
its work programme, including looking at the implications for any future capacity
expansion of each of the new runway options shortlisted for detailed consideration.
This will enable it to make recommendations to Government in its final report as to
when, how and by whom the case for a second new runway should be considered.
Before new capacity becomes operational, better use can be made of existing airport infrastructure
36 There are no easy ways of addressing the emerging problems for UK airports
without developing new infrastructure, but there are some steps that can be taken
to make better use of existing capacity in the short-term.
37 Following a call for evidence, the Commission is recommending a range of
measures including the following:
●● An ‘Optimisation Strategy’ to improve the operational efficiency of UK airports
and airspace, including:
– airport collaborative decision making. A system which provides access to
accurate and timely flight information for all those involved in processing
aircraft to increase the predictability and speed of the aircraft turnaround
process;
– airspace changes supporting performance based navigation. Matching
airspace structures with modern aircraft’s ability to follow more accurate tracks
allowing the possibility of designing closer spaced departure routes or
alternating multiple arrival and departure routes for respite;
– enhanced en-route traffic management. Driving greater schedule
adherence; and,

13
Executive summary
– time based separation. Enabling air traffic control to apply the same time
spacing between aircraft irrespective of wind conditions, increasing the
operational resilience of the airport in high wind conditions.
●● Trials at Heathrow of measures to smooth the early morning arrival schedule to
minimise delays and provide more predictable respite for local communities as
part of a range of measures to increase the flexibility of runway use.
●● The establishment of a Senior Delivery Group to drive forward the implementation
of the Future Airspace Strategy and the delivery of the Commission’s
recommendations, showing strong leadership and accountability for delivery.
●● The creation of an Independent Aviation Noise Authority to provide expert and
impartial advice about the noise impacts of aviation and facilitate the delivery of
future improvements to airspace operations.
●● A package of surface transport improvements to make airports with spare
capacity more attractive to airlines and passengers, including:
– the enhancement of Gatwick Airport Station;
– further work to develop a strategy for enhancing Gatwick’s road and rail
access;
– work on developing proposals to improve the rail link between London and
Stansted;
– work to provide rail access into Heathrow from the South; and,
– the provision of smart ticketing facilities at airport stations.
38 These measures are worthwhile on their own terms, but none of them can provide
a long-term solution to the UK’s airport capacity problem.
39 The Chair of the Commission wrote to the Chancellor of the Exchequer on 26
November about its recommendations on surface access to airports. HM Treasury’s
National Infrastructure Plan,2 published on 4 December, began the process of
implementing it. The Commission welcomes this, and encourages the Government
to continue to work on the delivery of the surface transport improvements.
2 HM Treasury (2013), National Infrastructure Plan https://www.gov.uk/government/publications/national-infrastructure-plan-2013

14
The Commission has carried out an assessment of the options for adding extra capacity in the longer-term
40 The Commission received 52 proposals for addressing the UK’s airport capacity
shortfall, over 40 of which suggested building additional runway infrastructure.
These proposals were based on very different visions for the future of the aviation
sector.
41 The Commission’s analysis looked at accommodating increasing demand through
a variety of means. This included options requiring no new runway infrastructure,
through purely operational measures or by using surface transport improvements to
replace the need for short-haul flights. The analysis concluded that none of these
options delivered the capacity needed.
42 The options for new runway infrastructure were assessed against the Commission’s
sift criteria and on this basis two potential sites were selected for further analysis
and assessment:
a. Gatwick Airport: At this site the Commission’s analysis will be based on a new
runway over 3,000m in length spaced sufficiently south of existing runway to
permit fully independent operation.
b. Heathrow Airport: At this site the Commission’s analysis will consider two
potential runway options:
– A new 3,500m runway constructed to the northwest of the existing airport,
as proposed by Heathrow Airport Ltd, and spaced sufficiently to permit fully
independent operation.
– An extension of the existing northern runway to the west, as proposed by
Heathrow Hub Ltd, lengthening it to at least 6,000m and enabling it to be
operated as two separate runways: one for departures and one for arrivals.
43 The Thames Estuary airport options were not at this stage shortlisted. While the
potential they offered to reduce aviation noise impacts in the South East of England
and to support economic development on the eastern side of London was
attractive, they presented many challenges and uncertainties.
44 They would be extremely expensive, with the cost of an Isle of Grain airport (the
most viable of those presented) around five times that of the three short-listed
options at up to £112 billion. They would present major environmental issues,
especially around impacts on protected sites. The new surface access infrastructure
required would be very substantial, with potential cost, deliverability and
environmental challenges of its own. And the overall balance of economic impacts

15
Executive summary
would be uncertain – particularly as an Estuary airport would require the closure of
Heathrow for commercial reasons and London City for airspace reasons.
45 The Commission intends to carry out additional analysis in respect of the Isle
of Grain option in the first half of 2014. On this basis, it will reach a view before the
end of the year as to whether such an option would offer a credible proposal for
consideration alongside the short-listed options. If so, it will be subject to a similar
appraisal and consultation process as for those options, although not necessarily
to the same timetable.
46 Stansted airport options have not been short-listed. Its volumes have fallen in recent
years, and there is considerable spare capacity, unlike at Gatwick. In addition, a
large hub airport would be close to the cost of the Estuary, highly disruptive to
airspace and would not present the same regeneration opportunities. Stansted
may however be a plausible option for any second additional runway in the 2040s.
47 None of the other proposals was considered to be a credible option for further
detailed development in the next phase of the Commission’s work. The
Commission’s consideration of rejected proposals is set out in the supporting
Appendix 2.
The Commission will now begin the next phase of its work to determine the most suitable location and design for new airport capacity
48 In the second phase of its work, from now until the publication of its final report in
summer 2015, the designs of the short-listed proposals will be further developed
and subjected to a more detailed assessment. There will be a consultation on the
short-listed options and associated appraisal results in the autumn of 2014.
49 The Commission will publish a draft Appraisal Framework for consultation early in
2014. This will set out details of how scheme designs should be developed and
how scheme impacts will be appraised.
50 The Commission will also set out early in 2014 more details of how it will take forward
its further analysis of the option for a new hub airport in the Thames Estuary.
51 The Commission recognises that the publication of this Interim Report may cause
uncertainty for communities close to the short-listed sites and may have some
impact on local property markets. The Commission encourages the Government
and those promoting schemes to consider what steps can appropriately be taken
to limit these concerns, including for the limited number of people who may face an
urgent need to sell their home before the Commission publishes its final report, but
find themselves unable to do so.

16
Chapter 1:
Background and methodology
Background
1.1 On 7 September 2012, the Government announced the creation of an independent
Airports Commission (the Commission) to identify and recommend to Government
options for maintaining the UK’s status as an international hub for aviation. The
Commission’s members are Howard Davies (Chair), Sir John Armitt, Professor Ricky
Burdett, Vivienne Cox, and Professor Dame Julia King.3
1.2 The Commission has been tasked with producing an Interim Report (this document)
by the end of 2013 and a final report by summer 2015. The Commission’s terms of
reference set out the following requirements for the Interim Report:
The Commission should report no later than the end of 2013 on:
●● its assessment of the evidence on the nature, scale and timing of the steps
needed to maintain the UK’s global hub status; and,
●● its recommendation(s) for immediate actions to improve the use of existing
runway capacity in the next five years – consistent with credible long-term
options.
1.3 The final report will set out the Commission’s recommendations for meeting any
need for additional capacity, based on a detailed assessment of the three short-
listed long-term options, including their economic, social and environmental
impacts. It will also make recommendations for ensuring that the need is met as
expeditiously as practicable within the required timescale.
1.4 In order to meet the requirements set out in the terms of reference for the Interim
Report, and to ensure that the Commission is well-placed to deliver a timely and
robust final report, this document:
●● sets out the Commission’s views on the nature, scale and timing of the UK’s
future aviation capacity and connectivity needs;
●● makes recommendations for immediate actions to improve the use of existing
runway capacity in the next five years;
3 A sixth Commissioner, Geoff Muirhead, stepped down from the Commission in September 2013

17
Chapter 1: Background and methodology
●● identifies additional measures for making the best use of existing capacity that
might be further developed before the Commission’s final report;
●● presents a shortlist of the most credible options for new runway capacity,
consistent with the Commission’s conclusions on the UK’s aviation capacity
needs, to be further developed before the final report; and,
●● sets out the process for the second phase of the Commission’s work, from now
until summer 2015, and explains how those with an interest in this work can
engage with it.
How the Commission’s work supports the Government’s role in planning airport capacity
1.5 While the UK has a competitive and substantially privatised airport sector, the
Government still has an important role in relation to planning future airport capacity.
The Planning Act 2008, as modified by the Localism Act 2011, put in place a new
system of development consent for Nationally Significant Infrastructure Projects
(NSIPs), including certain types of energy, transport, water, and waste projects.
1.6 Under this system, planning applications for NSIPs are examined by the Planning
Inspectorate, in the context of a National Policy Statement (NPS) produced by the
Government. NPSs include the Government’s objectives for the development of
nationally significant infrastructure in a particular sector, such as aviation. They give
reasons for the policy set out in the statement, and must include an explanation of
how the policy takes account of Government policy relating to mitigation of, and
adaptation to, climate change.
1.7 NPSs undergo a democratic process of public consultation and parliamentary
scrutiny before being ‘designated’ (published). They provide the framework within
which Planning Inspectors make their recommendations to the relevant Secretary of
State, who ultimately takes the decision on whether to grant or refuse development
consent. This system recognises the challenging and contentious nature of many
major infrastructure schemes.
1.8 The need for close Government involvement, to ensure the process is fair to both
communities and developers, and that it balances local considerations with the
national interest, is evident from the contentious nature of the recent debate on
airport expansion in the UK. When, in 2010, the incoming Coalition Government
said that it did not support an existing plan to build a third runway at Heathrow
(which, it should be emphasised, is different from the proposals that the

18
Commission has received for additional runways at that airport4), the airport quickly
dropped its plan. Although it would have been open to Heathrow, as a private
company, to have pressed ahead and submitted its application, it recognised that
without support from Government it was highly unlikely to obtain consent.
1.9 To help avoid a similar situation arising in future, the Commission will publish as part
of its final report its recommendations on the appropriate legal and planning
processes that should be used to expedite the delivery of new airport infrastructure.
The Commission’s methodology
1.10 Decisions on airport location and capacity are among the most important strategic
choices a country or city can make. These choices influence the economic,
environmental and social development of cities and regions more than many other
planning choices. It is therefore right that these decisions are carefully made, and
that an attempt is made to achieve as much consensus as possible. Those
principles have guided the Commission’s process and approach.
An integrated approach
1.11 Decisions on major infrastructure projects have often been based on a simplistic
process of projecting future demand, and then providing the infrastructure to meet
that demand no matter the cost – the so-called ‘predict and provide’ model.
1.12 Previous attempts at addressing the issue of the UK’s airport capacity have
conformed to this model. Work has been predicated on a straightforward projection
of demand and has primarily focused on a comparison of the merits and drawbacks
of various sites for expansion. Political consensus has proven difficult to achieve.
1.13 The Commission began its work with an understanding that aviation and airports
have wide ranging impacts. The ability to move people and goods across the globe
in a matter of hours is fundamental to the global economy, affecting everything from
the performance of our financial services to the range of goods available on
supermarket shelves. Airports themselves can also make an important contribution
to their local economies, being major employers in their own right and having the
potential to attract companies whose business depends on air travel into their
immediate proximity.
1.14 The ability to travel abroad for leisure (which has become much more widely
available in recent decades) makes an important contribution to quality of life,
whether by providing opportunities for relaxation or by allowing people to broaden
4 Heathrow Airport Ltd. (17th July 2013), Submission to Airports Commission, http://www.heathrowairport.com/static/HeathrowAboutUs/Downloads/PDF/long-term-hub-capacity-options_LHR.pdf
19
Chapter 1: Background and methodology
their horizons. One fast-growing driver of demand for air travel is the need to visit
friends and relatives – an inevitable consequence of an increasingly mobile global
society in which families and communities are frequently spread around the world.
Airports are also often the first point of contact for many visitors to the UK.
1.15 Some of the consequences of aviation are not so positive. Air travel already makes
a significant contribution to global greenhouse gas emissions and this contribution
is set to grow as other industries take steps to decarbonise. Other environmental
impacts are more local in scope; aircraft noise causes considerable annoyance to
the communities it affects and there is a growing body of evidence regarding its
impacts on human health. New infrastructure developments can alter landscapes
and affect natural habitats and cultural heritage. The challenge of getting
passengers into and out of airports on the ground can also place stress on local
transport networks, potentially leading to congestion and air quality issues.
1.16 The Commission has therefore adopted an integrated approach to analysis. It has
considered a range of economic, social and environmental factors that affect how
much – and what sort of – airport capacity is needed in the UK. These include:
●● the Government’s objective of maintaining the UK’s status as Europe’s most
important aviation hub;
●● the impacts of air connectivity on the economy;
●● the interactions between aviation and other transport modes;
●● the need for action on climate change and, in particular, to meet the UK’s
legislated climate change commitments;
●● the impacts of airport development on the local environment, landscape and
heritage;
●● the impacts of airports on the quality of life for people living and working near
airports, such as the impacts of aircraft noise;
●● the impacts on employment, housing and broader social factors;
●● the needs of air passengers, both business and leisure;
●● the implications for the quality of experience for passengers; and,
●● the prospects for financing and delivering new airport infrastructure.
1.17 The Commission’s approach has been informed by the principles of the Strategic
Environmental Assessment (SEA) Directive to support any subsequent decision by
20
Government on its long-term aviation policy. The Commission’s methodology takes
account of the social and environmental costs of policy options alongside their
anticipated benefits, and has considered a range of alternative strategies for
meeting the stated policy objectives.
An open and inclusive process
1.18 The Commission was determined to take a fresh and independent look at UK
airport capacity. As a new body, comprising individuals with a variety of professional
backgrounds and expertise, it has been able to engage widely, review the evidence
objectively, and exercise its judgement at arm’s length from the political process.
1.19 The Commission’s work has been supported by an Expert Advisory Panel, whose
terms of reference are available on the Commission’s website.5 The views and
opinions expressed in this report are those of the Commission and do not
necessarily reflect the views or opinions of any other parties who assisted in the
compilation of this Interim Report.
1.20 The Commission began its work by making a fresh assessment of the UK’s future
airport capacity requirements. It published a series of discussion papers, on aviation
demand forecasting, the economic benefits of air connectivity, aviation and climate
change, airport operating models, and aviation noise.6 It has sought to look afresh
at how the industry operates and how it may develop in future, taking into account
the latest evidence and forecasts.
1.21 In addition, the Commission held two public evidence sessions in Manchester and
London on 9 and 10 July 2013 respectively. At these events the Commission took
evidence from airport operators, airlines, environmental organisations, local
campaign groups, business organisations, representatives of the tourism industry,
and others.
1.22 The Commission has considered research and reports from a wide range of bodies
including Committees, academic bodies and interest groups. It has also undertaken
an extensive programme of meetings and visits. The Commission has been to
several of the proposed sites for expansion and has visited or met representatives
from a number of overseas airports. The Commission has also sought to
understand the local impacts of potential airport development, for example by
visiting west-London sites affected by noise from Heathrow, and touring a proposed
site for a Thames Estuary airport on the Hoo Peninsula.
5 https://www.gov.uk/government/uploads/system/uploads/attachment_data/file/193932/eap-tor-membership.pdf6 All discussion papers can be found on the Commission’s website,
https://www.gov.uk/government/collections/airports-commission-discussion-papers--2.

21
Chapter 1: Background and methodology
1.23 The Commission also invited submissions on how to make best use of the UK’s
existing airports and runways. Seventy-five responses were received to the
consultation which ended on 17 May, covering issues such as airspace
optimisation, airport operations, and surface access. Further detail of the
assessment of these measures is included in Appendix 1. The conclusions are in
Chapter 5.
1.24 Finally, to ensure that it would be able to move quickly to assess the options for
meeting any long-term capacity gap it might identify, the Commission invited outline
proposals for adding new airport capacity in the longer-term. Fifty-two proposals
were received, of which 39 were from organisations and 13 from members of the
public. Detail of the assessment of these proposals is included in Appendix 2.
The conclusions are in Chapter 6.
1.25 To make the process as open, inclusive, and transparent as possible, the
Commission has published the responses to its discussion papers on its website,
alongside transcripts of public evidence sessions, a summary of options for making
best use of existing capacity, and the full text of the proposals for new capacity (or
links to them where they had previously been published by their authors). Interested
parties were given an additional two months after the publication of proposals for
new capacity to submit further comments on these, and 300 individual responses
were received. In addition, two campaigns generated around 3,000 representations
in relation to the proposed Thames Estuary airport.
1.26 Finally on 7 October the Commission Chair gave a speech outlining that there was a
need for some additional capacity to service future demand in London and the
South East. The speech invited comments on this emerging thinking by 31 October
and just over one hundred responses were received.
Structure of the Interim Report
1.27 This Interim Report sets out the conclusions the Commission has now reached, and
the evidence and judgements on which they are based. The document is structured
as follows:
●● Chapter 2 provides an overview of recent developments in the global aviation
sector, and how these relate to broader economic, social and environmental
changes. It also proposes a set of scenarios for how the aviation sector might
evolve in the future.
22
●● Chapter 3 assesses the structure of the UK airports sector and considers how
well the UK’s economy and society are being served by its current airport
infrastructure.
●● Chapter 4 sets out the Commission’s view of the UK’s longer-term airport
capacity requirements, in the context of the Commission’s forecasts of aviation
demand and traffic to 2050, and the scenarios set out in Chapter 2.
●● Chapter 5 sets out the Commission’s recommendations for making best use of
the UK’s existing airport capacity, including airspace improvements, operational
changes, and proposals for improving surface transport links to airports.
●● Chapter 6 summarises the proposals for adding new airport infrastructure in the
longer-term, and sets out the options that the Commission believes merit more
detailed appraisal.
●● Chapter 7 sets out the next phase of the Commission’s work, including the
publication of its draft Appraisal Framework, and information on how interested
parties can engage with the Commission in the next phase of its work.
1.28 The series of supporting Appendices and Technical Reports7 provide more detail on
the processes the Commission followed, the analytical approaches it has adopted,
and the technical details of its recommendations.
7 These can be found on the Commission’s website at https://www.gov.uk/government/organisations/airports-commission

23
Chapter 2
The global aviation sector
SUMMARY
The world has changed substantially since the last major review of UK airport policy,
due to globalisation, technological innovation, the recent economic downturn, and
international efforts to tackle climate change.
These changes have had a profound impact on the aviation industry. Two parallel
trends can be observed – one of consolidation, partnership and network integration;
the other of new entrants, enhanced competition and expanding point-to-point travel.
The first of these trends has seen:
●● consolidation in liberalised aviation markets such as the US and, increasingly,
Europe;
●● the rapid growth of the three major airline alliances – Star Alliance, SkyTeam and
oneworld;
●● complex webs of code shares, equity stakes and joint ventures underneath and
alongside these alliance structures, which are further strengthening links between
airlines; and,
●● the development of dense and integrated route networks focused around major
aviation hubs, combining origin and destination (OD) and transfer traffic to enable
high levels of connectivity.
This pattern of increasing integration has, however, been accompanied by a parallel
trend which has seen new competitors and new business models emerging,
particularly in the more liberalised markets, and point-to-point networks expanding.
Key developments include:
●● the growing importance of the low-cost sector, which is increasingly expanding into
new markets – for example long-haul services and business travel;
●● cost-efficiencies and new technologies, enabling new routes to be opened which
were not previously considered viable;

24
●● Middle Eastern and south east Asian carriers competing with long-haul legacy
airlines, and new international links to second-tier airports; and,
●● the emergence of self-connecting, supported by airports like Gatwick.
These trends are not mutually exclusive and they bring the low-cost and the
full-service models closer together. For example, some low-cost airlines are entering
alliances and some legacy carriers are establishing low-cost subsidiaries of their own.
There are also a number of wider factors to take into account. Increasing demand for
aviation in new and emerging markets, driven by their expanding middle-class, will
shape future industry investment decisions and strategies.
The introduction of new aircraft, for example the Airbus A350 and Boeing 787, will
make new routes and service types possible. Future trends towards protectionism or
liberalisation may have significant implications for the shape of the industry and the
markets it serves. And moves towards a global scheme to tackle aviation greenhouse
gas emissions could affect the way the industry is regulated in the future.
2.1 The aviation industry has evolved rapidly in the past few decades and often in
unforeseen ways. One important development has been the evolution of airline
alliances, operating global route networks from major aviation hubs in Europe,
North America and, increasingly, the Middle East and south east Asia.
2.2 A second important innovation has been the rapid expansion of the low-cost airline
business, which was pioneered in the US and subsequently spread to Europe
during the 1990s. There are now a number of low-cost models with different
strategies. Low-cost carriers represent the fastest growing sector of the aviation
market, which has led to new routes and lower fares.
2.3 This chapter describes these recent industry developments in more detail, explores
the factors that have driven them, and considers how they might evolve in the
future. A key theme is the dynamism of the aviation industry: neither the emergence
of the hub model, nor the expansion of the low-cost sector were widely predicted.
2.4 The Commission has engaged widely with stakeholders within and outside the
aviation industry, and found little consensus about how the sector will develop in
future. Some argue that airline alliances, and the hub-and-spoke networks that they
operate, will remain central to the way the industry works. Others maintain that a
wider range of airports will start to operate some form of hub, even where they lack
a major hub carrier, by enabling passengers to ‘self-connect’. A third view is that

25
Chapter 2 The global aviation sector
new aircraft with longer ranges will make more long-haul destinations viable as
point-to-point routes, resulting in a decline in the importance of hubs. Each of these
views has different implications for the type of airport capacity needed in the UK.
The aviation industry today
2.5 The current structure of the global aviation industry is the product of a number of
recent economic, social and technological changes. Globalisation and technological
innovation have resulted in an increase in cross-border flows of goods, services and
people. This has created new opportunities for airlines, and there have been a
number of cross-border mergers and partnerships, which were not previously
possible.
Consolidation and alliances
2.6 For the airline industry, globalisation and changes to the way the industry is
regulated have liberalised a market that was highly fragmented and protected. Until
around thirty years ago, airlines were typically state-owned companies with
monopoly rights in domestic markets, and almost all international traffic rights were
negotiated bilaterally between individual states.
2.7 This situation began to change when the US became the first to deregulate its
airline sector in 1978. Europe followed suit in the following decades, with a series of
reforms between 1987 and 1997. Until this point liberalisation mostly took the form
of internal deregulation within the US and EU, with some limited steps towards
deregulation in other parts of the world. However, in 2008 the EU and US signed
the Open Skies agreement, under which any carrier from either side can fly to and
from any point in the EU and any point in the US.
2.8 Liberalisation has exposed previously protected airlines, flying primarily ‘point-to-
point’ services between an origin in one country and a destination in another, to
greater competition and, as a result, cost pressures. These cost pressures on one
hand, and liberalisation on the other, incentivised network airlines to join forces.
Figure 2.1 shows that the global market share has increasingly been captured
by very large carriers (whose ranks some low-cost carriers have joined over
recent years).
26
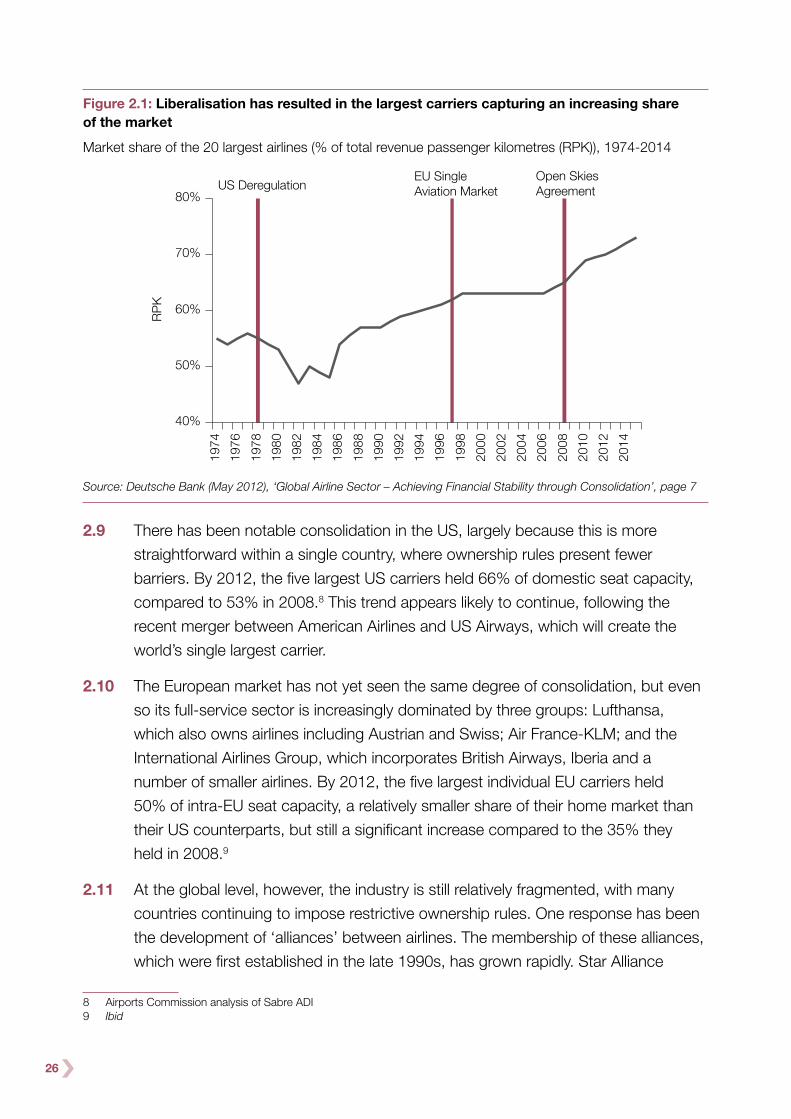
Figure 2.1: Liberalisation has resulted in the largest carriers capturing an increasing share of the market
Market share of the 20 largest airlines (% of total revenue passenger kilometres (RPK)), 1974-2014
40%
50%
60%
70%
80%19
74
1976
1978
1980
1982
1984
1986
1988
1990
1992
1994
1996
1998
2000
2002
2004
2006
2008
2010
2012
2014
US Deregulation
RP
K
Open Skies Agreement
EU Single Aviation Market
Source: Deutsche Bank (May 2012), ‘Global Airline Sector – Achieving Financial Stability through Consolidation’, page 7
2.9 There has been notable consolidation in the US, largely because this is more
straightforward within a single country, where ownership rules present fewer
barriers. By 2012, the five largest US carriers held 66% of domestic seat capacity,
compared to 53% in 2008.8 This trend appears likely to continue, following the
recent merger between American Airlines and US Airways, which will create the
world’s single largest carrier.
2.10 The European market has not yet seen the same degree of consolidation, but even
so its full-service sector is increasingly dominated by three groups: Lufthansa,
which also owns airlines including Austrian and Swiss; Air France-KLM; and the
International Airlines Group, which incorporates British Airways, Iberia and a
number of smaller airlines. By 2012, the five largest individual EU carriers held
50% of intra-EU seat capacity, a relatively smaller share of their home market than
their US counterparts, but still a significant increase compared to the 35% they
held in 2008.9
2.11 At the global level, however, the industry is still relatively fragmented, with many
countries continuing to impose restrictive ownership rules. One response has been
the development of ‘alliances’ between airlines. The membership of these alliances,
which were first established in the late 1990s, has grown rapidly. Star Alliance
8 Airports Commission analysis of Sabre ADI9 Ibid

27
Chapter 2 The global aviation sector
began in 1997 with just five members (Lufthansa, United, Air Canada, Thai Airways
and SAS). By 2013 it had 28 members, including two major Chinese airlines and
Latin American and African carriers.
2.12 By 2012, 58% of global airline seat capacity was controlled by one of the three
major alliances, oneworld, SkyTeam and Star Alliance. Beginning as relatively
loose marketing partnerships they are increasingly taking on a fuller role, with
co-operation between alliance members ranging from limited partnerships on
specific routes through to joint ventures and quasi mergers. Most recently they
have also begun to co-ordinate investment in shared facilities, including integrated
check-in areas at major airports.
Figure 2.2: The three major alliances hold over half of global seat capacity
Airline alliance market share by seat capacity, January – June 2012
WorldEurope–Asia
N. America–Latin America
N. America–Asia
N. America–Europe
Star Alliance oneworld SkyTeam
26%
87% 88% 86%
75%
58%
30%14%
23%
18%22% 21%
31%
18%
14%
39% 37% 41% 34%26%
Source: Deutsche Bank (May 2012), ‘Global Airline Sector – Achieving Financial Stability through Consolidation’, page 8
The rise of Middle Eastern and south east Asian carriers
2.13 The development of a more competitive commercial environment for airlines has
coincided with a shift in relative economic power from west to east. As a result,
many of the fastest growing airlines are Middle Eastern and south east Asian,
posing a challenge to legacy carriers and alliances based in Europe and
North America.

28
Box 2a: The rise of the Middle Eastern aviation hubs
One of the most significant developments in the global aviation sector over
the past decade has been the emergence of the Gulf airports and in particular
Dubai, which is now the largest aviation hub in the Middle East and one of the
largest in the world. The current airport, Dubai International, is the primary hub
for Emirates airline. It is also home to flydubai, a low-cost airline operating to
60 destinations across the Middle East, Africa, and Eastern Europe.
Dubai’s aviation model is quite different from those of the major European
hubs. Dubai has a smaller domestic market which makes its aviation sector
more reliant on international passengers. Its extraordinary growth, averaging
around 12% per year in international passengers, is a function of its strategic
location, which makes it well placed to serve emerging markets in Asia and
Africa. Around two-thirds of the world’s population lives within eight hours’
flight from Dubai.
Figure 2.3: Dubai is geographically well-placed to serve emerging markets in Asia and Africa
Please note the contour lines represent estimated flight times only and may differ slightly
from the actual routes taken.
4 hours
8 hours
12 hours
Source: DfT
29
Chapter 2 The global aviation sector
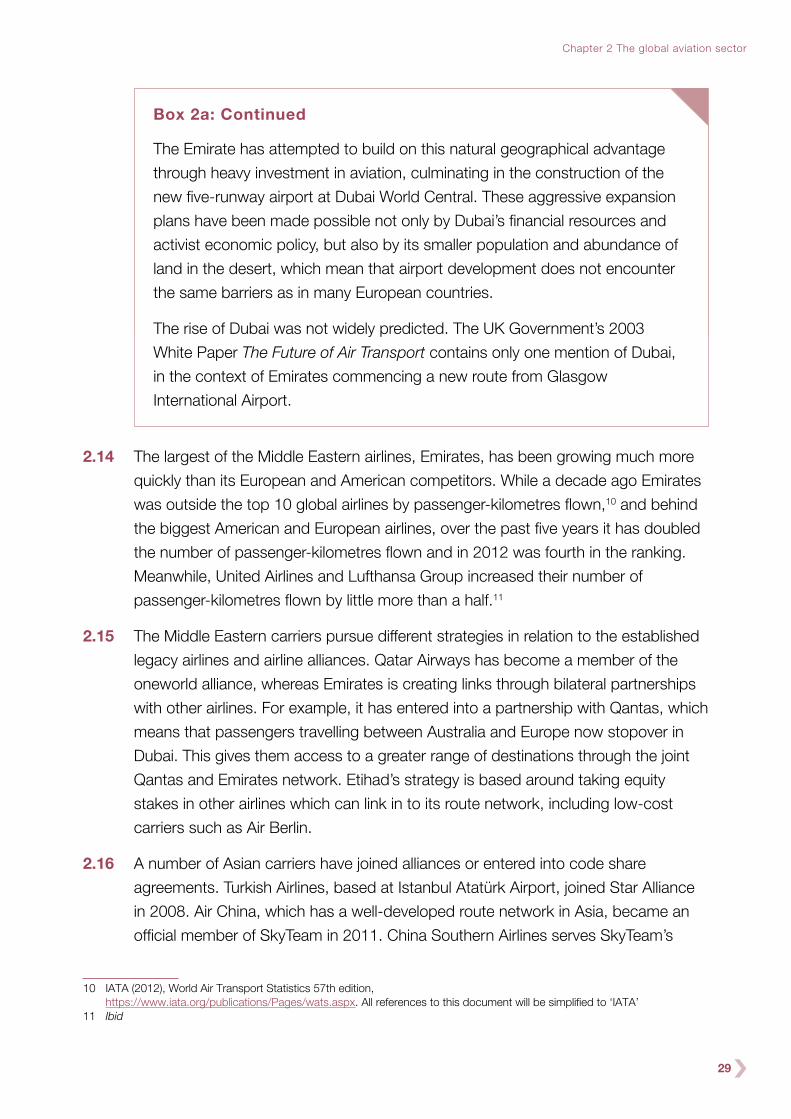
Box 2a: Continued
The Emirate has attempted to build on this natural geographical advantage
through heavy investment in aviation, culminating in the construction of the
new five-runway airport at Dubai World Central. These aggressive expansion
plans have been made possible not only by Dubai’s financial resources and
activist economic policy, but also by its smaller population and abundance of
land in the desert, which mean that airport development does not encounter
the same barriers as in many European countries.
The rise of Dubai was not widely predicted. The UK Government’s 2003
White Paper The Future of Air Transport contains only one mention of Dubai,
in the context of Emirates commencing a new route from Glasgow
International Airport.
2.14 The largest of the Middle Eastern airlines, Emirates, has been growing much more
quickly than its European and American competitors. While a decade ago Emirates
was outside the top 10 global airlines by passenger-kilometres flown,10 and behind
the biggest American and European airlines, over the past five years it has doubled
the number of passenger-kilometres flown and in 2012 was fourth in the ranking.
Meanwhile, United Airlines and Lufthansa Group increased their number of
passenger-kilometres flown by little more than a half.11
2.15 The Middle Eastern carriers pursue different strategies in relation to the established
legacy airlines and airline alliances. Qatar Airways has become a member of the
oneworld alliance, whereas Emirates is creating links through bilateral partnerships
with other airlines. For example, it has entered into a partnership with Qantas, which
means that passengers travelling between Australia and Europe now stopover in
Dubai. This gives them access to a greater range of destinations through the joint
Qantas and Emirates network. Etihad’s strategy is based around taking equity
stakes in other airlines which can link in to its route network, including low-cost
carriers such as Air Berlin.
2.16 A number of Asian carriers have joined alliances or entered into code share
agreements. Turkish Airlines, based at Istanbul Atatürk Airport, joined Star Alliance
in 2008. Air China, which has a well-developed route network in Asia, became an
official member of SkyTeam in 2011. China Southern Airlines serves SkyTeam’s
10 IATA (2012), World Air Transport Statistics 57th edition, https://www.iata.org/publications/Pages/wats.aspx. All references to this document will be simplified to ‘IATA’
11 Ibid
30
routes to Australia, where it competes with Qantas, Emirates, Singapore Airlines
(Star), Malaysian Airlines (oneworld) and Cathay Pacific. India’s flag carrier, Air India,
is not an alliance member, but does have code share agreements with airlines
including Air Canada, Lufthansa, Singapore Airlines, and Turkish Airlines.
2.17 It is not clear whether more Middle Eastern and Asian carriers will opt to join
alliances and integrate their services into these global networks, or whether many
will remain non-aligned and extend their networks to compete with them. Either of
these moves could have significant impacts on the global airline industry.
Strengthening hub-and-spoke networks
2.18 The consolidation of the airline industry and the rise of alliances have gone hand-in-
hand with the strengthening of ‘hub-and-spoke’ networks based around the largest
airports. In hub-and-spoke networks, airlines and alliances route their traffic through
one or more key airports (‘hubs’), with feeder traffic from other airports in the
network (‘spokes’) supplementing local origin and destination traffic at the hubs.
This model developed first in the US, before spreading to Europe during the 1990s
and 2000s, and more recently to Asia and the Middle East. Box 2b explains the
concept of an aviation hub in more detail.
2.19 For airlines and alliances, pooling traffic in this way maximises yields, and
concentrating operations at a few key airport locations can help to drive down
operating costs. For passengers, the hub-and-spoke model maximises the choice
of destinations within a route network, although sometimes at the expense of some
direct connections.

31
Chapter 2 The global aviation sector
Box 2b: What are aviation hubs and how do they work?
In a hub-and-spoke model, airlines and alliances focus their route networks
on one or more key airports which maximise connecting opportunities for
passengers. For example, an airline that operates direct services between
three pairs of airports (A-D, B-E, and C-F) could instead route its flights via a
hub (H) as shown below.
This creates more route options, with passengers travelling from any airport in
the network now able to access five different destinations (six, including the
hub itself). Furthermore, the additional passengers transiting through the hub
make it more viable for the airline to add new routes at that airport or increase
frequencies on existing routes, bringing further connectivity benefits. On the
other hand, such a model may incentivise airlines to replace some thinner
direct routes with routes that involve a transfer, which is less convenient from
the perspective of those passengers who travel on this particular route.
A
C
B
F
D
E
A
C
B
F
D
E
H a
a
b
c
1 a 2
b 1 b 2
c 1 c 2
Not all airports are equally suited to hosting an aviation hub. Typically an airline or
alliance will want to concentrate its flights into ‘waves’ of arrivals and departures,
with a short interval to transfer arriving passengers and luggage onto connecting
flights. To facilitate this, the airport must have sufficient runway, apron, and
terminal capacity to enable this type of scheduling, and its infrastructure must be
designed to enable efficient transfer of passengers and luggage. The minimum
connecting time is a measure of the shortest possible time to transfer between
flights at a given airport, but what matters more to airlines is the average
connecting time, a measure of the typical time taken to transfer.

32
Box 2b: Continued
time MCT
MCT = Minimum connecting time
departures
arrivals
a1
a2
b1
b2
c1
c2
Aviation hubs are the product of network airlines (or alliances) and airports
working together to maximise connecting opportunities. It has historically
been difficult for an airport to act as a hub without an airline that wants to use
it as one (although some airports such as London Gatwick and Milan
Malpensa have schemes in place to assist ‘self-connecting’ passengers).
Conversely, an airline cannot operate an effective hub without an airport that
is equipped for appropriate scheduling and efficient transfers.
2.20 Aviation hubs first emerged in North America after the liberalisation of the US
aviation sector, for example the development of the Delta Airlines hub at Hartsfield-
Jackson Atlanta, and the American Airlines hub at Dallas-Fort Worth. Later the
model spread to Europe, through the development of the oneworld hubs at London
Heathrow and Madrid Barajas, the SkyTeam hubs at Paris Charles-de Gaulle and
Amsterdam Schiphol, and the Star Alliance hub at Frankfurt. Star Alliance also
operates secondary hubs in Munich and Düsseldorf.
2.21 The European hubs serve distinct but overlapping markets, with their specialisation
reflecting geography, trade links, language, culture, and colonial history. For
instance, London has particularly good connections to North America, while Madrid
is more focused on Latin America and southern Europe. Similarly, Paris tends to
serve francophone destinations, while Amsterdam operates more flights to northern
Europe.
33
Chapter 2 The global aviation sector
2.22 Over the past decade, new hubs in the Middle East and Asia have emerged, driven
by rapidly increasing numbers of passengers from south east Asia. Of particular
importance to international transfer passengers is the Emirates hub at Dubai
International. Atatürk International is among the fastest-growing major international
airports in the world. Turkey has also set out plans to build a new airport in Istanbul,
at a cost of more than $5 billion. Beijing Capital International is now the second
busiest airport in the world by passenger traffic and could become increasingly
important as a hub in the future.
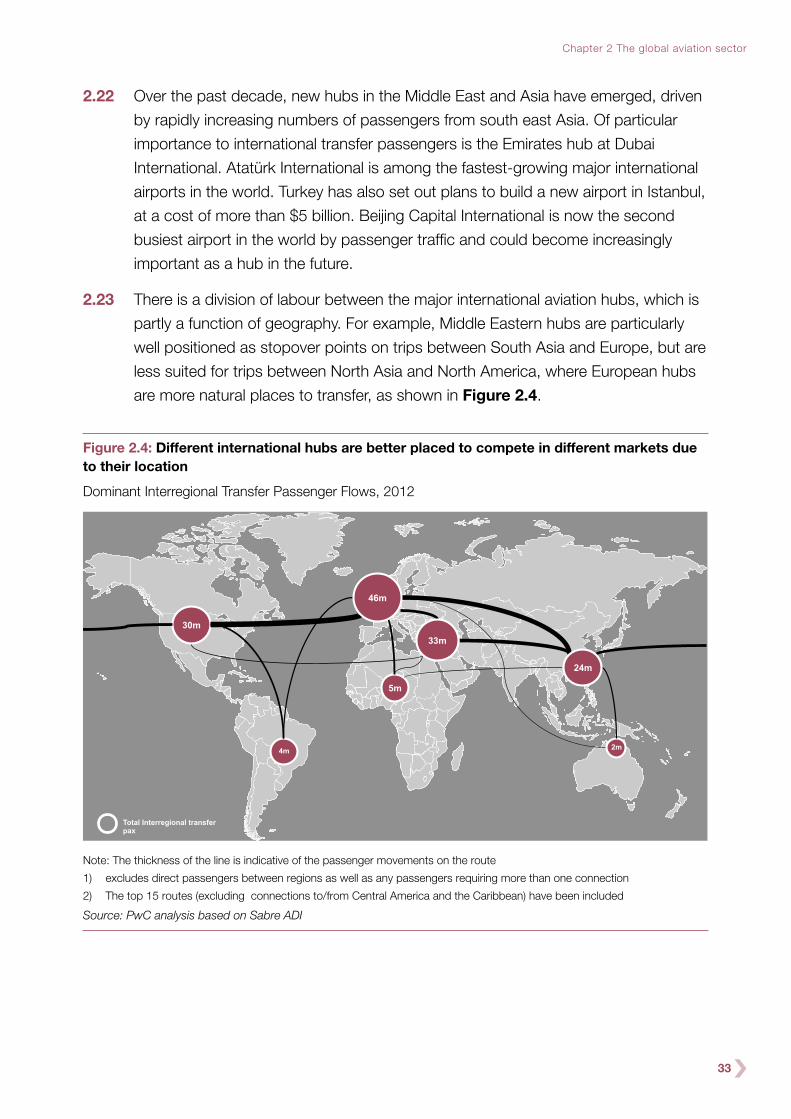
2.23 There is a division of labour between the major international aviation hubs, which is
partly a function of geography. For example, Middle Eastern hubs are particularly
well positioned as stopover points on trips between South Asia and Europe, but are
less suited for trips between North Asia and North America, where European hubs
are more natural places to transfer, as shown in Figure 2.4.
Figure 2.4: Different international hubs are better placed to compete in different markets due to their location
Dominant Interregional Transfer Passenger Flows, 2012
5m
2m 4m
30m
Total Interregional transfer pax
46m
24m
33m
Note: The thickness of the line is indicative of the passenger movements on the route
1) excludes direct passengers between regions as well as any passengers requiring more than one connection
2) The top 15 routes (excluding connections to/from Central America and the Caribbean) have been included
Source: PwC analysis based on Sabre ADI

34
2.24 Geography is not the only factor that determines the location of international
aviation hubs. The availability of suitable airport infrastructure, the nature of
economic, fiscal and regulatory regimes in different countries, and historic, cultural
and trading links all play a part.
2.25 Where a country or city is successful in developing one of its airports into a major
hub, this can bring significant benefits. Hubs provide local people and businesses
with a greater range of direct connections, to further-removed destinations, and at
higher frequencies, than would generally be possible with local origin and
destination demand alone. This not only benefits those using the hub by reducing
the time (and potentially cost) involved in travelling by air, but the greater
connectivity associated with hubs can also have wider benefits for local economies,
for example by attracting investment to the area and creating jobs.
2.26 Hubs are particularly important for countries or cities that lack large origin and
destination (OD) markets. Dubai, for example, with a population of just over
2 million, would find it much more difficult to support a comprehensive route
network than London on the basis of OD demand alone.
2.27 Hubs also come with some potential downsides, given the scale of the airport
infrastructure necessary to support them. Routing traffic through a single airport
location concentrates environmental and other negative impacts in one place.
These impacts include aircraft noise, air pollution, landscape alterations, and
surface transport congestion.
2.28 The number of people affected can be reduced by locating the airport further away
from major population centres, though this tends to make it more time-consuming
and costly to access, eroding some of the benefits that the hub would bring and
reducing its attractiveness for local origin and destination passengers. These are
inescapable trade-offs for any airport development, but particularly pronounced in
the case of a big hub with large volumes of traffic.
2.29 These trade-offs, combined with the recent economic downturn, have acted as a
check on capacity expansion at major airports in Europe. The fourth runway at
Frankfurt, finally completed in 2011, proved particularly contentious, and expansion
at Amsterdam Schiphol has required a lengthy mediation process and the
imposition of stringent caps on ATMs.

35
Chapter 2 The global aviation sector
A diversifying low-cost sector
2.30 The development of very large carriers and alliances, and the global hub-and-spoke
networks that they operate, has not arrested the growth of airlines that focus
primarily on point-to-point connections. Over the past twenty years the rise of the
low-cost airline model has been dramatic.
2.31 In 2012, Ryanair was the biggest airline in the world in terms of international
passengers carried, whilst easyJet was ranked third, after Lufthansa. Even on the
basis of total passengers carried, both domestic and international, Ryanair is still
the sixth biggest airline in the world and the biggest European airline.12
2.32 Low-cost airlines are built around reducing operating costs in order to offer relatively
cheaper fares. This approach has been most successful in highly liberalised aviation
markets, in which there are fewer bilateral or regulatory constraints and it is
comparatively easy to begin operating at a new airport and to open new routes
and services.
2.33 While the cost-cutting approach is at the centre of all low-cost airline business
models, different airlines have pursued slightly different strategies as described in
Box 2d. These strategies may have implications for the type of airport capacity
needed in the future.
12 IATA

36
Box 2c: Low-cost airline business models
Low-cost airline models were pioneered by carriers such as Southwest
Airlines in the US (1980s) and Ryanair in Europe (early 1990s). Low-cost
airlines offer mostly direct connections to short-haul destinations. They have
opened up routes previously considered commercially unviable, and attracted
price-sensitive (often leisure) passengers away from full-service airlines.
Their business model typically includes:
●● high aircraft utilisation with rapid aircraft turnaround;
●● a small number of efficient aircraft models (often Boeing 737 or Airbus
A320);
●● a high proportion of online ticket sales and check-in to reduce
administration; and,
●● a single, standardised service, with supplementary charges for additional
services, like seat reservations or priority boarding.
Beyond these common elements, there are some important differences in
low-cost models, for example:
●● Ryanair has generally marketed itself as ‘ultra low-cost’. The airline tends
to operate from smaller, less congested airports for cost and scheduling
reasons, and has not sought to compete directly with legacy carriers on
the majority of its routes.
●● easyJet also has a strong focus on providing low-cost, efficient services,
but flies more frequently to primary airports, competing directly with legacy
carriers. It also has a stronger focus on attracting business travellers,
providing more flexibility in terms of ticket sales and priority boarding.
●● Norwegian Air Shuttle established a base at Gatwick Airport in spring
2013, offering services to a wide range of European airports. It has recently
signalled its intention to move into the long-haul market, purchasing several
Boeing 787s to operate on services to destinations including Bangkok,
New York, Fort Lauderdale and Los Angeles.
2.34 The growth of the low-cost sector has had profound effects. Many previously
underused airports have seen significant growth in passenger numbers, and routes
previously unserved by aviation have been opened up and operated profitably.

37
Chapter 2 The global aviation sector
Traditional network airlines have been forced to reduce fares significantly on many
short-haul routes to compete effectively for traffic, and in some cases have set up
low-cost subsidiaries of their own. In the case of Lufthansa, for example, all
short-haul routes other than those operated out of Frankfurt and Munich will
shortly be transferred to its low-cost subsidiary, Germanwings.
2.35 In the process, the divide between ‘low-cost’ and ‘full-service’ carriers is being
eroded. In 2012, around one fifth of passengers flying low-cost from big UK airports
like Gatwick, Manchester and Birmingham were business travellers.13 Low-cost
carriers also no longer operate only to secondary airports; they account for a
substantial proportion of traffic at both Schiphol and Charles de Gaulle, and even
at Heathrow and Frankfurt some low-cost services operate.
2.36 There is also increasing evidence of collaboration between low-cost and full-service
carriers. Middle Eastern carriers such as Etihad and Emirates have taken significant
stakes in European low-cost carriers, and the Spanish low-cost carrier, Vueling, is
owned by International Aviation Group, which also owns British Airways and Iberia.
Air Berlin has now joined the oneworld alliance, and it is possible that the transfer of
many Lufthansa services to Germanwings may see the low-cost carrier working
increasingly closely with Star Alliance, although it is not currently a member.
2.37 These trends towards increasing collaboration could result in low-cost carriers
supporting the hub-and-spoke networks through providing a short-haul feed into
long distance services. Some already claim there is a high level of ‘self-connecting’
amongst their passengers, even if they do not directly support such connections.
This type of travel may grow in the future.
2.38 The low-cost airline model has been most successful on short-haul routes, with
flights up to four or five hours using narrow-bodied jets. It has not yet proved
effective on longer flights, where fuel accounts for a greater proportion of flight
costs, rapid aircraft turnaround is more difficult, and passengers expect more
legroom and comfort, which are harder to provide at low-cost. In addition, because
low-cost airlines tend to offer a single, standardised service, they cannot increase
prices for business and first-class passengers in order to keep economy-class
prices low, which is the model typically used by network carriers to support the
viability of their long-haul routes.
2.39 However, as new, fuel-efficient, long-haul aircraft are developed, this may provide new
opportunities for low-cost carriers to enter these markets, particularly if they can be
13 DfT analysis of 2012 CAA survey data at Gatwick, Stansted, Luton, Manchester, Birmingham, Bristol, Cardiff, East Midlands, and Exeter, based on respondents travelling on ELFAA member airlines at selected airports

38
combined with other efficiencies. Norwegian’s entry into the long-haul market, for
example, has been enabled through the purchase of several Boeing 787 jets.
2.40 The way in which the low-cost sector develops, and the consequent implications
for other carriers, could have profound effects on the future shape of the overall
aviation industry, as well as affecting the nature and scale of any additional capacity
required in the UK.
Technological change
2.41 The evolution of new airline business models and global route networks has been
facilitated not just by liberalisation of the sector, but also by new technologies. The
first few decades of the air transport industry were characterised by very rapid
technological progress, primarily reflected in faster aircraft cruising speeds. Since
the 1960s, however, passenger capacity and aircraft range have increased most
significantly, although fuel efficiency and noise performance have also continued to
improve.
2.42 Over the past fifty years, mostly due to the developments of engine and aircraft
technology, the trend towards more fuel-efficient and quieter aircraft has continued,
as shown in Figures 2.5 and 2.6.
Figure 2.5: Aircraft fuel efficiency has been steadily improving
Historical and forecast improvements in aircraft fuel efficiency, 1955-201514
Ene
rgy
inte
nsity
(MJ/
pkm
)
Long range Short range
6.0
5.5
5.0
4.5
4.0
3.5
3.0
2.5
2.0
1.5
1.01955 1965 1975 1985 1995 2005 2015
B720-000
B720-000B
B707-300
DC9-10
B707-100B
B707-300B
B737-100/200
A300-600/R/CF/RCFB767-200/200ER
L1011-500TristarA310-300
B737-400B737-500/600MD11
B737-300
B757-200A320-100/200
B767-300/300ER
B777
B747-400
A380
A350
B787-3
B787-8
MD80/DC9-80
B747-100
DC9-30
DC9-40
DC10-30
DC10-10
DC10-40
B727-200/231A
B747-200/300
Source: International Energy Agency (2009), ‘Transport, Energy and CO2’
14 http://www.iea.org/publications/freepublications/publication/name,3838,en.html. Note: The range of points for each aircraft reflects varying configurations, connected dots show estimated trends for short and long-range aircraft

39
Chapter 2 The global aviation sector
2.43 The improvements in noise performance have been accompanied by increases in
flight numbers at many airports and therefore the overall effect for those living near
airports may not be as significant as implied in Figure 2.6. Nevertheless, as shown
in Chapter 3, an overall trend of reducing impacts can be discerned.
2.44 Passenger capacity and aircraft range have been increasing over time in each
aircraft category – small, medium and large. In the short-haul market for small
aircraft, the A320ceo and Boeing 737 families will gradually be replaced with a new
generation of aircraft – A320neo and Boeing 737 MAX – that are quieter, more fuel
efficient and will be able to fly greater distances. For example, the A320neo is about
15% more fuel efficient and has a range approximately 10% greater than its
predecessor, the A320. The Boeing 737 MAX 8 that will replace the currently
operated 737-800 is expected to deliver similar fuel-efficiency savings in relation to
its predecessor as does the A320neo; its range is expected to be almost 1,000km
greater than that of the 737-800.
Figure 2.6: The introduction of new aircraft is reducing aviation noise footprints
Reduction in aircraft noise over time15
B707Circa 196054.5 square miles
B727 with hush kitOriginal aircraft circa 1970 with hush kit fitted in the 1980s
DC-10Circa 1970
A300Circa 1975
B777Circa 1995
B787NOISE FOOTPRINTShape and relative size of theground area affected byaircraft noise to a level 90db
Source: Australian Government (December 2008)
15 Geoffrey Thomas, Christine Forbes Smith, Guy Norris, Steve Creedy and Rachel Pepper, ‘Plane Simple Truth’, quoted by the Australian Government (Dec 2008), ‘National Aviation Green Paper – Flight Path to the Future’, http://www.infrastructure.gov.au/aviation/publications/pdf/Aviation_Green_Paper_final.pdf
40
2.45 The same trend can be observed in the market for medium- and long-haul aircraft.
For example, the A350-800 is expected to take approximately 20 more passengers
onboard which will be a significant capacity improvement in comparison to the
A330-200 (A330-200 can take up to 253 passengers in a 3-class seating
arrangement). It can also fly 2,000km further than its predecessor, a distance that is
roughly equivalent to a flight between London and St Petersburg. The Boeing 787-8
Dreamliner is expected to fly between 3,000 and 4,000km further and take about
20 to 40 passengers more onboard than the 767-200ER and 767-300ER
respectively. It is also expected to be about 20% more efficient than its
predecessors.
2.46 But the global fleet of the future will on average be served with smaller planes.
As Airbus’ and Boeing’s current order books show, the smaller, more fuel-efficient
models are proving more popular with airlines than ‘superjumbos’, very large
wide-bodied planes such as the Boeing 747-8I and the Airbus A380 that mostly
serve the thickest routes, often from major hubs. Whereas there are only 143
current orders for A380s, 72 of which have been placed by the Middle Eastern
carriers that specialise in intercontinental hubbing, there are 789 orders for A350s
and 754 orders for Boeing 787s.
2.47 During the 2000s, Boeing prioritised the development of the 787, a mid-size, fuel-
efficient aircraft. Airbus subsequently followed suit with the A350. Both carriers also
invested in the development of the new generation of more fuel-efficient, short- and
medium-haul aircraft with greater ranges – the A320neo and the Boeing 737 MAX.
The 787 and A350 are more flexible than ‘superjumbos’, and are suitable for
operation on spokes within hub-and-spoke networks, or on point-to-point routes.
The increased range and greater efficiency of these aircraft are acting to reduce the
scale of passenger demand needed to make long-haul routes commercially viable.
2.48 This may make it possible for some low-cost airlines to successfully enter the
long-haul market. Although currently only 84 medium- and long-haul aircraft are on
order by low-cost airlines, this is still a significant increase compared to the current
fleet of around 60 medium- and large-sized aircraft operated by these airlines, and
a clear sign that some low-cost carriers now consider it possible to succeed in
this market.
2.49 The popularity of the A350 and Boeing 787 could therefore signal a decline in the
importance of the hub-and-spoke model, as airlines become able to bypass hubs
and operate more long-haul point-to-point services. Alternatively, aircraft like the
B787 and A350 could ultimately reinforce the hub-and-spoke model, as their
greater range brings more potential spokes within the reach of each hub.
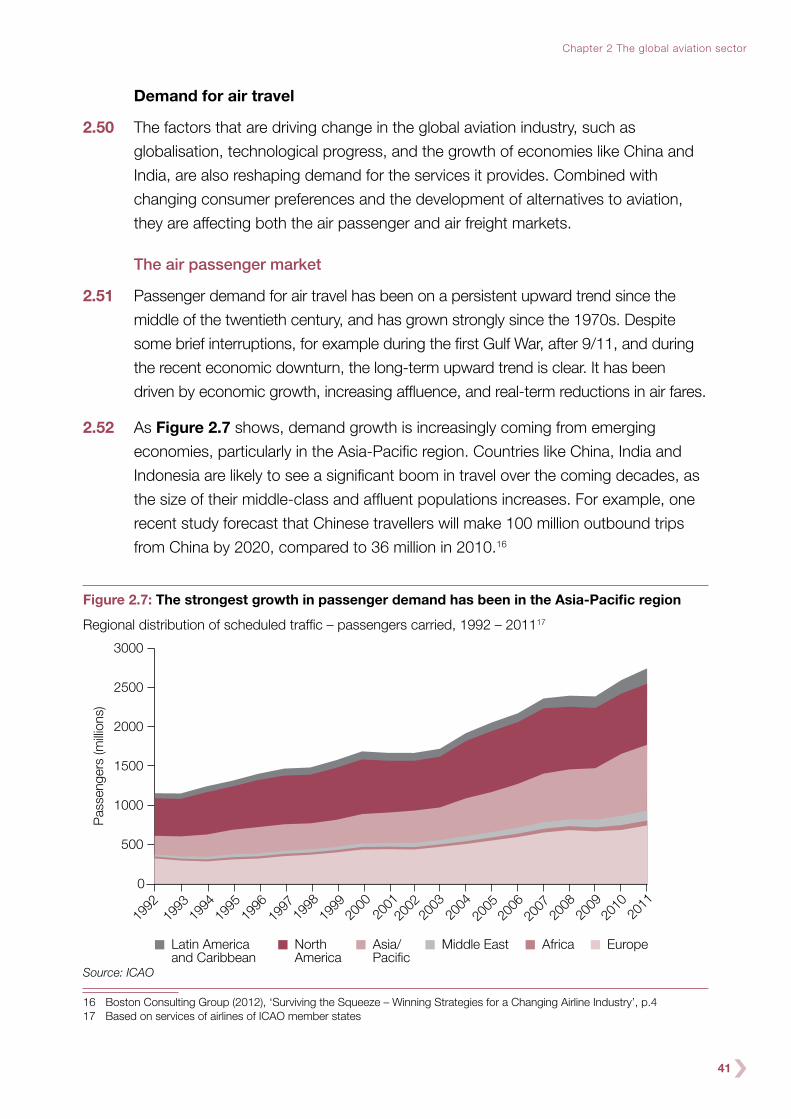
41
Chapter 2 The global aviation sector
Demand for air travel
2.50 The factors that are driving change in the global aviation industry, such as
globalisation, technological progress, and the growth of economies like China and
India, are also reshaping demand for the services it provides. Combined with
changing consumer preferences and the development of alternatives to aviation,
they are affecting both the air passenger and air freight markets.
The air passenger market
2.51 Passenger demand for air travel has been on a persistent upward trend since the
middle of the twentieth century, and has grown strongly since the 1970s. Despite
some brief interruptions, for example during the first Gulf War, after 9/11, and during
the recent economic downturn, the long-term upward trend is clear. It has been
driven by economic growth, increasing affluence, and real-term reductions in air fares.
2.52 As Figure 2.7 shows, demand growth is increasingly coming from emerging
economies, particularly in the Asia-Pacific region. Countries like China, India and
Indonesia are likely to see a significant boom in travel over the coming decades, as
the size of their middle-class and affluent populations increases. For example, one
recent study forecast that Chinese travellers will make 100 million outbound trips
from China by 2020, compared to 36 million in 2010.16
Figure 2.7: The strongest growth in passenger demand has been in the Asia-Pacific region
Regional distribution of scheduled traffic – passengers carried, 1992 – 201117
0
500
1000
1500
2000
2500
3000
2011
2010
2009
2008
2007
2006
200520
0420
0320
022001
2000
1999
1998
1997
1996
1995
1994
1993
1992
Middle EastNorth America
Asia/Pacific
Pass
enge
rs (m
illion
s)
Latin Americaand Caribbean
EuropeAfrica
Source: ICAO
16 Boston Consulting Group (2012), ‘Surviving the Squeeze – Winning Strategies for a Changing Airline Industry’, p.417 Based on services of airlines of ICAO member states

42
2.53 The composition of passenger demand is also being affected by changes in the
ways people live and work. Over the past decade, the EU aviation market has
experienced a surge in demand for air travel to visit friends and relatives (VFR) as
more people take advantage of increasing European integration to live, study and
work outside of their country of origin. VFR travel could become an increasingly
important market.
2.54 The low-cost airlines have been adept at exploiting these developments. The
estimated seats available on direct flights between the UK and Poland have
increased by around 4.8 million since 2002.18 In 2012 91% of these seats were
available from airlines that are part of the European Low Fares Airline Association
(ELFAA).
The air freight market
2.55 Historically the air freight market has grown at a similar rate to the passenger
market. Around $6.4 trillion of goods now travel by air each year, equating to
around 35% of all world trade by value,19 though the past few years have been
more difficult for the industry, as growth in international trade has slowed following
the financial crisis.
2.56 As Figure 2.8 shows, international air freight and air passenger flows are correlated,
particularly on intercontinental routes. Where alternative modes of transport are
available, the link is weaker. For example, the level of air freight between EU
countries is lower relative to the number of passengers on these routes, given the
availability of road transport.
18 Department for Transport analysis of CAA airport statistics19 IATA (December 2013)

43
Chapter 2 The global aviation sector
Figure 2.8: International air freight and passenger flows are correlated
Country by country passengers vs. freight volumes in 2012
900
800
700
600
500
400
300
200
100
0
Frei
ght T
onne
s (T
hous
ands
)
OtherIntercontinental
Europe–Asia
North America–Asia
North America–Europe
Intra-Continental(excluding Europe)
Intra Europe
0 5 10 15 20 25 30Passengers (Millions)
UK–Spain
US–Canada
Germany–Spain
US–Mexico
UK-US
Germany–US
India–UAE
China–Hong Kong
Germany–UK
Germany–Italy
Italy–Spain
Japan–Korea
China–Korea
US-Japan
US–Korea
US–China US–Hong Kong
US–Taipei
Italy–UK France–UK
Intra continental Inter continental
Source: PwC analysis based on IATA Airline Industry Forecast 2013-17
2.57 Two distinct business models now operate within the freight sector. ‘Freight
forwarders’ provide a link between freight customers and those with air freight
capacity, typically full-service airlines which provide cargo capacity on long-haul
passenger services, known as ‘belly hold’ freight. Some low-cost carriers, such as
Air Asia, Norwegian Air Shuttle, and Southwest Airlines, run limited freight
operations, but others such as easyJet and Ryanair prefer to avoid the additional
complexity this would bring to their flight operations.
2.58 ‘Integrated air freight’ companies are dedicated logistics companies, such as
FedEx, DHL, and UPS, that offer a complete end-to-end express delivery service.20
In contrast to the forwarding model, integrated freighters typically control the entire
logistics chain from collection to delivery. They tend to have an extensive surface
transport network as well as an in-house fleet of dedicated freighter aircraft. They
normally operate from dedicated freight hubs with more relaxed night flight regimes,
such as Memphis and Louisville in the US and Brussels and Leipzig in Europe.
Alternatives to aviation
2.59 In the passenger market, there is potential for high-speed rail to be an attractive
alternative to flying for many short-haul point-to-point routes, and it typically
20 Flightglobal (October 2013), ‘Airline Business Special Report, Cargo 2013’
44
captures a majority of the market on routes where the total rail journey time is no
more than 3-4 hours. For example, on the London-Paris and London-Brussels
routes, the Eurostar rail service has captured around 80% of the total rail/air market.
Chapter 4 discusses the impact of high-speed rail on forecast demand for aviation
in the UK.
2.60 New communications technologies, such as videoconferencing, also offer
alternatives to flying in the business sector. WWF-UK has carried out research and
advised businesses on this issue.21 Their evidence suggests that some businesses
are keen to cut back on flights and to use videoconferencing instead, as a cost-
saving measure. This seems to have been catalysed by the recession, but in some
cases there is evidence that the change in company behaviour may be permanent.
2.61 However, as the Committee on Climate Change and others have argued, the scope
for videoconferencing to replace air travel should not be overstated.22 Face-to-face
contact is likely to remain important in many business contexts, and the scope for
videoconferencing to replace flights for leisure or for visiting friends and relatives is
much more limited.
2.62 As 3D printing becomes more widely used, it could enable more localised
production of some consumer goods, with potentially significant impacts on global
supply chains. However, the nature of the products that are most reliant on air
freight, such as machinery, pharmaceuticals and perishables, is such that 3D
printing is unlikely to have a significant impact in the near future.
Aviation and the global climate
2.63 Aviation has a significant impact on the Earth’s climate, through emissions of
carbon dioxide (CO2), nitrogen oxides (NOx), water vapour, sulphates and soot,
and through the formation of contrails and aircraft induced cirrus cloud. Globally,
aviation accounts for around 1–2% of greenhouse gas (GHG) emissions, but is
expected to make up a growing proportion of the total as other sectors
decarbonise.
2.64 Aviation is harder to decarbonise than other sectors because of the lack of an
obvious low-carbon alternative to aviation fuel (kerosene). In addition, the long
service life of aircraft compared to most other vehicles means that it takes longer
21 WWF, ‘One in Five Challenge’, http://www.wwf.org.uk/how_you_can_help/get_your_business_involved/one_in_five_challenge/. For a similarly optimistic view of the potential for teleconferencing to reduce business travel, see Cairns (2010), ‘Can teleconferencing reduce business travel’
22 CCC (2009), ‘Meeting the UK aviation target’, pp. 78-81. See also Mokhtarian (2009), ‘If telecommunication is such a good substitute for travel, why does congestion continue to get worse?’

45
Chapter 2 The global aviation sector
for new technologies to penetrate the aircraft fleet than, for example, surface
vehicle fleets.
2.65 The Intergovernmental Panel on Climate Change’s (IPCC) Fifth Assessment Report
argues that total CO2 from all anthropogenic sources would need to be limited to
a cumulative budget of 1 trillion tonnes if the world is to have a ‘likely’ chance of
limiting temperature rise to 2°C.23 This is very unlikely to be achieved if aviation
emissions are not controlled, so aviation is a crucial part of overall climate change
policy.
2.66 The aviation industry itself recognises this. The International Air Transport
Association (IATA), the trade association for the world’s airlines, has adopted a
set of targets to mitigate the climate impacts of aviation.24 These include:
●● an average improvement in fuel efficiency of 1.5% per year from 2009 to 2020;
●● a cap on net aviation CO2 emissions from 2020 (carbon-neutral growth); and,
●● a reduction in net aviation CO2 emissions of 50% by 2050, relative to 2005 levels.
2.67 Currently expected technological and operational improvements will help mitigate
the climate impacts of aviation. Aircraft have become steadily more fuel-efficient
over the past fifty years, but the historical rate of improvement in fuel efficiency has
not been sufficient to offset the rate of growth in air travel, meaning that aviation
emissions have been on a steady upward trajectory.
2.68 The industry has also been trialling alternative fuel sources. Biofuels are now
officially certified for use up to 50% blend with conventional jet fuel. However, there
are important sustainability concerns around large-scale biofuel use. The
Committee on Climate Change (CCC) and others have highlighted that:
●● lifecycle emissions savings from biofuels vary significantly depending on the
production route, and can be reduced significantly where growth of biofuel
feedstock results, directly or indirectly, in land-use change;
●● aviation will have to compete for scarce biofuels with other sectors such as road
transport, shipping, household cooking and heating, and energy generation; and,
●● it is unclear whether sufficient land and water will be available for growing biofuel
feedstock on a large scale, given projected population growth and rising living
standards in developing countries.25
23 IPCC, ‘Fifth Assessment Report’, http://www.ipcc.ch/report/ar5/wg1/24 http://www.iata.org/policy/environment/Pages/climate-change.aspx25 Committee on Climate Change (2009), ‘Meeting the UK Aviation Target – options for reducing emissions to 2050’, pp. 96-119
46
2.69 Because fuel-efficiency improvements and biofuels use will not be sufficient to
tackle the climate effects of aviation, further measures will be necessary to address
the remaining emissions gap, ideally through a global framework to control aviation
emissions. Establishing such a framework has, however, proved challenging.
For example, it is hard to strike an equitable balance between developed countries
(which are responsible for the majority of aviation emissions to date) and developing
countries (which will be responsible for an increasing share of future emissions).
2.70 In the past few years there have been some important steps towards a global
agreement on aviation emissions through the European Union and at the
International Civil Aviation Organisation (ICAO), although significant challenges
remain as set out in Box 2e.
Box 2d: Towards an international framework to tackle aviation emissions
The International Civil Aviation Organization (ICAO), the United Nations agency
responsible for aviation, has been debating options for a global market-based
measure to tackle aviation emissions. Market-based measures could include
emissions trading schemes or emissions offsetting. ICAO believes that such a
measure would ensure that emissions reductions are delivered in the most
cost-effective and flexible manner.
But progress towards a global market-based measure has been relatively
slow. At its most recent summit in Montreal in September 2013, ICAO agreed
to develop a global market-based measure, and member nations will report
back in 2016 with proposals for a scheme that could be implemented by
2020. There are many obstacles still to overcome in these negotiations and
success is not guaranteed.
In lieu of a global deal, the EU has included aviation emissions in its Emissions
Trading System (EU ETS) since January 2012. The EU ETS is a cap-and-trade
system, covering flights arriving at or departing from airports in the European
Economic Area (EEA), irrespective of the nationality of the carrier. Tradable
emissions allowances are issued up to the level of the cap, and allocated to
market participants through a mixture of free allocations and auctions.
The initial annual cap for aviation emissions has been set at 97% of average
emissions between 2004 and 2006. From 2013 to 2020, it will be reduced
to 95% of 2004–2006 emissions.

47
Chapter 2 The global aviation sector
Box 2d: Continued
The ETS has provoked significant opposition from third-party states,
including the United States, Russia, China and India. These countries argue
that the ETS infringes their sovereignty (by covering non-EU airlines) and is
extra-territorial (by including emissions outside EU airspace). Twenty-six
nations have signed a declaration formally opposing the inclusion of aviation in
the ETS, and several have directed their airlines not to comply with the ETS,
or are contemplating doing so. As a result the ETS is currently in partial
abeyance. The European Commission (EC) announced in November 2012
that it would ‘stop the clock’ on the enforcement of ETS obligations on flights
between European airports26 and the rest of the world, pending the outcome
of negotiations at ICAO. Following the ICAO summit in September 2013, the
EC has stated that it is assessing the ICAO decision in more detail before
deciding on its next steps.
The future of the global aviation sector
2.71 The future development of the global aviation sector remains difficult to predict.
Market liberalisation and technological change have fundamentally changed the
structure of the industry. It is unclear whether the full impact of these changes has
yet been felt. It is also uncertain whether the future will see these trends persist,
stop, or perhaps even reverse.
2.72 There are a number of unanswered questions:
●● will airline alliances, and the hub-and-spoke networks that they operate, remain
central to the way the industry works? If so, how will they develop?
●● if the hub-and-spoke model does remain central, will the Gulf carriers and Middle
Eastern airports continue to grow and capture increasing market share?
●● might a wider range of airports start to operate some form of hub, even where
they lack a major hub carrier, for example through enabling passengers to
‘self-connect’ more easily?
●● alternatively, will new aircraft such as the Boeing 787 and A350, with their greater
ranges, make more long-haul destinations viable as point-to-point routes,
resulting in a relative decline in the importance of hubs?
26 Classified as the airports located in the European Economic Area (EEA), including for this purpose Croatia, Switzerland and the dependent territories of EEA States

48
●● if long-haul point-to-point becomes more viable, could low-cost carriers start to
move into this market, using the reduced fuel costs made possible by aircraft like
the Boeing 787 and A350 to undercut the network carriers?
●● will a global climate change scheme be agreed, and if so, what will be its impact
on patterns of aviation demand?
2.73 These uncertainties could have major implications for the nature and scale of airport
capacity needed in the UK. To ensure that its analysis can take account of these
uncertainties, the Commission has developed four scenarios for the future of the
aviation sector. Each scenario has different implications for the respective market
shares of hub-and-spoke and point-to-point networks, and for the participation of
UK airports in global route networks.
2.74 The four scenarios have been developed by combining different assumptions in five
key areas discussed in this Chapter:
●● Globalisation: Will the liberalisation of the global economy, including the aviation
sector, continue?
●● Rise of Asia: How far will the world economy’s centre of gravity shift from west
to east?
●● Alliances and partnerships: Will existing carriers and new market entrants
cooperate, through alliances or partnerships, or will they compete with one
another?
●● Technology: Will the trend towards longer range, more fuel-efficient aircraft like
the A350 and B787 continue?
●● Climate change agreement: Will governments sign a global climate change
agreement that levels the playing field between airlines?

49
Chapter 2 The global aviation sector
Scenario A: Global growth
Hub-and-spoke dominates the aviation market; Europe within major global traffic flows
high
none
Level ofrealisation
Alliances andpartnerships
Technologicalchange
Globalclimate-changeagreement
Globalisation
Rise of Asia
2.75 This scenario is characterised by strong economic growth in an increasingly global
economy, with technology used successfully to mitigate climate change and other
sustainability challenges. This results in continued rapid growth in aviation demand,
with the role of major aviation hubs and airline alliances strengthened around the
world.
2.76 For this scenario to materialise, the following need to happen:
●● Globalisation: Continued liberalisation of the global economy, including in the
aviation sector where countries sign a global Open skies agreement.
●● Rise of Asia: Continued growth of middle-class and affluent populations in Asia,
leading to strong demand growth, and strengthening the position of Far East
aviation hubs and carriers.
●● Alliances and partnerships: Alliances and partnerships between US, European
and Asian carriers enhance the global hub network.
●● Technology: Rapid growth in the new generation of fuel-efficient wide-bodied
aircraft, A350s and Boeing 787 Dreamliners supports hub-and-spoke networks
by providing more feeder routes into hubs.
●● Climate change agreement: A global deal is signed that ensures a level playing
field between airlines.

50
Scenario B: Relative decline of Europe
Hub-and-spoke dominates the aviation market; Europe outside major global traffic flows
2.77 Scenario B also sees strong economic growth and increasing globalisation.
However, this scenario is characterised by more aggressive airline competition,
especially between legacy carriers and new market entrants from emerging
economies. This results in a decline in the importance of European aviation hubs,
as European airlines are frequently out-competed by Middle Eastern and Asian
carriers.
2.78 For this scenario to materialise, the following need to happen:
●● Globalisation: Continued liberalisation of the global economy, including in the
aviation sector.
●● Rise of Asia: Growth of middle class and affluent populations in Asia, leading to
strong demand growth, and strengthening the position of Far East aviation hubs
and carriers.
●● Alliances and partnerships: Middle and Far Eastern carriers and airports
develop a dominant role through aggressive competition and selective bilateral
partnerships as the role of global alliances declines.
●● Technology: New longer range aircraft like A350s and Boeing 787 Dreamliners
enable Middle and Far Eastern carriers to bypass European hubs and fly directly
to second-tier European airports.
●● Climate-change agreement: Partial climate-change agreement that creates
inequality between airlines in the developing and developed worlds.
high
none
Level ofrealisationAlliances and
partnershipsTechnologicalchange
Globalclimate-changeagreement
Globalisation
Rise of Asia

51
Chapter 2 The global aviation sector
Scenario C: Low-cost is king
Point-to-point dominates the aviation market; Europe within major global traffic flows
high
none
Level ofrealisation
Alliances andpartnerships
Technologicalchange
Globalclimate-changeagreement
Globalisation
Rise of Asia
2.79 Scenario C sees a decline in the importance of hubs throughout the world as
low-cost carriers move into the long-haul market and self-connecting becomes
more common. By 2040, low-cost and charter airlines capture over 50% of the
market, transforming the shape of the aviation sector.
2.80 For this scenario to materialise, the following need to happen:
●● Globalisation: Continued liberalisation of the global economy, including in the
aviation sector.
●● Rise of Asia: Growth of Asian middle classes results in increase in price-
sensitive leisure traffic, which increases the market-share of low-cost carriers at
the expense of network airlines.
●● Alliances and partnerships: Low-cost Asian carriers become key players in
the global aviation sector, and they have few incentives to enter formal alliances.
●● Technology: New longer range aircraft like A350s and Boeing 787 ‘Dreamliners’
enable more people to fly point-to-point.
●● Climate change agreement: Global climate-change agreement that levels the
playing field between airlines.

52
Scenario D: Global fragmentation
Point-to-point dominates the aviation market; overall relative decline in global traffic flows
high
none
Level ofrealisation
Alliances andpartnerships
Technologicalchange
Globalclimate-changeagreement
Globalisation
Rise of Asia
2.81 Scenario D involves a combination of pessimistic assumptions. The world faces
a decline in global growth prospects and the fragmentation of the world economy,
as the strong growth and liberalisation of the late 20th century increasingly looks
like a one-off ‘blip’. Countries turn inwards, adopting more interventionist and
protectionist policies. While technological developments keep on changing the
airline industry, there is no political appetite for a global ‘Open Skies’ agreement
or a global climate-change deal. This pessimistic scenario of stalled growth
and hindered global governance results in a more negative outlook for the
aviation market.
2.82 For this scenario to materialise, the following need to happen:
●● Globalisation: Countries try to insulate themselves from the perceived
‘downsides’ of globalisation, such as volatile capital flows and mass migrations,
by creating explicit or implicit barriers.
●● Rise of Asia: Slowdown in growth prospects in Asia, as global markets suffer
from a rise in protectionism.
●● Alliances and partnerships: Airlines compete aggressively for a relatively
smaller pool of passengers, resulting in the partial break-up of global alliances.
●● Technology: New longer range aircraft like A350s and Boeing 787 Dreamliners
enable more people to fly point-to-point.
●● Climate change agreement: No global climate change agreement.

53
Chapter 2 The global aviation sector
2.83 These scenarios are not comprehensive, but they do capture a number of the key
uncertainties around the future of the aviation sector. Their implications for UK
airports are discussed in Chapter 4, where the scenarios are used to test the
Commission’s conclusions on the UK’s future airport capacity requirements.
2.84 The next Chapter discusses how UK airports operate at the moment. It provides a
high-level overview of the structure of the UK airports sector, and considers how
well UK airports have adapted to changes in global aviation.

54
Chapter 3
The UK airports sector
SUMMARY
The global developments described in Chapter 2 have also driven significant
changes in the UK aviation sector. The consolidation around major hubs has
entrenched the dominance of the London aviation market and particularly Heathrow,
the UK’s largest airport, which is the main base for British Airways, the UK’s sole
network carrier. Meanwhile, successful and dynamic point-to-point carriers operate at
other UK airports. This has made the UK the biggest aviation market in Europe, and
London the largest OD market in the world.
Alongside the impact of global trends, developments at the national level are
changing the UK aviation sector. These include the break up of BAA Ltd, the
development of competition within the London airport system, and a new statutory
framework reducing carbon emissions. Growth in demand for aviation has also been
tempered by the economic downturn.
These developments were largely unforeseen by previous studies of airport capacity.
The one thing that has not changed significantly is the UK’s physical airport
infrastructure, and particularly runway capacity. The only new runways built over
recent decades have been at London City and Manchester airports. The main
London airports have benefited from new terminals, but are still reliant on runway
capacity which was built in the middle of the twentieth century.
The industry has responded well both to the constraints of the existing infrastructure
and to the new, more competitive environment. The largest UK airports operate their
runway infrastructure more efficiently than any others in the world. The UK is still one
of the best connected countries in the world. And competition between major airports
may drive some further improvements over the coming years.

55
Chapter 3 The UK airports sector
But problems are starting to emerge and are likely to get worse. Heathrow is
effectively full. Gatwick is operating at more than 85% of its maximum capacity, and
is completely full at peak times. Capacity constraints are making it more and more
difficult for airports and airlines to operate efficiently, lay on new routes, and deal with
resilience issues.
More intensive runway use also makes it harder to offer appropriate and predictable
respite from noise for people living and working near airports.
The current approach of forcing ever greater volumes of traffic through the existing
infrastructure, if continued, would also have increasingly detrimental effects on the
national economy, businesses, and air passengers.
The Commission’s analysis suggests that the costs of failing to address these issues
could amount, over a sixty-year time period, to:
●● £18-20 billion of costs to users and providers of airport infrastructure.
●● £30-45 billion of costs to the wider economy.
3.1 Since the Future of Air Transport White Paper was published in 2003, the UK
airports sector has faced a number of significant challenges. These have been
driven by broader developments in the global aviation sector, described in
Chapter 2, but also by changes to the policy and regulatory environment in the UK.
3.2 This chapter looks at how well UK airports have adapted to these changes, and
whether the UK is well-placed to maintain its position as Europe’s leading
international aviation hub.
The aviation market in the UK
3.3 Since the 1960s, UK air passenger demand has tended to rise in line with, and at
times slightly faster than, economic growth. There was a sharp fall in aviation
demand between 2007 and 2009 as a result of the economic downturn, but it has
more recently returned to a pattern of growth. This is shown in Figure 3.1.

56
Figure 3.1: Historically passenger demand for aviation has risen in line with or faster than GDP since 1960
Terminal passengers at UK airports and GDP, 1960-2012
300
250
200
150
100
50
0
1,600
1,400
1,200
1,000
800
600
400
200
0
GD
P £
milli
ons
Term
inal
pas
seng
ers,
milli
ons
Charterboom
B747Introduced
Oil crisis andrecession
GDP (right hand scale)
Sept 11th
1st Gulf Warand recession
Recession
UK AirportPassengers
(left hand scale)
1960
1962
1964
1966
1968
1970
1972
1974
1976
1978
1980
1982
1984
1986
1988
1990
1992
1994
1996
1998
2000
2002
2004
2006
2008
2010
2012
Source: DfT analysis based on CAA statistics and ONS data
3.4 While the focus of the aviation debate in the UK is often on passenger travel, the
market for air freight is also significant to the UK aviation sector and wider economy.
Both markets tend to have the same needs in terms of connectivity as 70% of
cargo by volume is shipped in the belly hold of passenger aircraft.
3.5 These markets are served by a diverse range of airports, from a major alliance hub,
through substantial low-cost carrier bases to small regional airports focusing on
short-haul and domestic routes. Passenger demand is, however, highly
concentrated on the four largest airports, which serve noticeably higher numbers
of passengers and destinations than other UK airports, as seen in Figure 3.2.

57
Chapter 3 The UK airports sector
Figure 3.2: The UK air travel market is highly concentrated at the country’s four largest airports
Number of passengers and destinations served, selected airports in 201227
0
20
40
60
80
100
120
140
160
180
0
10
20
30
40
50
60
70
80
Lond
on C
ity
Liver
pool
Bristo
l
Glasgo
w
Birming
ham
Edinbu
rgh
Luto
n
Stanste
d
Man
ches
ter
Gatwick
Heath
row
Total weekly (left axis)
Num
ber
of d
estin
atio
ns
Total daily (left axis) Terminal passengers (right axis)
Term
inal
pas
seng
ers
(milli
ons)
Source: DfT analysis based on CAA airport statistics
The role of the London airport system
3.6 Three of these four airports are within the London system. A number of factors
contribute to this concentration of aviation services in London and the surrounding
regions (South East and East of England):
●● London and the South East are the most populous regions in England, each with
more than 8 million inhabitants. The East of England is the fourth most populous
(after the North West);28
●● these three regions contribute more than 40% of total UK GVA, and GVA per
head in all three regions is higher than in any other part of England;29
●● the highest average incomes in the UK are also seen in these regions, with
wages in London some 20% higher than the national average;30
27 Definition of a weekly service is at least 52 passenger flight departures to that destination in a year. Definition of a daily service is at least 362 passenger flight departures to that destination in a year.
28 ONS (2012), ‘Annual Mid-Year Population Estimates for England and Wales’, Table 3, http://www.ons.gov.uk/ons/dcp171778_315456.pdf
29 ONS (2013), ‘Regional Gross Value Added (Income Approach) 2013’, http://www.ons.gov.uk/ons/dcp171778_291684.pdf (NB: GVA per head in Scotland is slightly higher than in the East of England, but lower than in the South East or London.)
30 Regional Economic Analysis, Changes in real earnings in the UK and London, 2002 to 2012, http://www.ons.gov.uk/ons/rel/regional-trends/regional-economic-analysis/changes-in-real-earnings-in-the-uk-and-london--2002-to-2012/index.html

58
●● almost a quarter of London’s population are non-UK nationals, compared to less
than 10% for England as a whole;31 and
●● more than a third of Londoners were born outside the UK.32
3.7 As can be seen in Figure 3.3, the result is a higher propensity to fly in these
regions than in the UK as a whole, with only the North West region also
approaching the national average. This pattern is likely to be strengthened further in
the future by the comparatively strong population growth forecast for London,
where the population is predicted to rise from approximately 8 million currently to
almost 10 million by 2031.33
Figure 3.3: London has the highest propensity to fly across all the UK’s regions
Passengers flying abroad per head, by UK region and purpose of travel (several years weighted to
2010 levels)
0.00
0.50
1.00
1.50
2.00
2.50
3.00
VFRGre
ater L
ondo
n
South
Eas
t
East o
f Eng
land
South
Wes
t
East M
idlan
ds
Wes
t Midl
ands
North
Wes
t
Yorks
hire &
Humbe
rside
North
Eas
t
Wale
s
Scotla
nd
Nation
al av
erag
e
Leisure BusinessSource: DfT analysis based on CAA Passenger Survey and ONS population statistics
3.8 London is also a significant international business destination, with the fifth largest city
economy in the world and an estimated GDP in 2012 of over £450 billion.34 A recent
study for the CAA found that London is considered the most important European
destination by airlines, concluding that its ‘potential strategic importance to airlines is
31 ONS (2013), ‘Population by Country of Birth and Nationality Report, August 2013’ http://www.ons.gov.uk/ons/dcp171776_324663.pdf
32 Census 201133 Greater London Authority (2012), ‘Round Population Projections’, http://www.london.gov.uk/sites/default/files/Update%20
05-2013%20GLA%202012%20round%20population%20projections.pdf 34 Global Metro Monitor (2012), ‘Slowdown, Recovery, and Interdependence Research’, Appendix 2,
http://www.brookings.edu/research/reports/2012/11/30-global-metro-monitor

59
Chapter 3 The UK airports sector
expected to persist if not increase’ and that ‘it is unlikely that the combination of
volume and value that defines London can be replicated elsewhere.’35
3.9 These factors have contributed to London continuing to accommodate the largest
OD aviation market in the world, despite increasing competition from Chinese and
other emerging market cities, as shown in Figure 3.4.
Figure 3.4: London still retains the biggest OD market in the world
20 biggest OD markets in the world in 2012; 2002 and 2012 figures
0
20,000,000
40,000,000
60,000,000
80,000,000
100,000,000
120,000,000
Singap
ore
San Fr
ancis
co
Atlant
a
Hong
Kong
Jaka
rta
Bangk
ok
Guang
zhou
Seoul
Mos
cow
Miam
i
Sao P
aulo
Was
hingt
on D
C
Chicag
o
Paris
Los A
ngele
s
Shang
hai
Beijing
Toky
o
New Yo
rk
Lond
on
2002 OD passengers 2012 OD passengers
Source: PwC analysis based on Sabre ADI
3.10 The size of the London market enables the London airport system to play a crucial
national role, supporting a much denser network of routes for UK passengers and
businesses than can be provided elsewhere in the country. Survey evidence
compiled by the Institute of Directors shows that Heathrow is the most regularly
used airport for business travel amongst its members in seven out of twelve UK
regions, and either the second or third most regularly used in all of the others.36
3.11 The role played by London airports is particularly important for long- haul
connectivity. Although all of the UK’s major conurbations are served by one or more
airports, long-haul routes, whose higher cost base requires a greater concentration
of demand, are focused heavily on the London airport system, and particularly at
Heathrow, as Figure 3.5 shows.
35 CAA (October 2013), ‘The Strategic Importance of London to Airlines’, http://www.caa.co.uk/docs/78/rpt%20strategic%20importance%20of%20London%20final.pdf
36 Institute of Directors (2012), ‘Infrastructure for Business: Flying into the Future’, p.56

60
Figure 3.5: London airports play a crucial role in providing long-haul connectivity
20 biggest UK airports by ATMs, 2012
Source: DfT analysis based on CAA airports statistics
Heathrow Airport – consolidation at a single hub
3.12 For many decades, Heathrow has been the UK’s busiest airport and the main base
for British Airways, the country’s sole network carrier. The trend towards
consolidation and partnership outlined in the previous chapter has reinforced
Heathrow’s position as the UK’s most important international gateway for both
aviation passengers and freight. Key developments have included:
●● The end of British Airways’ dual hub operation. British Airways operated
hubs at both Heathrow and Gatwick throughout the 1990s, but following a fall in
aviation demand in the early 2000s reversed that strategy in 2002. Since then,
BA has continued to reinforce its hub network at Heathrow, with long-haul
61
Chapter 3 The UK airports sector
services at Gatwick being focused primarily on point-to-point leisure markets.37
BA’s subsequent withdrawal from Birmingham Airport has further strengthened
this consolidation.
●● The introduction of the EU-US ‘Open Skies’ agreement. This agreement,
discussed in more detail in Chapter 2, ended the previous bilateral arrangement,
which only allowed two US carriers to operate at Heathrow. Four additional US
airlines moved services from Gatwick to Heathrow as a result.
●● Consolidation of alliance operations. Heathrow Airport Ltd’s investment
programme has enabled each of the three aviation alliances to strengthen the
concentration of their operations in a single terminal. The majority of British
Airways’ services are now operated from Terminal 5. Star Alliance members will
be based in the new Terminal 2 when it opens and SkyTeam airlines are based in
Terminal 4. This is being accompanied by significant investment on the part of
the alliances in dedicated facilities at their ‘home’ terminals.
3.13 As a result of this consolidation, the vast majority of transfer passengers using UK
airports now pass through Heathrow. Although they are not as high a proportion of
total traffic as at Frankfurt or Amsterdam Schiphol, transfer passengers are vital to
maintaining the strength of the airport’s route network. Analysis carried out by the
Commission suggests that most of these transfers take place within alliances, a
trend which may be reinforced by the consolidation of operations.
3.14 Approximately a quarter of flights at Heathrow carry more than 40% transfer
passengers, including routes to key emerging markets destinations such as Hyderabad,
Mexico City and Buenos Aires, as well as a number of North American cities.38
3.15 The increasing concentration of long-haul and network services has driven ongoing
growth in passenger numbers at Heathrow (interrupted during the economic
downturn by a 2% reduction between 2007 and 2009) and the continuing operation
of the airport’s two runways at close to the 480,000 air traffic movements limit
specified in Heathrow’s ‘planning cap’.
3.16 In contrast, other European hub airports continue to operate with substantial spare
runway capacity available. This can however be overstated – for example, Amsterdam
Schiphol has six runways, but is in practice generally able to operate only three at a
time and is itself subject to a planning cap of 510,000 movements by 2020.
3.17 With Heathrow effectively full, airlines operating there have tried to get the highest
return from the limited capacity available. They have done this by concentrating on
37 CAA (2008), ‘Connecting Passengers at UK Airports’, paragraph 2.938 Commission analysis of data taken from Sabre Airport Data Intelligence

62
the thickest routes. This has led to service frequencies gradually increasing but the
total number of destinations served each week remaining broadly constant over
time, as shown in Figure 3.6.
Figure 3.6: At Heathrow passenger numbers and service frequencies have increased but the numbers of overall destinations served have remained roughly constant
Number of passengers and destinations served at Heathrow, 1990-201239
0
20
40
60
80
100
120
140
160
180
1211100908070605040302010099989796959493929190
Total weekly
Num
ber
of d
estin
atio
ns
Term
inal
pas
seng
ers
(milli
ons)
Total daily Terminal passengers (right hand axis)
0
10
20
30
40
50
60
70
80
Source: DfT analysis based on CAA airport statistics
3.18 The attractiveness of Heathrow to airlines is in part driven by its high yields
compared to other London airports. In 2012, airlines operating out of Heathrow
earned approximately 21 US cents per passenger mile on average. In contrast, the
average yield at Stansted was approximately 15 cents per passenger mile and at
Gatwick just under 10 cents.40 Even allowing for the difficulty and cost of acquiring
slots at Heathrow (the value of a slot pair is estimated at roughly £25-30 million41)
and its higher charges compared to other London airports, this makes it
commercially attractive to many airlines. This is further underlined by the high
number of business and first class passengers using Heathrow compared to all
other UK airports.
39 Definition of a weekly service is at least 52 passenger flight departures to that destination in a year. Definition of a daily service is at least 362 passenger flight departures in a year to that destination
40 Commission analysis of data taken from Sabre ADI41 Deloitte (2008), ‘Open Skies – Open for Business’, http://www.deloitte.com/assets/Dcom-UnitedKingdom/Local%20Assets/
Documents/UK_THL_OpenforSkiesOpenForBusiness_May08(2)!!1!!.pdf (N.B. It should be noted that this is higher than the price implied by IAG’s £172.5 million purchase of BMI in 2012, which saw them acquire 42 slot pairs)

63
Chapter 3 The UK airports sector
3.19 Heathrow is also by far the largest UK freight airport, accounting for 64% of the UK
total air freight by volume.42
Box 3a: Air freight in the UK
In 2012, 2.3 million tonnes of cargo were transport through UK airports.
Heathrow dominates air freight activity, due to its connectivity and availability of
direct cargo links to intercontinental destinations. It accounts for 1.5 million
tonnes of air freight, 95% of which is carried as belly hold. The second busiest
cargo airport was East Midlands with 264,000 tonnes (11% of total UK freight
tonnes) most of which was carried by dedicated freighters (rather than belly
hold), and dominated by freight forwarding and express services.43
UK-Asia and UK-East Africa routes have the highest freight content, by
weight, relative to passengers, both routes with high levels of machinery and
transport equipment, and the UK-East Africa route also featuring perishables.
Other routes, such as the UK-North America are thick freight and passenger
routes. The value of these thick freight routes are derived through the relatively
high value of the goods transported, particularly in relation to UK exports.
These tend to be focused on high value manufacturing, pharmaceuticals and
luxury goods, all of which require fast, reliable transportation over long
distances, which only air freight can offer.
While the largest global air freight market players are the express carriers,
FedEx and UPS (dominated by business mail and parcels), the UK air freight
market is dominated by belly hold cargo at Heathrow. This has led to a
buoyant ‘freight forwarder’ market, taking advantage of the connectivity
offered by the UK’s passenger services. This, according to the industry, has
lead to a “passengers lead, freight follows” business model in the UK. BA, the
UK’s largest freight carrier, derives only 7% of its revenue from cargo with the
majority derived through passenger services. However, this additional revenue
can be the difference between a loss-making/profit making route.44 The
“passenger leads, freight follows” business model is further evidenced by a fall
in freight volumes at Gatwick Airport since 2008, which coincided with a
consolidation of US and other long haul flights to Heathrow. As the Gatwick
long-haul services reduced, they were replaced by an increase in LCC
operations – which tend not to offer freight services.
42 CAA Airport Statistics, http://www.caa.co.uk/docs/80/airport_data/2012Annual/Table_13_1_Freight_by_Type_and_Nat_of_Operator_2012.pdf
43 CAA Airport Statistics44 Flightglobal, Cargo 2013 report
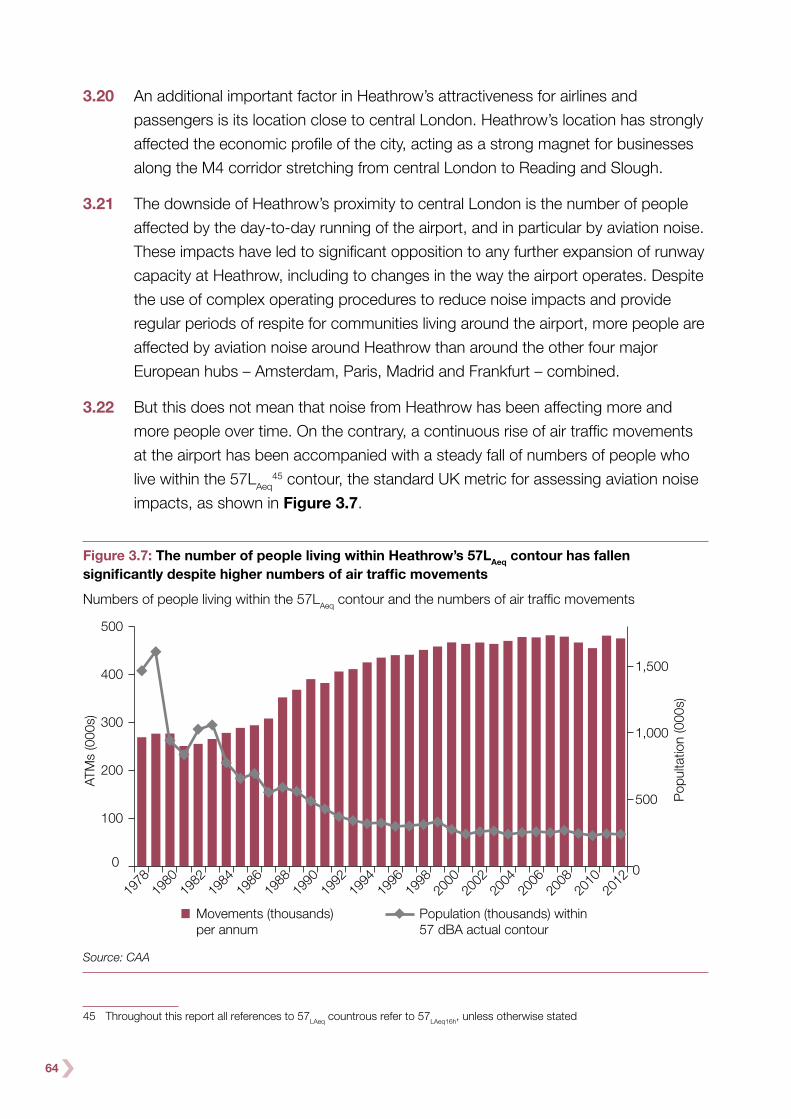
64
3.20 An additional important factor in Heathrow’s attractiveness for airlines and
passengers is its location close to central London. Heathrow’s location has strongly
affected the economic profile of the city, acting as a strong magnet for businesses
along the M4 corridor stretching from central London to Reading and Slough.
3.21 The downside of Heathrow’s proximity to central London is the number of people
affected by the day-to-day running of the airport, and in particular by aviation noise.
These impacts have led to significant opposition to any further expansion of runway
capacity at Heathrow, including to changes in the way the airport operates. Despite
the use of complex operating procedures to reduce noise impacts and provide
regular periods of respite for communities living around the airport, more people are
affected by aviation noise around Heathrow than around the other four major
European hubs – Amsterdam, Paris, Madrid and Frankfurt – combined.
3.22 But this does not mean that noise from Heathrow has been affecting more and
more people over time. On the contrary, a continuous rise of air traffic movements
at the airport has been accompanied with a steady fall of numbers of people who
live within the 57LAeq45 contour, the standard UK metric for assessing aviation noise
impacts, as shown in Figure 3.7.
Figure 3.7: The number of people living within Heathrow’s 57LAeq contour has fallen significantly despite higher numbers of air traffic movements
Numbers of people living within the 57LAeq contour and the numbers of air traffic movements
0
100
200
300
400
500
2012
2010
2008
2006
2004
2002
2000
1998
1996
1994
1992
1990
1988
1986
1984
1982
1980
1978
Movements (thousands)per annum
ATM
s (0
00s)
Pop
ulta
tion
(000
s)
Population (thousands) within 57 dBA actual contour
0
500
1,000
1,500
Source: CAA
45 Throughout this report all references to 57LAeq countrous refer to 57LAeq16h, unless otherwise stated
65
Chapter 3 The UK airports sector
3.23 This inverse relationship between the numbers of aircraft using Heathrow and the
numbers of people affected by significant levels of noise living within its 57LAeq
contour is mostly due to improved aircraft technologies, and also to takeoff and
landing procedures designed to minimise noise impacts.
3.24 The dramatic fall in the numbers of people living within Heathrow’s 57LAeq contour
between the early 1980s and early 1990s was due to the retirement of the first
generation of jet aircraft, notably the Hawker Siddeley Trident (retired at the end of
1985) and Boeing 707 (retired by BA in late 1984) as they used to make up a large
part of BA’s fleet. Another very noisy aircraft, the Vickers VC-10, was retired by BA
in 1981, and in 2003 Concorde services were discontinued.
3.25 Although this trend has slowed significantly over the last decade, further reductions
in noise impacts can be expected over the coming years as a new generation of
planes, including both wide-bodied aircraft such as the Boeing 787 and A350 and
narrow-bodied jets such as the A320neo and Boeing 737 MAX, are introduced. But
the changes may not be as dramatic as those seen in the 1980s and 1990s.
3.26 The Commission is aware of the effect that aviation noise can have on people who
live and work near airports. Box 3b sets out the Commission’s work to date on
noise and the approach it will be taking to this issue in the next phase of its work.

66
Box 3b: Aviation noise
The Commission looked in depth at the issue of aviation noise in its Aviation
Noise discussion paper, published in July 2013. The paper outlined the noise
situation at the UK’s airports and how it compared with other international
airports. It also explored different ways of measuring noise and its impacts,
and considered potential noise mitigation techniques.
The paper generated a strong response, eliciting over 400 replies from
airports, local councils, campaigners, members of the public, politicians,
acoustic specialists and others. These responses outlined the importance of
measuring noise impacts accurately, and of evaluating its effects transparently.
The responses also made clear to the Commission the strength of feeling of
those living under flight paths. The paper and all technical responses to it can
be viewed in full on the Commission’s website, alongside a summary of the
non-technical responses submitted.
Respondents to the paper made it clear that there are a number of credible
metrics to measure noise and its effects, and that a comprehensive noise
assessment should employ a range of them, which is the Commission’s
intention. In January 2014 the Commission will publish its draft Appraisal
Framework, setting out in detail its suggestion for how these assessments
should be undertaken in relation to the short-listed proposals for airport
expansion.
Respondents also agreed that aviation noise has the potential to damage the
health and quality of life of those exposed to it. A number of respondents
testified that living under a flight path can cause annoyance, adverse health
and, at times, deep unhappiness. The Commission wishes to account fully for
the negative impact that aviation noise can have on quality of life, and to
consider it alongside the more positive impacts on quality of life that an airport
may have on its surrounding population. Further analysis of these topics will
be undertaken in the second phase of the Commission’s work.
Further discussion on the Commission’s Aviation Noise discussion paper is
located in Chapter 5.
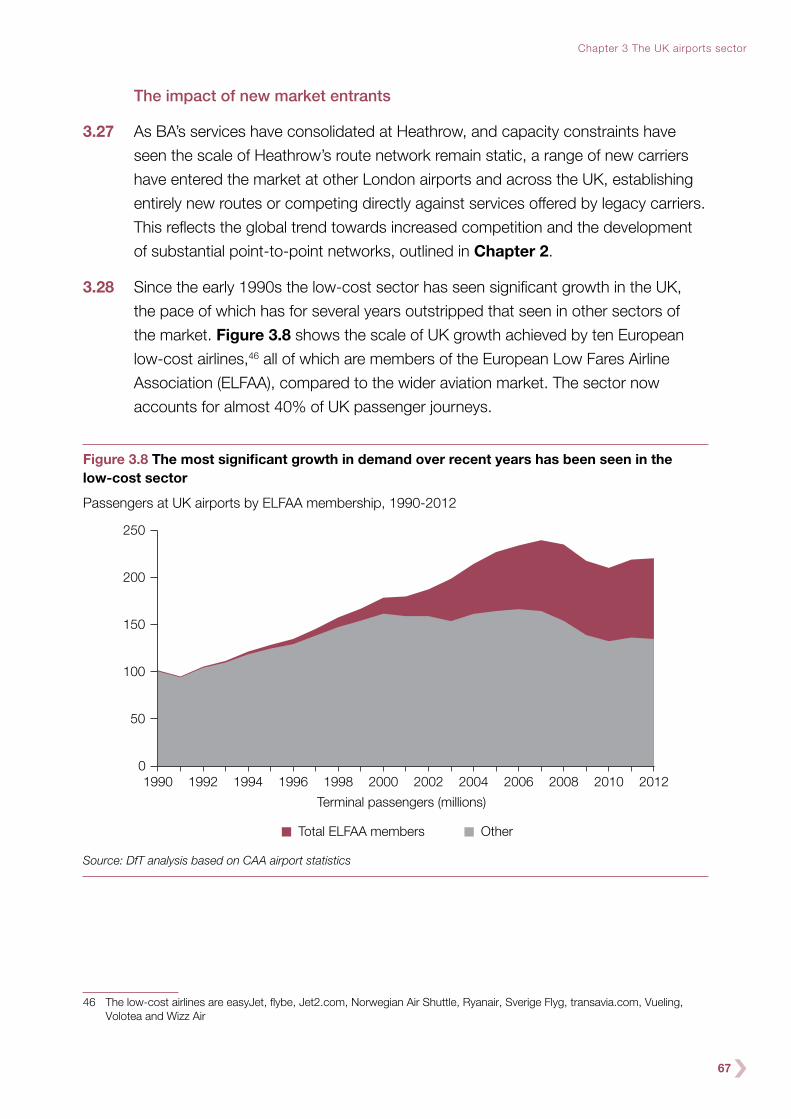
67
Chapter 3 The UK airports sector
The impact of new market entrants
3.27 As BA’s services have consolidated at Heathrow, and capacity constraints have
seen the scale of Heathrow’s route network remain static, a range of new carriers
have entered the market at other London airports and across the UK, establishing
entirely new routes or competing directly against services offered by legacy carriers.
This reflects the global trend towards increased competition and the development
of substantial point-to-point networks, outlined in Chapter 2.
3.28 Since the early 1990s the low-cost sector has seen significant growth in the UK,
the pace of which has for several years outstripped that seen in other sectors of
the market. Figure 3.8 shows the scale of UK growth achieved by ten European
low-cost airlines,46 all of which are members of the European Low Fares Airline
Association (ELFAA), compared to the wider aviation market. The sector now
accounts for almost 40% of UK passenger journeys.
Figure 3.8 The most significant growth in demand over recent years has been seen in the low-cost sector
Passengers at UK airports by ELFAA membership, 1990-2012
Total ELFAA members
Terminal passengers (millions)
0
50
100
150
200
250
201220102008200620042002200019981996199419921990
Other
Source: DfT analysis based on CAA airport statistics
46 The low-cost airlines are easyJet, flybe, Jet2.com, Norwegian Air Shuttle, Ryanair, Sverige Flyg, transavia.com, Vueling, Volotea and Wizz Air

68
3.29 This rapid growth has seen easyJet and Ryanair grow into two of the world’s ten
largest airlines by international passenger numbers, with major bases at Gatwick
and Stansted respectively, and routes established at a large number of airports
across the UK. Flybe and Jet2 have also seen substantial passenger growth,
serving approximately 10 million and 5 million passengers respectively in 2012,
mainly out of the UK’s regional airports.
3.30 The UK’s low-cost network is not restricted to the leisure market. Low-cost airlines
also provide links for foreign workers to their home countries, particularly in the
European Union, and routes from UK regional airports to European business
destinations and hub airports. In 2012, around 40% of passengers flying with
low-cost airlines from UK airports were visiting friends or relatives abroad. Also,
around one fifth of passengers flying low-cost from big UK airports like Gatwick,
Manchester and Birmingham were business travellers.47
3.31 Low-cost carriers have also established a number of domestic routes to London
airports other than Heathrow, enabling both improved access to the capital and
opportunities to self-connect to onward flights. For example, in 2011, 27% of Flybe
passengers into Gatwick self-connected to another service.48
3.32 The impact of the Gulf carriers on the UK market has also been substantial. Not
only have they established high frequency routes into Heathrow, which have seen
Dubai grow into the airport’s second largest passenger market after New York JFK,
but they have also opened new services from a number of UK regional airports.
Emirates now serves Birmingham, Glasgow, Manchester and Newcastle, as well as
Heathrow and Gatwick. Both Etihad and Qatar offer services from Manchester and
Heathrow. The substantial onward route networks available from these airlines’
hubs, particularly to South Asian and Far Eastern destinations, have opened up
many new opportunities for long-haul travel from Manchester and other regional
airports.
3.33 The impact of the low-cost airlines and Gulf carriers on UK regional connectivity to
destinations outside Western Europe has been transformational. This is reflected in
Figure 3.9: in 2003 there were no services to African destinations from regional
airports, but by 2013 more than 1 million seats per annum were available.
47 Commission’s analysis of ELFAA data (2012) for Gatwick, Stansted, Luton, Manchester, Birmingham, Bristol, Cardiff, East Midlands, and Exeter, taken from ‘Passengers travelling on ELFAA member airlines at selected airports’
48 CAA (2011), ‘Passenger Survey’
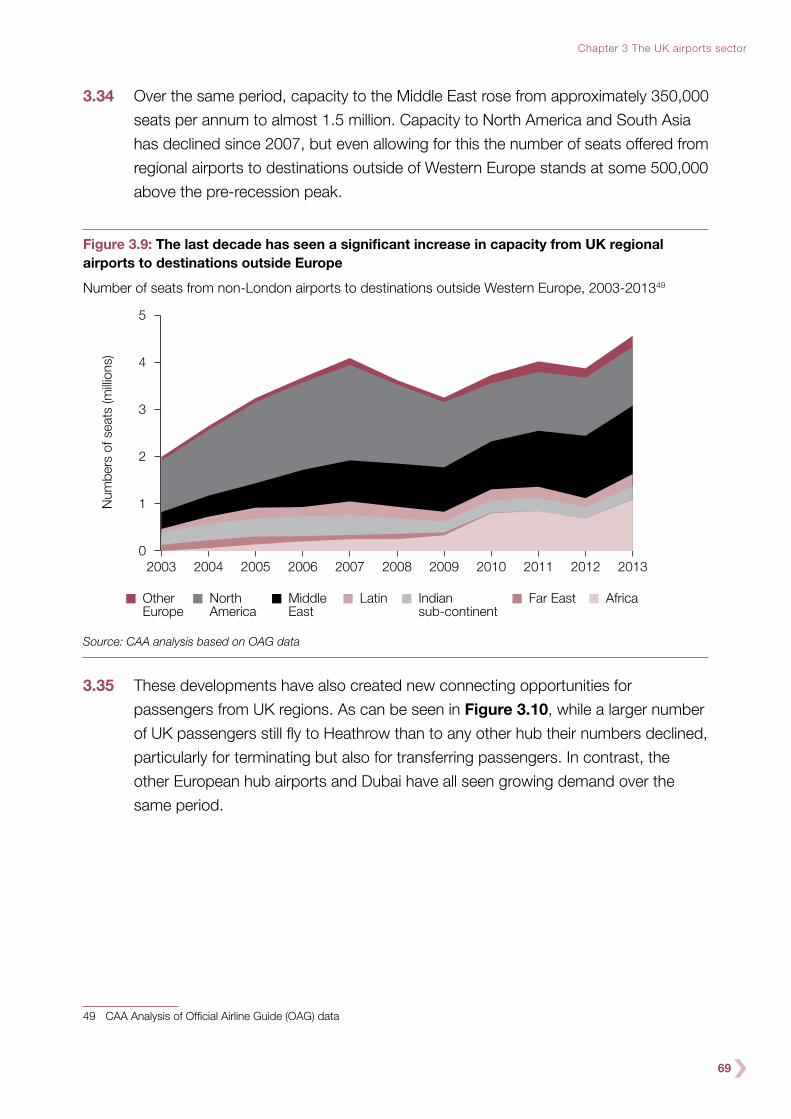
69
Chapter 3 The UK airports sector
3.34 Over the same period, capacity to the Middle East rose from approximately 350,000
seats per annum to almost 1.5 million. Capacity to North America and South Asia
has declined since 2007, but even allowing for this the number of seats offered from
regional airports to destinations outside of Western Europe stands at some 500,000
above the pre-recession peak.
Figure 3.9: The last decade has seen a significant increase in capacity from UK regional airports to destinations outside Europe
Number of seats from non-London airports to destinations outside Western Europe, 2003-201349
OtherEurope
0
1
2
3
4
5
20132012201120102009200820072006200520042003
Indiansub-continent
MiddleEast
LatinNorthAmerica
AfricaFar East
Num
bers
of s
eats
(milli
ons)
Source: CAA analysis based on OAG data
3.35 These developments have also created new connecting opportunities for
passengers from UK regions. As can be seen in Figure 3.10, while a larger number
of UK passengers still fly to Heathrow than to any other hub their numbers declined,
particularly for terminating but also for transferring passengers. In contrast, the
other European hub airports and Dubai have all seen growing demand over the
same period.
49 CAA Analysis of Official Airline Guide (OAG) data

70
Figure 3.10: Increasing numbers of passengers from UK regional airports are connecting through hubs other than Heathrow
Estimated number of passengers flying between non-London airports and hubs and terminating or
transferring at the hub, 2001 and 2012
0
1
2
3
4
5
6
7
201220012012200120122001201220012012200120122001
Terminating
Heathrow Amsterdam Paris CDG Dubai Frankfurt Madrid
Term
inal
pas
seng
ers
(milli
ons)
Transferring on
Source: DfT analysis based on CAA airport statistics
The changing UK policy context
3.36 Alongside these developments in the global aviation sector, a number of recent
changes at the national level have also affected UK airports.
Enhanced competition
3.37 Potentially the most important change has been the fundamental shift in the sector’s
competitive landscape as a result of the Competition Commission’s March 2009
decision to require BAA Ltd to sell a number of its airports. This decision led to the
sale of Gatwick Airport to Global Infrastructure Partners (GIP) in October of the
same year. This was followed in February 2013, after BAA had abandoned a
long-running attempt to challenge the decision in the Courts, by Manchester Airport
Group’s purchase of Stansted Airport.
3.38 The level of private sector ownership of UK airports was already unusually high prior
to the break up of BAA Ltd. The privatisation of the British Airports Authority in July
1987 had seen the three largest London airports, together with Glasgow,
Edinburgh, Aberdeen and Southampton airports, become privately owned. The
pattern of ownership at other airports varies. Manchester Airport Group remains

71
Chapter 3 The UK airports sector
majority publicly owned, for example, and 49% of shares in Birmingham Airport are
local authority owned (with a further 2.5% owned by the airport’s employees).
Many other airports are fully private sector enterprises, for example: Peel Holdings
fully owns both Liverpool John Lennon Airport and Robin Hood Airport.
3.39 The sale of Gatwick and Stansted created a unique competitive environment in the
London and South East aviation market. As set out in Box 3c, while there are a
range of ownership models across the world, fully private sector ownership is still
rare.
Box 3c: Ownership of major international airports
●● The City of New York owns JFK and LaGuardia Airports, and Newark
International is owned by the City of Newark. All three airports, as well as a
number of smaller aviation facilities, are operated by the Port Authority of New
York and New Jersey under long-term operating leases. This allows the Port
authority to operate them as a system and they do not directly compete.
●● Tokyo’s two airports are both publicly owned, but by different bodies.
Haneda Airport is owned by the Japanese Ministry of Land, Infrastructure,
Transport and Tourism, whereas Narita is owned by the Narita International
Airport Corporation. This Corporation was set up in 2004 with a view to
privatisation, but remains 100% publicly owned.
●● Schiphol Airport is owned by Schiphol Group, which is a wholly public
sector company in which the Dutch Government and the City of
Amsterdam are the major shareholders. In addition, Aeroports de Paris and
Schiphol Group each hold an 8% stake in the other. Schiphol Group also
wholly owns and operates Rotterdam and Lelystad Airports, and holds a
51% stake in Eindhoven Airport. The group came close to privatisation in
early 2000s, but this was not taken forward.
●● Aeroports de Paris is a public company which owns and operates Charles
de Gaulle, Orly and Le Bourget airports, as well as a number of smaller
airfields around Paris. The French Government holds a 50.6% share and
8% is owned by Schiphol Group. The remaining shares are owned by a
combination of private sector companies, institutional investors, individual
shareholders and employees.

72
Box 3c: Continued
●● The operator of Frankfurt Airport, FRAPort AG, is owned by a range of
investors. A majority stake is held by the public sector, with the Hesse
regional Government owning 31.4% and the City of Frankfurt 20.1%.
In addition, Lufthansa owns 10%, with the remaining shares held by a
range of private and institutional shareholders.
●● Dubai International Airport and Dubai World Central are owned by the
Government of Dubai.
3.40 Since its sale to Global Infrastructure Partners, Gatwick Airport has sought to
enhance its competitive position:
●● in 2011, the airport began a £1.2 billion pound investment programme to
improve its terminals and other facilities;
●● new long-haul routes have been introduced to emerging market destinations
including China, Vietnam and, from spring 2014, Indonesia;
●● in spring 2013, a second low-cost carrier, Norwegian Air Shuttle, made the
airport into its base; and,
●● the Gatwick Connect service has been implemented to facilitate transfers for
self-connecting passengers.
3.41 In addition, Manchester Airport Group, the new owners of Stansted have concluded
long-term deals with the airport’s two largest carriers, Ryanair50 and easyJet,51
which will see new routes introduced and a significant increase in passenger
numbers. The Group has also started an £80 million investment programme in the
airport’s terminal facilities.52
Climate change legislation
3.42 A second important change has been the establishment of a legislative framework
for reducing greenhouse gas emissions, through the Climate Change Act 2008.
The Act set out a legally binding target to reduce overall UK emissions by at least
80% below 1990 levels by 2050 and a system of five-year carbon budgets. It also
50 http://www.ryanair.com/en/news/ryanair-agrees-10-year-growth-deal-at-stansted 51 http://www.stanstedairport.com/about-us/media-centre/press-releases/easyjet-sign-long-term-deal-to-double-traffic-at-
stansted 52 http://www.stanstedairport.com/about-us/media-centre/press-releases/transport-secretary-launches-£80-million-terminal-
redevelopment-(1)

73
Chapter 3 The UK airports sector
established the Committee on Climate Change (CCC), an independent statutory
body to advise the Government on emissions targets and report to Parliament on
progress towards meeting them.
3.43 Separate from the statutory framework, in the context of its 2009 decision to allow
an expansion of Heathrow airport, the then-Government adopted a target that
gross CO2 emissions from UK aviation in 2050 should not exceed 2005 levels.
Analysis undertaken by the CCC at that time suggested that aviation demand
growth of around 60% between 2005 and 2050 was compatible with that target,
given prudent assumptions around aircraft fuel efficiency and biofuels use.
3.44 Whilst the target of constraining aviation emissions to 2005 levels in 2050 is not
itself part of the legally binding framework, legislated carbon budgets have been set
on the assumption that aviation emissions out to 2050 are constant at the level of
the EU ETS cap in 2020. Given that the EU ETS has been set with reference to
average emissions between 2004 and 2005 (i.e. very close to 2005 emissions
levels), the previous Government’s target and the currently legislated budgets are
very similar. A significant overshoot of 2005 aviation emissions levels in 2050 would
therefore imply more challenging reductions in other sectors, if the overall UK
emissions target is to be met.
Airport expansion
3.45 The broader aviation policy context also shifted significantly following the 2010
election, when the incoming government rejected the airport expansion plans which
had been supported by the previous administration.
3.46 Airport expansion in the UK has been politically controversial for many decades,
since the establishment of the Roskill Commission in 1968 to consider options for
a third London airport. Box 3d sets out the key milestones in the period between
then and the publication of the 2003 Aviation White Paper.

74
Box 3d UK aviation policy over the last 50 years
1963 Stansted recommended as the location for a new London airport
1966 Government sets up Interdepartmental Committee to revisit case for Stansted
1967 Ministerial statement announcing decision to develop Stansted
1968 Government sets up the Roskill Commission to recommend a new London airport
1971 Roskill Commission recommends Cublington, Oxfordshire as new airport for London Government selects Maplin Sands, Foulness to be London’s new hub airport
1974 Maplin Sands proposal abandoned by the Government
1978 Aviation White Paper identifies Heathrow capacity as ‘restricted’
1979 ‘Gatwick Agreement’ between BAA and West Sussex County Council that there would be no operational second runway at the airport before 2019
1990 Government commissions the study on airport capacity ‘Runway Capacity in the South East Study’ (RUCATSE)
1997 RUCATSE concludes that expanding Heathrow ‘would afford the greatest benefits’. Planning permission granted for second runway at Manchester Airport
2001 Second runway at Manchester Airport completed
2002 Government publishes SERAS (South East of England Regional Air Services Study) with options for new runway capacity in the South East
2003 Air Transport White Paper supports a third runway and sixth terminal at Heathrow and a second runway at Stansted
2006 Government Progress Report confirms commitment to third runway at Heathrow and a second runway at Stansted
2007 Government consults on expanding Heathrow
2009 Government backs a third runway decision (subject to conditions) and rules out mixed-mode operation of existing runways at Heathrow
2010 Coalition Government reverses third runway decision and rules out new runways at Gatwick or Stansted
2011 Government publishes ‘scoping document’ on a ‘sustainable framework for UK aviation’
2012 Government publishes draft aviation policy framework for further consultation. Independent Airports Commission established in November
Adapted from Source: Aviation Foundation, Fifty Years of Indecision – a timeline of UK aviation policy (http://www.aviation-foundation.org/docs/Timeline_50YearsOfIndecision_Final.pdf)
75
Chapter 3 The UK airports sector
3.47 The 2003 White Paper, The Future of Air Transport, was informed by a national
consultation exercise seeking views on a wide range of options for new airport
infrastructure. As well as indicating the Government’s support for expansion at
a number of regional airports, it concluded that new runways should be built at
Stansted and, subject to certain environmental conditions being met, at Heathrow.
It also recommended that land should be safeguarded for a second runway at
Gatwick, in case expansion at Heathrow proved unachievable.
3.48 Subsequently, in January 2009, the Labour Government announced, following a
further consultation process, that it had concluded that the environmental
conditions could reasonably be met and confirmed its support for the Heathrow
third runway. In doing so, it proposed that a number of safeguards should be put
in place to ensure that the environmental impacts of expansion were appropriately
managed.
3.49 An initial planning cap of 605,000 air traffic movements at Heathrow was proposed
for the period to 2020, with the CAA and Environment Agency responsible for
monitoring whether noise and air quality limits were being met prior to any new
capacity being released. The Government also stated that the release of any
additional capacity would be dependent on advice from the CCC as to whether the
industry was on track to meet its climate change target.
3.50 The difficulties faced by Heathrow in seeking to expand are not unique amongst
European airports. Frankfurt and Amsterdam Schiphol for example have both had
to address serious concerns on the part of local communities and accept stringent
conditions in order to enable recent expansions to take place, as set out in Box 3e.
Box 3e: Challenges to Expansion – Amsterdam Schiphol and Frankfurt Airports
Frankfurt: Until 1984, Frankfurt Airport operated with two parallel runways,
oriented roughly east-west. A third, north-south, runway was opened that year,
almost twenty years after planning documents had first been submitted.
Despite the significant opposition to the third runway, in 1997 a process began
to consider options for further expansion. The regional Government put in place
a mediated process for over 15 months, which led to a package of measures
being recommended, including the construction of a short fourth runway,
together with a noise reduction programme and a complete ban on flights
between 11pm and 5am.

76
Box 3e: Continued
The fourth runway opened in October 2011, but local environmental groups
have continued to protest on a weekly basis in the airport’s terminals.
Furthermore, as at Heathrow, the question of aviation noise has become a
significant local political issue, the recently elected Lord Mayor of Frankfurt
having campaigned on an explicitly anti-airport platform. As Mayor, he has joined
the supervisory board of the airport, significantly reducing the likelihood of any
relaxation of the conditions on the airport’s operations or any further expansion.
Amsterdam Schiphol: In order to manage long-standing tensions between
the Dutch Government’s and the airport’s ambitions for expansion at
Amsterdam Schiphol and the concerns, principally around noise effects, of
local communities, a ‘roundtable’ approach was introduced in 2006,
independently chaired by a former politician, Hans Alder, and known as the
Alderstafel. This brought together a range of stakeholders including national
and local Government, the airport, local business groups and community
representatives, all of whom were required to participate in discussions,
with a clear mandate to negotiate and agree a solution.
The Alderstafel agreed in 2008 that medium-term growth (to 2020) at the
airport should be should be subject to an overall cap of 510,000 air traffic
movements, and that a wide-ranging package of measures to mitigate and
compensate for noise effects should be put in place alongside this.
In addition, two other airports in the Schiphol Group could expand to
accommodate a total of 70,000 ATMs, so that point-to-point services could
use other infrastructure while Schiphol itself focused on its hub operations.
Any further expansion beyond 2020 would be subject to a noise envelope
(see Chapter 5) with the benefits from any improvements in noise
performance due to technological change to be split equally between the
airport and local communities. The Alderstafel remains in place to monitor
the delivery of its recommendations.
3.51 Despite these safeguards, the proposed expansion of Heathrow remained highly
controversial. It was opposed by the Conservative and Liberal Democrat parties in
the run-up to the 2010 election and was cancelled following the formation of the
Coalition Government. Subsequently, the Airports Commission was established to
review these issues afresh.

77
Chapter 3 The UK airports sector
The performance of UK airports
3.52 Whilst there have been significant developments in the policy and regulatory
environment for UK airports, the contentious nature of airport expansion proposals
has ensured that the physical airport infrastructure has changed little. New terminals
have been built, and existing ones extended at a number of airports, including
Terminal 5 and the new Terminal 2 at Heathrow. But the only new runways to be
constructed since the end of the Second World War are at London City Airport,
which opened in 1997, and the second runway at Manchester Airport, which
opened in 2001.
3.53 The consequence is that the UK’s two largest airports must generate a higher level
of capacity utilisation from their runways than any comparable airports in the world,
as shown in Figure 3.11.
Figure 3.11: Heathrow and Gatwick have the highest runway utilisation in the world
Runway utilisation at selected airports measured in number of ATMs per runway, 2012
Source: NATS
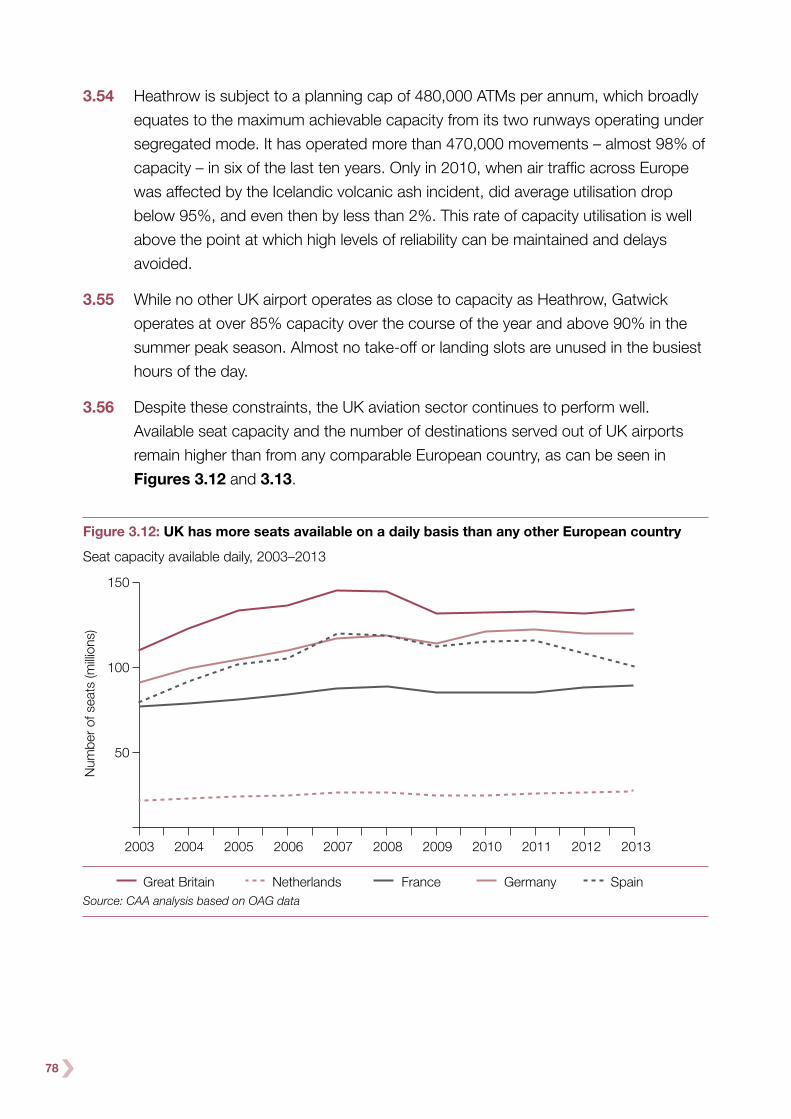
78
3.54 Heathrow is subject to a planning cap of 480,000 ATMs per annum, which broadly
equates to the maximum achievable capacity from its two runways operating under
segregated mode. It has operated more than 470,000 movements – almost 98% of
capacity – in six of the last ten years. Only in 2010, when air traffic across Europe
was affected by the Icelandic volcanic ash incident, did average utilisation drop
below 95%, and even then by less than 2%. This rate of capacity utilisation is well
above the point at which high levels of reliability can be maintained and delays
avoided.
3.55 While no other UK airport operates as close to capacity as Heathrow, Gatwick
operates at over 85% capacity over the course of the year and above 90% in the
summer peak season. Almost no take-off or landing slots are unused in the busiest
hours of the day.
3.56 Despite these constraints, the UK aviation sector continues to perform well.
Available seat capacity and the number of destinations served out of UK airports
remain higher than from any comparable European country, as can be seen in
Figures 3.12 and 3.13.
Figure 3.12: UK has more seats available on a daily basis than any other European country
Seat capacity available daily, 2003–2013
2003
150
100
50
2004 2005
Num
ber o
f sea
ts (m
illion
s)
2006 2007 2008 2009 2010 2011 2012 2013
Great Britain Netherlands France Germany SpainSource: CAA analysis based on OAG data

79
Chapter 3 The UK airports sector
Figure 3.13: UK serves more destinations on a daily basis than any other European country
Number of destinations served daily, 2003–2013
2003
250
200
150
100
502004 2005
Num
ber o
f Des
tinat
ions
2006 2007 2008 2009 2010 2011 2012 2013
Great Britain Netherlands France Germany SpainSource: CAA analysis based on OAG data
3.57 Heathrow continues to serve the largest number of international passengers of any
airport in the world. Over the past five years, international passenger numbers have
risen at Heathrow from roughly 61.5 million in 2008 to 65 million in 2012 – this
compares to 56 million at Paris Roissy-Charles de Gaulle, and 51 million at both
Frankfurt and Amsterdam Schiphol in 2012.53
The effects of constraining capacity
3.58 Nonetheless, some negative effects from constraints on capacity at the UK’s key
airports are beginning to be felt, and these may become more widespread and
severe over time. These include impacts on resilience, fares, air connectivity, the
UK’s international hub status, and the wider economy.
Resilience and delays
3.59 In the immediate term, the most significant effect of operating at the limits of
available capacity is reduced airport resilience. This can result in more regular and
substantial delays for passengers.
3.60 The day-to-day operational performance of an airport needs to be resilient to
unforeseen events, whether they arise from airline behaviour or from extraneous
53 ICAO data of top 25 airports ranked by international passengers in 2012 and earlier where available

80
events such as fog, low visibility, or strong winds. The capacity constraints at
Heathrow are currently limiting the airport’s ability to respond to such events.
3.61 In 2008 the CAA commissioned a report into the resilience of the UK’s runways.54
This found that during the period April 2007 to March 2008, Heathrow suffered 13
days when arrivals capacity was restricted to less than 90% of the norm (disastrously
disrupted with 2000 cancelled flights) and a 47 further days when the flow of both or
either of arrivals and departures was severely restricted (significant but recoverable
disruption). In contrast, Gatwick suffered no such days, due in part to the availability
of spare capacity on its runway which could be used as a ‘buffer’ to recover from
delays. As growing demand sees capacity at Gatwick and other airports increasingly
constrained, the issues already experienced at Heathrow will be felt more widely.
3.62 As shown in Figure 3.14, Heathrow currently performs slightly worse than its
European hub competitors in terms of delay for arriving and departing services, except
for Madrid for arrivals. In contrast, following the opening of its fourth runway in October
2011, Frankfurt Airport saw an immediate boost in its reliability, with on-time arrival
performance rising by 14%.55 In 2012, its annual on-time performance rose above
80% for the first time since it began keeping records in 1997,56 and it did not feature in
Eurocontrol’s list of the top 20 worst performing airports for arrivals. In contrast, both
Heathrow and Gatwick were in the top 6 airports on both measures.57
54 CAA, ‘UK Runway Resilience Study: Final Report’, http://www.caa.co.uk/docs/589/ICF_runway_resilience_final_report_16Feb09.pdf
55 http://www.lufthansagroup.com/en/press/news-releases/singleview/archive/2012/january/30/article/2073.html 56 FRAport AG (2013), ‘The City at the Gates of Frankfurt’, http://www.fraport.de/content/fraport/de/misc/binaer/presse/
aviaton-world-1-2013/jcr:content.file/fra_aviation_world_0113_4view_130304b.pdf 57 Eurocontrol (2012), ‘CODA Digest: Delays to Air Transport in Europe’, http://www.eurocontrol.int/sites/default/files/content/
documents/official-documents/facts-and-figures/coda-reports/CODA-Digests-2012/coda-digest-annual-2012.pdf

81
Chapter 3 The UK airports sector
Figure 3.14: In 2012 Heathrow had a high average delay per departure and arrival compared to other European hubs58
Average delay per departure and arrival, selected European hubs in 2012
0
5
10
15
20
25
MadridParis CDGFrankfurtHeathrowAmsterdam
Average delay per departure
10.1 9.5
12.7 13.0
10.29.1
11.7
9.411.6
14.3
min
utes
Average delay per arrival
Source: CODA (December 2013) by Eurocontrol
3.63 Delays, cancellations and unreliability impose costs on passengers and airlines, and
ultimately on the wider economy. Longer flight times leave passengers spending
time in the air that could be used more productively or enjoyably. Cancelled flights
cause frustration and wasted journeys. And uncertainty about arrival and departure
times leads to inconvenience and can leave travellers stranded on the runway or in
the departure lounge. These issues have environmental consequences, for example
in terms of increased emissions as aircraft are required to spend time in holding
stacks awaiting the opportunity to land. At Heathrow, they also impact on local
residents, as respite from noise is reduced when both runways have to be used for
arrivals and departures in order to recover from delays.
3.64 Some of these effects can be monetised to calculate the costs of failing to improve
reliability by addressing capacity constraints. Chapter 5 shows that the
implementation of a package of short-term measures to improve airspace and
runway operations could deliver benefits to airlines and passengers with a net
present value of more than £2 billion over the period to 2030. The Commission has
also used a similar methodology to calculate the economic costs that could be
incurred if, having implemented the package of short-term measures, no further
action was taken to deal with capacity constraints in the London airport system.
58 The Eurocontrol figures are based on performance against published timetables, and do not take into account the additional time built into schedules for flights into Heathrow to allow for the regular use of holding stacks to manage arrivals onto the airport’s runways. This is discussed in more detail in Chapter 5

82
It estimates that these costs would have a present value of approximately
£1.8 billion over the period from 2021 to 2080.59
Costs of travel
3.65 As well as affecting an airport’s resilience, capacity constraints may also affect the
fares that passengers pay for travel. In any market, prices are higher when demand
outstrips supply. In the aviation market, if the supply of available seats is limited,
whether that be through constraints on airline or airport capacity, it can be expected
that the price paid, either by the passenger through air fares or the airline through
airport charges, will be higher. With Heathrow’s runways full, and other UK airports,
particularly in London and the South East, forecast to fill up over the coming
decades, this would imply that there is potential for prices to rise as capacity
constraints bite.
3.66 Identifying effects of this kind is challenging given the range of factors that will have
an impact on fares, including fuel costs, fluctuations in demand and competition.
PwC, on behalf of the Commission, have undertaken research which attempts to
isolate the effect of capacity constraints on fares.60 This study used fare data from
Sabre Airport Data Intelligence for a selection of European airports61 (a mix of
constrained and unconstrained62) and conducted an econometric analysis to
examine the relationship.
3.67 The study found that capacity constraints are associated with higher fares. Including
all airports and routes, fare revenue per passenger mile is found to be on average
18% higher for constrained airports than unconstrained. The difference is even
higher on premium routes. When the UK market is considered in isolation the effect
is still significant but lower at around 10%. These results should be treated with
caution as although the research did identify higher fares at constrained airports,
it did not establish a causal relationship.
International Connectivity
3.68 A number of stakeholders have argued that the capacity constraints faced by
Heathrow are significantly affecting the UK’s level of international connectivity, and
that other countries, whose hub airports are less constrained, are rapidly catching
up with or overtaking the UK.
59 This figure is likely to be an underestimate of the potential value of reducing delays. It does not include the value of noise respite and lower CO2 emissions (from less stacking) and using standard DfT methodology would most likely produce a higher figure
60 PwC analysis, “Fare differentials”, available on the Airport Commission’s website61 All airports with scheduled services in France, Spain, Italy, Germany, the Netherlands and the United Kingdom were
included in the analysis62 Constrained airports were defined as those operating at above 95% of their ATM capacity in any given year

83
Chapter 3 The UK airports sector
3.69 These concerns should be put in perspective. Heathrow Airport’s ‘One Hub or
None’ report highlights 26 emerging market destinations that are served daily by
other European hubs but not from Heathrow.63 Six of these, however, are services
to second-tier airports in Poland, which are operated by low-cost airlines from other
London airports and five are short-haul leisure destinations served from other
London airports.64 Two of the long-haul destinations cited are already served from
Gatwick with a third to be introduced in 2014, and a further four are served from
Heathrow, but fewer than seven times a week.65 This leaves only eight remaining
destinations with no current or forthcoming direct service from London.66
3.70 An equivalent list of destinations currently served from Heathrow but not from any
other European hub can equally be compiled. In 2013 it would include both
emerging market destinations such as Dhaka, Freetown, Hyderabad and Karachi,
and North American destinations such as Raleigh/Durham, Edmonton, Phoenix and
San Diego.67
3.71 Nonetheless, there is some validity in the argument. Although Heathrow remains
the world’s busiest international airport, its total route network is less extensive than
those of all the other main European hubs, and its long-haul route network smaller
than all except for Madrid. Figure 3.15 shows that Frankfurt and Paris Charles de
Gaulle have for some time offered a higher number of long-haul destinations than
Heathrow, and more recently Heathrow has also been overtaken by Dubai
International and Amsterdam Schiphol.
63 Heathrow Airport Ltd. ‘One Hub or None’, http://mediacentre.heathrowairport.com/Media-library/One-hub-or-none-451.aspx64 The six Polish cities are Gdansk, Katowice, Krakow, Poznan, Rzeszow and Wroclaw. The five short-haul leisure destinations
are Antalya, Bodrum, Dalaman, Hurghada and Izmir65 Hanoi, Ho Chi Minh City and (in 2014) Jakarta; and Chennai, Guangzhou, Manila and Tehran, respectively66 The eight remaining destinations are Ankara, Bogota, Caracas, Dammam, Denpasar, Lima, Port Harcourt and Santiago67 CAA Analysis for Airports Commission

84
Figure 3.15: Dubai International has seen a dramatic increase in long-haul destinations served since 2003
Changes in number of long-haul destinations at major airports
2003
160
120
80
402004 2005
Num
ber o
f des
tinat
ions
2006 2007 2008 2009 2010 2011 2012 2013
LondonHeathrow
Amsterdam Charlesde Gaulle
Frankfurt Madrid Dubai
Source: PwC analysis based on Sabre ADI
3.72 Dubai International has seen particularly rapid growth in international passenger
numbers. It is now second only to Heathrow, and forecast to overtake it in the next
two years if recent rates of growth are maintained.
3.73 In relation to the number of destinations to emerging markets, which is an important
issue for business passengers, the Commission has examined Heathrow’s
connections to both the BRIC nations (Brazil, Russia, India and China) and a group
of a further thirteen countries drawn from the Next 11 and CIVET groupings
proposed by Goldman Sachs and the Economist Intelligence Unit respectively.68
In respect of the BRIC countries, as seen in Figure 3.16(a), Heathrow has a strong
route network into India compared to other European hubs, but has fewer
connections than some other European hubs to Brazil, mainland China and Russia.
3.74 The same broad pattern is seen in relation to the second group of emerging market
countries. Heathrow’s comparative strengths are in relation to destinations in
southern Asia (Pakistan and Bangladesh) and other Commonwealth nations, such
as Nigeria and South Africa, whereas it performs less well in relation to destinations
in Latin America and the Far East.
68 This group of thirteen includes Bangladesh, Colombia, Egypt, Indonesia, Iran, Mexico, Nigeria, Pakistan, Philippines, South Africa, South Korea, Turkey and Vietnam
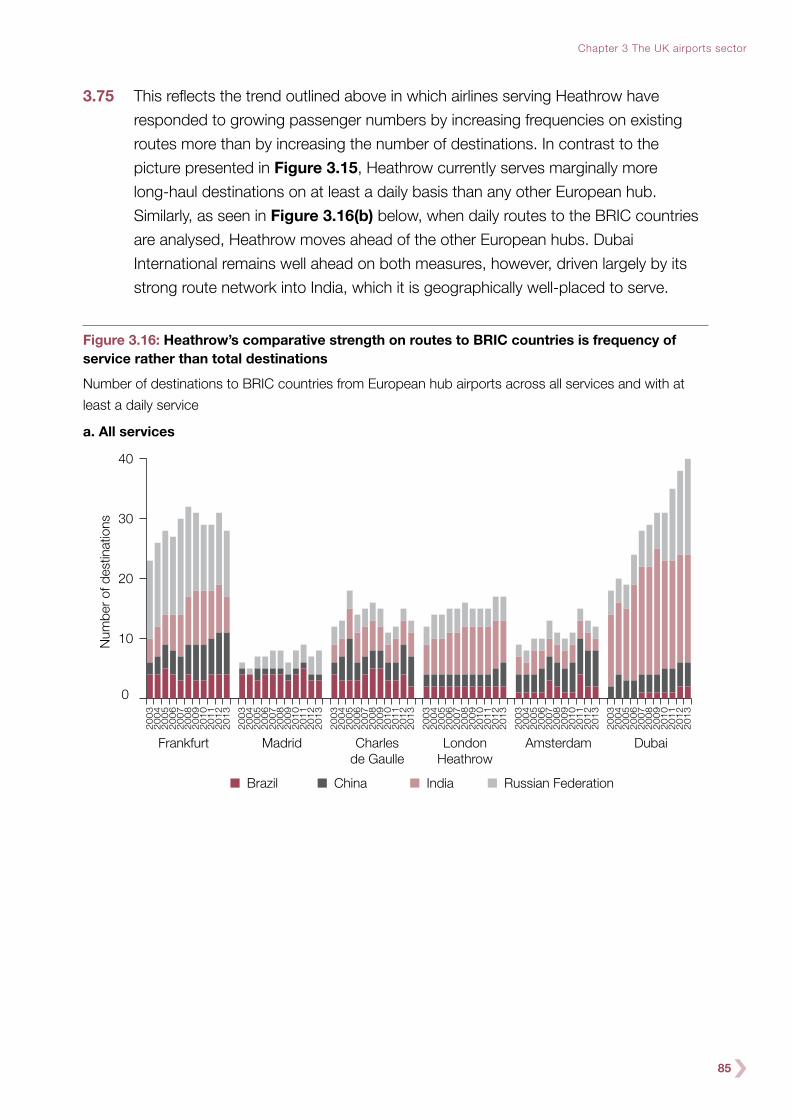
85
Chapter 3 The UK airports sector
3.75 This reflects the trend outlined above in which airlines serving Heathrow have
responded to growing passenger numbers by increasing frequencies on existing
routes more than by increasing the number of destinations. In contrast to the
picture presented in Figure 3.15, Heathrow currently serves marginally more
long-haul destinations on at least a daily basis than any other European hub.
Similarly, as seen in Figure 3.16(b) below, when daily routes to the BRIC countries
are analysed, Heathrow moves ahead of the other European hubs. Dubai
International remains well ahead on both measures, however, driven largely by its
strong route network into India, which it is geographically well-placed to serve.
Figure 3.16: Heathrow’s comparative strength on routes to BRIC countries is frequency of service rather than total destinations
Number of destinations to BRIC countries from European hub airports across all services and with at
least a daily service
a. All services
0
10
20
30
40
2013
2012
2011
2010
2009
2008
2007
2006
2005
2004
2003
2013
2012
2011
2010
2009
2008
2007
2006
2005
2004
2003
2013
2012
2011
2010
2009
2008
2007
2006
2005
2004
2003
2013
2012
2011
2010
2009
2008
2007
2006
2005
2004
2003
2013
2012
2011
2010
2009
2008
2007
2006
2005
2004
2003
2013
2012
2011
2010
2009
2008
2007
2006
2005
2004
2003
Num
ber
of d
estin
atio
ns
Brazil China India Russian Federation
Frankfurt Madrid Charlesde Gaulle
LondonHeathrow
Amsterdam Dubai

86
b. At least daily services
0
5
10
15
20
25
2013
2012
2011
2010
2009
2008
2007
2006
2005
2004
2003
2013
2012
2011
2010
2009
2008
2007
2006
2005
2004
2003
2013
2012
2011
2010
2009
2008
2007
2006
2005
2004
2003
2013
2012
2011
2010
2009
2008
2007
2006
2005
2004
2003
2013
2012
2011
2010
2009
2008
2007
2006
2005
2004
2003
2013
2012
2011
2010
2009
2008
2007
2006
2005
2004
2003
Brazil China
Num
ber
of d
estin
atio
ns
India Russian Federation
Frankfurt Madrid Charlesde Gaulle
LondonHeathrow
Amsterdam Dubai
Source: CAA analysis based on OAG data
3.76 While the range of destinations offered is important, so is frequency of service,
particularly for business travellers who may have less flexibility in the timing of their
journeys. It is therefore important to take both factors into account.
3.77 In order to assess the overall strength of connectivity at Heathrow compared to less
constrained hubs, as well as the broader connectivity of the London and UK airport
systems, the Commission has drawn on methodology developed by IATA. This
derives a measure of connectivity through combining destinations served and total
seats available, weighted by the economic value of the destinations.69 Two
approaches to measuring economic value have been tested: the size of the aviation
market in each destination (as used by IATA) and – to test connectivity to the most
important future markets – forecast GDP on the basis of the IMF’s 2013-18 growth
projections.70
3.78 On both indicators, Heathrow has performed well in comparison to other European
hubs over the past decade despite its capacity constraints. This applies to both
total connectivity and long-haul connectivity, and is driven by the very high
frequencies that Heathrow offers to economically valuable destinations. For
example, using IMF GDP weights, Heathrow’s strong links to North America make a
69 The Commission conducted the analysis of these measures to address issues highlighted in response to the ‘Aviation Connectivity and the Economy’ discussion paper
70 The Commission has tested this analysis further using current IMF data and 2013-18 and 2040-50 growth projections from PwC’s (2013) ‘World in 2050’, http://www.PwC.com/en_GX/gx/world-2050/assets/PwC-world-in-2050-report-january-2013.pdf. The results in each case were broadly in line with those calculated using the IMF projections
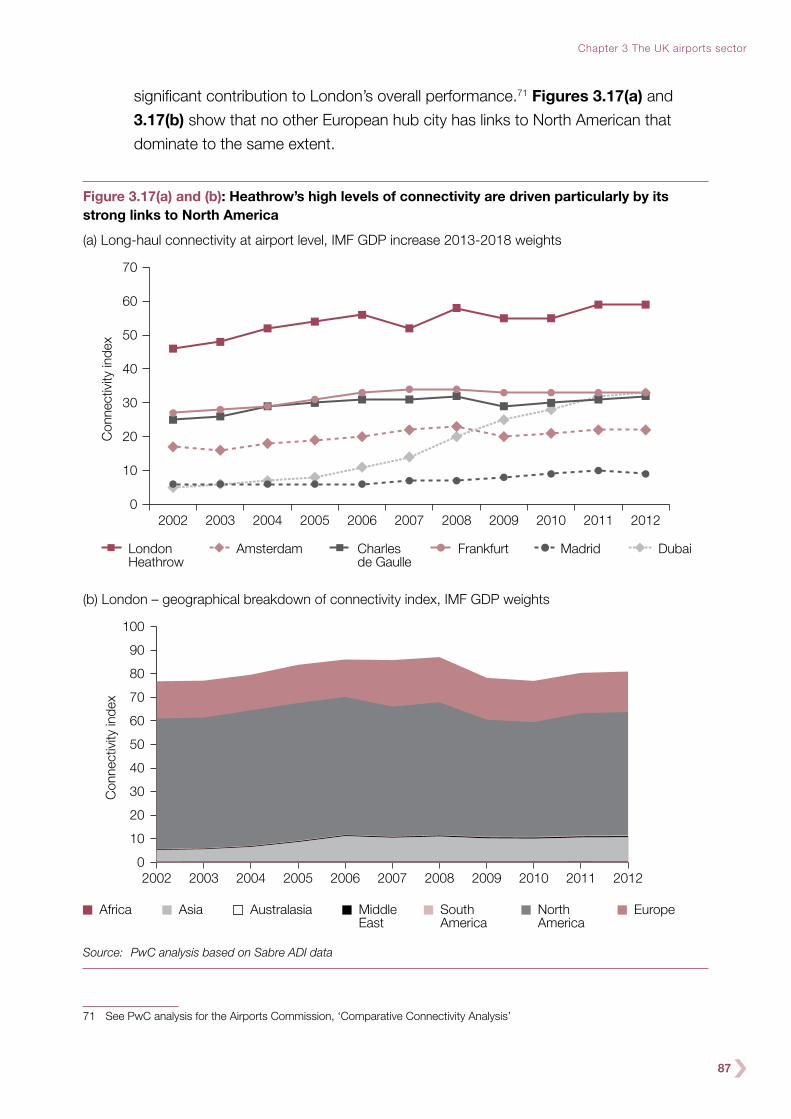
87
Chapter 3 The UK airports sector
significant contribution to London’s overall performance.71 Figures 3.17(a) and
3.17(b) show that no other European hub city has links to North American that
dominate to the same extent.
Figure 3.17(a) and (b): Heathrow’s high levels of connectivity are driven particularly by its strong links to North America
(a) Long-haul connectivity at airport level, IMF GDP increase 2013-2018 weights
Con
nect
ivity
inde
x
0
10
20
30
40
50
60
70
20122011201020092008200720062005200420032002
LondonHeathrow
Amsterdam Charlesde Gaulle
Frankfurt Madrid Dubai
(b) London – geographical breakdown of connectivity index, IMF GDP weights
Con
nect
ivity
inde
x
Africa
0
10
20
30
40
50
60
70
80
90
100
20122011201020092008200720062005200420032002
Asia Australasia MiddleEast
SouthAmerica
NorthAmerica
Europe
Source: PwC analysis based on Sabre ADI data
71 See PwC analysis for the Airports Commission, ‘Comparative Connectivity Analysis’
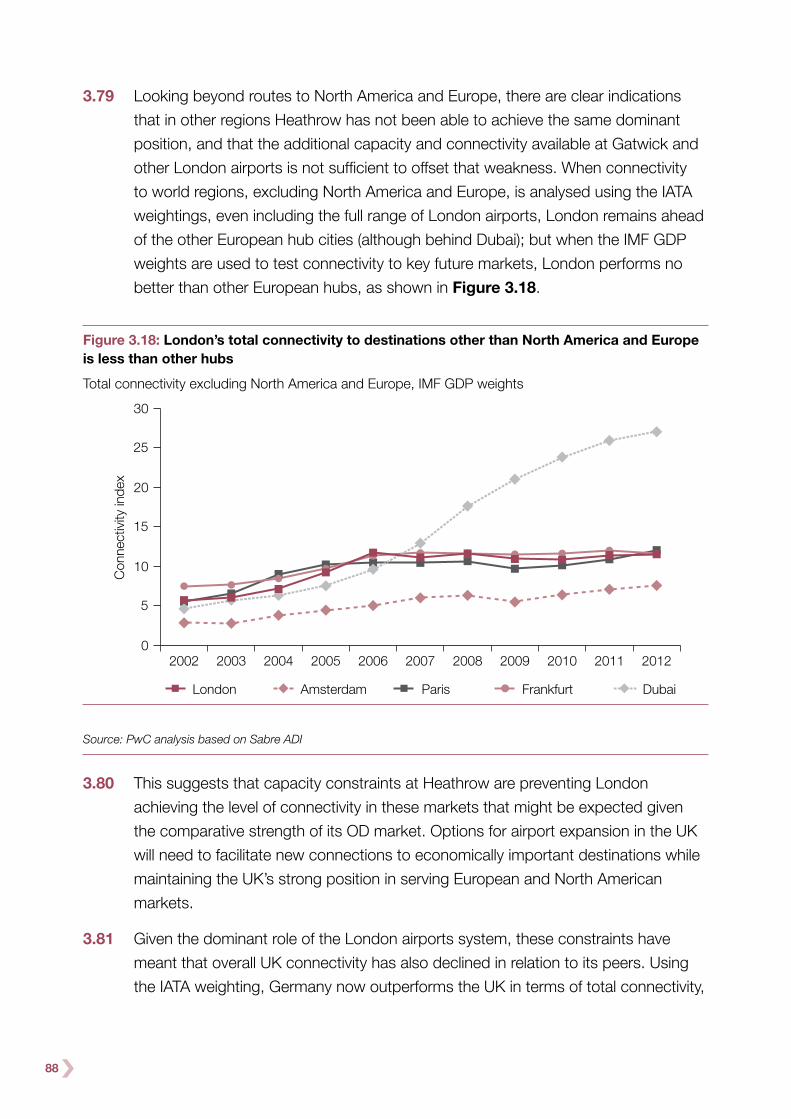
88
3.79 Looking beyond routes to North America and Europe, there are clear indications
that in other regions Heathrow has not been able to achieve the same dominant
position, and that the additional capacity and connectivity available at Gatwick and
other London airports is not sufficient to offset that weakness. When connectivity
to world regions, excluding North America and Europe, is analysed using the IATA
weightings, even including the full range of London airports, London remains ahead
of the other European hub cities (although behind Dubai); but when the IMF GDP
weights are used to test connectivity to key future markets, London performs no
better than other European hubs, as shown in Figure 3.18.
Figure 3.18: London’s total connectivity to destinations other than North America and Europe is less than other hubs
Total connectivity excluding North America and Europe, IMF GDP weights
0
5
10
15
20
25
30
20122011201020092008200720062005200420032002
London Amsterdam
Con
nect
ivity
inde
x
Paris Frankfurt Dubai
Source: PwC analysis based on Sabre ADI
3.80 This suggests that capacity constraints at Heathrow are preventing London
achieving the level of connectivity in these markets that might be expected given
the comparative strength of its OD market. Options for airport expansion in the UK
will need to facilitate new connections to economically important destinations while
maintaining the UK’s strong position in serving European and North American
markets.
3.81 Given the dominant role of the London airports system, these constraints have
meant that overall UK connectivity has also declined in relation to its peers. Using
the IATA weighting, Germany now outperforms the UK in terms of total connectivity,
89
Chapter 3 The UK airports sector
and using the IMF weighting, the UK’s lead over Germany has been significantly
narrowed, as it has in relation to long-haul connectivity.
3.82 It is also noticeable that as capacity constraints at Heathrow have tightened, British
Airways has not grown as rapidly as its competitors. Between 2002 and 2012,
BA increased the overall capacity of its route network, measured in available
seat-kilometres, by 14%, whereas Lufthansa increased its network by 50%,
KLM by 37% and Air France by 29%.72
3.83 This effect is also apparent in the Airports Commission’s forecasts (see Chapter 4),
which provide a further indication of the potential impacts of capacity constraints on
connectivity. They show that if runway capacity constraints were alleviated, the size
of the UK’s overall long-haul route network (again measured in available seat-
kilometres) would increase by 7-10% in 2030 and by 7-17% in 2040, depending on
the assumption made in relation to constraints on carbon emissions. The impact
becomes less strong by 2050, as the market for long-haul travel from regional
airports grows, but it does not disappear.
3.84 Addressing capacity constraints may not on its own lead to a significant increase in
connectivity. The wider economic context may play a role: for example, Frankfurt
has not seen any material growth in destinations served or flight frequencies since
the opening of its fourth runway in October 2011, with any benefits currently
deriving from improvements in resilience and punctuality. Furthermore, the airport
has delayed the construction of its third terminal. Other factors may also influence
the level of additional connectivity which can be achieved, including aircraft
availability, bilateral air services agreements with key states and wider policies in
areas such as immigration and fiscal policy.
Domestic Connectivity to London
3.85 Capacity constraints at Heathrow have also affected domestic connectivity to the
airport. While other hubs are attracting more transfer traffic from the UK, Heathrow
remains a key access point to international and long-haul travel for many
passengers from other UK airports. The number of domestic destinations served
from Heathrow has, however, been steadily declining over a number of years, as
shown in Figure 3.19. By 2040, unless capacity is expanded, the Commission
forecasts that the number of domestic destinations served daily from Heathrow will
have fallen further to only four.
72 IATA. In comparison, Emirates increased its network by 480% over the same period

90
Figure 3.19: The number of UK destinations served from Heathrow has steadily decreased since 1990
Number of UK destinations with a direct service from 1990-201273
0
5
10
15
20
2012
2011
2010
2009
2008
2007
2006
2005
2004
2003
2002
2001
2000
1999
1998
1997
1996
1995
1994
1993
1992
1991
1990
At least weekly
Num
ber
of U
K d
estin
atio
ns
At least daily
Source: DfT analysis based on CAA airport statistics
3.86 The Commission has received a number of submissions from stakeholders about
the importance of these links.74 Connections to other hubs in Europe and the Gulf
are a welcome addition to the connectivity available from the UK’s regional airports,
but they are not generally considered to be a replacement for links to Heathrow.
Heathrow offers strong connectivity to a number of important markets, particularly
in North America, which is hard to replicate elsewhere.
3.87 In terms of overall connectivity, whereas London’s connectivity is on a clear upwards
trend since the effects of the recession, the weakening in links to Heathrow has
contributed to a continuing decline in connectivity as measured using the IMF
weightings.
The UK’s hub status
3.88 The strength of Heathrow’s route network is underpinned by the airport’s transfer
passengers, who account for around a third of the airport’s overall passenger
numbers. Many of the airport’s routes to emerging market destinations and smaller
North American cities would be unlikely to be viable without transfer traffic to
supplement domestic demand.
73 Definition of a weekly service is at least 52 passenger flight departures to that destination in a year. Definition of a daily service is at least 362 passenger flight departures in a year to that destination
74 See ‘Aviation Connectivity and the Economy’ discussion paper

91
Chapter 3 The UK airports sector
3.89 The European transfer market has faced increased competition over the past
decade from the newly established hubs in the Middle East and particularly from
Dubai, whose market share75 increased from 7% to more than 20% between 2002
and 2012, while the only European hub to maintain its market share was
Amsterdam Schiphol.
3.90 In some segments of the market this is inevitable. The Gulf hubs are well-placed
geographically to serve destinations in India and the Middle East and have built up
significant route networks in these regions. As a result, they are capturing increasing
market share. For example, Dubai’s share of transfer traffic on routes between
the west coast of the US and India increased from 12% to 50% between 2002
and 2012.
3.91 There are, however, market segments in which European hubs can compete more
effectively. These include routes from other European cities to a wide range of
long-haul destinations and between the east coast of the US and the Far East
(where no direct route is available). The distance from Boston to Shanghai, for
example, is nearly 20% further via Dubai than via London.76
3.92 Transfer passengers tend to be highly price sensitive as they often have more
choice in how to make their journey than those flying direct. A transfer passenger
from New York to Seoul could potentially travel via airports as varied as Frankfurt,
Los Angeles, Helsinki or Dubai as well as Heathrow, each served by a different
airline. For this reason, transfer passengers may choose to fly via other hubs, as
origin and destination demand increases and prices rise at capacity constrained
airports. As such demand is more likely to be concentrated on the most profitable
routes, this may have a negative effect on growth in the overall route network.
3.93 Although Heathrow has broadly maintained the proportion of transfer passengers
carried as a percentage of the whole over recent years, the above pattern of
concentration on key routes is already evident, as discussed earlier in this chapter.
Furthermore, the Commission’s forecasts suggest that if capacity constraints at the
airport are not alleviated, the number of transfer passengers at the airport will first
stagnate and then decline. This sees transfer passengers drop from 22.6 million in
2011 to less than 4 million in 2050, and the number of destinations served from the
airport fall by roughly 20% over the same period.
75 Drawn from PwC analysis ‘Historical trends in international-to-international interliners’. The total transfer market share is defined as the sum of market shares of airports in Amsterdam Schiphol, Dubai, Frankfurt, London Heathrow and Paris Roissy-Charles de Gaulle
76 Figures calculated using Great Circle Mapper, www.gcmap.com

92
3.94 To support its consideration of the role played by transfer passengers in supporting
UK connectivity, the Commission also undertook a forecast of future destinations
served if international transfer passengers are removed from the UK market
altogether. This indicated a significant reduction in destinations served from UK
airports, with the most significant effects are seen around 2030, as beyond that
point OD traffic begins to build up to the point that it can support some of the lost
routes towards the end of the forecast period. This analysis is described in more
detail in Appendix 3: Technical Appendix.
Impacts on the economy
3.95 The Commission has investigated the economic costs of constraining aviation
capacity. Its research and analysis has been informed by responses to the
Commission’s March 2013 discussion paper Aviation Connectivity and the
Economy77 and is described in more detail in Appendix 3: Technical Appendix.
The potential impacts are considered at three levels:
1) The economic costs and benefits for providers (airports and airlines) and users
(passengers) resulting from a constrained airport system;
2) The direct economic impacts on business associated with constrained airport
capacity, including impacts on trade, foreign direct investment (FDI) and tourism;
and,
3) The wider impacts on the economy associated with changes in trade, investment
and tourism.
3.96 Previous Government studies looking at the case for additional airport capacity
have focused primarily on the first of these impacts. Those costs and benefits are
significant, but it is important to take a wider perspective which considers not only
the immediate effects on airlines and passengers of capacity constraints, but also
how they are transmitted through the wider economy, as presented in Figure 3.20.
77 Airports Commission, Aviation Connectivity and the Economy discussion paper, March 2013, http://www.gov.uk/government/publications/discussion-paper-on-aviation-connectivity-and-the-economy
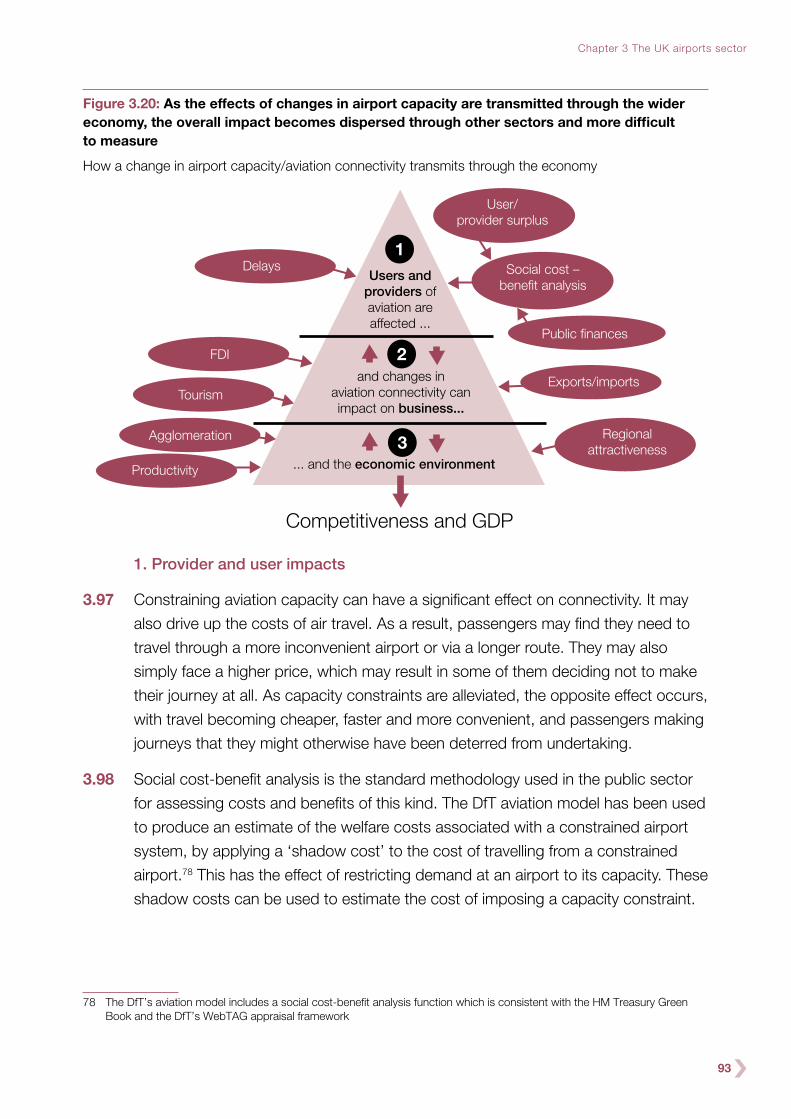
93
Chapter 3 The UK airports sector
Figure 3.20: As the effects of changes in airport capacity are transmitted through the wider economy, the overall impact becomes dispersed through other sectors and more difficult to measure
How a change in airport capacity/aviation connectivity transmits through the economy
Delays
FDI
Users andproviders ofaviation areaffected ...
and changes inaviation connectivity canimpact on business...
... and the economic environment
Tourism
Agglomeration
Productivity
Competitiveness and GDP
User/provider surplus
Social cost –benefit analysis
Public finances
Exports/imports
Regionalattractiveness
2
3
1
1. Provider and user impacts
3.97 Constraining aviation capacity can have a significant effect on connectivity. It may
also drive up the costs of air travel. As a result, passengers may find they need to
travel through a more inconvenient airport or via a longer route. They may also
simply face a higher price, which may result in some of them deciding not to make
their journey at all. As capacity constraints are alleviated, the opposite effect occurs,
with travel becoming cheaper, faster and more convenient, and passengers making
journeys that they might otherwise have been deterred from undertaking.
3.98 Social cost-benefit analysis is the standard methodology used in the public sector
for assessing costs and benefits of this kind. The DfT aviation model has been used
to produce an estimate of the welfare costs associated with a constrained airport
system, by applying a ‘shadow cost’ to the cost of travelling from a constrained
airport.78 This has the effect of restricting demand at an airport to its capacity. These
shadow costs can be used to estimate the cost of imposing a capacity constraint.
78 The DfT’s aviation model includes a social cost-benefit analysis function which is consistent with the HM Treasury Green Book and the DfT’s WebTAG appraisal framework

94
3.99 The results from our analysis indicate that the costs of capacity constraints could
be roughly in the region of £18 billion to £20 billion in present value terms between
2021 and 2080,79 including the costs associated with delays.
3.100 The appraisal framework underpinning that valuation is highly stylised and does
not account for all of the complexities of how the airline industry operates and how
airline pricing structures may affect passengers. In reality, the costs of capacity
constraints are likely to be reflected in reductions in the number of available
destinations, less convenient schedules, and less competition between different
carriers, all of which adversely affect passengers but are not fully captured by the
appraisal framework. It also excludes some important factors which would be
included in an appraisal of specific capacity options. For example, environmental
impacts, surface access requirements and impacts on the air freight market are
not assessed.
2. Direct business impacts
3.101 In addition to these immediate impacts on passengers, airport capacity constraints
may be associated with direct economic impacts upon trade, FDI and tourism.
The Commission has undertaken further research in these areas to supplement the
previous analysis set out in its Aviation Connectivity and the Economy discussion
paper, drawing on literature and commissioning an econometric study to consider
these links in more detail.
3.102 A review of the literature on trade confirmed that greater connectivity, by air and
other means, creates better access to foreign markets by providing cheaper and
easier business travel. One study found that such connectivity was found to have
led to greater sales efforts in those countries and that more easily available direct
client contact plays an important role in increasing trade.80
3.103 Trade in services is particularly important to the UK economy and those sectors
with the highest propensity to fly are often of significant economic value. For
example, the financial sector, which had Gross Value Added of £125 billion in
2011,81 makes 28% of UK service exports (and 23% of total global financial
exports). UK business services exports followed closely behind with a 27% share.82
Both sectors see an extremely high level of expenditure on aviation services.
Exports of services have generally outweighed imports since 1983, making a
substantial positive impact on the UK trade balance.
79 2012 prices. The low end of this range is the cost with a carbon cap in place; the high end is with a traded carbon scenario80 Poole, J (2010) “Business travel as an input to international trade”, UC Santa Cruz81 www.parliament.uk/briefing-papers/sn06193.pdf82 BIS (Feb 2012) “UK trade performance across markets and sectors”

95
Chapter 3 The UK airports sector
3.104 Air transportation is also an important facilitator of trade in goods. Although UK
exports of goods are lower than those of some comparable European countries,
the UK is doing relatively well in particular high-tech sectors, such as
pharmaceuticals and high-tech machinery. These sectors depend heavily on air
freight which accounted for 31% of the UK’s total non-EU imports and 46% of the
UK’s total non-EU exports in value terms in 2011.83
3.105 In addition, aviation can play an important role in attracting foreign direct
investment. The FDI literature concludes that improvements in infrastructure do
stimulate FDI, though the magnitude of this effect varies widely.84 This relationship
can clearly be seen, however, when considering activity around Heathrow and along
the M4 corridor, where a number of multinational companies, such as
GlaxoSmithKline and Microsoft, have located headquarters.
3.106 The link between aviation connectivity and FDI is supported by survey evidence and
some empirical studies.85 Strauss-Kahn and Vives (2009), for example, found that
the probability of firms in the US relocating to a particular location increased by 90%
if there is large airport nearby or 40% if there is a small airport.86
3.107 Tourists coming to the UK support its GDP through their holiday expenditure.
In 2012 alone visitors from abroad spent just under £19 billion in the UK, 84% of
which was attributed to those who arrived by air.87 Visitors travelling long distances
nearly all travel by air, and those tourists tend to spend more per day than European
visitors.
3.108 The value of outbound tourism from the UK was £32 billion in 2012, negatively
affecting the overall UK trade balance.88 The UK, however, is not the only country
with a tourism trade, deficit: so are other developed countries whose citizens travel
a lot. Outbound tourism also brings benefits in relation to quality of life, and through
supporting routes which are also of benefit to business travellers.
3.109 The Commission’s econometric study examined the links between aviation
connectivity and trade, FDI and tourism. For trade and tourism, it was based on
data over the past decade from 164 and 45 countries respectively.89 In relation to
FDI, the study looked at total UK FDI and regional FDI broken down by the former
83 HMRC analysis84 NERA (2009), “Transport’s Role in Facilitating International Business”, version. 26th Jan 200985 Bel, G. & Fageda, X. (May 2008) “Getting there fast: globalisation, intercontinental flights and locations of headquarters”,
Journal of Economic Geography, No. 8, P. 471-49586 Strauss-Kahn, V. and Vives, X (September 2009) “Why and where do headquarters move?”, IESE Business School –
University of Navarra Working paper no.65087 ONS IPS 201288 Ibid89 The study also attempted to establish the links between aviation connectivity and migration, but no dataset could be
identified which would provide statistically significant results

96
Government Office Regions. UK seat capacity was used as a proxy for aviation
connectivity and the approach accounted for other influencing factors. The
magnitude of the links and statistical significance varied but a positive relationship
was identified in each case, with a 10% increase in seat capacity between the UK
and any other given country being associated with an increase in activity of between
1% and 7% across the various areas.
3.110 The relationships found in the Commission’s research support the view that
connectivity by air may play an important role in enabling trade and tourism,
and facilitating foreign investment in the UK. The study is not, however, location
or country specific and the effects may in reality differ between destinations.
An increase in short-haul leisure services to destinations such as Ibiza or Crete may
have no noticeable impact on trade or FDI, whereas other destinations will be likely
to increase trade by a much larger extent. For example, the Department for
Business Innovation and Skills found that on average each flight from Heathrow to
a BRIC country carries more than £400,000 in goods exports, with flights to China
averaging more than £1 million.90
3.111 Furthermore, this study took seat capacity as a proxy for connectivity in assessing
the effects of capacity constraints. In practice the cost of the constraint would
manifest itself in many different ways, such as less attractive travel options,
although airlines would seek to make best use of the limited capacity available
in a constrained system.
3.112 The results should be read with caution as they do not necessarily imply causality,
but they do suggest positive relationships between seat capacity and trade, FDI
and tourism. This could mean that an increase in seat capacity provides more
scope for trade, that growth in trade increases the need for seat capacity, or some
combination of the two. Regardless, this implies that any constraints on the
capacity of the aviation sector may hinder the UK’s ability to develop new trade or
foreign investment opportunities or to reap the benefits when such opportunities
arise in other ways.
3. Wider economy impacts
3.113 The direct economic impacts on trade, FDI and tourism can further impact the
economy through ‘spillovers’, such as productivity improvements and positive
agglomeration effects. In most cases these impacts can be considered additional to
the direct economic impacts.
90 BIS analysis of HMRC Overseas Trade Statistics

97
Chapter 3 The UK airports sector
3.114 The Commission has undertaken a literature review to investigate the strength and
nature of the link between the direct impacts of connectivity (and hence, capacity
constraints) and their effects on the wider economy. While the wider economic
impacts of tourism were found to be small, the literature review identified a clear
consensus that increased trade and FDI (both inbound and outbound) would drive
broader improvements in productivity.
Connectivity impacts on GDP
3.115 The Commission has also sought to identify broader GDP impacts of aviation
capacity constraints.
3.116 Many previous studies have attempted to value the GDP benefits of increasing
aviation connectivity or the costs to the economy of a capacity constraint. These
estimates vary dramatically – from as little as £9 billion to £13 billion over 60 years91
to as much as £8.5 billion a year by 2021.92
3.117 While the findings of these studies indicate that capacity constraints could have a
negative impact on the economy, the wide range of estimates suggests that there is
considerable uncertainty surrounding the scale of any such impact. In an attempt to
understand where in this wide range of estimates the evidence is strongest, the
Commission has undertaken additional analysis using Computable General
Equilibrium (CGE) modelling to assess the potential overall economy impact of a
constrained airport system. Box 3f sets out the approach taken in CGE modelling
and outlines its potential applications.
91 British Chambers of Commerce (2009), “Economic Impacts of Hub Airports”92 Oxford Economics (2012), “The value of aviation connectivity to the UK: a report prepared for Heathrow”

98
Box 3f: What is a Computable General Equilibrium model?
Over the past 25 years, Computable General Equilibrium (CGE) models have
become a standard tool of empirical economic analysis, capturing the
economic behaviours of all agents (consumers, producers, Government,
investors, etc.) in the economy. Figure 3.21 shows the economic interactions
between households, businesses and the Government captured in the CGE
model. Each of these institutions is interlinked through either labour market or
capital market flows.
CGE models can be used to undertake scenario analysis to estimate the
impact of a policy change on the whole economy. CGE models capture
detailed sectoral interactions and account for behavioural responses of firms
and households, over both short and long-term horizons. They can therefore
account for the overall impact on the economy from a change in the aviation
sector. This sets CGE models apart from many transport models which are
‘partial equilibrium’, which means that they use standard supply and demand
analysis to find equilibrium in an isolated market.
Figure 3.21: CGE modelling captures the interactions between households, firms and the Government
Government
Firms (local and
multinational
Firms (local and
multinational Household
Goods and services, and wage income
Labour and investment
TaxesTaxes
Transfers Subsidies
Firm purchase goods and services from each other
Firms determine the level of production by maximising profit
3.118 CGE models are well suited to evaluate the national economic impact of a capacity
constraint in the aviation sector and two different CGE models have been used; the
HMRC model and a model owned and operated by PwC. Two different modelling
approaches were used to model the capacity constraint, in order to provide a range
of estimates. In the HMRC model, the change in seat capacity is applied as a
constraint on the aviation sector’s output, which causes the price of aviation to

99
Chapter 3 The UK airports sector
increase and impacts on the rest of the economy. In the PwC model, the constraint
leads to lower productivity in the aviation sector, which impacts on the rest of the
economy.
3.119 The results produced by both models are of a similar magnitude and strongly
support the hypothesis that capacity constraints have negative impacts on GDP.
They indicate that the limited capacity constraints currently being experienced are
unlikely to affect economic activity significantly, but as these become more severe
and a wider range of airports are operating at capacity, the effects on the economy
will be more significant.
3.120 The modelling indicates that by 2030 aviation capacity constraints could depress
GDP by between 0.03% and 0.05%. By 2050, as the London airport system
becomes completely full, the contraction in GDP is higher, between 0.04% and
0.09%. Assuming a standard 60 year period appraisal, as would commonly be
applied to any decision on new infrastructure, the total cost of a capacity constraint,
assuming no action was taken, could amount to between £30 billion and £45 billion
between 2021 and 2080.93 The upper bound of this range is taken from the HMRC
modelling and does not include productivity impacts. The Commission’s literature
review has indicated that productivity impacts would be likely to be felt, further
depressing GDP.94
3.121 Key limitations of this modelling include the fact they are single country models and
are unable to distinguish between the value of different types of seat capacity.95 For
example, an additional leisure flight from Stansted to Malaga would not have
the same value in terms of potential for increased trade or productivity as, say, a
business flight from Heathrow to Shanghai. This is particularly important in a
scenario where a limit on carbon emissions is in place (see Chapter 4) and
therefore the benefits of alleviating capacity constraints are likely to relate more to
the type and value of travel that is enabled than to changes in overall passenger
numbers.
3.122 CGE models account for how consumers and businesses might react and adapt to
a capacity constraint over time, whereas standard transport models commonly
exclude such changes in behaviour. This analysis is helpful in indicating the direction
of the impact and its likely scale. Though the analysis suggests that some of the
effects stated in the literature appear to be overestimated, it does support the view
93 2012 PV year and price base94 The Commission has undertaken some simple additional modelling to attempt to assess the potential effect of incorporating
productivity impacts in the HMRC model. The results of this analysis showed that GDP could contract by to up to 0.17% in 2050. Further details of this analysis can be found in Appendix 3
95 A single country model cannot measure all the possible impacts of a capacity constraint. For example, there may be leakages such as repatriation of profits where there is foreign ownership in the aviation sector
100
that capacity constraints could impose a significant cost on the economy. However,
given the relatively novel approach the Commission has taken, these results should
be interpreted with caution.96
Conclusions
3.123 Heathrow is effectively full and Gatwick is operating at more than 85%. As
passenger demand grows, other airports can also be expected to reach capacity
over the coming decades. The impacts are already being felt in terms of delay and
unreliability, and there is some evidence of an impact on fares. It is also becoming
clear that capacity constraints could mean expansion of new connections to
economically important places are traded off against the UK’s current strong
position serving Europe and North America.
3.124 Nonetheless, the UK does not face an immediate capacity crisis. The London
aviation market continues to be amongst the most attractive and best connected in
the world. Gatwick is responding to the continuing capacity constraints at Heathrow
by opening new long-haul routes to emerging markets and to the United States.
British Airways’ recent acquisition of new slots at Heathrow through its purchase of
BMI will allow it gradually to expand its route network. The low-cost sector will
continue to innovate and introduce new routes at other airports, together with the
long-haul travel opportunities opened up by the Gulf carriers. Measures are being
taken to strengthen the resilience of operations at Heathrow, with a number of
potential further measures identified by the Commission in Chapter 5. Similar
mechanisms may be feasible at other airports as they reach capacity.
3.125 But over time, as capacity constraints propagate through the London and ultimately
UK airport system, with more and more airports becoming full, the negative impacts
will become harder to manage. The timing is discussed further in Chapter 4.
3.126 The analysis presented in this chapter has indicated that the costs of failing to
address these constraints could be substantial. The social cost-benefit analysis
indicates costs with a present value estimate of £18 billion to £20 billion, including
delay costs. There is good evidence to suggest that there are also costs associated
with lost trade, FDI and tourism, and that these are likely to affect wider UK
economic performance. The Commission’s analysis of these wider economy
impacts of capacity constraints on GDP estimated total costs of £30 billion
to £45 billion between 2021 and 2080.
96 Particular caution should be taken in using the results in any cost-benefit analysis. The results would also not be appropriate for any commercial case developed in respect of the private financing of aviation infrastructure, which would consider a different range of inputs

101
Chapter 3 The UK airports sector
3.127 On this basis, the Commission believes that there is a rational economic case for
taking action to address capacity constraints. The next chapter looks in detail at
how demand may develop in the future and sets out the Commission’s
recommendations on the nature, scale and timing of the need for additional
capacity.
102
Chapter 4:
The UK’s long-term capacity requirements
SUMMARY
UK airports have so far adapted well to a changing world, but problems are starting
to emerge, particularly at Heathrow, which is now operating at close to full capacity.
While it is not possible to predict with certainty how soon other UK airports will fill up,
in planning long-lived infrastructure policymakers need to work with some view of the
future, whilst taking account of significant uncertainties.
The Commission has therefore developed a new set of forecasts which improve on
the Department for Transport’s aviation model, including a new approach to dealing
with uncertainty. This addresses many of the issues raised by respondents to the
Commission’s Aviation Demand Forecasting discussion paper.97
Across all scenarios considered, including when the UK is meeting its climate change
targets, there is forecast to be significant growth in demand for aviation between now
and 2050, placing additional pressure on already stressed airport infrastructure in
London and the South East. The London airport system is forecast to be under very
substantial pressure in 2030, and by 2050 sees demand significantly in excess of the
total available capacity.
The Commission’s analysis further suggests that there is relatively little scope to
redistribute this demand away from London and South East airports. A congestion
charge on the UK’s busiest airports, to incentivise airlines to use currently under
utilised infrastructure, would have a negative effect on UK connectivity and capacity.
The scope for other policy levers, such as slot allocation and Traffic Distribution Rules,
to redistribute demand, is very limited.
The Commission therefore concludes that there is a case for at least one net
additional runway in London and the South East by 2030.
97 Airports Commission, ‘Discussion Paper 01: Aviation Demand Forecasting’, February 2013 https://www.gov.uk/government/publications/discussion-paper-on-aviation-demand-forecasting
103
Chapter 4: The UK’s long-term capacity requirements
In terms of the nature of the capacity that is needed, the Commission does not
believe there is a binary choice between providing additional hub capacity or
additional point-to-point capacity. Instead, the optimal approach is to continue to
invest in an airport system that caters for a range of airline business models. This is
particularly important in a competitive airport system, like London, where airlines can
choose how to use the available capacity, and the market can be expected to
respond dynamically to the provision of new infrastructure. The Commission expects
to look further into how each of the shortlisted options may support this overall
objective as part of its next phase of work.
The Commission’s forecasts indicate that there is likely to be a demand case for a
second additional runway in operation by 2050 or, in some scenarios, earlier.
The Commission will carry out further analysis in the second phase of its work
programme, including looking at the implications for any future capacity expansion of
each of the new runway options shortlisted for detailed consideration. This will enable
it to make recommendations to the Government in its final report as to when, how
and by whom the case for a second additional runway should be considered.
4.1 The UK has to date been reasonably well-served by its existing airport
infrastructure. There are signs, however, that some of this infrastructure is being
stretched increasingly close to its limits in terms of connectivity and resilience.
4.2 It is not possible to predict with certainty how soon these problems will come to a
head. Nevertheless, the Government needs to plan for the long-term to ensure that
infrastructure is in place to serve the needs of future generations. This should not
entail a mechanistic ‘predict and provide’ approach, where forecasts are treated as
straightforward predictions of future need, and infrastructure to meet that need is
provided at any cost. Rather, policymakers should use the full range of tools at their
disposal, including forecasts, to make informed judgments about what infrastructure
should be provided. In doing so, they need to weigh carefully the risks of both over
and under provision.
4.3 The Commission has therefore developed a new set of aviation demand forecasts
and used them alongside other analytical approaches, such as scenario testing and
other forms of evidence, including discussion paper responses and expert advice,
to reach its conclusions. This chapter explains the Commission’s approach in more
detail, summarises the results of its analysis, and sets out its key conclusions on the
nature, scale and timing of the UK’s future airport capacity needs.

104
The Commission’s approach
4.4 To estimate the scale and timing of capacity needed, the Commission first
developed a set of core forecasts for future aviation demand. It used these to
identify airports and regions where future demand is likely to exceed available
capacity across a range of scenarios, including where the UK is meeting its climate
targets. Finally, the Commission considered the scope for redistributing demand
within existing airport capacity using a range of potential policy levers, such as Air
Passenger Duty (APD), changes to the slots regime, and Traffic Distribution Rules
(TDRs). This process is illustrated in Figure 4.1.
Figure 4.1: The Commission’s framework for considering the scale and timing of any need for additional airport capacity
Step 1: How much potential demand is there likely to be for UK airports between now and 2050?
Step 2: Are there specific airports/regions where future demand is likely to exceed available capacity across a range of scenarios, including where the UK is meeting its legislated climate targets?
No.Yes.
Are there specific airports where the level of future demand could still affect resilience?
Step 3: How far can excess demand be redistributed to other airports?
Little or no scope for redistribution
Strong case for additional capacity, subject to detailed analysis of the costs and benefits of options for meeting the additional demand.
No.
Potential case for adding capacity to improve resilience.
Yes.
Weak or no case for adding extracapacity.
Significant scope for redistribution
Differences between the Airports Commission and DfT forecasts
4.5 The Commission has taken the DfT aviation model as the starting point for
producing its demand forecasts. The two major components of the model are the
National Air Passenger Demand Model (NAPDM), which forecasts passenger
demand before taking account of capacity constraints, and the National Air
Passenger Allocation Model (NAPAM), which allocates these passengers to airports
and can take into account capacity constraints.

105
Chapter 4: The UK’s long-term capacity requirements
4.6 Changes to the forecasting methodology and assumptions have been made in part
as a result of responses to the Commission’s Aviation Demand Forecasting
discussion paper. In these responses, some of the criticisms of the DfT’s forecasting
approach included:
●● The way the DfT accounts for uncertainty in the demand for travel. A key
area of concern was in the reliability of models over a long time period and the
approach to uncertainty.98 A number of responses recommended that uncertainty
would be better incorporated through the use of probabilistic techniques.
●● Forecasting international growth. Several respondents questioned whether
the international regions used in the NAPDM were suitable, with particular
concern that the countries contained within the existing groupings were not
similar enough to be modelled together.99
●● Modelling international traffic. Respondents generally agreed with the
suggestion in the Commission’s discussion paper that the inability of the DfT
model to capture fully the international transfer passenger market was an
important weakness.100
●● Representing airline and airport competition. Comments and
recommendations were made on the suitability of the model in representing
airline and airport competition. Respondents pointed out that there are a number
of ways that these markets could develop.101
4.7 The Commission has sought to address these criticisms through the following
revisions to the DfT forecasting approach:
●● A revised definition of emerging economies. The definition of markets used
for international forecasting has been re-evaluated in line with several responses
to the discussion paper.102 Several countries, such as Brazil and Indonesia,
previously classified as Less Developed Countries (LDCs) have been reclassified
as Newly Industrialised Countries (NICs). This is expected to provide better
estimates of future demand for travel.
●● Decreased ‘demand overspill’ from the South East. Once an airport reaches
capacity, prospective passengers either travel to an alternative airport or do not
fly at all. In these new forecasts more people choose not to travel at all than to go
98 In particular, this was raised by the Aviation Environment Federation (AEF), Manchester Airports Group (MAG) and Kent County Council
99 Including the Mayor of London and Birmingham, Bristol and Newcastle airports100 Including Heathrow Airport Limited, British Airways and the Chartered Institute of Logistics and Transport101 Respondents included British Airways, Gatwick Airport and Gatwick Area Conservation Campaign102 This was raised by the Mayor of London and Birmingham Airport, amongst others

106
to another available airport, which has the effect of reducing implausibly high
demand growth in the later years of the forecast period at airports such as
Humberside and Exeter.
●● Probabilistic forecasts. Monte Carlo simulation, a statistical technique
involving repeated random sampling, has been used to produce a range of all
possible levels of output and the probability they will occur for any combination of
inputs. This is a better approach to capturing some of the inherent uncertainty in
forecasting than traditional high/low scenarios. Figure 4.2 shows the difference
this makes to the national level demand forecast.
●● Modelling overseas hubs. The biggest overseas hub competitors to London
are now modelled to the same level of detail as UK airports. The four newly
modelled hubs are Paris Roissy-Charles de Gaulle (CDG), Amsterdam Schiphol
(AMS), Frankfurt (FRA) and Dubai International (DXB). The forecasts show that
the UK would be successful at re-capturing the majority of the traffic which
moves to alternative hubs if capacity constraints are alleviated. The UK only has
a 3% share of the international to international transfer passenger market in 2050
when capacity is constrained, which rises to 22% if capacity constraints are
lifted.103
●● Revisions to model inputs. The Commission’s forecasts include updated oil
price assumptions, using forecasts from the International Energy Agency (IEA).
These forecasts are available out to 2035, after which the figures have been
extrapolated to 2050. These values replace the previously used DECC forecasts,
which extended only as far as 2030, as mentioned in a number of
submissions.104 The Commission has taken forward work to improve the
assumptions about growth in aircraft size, which have been increased as a result.
It has also reviewed the assumptions on aircraft load factors, concluding that
they remain appropriate.
4.8 More detail on these updates to the model can be found in the Appendix 3:
Technical Appendix.
How the model has been used
4.9 The Commission has used the updated model to develop four core forecasts:
1) Carbon traded, capacity unconstrained. This represents total potential
demand for UK aviation, in the absence of any constraints on airport capacity or
103 At the median of the range with carbon capped104 Including Stop Stansted Expansion and WWF-UK

107
Chapter 4: The UK’s long-term capacity requirements
on aviation emissions. It assumes that aviation continues to participate in existing
emissions trading schemes, such as the EU Emissions Trading System (ETS),
so passengers face a carbon cost, but no specific emissions level is targeted.105
It is broadly equivalent to the DfT’s unconstrained demand forecast.
2) Carbon traded, capacity constrained. This is the same as the first forecast,
except that it assumes that existing constraints on UK airport capacity persist
throughout the forecast period. The difference between this forecast and the first
allows the Commission to estimate the scale of unmet demand at national,
regional and airport level, and the rate at which airports would fill up in the
absence of any limit on carbon emissions. This forecast is broadly equivalent to
the DfT constrained forecast.
3) Carbon capped, capacity unconstrained. This represents the level of aviation
demand consistent with the CCC’s current assessment of how UK climate
targets can be met. It includes a higher modelled carbon price, which ensures
that forecast emissions return to 2005 levels by 2050, but assumes no
constraints on airport capacity. It is broadly equivalent to the CCC’s ‘likely’
scenario, set out in its 2009 report “Meeting the UK aviation target – options for
reducing emissions to 2050”.106
4) Carbon capped, capacity constrained. This forecast assumes both a higher
modelled carbon price, as in (3), and the continuation of existing constraints on
UK airport capacity, as in (2). It allows the Commission to estimate how existing
airport capacity would be used if further policies were introduced to return
aviation emissions to 2005 levels by 2050.
4.10 In addition, the Commission has carried out sensitivity tests around the core
forecasts, using the scenarios set out in Chapter 2 to inform some further modelling.
Step 1: How much potential demand is there likely to be for UK airports between now and 2050?
4.11 The carbon traded, capacity unconstrained forecast (1) allows the Commission to
estimate total potential demand for UK airports, in the absence of any constraints
on capacity or further policies to control aviation emissions. This forecast suggests
that unconstrained aviation demand is likely to grow significantly between now and
2050. Figure 4.2 shows the median forecast for unconstrained demand is 450
105 Carbon prices are based on the recommended traded values provided by DECC for use in policy appraisals, and assume aviation is part of the EU ETS until at least 2020, and part of a global carbon market beyond then
106 Committee on Climate Change (2009), “Meeting the UK aviation target – options for reducing emissions to 2050”, http://www.theccc.org.uk/publication/meeting-the-uk-aviation-target-options-for-reducing-emissions-to-2050/

108
million passengers per annum (mppa) in 2050, in a range of 380 mppa to 530
mppa. The median estimate is 7% lower than the January 2013 DfT forecasts.
Figure 4.2: The Commission’s forecasts show unconstrained demand would grow significantly up to 2050
Unconstrained national air passenger forecasts, carbon traded, 2010-2050
0
100
200
300
400
500
600
2010 2015 2020 2025 2030 2035 2040 2045 2050
UK
term
inal
pas
seng
ers
(mpp
a)
60% likelihood 40% likelihood 20% likelihood Median
4.12 The carbon traded, capacity constrained forecast (2) shows the effect that current
capacity constraints would have, if they are not alleviated. Here the median
passenger demand forecast falls from 450 mppa to 400 mppa by 2050, in a range
of 350 mppa to 455 mppa. Forecast passenger numbers in this scenario are 4%
lower in 2030 and 11% lower respectively in 2050 than the levels forecast by the
DfT in January 2013. This reduction is largely explained by the improved modelling
of overseas hubs and updated forecasts for UK and foreign GDP.
4.13 The forecasts shown above have been derived using an updated, probabilistic
approach to uncertainty developed by the Commission. Figure 4.3 shows how this
new approach to modelling uncertainty produces a narrower range of forecasts
than the range based on high and low demand scenarios published by the DfT in
January 2013.

109
Chapter 4: The UK’s long-term capacity requirements
Figure 4.3: The Commission’s forecasts have a narrower range than DfT’s January 2013 forecasts
Constrained national air passenger forecasts, carbon traded, 1980-2050
New range New central Previous range
0
50
100
150
200
250
300
350
400
450
500
1980 1985 1990 1995 2000 2005 2010 2015 2020 2025 2030 2035 2040 2045 2050
UK
term
inal
pas
seng
ers
(mpp
a)
0
50
100
150
200
250
300
350
400
450
500
4.14 The Climate Change Act 2008 set a target for total UK greenhouse gas emissions
to be reduced by 80% by 2050, relative to a 1990 baseline. The CCC’s current
assessment of how this target can be met assumes that CO2 emissions from UK
aviation in 2050 should be at or below 2005 levels.107
4.15 In its 2009 report the CCC assessed the maximum increase in total UK demand
which is likely to be consistent with constraining 2050 aviation emissions to 2005
levels, given best estimates for future technological progress. The Committee’s
findings, based on its ‘likely’ scenario, included:
●● demand growth of around 60% over 2005 levels would be compatible with
keeping aviation CO2 emissions in 2050 no higher than in 2005, given prudent
assumptions on likely improvements in fleet fuel efficiency and biofuels use;
●● this equated to an increase in ATMs of around 55% over the same period; and,
●● a 60% increase in total UK aviation demand could be consistent with a range of
policies as regards capacity expansion at specific airports (it was not the CCC’s
role to assess the merits of specific airport expansion plans).
107 Committee on Climate Change (2009), ‘Meeting the UK aviation target – options for reducing emissions to 2050’, http://www.theccc.org.uk/publication/meeting-the-uk-aviation-target-options-for-reducing-emissions-to-2050/

110
4.16 The Airports Commission’s carbon capped, capacity unconstrained forecast (3)
updates the previous work of the CCC, using a broadly similar approach. The
Commission’s updated analysis suggests that:
●● based on current forecasts, the compatible level of passenger demand growth
is around 67% by 2050;
●● this translates into an increase of around 38% in the number of ATMs, given
current assumptions around average aircraft sizes and load factors; and,
●● as the CCC found, this is compatible with a range of policies on capacity
expansion.
4.17 Notwithstanding some differences in the DfT and CCC models, the results are
broadly similar. The differences between the estimates can be attributed largely to
assumptions regarding load factor and aircraft fuel efficiency. For instance, the CCC
model forecasts average load factors of 85% by 2050, whereas the Commission’s
forecasts are lower at 80%.
Step 2: Are there specific airports or regions where future demand is likely to exceed available capacity across a range of scenarios, including where the UK is meeting its legislated climate targets?
4.18 With aviation emissions capped at a level consistent with current plans to meet
UK climate targets, passenger demand at UK airports is forecast to increase from
217 mppa in 2011 to 295 mppa in 2030 and 389 mppa by 2050. This is an average
increase of 1.4% a year, compared to historic growth of 4% a year and forecast
growth of 1.5% a year without a carbon cap. With the carbon cap now the limiting
factor for demand growth overall, passenger numbers do not change significantly
between the capacity constrained and unconstrained scenarios. It is rather the
allocation of demand between airports and market sectors which alters as capacity
constraints are alleviated.
4.19 In the carbon capped, capacity constrained forecast (4), total demand across the
London airport system is projected to reach 90% of the available runway capacity
by 2030. This rises to more than 96% in the carbon capped, capacity
unconstrained forecast (3), in which passenger choices are not restricted by the
limitations of existing runways or other infrastructure. These rates of utilisation are
at or above the point at which high levels of reliability would no longer be able to
be maintained – particularly on a system-wide basis.

111
Chapter 4: The UK’s long-term capacity requirements
4.20 With carbon capped but capacity unconstrained, demand in the London airport
system would continue to grow such that it would exceed the theoretical maximum
capacity by around 14% by 2050. In contrast, there is projected to be significant
spare capacity available at airports elsewhere in the country. The scope to
redistribute excess demand to airports outside London and the South East is
discussed later in this chapter.
4.21 Even with a carbon cap and a projected increase in aircraft sizes and loadings, by
2030 demand across the London airport system would be reaching the absolute
limits of what could feasibly be accommodated. By 2050, the gap between demand
and capacity equates to some 170-200,000 ATMs.
4.22 On the basis that a single runway could accommodate some 200,000 movements
or more, this suggests that one net additional runway would be able to
accommodate forecast demand growth in London and the South East between
2030 and 2050 in this scenario. By the end of that period the system would once
again be approaching the limits of its capacity, suggesting that there may be a case
for a second additional runway by around 2050.
4.23 Excess demand in the London airport system is forecast to be concentrated
particularly on Heathrow, which remains full across all the demand scenarios
considered. This does not mean, however, that the correct approach to addressing
any capacity gap would necessarily be to expand Heathrow. The UK’s aviation
market is evolving, and the London airport sector is uniquely competitive. As this
evolution continues, new options for meeting passenger needs and effectively
addressing the forecast gap between supply and demand presented here may
develop. Furthermore, final decisions on options for new capacity will also need to
take into account wider factors including cost, deliverability and impacts, both
positive and negative, on local communities and the environment.
4.24 The timeline in Figure 4.4 shows the Commission’s estimate of when London and
South East airports will reach the limits of their current capacity in a carbon capped
scenario. Even with the much higher modelled carbon price in the carbon capped,
capacity constrained forecast, the London airport system is still projected to fill up
by the early 2040s. During peak times some airports will be at capacity earlier than
shown here.

112
Figure 4.4: Without additional capacity, major London and South East airports will be full by the 2040s, even with a carbon cap in place
Projected years when London and South East airports become full, in the carbon capped, capacity
constrained forecast
Heathrow, 2010London City, 2024
Luton, 2030
Gatwick, 2020
2010 2015 2020 2025 2030 2035 2040 2045 2050
Stansted, 2041
4.25 It should be noted that 100% utilisation of the theoretical maximum runway capacity
across the whole of the London airport system is unlikely to be either desirable or
feasible. It would require investment in new terminal capacity and would create
significant airspace challenges.
4.26 Perhaps more importantly, it would entirely remove any scope to manage periods
of severe weather or other incidents, and would be likely to increase the levels of
unreliability and delay experienced by passengers across all major London and
South East airports. Therefore, the gap between demand and capacity indicated
in the analysis above may be an underestimate of actual capacity need.
4.27 The Commission has also considered the potential implications of its carbon traded
forecast. In this case, a greater level of overall demand growth is seen, as emissions
can rise above the level consistent with current plans to meet UK climate targets.
However the difference between the forecasts is relatively modest, with
unconstrained passenger numbers only 18% higher than in the carbon capped
scenario and ATMs roughly 16% higher.
4.28 The broad implications of this forecast, therefore, are in line with those from the
carbon capped forecast, except that capacity constraints would bite slightly earlier.
In this case, the median forecast shows unconstrained demand is estimated to
outstrip available capacity across the major London and South East airports
between 2025 and 2030, and one net additional runway would provide sufficient
capacity to accommodate demand growth until the mid-2040s, with a further
runway likely to be needed before 2050 for capacity as well as resilience reasons.
4.29 In reality, neither the carbon capped, nor the carbon traded forecast is likely to
provide a ‘correct’ picture of future demand. Nonetheless, the level of consistency
between them regarding overall demand pressures in the London airport system
provides a particularly helpful guide for policy makers, indicating that the scale of

113
Chapter 4: The UK’s long-term capacity requirements
demand growth and capacity needed is broadly similar across a range of potential
carbon futures, albeit with some difference in terms of timing.
4.30 These forecasts also show broadly similar results in relation to how future demand
growth might be allocated across market segments. Significant growth between
2011 and 2050 is seen in all four scenarios modelled across most of the sectors of
the aviation market (defined as domestic, short-haul business and leisure, long-haul
business and leisure, UK transfer and international transfer). The exceptions to this
are UK and international transfer passengers, which are forecast to decline by more
than three quarters by 2050 when capacity is constrained in both the carbon traded
and the carbon capped scenarios.
4.31 The main difference of this type between the scenarios relates to the effect of
relaxing capacity constraints. In the carbon traded scenario, when capacity is
unconstrained, growth rates are the same or higher than in the capacity constrained
forecast across all sectors (including both transfer and origin and destination). In the
carbon capped scenario, however, the limit on carbon emissions by 2050 means
that as numbers of transfer passengers – both UK and international – rise in the
unconstrained scenario, these have to be offset by lower growth rates in other
sectors of the market. This effect is most pronounced in relation to short-haul
leisure travel, which sees the level of growth forecast between 2011 and 2050
drop from 87% in the constrained scenario to 60% in the unconstrained scenario.
The reductions seen in the business sector are significantly smaller, with the
growth rate for long-haul business travel changing by less than 2%.
4.32 In reality, whatever capacity constraints may or may not be in place, future aviation
demand will be shaped by market forces and not by the outputs of a model. While
transfer passengers play an important role in supporting high levels of connectivity
at hub airports, for example, they are also highly price sensitive and in many cases
will effectively pay a similar or lower fare for two journeys to get to their destination
as a direct passenger pays for one. Therefore, airlines may endeavour to prioritise
direct passengers over transfer in allocating capacity. But this effect is not captured
in demand modelling.
Key uncertainties and sensitivities
4.33 The Commission’s carbon capped forecasts use carbon prices to constrain aviation
emissions, and hence aviation demand, to a level consistent with current plans to
meet UK climate targets. This is a proxy for a range of potential measures to control
emissions, which could include international cap-and-trade schemes, domestic
carbon taxes or some combination of these, and does not constitute a policy
114
recommendation. It is ultimately for Government, with advice from the CCC, to
determine the appropriate framework for controlling aviation emissions.
4.34 For the purpose of producing the carbon capped, capacity unconstrained forecasts,
the Commission assumed a carbon price of up to £600 per tonne of CO2. This price
is significantly in excess of the DECC central carbon values of around £200 per tonne
of CO2 and the current carbon price of around £3 per tonne of CO2.108 In 2050,
the average modelled short-haul fare increase in this scenario is £43, taking the
average fare from £103 to £146. The average modelled long-haul fare increase is
£205, taking the average fare from £397 to £602.
4.35 The very high modelled carbon price could be seen to imply that the proposed level
of emissions reductions within the aviation sector would not be the most cost-
effective option for achieving the UK’s overall carbon targets. As the CCC notes in
its advice to the Commission, “it is of course possible that there may be scope to
reduce emissions more in other sectors”, which would allow aviation demand to
grow by more than currently assumed. However, the CCC cautions that planned
reductions in other sectors are “at the limit of what is feasible, with limited
confidence about the scope for going beyond this”.109
4.36 New engine and airframe technologies could reduce the carbon intensity of future
air travel. If progress on this front is greater than currently expected, this would also
increase the level of demand that could be accommodated within the UK’s currently
legislated climate targets. A further uncertainty is around the future uptake and
potential carbon savings from aviation biofuels.
4.37 The Commission has reviewed key assumptions regarding aircraft efficiency and
biofuels. Estimated future fuel-efficiency savings used by the DfT are broadly in line
with those used by industry. There are a wide range of assumptions around future
biofuels uptake and potential carbon savings, with the DfT assumptions on the
conservative side. On this basis, the DfT approach has been retained, although this
remains an area of uncertainty. The assumptions in the CCC’s ‘likely’ scenario, for
example, are more optimistic overall in relation to biofuels.
4.38 Set against this, national and international policy frameworks do not currently
include the most significant non-CO2 emissions from aviation (see Box 4a).
As scientific understanding of these emissions develops, policy may need to
evolve to address their climate impacts. Should this require additional emissions
108 Based on The Times reported carbon price on 22/11/13 of approximately £4 per tonne of CO2, rebased to 2008 prices for consistency
109 Available at http://www.theccc.org.uk/wp-content/uploads/2013/07/CCC_letter_aviation_commission.pdf
115
Chapter 4: The UK’s long-term capacity requirements
reductions within the aviation sector beyond what is currently planned, this
constitutes a downside risk to the forecasts set out above.
Box 4a: Non-CO2 emissions from aviation
In addition to CO2, combustion of aviation fuel produces a range of emissions
including water vapour (forming contrails), soot (black carbon) and oxides of
nitrogen (NOx). While many national and international climate policies,
including the UK Climate Change Act, cover some non-CO2 emissions (NCEs)
through the concept of CO2-equivalent emissions (CO2e), they do not include
the most significant NCEs from aviation.
Unlike CO2, the climate effects of aviation NCEs depend on the location and
time of the emissions, and can exert both warming and cooling influences.
Compared to CO2, the effects are also generally more regional and shorter lived
in nature. This makes it difficult to compare the effects of NCEs with those of
CO2, although a number of methods have been developed to enable a
comparison of some aspects.
‘Radiative forcing’ is one method for doing this. Other approaches include the
‘Global Warming Potential’ (GWP) and ‘Global Temperature-change Potential’
(GTP). Despite significant progress in quantifying climate effects for NCEs,
climate metrics for these emissions remain more uncertain than for CO2.
As scientific understanding in this area continues to improve, climate policies
may need to evolve to take better account of NCEs. However, the implications
of this for specific sectors, such as aviation, are not yet clear.
4.39 The CCC’s recommendation to the Commission, taking account of all these
uncertainties, is that the target of constraining CO2 emissions from UK aviation to
2005 levels by 2050, consistent with current plans to meet the economy-wide climate
target, remains the most appropriate basis for planning future airport capacity.110
4.40 Forecasts of air passenger demand also need to take into account the development
of alternatives to aviation, such as high-speed rail and videoconferencing. Box 4b
discusses the potential impacts on aviation forecasts of High Speed 2 (HS2).
It should be noted, however, that in carbon capped scenarios, the use of
alternatives to aviation is unlikely to reduce aviation demand overall. This is because
in these scenarios the carbon cap is the constraining factor on aviation demand.
110 Ibid

116
The effect of aviation demand shifting to other transport modes is likely to be to
create additional headroom within the carbon cap for other air passengers.
With HS2
Phase 1opens
Phase 2opens
Without HS2
Impa
ct o
n D
omes
tic P
asse
nger
s (m
illion
s)
0
10
20
30
40
50
60
205020452040203520302025
Box 4b: Could high-speed rail solve the airport capacity problem in London and the South East?
A number of stakeholders have argued that aviation demand could be met
within existing capacity by shifting domestic and short-haul journeys onto rail,
especially if HS2 adds capacity to the network.
An air-to-rail shift based on HS2 is included in the Commission’s forecasts,
and as Figure 4.5 shows there is a relatively small reduction in domestic
demand as some passengers switch onto HS2. There will also be an increase
in the number of passengers flying from the UK to international destinations
as HS2 increases the catchment area of UK airports.
Figure 4.5: There is a small reduction in domestic demand as a result of HS2, particularly from 2033 when phase 2 opens
Domestic passenger demand with and without HS2, 2025 – 2050
The scope for further rail growth on short-haul European routes is limited by
some clear constraints, including rail line and tunnel capacity out of the UK –
there is only one railway link that connects the UK with continental Europe –
and by the availability of feasible destinations. For instance, the only additional
destination planned since the opening of Eurotunnel is Amsterdam, and this is
not yet operational.

117
Chapter 4: The UK’s long-term capacity requirements
Step 3: How far can excess demand be redistributed to other airports?
4.41 While demand at airports in London and the South East is expected to exceed
available capacity by 2050, even with policies in place to meet UK climate targets,
there is likely to be a high level of unused capacity at many regional airports.
The Commission therefore considered whether it would be possible to solve the
capacity problem in London and the South East by incentivising, or requiring,
airlines to make greater use of under utilised capacity elsewhere.
4.42 This approach has been put to the Commission by various stakeholders, including
environmental organisations, local groups and regional airports, in two different
contexts. Some proposed it as a short or medium term measure to maintain and
enhance the UK’s connectivity before any new capacity can be utilised. Others
suggested that the level of unused capacity, and the potential to make more use
of it, was such that there was no need to provide any additional airport capacity in
the longer-term.
4.43 The Richmond Heathrow Campaign’s submission on how to increase airport
capacity in the long-term was one of the most comprehensive proposals received
by the Airports Commission for how rising demand could be accommodated
without the need for new infrastructure, and is summarised in Box 4c.
118
Box 4c: Richmond Heathrow Campaign’s long-term proposals for meeting future airport demand
The four elements of this proposal are set out below, together with an
explanation of why the Commission does not consider that they would meet
the UK’s aviation capacity and connectivity needs.
Increasing the rate of aviation taxation to slow the rate of growth in passenger
demand
The Commission has considered the implications of a significant increase in
the cost of flying through its carbon capped forecasts, which can be
considered a proxy for increasing aviation taxes. Even with such a price
increase in place, there remains a need for additional capacity in the London
and South East airport system.
Revising the forecast distribution of demand between the South East region
and the rest of the UK
The Richmond Heathrow Campaign argues that forecasts should reflect the
higher rates of demand growth that have been seen over recent decades
outside of the South East. The Commission’s forecasts indicate, however, that
these higher rates of growth may be a consequence of the long-standing
capacity constraints in the South East system, and the pattern of growth
would be likely to change if those constraints were alleviated.
Expanding terminal capacity at South East airports to accommodate a higher
average number of passengers per flight
The Commission’s forecasts incorporate revised assumptions about plane
sizes, which see more passengers per flight than in previous DfT forecasts.
Despite this, significant excess demand over capacity is still forecast in the
South East by 2050.
Redistributing services between the major South East airports to make better
use of existing capacity
As set out in this chapter, the levers available to redistribute traffic are limited
and the historical precedents are not encouraging. The Richmond Heathrow
Campaign proposes that the removal of market disincentives would enable
the segmentation of traffic between airports, but industry experience indicates
that a highly interventionist approach would in practice be needed.

119
Chapter 4: The UK’s long-term capacity requirements
4.44 To assess the scope for redistributing traffic, the Commission considered four
potential policy levers:
●● taxation;
●● changes to the slots regime;
●● Traffic Distribution Rules; and,
●● restrictions on aircraft and services at congested airports.
Taxation
4.45 The UK’s main aviation tax, APD, is levied on airline passengers beginning their
journeys at a UK airport. Rates of APD vary depending on the distance of the
journey and the class in which the passenger travels. Since its introduction in 1994,
rates of APD have more than doubled and the rate structure has been changed so
as to allow more granular banding of destinations by distance. APD does not apply
to passengers transferring flights via a UK airport while en route between two other
countries (unless they stop over in the UK for more than 24 hours) or to passengers
flying on an aircraft with a weight of less than 5.7 tonnes.
4.46 The UK is not alone in levying an APD-style tax on flying. Within Europe, Austria,
France, Germany, Ireland and Italy have similar taxes. While all these taxes affect
demand for aviation, this is especially the case in the UK, where the tax rate levied
on passengers is much higher than the rate applied by other countries. This report
does not review arguments surrounding the overall yield from APD and its economic
impact, as this is not within the Commission’s remit.
4.47 The Commission did consider the potential to vary APD on a revenue-neutral basis
according to levels of congestion at airports – an APD congestion charge. This
would provide an incentive for airlines to make greater use of less-congested
airports. Whilst stakeholders proposed two alternative ways of using APD to
achieve the same overall objective – devolving APD and varying it by region –
these options would be less well-targeted than the APD congestion charge.
4.48 Devolving APD would do little to incentivise better use of existing capacity at
regional airports in England, and could potentially distort competition between
proximate airports on either side of a border, such as Bristol and Cardiff, or
Newcastle and Edinburgh. Regional variations in APD could potentially give rise
to perverse incentives, for example to not use spare capacity in London and the
South East, as currently exists at Stansted and Luton.

120
4.49 As a result, the Commission analysed the impact of a 10% APD surcharge at
airports above 90% of their maximum capacity, with approximately revenue neutral
decreases in APD at other airports. The results of this analysis are set out in Box
4d. Broadly, this shows that an APD congestion charge is not a promising solution
to the capacity problem in London and the South East because:
●● It does not increase overall seat capacity. The policy would be likely to result
in a minor reduction of long-haul seats available from the UK, with a negligible
impact on overall seat capacity.
●● It does not maintain or improve long-haul connectivity. The policy is likely
to lead to a minor fall in the number of destinations directly accessible from the
UK, as congested airports like Heathrow lose routes, and the new routes
developed at less congested airports largely duplicate those already available
from Heathrow.
●● It is carbon inefficient. The policy would result in a reduction in average plane
sizes on long-haul routes, as these routes are displaced from airports with high
traffic volumes, such as Heathrow, to airports with smaller traffic volumes, like
Luton. This increases emissions relative to the core forecasts.
●● The effects of the policy diminish over time. In the long-term, the measure
becomes less effective as currently less congested airports begin to hit the 90%
capacity limit, and no longer benefit from the lower rate.
4.50 While a congestion based charge might have some short-term benefits for less
congested airports, its net effect on the UK’s national connectivity and capacity is
mildly negative. The measure does not represent a suitable long-term strategy for
meeting the Commission’s remit of maintaining the UK’s international hub status.

121
Chapter 4: The UK’s long-term capacity requirements
Box 4d: Could a congestion charge on the UK’s busiest airports incentivise airlines to use currently under utilised capacity?
The Commission’s analysis focused on an APD congestion charge whereby a
10% surcharge is levied at airports operating above 90% of their maximum
capacity. These were accompanied by decreases in APD at other, less
congested airports, making the policy as a whole approximately revenue
neutral. A 90% ratio of demand to capacity was chosen as resilience
problems would be expected to increase significantly beyond this level of
capacity utilisation. The policy was modelled from 2015 onwards.
The analysis suggested that a congestion charge would result in an overall
increase in the number of flights out of regional airports. As Figure 4.6
shows, Birmingham, Luton and Stansted would be the main beneficiaries of
this policy. Manchester would not benefit to the same extent, as newly
energised regional competitors would draw traffic away from it.
Figure 4.6: Luton, Birmingham and Stansted see the largest increase in ATMs and Gatwick sees the biggest fall
Percentage change in ATMs as a result of 10% APD congestion charge relative to carbon
capped base case, 2020
ManchesterBirminghamLutonStanstedGatwickHeathrow
1%
-17%
4%
30%
16%
0%
The new routes developed at regional airports, however, would to a large
extent duplicate long-haul routes already available from large airports like
Heathrow, Gatwick and Manchester, as Table 4.1 shows.
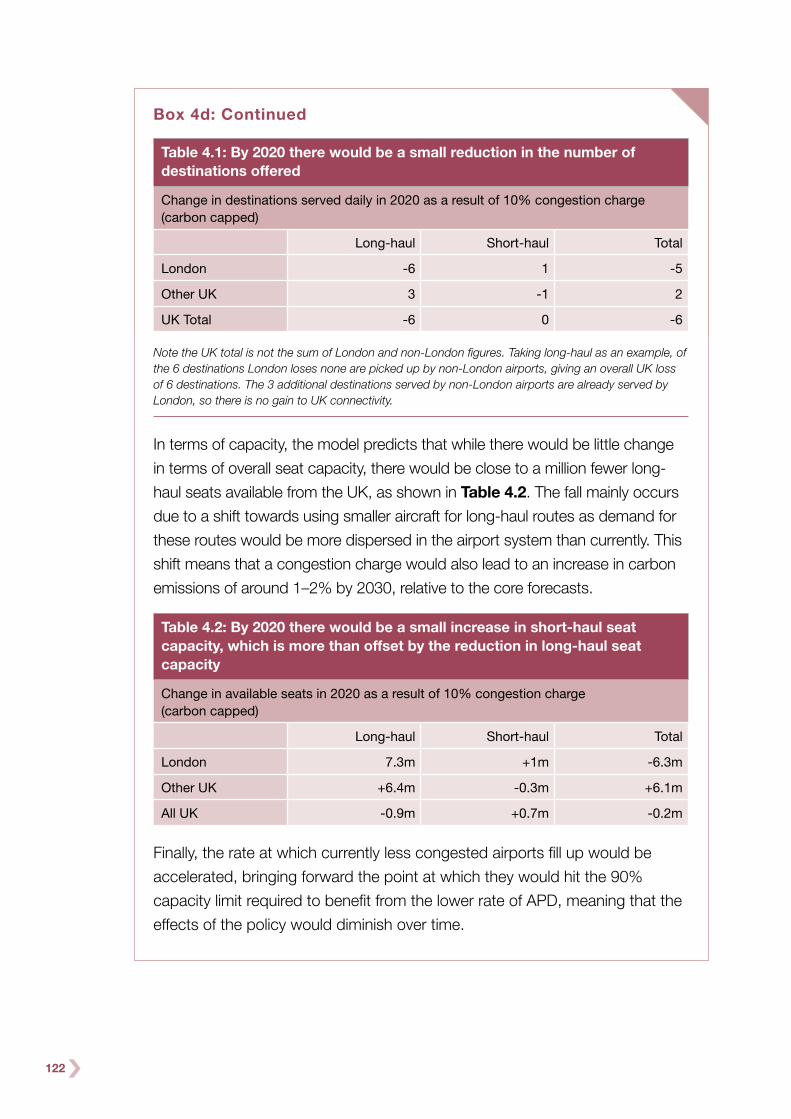
122
Box 4d: Continued
Table 4.1: By 2020 there would be a small reduction in the number of destinations offered
Change in destinations served daily in 2020 as a result of 10% congestion charge (carbon capped)
Long-haul Short-haul Total
London -6 1 -5
Other UK 3 -1 2
UK Total -6 0 -6
Note the UK total is not the sum of London and non-London figures. Taking long-haul as an example, of the 6 destinations London loses none are picked up by non-London airports, giving an overall UK loss of 6 destinations. The 3 additional destinations served by non-London airports are already served by London, so there is no gain to UK connectivity.
In terms of capacity, the model predicts that while there would be little change
in terms of overall seat capacity, there would be close to a million fewer long-
haul seats available from the UK, as shown in Table 4.2. The fall mainly occurs
due to a shift towards using smaller aircraft for long-haul routes as demand for
these routes would be more dispersed in the airport system than currently. This
shift means that a congestion charge would also lead to an increase in carbon
emissions of around 1–2% by 2030, relative to the core forecasts.
Table 4.2: By 2020 there would be a small increase in short-haul seat capacity, which is more than offset by the reduction in long-haul seat capacity
Change in available seats in 2020 as a result of 10% congestion charge (carbon capped)
Long-haul Short-haul Total
London 7.3m +1m -6.3m
Other UK +6.4m -0.3m +6.1m
All UK -0.9m +0.7m -0.2m
Finally, the rate at which currently less congested airports fill up would be
accelerated, bringing forward the point at which they would hit the 90%
capacity limit required to benefit from the lower rate of APD, meaning that the
effects of the policy would diminish over time.

123
Chapter 4: The UK’s long-term capacity requirements
Changes to the slots regime
4.51 The Commission also considered whether changes to the slots regime could enable
better use of existing airport capacity. Here the system of international treaties and
legal obligations surrounding the allocation of slots raises a number of points that
must be taken into consideration:
●● EU law, based on older international (IATA) precedents, requires slot allocation to
be independent of Government control. In the UK this is done by the UK’s slots
coordinator, Airport Coordination Limited.
●● The allocation of slots is the sole responsibility of independent airport
coordinators. Coordinators are assisted in certain respects by ‘coordination
committees’ (but these must not affect the independence of the coordinator).
●● Primary allocation of slots (from the coordinator to the airline) does not involve a
fee for the slot. Secondary trading markets, whereby airlines (in essence)
purchase slots from each other, are permitted. In theory, these are not financial
trades, but rather an exchange of one slot for another. In practice, the exchange
of slots is normally accompanied by a payment by the party acquiring the more
valuable slot.
●● Once an airline has operated a slot for a year it obtains ‘grandfather rights’ on
that slot.
●● After two years, the airline may change the destination to which the slot operates
without forfeiting ‘grandfather rights’.
●● When new capacity is created at an airport, 50% of it is reserved for
new entrants, i.e. airlines currently holding four or fewer daily slots at the airport
in question.
●● It is not part of the role of coordinators to make judgements about how slots
should best be allocated or used in the public interest, or to achieve economic
policy or competition objectives.
4.52 Several stakeholders have raised the question of whether the slots regime should
be changed, either to ensure that capacity within the current system is managed
in the national interest, or to ensure that any new capacity added increases the UK’s
connections to the most economically important markets.
4.53 Unilateral changes to the slot allocation regime would constitute a breach of the
UK’s EU Treaty obligations and could provoke retaliatory action by other states.
The agreement of changes to slot allocation regimes at the European or

124
international level would therefore be necessary if the UK were to seek to change
the slot allocation system. The Commission has seen no evidence that such
agreement is likely to be possible; indeed, the general direction of travel has been
towards further liberalisation.
4.54 Some proposals to the Commission have suggested that governments should have
the ability to direct airlines to fly particular routes and that the slots mechanism
could be utilised as a means to achieve this. However, the Commission finds it
difficult to conceive of any policy levers, short of state ownership, which could
compel airlines to fly routes that are not commercially viable.
4.55 Moreover, unless there were infinite capacity at UK airports, giving priority to certain
routes or destinations at a particular airport necessarily means constraining the
capacity available there for other routes and destinations. It is highly likely that
moves to deprive particular routes of their access into the most desirable UK
airports would trigger retaliatory measures. Responses to the Commission’s
publication of short and medium-term options emphasised this message, with
airlines and airline alliances making their opposition particularly clear, underlining the
difficulty of securing the required international agreement.
4.56 Similar considerations apply to measures which would reserve a portion of any
newly created capacity for specific destinations or markets, above and beyond the
existing requirement that 50% of new capacity be reserved for new entrants.
Traffic Distribution Rules
4.57 As an alternative to changes to the slot regime, some stakeholders have proposed
managing the use of existing or new capacity in the national interest through
increased use of Traffic Distribution Rules (TDRs). These are a means of allocating
traffic between different airports in the UK system, and were revised in 1991.
The changes were largely to reflect European law, which requires that TDRs do
not discriminate among destinations inside the EU, or on grounds of nationality or
identity of air carriers.
4.58 Prior to these changes, the London Air TDRs were introduced in 1978, which were
designed to achieve a better distribution of traffic between Heathrow and Gatwick,
to meet Government policy objectives of the time (i.e. to encourage greater use of
Gatwick). The rules were embodied in the 1977 US-UK Bermuda II bilateral air
services agreement, whereby all new routes between the USA and London had to
operate from Gatwick.

125
Chapter 4: The UK’s long-term capacity requirements
4.59 These TDRs proved unpopular with airlines, particularly US airlines. In 1991 the then
Secretary of State, at the CAA’s recommendation, removed the rules on passenger
flights to London, while maintaining the rules on cargo, business and general
aviation flights. The 1991 TDRs banning all new cargo flights from Heathrow and
Gatwick remain in place today.
4.60 At around the time the 1978 rules were adopted, the Government also announced
that all scheduled services between London and Canada, and between London
and the Iberian Peninsula, would be transferred from Heathrow to Gatwick by 1
April 1979. However, in response to strong resistance, the UK Government
withdrew the proposed TDRs, and the services to Canada and the Iberian Peninsula
remained at Heathrow.
4.61 Under the current system, the 1991 TDRs grant the Secretary of State the ability to
allocate certain types of traffic (particularly freight and charter) between Heathrow,
Gatwick and Stansted.
4.62 In reality, while TDRs can prevent certain services from operating from a given
airport, they cannot compel airlines to use specific airports for prescribed classes of
traffic. For example, airlines may consider the service pattern required by a TDR to
be commercially unattractive and, as a result, could choose to move their air service
operations elsewhere, where such rules did not apply.
Restrictions on aircraft and services permitted at congested airports
4.63 A number of proposals have suggested prohibiting certain types of flights from
Heathrow (and in some cases Gatwick). In particular, stakeholders have suggested
prohibitions on the following types of flight:
●● charter flights,
●● freight-only flights,
●● business jets,
●● general aviation,
●● small aircraft on scheduled services,
●● domestic flights.
4.64 In theory, as outlined above, the TDRs do provide Government with some levers
through which this measure might be implemented. However, a combination of
existing TDRs, restrictions placed by the airport itself through its conditions of use,

126
and market forces have already served to constrain the quantity of flights in most of
the above categories using Heathrow.
4.65 In particular, the relatively high landing charges and congestion at Heathrow already
render it largely unattractive for charter flights, dedicated freighters (most freight at
Heathrow is carried in the bellyhold of passenger aircraft), business and general
aviation. Moreover, as slots at Heathrow bring higher yields per passenger when
they are used for international rather than domestic routes, domestic routes are
relatively unattractive as well – over time the number of domestic routes into
Heathrow has fallen to just eight in 2012.
4.66 The Commission noted that charter flights, freighters, business and general aviation
flights were prohibited from entry into Heathrow for the period of the London
Olympics and recognises these measures as a sensible response to a period of
exceptional demand. However, recognising that those charter, business, general
aviation and freight users who choose to use Heathrow do so despite high landing
charges, the Commission does not believe that the case for a more restrictive
regime coming into permanent operation has been made.
4.67 While levels of charter traffic and, to a lesser extent, business and general aviation
are higher at Gatwick, there is a reasonable expectation that the same market
forces, which have operated to reduce this traffic at Heathrow, will come into effect
at Gatwick as the airport’s remaining spare capacity comes into use over the next
few years.
4.68 Constraining the use of smaller aircraft for scheduled flights is likely to remove
important ‘feeder’ traffic for long-haul routes, and could also make it harder for
airlines to experiment with new routes where a large plane may not initially be
justified. Furthermore, the high price of slots via secondary trading and high landing
charges at Heathrow already provide an incentive for airlines to use the largest
aircraft commercially viable on a given route.
4.69 Similarly, domestic connections at Heathrow and other London airports are of
economic significance for both London and the regions. The regions benefit both
from access to the capital’s economy and from the long-haul connectivity they can
access via Heathrow. London benefits from the contribution that those regional
passengers make to enhance the business case for its long-haul routes.
Undermining this system by banning domestic flights from Heathrow would not
be beneficial for the UK.
127
Chapter 4: The UK’s long-term capacity requirements
Summary: Scale, location, and timing of need for additional airport capacity
4.70 In summary, the Airports Commission’s analysis suggests that:
A. aviation demand is likely to increase significantly between now and 2050, even
when 2050 carbon emissions are capped at a level which is consistent with the
UK meeting its legislated climate commitments;
B. this demand growth is likely to be concentrated in the South East, with sufficient
demand to utilise 90% or more of available capacity across London and South
East airports by around 2030;
C. demand is predicted to exceed capacity in London and the South East by 2040
or earlier in all core scenarios, with the gap between capacity and demand rising
to approximately 170-200,000 ATMs by 2050 even in the carbon capped
forecast; and,
D. there is relatively little scope to redistribute demand away from London and the
South East to less heavily utilised capacity elsewhere in the country.
4.71 Taken together, these conclusions point to the need for additional capacity to be
provided in London and the South East, to alleviate the impacts of tightening
capacity constraints on operational reliability in the period to 2030, and to
accommodate additional demand growth over the period to 2050.
4.72 There is a clear case for at least one net additional runway by 2030 across a range
of scenarios, including where the UK is meeting its climate change targets. This
scale of additional capacity is compatible with a number of airport expansion
proposals that have been put to the Commission and views held by some of the
major airline stakeholders in the UK, notably BA.111
4.73 The Commission’s forecasts suggest that there is also likely to be a demand case
for a second additional runway to be operational by 2050, or, in some scenarios,
earlier. Even if there is a demand case, however, it does not necessarily follow that
there would be a strong economic or commercial case for a second net additional
runway.
4.74 The Commission will carry out further analysis in the second phase of its work
programme as to when, how and by whom the case for a second net additional
runway might most appropriately be considered. This analysis may include
consideration of how UK and international economic forecasts may develop, and
the implications for long-term aviation demand; progress in agreeing measures to
111 https://www.gov.uk/government/publications/public-evidence-sessions-transcripts-airports-commission-discussion-papers
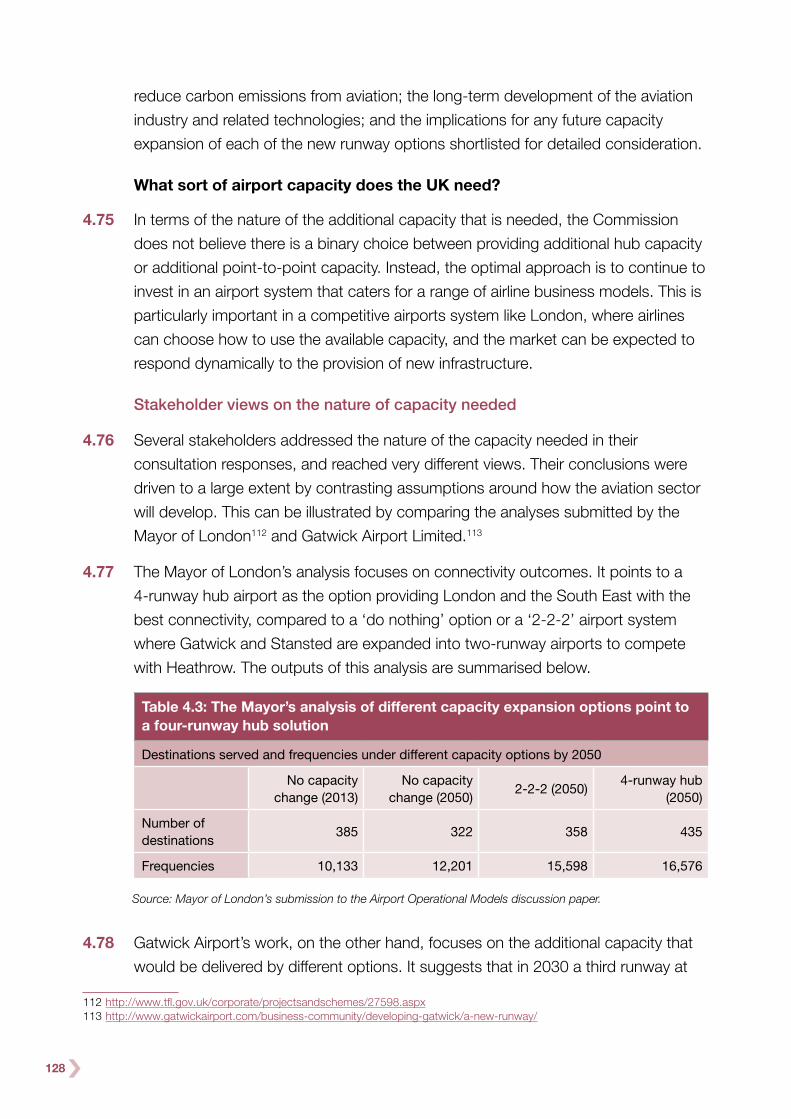
128
reduce carbon emissions from aviation; the long-term development of the aviation
industry and related technologies; and the implications for any future capacity
expansion of each of the new runway options shortlisted for detailed consideration.
What sort of airport capacity does the UK need?
4.75 In terms of the nature of the additional capacity that is needed, the Commission
does not believe there is a binary choice between providing additional hub capacity
or additional point-to-point capacity. Instead, the optimal approach is to continue to
invest in an airport system that caters for a range of airline business models. This is
particularly important in a competitive airports system like London, where airlines
can choose how to use the available capacity, and the market can be expected to
respond dynamically to the provision of new infrastructure.
Stakeholder views on the nature of capacity needed
4.76 Several stakeholders addressed the nature of the capacity needed in their
consultation responses, and reached very different views. Their conclusions were
driven to a large extent by contrasting assumptions around how the aviation sector
will develop. This can be illustrated by comparing the analyses submitted by the
Mayor of London112 and Gatwick Airport Limited.113
4.77 The Mayor of London’s analysis focuses on connectivity outcomes. It points to a
4-runway hub airport as the option providing London and the South East with the
best connectivity, compared to a ‘do nothing’ option or a ‘2-2-2’ airport system
where Gatwick and Stansted are expanded into two-runway airports to compete
with Heathrow. The outputs of this analysis are summarised below.
Table 4.3: The Mayor’s analysis of different capacity expansion options point to a four-runway hub solution
Destinations served and frequencies under different capacity options by 2050
No capacity change (2013)
No capacity change (2050)
2-2-2 (2050)4-runway hub
(2050)
Number of destinations
385 322 358 435
Frequencies 10,133 12,201 15,598 16,576
Source: Mayor of London’s submission to the Airport Operational Models discussion paper.
4.78 Gatwick Airport’s work, on the other hand, focuses on the additional capacity that
would be delivered by different options. It suggests that in 2030 a third runway at
112 http://www.tfl.gov.uk/corporate/projectsandschemes/27598.aspx113 http://www.gatwickairport.com/business-community/developing-gatwick/a-new-runway/

129
Chapter 4: The UK’s long-term capacity requirements
Heathrow would add 22 million passengers to the system while a second runway at
Gatwick would add 17 million. Gatwick’s analysis also includes the development of
viable route networks for each scenario considered as a means of identifying the
potential connectivity effects (using the IATA methodology discussed in Chapter 3).
The submission argues that after 2030 airlines would continue to add services to
the route network at Gatwick and that passengers would also benefit from
competition between the two airports.
Table 4.4: Gatwick’s analysis suggests an additional runway at Gatwick would add less traffic than an additional runway at Heathrow, but would further enhance the benefits of airport competition
Comparison of passenger numbers at Heathrow and Gatwick with additional runway by 2030
No capacity change (2030)
Third runway added to LHR (2030)
Second runway added to Gatwick (2030)
Number of passengers
120 million 142 million 137 million
Source: Gatwick’s long-term options submission
4.79 The differences between the Mayor of London’s conclusions and Gatwick Airport’s
conclusions are partly due to the different methodologies adopted by the two
studies, but are largely driven by different assumptions on the developments in the
airline sector and future passenger behaviour. The differences in assumptions are
summarised in Table 4.5.
Table 4.5: To forecast the future connectivity of various airport models the Mayor of London and Gatwick Airport made different assumptions on airline economic
Comparison of the Mayor of London and Gatwick Airport’s forecasting assumptions
Mayor of London Gatwick
Transfer passengers Self-connecting has limited potential to substitute for transferring within one airline alliance
Self-connecting will be more popular in the future as the market share of new more price sensitive passengers increases
Market for long-haul routes
Legacy carriers will maintain competitive advantage in the long-haul market
New more-efficient types of aircraft will enable low-cost carriers to compete with legacy carriers on long-haul routes
Alliances moving away from LHR
No alliance will move to a second-tier airport, the only possible move is to a more attractive hub
One scenario of expanding Gatwick assumes one alliance moves from LHR to Gatwick. A second scenario assumes no move to an expanded Gatwick.
Source: Mayor of London’s submission to the Airport Operational Models discussion paper and Gatwick’s long-term options submission

130
4.80 The Mayor assumes a future in which hubs and fewer, stronger airlines grow their
market share and global route networks become reinforced. Conversely, Gatwick
Airport believes that the future will see a relative decline in the importance of hubs
and alliances as low-cost airlines take over a significant share of the long-haul
market and price-sensitive passengers prefer to travel to second-tier airports. The
airport also argues that competition may drive further improvements, and potentially
incentivise an alliance to move its base to Gatwick were sufficient capacity available.
Airports Commission modelling results
4.81 The Airports Commission has tested the potential connectivity outcomes for two
possible future airport operational models. These two models were constructed
through adding capacity to the London airport system. In the first case –
concentrated – hub capacity is concentrated at one London airport (which has
unlimited capacity), while all the other airports focus on facilitating point-to-point
traffic. In the other case – dispersed – hub capacity is spread over two two-runway
airports that independently act as hubs for connecting traffic. Details of the
assumptions used in the model and the results are included in Appendix 3:
Technical Appendix.
4.82 Table 4.6 illustrates that the London airport system is likely to deliver slightly better
connectivity outcomes under a concentrated model, in terms of the number of
destinations served. However, the difference is not as marked in London as it would
be for many cities globally as London has the biggest origin and destination market
in the world,114 theoretically big enough to sustain two independent hub airports.
4.83 A concentrated system also serves more passengers in London and the South
East: by 2050 there are between 66,000 and 127,000 more ATMs under a
concentrated system. This model facilitates higher route densities through bringing
more passengers together than under a dispersed system.
114 PwC analysis of Sabre ADI

131
Chapter 4: The UK’s long-term capacity requirements
Table 4.6: The Commission’s forecasts of destinations served, passenger numbers and ATMs in the two London airport system scenarios are broadly similar
Passengers, ATMs and destinations served under dispersed and concentrated systems, carbon traded and capped, 2030, 2040 and 2050
Daily threshold 2030 2040 2050
CO2 traded
CO2 capped
CO2 traded
CO2 capped
CO2 traded
CO2 capped
Passengers (millions)
Dispersed 149 142 173 161 205 183
Concentrated 164 153 194 172 223 198
Difference 15 11 21 11 18 15
ATMs (000s)
Dispersed 1044 1003 1163 1094 1344 1,225
Concentrated 1133 1071 1306 1161 1471 1,291
Difference 89 68 143 67 127 66
Number of destinations served
Dispersed 211 206 228 221 248 240
Concentrated 217 216 235 229 249 244
Difference 6 10 7 8 1 4
4.84 This analysis has been carried out using the Commission’s updated version of the
DfT model. This derives its forecasts from historic trends and does not currently
incorporate the possibility of a step-change in capacity or connectivity at any
particular airport (for example, through the development of a substantial low-cost
long-haul network). The Commission intends to look in more detail in the next
phase of its work programme at the plausibility of such step-changes and their
potential impacts.
4.85 The analysis above also needs to be put into a wider societal and business context.
Whilst it demonstrates that a concentrated model may have some degree of
connectivity advantage in terms of the number of routes and frequencies offered,
connectivity may have other important dimensions – such as affordability and
accessibility. Taking a view on long-term expansion options also requires scrutinising
both the potential benefits, such as connectivity and agglomeration benefits, and
the potential costs, such as pollution, noise, congestion, on roads around the
airport and public transport.

132
4.86 This modelling cannot fully account for airlines’ commercial behaviour. IAG (a key
member of oneworld alliance), SkyTeam and Star Alliance argue that they would not
move away from Heathrow to a different hub. Such a potential move would result in
foregoing substantial expenditure by all three alliances on Heathrow’s terminals and
other infrastructure and facing uncertainty around the attractiveness to passengers
of a relatively unknown airport. Also, although alliances do not mention this point
specifically, one alliance freeing up slots at Heathrow could benefit its competitors.
4.87 The Commission will examine these questions further in the next phase of its work.
On the one hand, airlines are truly global in nature and many of them may have a
high degree of flexibility when it comes to locating their bases. This point may be
especially relevant for Europe, where distances between major airports are not as
great as on other continents and, as a result, competition for international-to-
international transfer passengers may be higher. On the other hand, London as a
global city provides airlines based there with access to currently the biggest OD
market in the world.
Implications of the Commission’s scenarios
4.88 The Commission has also used the scenarios set out in Chapter 2 to test how
conclusions on the nature of capacity needed vary according to key assumptions
around the future development of the aviation sector. The key modelling
assumptions for each scenario, and their implications for UK airports, are set out
in Table 4.7.
Table 4.7: Four scenarios have been used to inform sensitivity tests around the baseline forecasts
ScenarioModelling assumptions changed (relative to baseline)
Key results and implications for UK airports
A: Global Growth
●● GDP of newly industrialised and less developed countries rises 2% per annum above the baseline.
●● Passenger demand growth of 70% between 2005 and 2050, due to the introduction of more fuel-efficient aircraft.
●● 1% per annum growth of international-to-international transfer passenger demand above the baseline.
●● All London airports except Stansted are full by 2030
●● All London airports, plus Birmingham and Southampton, are full by 2050
●● Hub capacity particularly in demand

133
Chapter 4: The UK’s long-term capacity requirements
Table 4.7: Four scenarios have been used to inform sensitivity tests around the baseline forecasts
ScenarioModelling assumptions changed (relative to baseline)
Key results and implications for UK airports
B: Relative decline of Europe
●● 1% per annum reduction in I-I transfer passenger demand relative to the baseline
●● LCCs operate a new generation of twin-aisle aircraft which accommodate up to 220 passengers
●● Very large aircraft operated by network carriers (Boeing 747, A380) are replaced by smaller, more fuel-efficient aircraft like B787 and A350
●● Larger twin-engine aircraft (e.g. B777) continue to operate
●● The number of terminal passengers at UK airports would be slightly lower than in the baseline
●● Heathrow and Gatwick still full by 2020
●● Dubai International has grown at the expense of European hubs, with about 20 million more terminal passengers relative to the baseline
C: Low-cost is King
●● 1% per annum reduction in I-I passengers relative to the baseline
●● Higher share of traffic is assumed to be low-cost carriers and charter
●● A proportion of A380s have been replaced with smaller aircraft like B787 and A350
●● Low-cost and charter airlines capture over 50% of the market
●● Reduced passenger numbers at all EU hubs, with second tier airports growing in strength
●● Total terminal passengers at UK airports are broadly in line with baseline forecasts
●● There has been a switch in demand from Heathrow to Gatwick, which offers cheaper landing charges and has invested in facilities to enable self-connecting
D: Global Fragmentation
●● UK GDP grows more slowly (by about 0.5% per annum in the longer-term relative to the baseline); GDP of all the other economies declines by 1% per annum relative to the baseline
●● Carbon traded
●● Numbers of I-I passengers held constant at 2011 baseline levels
●● The relative attractiveness of Dubai decreases over time
●● Hub capacity has declined in importance as low-cost carriers capture a large market share
●● Reduced terminal passenger numbers compared to baseline, although all London airports except Stansted are still full by 2040
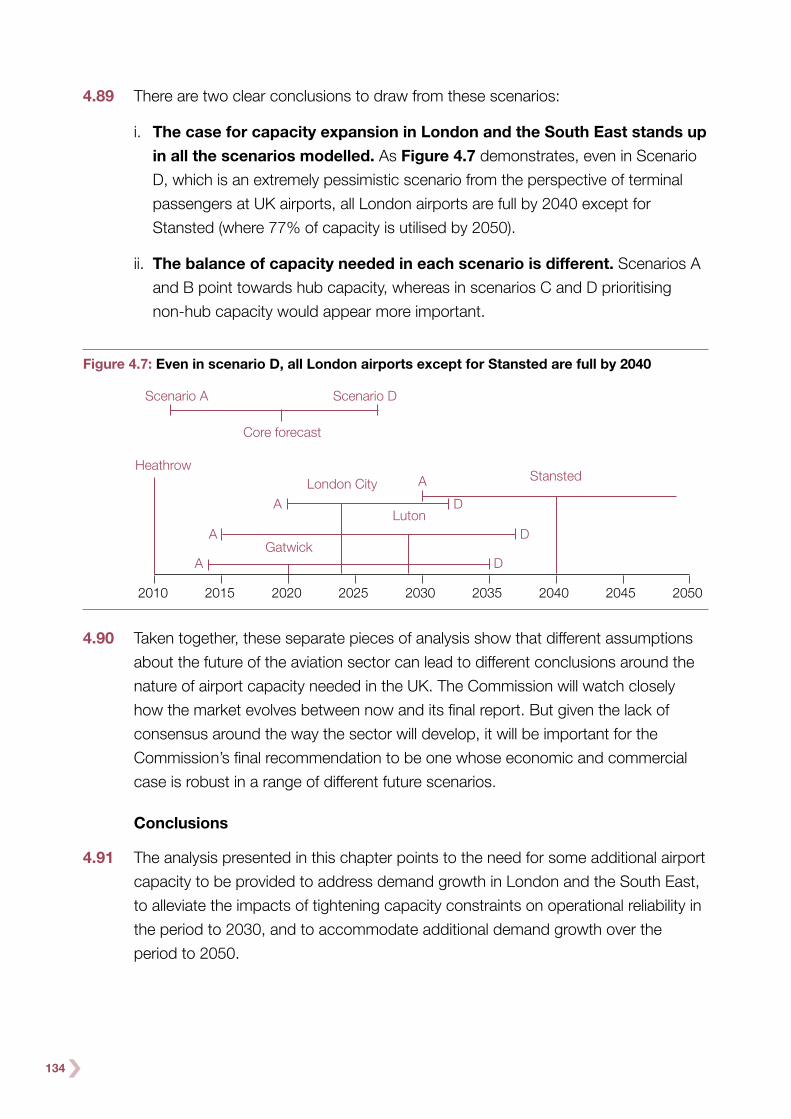
134
4.89 There are two clear conclusions to draw from these scenarios:
i. The case for capacity expansion in London and the South East stands up
in all the scenarios modelled. As Figure 4.7 demonstrates, even in Scenario
D, which is an extremely pessimistic scenario from the perspective of terminal
passengers at UK airports, all London airports are full by 2040 except for
Stansted (where 77% of capacity is utilised by 2050).
ii. The balance of capacity needed in each scenario is different. Scenarios A
and B point towards hub capacity, whereas in scenarios C and D prioritising
non-hub capacity would appear more important.
Figure 4.7: Even in scenario D, all London airports except for Stansted are full by 2040
4.90 Taken together, these separate pieces of analysis show that different assumptions
about the future of the aviation sector can lead to different conclusions around the
nature of airport capacity needed in the UK. The Commission will watch closely
how the market evolves between now and its final report. But given the lack of
consensus around the way the sector will develop, it will be important for the
Commission’s final recommendation to be one whose economic and commercial
case is robust in a range of different future scenarios.
Conclusions
4.91 The analysis presented in this chapter points to the need for some additional airport
capacity to be provided to address demand growth in London and the South East,
to alleviate the impacts of tightening capacity constraints on operational reliability in
the period to 2030, and to accommodate additional demand growth over the
period to 2050.
Heathrow
Core forecast
Scenario A Scenario D
London CityStanstedA
A D
D
D
A
A
Luton
Gatwick
2010 2015 2020 2025 2030 2035 2040 2045 2050

135
Chapter 4: The UK’s long-term capacity requirements
4.92 The analysis shows that there is a clear case for at least one net additional runway
by 2030 across a range of scenarios, including where the UK is meeting its climate
change targets. This is compatible with a number of specific airport expansion
proposals that have been put to the Commission.
4.93 The Commission’s forecasts indicate that there would be likely to be a demand
case for a second additional runway in operation by 2050 or, in some scenarios,
slightly earlier. The Commission will carry out further analysis in the second phase of
its work programme, including looking at the implications for any future capacity
expansion of each of the new runway options shortlisted for detailed consideration,
in order to be able to make recommendations to Government in its final report as to
when, how and by whom the case for a second new runway should be considered.
4.94 Chapter 6 sets out the Commission’s assessment of the various proposals for
addressing the UK’s airport capacity gap, in light of the analysis set out in this
chapter. Chapter 5, sets out the Commission’s recommendations for making best
use of existing airport capacity in the period before any new infrastructure comes
on line.

136
Chapter 5:
Making best use of existing capacity
SUMMARY
The emerging problems for UK airports cannot be addressed without some new
infrastructure, but there are opportunities to make better use of existing capacity in
the short-term.
The Commission recommends:
●● An ‘Optimisation Strategy’ to improve the operational efficiency of UK airports and
airspace, including:
–● Airport Collaborative Decision Making;
–● airspace changes supporting performance based navigation;
–● enhanced en-route traffic management to drive tighter adherence to schedules;
–● Time Based Separation.
●● Trials at Heathrow of measures to smooth the early morning arrival schedule to
minimise stacking and delays and to provide more predictable respite for local
people.
●● The establishment of a Senior Delivery Group to drive forward the implementation
of the Future Airspace Strategy and the delivery of the Commission’s
recommendations.
●● The creation of an Independent Aviation Noise Authority to provide expert and
impartial advice about the noise impacts of aviation and to facilitate the delivery
of future improvements to airspace operations.
●● A package of surface transport improvements to make airports with spare capacity
more attractive to airlines and passengers, including:
–● the enhancement of Gatwick Airport Station;
–● further work to develop a strategy for enhancing Gatwick’s Road and Rail
Access;

137
Chapter 5: Making best use of existing capacity
●– work on developing proposals to improve the rail link between London and
Stansted;
●– work to provide rail access into Heathrow from the South; and,
●– the provision of smart ticketing facilities at airport stations.
These measures are worthwhile on their own terms, but none of them provides a
long-term solution to the UK’s airport capacity problem.
The Chair of the Commission wrote to the Chancellor of the Exchequer on
26 November about the surface transport recommendations. HM Treasury’s National
Infrastructure Plan, published on 4 December, began the process of implementing
them. The Commission welcomes this, and encourages the Government to continue
to work on the delivery of the surface transport improvements.
5.1 In the short-term, the most significant effect of capacity constraints at UK airports is
reduced airport resilience. At Heathrow, this is already causing delays for
passengers. It is also causing unnecessary disruption for communities around
airports, whose exposure to aircraft noise is exacerbated and rendered less
predictable by the effects of delay on airport operations. The environmental impacts
of delay go wider still, as delays and airborne holding result in unnecessary
emissions.
5.2 As this report has argued, these problems can only be resolved in the longer-term
by adding new capacity. But the Commission’s remit also requires it to look at how
to make best use of existing airport infrastructure, before new capacity becomes
operational. This is not a new issue – it is one the aviation industry grapples with
every day. The Commission’s call for proposals therefore generated a wide range
of responses. Three key themes emerged:
●● Theme 1: that the aviation industry has itself recognised many of the specific
technical, operational and behavioural changes that would promote more
effective operations at UK airports and within UK airspace – particularly at the
most congested airports within the London area – but that progress on
implementing these changes has been slow and more momentum is required;
●● Theme 2: that there are opportunities for Government to encourage airlines to
use spare capacity in the UK’s airport system more effectively, through a
combination of incentives and facilitating measures. Through measures such as

138
improvements to surface access, the Government can help to shape industry
behaviours; and,
●● Theme 3: that there are more far-reaching changes that might be implemented
in respect of current capacity, but that these cannot be considered in isolation
from the longer-term options for adding additional airport capacity and
recommendations on them will therefore need to wait for the final report.
5.3 In reaching its recommendations, the Commission has followed an open process
with opportunities for public and stakeholder engagement. The details of this
process are described in Appendix 1. The Commission has sought to take a
balanced and integrated approach, considering measures not only in terms of
their impacts on the aviation sector, but also wider environmental and community
impacts.
5.4 The Commission recommends a range of short-term measures to improve the
efficiency of the UK’s current aviation system. Properly implemented, these actions
will produce substantial benefits for the UK. They will also provide a basis upon
which any future long-term strategy for new capacity, along with its supporting
transitional arrangements, can be built.
5.5 The main proposals are:
●● An Optimisation Strategy consisting of a range of improvements designed to
increase the capacity and efficiency of the UK’s airspace. The measures are
highly dependent on each other and to produce the most benefit must be
implemented together. They include:
– Airport Collaborative Decision Making;
– airspace changes supporting performance based navigation;
– enhanced en-route traffic management to drive tighter adherence to schedule;
and,
– Time Based Separation.
●● Trials at Heathrow of measures to smooth the early morning arrival schedule to
minimise delays and provide more predictable respite for local communities as
part of a range of measures to increase the flexibility of runway use at Heathrow.
●● The establishment of a Senior Delivery Group to drive forward the implementation
of the Future Airspace Strategy – the most significant development in improving
the UK’s aviation efficiency for over 40 years – and the delivery of the

139
Chapter 5: Making best use of existing capacity
Commission’s recommendations, showing strong leadership and accountability
for delivery.
●● The creation of an Independent Aviation Noise Authority to provide expert and
impartial advice about the noise impacts of aviation and facilitate the delivery
of future improvements to airspace operations.
●● A package of surface transport improvements to make airports with spare
capacity more attractive to airlines and passengers, including:
– the enhancement of Gatwick Airport Station;
– further work to develop a strategy for enhancing Gatwick’s Road and
Rail Access;
– work on developing proposals to improve the rail link between London and
Stansted;
– work to provide rail access into Heathrow from the south; and,
– the provision of smart ticketing facilities at airport stations.
5.6 The detail and rationale behind each of these proposals is described further in this
Chapter, while a full list of the components of the Commission’s strategy can be
found in Appendix 1.
5.7 The benefits of implementing the Optimisation Strategy are significant. Every
cancelled business meeting or shortened leisure trip has a consequent impact
on the economy.
5.8 The Commission’s analysis indicates economic benefits between 2014 and
2030 from the Optimisation Strategy, with a net present value in the region of
£2.3 billion.115 The benefits of the surface access measures are more difficult to
quantify, but in light of the length of time until new capacity can be brought online,
it is important that we make the most effective use of the capacity we currently have
in the interim. Improving surface access can help to achieve that.
115 The net present value has been calculated by the Commission’s technical consultants for details of their methodology please refer to the ‘Short term options: technical report’

140
Theme 1: More effective operations of UK airports and airspace
5.9 NATS – the UK’s provider of en-route air traffic control – has described the routes
within our airspace as the motorways of the sky. These motorways now need to be
optimised to support a more efficient and resilient aviation sector by allowing aircraft
to climb faster and to fly more direct routes into and out of our airports, reducing
their noise and emissions.
5.10 London terminal airspace is one of the busiest and most complex systems in the
world supporting the five London airport arrival and departure routes. According to
Eurocontrol,116 the number of flights arriving and departing London’s airports per
day, was around 3,386, averaged over 2012. It is difficult to compare this directly
with other European cities as airspace is structured differently across Europe,
however this average can be roughly compared to the lower airspace over the
Netherlands – including Amsterdam Schiphol – which experiences around 1,393
aircraft movements per day averaged over 2012. Perhaps the most directly
comparable airspace system to London is New York’s which in its lower airspace
experiences around 5,100 aircraft movements per day averaged over 2012.117
5.11 Figure 5.1 shows the routes flown into and out of the London area converging to
support the five main civilian airports at or below 25,000ft on a daily basis. The
routes overlap in large part, demonstrating the complexity of the system whereby air
traffic control are required to maintain safe distances between aircraft arriving and
departing from different airports in the same area with aircraft passing above and
below each other to reach their destination. Figure 5.1 also shows there are few
parts of London which are not over flown by aircraft.
116 Eurocontrol, Performance Review Report, 2012 117 FAA OPSNET
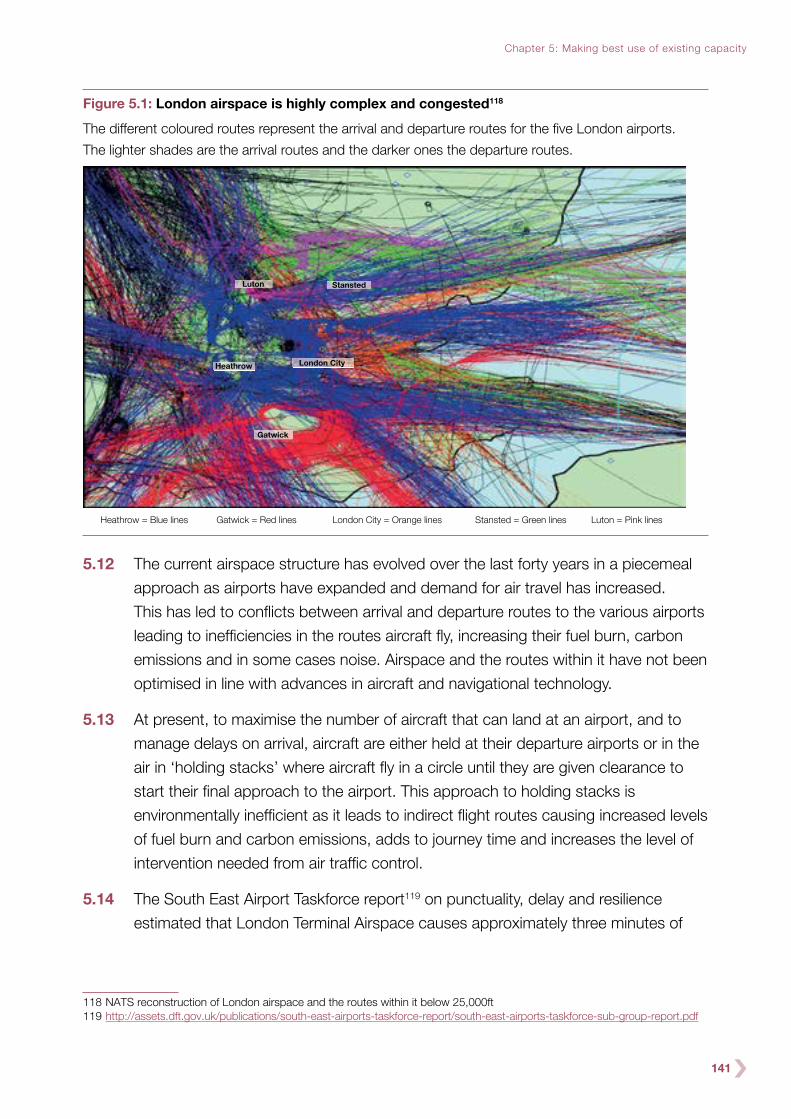
141
Chapter 5: Making best use of existing capacity
Figure 5.1: London airspace is highly complex and congested118
The different coloured routes represent the arrival and departure routes for the five London airports.
The lighter shades are the arrival routes and the darker ones the departure routes.
Heathrow
Gatwick
Luton Stansted
London City
Heathrow = Blue lines Gatwick = Red lines London City = Orange lines Stansted = Green lines Luton = Pink lines
5.12 The current airspace structure has evolved over the last forty years in a piecemeal
approach as airports have expanded and demand for air travel has increased.
This has led to conflicts between arrival and departure routes to the various airports
leading to inefficiencies in the routes aircraft fly, increasing their fuel burn, carbon
emissions and in some cases noise. Airspace and the routes within it have not been
optimised in line with advances in aircraft and navigational technology.
5.13 At present, to maximise the number of aircraft that can land at an airport, and to
manage delays on arrival, aircraft are either held at their departure airports or in the
air in ‘holding stacks’ where aircraft fly in a circle until they are given clearance to
start their final approach to the airport. This approach to holding stacks is
environmentally inefficient as it leads to indirect flight routes causing increased levels
of fuel burn and carbon emissions, adds to journey time and increases the level of
intervention needed from air traffic control.
5.14 The South East Airport Taskforce report119 on punctuality, delay and resilience
estimated that London Terminal Airspace causes approximately three minutes of
118 NATS reconstruction of London airspace and the routes within it below 25,000ft 119 http://assets.dft.gov.uk/publications/south-east-airports-taskforce-report/south-east-airports-taskforce-sub-group-report.pdf

142
delay per flight over Europe120 due to the high level of demand. This is exacerbated
by the lack of spare capacity – particularly at Heathrow – to mitigate and recover
from the impacts of disruption. In addition, the report suggested that tactical
measures imposed at Heathrow and Gatwick due to constraints on departures
through London Terminal Airspace contribute to start up delays of up to six minutes
on average per flight at Heathrow and four minutes on average per flight at Gatwick,
though as these are average figures, actual delays can be significantly higher.
5.15 Delays are also caused by poor weather conditions such as low visibility and strong
winds, which impact all airports. The Eurocontrol Central Office for Delay Analysis121
reported that in 2012 Heathrow suffered delays due to poor weather conditions
ranging from low visibility through to high winds and thunderstorms in 11 months of
the year. These weather conditions are just one of a range of reasons for a loss of
resilience which include delays caused by passengers; late arrival of aircraft; and
incidents at airports to name but a few. Heathrow’s segregated mode of operations,
whereby one runway is used for arrivals and one for departures, also contributes to
its difficulty in recovering from delay.
5.16 The extent of demand for access to the London terminal airspace is not the only
cause of delays; the high levels of airport capacity utilisation are also to blame.
For example, as explained in the South East Airport Taskforce report, the high
utilisation of Heathrow Airport entails considerable queuing for use of the runways.
This manifests itself in holding delays – of an average of 15 minutes per flight for
arrivals and an average of 20 minutes per flight for departures. These delays vary
through the day. At Gatwick, as the runway utilisation is a little more variable than at
Heathrow, this translates to moderate queues at peak times with up to 10 minutes
on average per flight for arrivals and up to 15 minutes on average per flight for
departures.
5.17 While some delays are inevitable – for example, those caused by the most severe
weather events such as heavy snow – the optimisation of the interactions between
airspace and airport operations could improve the system’s resilience and ability to
respond to disruption, reducing delays and cancellations currently associated with
high winds for example. The Commission has identified an Optimisation Strategy for
making the best use of existing capacity, with a particular focus on Heathrow.
120 The circa three minutes of delay per flight refers to holding delays on the ground at the departure airport imposed by the European network manager (Eurocontrol) that are attributed to the London Terminal Airspace (also referred to as the London Terminal Manoeuvring Area). This type of holding delay – where aircraft are held at the departure airport – is known as ‘air traffic flow management (ATFM)’
121 Eurocontrol Central Office for Delay Analysis, CODA Digest, ‘Delays to Air Transport in Europe’, Annual 2012

143
Chapter 5: Making best use of existing capacity
Optimisation strategy
5.18 The approach to aircraft holding observed today is partly a consequence of the lack
of sharing of real time information about when aircraft are going to arrive in London
airspace. Sharing operational information will allow all those involved in processing
arriving aircraft to prepare in advance, increasing the predictability and speed of the
aircraft turnaround process.
Airport Collaborative Decision Making
5.19 Heathrow and Gatwick have invested heavily in a system called Airport
Collaborative Decision Making (ACDM) which provides access to accurate and
timely flight information. This is expected to start delivering improvements in terms
of reduced delays on the ground; reduced costs to airlines, ground handlers and
other stakeholders; more flexibility for air traffic control in how they prioritise and
sequence departures; and the optimisation of the use of the airport’s capacity, for
example through the allocation of aircraft stands and gates, allowing for greater use
of the runway. ACDM has allowed Gatwick to increase the number of movements
it can process per hour at the airport from 50 to 55 movements at peak times.
5.20 The industry should implement ACDM quickly and seize the opportunity it provides
to make use of the data collected by the system to help inform the definition of
airport schedules and to monitor compliance against these.
5.21 Further benefits can be derived if more UK airports put departure information into
the system so that air traffic control both in the UK and in Europe can receive real
time information about target take off times. Airports with 30,000 movements per
year and above should invest in this Departure Planning Information (DPI)
functionality by April 2015 to ensure the most efficient use of airspace over the UK
in support of the implementation of the Future Airspace Strategy.
Airspace improvements
5.22 The complex nature of the London terminal airspace will remain a limiting factor on
airport capacity unless much needed improvements to its design are implemented.
This is particularly the case when delays have built up.
5.23 At present aircraft depart along ‘Standard Instrument Departure routes’ (SIDs).
These follow the centreline of ‘Noise Preferential Routes’ (NPRs), which were
designed in the 1960s to avoid overflying built up areas where possible. By
redesigning SIDs in line with the capability of modern aircraft it may be possible to
reduce the separation between departures and increase runway capacity. Modern

144
aircraft with performance based navigation capability are able to follow much more
accurate tracks providing confidence in their ability to avoid deviating from them.
5.24 Reducing separation between departure routes does not translate into an increase
in the airport’s overall capacity due to constraints elsewhere in the system relating
to arriving traffic and ground infrastructure. But it would allow for easier recovery
from disruption, which at present has a tendency to accumulate due to the
constraints of airspace operations.
5.25 The Government should facilitate moves by industry to redesign airspace within
the London area to a performance based navigation standard allowing for closer
spaced departure routes where possible. Airports should also work closely with
NATS to consider the feasibility and implementation of alternating arrival and
departure routes to offer respite for local communities living under these aircraft
paths.
Arrival management
5.26 NATS is establishing systems to manage the arrival of aircraft more effectively than
at present, including through ‘linear holding’, reducing the requirement to stack.
Air traffic control will be able to request aircraft to absorb delays en-route, reducing
fuel burn and CO2 caused by the stack, while also allowing air traffic control to
sequence arrival traffic in a way which makes the best use of runway capacity. This
is particularly relevant now with an increasing number of A380s flying into Heathrow
which require larger separations between them and the following aircraft and more
time to vacate the runway which could have a detrimental impact on the airport’s
capacity.
5.27 NATS should continue to drive this concept forward to reduce the use of holding
stacks. The Commission recommends that NATS encourage greater adherence to
schedule by airlines through stricter enforcement of aircraft required time of arrival at
fixed points en-route.
Time based separation
5.28 As aircraft begin to descend, air traffic controllers currently separate them by fixed
distances based on the aircraft sequence on the approach. However, the current
distance based separation does not take account of the effect of wind on the
aircraft’s speed. For example, during periods of strong headwinds, aircraft generally
travel at slower speeds relative to the ground which means that the separation
between successive arrivals increases. This means that fewer aircraft land per hour,
increasing delays at the airport and potentially leading to cancellations.

145
Chapter 5: Making best use of existing capacity
5.29 The use of time based separation would enable air traffic control to apply the same
time spacing between aircraft irrespective of wind conditions. This would result in a
much more consistent approach to aircraft separation in a much wider range of
wind conditions. NATS estimates that given prevailing wind conditions at Heathrow,
and the currently observed traffic mix, time based separation could recover up to
five movements per hour on windy days. Those movements would otherwise be
delayed or cancelled.
5.30 A typical landing rate at Heathrow is 42-44 aircraft per hour. On high wind days this
can drop to 36 per hour. On 11 March 2013 there was a high wind day so a 36
aircraft per hour flow rate was applied for most of the day at Heathrow which
resulted in 11,249 minutes of delay. NATS estimates that the use of Time Based
Separation could have reduced this delay figure by 32%.
5.31 Time Based Separation has not yet been introduced anywhere else in the world and
would therefore require a stringent safety case to be undertaken by the Civil Aviation
Authority (CAA). That work should be taken forward urgently with a view to
implementation at Heathrow by 2015 followed by implementation at Gatwick.
Flexible use of runways
5.32 The intensity with which Heathrow and Gatwick’s capacity is used means that it is
difficult for the airports to recover quickly from delays. The airports require increased
flexibility to enable them to:
●● improve the airport’s resilience by increasing its ability to react to disruption
through the advanced planning of its response;
●● increase flexibility to amend operations in response to delay build up; and,
●● be more flexible in the use of runways to manage noise impacts.
5.33 A range of proposals were received which met the objectives set out above.
The majority related to Heathrow.
Operation of an optimised, daily service plan
5.34 With the increase in information available through ACDM, linear holding and weather
forecasting, airports should be able to generate a strategic plan for delivery of the
schedule one day in advance to identify where there will be pinch points in the
schedule or where it will not be met. This would allow for preventative action to be
taken in advance where necessary, and for cancellations to be managed in a
controlled way with passengers being informed in advance.

146
Tactical management of arrivals throughout the day
5.35 To recover from arrival delay, Heathrow can use both its runways to land aircraft,
disrupting the departure flow temporarily. This is known as Tactically Enhanced
Arrival Management (TEAM). TEAM is enacted when a set of trigger conditions are
met, most notably a 20 minute delay on arrival. Its use is limited to six arrivals on the
departure runway per hour.
5.36 Heathrow airport recently undertook a trial to test the impact of changing the trigger
conditions for the use of TEAM so that it could be enacted if there was a 10 minute
delay on arrival and the number of arrivals using TEAM per hour was increased to
twelve arrivals per hour. The trial demonstrated that the use of this enhanced TEAM
supported effective and increased flexibility when compared to the pre-existing
TEAM availability. It also demonstrated that there was a fine balance between
arrivals and departures meaning that if too many arrivals were landed using both
runways, this would result in a reduction in the number of departures possible.
Therefore, the use of enhanced TEAM was self regulating. With this in mind, the
ability to respond to delays that are mounting at an early stage instead of waiting
until a trigger point of 20 minutes appears to introduce more operational flexibility
into Heathrow’s ability to manage arrival delay.
5.37 Following consultation, Heathrow should continue to operate enhanced TEAM to
allow delays to be tackled as they start building up, taking advantage of more
accurate schedule information so as to balance demand for arrivals and departures.
5.38 The number of A380s using Heathrow is set to increase over the coming years –
projected to increase from 21 daily arrivals in 2014 to 62 daily arrivals by 2030. In
the short-term, the airport should have the operational flexibility to land A380s on
the departure runway if this is necessary to retain the high levels of runway
throughput required to meet the schedule. Heathrow should also have the flexibility
to land arrivals for Terminal Four on the departure runway if this is the closest
runway for the terminal to avoid the aircraft having to cross the runway if delays
are occurring.
Departure management
5.39 The airspace structures around Heathrow do not support simultaneous departures
from both runways in the same way as they support TEAM, so if there is a build up
of delay on departure, there are few tools available.
5.40 Heathrow has trialled the use of early vectoring which allowed air traffic control to
direct aircraft to turn off SIDs earlier than normal. This meant that air traffic control

147
Chapter 5: Making best use of existing capacity
could reduce the separation between departures, thereby increasing the departure
rate. Whilst these early vectors were only trialled using two SIDs, they provided
some flexibility for air traffic control in managing departure delay and disruption.
Early vectoring also redistributed the noise footprint within and near to the edge of
the affected NPRs meaning that more people were impacted by aircraft noise in a
given hour without the predictability of normal operations where aircraft would
normally follow the centre line of the departure route. The integration of early
vectoring practices into normal Heathrow operations as part of a permanent
airspace change would increase the operational flexibility available to air traffic
control whilst increasing the predictability and information about where aircraft are
likely to overfly.
5.41 The early vectoring approach should be introduced as a permanent feature of
Heathrow operations so long as it forms part of a permanent airspace structure.
The Government should therefore support the airport in its efforts to expedite the
re-definition of its departure routes both to mitigate noise impacts and to enable
increased departure flow rates when necessary.
Alternation
5.42 Heathrow’s runways are oriented east-west and, as the prevailing wind is
predominantly westerly, the airport operates mainly with arrivals and departures to
the west, so as to fly into the wind. This is supplemented by a so-called ‘westerly
preference’ during daytime operations, which means that the airport continues to
operate in a westerly direction until any tailwind exceeds five knots. This means that
for approximately 75% of the time, flights operate to the west; approaching over
London and departing over Windsor. The westerly preference was introduced in the
1960s to reduce numbers of aircraft taking off in an easterly direction over London
as it was considered then that departure noise was louder than arrivals. However,
developments in aircraft technology have changed this balance over time. For this
reason, the Government should review the need for a westerly preference with a
view to introducing a ‘no preference’ policy.
5.43 During westerly operations one runway is used for arrivals and the other for
departures, with the arrival and departure runways being swapped (alternated) at
15:00 hours each day to give those living under the flight paths respite from noise.
For historical reasons, when the airport is operating in an easterly direction, the
northern runway can only be used for arrivals and the southern runway for
departures. This was to protect the village of Cranford, situated to the east of the
northern runway, from departure noise. The agreement that supported this
operational decision was rescinded by the previous Government and this decision

148
was confirmed in 2010 by the current Government. A planning application is
currently underway for the infrastructure required to support the alterations to the
airfield required to implement this decision.
5.44 Runway alternation should be enabled as rapidly as possible for easterly operations.
This will provide respite for those, particularly in Windsor, who do not currently
benefit from alternation.
Early morning smoothing
5.45 Delay often starts building at Heathrow from 06:00. The number of movements
before this – during the night period (23:00 and 05:59) – is strictly regulated as part
of the Department for Transport’s night noise regime with an average of 15
movements scheduled in this period.
5.46 Currently there are no flights scheduled at Heathrow between 06:00 and 06:20.
This is to ensure that no flights other than those allowed as part of the night noise
regime can arrive before 06:00, which would infringe the current night flight regime.
In practice, flights can land from 06:00 as they are technically classed as having
arrived ‘on-slot’ (at their scheduled time) even if they are 20 minutes early. The
airport is, therefore, effectively closed, opening for normal business at 06:00. This
creates a bunching effect immediately before 06:00 resulting in holding delays at
the start of the day which can knock-on to affect flights during the rest of the day.
5.47 To counter this delay, the airport routinely enacts TEAM (see paragraphs 5.35 –
5.38). In the 2012 summer season and 2012/13 winter season, TEAM was used
almost every day to manage arrival queues. This reduces respite for those living
under the departure runway who would not be expecting to be overflown on that
morning. It can also lead to further negative impacts for local communities as delays
build throughout the day and flights end up having to depart after 23:30 to recover.
5.48 The loss or reduction of respite is a key issue for the local community living around
Heathrow.
5.49 Smoothing the early morning arrivals to allow for more flights between the 05:00 to
05:59 period should reduce the peak of arrivals in the 06:00 hour and, as a result,
limit the use of both runways for arrivals to those days when the most significant
delays are experienced. This would therefore provide more certainty for those not
expecting to be overflown as part of their half day respite arrangements.
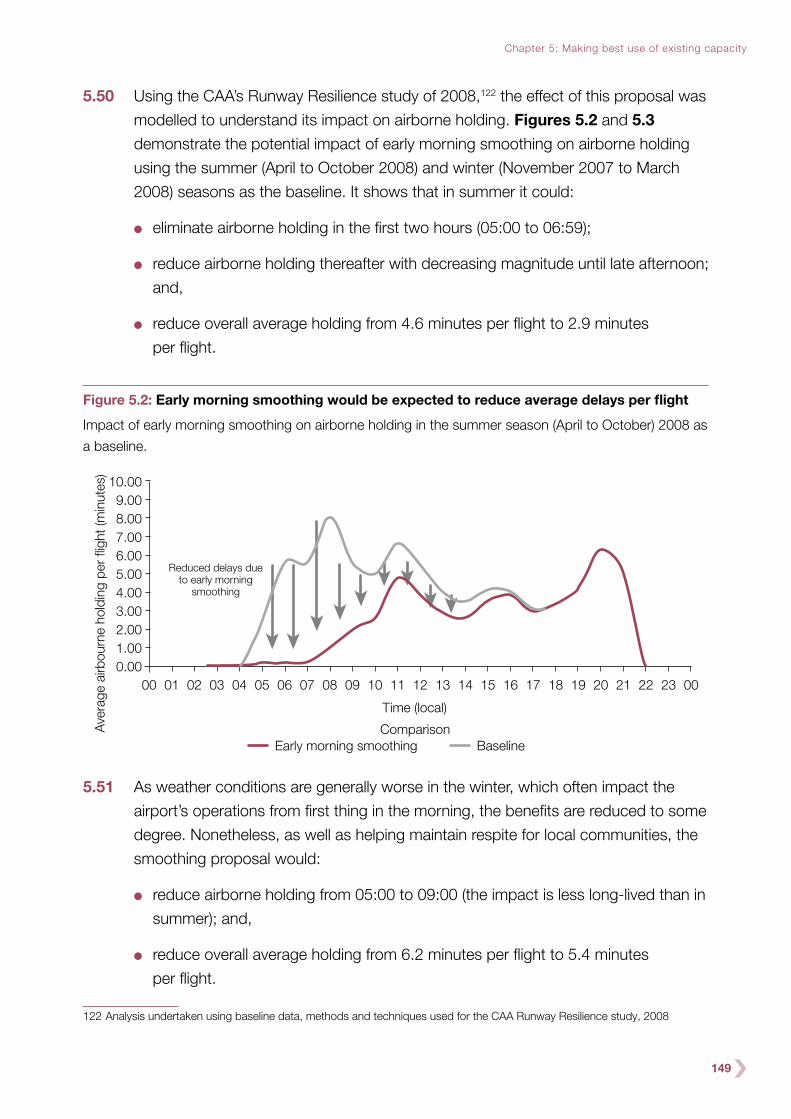
149
Chapter 5: Making best use of existing capacity
5.50 Using the CAA’s Runway Resilience study of 2008,122 the effect of this proposal was
modelled to understand its impact on airborne holding. Figures 5.2 and 5.3
demonstrate the potential impact of early morning smoothing on airborne holding
using the summer (April to October 2008) and winter (November 2007 to March
2008) seasons as the baseline. It shows that in summer it could:
●● eliminate airborne holding in the first two hours (05:00 to 06:59);
●● reduce airborne holding thereafter with decreasing magnitude until late afternoon;
and,
●● reduce overall average holding from 4.6 minutes per flight to 2.9 minutes
per flight.
Figure 5.2: Early morning smoothing would be expected to reduce average delays per flight
Impact of early morning smoothing on airborne holding in the summer season (April to October) 2008 as
a baseline.
10.009.008.007.006.005.004.003.002.001.000.00
00 01 02 03 04 05 06 07 08 09 10 11 12
Ave
rage
airb
ourn
e ho
ldin
g pe
r fli
ght (
min
utes
)
13 14 15 16 17 18 19 20 21 22 23 00
Early morning smoothing BaselineComparison
Time (local)
Reduced delays dueto early morning
smoothing
5.51 As weather conditions are generally worse in the winter, which often impact the
airport’s operations from first thing in the morning, the benefits are reduced to some
degree. Nonetheless, as well as helping maintain respite for local communities, the
smoothing proposal would:
●● reduce airborne holding from 05:00 to 09:00 (the impact is less long-lived than in
summer); and,
●● reduce overall average holding from 6.2 minutes per flight to 5.4 minutes
per flight.
122 Analysis undertaken using baseline data, methods and techniques used for the CAA Runway Resilience study, 2008
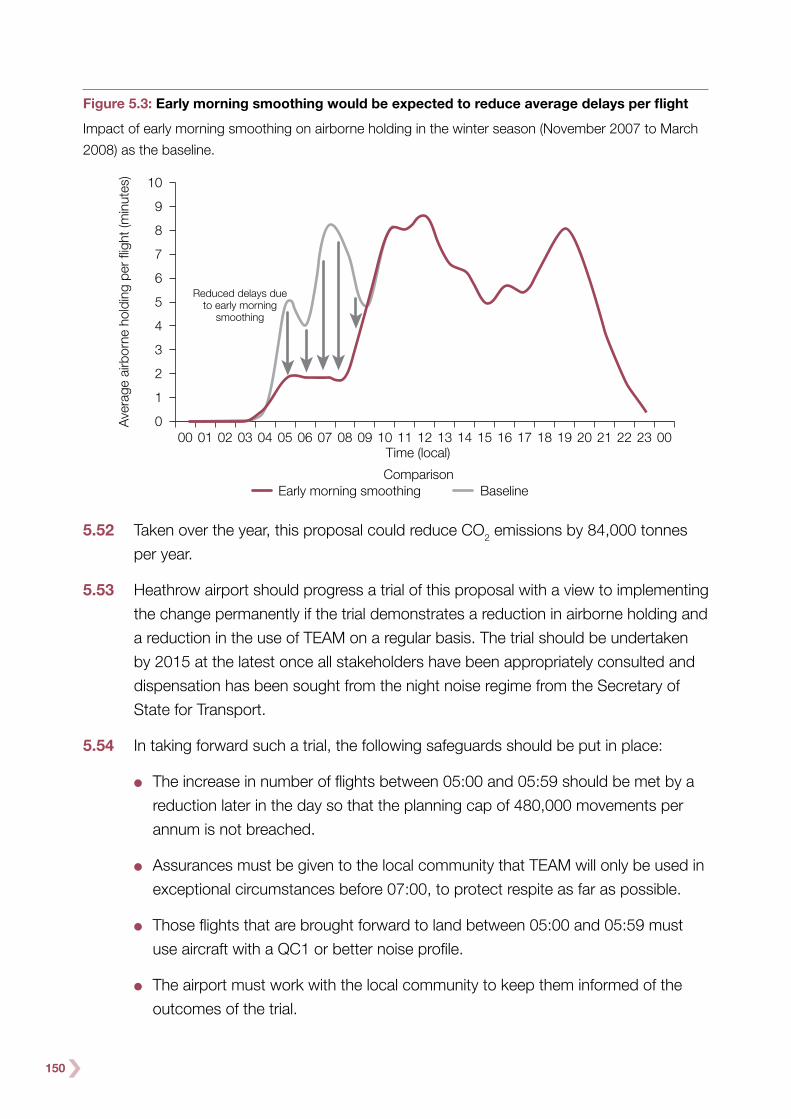
150
Figure 5.3: Early morning smoothing would be expected to reduce average delays per flight
Impact of early morning smoothing on airborne holding in the winter season (November 2007 to March
2008) as the baseline.
Early morning smoothing BaselineComparison
Time (local)
Ave
rage
airb
orne
hol
ding
per
flig
ht (m
inut
es)
0
1
2
3
4
5
6
7
8
9
10
00232221201918171615141312111009080706050403020100
Reduced delays dueto early morning
smoothing
5.52 Taken over the year, this proposal could reduce CO2 emissions by 84,000 tonnes
per year.
5.53 Heathrow airport should progress a trial of this proposal with a view to implementing
the change permanently if the trial demonstrates a reduction in airborne holding and
a reduction in the use of TEAM on a regular basis. The trial should be undertaken
by 2015 at the latest once all stakeholders have been appropriately consulted and
dispensation has been sought from the night noise regime from the Secretary of
State for Transport.
5.54 In taking forward such a trial, the following safeguards should be put in place:
●● The increase in number of flights between 05:00 and 05:59 should be met by a
reduction later in the day so that the planning cap of 480,000 movements per
annum is not breached.
●● Assurances must be given to the local community that TEAM will only be used in
exceptional circumstances before 07:00, to protect respite as far as possible.
●● Those flights that are brought forward to land between 05:00 and 05:59 must
use aircraft with a QC1 or better noise profile.
●● The airport must work with the local community to keep them informed of the
outcomes of the trial.

151
Chapter 5: Making best use of existing capacity
Delivery
5.55 Many of the concepts discussed above form part of the CAA led Future Airspace
Strategy (FAS). FAS is potentially the most significant development in improving the
UK’s aviation efficiency for over 40 years and is the key enabler of a number of the
recommendations forming part of the optimisation strategy. The FAS is described in
more detail in Box 5a.
5.56 The delivery of components of the Optimisation Strategy, particularly those
connected to the FAS, is dependent on a complete re-design of the airspace
around London. This is already being led by NATS through the London Airspace
Management Programme (LAMP) to provide more efficient operations to all the
airports in a manner that reflects advances in aircraft capabilities.
5.57 The LAMP project will bring significant operational and environmental benefits,
increasing capacity and performance efficiency, whilst improving safety – for
example, by removing current conflicts between arrival and departure routes at the
London airports so that more efficient routings to and from airports can be delivered
and carbon emissions reduced.

152
Box 5a: Future airspace strategy
The CAA led Future Airspace Strategy (FAS) contributes to the
implementation of the objectives of the Single European Sky (SES) and in
particular, supports the delivery of the technological and procedural solutions
that form part of the technological element of the SES with a view to
modernising and optimising the future European ATM network.
The FAS is intended to deal with inefficiencies in the system in three ways:
●● complex and congested airspace;
●● regular arrival delays; and,
●● under-utilisation of performance-based navigation.
The FAS deployment plan includes:
●● implementing a fundamentally more efficient route network in the busy
terminal environment;
●● removing fixed structures in the upper airspace enabling more direct
routes;
●● streaming traffic through speed control and improving arrival punctuality to
manage queuing and reduce stack holding;
●● re-designing departure procedures to allow aircraft to climb continuously
and increase runway throughput; and,
●● connecting airports electronically into the network to share accurate
information and better sequence departures and arrivals.
A number of the recommendations have been made earlier in the Chapter
form part of the FAS including:
●● the implementation of ACDM and DPI;
●● queue management;
●● re-designing of London terminal airspace to incorporate performance
based navigation standards; and,
●● Time Based Separation.
153
Chapter 5: Making best use of existing capacity
Box 5a: Continued
The first phase of work delivering the FAS is currently underway with a
timescale of 2013 to 2020, with the plan having been developed in
collaborating with airlines, airports, providers of air traffic control services, the
military and regulators forming part of the FAS Industry Implementation Group
(FASIIG).
Industry governance reform
5.58 Since the FAS is essential to the delivery of the wider Optimisation Strategy, the
pace at which the industry is moving to deliver the substantial changes required to
current operations is a cause for concern.
5.59 While collaboration is key to delivery, the lack of clear governance and responsibility
for delivery of the components of the FAS is adding to the delivery timescales.
The number of stakeholders involved does not facilitate swift decisions.
5.60 Overall leadership for the FAS and its component deliverables is lacking. The
delivery of the measures identified as part of Theme 1 of this Chapter, particularly
where they form part of the FAS and LAMP, requires the involvement of top level
representatives from the most directly involved organisations. We therefore
recommend the establishment of a Senior Delivery Group with Board level
representatives from the CAA, NATS and the major airports in London and the
South East with overall responsibility for the delivery of the FAS.
5.61 The Group should be chaired by the Chief Executive of one of the member
organisations listed above and should report on a six monthly basis by means of a
published progress report. The first report should provide industry with a detailed
timetable for delivery with clear milestones and dependencies identified.
5.62 The Group should be responsible for holding individual airports to account for
making sure that improvements to punctuality and scheduled performance driven
by the FAS and the wider optimisation strategy are matched by appropriate
changes to the airport’s local operation models.
5.63 Changes as in the optimisation strategy inevitably affect populations subject to
aircraft noise and so require the airport and air traffic control to consult with
communities near airports. There is a balance to be struck between the interests of
local communities and aviation users. The CAA has an active role in ensuring that
this balance is maintained but final decisions on large scale airspace change

154
currently rest with Ministers at the Department for Transport, bringing a risk that
decisions of this kind become politicised leading to delay or, at the extreme, failure.
5.64 It is right that local communities are involved in the decision making process for
changes that will affect them. The outcomes of this consultation should be fully
taken into account at the design stage governing any airspace change process, but
the Government should not form part of this decision making process as there are
organisations better placed to play this role in determining the balance of costs and
benefits of every operational change proposed. Government should devolve its
responsibility for airspace changes to the CAA, advised as appropriate by a newly-
established Independent Aviation Noise Authority.
Independent Aviation Noise Authority
5.65 The governance changes outlined above are necessary but not sufficient to deliver
the Optimisation Strategy. NPRs have not changed for many decades, despite the
significant population shifts that have taken place in the interim. Similarly, previous
attempts to restructure London’s airspace have failed. This is not only a problem in
terms of optimising the current system. It also suggests the scale of the challenge
that exists in delivering the airspace change to support any longer-term options to
provide new capacity.
5.66 A lack of trust between the aviation industry and local communities has played a
large role in creating this impasse. If this situation is to change, then it is vital that
any decisions made are recognised as impartial and evidence based, with the
needs of all parties appropriately balanced.
5.67 In many cases, where decisions are made in respect of aircraft noise, the ultimate
power rests either with the Secretary of State for Transport or the CAA. However
objective either party is in its behaviour, a perception will always persist that the
decisions of the former are driven by political considerations and that the latter is
beholden to the industry that provides its funding. These perceptions may be unfair,
but they persist.
5.68 An independent body with a statutory duty to provide advice and make
recommendations on an impartial basis, drawing on the latest evidence, could play
an important role.
5.69 The Commission’s Aviation Noise Discussion Paper sought views on establishing an
Independent Aviation Noise Authority. Respondents argued both for and against
this idea. Those against noted that many of the powers and responsibilities that
155
Chapter 5: Making best use of existing capacity
might be associated with the role already reside with one or other regulatory body,
including the CAA and the Secretary of State for Transport.
5.70 Other respondents saw merit in establishing an independent authority. They cited
mistrust amongst local communities in relation to the fairness and transparency of
current arrangements for reporting aircraft noise, and for the recording and handling
of complaints from members of the public. Separately, bodies involved in delivering
the FAS and LAMP noted the difficulties arising from the political clearances
required for changes to NPRs and noted that an independent body with a role in
providing advice could provide a means of overcoming them.
5.71 Independent bodies of this kind have been established in a number of countries.
In Australia, complaints and enquiries about aircraft noise and operations from any
airport in the country are submitted to the national body ‘Airservices Australia’,
which processes this data through its Noise Complaints and Information Service
(NCIS). NCIS reports are published quarterly, and the data is used to identify
systemic problems, and to provide guidance for government in developing
aviation policy. As a result of this interface, NCIS is well placed to:
●● explain aircraft movements and flight paths to the public (primarily through
WebTrak, an online system displaying information about where and how high
aircraft fly over metropolitan areas);
●● provide a one-stop shop for aviation noise information to the public, for example
airport curfew arrangements, air traffic control arrangements and information on
monitoring and noise abatement technologies;
●● work with other aviation industry stakeholders to resolve issues raised; and,
●● consider possible changes to air traffic management and advise if they are not
possible, or refer them for further investigation.
5.72 NCIS also undertakes systematic monitoring of aircraft noise, collecting data from
every aircraft travelling to or from the country’s eight largest airports. In the UK,
some of the larger airports have replicated some of these functions on a voluntary
basis.
5.73 The French Noise Regulator, ACNUSA, undertakes a similar noise monitoring
program. In addition, ACNUSA has the power to fine airlines which fail to comply
with noise regulations.
5.74 An independent, national authority with a credible and authoritative voice on noise
issues could be of significant value. It could provide comprehensive advice on

156
changes to NPRs, addressing some of the concerns described above in relation to
the political obstacles to the delivery of FAS and LAMP. It could also act as a
statutory consultee on other noise related issues, including involvement in planning
inquiries which would have implications for populations affected by aircraft noise.
Government and the regulator could be required to seek the authority’s views on
issues with implications for aircraft noise and, should either party decide not to act
upon its recommendations, they could be required to publish in full the reasons for
their decision.
5.75 The authority could also play a role in the delivery of longer-term plans for additional
airport capacity. It could put a framework in place governing aircraft noise at sites
affected by expansion and monitor the delivery and operation of the infrastructure
and its associated airspace to ensure that it remained in compliance with this
framework.
5.76 In addition, an Independent Aviation Noise Authority could be well-placed to
undertake consistent and regular surveying of attitudes to aviation noise, including
its impacts on health and well-being. The response to the Commission’s discussion
paper, from all sides of the industry, showed that further research into these effects
is desirable and necessary. In particular, responses identified the need for regular
surveying of attitudes over time (annual or bi-annual data collection), rather than
sporadic and occasional surveying. The CAA noted that noise modelling has
improved to such an extent that noise and annoyance studies could now be plotted
with a greater degree of specificity than ever before.
5.77 The Authority could also have a broader role in leading research on aviation noise
issues, although the time taken to establish such a body should not be a reason for
Government or the industry to delay taking forward research more quickly where
that would be of value. The Commission notes that respondents to its noise paper
made some suggestions for further research priorities.
5.78 The Independent Aviation Noise Authority could also collect and publish information
on airports’ and airlines’ progress on noise issues, giving it the ability to ‘name and
shame’ the worst performers.
5.79 There is potential for airports to be subject to ‘double jeopardy’ should the Noise
Authority have direct licensing and enforcement powers. Accordingly, the primary
function of the Authority should be provision of accurate, impartial and published
advice to those with whom formal decision making and enforcement powers rest.
Where such parties departed from the advice provided, they could be required to
explain their reasons for doing so.

157
Chapter 5: Making best use of existing capacity
5.80 The Commission therefore recommends that an independent body be established
with a duty to provide statutory advice to the Government and CAA on issues
relating to aircraft noise. The Government and the CAA should be required to
publish their reasoning in any cases where their decisions diverge from the advice
provided by the body.
5.81 Specifically, the body could:
●● Provide statutory advice to the Secretary of State for Transport regarding
proposed changes to Noise Preferential Routes.
●● Provide statutory advice to the Secretary of State for Transport and the CAA in
respect of the proper structure for noise compensation schemes.
●● Provide statutory input to planning inquiries relating to airport infrastructure in
respect of the appropriate controls that should apply in respect of aircraft noise.
●● Work with the developers and operators of any new airport capacity, as well as
communities affected by the development to define a noise envelope to create a
balance between aviation growth and noise control.
●● Conduct research into the best means of monitoring and reporting aircraft noise,
as well as its association with annoyance and impacts upon human health and
their possible mitigation.
●● Publish comparative assessments of airlines’ performance in reducing their noise
impacts.
●● Act as a statutory consultee in planning applications with respect to airport
infrastructure or housing developments which would have an effect upon the
population affected by airport noise.
●● Mediate by request between airports and their local communities in disputes
relating to noise monitoring, the functioning of airports’ advisory committees,
and airports’ compliance with their noise action plans and, where appropriate,
advising the CAA in respect of potential breaches of noise regulations.
5.82 The establishment of the Independent Aircraft Noise Authority would require primary
legislation. In the meantime, industry should not wait for the establishment of this
body before beginning the process of implementing the Optimisation Strategy or
progressing the delivery of the FAS.
158
Theme 2: Promoting the use of under-utilised capacity
5.83 Many submissions on making the best use of existing capacity pointed to the level
of unused capacity at many UK airports. Making more use of this capacity has been
put forward as an alternative to the provision of new runway capacity. Chapter 4
discussed means by which the Government might mandate or provide strong
financial incentives for the redistribution of traffic around the UK’s airport network.
The conclusion was that mandatory measures were impractical and that strong
financial incentives would have significant adverse consequences.
5.84 However, there are benefits to incentivising the use of existing capacity, where this
can be done without harming the connectivity of the UK’s busiest airports. Each of
the long-term options outlined for further development in Chapter 6 would require
a substantial period of time for planning and delivery and the potential for
Heathrow’s connectivity to improve during this period is clearly limited.
5.85 The Commission therefore considered measures that would provide incentives for
the use of under-utilised capacity, or remove obstacles to its use. These included:
●● enhanced surface transport links to airports;
●● encouragement of air-services agreements at less utilised airports;
●● promotion of reliever airport facilities; and,
●● financial incentives to open new routes.
Enhanced surface transport links
5.86 Passengers do not think of their journey only in terms of its airborne component.
The length of time it takes them to reach the airport, the cost, quality, comfort and
convenience of that journey and the likelihood that it will be subject to delay are all
important considerations.
5.87 Not all passengers have the same expectations regarding their journey to or from
the airport. A passenger on a short-haulflight using a low-cost carrier probably has
different expectations to a passenger emerging from a long-haul overnight flight.
Meeting passengers’ needs in terms of surface transport often means offering a
range of options, with a range of prices. Airlines respond to the needs of their
customers; if passengers do not want to travel to an airport because of the quality
of its surface transport, airlines will be less likely to schedule flights to or from it.
Poor surface transport can send the message that an airport is ‘second best’ or
‘not the city’s main airport’. For long-haul passengers, particularly those with a
choice of airlines, these are significant issues.

159
Chapter 5: Making best use of existing capacity
5.88 In many instances airport surface transport shares its infrastructure with commuter,
intercity and leisure traffic that is vital to the wider economies of those cities.
Congestion on that infrastructure – both road and rail – can force difficult decisions
between the interests of airport users and other travellers. However, in light of the
current severe capacity constraints within the UK system and the length of time until
new capacity can be brought into operation. There is a strong case for attaching a
greater strategic priority to transport investments which improve surface access to
our airports.
5.89 The Chair of the Commission wrote to the Chancellor of the Exchequer on
26 November to make this point and to set out the Commission recommendations
on surface access to airports. HM Treasury’s National Infrastructure Plan,123
published on 4 December, began the process of implementing it. The Commission
welcomes this, and encourages the Government to continue to work on the delivery
of the surface transport improvements.
Gatwick
●● The Government should work with Network Rail and Gatwick Airport to
implement a significant enhancement of the airport station, with an emphasis on
making the station more accessible to users with luggage (which should also
enhance access for users with disabilities). The Government should pursue an
ambitious (circa £180 million) option for enhancing the station through the
construction of a new concourse and ticket hall with enhanced access to
platforms, subject to the airport providing an appropriate contribution to the
costs of the scheme.
●● There is a need to improve the suitability of the Gatwick Express rolling stock to
make it more suitable for airport users, for example by the provision of additional
luggage space. The Government should take opportunities to enhance it through
the franchising system.
●● The Government should work with train operators to promote the introduction of
paperless ticketing facilities for journeys to and from Gatwick Airport station.
●● The Government and Network Rail should accelerate work to produce a detailed
plan for the enhancement of the Brighton Main Line, with a particular emphasis
upon enhancing capacity and reliability, so as to accommodate growth in both
airport and commuter traffic. This could focus on the alleviation of particular
pinch points (such as East Croydon).
123 HM Treasury (2013), National Infrastructure Plan https://www.gov.uk/government/publications/national-infrastructure-plan-2013

160
●● The Government should work with the Highways Agency to develop a forward
route strategy for the sections of the motorway network connecting to Gatwick
Airport, with a particular emphasis on the connections between the M25, M23
and the airport itself. That strategy should consider options for expanding the
slip-roads between the roads in question, which could become substantial
congestion pinch points.
Stansted
●● The Government should work with Network Rail and Transport for London on a
detailed study of the route between London and Stansted Airport and serious
consideration should be given to 4-tracking the line as far as Broxbourne
Junction, subject to a robust business case being developed. This study should
consider how enhancements to the route might benefit airport traffic, London
commuters and Cambridge traffic, recognising that any steps to enhance the
Stansted Express service through regularising or reducing journey times and
improving reliability will help the airport to play an enhanced role in supporting
London and the UK’s international connectivity. The study should take full
account of the Mayor’s London Growth Strategy.
●● The Government, Network Rail and Train Operators should work together on
options to connect Stansted Airport to a wider range of London destinations,
with a particular emphasis on making better use of the connection facilities
available at Stratford domestic station.
●● The Government should work with train operators to promote the introduction
of paperless ticketing facilities for journeys to and from Stansted Airport station.
●● The Government and the Highways Agency should monitor road congestion
around Stansted Airport, with a view to making interventions should substantial
congestion arise as traffic at the airport grows.
Heathrow
●● Recognising the importance of encouraging modal shift towards more
environmentally sustainable forms of transport at Heathrow, not only for
supporting future expansion plans but also for optimising the airport’s operations
within its current capacity constraints, the Government should work with
Network Rail to undertake a detailed study to find the best option for enhancing
rail access into Heathrow from the south. Initial indications are that up to roughly
15% of Heathrow’s passengers in the London and South East region could
benefit from improved Southern Access.

161
Chapter 5: Making best use of existing capacity
Manchester
●● The Government should continue its support for the Northern Hub and ensure
that the project is completed in full.
●● The Government and the Highways Agency should monitor road congestion
around Manchester Airport, with a view to making interventions should
substantial congestion arise.
Birmingham
●● The Government should continue its support for the Birmingham Gateway
project and ensure that the scheme is fully delivered.
Luton
●● The Government and the Highways Agency should develop a comprehensive
strategy for motorway access to Luton, with a particular view to examining the
case for enhancements to M1 Junction 10A.
Glasgow
●● There is a need for improved public transport access to Glasgow airport. In the
short-term, the Commission recommends that the Scottish Executive develop
enhanced bus links to the airport. However, looking beyond this, the Scottish
Executive should work with Network Rail and other stakeholders to explore other
options, including light-rail options.
Other airports
●● The Commission’s resources and remit mean that it is not the appropriate body
to reach a view on many of the schemes proposed for improving access to
smaller and regional airports. However, it is important that these airports can
serve their local markets effectively, so central Government should work with
Local Authorities and Local Enterprise Partnerships to ensure that proper
consideration is given to the needs of airport users when prioritising local
transport investment.
5.90 Taken as a whole, this package would need to be underpinned by more than
£2 billion of investment. The most immediate package of works would entail cost of
around £200 million. Many of the schemes will take some time to plan and deliver.
Making an early start will maximise the benefits that can be achieved before new
airport capacity comes online.

162
Encouragement of Air Services Agreements at less utilised airports
5.91 Air Services Agreements are negotiated between nations and determine bilateral
rights around access to airports. Some parties proposed that promoting bilateral
agreements – particularly fifth freedoms – in respect of less utilised airports could be
an effective means of managing capacity.
Box 5b: Fifth freedoms
Fifth freedoms allow an airline permitted to operate a service between that
airline’s home country and the UK also to pick up passengers on the arrival of
that service in the UK and carry them on to a third country (and on returning
from that third country to drop off passengers whose destination is the UK
before continuing on back to its home country). An example might be a flight
which originated in Dubai, stopped at Manchester to pick up and drop off
passengers and then continued to New York.
5.92 Current Government policy – as articulated in the 2013 Aviation Policy Framework
– is liberal, supporting the granting of air services agreements at less congested
airports. However, some have suggested Government should further relax its policy
in this area, by reducing or removing the requirement for overseas airlines to
demonstrate that they are not dependent upon state aid, or by removing the ability
of competing airlines to object to applications.
5.93 The Commission sought legal advice on whether this would be possible. On the
basis of this advice, the Commission has concluded that current Government policy
represents the furthest point in the direction of liberalisation to which the
Government might plausibly travel.
5.94 The Government is free to grant traffic rights despite objections (including where it
determines that objections are driven only by commercial self-interest). However it
would likely be inconsistent with the modern approach to ignore legitimate concerns
regarding anti-competitive state aids. A UK based carrier without Government
support would have a legitimate right to object to fifth freedoms being granted at
its home base to an overseas carrier supported by direct Government subsidy,
preferential loans or tax exemptions.
5.95 Accordingly, the Commission recommends that the Government continue to pursue
its current policy of encouraging overseas airlines to apply for fifth freedom rights at
163
Chapter 5: Making best use of existing capacity
less congested UK airports, subject to the Government satisfying itself that the
grant of such rights will not be likely to distort competition in the relevant market.
Reliever airports and support for business aviation
5.96 Several submissions drew the Commission’s attention to the concept of ‘reliever
airports’, with particular reference to its application within the New York airport
system. Under this system, smaller airports and airfields in the vicinity of
congested airports are designated to handle specific types of traffic, with a
particular emphasis on business and general aviation, as well as smaller aircraft
flying scheduled services.
5.97 The private, competitive nature of UK airports ownership means that a strict
application of the New York system would not be possible in the London and
South East area. Government would not be able to mandate the distribution of
traffic to other airfields without running a high risk of creating an illegal distortion
of competition.
5.98 However, a growth in scheduled traffic at airports with a large share of the current
business jet market (Luton and Stansted in particular) may create pressures over
time for business jet users, who depend upon access to airports being available at
short notice, which is difficult at a congested airport. The Commission does not
recommend mandating changes to the operation of the business aviation market
(which generally appears to be functioning well), but it does note the need for
flexibility within the system.
5.99 Government policy should promote the benefits of smaller airports in the London
and South East system for accommodating business and general aviation.
5.100 Furthermore, while the opening hours and other conditions of use of these airports
are often matters that should properly be dealt with between the airport and its
local authority, the local authorities should support the development of smaller
local airports and, alongside consideration of their environmental impacts, also
give due consideration to the positive benefits they can bring to the local and
regional economy.
RAF Northolt
5.101 One proposal to increase the level of traffic that can be accommodated within the
Heathrow system is to use RAF Northolt for traffic that would otherwise use
Heathrow, possibly as a means of providing additional flights to UK regional
airports.

164
5.102 The Commission has considered options which would make use of the existing
infrastructure for commercial flights and those which would extend and realign the
runway to allow for more extensive use. The Commission’s conclusion is that RAF
Northolt does not provide a realistic option for managing capacity at Heathrow.
Box 5c: RAF Northolt
RAF Northolt is a single-runway military airfield, located approximately six
miles (10km) north of Heathrow airport. The runway is just under 1,700m long
and is on a south-south-west/north-north-east alignment (while Heathrow’s
runways are on a straight west/east alignment). The airfield is currently used
for private flights (though not for commercial operations carrying fare-paying
passengers), with the annual cap currently in the process of being raised from
7,000 to 12,000 per year.
There are two categories of proposal for the further use of Northolt:
●● make additional use of the existing runway to accommodate civilian traffic,
with an improved interface with the Heathrow system; or,
●● realign and extend the runway to enable greater use of the airport,
potentially allowing for it to be fully integrated into Heathrow as a
“third runway”.
Safety regulations governing the use of runways in proximity to busy roads
means that the usable portion of Northolt’s runway for routine use by civilian
traffic is short (1,200m), significantly limiting the aircraft and routes that can
operate. The runway’s alignment means that its arrival routes for civilian traffic
conflict with the routes for Heathrow’s runways. Significant additional usage of
Northolt would come at the expense of reduced Heathrow airspace capacity.
Northolt’s departure routes also conflict with Luton’s. Rectifying this would
require changes (and potentially delays) to the LAMP.
While Northolt is relatively well served for journeys into central London, road
journeys between Northolt and Heathrow are subject to delay due to
congestion, particularly at peak times. Minimum transfer times in scheduling
term between Northolt and Heathrow would be high, while the built-up nature
of much of the area between Northolt and Heathrow means that the cost of
providing a dedicated surface transport link would be prohibitive.

165
Chapter 5: Making best use of existing capacity
Box 5c: Continued
In respect of proposals to realign and extend the runway, the local geography
is not particularly well suited and substantial rebuilding of current roads would
be required, along with a possible need for large-scale demolition of housing.
The maximum possible length of a Northolt runway would be significantly less
than those of other Heathrow third runway proposals, entailing a very
significant delivery time, on a par with other third runways at Heathrow.
The Commission recognises the value of the role Northolt currently plays in
respect of civilian traffic, but does not include significantly increased use of
Northolt among its short or medium term recommendations.
Financial incentives for new routes
5.103 In addition to considering the potential to use variable APD to redistribute traffic
around the UK’s airport system (as discussed in Chapter 4), the Commission also
considered proposals to use ‘APD holidays’ to encourage the development of
routes to new destinations.
5.104 Under this proposal, new routes would benefit from an initial period (probably two
years) during which they would be exempted from APD. This would enable new
routes to develop their market and help to offset some of the commercial risks
associated with opening them.
5.105 There are two potential pitfalls:
●● If the proposal were non-discriminatory (in other words, if it applied to every new
route equally) then there would be substantial potential to game the system, for
example via airlines switching between airports in the same regions of their origin
and destination countries to ensure that they would always benefit from the
holiday. This behaviour would reduce the UK’s tax income from APD without
generating connectivity benefits.
●● If the proposal introduced measures to counter these perverse incentives, then it
would run a substantial risk of being challenged on the basis that it was distorting
competition by favouring particular routes in favour of others.
5.106 The Commission cannot, therefore, recommend the use of APD holidays, though
UK airports might consider options available to them within their landing charge
regimes to incentivise the development of new routes.

166
Theme 3: Medium-term options
5.107 There are other options for enhancing the use of existing capacity, but which make
sense only as part of a longer-term scenario for adding new capacity. They include:
●● mixed mode operations at Heathrow;
●● the ‘noise envelope’ concept;
●● changes to the system governing the economic regulation of airports;
●● some major surface transport proposals; and,
●● removal of physical or planning restrictions on making the maximum use of
existing runway infrastructure.
5.108 Some of the key considerations around each of these areas are described below.
Mixed mode operations at Heathrow
5.109 Heathrow presently operates in segregated mode. Under this model, one runway is
used for arrivals and the other for departures. Currently, on westerly operations, the
runways alternate in the middle of the day, to allow for respite for people living under
specific flight paths. While some of the measures recommended in this Chapter
would allow for the tactical use of de-segregation in specific circumstances, the
principle of segregation would remain.
5.110 Mixed mode operations would allow both runways to be used for arrivals or
departures at the same time. This potentially allows for a significant increase in the
number of scheduled flights at the airport above the current cap of 480,000
(certainly up to 520,000 ATMs and potentially as high as 540,000) – or alternatively,
the increased operational flexibility could be used to enhance the resilience of the
airport’s operations. However, this comes at a cost to people living around the
airport. Mixed mode operations mean a loss of respite; aircraft noise could be
present throughout the day, every day. The measure therefore attracts strong local
opposition.
5.111 The Commission is not recommending the introduction of mixed mode operations
at Heathrow as a short-term measure. There are three key factors behind this
decision:
●● The noise impacts of mixed mode operation are severe, as it would mean an end
to the respite periods currently granted to communities around the airport as a
result of runway alternation.

167
Chapter 5: Making best use of existing capacity
●● Removing the current planning limitation in place at Heathrow which caps its
annual ATMs at 480,000 would require a planning inquiry. Even with a more
streamlined planning process, the Commission believes that the planning inquiry
could still take a considerable period of time and there is no guarantee of
success. Even if the planning cap were not to be lifted and mixed mode
operations were used only to enhance resilience, infrastructure and airspace
changes would be required, with a consequent need for extensive consultation.
●● The implementation of mixed mode operations would need to be driven by the
airport’s owners, who have indicated they do not support this measure.124
5.112 Taken together, the above factors present a strong case that the implementation of
mixed mode is neither quick nor easy and would inevitably come at a significant
cost to local communities.
5.113 However, the Commission’s assessment of need has indicated that the aviation
demand pressures in the London and South East system will continue to grow.
Furthermore, the Commission has noted the range of possible delivery timescales
associated with the long-term options under consideration. Should the delivery
timescale for new runway capacity be towards the longer end of the anticipated
spectrum, then the case for enabling mixed mode operations at Heathrow may be
stronger.
5.114 Accordingly, while mixed mode operations do not form part of the Commission’s
short-term recommendations, it is conceivable that this issue may become material
as part of a transition strategy to the preferred longer-term option. It is therefore
possible that the Commission may need to give some further thought to this issue
within Phase 2 of the process.
Noise mitigation measures including the ‘noise envelope’ concept
5.115 The Commission received a range of proposals both in response to its call for
evidence on short and medium term options for making best use of existing
capacity and in response to its noise discussion paper, on how industry and
Government could tackle aviation’s noise impacts further.
5.116 Government policy has been that, in most circumstances, it is desirable to
concentrate aircraft along the smallest possible number of specified routes and that
these routes should avoid densely populated areas as far as possible. A number of
respondents noted that new aircraft navigational technology such as performance
based navigation would allow for more accurate tracks to be flown. An extension of
124 http://mediacentre.heathrowairport.com/Media-library/Short-medium-term-options-submission-5b1.aspx

168
this was the proposal to alternate the concentration of noise through the creation of
multiple arrival and departure routes to performance based navigation standard to
avoid the creation of ‘noise ghettos’. These concepts form part of the LAMP.
5.117 Other proposals may be categorised roughly into two categories; those relating
to the management of noise and those relating to planning and compensation
against noise.
5.118 In the first of these categories the Commission received representations seeking the
establishment of an independent noise regulator – as discussed earlier in this
chapter – and the development of a ‘noise envelope’ to create a balance between
aviation growth and noise reduction with the objective of incentivising airlines to
introduce quieter aircraft whilst giving local communities more certainty about the
levels of noise they may expect in the future. There are three possible approaches
to setting an envelope. They are:
●● restricting the number of inputs through the introduction of a movement cap
(as seen at Heathrow currently); a quota count system which would see aircraft
types assigned a ‘noise factor’ according to their noise performance incentivising
airlines to invest in quieter aircraft which conceivably could lead to more
movements within a set cap (as seen with the DfT’s Night Noise Regime);
and by setting passenger number limits;
●● restricting noise exposure through the use of noise contours as a basis for
setting restrictions associated with noise exposure; and,
●● setting noise level caps by for example setting caps based on acceptable levels
of noise as measured by noise monitors.
5.119 Of these approaches, the Commission received suggestions about extending
the use of the quota count system currently in place during the night period
(23:00–05:59) into full day operations with an agreed quota count limit.
Others proposed the concept of introducing noise envelopes more generally.
5.120 The concept of noise envelopes will be considered further in Phase 2, taking
account of the short-listed options under consideration. Noise envelopes could be
an effective way of managing the noise impacts of any new airport or runway
development.
5.121 In the second category of options, those relating to planning and compensation
against noise, the Commission received a range of proposals suggesting that noise
compensation arrangements should be reviewed alongside consideration of the
proposals for new runway capacity. Representations were also received indicating

169
Chapter 5: Making best use of existing capacity
that there were no effective land use policies applied to the areas around Heathrow,
Gatwick and Stansted, and that whilst the aviation industry was delivering quieter
aircraft and the size of the 57LAeq contour around airports affected by noise is
reducing, new domestic dwellings are continuing to be built therefore increasing the
size of the population within the noise affected area.
5.122 Both these issues are important. The role of the proposed Independent Aviation
Noise Authority should include responsibilities for advising the Secretary of State for
Transport and the CAA in respect of appropriate noise compensation schemes.
This body would also have a statutory role in providing input to planning inquiries
relating to new housing developments in the vicinity of existing airports. The
Commission expects to consider these issues further in the next phase of its work.
Changes to the system governing the economic regulation of airports
5.123 Many parties put proposals to the Commission for changes to the regulatory
regime. These changes would require primary legislation (the framework was most
recently updated by the Civil Aviation Act 2012).
5.124 The Commission considered these proposals but is not making recommendations
in this area in its interim report. The long-term options discussed in Chapter 6
present a range of different future scenarios in terms of the competitive environment
within which the UK’s airport industry might operate. The regulatory underpinnings
required for a system in which a single airport would clearly dominate may be
different for those in which two or more airports of broadly comparable size would
compete for market share.
5.125 Furthermore, the regulatory framework, with its role in determining the rate of return
for airport investors and the landing charges paid by airlines, has clear implications
for the commercial viability of long-term options. The Commission will return to this
issue in detail as part of its work ahead of the final report.
Major surface transport proposals
5.126 Paragraphs 5.86 to 5.90 discuss the Commission’s immediate recommendations in
terms of surface transport. In respect of each of those recommendations, there is a
clear case to act on the basis of forecast demand at existing airports during the
period until any new capacity could be brought online.
170
5.127 The Commission received many other proposals in respect of enhanced surface
transport links to airports. In some cases, the Commission did not believe that there
was ever likely to be a case for the proposal in question. In other cases, however,
while current and short to medium term forecast demand would not justify a
proposal, the proposal might nevertheless play a role in supporting the transition
towards or operation of one or more of the long-term proposals taken forward for
further consideration.
5.128 Proposals identified for this category had one or more of the following features:
●● a very high cost, significantly outweighing benefits on the basis of current and
short to medium term forecast demand;
●● the potential for expenditure on building infrastructure that might not be used if
one or more of the long-term options taken forward for further consideration
should be selected;
●● significant impacts on commuters and other users of surface transport networks
that cannot be justified on the basis of current or short to medium term forecast;
or,
●● the potential to create significant planning blight, due to a requirement for
land-take or substantial road or rail noise implications for existing communities.
5.129 Accordingly, a number of surface transport proposals were identified for further
examination alongside the relevant long-term options ahead of the Commission’s
final report. They include:
●● construction of new high speed rail lines or spurs from current or planned high
speed rail lines, such as the HS2 spur to Heathrow;
●● construction of new rail lines (as opposed to the enhancement of lines that form
part of the existing network); and,
●● significant changes to current infrastructure or service patterns which cannot be
justified on the basis of existing airport traffic levels.
Removal of physical or planning restrictions on making the maximum use of existing runway infrastructure
5.130 The maximum permitted use of existing capacity at some airports, including
Stansted and Luton, is constrained by planning restrictions and also by the
availability of non-runway infrastructure such as terminal and stands able to handle
higher than current numbers of passengers or air traffic movements.

171
Chapter 5: Making best use of existing capacity
5.131 Alongside its consideration of proposals for adding new runway capacity, the
Commission may also examine as part of its Phase 2 work whether there is a case
as part of its overall strategy for taking action to address any of these limitations in
order to enable more effective use of existing capacity.
5.132 This work will be focused on those airports where no proposal for new runway
infrastructure has been taken forward for further consideration.
Conclusions
5.133 Many of the actions required to optimise the UK’s airspace and airport operations
are well understood and it is inertia in industry and political processes that has
inhibited their implementation. The Commission has already made clear the scale
of the challenge that the UK faces in the period until new capacity can be brought
online. It is imperative that all parties now work together to implement these
recommendations as quickly as possible. Failure to deliver will result in missed
opportunities for the UK’s economy and its role in international markets.
5.134 Access to the benefits of the strategy outlined in this chapter is contingent upon
the delivery of the entire package, which contains a number of measures with
complicated interdependencies. Attempts to pick and choose between
recommendations will, the Commission believes, substantially reduce the overall
benefits.
5.135 While the measures described in this chapter will lead to real gains in the short
and medium term, they are not a solution to the UK’s longer-term capacity needs.
Chapter 6 describes the Commission’s assessment of the options for addressing
those needs.

172
Chapter 6:
Adding capacity in London and the South East
SUMMARY
The analysis in Chapter 4 demonstrates a clear case for at least one net additional
runway in London and the South East by 2030.
The Commission has looked at accommodating increasing demand through a variety
of means. This includes through purely operational measures requiring no new
runways, or through using surface transport improvements to replace the need for
short-haul air movements or to enable more effective use of existing capacity.
The Commission has concluded that none of these options could meet the capacity
shortfall.
Several potential options for providing additional capacity have been considered,
ranging from incremental increases of capacity at current airports to building several
new runways at completely new airports. The Commission has considered the trade-
offs and balances between these options and will come to a final decision in 2015.
The Commission has therefore identified two existing airports as credible locations for
an additional runway. At one of these airports there are two potential sites for
expansion:
●● Gatwick Airport:
The Commission will take forward Gatwick Airport Ltd’s proposal for one new runway
to the south of the existing runway. This would be over 3,000m in length and the two
runways would be spaced sufficiently apart to permit fully independent operation.
Related new terminal facilities and linking taxiways would be built between the new
and existing runways.
173
Chapter 6: Adding capacity in London and the South East
●● Heathrow Airport (two alternatives):
●– One new runway to the north west – as proposed by Heathrow Airport Ltd,
alternatives a new 3,500m runway constructed to the north west of the existing
airport spaced sufficiently to permit fully independent operation. Related new
terminal facilities would be needed to the north and west of the existing northern
runway and linking taxiways to the west.
●– Extending the northern runway to the west – as proposed by Heathrow Hub
Ltd, an extension of the existing northern runway to a length of at least 6,000m
to allow the extended runway to operate as two independent runways: one for
departures and one for arrivals.
There are still important issues to examine for each of the proposals, together with
significant risks. The Commission will seek to address these as the options are
developed and appraised in more detail in the next phase. That will involve close
consultation with promoters and others. It will also be important to understand the
needs of local communities.
In addition, the Commission intends to carry out further analysis of the feasibility and
impacts of an Isle of Grain airport and reach a decision in the second half of 2014 as
to whether this constitutes a credible option for detailed development and appraisal.
If it concludes that it is, it will be subject to a similar process of appraisal and
consultation as the existing short-listed options, prior to the Commission reaching
the recommendations in its final report.
6.1 The analysis in Chapter 4 demonstrates a clear case for at least one net additional
runway in London and the South East by 2030.
6.2 Heathrow is already 98% full. By 2030, Gatwick, London City and Luton are all
forecast to become full, across a range of scenarios. Although there will still be
some unused capacity at Stansted, total capacity utilisation across the London
airports system will be more than 90% – above the level at which resilient
operations can normally be expected to be maintained. In some scenarios, demand
would already exceed capacity. Only through the provision of an additional runway
can resilience be maintained and demand growth accommodated in subsequent
years.
6.3 Even with one additional runway in place, by 2050 demand in the carbon capped
forecast is predicted to have risen once again to more than 95% of available
capacity. In the carbon traded forecast, demand is estimated to exceed capacity to

174
the same timescale by up to 150,000 ATMs. On this basis, the Commission’s
forecasts indicate that there is likely to be a demand case for a second additional
runway to be in operation by 2050 or, in some scenarios, earlier.
6.4 One of the aims of this Interim Report is to identify credible long-term options
meriting further detailed consideration. The Commission’s assessment has
identified a small number of options with a credible prospect of being deliverable
within the required timescale, meeting the UK’s international connectivity needs and
being commercially attractive to airlines.
6.5 In addition, for reasons outlined below, the Commission will continue to investigate
the option of a potential new hub airport located in the Thames Estuary. This
additional work will be undertaken in the first half of 2014 with a view to deciding in
the second half of that year whether such a proposal should be considered
alongside the short-list. If a decision is reached that it should, it will be subject to
similar appraisal and consultation processes as the short-listed options, although
not necessarily to the same timescale.
How did the Commission reach its shortlist?
6.6 The Commission invited interested parties to submit proposals for long-term
aviation capacity options by 19 July 2013. Some 52 proposals were received.
These were published on the Commission’s website and stakeholders were invited
to submit views and additional evidence.
6.7 The submitted proposals were assessed against the Commission’s sift criteria,
alongside a small number of additional options developed directly by the
Commission to give a suite of possible options for further analysis. Further details of
how the Commission reached its shortlist – the process undertaken, the analysis,
evidence and materials considered – are available on the Commission’s website.125
6.8 An initial sift identified a number of options which were not taken forward for further
consideration, on the basis that they either:
●● presented fundamental challenges that could not credibly be overcome, for
example regarding safety, legality or deliverability;
●● were very similar in scope to more credible, well developed options; or
●● were inconsistent with the Commission’s remit.
125 https://www.gov.uk/government/organisations/airports-commission

175
Chapter 6: Adding capacity in London and the South East
6.9 The remaining options could be split into three groups:
a. proposals advocating alternatives to additional runway infrastructure e.g. new
surface transport or operational measures to enable more effective use of
existing capacity;
b. proposals for a new hub airport with four or more runways, either through major
expansion of an existing airport or at a completely new site; and,
c. proposals for the incremental provision of an additional runway at an existing
airport.
Alternatives to new runway infrastructure
6.10 The Commission received a number of submissions arguing that the UK’s aviation
capacity and connectivity needs could be met without the provision of new runway
infrastructure. Chapter 4 sets out the Commission’s consideration of the options
for fiscal or regulatory measures to enable more effective use of existing capacity,
and why these have been rejected.
6.11 In addition, the Commission received a number of proposals for major investment
in surface transport infrastructure as an alternative to new runways. Its assessment
of these options is set out in text Box 6a. On the basis of this assessment,
the Commission concluded that none of these options was a credible candidate
for short-listing.
6.12 The remainder of the Commission’s short-listing process focused on options
for new aviation infrastructure, whether through the incremental expansion of an
existing airport or the creation of a new hub airport. To inform its consideration
of these options, and to enable comparisons on a broadly consistent basis, the
Commission’s technical advisers carried out independent assessments across
a range of factors covered by the sift criteria. These included noise and other
environmental effects, cost, surface access and deliverability.
6.13 On the basis of these assessments and other relevant evidence, the Commission
reduced the number of options under consideration. Removing options which are
judged highly unlikely to be credible by assessing them against our sift criteria has
enabled the Commission to avoid unnecessary impacts on those who live near the
sites in question. A process of the type undertaken by the Commission is bound to
affect local communities; in reaching its short-list the Commission’s intention has
been to minimise these impacts as far as is consistent with a rigorous assessment
process.

176
Box 6a: Surface transport alternatives
Following the Commission’s initial sift process, the surface transport options
were grouped into the following categories:
●● high speed rail networks to replace domestic air journeys and so free up
slots/capacity at constrained airports;
●● direct orbital connections between London’s airports e.g. fly in to Heathrow
and connect via train to an outbound flight departing Gatwick; and,
●● a new hub or terminal in central London to encourage similar interchange
possibilities, or promotion of the city as a hub itself.
For each category an overall assessment was carried out, drawing on
elements from the range of proposals submitted, to consider whether the
approach could offer a credible means of meeting the UK’s aviation capacity
and connectivity needs.
Given the scale of required aviation capacity identified, simply replacing
domestic flights to London airports with high speed rail journeys would not
liberate enough slots. Without removing all other options it is unlikely all
travellers would choose the train over domestic flights. In addition, faced with
such a choice many may choose to transfer via an alternative European
airport. Finally, the release of a domestic slot may not necessarily result in a
corresponding international flight as safety rules require greater separation
between larger long-haul aircraft than for smaller aircraft typically used for
domestic flights.
The other two categories did not offer an increase in aviation capacity, but
rather fuller utilisation of existing capacity in a bid to tackle the current
constraints at Heathrow. In these cases it was found that building surface
transport infrastructure, capable of delivering flight connection times
consistent with current passenger expectations, was either impossible or
prohibitively expensive, especially when compared with options for additional
runways.
Options for new hub airports
6.14 The option of constructing a new hub airport offers the attractive prospect of
providing a potentially significant increase in capacity while at the same time

177
Chapter 6: Adding capacity in London and the South East
delivering a very substantial reduction in noise impact. In some cases, where
aligned with wider regional development strategies, such options may also make
a positive contribution to the delivery of wider economic development and
regeneration objectives.
6.15 A new hub airport would effectively relocate Heathrow’s operations and
infrastructure to another site and further increase capacity through provision of
additional runways; moving the aircraft noise associated with the UK’s largest
airport from the heavily populated environs of west London to more sparsely
inhabited areas. Although some people in these areas would be affected by noise
for the first time as a result, the difference in the total scale of impacts could be
transformational. Approximately a quarter of a million people around Heathrow
currently experience noise levels in excess of 57LAeq. Depending on the option
under consideration, the replacement of Heathrow with a new airport could see this
cut to a few thousand by 2030.
6.16 By building a completely new airport many of the legacy issues associated with
incremental development at existing sites could be avoided. It would be possible for
example to use land use planning to stop new residential and public infrastructure
(e.g. schools) from being built in the higher levels of the noise contour, safeguarding
the fundamental reduction in noise nuisance into the future.
6.17 Such options also, however, present significant challenges. A project of this kind
would be of a different scale to the incremental expansion of an existing airport and
the associated costs and delivery challenges could be commensurately higher.
Despite their potential noise benefits, many of these options would have other
negative environmental impacts which need to be taken into account. They would
require extensive additional surface transport infrastructure, which would have cost,
deliverability and environmental challenges of its own. The complexity of
incorporating a major new airport of this size into London’s congested airspace
could also restrict the level of capacity increase which is achievable in practice.
6.18 A broad range of proposals of this kind were considered by the Commission, all of
which would require the closure of Heathrow to enable them to attract the
investment and traffic necessary to operate at the scale envisaged. These included
options for:
●● new airports in and around the Thames Estuary;
●● new airports at a number of inland locations in the South East where no
commercial airport currently exists; and,
178
●● options for major expansion at existing airports, including for four runways at
Luton or up to five runways at Stansted.
6.19 Additional challenges would be associated with the closure of Heathrow airport.
First, this would likely increase further the costs associated with a new hub airport.
Although it is very difficult to quantify how much value could be realised from the
Heathrow site, it is clear that with the need to remediate the site (decontamination
and preparation for redevelopment etc) and then release the land in a manner that
did not flood the market, it would be decades after acquisition before the full value
of the site could be realised. In addition there would be a high degree of risk
associated with any redevelopment of this size (broadly equivalent to a medium-
sized town such as Maidenhead). In light of these factors it seems a safe
assumption that for the purposes of this study the acquisition of Heathrow should
be considered a net cost in 2030, with an uncertain prospect for full recovery of
these costs by 2050.
6.20 Second, while the potential value of the Heathrow site for addressing housing
shortages in the capital should not be underestimated, it cannot be assumed that
the overall economic impact of closure would be positive. Analysis carried out for
the Commission of these impacts, although noting that much employment may be
replicated at the new airport site, indicates that the impacts in the local area could
be significant, with the airport being associated with 8-10% of employment in the
four closest boroughs. Easy access to an international airport is an important
consideration for firms locating in the Thames Valley corridor, and the closure of
the airport would be expected to reduce both the area’s attractiveness to new
businesses and its ability to retain the firms currently located there.126
6.21 Finally, there are important uncertainties about how the aviation industry would
respond to a decision to construct a major new hub airport to the east of London.
As set out in Chapter 2 the aviation industry is in a state of constant evolution.
Investment in a new airport of this kind would require a high level of certainty that
the hub-and-spoke model would continue to play a dominant role in providing
international connectivity, and that airlines would bear the cost and risk of locating
to a new airport.
6.22 In public and in their submissions to the Commission, a number of airlines and
alliances have been unenthusiastic about moving from Heathrow and the
establishment of an effective hub capability at any new airport cannot be
guaranteed. Airlines will always need access to London’s origin and destination
126 Leigh Fisher (2013), “Economic and operational impacts of closure of Heathrow Airport”, available on the Commission’s website
179
Chapter 6: Adding capacity in London and the South East
market, but that need not be through a new, untested airport, and they may choose
to locate other elements of their networks elsewhere.
6.23 During the assessment process the Commission identified the two most interesting
options as the construction of a new four runway airport in the Thames Estuary and
the expansion of Stansted Airport into a five runway hub. These are discussed in
more detail below.
A Thames Estuary hub airport
6.24 Among the most imaginative options submitted were those for a new hub airport in
or around the Thames Estuary. The options presented to the Commission ranged
from floating islands constructed some distance offshore to airports located at a
number of locations on the foreshore, from Foulness Island to the Cliffe marshes.
The proposals from the London Mayor and others to build a four runway airport on
the Isle of Grain are good examples of the latter. As set out in Appendix 2, the
Commission’s view was that they were likely to represent the most viable of the
options for development in the Estuary. The more remote options presented cost,
feasibility and distance obstacles which made them less attractive in a number
of respects.
6.25 The assessment of an inner Estuary airport on the Isle of Grain has been based on
an option developed by the Commission itself, which draws upon elements from a
number of the proposals submitted and seeks to achieve the most effective balance
of impacts.
6.26 In order to limit noise impacts, while also reducing or avoiding any consequences
for the Liquefied Natural Gas (LNG) facility nearby, a north-easterly location on the
Isle of Grain was used. Options further to the west would increase the size of
population affected by noise, and locations further to the west or south could
potentially require the relocation of the LNG facility. To minimise the costs
associated with land reclamation from the Estuary whilst still providing a significant
increase in capacity, a configuration of two independent sets of dependent runways
was used. It was not possible, however, to avoid affecting internationally designated
environments without reducing the additional capacity provided to less than that
required by the Commission’s assessment of need, due to the extent of the
designated areas.
6.27 The key potential advantages of an option of this kind are:
●● It would deliver the most significant reduction in overall noise impacts of any of
the options considered other than an island airport. The Commission’s analysis
180
suggests the population within the 57LAeq contour surrounding an Isle of Grain
airport could be as low as 1,400 people by 2030 – compared to around 150,000
around Heathrow to the same timescale as currently configured. The proposal
would also offer other environmental benefits in comparison to other options,
particularly in relation to air quality for which the impacts would be particularly
low.
●● It could make a significant contribution to local regeneration. The local authority
areas immediately surrounding the site experience comparatively high average
levels of deprivation for the south east of England and higher levels than at the
vast majority of sites considered by the Commission. A new airport could be a
substantial generator of economic activity in the region and provide significant
new employment opportunities – around 100,000 jobs127 at the airport alone in
the 2030s, plus additional related wider employment.
●● It would be well-aligned with the wider economic development of London.
London is forecast to see a significant increase in population and economic
activity over the coming decades – with population rising to over 10 million by
2036 and the labour market growing by around 850,000 jobs over the same
period.128 The most significant proportion of this growth is expected to be seen in
the east of the city. A Thames Estuary airport could be well-located to support
the strategies for development set out in the Mayor’s London Plan. In addition,
the closure of Heathrow could offer a very substantial site for redevelopment,
with on some estimates scope to provide homes by 2050 for around 150,000
people.
●● It would provide a significant increase in hub airport capacity which would likely
be subject to fewer operational limitations than Heathrow. In particular, its very
low noise impacts would offer the opportunity to operate 24 hours a day,
increasing its flexibility.
6.28 These benefits could be significant. In some cases, however, they are complex
to assess. Whereas the Commission has been able to model the potential noise
impacts to a reasonable degree of accuracy, economic development and
regeneration benefits are far harder to quantify. While the Commission has taken
appropriate account of these factors in its short-listing process, balanced against
the costs and risks of an approach of this kind, a full assessment would require
more detailed analysis than has been undertaken to date.
127 Calculated on the basis that each 1 million passengers at an airport supports roughly 1,000 jobs128 Mayor of London (2013), “A new hub Airport for London and the UK: Isle of Grain”, para 3.6,
http://www.tfl.gov.uk/assets/downloads/corporate/new-hub-airport-isle-of-grain-mayor-of-london.pdf
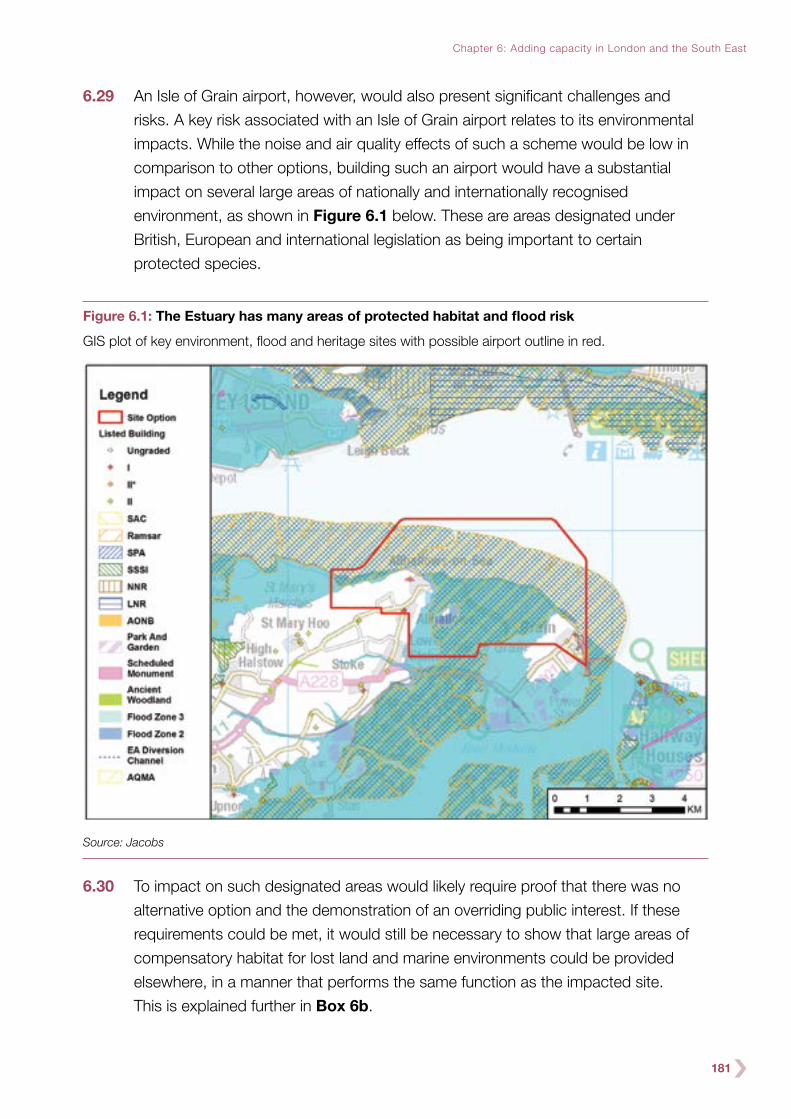
181
Chapter 6: Adding capacity in London and the South East
6.29 An Isle of Grain airport, however, would also present significant challenges and
risks. A key risk associated with an Isle of Grain airport relates to its environmental
impacts. While the noise and air quality effects of such a scheme would be low in
comparison to other options, building such an airport would have a substantial
impact on several large areas of nationally and internationally recognised
environment, as shown in Figure 6.1 below. These are areas designated under
British, European and international legislation as being important to certain
protected species.
Figure 6.1: The Estuary has many areas of protected habitat and flood risk
GIS plot of key environment, flood and heritage sites with possible airport outline in red.
Source: Jacobs
6.30 To impact on such designated areas would likely require proof that there was no
alternative option and the demonstration of an overriding public interest. If these
requirements could be met, it would still be necessary to show that large areas of
compensatory habitat for lost land and marine environments could be provided
elsewhere, in a manner that performs the same function as the impacted site.
This is explained further in Box 6b.

182
Box 6b: Development impacting the Natura 2000 network
Natura 2000 is an EU wide network of nature protection areas aiming to
assure the long-term survival of Europe’s most valuable and threatened
species and habitats. It comprises Special Areas of Conservation (SAC)
designated by Member States under the Habitats Directive, and also
incorporates Special Protection Areas (SPAs) designated under the 1979
Birds Directive.
Direct impacts on the Natura 2000 network would likely mean development
can only take place in these areas when no alternative is shown to exist.
The bar for the alternatives test is high due to the potential for many other
locations to meet the objectives for the expansion which would not have such
adverse effects. If there are no feasible alternatives, then there must also be
‘imperative reasons of overriding public interest’ (IROPI) that justify the plan or
project despite the environmental damage it will cause.
Where a plan or project will negatively affect a ‘priority’ habitat or species, only
reasons relating to human health, public safety, or beneficial consequences of
primary importance to the environment can be considered. Other imperative
reasons of overriding public interest can only be considered having obtained
and had regard to the opinion of the European Commission.
Finally, the proposal would also need to demonstrate how it could provide
compensatory measures which maintain the integrity of the Natura 2000 sites
affected. Where possible the impact of this compensation should be secured
before consent is granted. Given the need to ensure adequate compensation
a suggested target compensatory habitat would be between a 2:1 and 3:1
ratio. However, the actual test is that the compensatory habitat is functionally
equivalent and maintains the Natura 2000 site integrity.
6.31 The Commission’s view is that these issues present significant delivery risks for an
Isle of Grain airport. None of the proposals submitted to the Commission for an Isle
of Grain airport has provided clear evidence that the impacts on these designated
sites could feasibly be addressed or compensatory habitats provided, though some
do point to previous projects in which these issues have been managed. Even if it is
assumed that an appropriate solution can be identified, this would remain an area of
major legal risk, given the stringency of the regulations governing development at
such sites. The need to overcome these issues is a further reason why the
timescales for delivery of a new Estuary airport may be prolonged.

183
Chapter 6: Adding capacity in London and the South East
6.32 There is also a potential flood risk at the proposed Isle of Grain site, which is on the
coastal area of a considerable flood plain and built out into an estuary. While other
new hub airport options also have flood risk issues to be addressed, the problems
for an Estuary site are of a different order of magnitude. Furthermore, developing an
airport at the Isle of Grain, on the Commission’s analysis, would likely cause the loss
of around 1,600 homes and require the relocation of at least one entire community,
as well as directly affecting five scheduled monuments and seven listed buildings
(including two Grade I and one Grade II* listed churches).
6.33 An Isle of Grain Airport would be some 33 miles from central London (compared
to 15 for Heathrow and 25 for Gatwick) with no direct surface access links in place.
Its easterly location makes it less convenient than Heathrow for the majority of UK
travellers. The Commission’s analysis suggests that a number of major transport
enhancements would be required to support an Isle of Grain airport, including new
high speed links to central London, extensions to Crossrail and local conventional
rail lines and a range of road improvements. Securing planning permission for and
delivering surface transport investment of this scale to support an airport opening
date prior to 2030 would be extremely challenging, particularly given the overlap
with the construction period for HS2.
6.34 These surface transport enhancements would also be very costly (estimated at
more than £24 billion before any adjustment for risk or optimism bias) and would
present their own planning, delivery and environmental challenges. They may,
however, provide additional benefits through increasing transport capacity for other
users in Kent and East London. Even with these improvements in place the
population likely to be living within 45, 60 and 120 minutes’ travel of the airport
would be lower than around Heathrow and broadly similar to Gatwick.
6.35 The overall costs of an Isle of Grain airport would be extremely high. The
Commission’s independent assessment suggests that they could total as much
as £82-112 billion by 2030, including surface access costs and allowances for risk
and optimism bias. This is around five times the estimated cost of a new runway
at Heathrow, and does not include any costs related to the acquisition or closure
of Heathrow.
6.36 The Commission’s cost estimates are higher than those put forward by the
promoters of Thames Estuary schemes, due in large part to the treatment of risk
and optimism bias. The same allowances, however, have been used for all schemes
under consideration, and the difference between the estimated base and risk
adjusted costs (roughly 100%) is broadly in line with the difference between the

184
original base cost estimate for the HS2 network and the current risk adjusted
total.129
Box 6c: Assessing the costs and financeability of new airport infrastructure
The costs associated with any new infrastructure proposal include many
elements. For the airport they will include the cost of constructing the runway,
the associated airport infrastructure such as terminals and baggage handling
facilities, and potentially any environmental elements such as flood protection
and mitigation. Any proposal for additional capacity will also need to ensure
sufficient surface transport is available to bring passengers and goods to
and from the site. Where this is additional to current confirmed transport
schemes this is arguably a necessary additional cost to enable full realisation
of the proposal.
Finally there may also be other ancillary costs necessary to bring the project
into being, such as wider environmental mitigation or protection measures,
or the acquisition of other airports to ensure their closure or compensation for
any reduction in capacity.
Many proposals considered some or all of these costs, but different
methodologies, approaches to risk and apportionment of costs were used
in each case. To ensure consistent comparison the Commission generated
its own cost estimates for all elements necessary to deliver the project.
These estimates included allowances of 40% for risk and a further 50% for
optimism bias.
The question of who pays for which elements of a new airport is ultimately a
political judgement. In many cases the most expensive element of a proposal
is the associated surface access improvements. In some cases these may
offer wider benefits to society than to just airport users, although dedicated
airport express links would be less likely to do so.
129 The HS2 Y network was estimated in January 2012 to have a construction cost of £33 billion, including allowances for risk and optimism bias of approximately 65%. This indicates a base cost of roughly £20 billion compared to a current risk-adjusted cost estimate of £43 billion

185
Chapter 6: Adding capacity in London and the South East
Box 6c: Continued
The Commission analysed various approaches to public sector support for
the options under consideration. It assessed the level of public sector support
necessary to allow the airport to finance the required debt from within its
current charging scheme. It also looked at the increase in airport charges
necessary to finance the required debt both with and without surface
transport costs and with and without an allowance for indexation of revenues.
The broad conclusion was that any significant expansion in airport capacity
would likely be beyond the capability of the private sector to achieve alone.
All the options considered therefore would be expected to require some level
of public support, be that Government guarantees for finance or the
construction of associated public transport infrastructure to reduce the risk
sufficiently to encourage private investment.
6.37 These high costs would present very significant challenges in terms of financeability.
In order to repay the debt required to finance the project, aeronautical charges
would need to be set around three times the Heathrow Q6 level set by the CAA.130
This would have a major effect on the attractiveness of this option to airlines.
In order to finance the project without such an increase in charges an estimated
£64 billion in public subsidy would be required.
6.38 The interaction of any Isle of Grain airport with the wider London airspace system
would also be challenging. As a result, although such an airport would represent a
significant increase over Heathrow’s current capacity, the increase would not be as
great at a system wide level. In particular, it would be very challenging to manage
the interactions between arrivals and departures at the new airport and those at
London City, suggesting the latter would have to close. An Isle of Grain airport
would also be likely to require the closure of Southend Airport, reducing the options
available to low cost carriers in the south east of England.
6.39 These interactions would limit the net capacity gain within the London system, as
well as reducing the level of competition and diversity within the London aviation
market. For these reasons, despite its higher costs, it is estimated that the net
capacity gain in the London system from an Isle of Grain airport would be broadly
130 The financing figures in this chapter assume no direct Government subsidy and include the cost of surface access improvements unless otherwise stated. For these figures some level of Government guarantee or other intervention may, however, be required to secure affordable financing. For further details of the assumptions and methodology behind these figures please refer to the “High-Level Commercial/Financial Assessment of Selected Potential Schemes” paper on the Commission’s website

186
comparable to that from a single additional runway at Heathrow or Gatwick.
Box 6d describes in more detail how the Commission has assessed the airspace
implications of the options that it has considered.
6.40 The impacts of a scheme of this kind on the point-to-point aviation market would
also need careful consideration. If some legacy carriers’ services were attracted to
such an airport from other parts of the London system, it could release additional
capacity for growth in the point-to-point and low cost sectors. However, the likely
closures of London City and Southend airports should an Estuary airport be taken
forward, could offset these benefits and reduce variety and competition within the
aviation market. Further work would be required to understand fully the effects of
an airport of this kind on the aviation industry.
6.41 Overall, the proposals put forward for a new hub airport in the Estuary show great
imagination and ambition. Following 60 years of debate about how best to
accommodate aviation growth in the South East, the next step will mark a
watershed in the UK’s approach. The prospect of a new hub airport that
fundamentally alters the current relationship between airport operations and local
noise impacts is bound to seem attractive, particularly for the many thousands
affected by noise around Heathrow. Supporting the shift of London’s economic
centre of gravity eastwards to allow for further expected population growth,
combined with a major redevelopment opportunity of the Heathrow site, is an
alluring prospect, which could have a major impact on the economic geography
of the South East.
6.42 Conversely, the costs and risks attached to such plans are so high that they present
serious challenges to the credibility of these options. The scale of road and rail
investment and construction activity needed is daunting, at a time when HS2 is also
under way. They present serious environmental challenges and planning risks, due
to their impacts on important protected sites. These problems are not necessarily
insuperable, but no complete solutions to them have been presented and it is clear,
in any case, that they would take many years to overcome. The risks to the
timescales set out by the Commission for addressing the identified capacity gap
would be significant.
6.43 The Commission’s view therefore, is that no proposal for an Estuary airport
advanced so far has presented a sufficiently powerful case for it to be
recommended as a credible option for further detailed assessment at this stage.
6.44 But neither does the Commission consider that a firm conclusion can yet be
reached that an Isle of Grain airport option would have no prospect of success. The

187
Chapter 6: Adding capacity in London and the South East
scale of benefits associated with such a proposal is potentially greater than for
any of the other options that the Commission has considered. As noted above,
substantial further work is required to evaluate these fully. The delivery challenges
posed need detailed and careful consideration. The analytical difficulties are of a
different order from those associated with expansion at an existing airport site,
particularly in relation to its local and regional economic impacts. It has not been
possible to undertake this analysis in the time available for the publication of
this report.
6.45 For these reasons, the Commission believes that it is appropriate to continue to
analyse the feasibility and impacts of such an airport in addition to the further
development of its short-listed options. Therefore, in the first half of 2014, it intends
to carry out further analysis of a number of the key issues presented by an Isle of
Grain airport. This may include consideration of:
●● the surface access measures needed to support such a development, together
with their costs and benefits (including wider impacts for users of the South East
transport network);
●● the feasibility of meeting the tests required for development affecting Natura
2000 sites, including in particular of delivering effective compensatory habitats;
and
●● the potential socio-economic impacts of a major airport development on the Isle
of Grain, including the consequential impacts in respect of the Heathrow and
London City sites.
6.46 The Commission will aim to complete this work in time to enable it to reach a
decision in the second half of 2014 on whether an Isle of Grain option constitutes
a credible option. If so, it will subject it to the same process of appraisal and
consultation as the other three short-listed options, although not necessarily to the
same timescale, so as to reach a firm recommendation in its final report in the
summer of 2015.
A hub airport at Stansted
6.47 Two options for a new hub airport were proposed at Stansted: a four runway and a
five runway airport. The Commission’s analysis focused on the five runway option.
This is because a four runway airport at this location would not deliver the
necessary overall increase in capacity across the London system. It would add
three runways at the Stansted site, but would require the closure of Heathrow and
a significant scaling back of operations at Luton due to airspace constraints. As a

188
result, the additional capacity provided would be significantly below the requirement
identified by the Commission.
6.48 The Commission’s consideration of the new hub option at Stansted has therefore
focused on a five runway option, broadly as proposed by the Mayor of London.
This would clearly address some of the issues presented by a new hub on the Isle
of Grain. It would have no direct impacts on any internationally designated sites,
for example, and the number of properties requiring demolition would be
significantly smaller.
6.49 It would be less costly than the Estuary option, though still significantly more
expensive than options for incremental expansion, at £59-80 billion. This, combined
with the higher number of passengers able to use an airport of this scale, means
that the costs of operation would be noticeably lower: with no allowance for
indexation, aeronautical charges would need to be more double than the level in the
Heathrow Q6 settlement, as opposed to over three times more for the Estuary.
6.50 In other ways, however, a five runway Stansted hub does not offer as compelling a
proposal as an Isle of Grain airport. It would not offer the same potential to address
noise impacts in the south east of England, with almost ten times as many people
affected by this option as by a Thames Estuary hub. It would be located in an
affluent area of the country, offering fewer regeneration opportunities, and although
broadly aligned with the development corridor along the Lea Valley would not
support London’s economic development objectives to the same extent.
6.51 Despite its advantages in relation to designated sites, it would also have significant
environmental and heritage impacts of its own. More than 150 listed buildings fall
within the proposed footprint for the site, including two Grade I and seven Grade II*
buildings, as well as four Scheduled Monuments and one Registered Park and
Garden. Its impacts on cultural heritage are greater than for any other option
considered. It would also involve the loss of more than 2,000 hectares of high
quality agricultural land and up to six villages. As with other hub options, it would
require major new surface access infrastructure which would present environmental
and deliverability challenges of its own.
6.52 Finally, there would be significant risks associated with the level of additional
capacity which might be provided by this option. As described in Box 6d, the
system wide capacity impacts of building four or more runways in one location
need to be considered carefully. If a five runway Stansted Hub proves capable
of delivering gross capacity of 1,250,000 ATMs the net increase for the London
airport system could be more than 300,000 movements, even allowing for the

189
Chapter 6: Adding capacity in London and the South East
closure of Heathrow and a substantial reduction in the scale of operations at Luton
and London City.
6.53 There may, however, be an upper limit to the total number of air transport
movements possible at one site. NATS advise that in the London context it may
be difficult to achieve much more than one million movements at any one site
which would almost eliminate the capacity gain provided. By way of comparison,
Atlanta – the busiest airport in the world – currently manages to handle 950,000
movements off five parallel runways with no other significant airports within
200 miles.
Box 6d: Air traffic management and system capacity
Capacity needs to be considered both in terms of the individual airport and
also in terms of net impact on the capacity of the London air traffic system.
Managing air traffic is a complex multidimensional task. It is predicated on
keeping planes safely separated until they converge at an airport. It requires
careful planning and management, whose complexity increases the closer
together airports are located and the more traffic that uses them.
Figure 5.1 in Chapter 5 gives a sense of the complexity of the London air
traffic management system; in Figure 6.2 below the same traffic is depicted
using red to indicate the densest flows of traffic and grey the least dense.
From this it is possible to see the elliptical swirls of the holding stacks where
arriving planes circle while waiting for an available slot at an airport, and the
approach paths extending for several miles along the centreline of each
runway e.g. the two approach paths to the east of Heathrow extending all the
way to London City. It is also possible to see the interaction of different
streams of traffic for the different airports – in particular Heathrow with London
City and Luton with Stansted.

190
Box 6d: Continued
Figure 6.2: London air space is complex with many interactions between the traffic streams for the various airports
Density plot of all traffic below 25,000ft (arrivals and departures) for a day in August 2012
for airports displayed – westerly operations.
BHX
LTN STN
LCYLHR
LGW
Airports:BHX – BirminghamLCY – London CityLGW – GatwickLHR – HeathrowLTN – LutonSTN – Stansted
Source: NATS
Given the proximity of London’s airports and the current volumes of traffic,
it is likely that building additional capacity at one airport may mean that it is
not possible to utilise fully the runway of another. This is particularly true where
the centrelines of runways converge at some point proximate to the airport
e.g. as is the case with Luton and Stansted.
New hub airports, therefore, often lead to greater airspace interaction
problems than incremental expansion at existing sites as their provision of
large amounts of additional capacity in one place has greater potential to
perturb the system. For these reasons the Commission’s analysis found that
the majority of new hub airports did not offer net additional system capacity
far in excess of demand forecasts. Indeed once the closure of Heathrow for
commercial reasons was factored into the calculation, the majority offered
broadly the same or even less capacity than an additional runway at an
existing airport. Table 6.1 gives a broad indication of this.
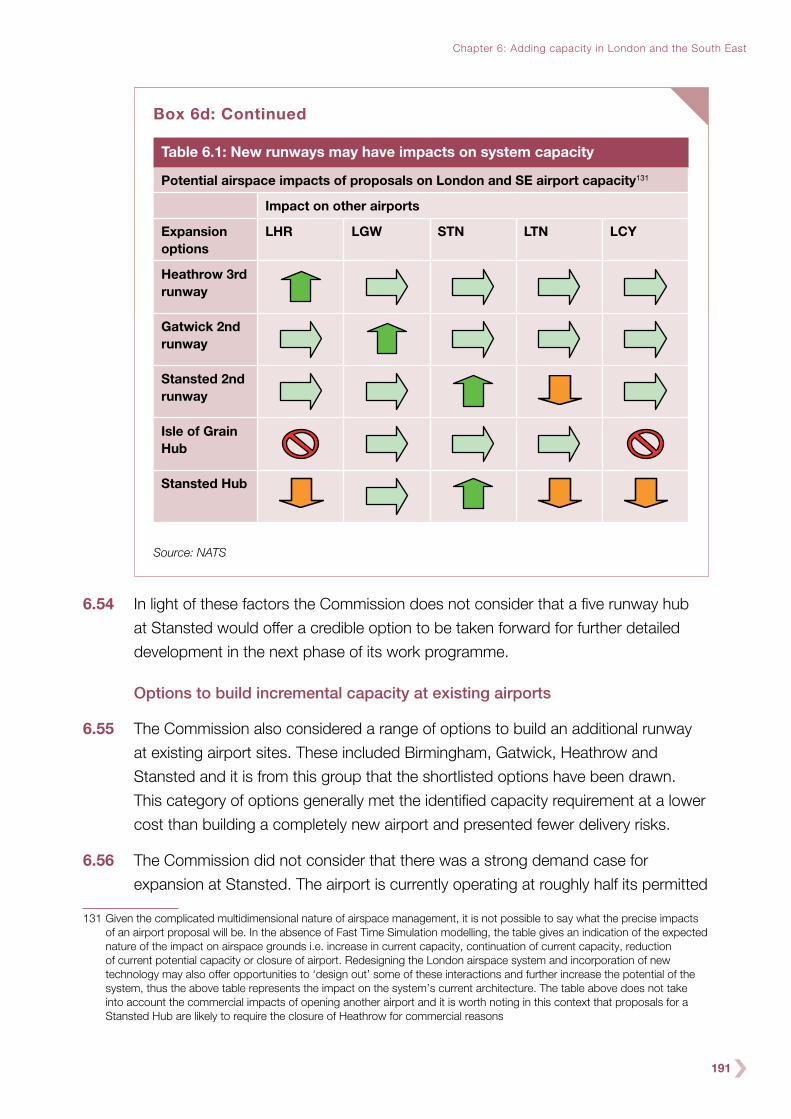
191
Chapter 6: Adding capacity in London and the South East
6.54 In light of these factors the Commission does not consider that a five runway hub
at Stansted would offer a credible option to be taken forward for further detailed
development in the next phase of its work programme.
Options to build incremental capacity at existing airports
6.55 The Commission also considered a range of options to build an additional runway
at existing airport sites. These included Birmingham, Gatwick, Heathrow and
Stansted and it is from this group that the shortlisted options have been drawn.
This category of options generally met the identified capacity requirement at a lower
cost than building a completely new airport and presented fewer delivery risks.
6.56 The Commission did not consider that there was a strong demand case for
expansion at Stansted. The airport is currently operating at roughly half its permitted
131 Given the complicated multidimensional nature of airspace management, it is not possible to say what the precise impacts of an airport proposal will be. In the absence of Fast Time Simulation modelling, the table gives an indication of the expected nature of the impact on airspace grounds i.e. increase in current capacity, continuation of current capacity, reduction of current potential capacity or closure of airport. Redesigning the London airspace system and incorporation of new technology may also offer opportunities to ‘design out’ some of these interactions and further increase the potential of the system, thus the above table represents the impact on the system’s current architecture. The table above does not take into account the commercial impacts of opening another airport and it is worth noting in this context that proposals for a Stansted Hub are likely to require the closure of Heathrow for commercial reasons
Box 6d: Continued
Table 6.1: New runways may have impacts on system capacity
Potential airspace impacts of proposals on London and SE airport capacity131
Impact on other airports
Expansion options
LHR LGW STN LTN LCY
Heathrow 3rd runway
Gatwick 2nd runway
Stansted 2nd runway
Isle of Grain Hub
Stansted Hub
Source: NATS

192
capacity and could accommodate an additional 130,000 ATMs per year. It is not
forecast to reach capacity until approximately 2040, even with other London
airports remaining constrained. It is therefore uncertain that it would provide an
effective solution to wider emerging capacity constraints.
6.57 Its wider costs and benefits would not outweigh these disadvantages. A second
runway at Stansted would not be significantly cheaper than one at Gatwick, and its
45 and 60 minute catchment areas would be noticeably smaller than at Gatwick
and Heathrow (although its 120 minute catchment area would be larger than for
Gatwick). It would increase noise impacts in 2030 at the local level, although its
noise impacts across the London system would be broadly neutral. Its other
environmental impacts would be mixed – for example, it would have comparatively
limited impacts on air quality and designated sites, but would require the loss of a
high number of listed buildings and the largest area of greenfield land of any of the
main single runway options.
6.58 For these reasons, the Commission did not consider that a second runway at
Stansted should be shortlisted as a credible option for further development and
appraisal. The airport is, however, currently prevented from operating to its absolute
maximum capacity due to planning restrictions, and the Commission will consider in
the next phase of its work whether there is a case for lifting these as part of its
overall strategy for optimising aviation capacity in the London system.
6.59 It is likely also that a new runway at Stansted should be reconsidered as part of any
future review of options for a second additional runway, which will be able to take
into account the long-term effects of competition resulting from its sale by BAA Ltd.
6.60 The case for a second runway at Birmingham Airport is predicated heavily on the
improvements in surface access which will be enabled by the construction of HS2.
The airport argues that these will make it significantly more accessible from a large
part of the UK and capable of servicing the London market as well as its existing
catchment.
6.61 The Commission’s forecasts, however, have incorporated the changes to surface
accessibility that would be enabled by HS2 and even on this basis the airport is not
forecast to be operating at capacity until the mid-2040s, even with other airports
remaining constrained. This reflects both the fact that the airport’s catchment has a
lower propensity to fly than that of airports in the South East region and that HS2 will
improve access to other airports (notably Manchester and Heathrow) from the West
Midlands just as much as it will enable easier access to Birmingham Airport from other

193
Chapter 6: Adding capacity in London and the South East
areas of the country. This is before consideration is given as to whether HS2 is able to
provide an effective ‘shuttle’ service between the airport and central London.
6.62 Noise impacts from an expanded Birmingham Airport would be relatively high in
comparison to alternative options (other than at Heathrow) for expansion at an
existing airport. There would, however, be comparatively minor impacts on listed
buildings and designated sites. Likely costs would be lower than for Heathrow
options but broadly comparable with other potential sites for a single new runway.
6.63 On balance, the Commission’s view was that there was not a strong case for
expansion at Birmingham Airport, and that it should not be shortlisted as a credible
option for further development and appraisal. As with Stansted Airport, however,
this option may merit reconsideration as part of any future assessment of options
for a second new runway, particularly as the long term impacts of HS2 on patterns
of travel and aviation demand become clearer.
6.64 At Heathrow, in addition to the runway options shortlisted, the Commission
considered options for new runways to the north and to the south west of the
existing runway. The northern option was less costly than the shortlisted north west
option, but had more severe noise impacts, while providing less capacity and
requiring the loss of significantly more residential properties. The south western
option would have a direct impact on an internationally designated site, as well as
potential effects on London’s water supply through the loss of a reservoir which
could not easily be mitigated.
6.65 The full list of options of this kind considered by the Commission is set out in
Appendix 2.
The shortlisted options
6.66 From a long list of over 50 possible options the Commission selected two potential
sites for further analysis and assessment which:
●● delivered the capacity needed in line with the estimated capacity requirement;
●● were sufficiently flexible to cope with uncertainty around the future development
of the industry; and,
●● performed well across a balanced assessment of various factors identified in the
sift criteria.
6.67 These two sites, and the credible runway options in each case, are considered in
detail below with an explanation of the Commission’s rationale for the proposed
option being shortlisted. The two sites are:

194
●● Gatwick Airport: At this site the Commission’s analysis will be based on a new
runway over 3,000m in length spaced sufficiently south of the existing runway to
permit fully independent operation.
●● Heathrow Airport: At this site the Commission’s analysis will consider two
potential runway options:
– A new 3,500m runway constructed to the north west of the existing airport,
as proposed by Heathrow Airport Ltd, and spaced sufficiently to permit fully
independent operation.
– An extension of the existing northern runway to the west, as proposed by
Heathrow Hub Ltd, lengthening it to at least 6,000m and enabling it to be
operated as two separate runways: one for departures and one for arrivals.
6.68 In the next phase of its work, the Commission will subject the short-listed proposals
to a more rigorous assessment, including consideration of their economic, social
and environmental impacts, to develop as comprehensive a picture as possible of
the risks and opportunities within each of the proposals, and to prepare the
background evidence needed for the delivery of a final recommendation. There will
be consultation on the design and appraisal of each shortlisted option in the
autumn of 2014.
Site 1 – Gatwick Airport
6.69 As discussed in Chapter 3, since it was purchased by its current owners in
October 2009 Gatwick Airport has sought to position itself as a competitor to
Heathrow, as well as to enhance its position as a key airport for low-cost and point-
to-point services.
6.70 The airport has attracted a number of new carriers, including airlines operating to
Far Eastern destinations (China, Vietnam and from next year Indonesia), which
might previously have been expected to operate only from a more established hub
airport. It has also introduced its Gatwick Connect service to support travellers
using the airport to self-connect between services, and from 2014 it will
accommodate the UK’s first low-cost long-haul services.
6.71 Expanding capacity at Gatwick Airport could support growth in the point-to-point
market by allowing established carriers at the airport to increase the scale of their
operations and attracting new ones. But it could also help to support and enhance
the UK’s hub status, perhaps by attracting one of the major alliances to move from
Heathrow, incentivised by greater scope for growth or the opportunity to build a
dominant position at the airport. It might equally be through the continuing growth

195
Chapter 6: Adding capacity in London and the South East
of self-connecting at the airport, through new partnerships between short- and
long-haul airlines operating there or through some combination of the two.
6.72 These are not mutually exclusive scenarios. Growth in point-to-point traffic, for
example, could over time provide an increasing feed market for any potential
network carrier at the airport, strengthening the incentives to move from Heathrow.
In addition, the enhanced competition for Heathrow which might be offered by an
expanded Gatwick Airport could potentially lead to further benefits for passengers
and freight users.
6.73 Gatwick’s single current runway is already operating at a high level of utilisation and
the Commission’s demand forecasts estimate that it will reach capacity within less
than ten years. This suggests that any new runway would likely be well-utilised, with
the Commission’s forecasts indicating an expanded Gatwick could operate at 70%
capacity in 2030 rising to over 95% by 2050.
6.74 Gatwick Airport Ltd has proposed that a new runway should be constructed south
of the existing one. It has identified three options: close-spaced, wide-spaced/
dependent operation and wide-spaced/independent operation. The Commission’s
assessment has focused on the last – a runway over 3,000m in length spaced
sufficiently south of the existing runway (at least 1,035m) to permit fully independent
operation. This offers the greatest increase in capacity while still having relatively low
environmental and noise impacts compared with some other potential sites. The
Commission will, however, keep this under review as it takes forward more detailed
development and appraisal. The proposal also includes related new terminal
facilities and taxiways between the new and existing runways.

196
Figure 6.3: Gatwick Airport: one new runway to the south
A new runway over 3,000m in length, as proposed by Gatwick Airport Ltd, spaced sufficiently south of
the existing runway to permit fully independent operation. Related new terminal facilities and linking
taxiways would be built in between the new and existing runways
Source: Gatwick Airport Ltd
6.75 The costs of expansion at Gatwick, while substantial (estimated to be between
£10-13 billion over the period to 2030, once the costs of surface access
improvements are taken into account, and with allowances for risk and optimism
bias), are lower than those of expansion at Heathrow and significantly lower than
those of any new hub airport.
6.76 The relatively strong forecast demand at Gatwick suggests that these costs could
credibly be financed. With no direct Government subsidy and including surface
access costs, the Commission estimates that this would require aeronautical yields
per passenger to be about a third more than the level of the proposed Heathrow Q6
settlement at Heathrow. Given the scale of the project, some level of Government
involvement may be required to secure financing at an attractive rate, but that
applies to all options under consideration.
6.77 Gatwick’s demand catchment is comparatively strong. There are reasonably fast
rail connections to Victoria and London Bridge, with the Thameslink connection
providing a link to two other London terminals and suburban destinations to the
north of the capital, as well as to HS1 and in due course to Crossrail. Access to
the airport is also good from a range of towns and cities to the south of London.

197
Chapter 6: Adding capacity in London and the South East
The expansion of the airport, however, would place additional pressure on transport
links, although that will be mitigated to some degree by improvements already
committed.
Figure 6.4: Environmental impacts of a new runway at Gatwick
Source: Jacobs
6.78 The land required for this proposal has previously been safeguarded by Gatwick so
the need for property demolitions is small, with roughly 200 homes estimated to be
lost – fewer than for most other proposals.132
6.79 As can be seen in Figure 6.4, the impacts on protected sites, landscape and
heritage of this proposal are also limited. There is no loss of greenbelt land and no
sites with the most important international environmental designations are affected,
although there may be indirect impacts on nearby Sites of Special Scientific Interest,
Conservation Areas and Scheduled Monuments. These impacts are lower than for
many other schemes considered. Up to 15 listed buildings are located within the
safeguarded area and could potentially be lost (five of which are Grade II*, but none
132 By way of comparison Gatwick Airport Ltd stated that this option would likely impact 100 residential and 120 commercial properties. The Commission’s analysis used area data from GIS sources to provide average population densities for the affected sites. The analysis was consistent across all options analysed but does not represent local on site survey data which may or may not underpin some of the figures quoted by proposers. Further information on the methods used to compile the data are available in the Approaches and Assumptions paper on the Commission’s website. This is an area for further work in Phase 2

198
of which are Grade 1), with some other nearby buildings at risk. The proposals
would require the development of some 900 hectares of greenfield site (not
including road schemes), but this is limited in comparison to some of the larger
schemes.
6.80 Local noise impacts at Gatwick are currently much lower than at Heathrow, with the
modelled population within the 57LAeq contour totalling approximately 3,200. If the
proposed expansion were implemented this would be estimated to rise by 2030 to
around 6,300 (compared to a 2030 baseline of 1,900 taking account of expected
background reductions in aviation noise due to technological and operational
improvements). This compares to a modelled 2030 baseline of more than 150,000
at Heathrow. While the proposal does not offer the same potential to reduce overall
noise impacts as a new hub airport, the numbers of people affected by noise in the
Gatwick area remain relatively low.133
6.81 Noise performance against a 57LAeq contour at a London airport system-wide level
is slightly worse than the north western runway option at Heathrow but better than
the extended northern runway. There is a much better modelled performance at
noise contours that measure a wider area, frequency of impact, or at night, (i.e.
55LDen, 50LNight and N70) due to the airport’s more sparsely populated hinterland.
The numbers of people expected to be affected by noise in 2030 who were not
impacted in 2012 is low. The scope to reduce noise impacts further through
airspace and operational design will be explored as part of detailed development.
6.82 The area immediately surrounding the airport is relatively affluent so a second
runway at Gatwick would be unlikely to promote significant regeneration, but there
is still potential for economic and employment benefits in the region.
6.83 On the basis of its analysis, the Commission’s view is that on balance this is a
credible option for future expansion which should be developed and appraised in
detail in the next phase of the Commission’s work programme.
133 For comparison the modelled population in the CAA 57LAeq contour for 2012 was 3,650 at Gatwick. The Commission used a different modelling approach (INM) to that of the CAA (ANCON) to allow for consistent comparison across all options (including those where no historic data was available e.g. new sites). This approach has not taken account of noise preferential routes assuming straight in and out operations, and so the results differ from those of the CAA modelling. The key factor is the relative difference between the modelled results rather than the absolute numbers. Given the uncertainties associated with modelling, only where differences greater than a few thousand is there a strong likelihood that reality will reflect the same relative performance. Further information on the approach taken by the Commission to modelling of noise is available in the Approaches and Assumptions paper on the Commission’s website

199
Chapter 6: Adding capacity in London and the South East
Site 2 – Heathrow Airport
6.84 Heathrow Airport is the UK’s largest airport and has a well-established role as its
major aviation hub. While passenger numbers continue to rise, it has operated for
some time at the limits of its runway capacity with no scope for further growth in air
transport movements.
6.85 As the analysis in Chapter 3 sets out, the impacts of this are already perceptible in:
high levels of delays and unreliability; the consequent restrictions on growth in the
number of destinations served; and impacts on local communities through
unpredictability of respite. The Commission’s modelling has indicated that the
impact on connectivity could potentially become more severe over time as fewer
transfer passengers use the airport and its route network declines as a result.
6.86 Expansion at Heathrow could alleviate these impacts, providing greater scope for
airlines to open new routes and services and enabling more resilient and hence
predictable operations.
6.87 It would be likely to support the maintenance and improvement of the UK’s hub
status, as it would open up the potential for growth at one of the world’s most
important aviation hubs. It could also enable growth in the point-to-point market
both by enabling point-to-point carriers to increase their presence or establish new
footholds at Heathrow; and by creating space for growth at other congested
airports as and when services operated by network carriers migrate to Heathrow.
6.88 The Commission’s forecasts indicate that a new runway at Heathrow would be very
well-used, with the expanded airport operating at around 80-90% of capacity by
2030 and at maximum capacity by 2050.
6.89 A wide range of options for new runways at Heathrow was submitted to the
Commission. In reviewing them, the Commission has taken careful account of their
environmental implications, alongside other factors such as cost and deliverability.
A key environmental issue was noise, given the high numbers of people affected by
the airport currently, but other issues including air quality, impacts on protected sites
and London’s water supply were also relevant.

200
6.90 The Commission’s detailed assessment of the case for a new runway at Heathrow
will focus on two possible options as shown in Figures 6.5 and 6.6 opposite:
6.91 Many of the features and impacts of these options are broadly the same. The costs
for each would be higher than those for most single runway options considered at
other sites, although less than those for the south west runway option at Heathrow.
Estimated as costing £13-18 billion by 2030 they are, however, much lower than
most options with four or more runways, in many cases by several orders of
magnitude.
6.92 The Commission has carried out the same financing analysis as for other options.
This suggests that the costs for both could credibly be financed, given the strength
of forecast demand for any expanded capacity, with the airport’s aeronautical yields
rising as a result to roughly one and a half times the level in the proposed Q6
settlement.
6.93 Heathrow offers the closest location to central London of any of the potential sites
considered – providing good connection times to important origin and destination
markets. The completion of Crossrail and the western link to Heathrow from the
Great Western Main Line will improve this further. For these reasons, and taking into
account the additional transport investment, Heathrow benefits from larger 45, 60
and 120 minute catchments than the majority of the options under consideration.
6.94 Given the extensive existing and planned transport connections to the airport,
additional surface access requirements are limited but include improved rail access
to the south and incremental road improvements. A high speed rail spur from the
main HS2 line to the airport is not included in the cost estimate, but the
Commission will consider the case for this as part of its review of surface access
options. It will not, however, consider the case for any re-routing of the main
HS2 line.
6.95 It appears reasonable to assume that background increases in traffic over the
period to 2030 will already push the heavily congested local motorway network
beyond capacity and therefore action will need to be taken with or without
expansion at the airport. For this reason, more significant motorway enhancement
costs are not included in the Commission’s cost estimate, however, these
assumptions will need further consideration.
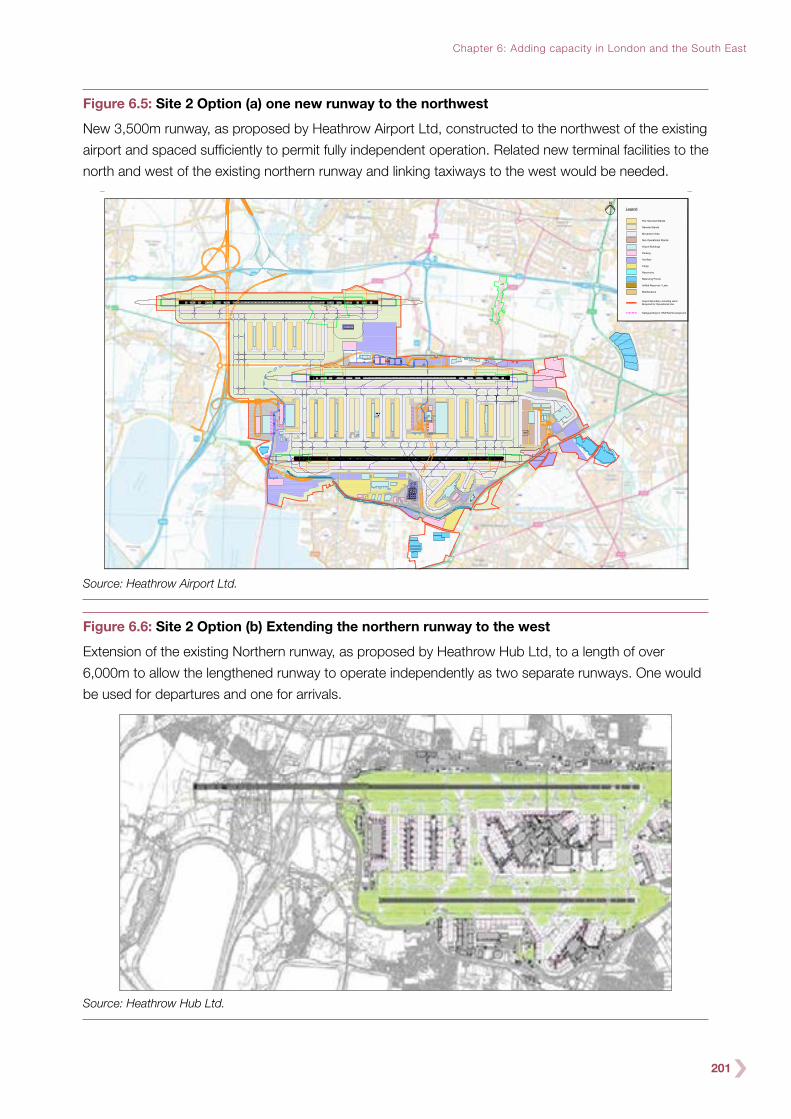
201
Chapter 6: Adding capacity in London and the South East
Figure 6.5: Site 2 Option (a) one new runway to the northwest
New 3,500m runway, as proposed by Heathrow Airport Ltd, constructed to the northwest of the existing
airport and spaced sufficiently to permit fully independent operation. Related new terminal facilities to the
north and west of the existing northern runway and linking taxiways to the west would be needed.
500Metres - 1:10,000
10000
Legend
Pier Serviced Stands
Remote Stands
Movement Area
Non Operational Stands
Airport Buildings
Parking
Airport Boundary including LandRequired for Operational Use
Safeguarding for HS2 Rail Development
Ancillary
Cargo
Infilled Reservoir / Lake
Maintenance
Balancing Ponds
Reservoirs
ISO A1 Landscapezz12_V7_0_baa-a1l-b
This drawing may contain Ordnance Mastermap and Raster data.
OS Copyright Acknowledgement.Reproduced by permission of Ordnance Survey on behalf of HMSO. © CrownCopyright and database right. All rights reserved. LHR Airports Limited, O.S. LicenceNumber AL100020071.
TitleModel / Content References List - Name, Version & Status:
Document Uncontrolled When Printed
Key Plan
Version
Project Name
Location-Level-Sub Series/System-Identifier
Heathrow Project No.
© LHR Airports Limited
Company Drawn By Chk/Approved StatusDrawn DateScale:Security:
DrnVer Description Of ChangeDate
This document is issued for the party which commissioned it and for specific purposesconnected with the captioned project only. It should not be relied upon by any otherparty or used for any other purpose.We accept no responsibility for the consequences of this document being relied uponby any other party, or being used for any other purpose, or containing any error oromission which is due to an error or omission in data supplied to us by other parties.
This document contains confidential information and proprietary intellectual property.It should not be shown to other parties without consent from the party whichcommissioned it.
Heathrow 2025SECURE 1:12,500
3R Masterplan
North WestSource: Heathrow Airport Ltd.
Figure 6.6: Site 2 Option (b) Extending the northern runway to the west
Extension of the existing Northern runway, as proposed by Heathrow Hub Ltd, to a length of over
6,000m to allow the lengthened runway to operate independently as two separate runways. One would
be used for departures and one for arrivals.
Source: Heathrow Hub Ltd.
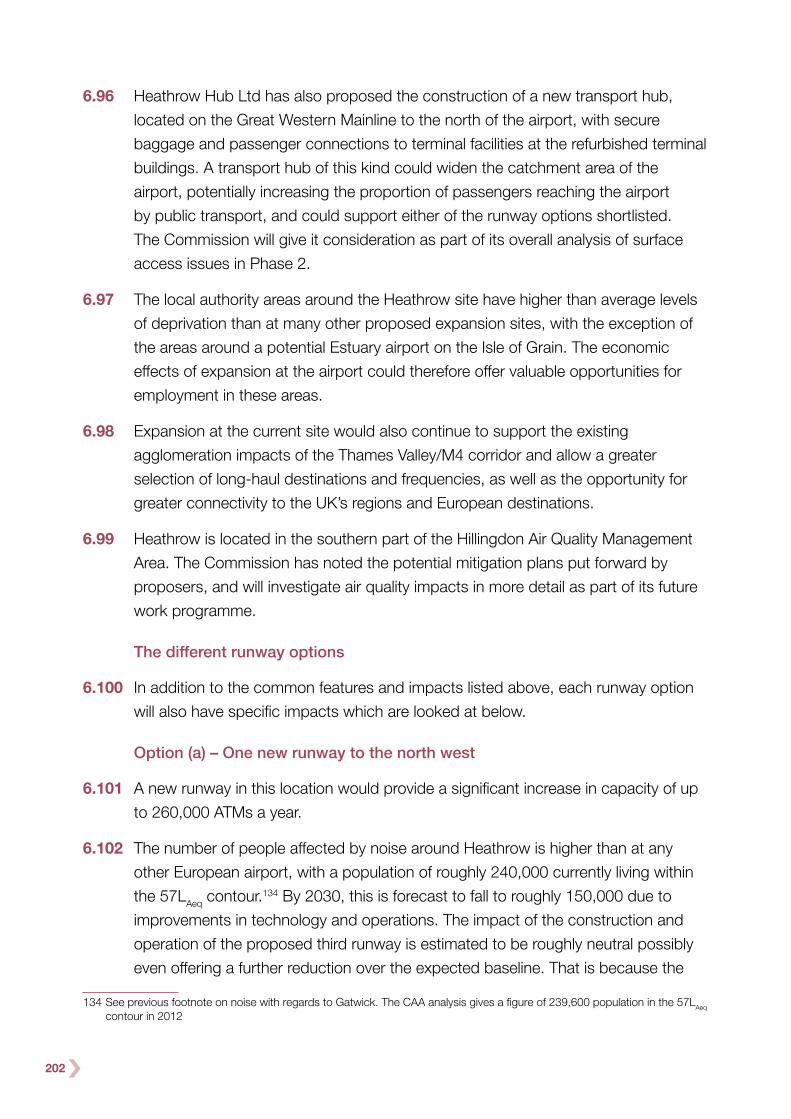
202
6.96 Heathrow Hub Ltd has also proposed the construction of a new transport hub,
located on the Great Western Mainline to the north of the airport, with secure
baggage and passenger connections to terminal facilities at the refurbished terminal
buildings. A transport hub of this kind could widen the catchment area of the
airport, potentially increasing the proportion of passengers reaching the airport
by public transport, and could support either of the runway options shortlisted.
The Commission will give it consideration as part of its overall analysis of surface
access issues in Phase 2.
6.97 The local authority areas around the Heathrow site have higher than average levels
of deprivation than at many other proposed expansion sites, with the exception of
the areas around a potential Estuary airport on the Isle of Grain. The economic
effects of expansion at the airport could therefore offer valuable opportunities for
employment in these areas.
6.98 Expansion at the current site would also continue to support the existing
agglomeration impacts of the Thames Valley/M4 corridor and allow a greater
selection of long-haul destinations and frequencies, as well as the opportunity for
greater connectivity to the UK’s regions and European destinations.
6.99 Heathrow is located in the southern part of the Hillingdon Air Quality Management
Area. The Commission has noted the potential mitigation plans put forward by
proposers, and will investigate air quality impacts in more detail as part of its future
work programme.
The different runway options
6.100 In addition to the common features and impacts listed above, each runway option
will also have specific impacts which are looked at below.
Option (a) – One new runway to the north west
6.101 A new runway in this location would provide a significant increase in capacity of up
to 260,000 ATMs a year.
6.102 The number of people affected by noise around Heathrow is higher than at any
other European airport, with a population of roughly 240,000 currently living within
the 57LAeq contour.134 By 2030, this is forecast to fall to roughly 150,000 due to
improvements in technology and operations. The impact of the construction and
operation of the proposed third runway is estimated to be roughly neutral possibly
even offering a further reduction over the expected baseline. That is because the
134 See previous footnote on noise with regards to Gatwick. The CAA analysis gives a figure of 239,600 population in the 57LAeq contour in 2012

203
Chapter 6: Adding capacity in London and the South East
new runway would allow a portion of the airport’s traffic to land and take off further
to the west than the existing configuration of runways, which sees those aircraft
flying at a higher altitude over the most densely populated areas. That is sufficient to
offset the noise impacts from the additional air services accommodated, on the
57LAeq noise metric.
6.103 The use of the additional runway would also spread the noise impact over a larger
area, meaning that some people would be newly brought within the 57LAeq contour,
although they are estimated to be roughly balanced by those removed from the
contour area as a result of the operational changes described above. There would
likely be some reduction in respite under this option, although this is unlikely to be
as significant as for the extended northern runway considered in option (b) below.
6.104 The north western runway option performs more strongly than the extended
northern runway in respect of the 57LAeq noise contour and the N70 noise contour
(this offers an alternative to average noise contours and identifies those properties
experiencing more than 50 events per day whose maximum noise level is 70
decibels or above). In respect of other metrics, however, the extended northern
runway option has the lower impact. This is described in more detail below.
Figure 6.7: Environmental impacts of Option (a) – one new runway to the northwest
Source: Jacobs

204
6.105 As shown in Figure 6.7, no internationally designated sites are directly impacted by
the proposal. The South West London Waterbodies SPA/Ramsar site would,
however, lie within 2km of the expanded airport site, with the potential for some
indirect impacts. Further analysis would be needed, but the current close proximity
of the existing airport boundary gives cause to believe any impact may not be
significant.
6.106 This proposal would also require a significant number of demolitions, totalling
approximately 1,500 houses and including the loss of the village of Harmondsworth,
much of which is a conservation area.135 A second conservation area in Longworth
would also lose listed buildings. Around 30 listed buildings would be lost, including
the Grade I listed Great Tithe Barn and the Grade II* listed St Mary’s Church. While
Heathrow Airport Ltd has indicated that it will continue to examine the potential to
avoid the most severe of these heritage impacts, it is difficult to see currently how
this may be achieved other than by relocating the barn and church.
Option (b) – Extending the northern runway to the west
6.107 The extended northern runway option would not be capable of operating
independently from the existing runways, and therefore the level of net additional
capacity achieved would not be as great. The Commission estimates that the
maximum additional capacity achievable under this option would be 190,000 air
transport movements, compared to 260,000 for the north western runway. The
novel nature of the proposal also means that further work to develop an acceptable
safety case would be required to understand fully the capacity benefits, although
the Commission has not seen any evidence to suggest that such a safety case
could not be put into place.
6.108 The potential noise impacts also vary significantly between the two proposals.
As set out above, the north western runway performs more strongly than this option
in respect of a 57LAeq contour. On this measure, the population within the contour
would increase by approximately 30,000 in comparison to the forecast 2030
baseline. This option also offers less scope to maintain significant periods of respite,
as it relies on the simultaneous use of two runways for arrivals or departures for
substantial periods of the day, though this effect is mitigated if not operating at full
capacity. Further investigation of the issues surrounding respite for both options will
be needed in Phase 2.
6.109 Conversely, the extended northern runway proposal would offer significantly greater
benefits in reducing noise at night. The runway configuration would allow all night
135 For comparison Heathrow Airport Ltd estimate a total of 950 residential properties lost

205
Chapter 6: Adding capacity in London and the South East
flights to use the western portion of the extended runway, shifting these movements
noticeably further to the west than with the north western option. As a result, the
population falling within the 55 LDen contour, which measures average noise levels
across day, evening and night, placing greater weight on the latter two, is more than
20,000 lower than for the north western runway. The difference in respect of night
noise alone is even greater.
Figure 6.8: Environmental impacts of Option (b) – Extending the northern runway to the west
Source: Jacobs
6.110 This option is situated closer to the boundary of the South West London
Waterbodies SPA/Ramsar site and could potentially encroach upon it. Therefore,
the risk of direct impacts cannot be ruled out, and any indirect impacts may be
greater than for the north western runway. Nonetheless, as for the north western
runway, the current close proximity of the airport’s existing boundary suggests that
they may not be significant.
6.111 This option’s impacts on properties and local cultural heritage, however, are
noticeably lower than for the north west runway proposal, with direct effects on just
8 listed buildings (none Grade I or Grade II*) and only indirect effects on the
Colnbrook Conservation Area. It also requires the demolition of the fewest

206
properties out of all options considered at Heathrow, with a probable total of 720
properties estimated to be lost.136
6.112 On the basis of its analysis, the Commission’s view is that on balance both the
north western runway and the extended northern runway at Heathrow are credible
options for future expansion which should be developed and appraised in detail in
the next phase of the Commission’s work programme.
Conclusion
6.113 On the basis of its analysis the Commission believes that an additional runway at
Gatwick or an additional runway at Heathrow, which could be delivered in one of
two ways, warrant further analysis as credible options to maintain the UK’s position
as Europe’s most important aviation hub.
6.114 The Commission will now subject these three options at the two short-listed sites to
a more detailed assessment, including consideration of their economic, social and
environmental impacts, to develop as comprehensive a picture as possible of the
risks and opportunities within each of the proposals, and to prepare the
background evidence needed for the delivery of a final recommendation.
6.115 In addition, the Commission intends to carry out further analysis of the feasibility
and impacts of an Isle of Grain airport and reach a decision in the second half of
2014 as to whether this constitutes a credible option for detailed development and
appraisal. If it concludes that it is, it will be subject to a similar process of appraisal
and consultation as the existing short-listed options, prior to the Commission
reaching the recommendations in its final report.
136 Heathrow Hub Ltd estimate the total number of residences to be lost as 100-150

207
Chapter 7:
Next steps
SUMMARY
In the second phase of the Commission’s work, from now until the publication of its
final report in summer 2015, the designs of the short-listed proposals will be further
developed and subjected to a more detailed assessment. There will be consultation
on the short-listed options and the associated appraisal results in the autumn of
2014.
The Commission will publish a draft Appraisal Framework for consultation early in
2014. This will set out details of how scheme designs should be developed and how
scheme impacts will be appraised.
The Commission will also set out early in 2014 more details of how it will take forward
its further analysis of the option for a new hub airport in the Thames Estuary.
The Commission recognises that the publication of this Interim Report may cause
unwelcome uncertainty for communities close to the short-listed sites. The
Commission encourages the Government and those promoting schemes to consider
what steps can appropriately be taken to limit these concerns, including for the
limited number of people who may face an urgent need to sell their home before the
Commission publishes its final report but find themselves unable to do so.
Introduction
7.1 Following this Interim Report the Commission’s work enters a new phase.
7.2 The Commission’s Terms of Reference set out the following requirements for the
final report:
The Commission should report no later than summer 2015 on:
●● its assessment of the options for meeting the UK’s international connectivity
needs, including their economic, social and environmental impact;
●● its recommendations for the optimum approach to meeting any needs; and

208
●● its recommendations for ensuring that the needs are met as expeditiously as
practicable within the required timescale.
The Commission should base the recommendations in its final report on a detailed
consideration of the case for each of the credible options. This should include the
development or examination of detailed business cases and environmental
assessments for each option, as well as consideration of their operational,
commercial and technical viability.
7.3 The next phase of the Commission’s work programme has, therefore, a different
focus.
7.4 To understand better the economic, social and environmental impacts of the short-
listed options, as well as their operational, commercial and technical viability, the
Commission will now subject them to more thorough and rigorous analysis. This
analysis will be put to national consultation in autumn of 2014 and, ultimately,
will be published alongside the Commission’s final report to the Government.
Figure 7.1: Commission’s proposed timings for work on the short-listed options
Dec 17th: Publicationof InterimReport
Consultation
Jan 16th–Feb 28th:Public Consultationon draft AppraisalFramework
Commission activityMay 9th: Refreshedscheme designs submittedby scheme promoters
Assessments undertaken on refreshedscheme designs. Any assessments submitted by scheme promoters quality assured by the Commission.
Publication of refreshedscheme designs andCommission appraisals
Scheme promoter activity
National consultation onrefreshed scheme designsand Commission’s appraisalof schemes
Summer 2015
Date to be confirmed:Publication of theCommission’s finalrecommendations
Jan2014
Feb March MayApril June July Aug Sept Oct Nov Dec
January 16th: Publication of Appraisal Framework consultation
March 28th: Publication of finalised Appraisal Framework
7.5 In addition, as outlined in Chapter 6, the Commission will continue to investigate the
option of a potential new hub airport located in the Thames Estuary. This additional
work will be undertaken in the first half of 2014 with a view to deciding in the
second half of 2014 whether such a proposal should be considered alongside the
short-list. If a decision is reached that it should, it will be subject to similar appraisal
and consultation processes as the short-listed options, although not necessarily to
the same timescale.

209
Chapter 7: Next steps
Public engagement
7.6 A range of stakeholders are likely to want to input into the Commission’s process
and provide their views both on the short-listed schemes and on the further analysis
of the Thames Estuary option.
7.7 The first opportunity for such engagement in relation to the development and
appraisal of the short-listed schemes will be the consultation on the Commission’s
draft Appraisal Framework. This is expected to be published in early 2014.
7.8 The Commission also intends to hold a national consultation in the autumn of 2014.
This will present for public scrutiny the refreshed designs of the short-listed
schemes, as well as the assessments that have been undertaken on these
schemes’ economic, social and environmental impacts and on their operational,
commercial and technical viability.
7.9 Following this consultation the Commission will review the scheme designs and
assessments in the light of comments received, and address any gaps or
weaknesses in the evidence base. The final versions of these documents will be
used to inform the recommendations in the final report, due in summer 2015.
7.10 Alongside these consultation processes, the Commission expects that there will be
further opportunities for engagement through public evidence sessions, similar to
those conducted during the first phase of its work. These sessions will provide
opportunities for interested parties and members of the public to comment on
elements of the Commission’s process and appraisal methods.
7.11 They may also provide an opportunity for the Commission to question the
promoters of short-listed schemes on the details of their proposals and to take
evidence from local authorities, community and business groups and other
stakeholders in close proximity to the short-listed areas regarding their views about
the schemes under development and the appraisal of those schemes.
7.12 Alongside any public engagement activities taken forward by the Commission, it will
be important for the promoters of short-listed schemes to ensure that groups
representing nearby residents and businesses, and other stakeholders such as
passengers and airport users, have the opportunity to make their views known.
7.13 The Commission therefore encourages scheme promoters to engage with and
understand the views of these groups, and to report on this as part of their
submissions.
210
Airports Commission: Interim Report
7.14 The Commission’s further analysis of the feasibility and impacts of a Thames
Estuary airport will incorporate opportunities for input from stakeholders, including
those who have previously submitted proposals for such a scheme. The
Commission will publish details early in 2014 of how it intends to take this process
forward.
Managing impacts on local communities and property markets
7.15 In the long-term, should the recommendations in the Commission’s final report
be taken forward, it will be important that effective and wide-ranging measures are
put in place in the relevant locations to ensure local property markets continue to
function efficiently as proposals progress through the planning system. The
Commission welcomes the recognition of this in the submissions made by the
owners of Gatwick and Heathrow airports. For any area that is not the subject of
the Commission’s final recommendations, any prior impacts should be rapidly
alleviated.
7.16 In the interim period, however, the Commission recognises that the publication of
this Interim Report may cause unwelcome uncertainty for communities close to the
short-listed sites and may have some impact on local property markets. There is
likely to have been some underlying uncertainty for some time in these areas,
potentially since well before the Commission was established, as Gatwick and
Heathrow are both areas where such proposals have been made previously.
But the Commission is aware of the potential of this Interim Report to intensify this.
7.17 The Commission therefore encourages the Government and those promoting
schemes to consider what steps can appropriately be taken to address these
concerns. It is important that, at this early stage in the process, any measures are
proportionate. This report only proposes a shortlist of schemes for further
development, plus a limited period of further consideration of the option for a
Thames Estuary airport. It would not be appropriate for wide-ranging measures to
be put in place that could see large numbers of property owners incentivised to
leave the areas under consideration. Such an approach could have the perverse
effect of intensifying blight rather than alleviating it.
7.18 Nonetheless, there may be a limited number of property owners, particularly around
the short-listed sites, with a clear need to move home or sell their property, who find
themselves unable to do so following the publication of this report.
7.19 The Commission recommends that where such cases are identified, those
promoting schemes should consider what mitigations could be put in place, be that

211
Chapter 7: Next steps
through individual engagement with the property owners affected or through the
introduction of targeted assistance schemes for those in immediate hardship.
7.20 It is clear that the successful delivery of any new proposal will depend upon
developing fair, open and honest relations with local communities. Alleviating
concerns and actively managing relations will be an important step in demonstrating
commitment to such an approach.
The role of the Commission
7.21 Key elements of the Commission’s work between now and the final report will
include a) refreshing and developing the designs of short-listed schemes, and b)
appraising scheme impacts. The latter will, to some extent, inform the former.
7.22 The Commission has a different role to play for each of these tasks. In order to
ensure that the Commission’s process is transparent, fair and independent, it is
important that it has the final decision on the appraisal of all scheme impacts.
In designing and developing schemes, promoters should take the lead role.
7.23 The Commission has previously stated that it will seek to work collaboratively with
scheme promoters, and scheme promoters will be expected to communicate
openly with the Commission during both the design and appraisal phases.
Refreshed scheme design
7.24 In order to inform its final recommendations, the Commission requires all the
short-listed schemes to be developed to an appropriate level of detail, and
appraised to a consistent standard.
7.25 To this end, the Commission invites scheme promoters to submit a refreshed
scheme design by Friday 9 May. These refreshed designs will be a development
of the specific options short-listed by the Commission, and will be published by the
Commission as part of its autumn 2014 consultation. Scheme promoters will be
invited to provide further information in a number of areas, including the following:
●● Strategic Overview, outlining why a proposal is well-placed to address the UK’s
future aviation capacity and connectivity needs, and how it may support the
socio-economic development of local areas, regions and the UK as a whole.
●● Airport Master Plan, providing details of the airfield design and its planned
modes of operation, including planned airspace requirements.
●● Engineering Plans, including for example information on costings, energy and
utilities requirements, geo-environmental issues and surface development plans.

212
●● Mitigation Strategies, comprising plans to limit detrimental impacts on the
environment and local communities.
●● Development Strategies, detailing how the additional capacity would be
funded and project-managed to delivery.
7.26 Further information on each of these scheme elements will be contained in the draft
Appraisal Framework.
7.27 In addition, scheme promoters will also be invited to submit details of their
proposed Surface Access Strategies. However, this will be used as an input into
an overall programme of work led by the Commission. This is because any surface
access improvements to support proposed new airport infrastructure are likely to be
at least part-funded by the Government, and the design and appraisal of
appropriate surface access measures will require the full involvement of Network
Rail and the Highways Agency amongst others. The Commission is well-placed to
coordinate this work, working alongside scheme promoters as appropriate.
7.28 The Commission expects that in refreshing scheme designs scheme promoters will
wish to refer to the appraisal modules detailed within its Appraisal Framework.
A final version of this Framework is expected to be published at the end of March.
This will allow promoters time to consider the finished Appraisal Framework prior
to submitting refreshed designs.
7.29 Once refreshed scheme designs have been submitted, the Commission will review
whether further refinements to scheme proposals are required or would be
beneficial.
Scheme appraisal
7.30 The final Appraisal Framework will set out the areas for appraisal and the
assessment methodologies to be used in these areas.
7.31 The results of the various appraisals and assessments undertaken will be used to
compile detailed business cases and sustainability assessments. These documents
will be produced for each short-listed option, and presented for national
consultation in the autumn of 2014 alongside scheme promoters’ refreshed scheme
designs.
7.32 The Commission will consider any appraisal information submitted by proposers,
and submit it to rigorous validation and quality assurance. Final responsibility for
scheme appraisal and the content of its autumn consultation documents lies,
however, with the Commission, and the Commission will be under no obligation to
213
Chapter 7: Next steps
use or refer to appraisals submitted by proposers when compiling documents for its
national consultation or decision-making process.
7.33 Should the Commission decide in the second half of 2014 that a new airport in the
Thames Estuary is a credible option for detailed consideration alongside the short-
listed schemes, it will undergo a similar process of development, appraisal and
public consultation, although not necessarily to the same timescale.
7.34 The Commission welcomes views on all the approaches outlined in its draft
Appraisal Framework, which will be published early in 2014.
Delivering the Commission’s final recommendations
7.35 In addition to identifying recommendations for meeting the UK’s long-term aviation
capacity needs, the Commission’s remit for the next phase of its process requires it
to identify how the delivery of any such recommendation may be expedited.
7.36 The Commission has identified a number of areas where further work may be
necessary to fulfill this element of its remit. These could include:
●● planning issues – including in relation to the development and adoption of any
future National Policy Statement, and the resolution of any subsequent planning
applications;
●● approaches to noise management, including operational procedures, planning
safeguards and compensation for those affected by future noise from any
recommended option;
●● other environmental safeguards, for example in respect of carbon emissions or
air quality;
●● options for structuring any necessary public sector funding contribution or
financing guarantees;
●● changes to the system governing the economic regulation of airports to support
the delivery of long-term options; and,
●● measures to enable the maximum use of existing runway infrastructure at other
sites as part of an overall aviation capacity and connectivity strategy.
7.37 The Commission will provide further details of its work programme in these and
related areas in the course of 2014.

214
Glossary
ACDM Airport Collaborative Decision MakingACL Airport Coordination LimitedACNUSA The French Noise Authority translated to Airport Pollution Control Authority AEF Aviation Environment FederationAero revenue That part of an airport’s revenue derived from a number of charges levied on airlines
using the airport Airline alliance An airline alliance is an agreement between two or more airlines to cooperate: it may
range from marketing agreements through code sharing and joint ventures to
mergers. The three global airline alliances are Star Alliance, SkyTeam, and oneworld
which provide a global network of destinations for passengersAMS Amsterdam Schiphol Airport (IATA code)ANCON The UK Civil Aircraft Noise Contour Model (ANCON) is the mathematical model used
by the CAA to produce annual aircraft noise contours depicting the magnitude and
extent of the aircraft noise around Heathrow, Gatwick and Stansted. It is also used
to produce noise exposure forecasts for use in airport planningAONB Areas of Outstanding Natural BeautyAPD Air Passenger DutyATC Air Traffic ControlATMs Air Transport Movements. Landings or take offs of aircraft engaged in the transport
of passengers or freight on commercial termsBA British AirwaysBAA British Airports Authority LimitedBCC British Chamber of CommerceBelly hold
freight
Refers to cargo on passenger services
Bilateral
agreements
An agreement which two nations sign to allow international commercial air transport
services between their territories on a reciprocal basisBRIC Grouping acronym that refers to the countries of Brazil, Russia, India and China Business
aviation
Refers to dedicated business jets
CAA Civil Aviation AuthorityCapacity
constrained
forecast
Future passenger and ATM demand is limited to airport capacity where no
significant additional runway or terminal capacity added
Capacity
unconstrained
forecast
Passenger and ATM demand is not limited by runway or terminal capacity
Carbon
capped
forecast
Modelling scenarios where CO2 emissions in 2050 are limited to 2005 levels through
higher carbon prices

215
Glossary
Carbon traded
forecast
Modelling scenario where CO2 emissions are part of an ETS, but not limited to any
targetCCC UK Committee on Climate ChangeCDG Paris Roissy-Charles de Gaulle Airport (IATA code)CGE Computable General Equilibrium modelling Charter airlines These airlines provide charter aircraft specifically for the holidays they sell and/or
respond to ad-hoc demand as opposed to providing a year round scheduleCIVET Grouping acronym that refers to the countries of Colombia, Indonesia, Vietnam,
Egypt, Turkey and South AfricaCO2e CO2 equivalent emissions
DECC Department for Energy and Climate ChangeDfT Department for TransportDPI Departure Planning InformationDXB Dubai International AirportEC European CommissionEEA European Economic AreaERCD The Environmental Research and Consultancy of the CAA estimates the noise
exposures around London airports (Heathrow, Gatwick and Stansted) on behalf of
the Department for TransportEU European UnionEU ETS EU Emissions Trading SystemEuropean
airports
Classified as the airports located in the European Economic Area (EEA), including for
this purpose Croatia, Switzerland and the dependent territories of EEA StatesFAS Future Airspace StrategyFDI Foreign Direct InvestmentFeeder traffic Feeder traffic comprises connections at particular airports which ‘feed’ or connect
passengers onto ongoing flights. These ongoing flights are therefore supported by
higher passenger volumes than otherwise would be the caseFifth freedoms Fifth freedoms allow an airline permitted to operate a service between that airline’s
home country and the UK, also to pick up passengers on the arrival of that service
in the UK and carry them on to a third country (and on returning from that third
country to drop off passengers whose destination is the UK before continuing on
back to its home country). An example might be a flight which originated in Dubai,
stopped at Manchester to pick up and drop off passengers and then continued to
New YorkFRA Frankfurt Airport (IATA code)Freight
forwarders
Freight forwarders provide a link between freight customers and those with air
freight capacity, typically full service scheduled airlines which provide cargo capacity
on passenger services, known as ‘belly hold’Freighters Also known as integrated air freighters
216
Airports Commission: Interim Report
Full service
carriers
The full service carrier business model is based on sustaining global route networks.
As such, full service carriers are based at one or more hub airports where their
passengers can connect between a variety of flights. Traditionally network airlines
were national carriers. Most of them are members of one of the three global airline
alliances. Full service carriers are also known as legacy carriers and network airlines
in this reportFully
independent
operations
Fully independent operations occur when there is no interdependence between the
use of runways at an airport with more than one runway
GDP Gross Domestic Product (National Income)General
aviation
General aviation (GA) can be defined as a civil aircraft operation that is not a
commercial air transport flight operating to a schedule. General aviation flights range
from gliders and powered parachutes to corporate jet flightsGHG Greenhouse gas emissionsGIP Global Infrastructure PartnersGrandfather
rights
Grandfather rights refer to the rights of an airline to retain a series of airport slots on
the basis of historic precedence. This historic precedence is determined if the slots
have been operated at least 80% of the time during the period allocated in the
previous equivalent season. Historic slots may not be withdrawn from an airline to
accommodate new entrants or any other category of aircraft operator. Confiscation
of slots for any reason other than proven intentional slot misuse is not permittedGTP Global Temperature-change PotentialGVA Gross Value AddedGWP Global Warming PotentialHAL Heathrow Airport LimitedHeathrow Q6 Heathrow Q6 relates to the sixth review that the CAA is undertaking of the economic
regulation of operators of airports in the UK. Q6 relates to the period 2014-2019HMRC Her Majesty’s Revenue and CustomsHolding stacks A holding stack is a fixed circling pattern in which aircraft fly whilst they wait to land.
When airports are busy, there can be a build up of aeroplanes waiting to land.
Aircraft will sometimes circle around in the stack until air traffic controllers are able to
fit them into the landing patternHS1 High Speed OneHS2 High Speed TwoHub-and-
spoke network
In hub-and-spoke networks, airlines and alliances route their traffic through one or
more key airports (‘hubs’), with feeder traffic from other airports in the network (the
‘spokes’) supplementing local origin and destination traffic at the hubsIAG International Airlines Group. IAG is the holding company of British Airways and IberiaIATA International Air Transport Association (airline trade body)ICAO International Civil Aviation OrganisationI-I International to International interliners i.e. passengers who are transferring via a UK
airport with their origin and destination outside the UKILS The Instrument Landing System (ILS) is a standard system for navigation of aircraft
upon the final approach for landing IMF International Monetary Fund

217
Glossary
INM The Integrated Noise Model (INM) is a computer model that evaluates aircraft noise
impacts in the vicinity of airports. The INM can output either noise contours for an
area or noise level at pre-selected locations. The noise output can be either
exposure-based, maximum-level-based, or time-basedIntegrated air
freighters
Integrated air freight companies are dedicated logistics companies, such as FedEx,
DHL, and UPS, that offer a complete end-to-end express delivery service and
typically control the entire logistics chain from collection to deliveryIPCC Intergovernmental Panel on Climate ChangeIROPI Imperative reasons of overriding public interestIsochrone An isochrone is a line on a map or diagram connecting places from which it takes
the same time to travel to a certain pointJFK John F Kennedy Airport – New York (IATA code)LAeq Leq is the noise measure used to describe the average sound level experienced
over a period of time resulting in a single decibel value. This approach is used
beyond aviation to measure most environmental noise exposure. Leq is most
commonly used with the A-weighted scale, expressed as LAeq. The A-weighted
sound level is the most widely used to quantify sound from all modes of transport.
When considering LAeq, it is always necessary to quote the time period over which
the LAeq applies. UK airports produce noise contours showing locations of equal
noise exposure over 16 hours (LAeq16H) in effect presenting the average sound level
experienced within certain areas around the airport between the hours of 07:00 and
23:00. Historically, UK policy has been to use 57 LAeq16H as the level of daytime
noise marking the approximate onset of significant community annoyance and this
value has influenced the production of annual contour maps at many airports.
Measurements are always in decibels (dB), though these are not stated. Thus
57dBLAeq will be written 57LAeq throughout the document
LAMP London Airspace Management ProgrammeLCC Low-Cost CarrierLCY London City Airport (IATA code)LDC Less Developed CountryLDEN LDEN is the 24-hr Leq calculated for an annual period, but with a 5 decibel
weighting for evening and a 10 decibel weighting for night to reflect people’s greater
sensitivity to noise within these periodsLegacy
carriers
The legacy carrier business model is based on sustaining global route networks.
As such, legacy carriers are based at one or more hub airports where their
passengers can connect between a variety of flights. Traditionally legacy carriers
were national carriers. Most of them are members of one of the three global airline
alliances. Legacy carriers are also known as network airlines and full service carriers
in this reportLHR Heathrow Airport (IATA code)London 2-2-2
system
A theoretical model where London is served by a two runway Heathrow, a two
runway Stansted and a two runway Gatwick London airport
system
For the purposes of this report, the London airport system refers to the following
airports: Heathrow, Gatwick, Stansted, Luton and London City

Airports Commission: Interim Report
Long-haul For the purposes of this report, ‘long-haul’ depicts a destination (or route) to or from
a country that is not listed in the group of countries as part of the group of countries
defined as ‘Western Europe’ (or ‘short-haul’) Long-term
options
Long-term options are those which involve the substantial development of a new or
existing airport site. This includes the delivery of any surface access links or other
infrastructure required to ensure that the new airport capacity can be utilisedLow-cost
carrier
Low-cost carriers apply a business model that relies on reducing operating costs to
provide passengers with relatively cheap tickets. The model has so far been very
successful on short-haul routesLTMA London Terminal Manoeuvring Area (also known as London terminal airspace in this
report). This airspace contains the arrival and departure routes for the five major civil
airports in the London area: Heathrow, Gatwick, Stansted, Luton and London City MAG Manchester Airports GroupMCT Minimum Connecting Time. The minimum time needed to transfer passengers from
one flight to anotherMedium-term
options
Medium-term options are those which do not require the provision of additional
runways or terminals, but which may need more than five years to deliver (for
example, measures requiring significant planning approvals to be obtained or
improvements in surface access infrastructure serving an existing airport)Mixed mode Mixed mode operations would allow runways to be used for scheduled arrivals or
departures at the same timeMLS The Microwave Landing System (MLS) is an all-weather precision guidance system
making aircraft landings possible at more locations and providing flexibility in
approach pathsMovement cap Movement caps at airports set a limit on the number of air transport movements
allowable on an annual basis. Heathrow Airport has a movement cap of 480,000
which was set as a condition of the Terminal Five planning consent in 2001 Mppa Million passengers per annumNAPAM The DfT’s National Air Passenger Allocation ModelNAPDM The DfT’s National Air Passenger Demand ModelNarrow bodied
jets
A narrow-body aircraft has a typical aircraft cabin width of 3 to 4 metres allowing for
between 2 and 6 passengers to sit side by side. Narrow-body aircraft are commonly
used for short-haul flights as their range will not allow transatlantic or
transcontinental flightsNATS National Air Traffic ServicesNatura 2000
network
Natura 2000 is an EU wide network of nature protection areas established under the
1992 Habitats Directive. The aim of the network is to assure the long-term survival
of Europe’s most valuable and threatened species and habitats. It is comprised of
Special Areas of Conservation (SAC) designated by Member States under the
Habitats Directive, and also incorporates Special Protection Areas (SPAs)NCEs Non-CO2 emissions
NCIS Noise Complaints and Information ServiceNet additional
capacity
Additional runway capacity over and above the level of runway capacity available
today
218

219
Glossary
Network
airlines
The network airline business model is based on sustaining global route networks. As
such, network airlines are based at one or more hub airports where their passengers
can connect between a variety of flights. Traditionally network airlines were national
carriers. Most of them are members of one of the three global airline alliances.
Network airlines are also known as legacy carriers and full service carriers in this
report NIC Newly Industrialised CountryNight noise
regime
The Government has historically set restrictions on the operation of aircraft at night
at Heathrow, Gatwick and Stansted. The restrictions are collectively known as the
‘night flying regime’ and have been based on: setting a limit on the overall number of
night flights; placing restrictions on the noisiest aircraft types; and setting noise
quotas which cap the amount of noise energy which can be emitted at night over
the course of the regime Noise
contours
Noise contours are lines on a map showing where equal levels of noise are
experienced Noise
envelopes
The concept of a ‘noise envelope’ is one which would create a balance between
aviation growth and noise reduction with the objective of incentivising airlines to
introduce quieter aircraft whilst giving local communities more certainty about the
levels of noise they may expect in the future. A noise envelope can be created
through the introduction of a movement cap, a quota count system or by setting
passenger number limitsNoise quota Noise quotas form part of the Government’s night noise regime. The noise quota
caps the amount of noise energy which can be emitted at night over the course of
the regimeNoise respite The principle of noise respite is to provide defined periods of noise relief to people
living directly under the flight pathNOx Nitrogen oxidesNPRs Noise Preferential Routes. Paths known as Noise Preferential Routes (NPRs) are
followed by aircraft departing airports in the London area. NPRs were set by the
Department for Transport (DfT) in the 1960s and were designed to avoid overflight of
built-up areas where possibleNPS National Policy StatementNSIPs Nationally Significant Infrastructure ProjectsObstacle
limitation
surfaces
This refers to the definition of airspace around airports which must be maintained
free from obstacles in order to ensure safe airport operations
OD market Origin and destination markets are characterised by passenger demand for travelling
to/from the city in which their air journey starts (the origin “O”) and the city in which it
ends (the destination “D”) Open Skies
agreement
Open Skies is an international policy concept that calls for the liberalisation of the
international aviation industry—particularly commercial aviation—in order to create a
free-market environment for the airline industry. The EU-U.S. Open Skies agreement
is one of the most significant open skies agreements concluded in recent yearsPAX Passengers

Airports Commission: Interim Report
Performance
based
navigation
The PBN concept was developed by the International Civil Aviation Organisation
(ICAO) and moves aviation away from the traditional use of aircraft navigating by
ground based beacons to a system more reliant on airborne technologies, utilising
area navigation and global navigation satellite systemsPoint-to-point
connection
A point-to-point connection means a direct connection between two destinations
Predict and
provide
approach
An approach based on forecasting future demand and then meeting that demand
no matter the cost
PSO Public Service Obligation. In order to maintain appropriate scheduled air services on
routes which are vital for the economic development of the region they serve,
European Member States may impose PSOs on these routesPwC PricewaterhouseCoopersQuota count At Heathrow, Gatwick and Stansted, aircraft operating at night are classified
according to a Quota Count (QC) classification system for landing and taking off.
The QC classification system is based on the noise emitted by aircraft type and
aircraft are given a QC value according to the noise they emit. Airports operating the
system have a fixed quota for each of the summer and winter seasons which
incentivises airlines to invest in quieter aircraftRAB Regulated Asset Base is the historic efficient investment in regulated assets by the
company, against which the company is allowed to earn a returnRamsar
designations
Ramsar sites are wetlands of international importance, designated under the
Ramsar ConventionRegional
airports
For the purposes of this report, ‘regional airports’ refers to the following airports:
Southampton, Norwich, Southend, Bristol, Cardiff, Bournemouth, Birmingham, East
Midlands, Coventry, Manchester, Newcastle, Liverpool, Leeds, Bradford, Durham
Tees Valley, Doncaster – Sheffield, Humberside, Blackpool, Glasgow, Edinburgh,
Aberdeen, Prestwick, Inverness, Belfast International and Belfast City. This is
consistent with the approach taken by the DfT aviation forecasts Reliever
airports
The ‘reliever airport’ concept would see smaller airports and airfields in the vicinity of
congested airports are designated to handle specific types of traffic, with a particular
emphasis on business and general aviation, as well as smaller aircraft flying
scheduled servicesResilience For the purposes of this report, resilience refers to the ability of an airport to be able
to anticipate, absorb or recover from unforeseen events, whether they arise from
late passengers or aircraft, or from extraneous events such as fog, low visibility,
or strong winds RPK Revenue Passenger KilometreRunway
alternation
In this report, runway alternation refers to the practice at Heathrow airport whereby
the designated landing runway is changed at 15:00 (so that the designated
departure runway becomes the landing one) when the airport is operating during
westerly operations providing predictable periods of relief from the noise of landing
aircraft for communities under the final approach tracks to the east of the airportSabre Sabre Airline Solutions – travel transaction processing companySAS Scandinavian Airlines
220
221
Glossary
Scheduled
monuments
‘Scheduling’ is shorthand for the process through which nationally important sites
and monuments are given legal protection by being placed on a list, or ‘schedule’.
English Heritage takes the lead in identifying sites in England which should be
placed on the schedule by the Secretary of State for Culture, Media and SportSEA Strategic Environmental Assessment. The SEA identifies the significant
environmental effects that are likely to result from the implementation of the plan or
alternative approaches to the planSegregated
mode
Under this model of airport operations, one runway is used for arrivals and the other
for departures. Heathrow airport operates under segregated modeSelf
connecting
Customers may decide to ‘self connect’ from one flight to another in the absence of
airlines facilitating such connections SERAS South East of England Regional Air Services StudySES Single European SkyShadow cost The extra cost of flying required to reduce passenger demand from above an
airport’s runway or terminal capacity, to a level that is back within capacityShort-term
options
Short-term options are those which could be delivered without the provision of
additional runways or terminals, within 5 years of the publication of our interim report
in December 2013Short- Haul For the purposes of this report, ‘short- haul’ has been defined in the same way as
‘Western Europe’ and comprises the following group of countries: Andorra; Austria;
Belgium; Bosnia Herzegovina; Cape Verde; Croatia; Cyprus; Czech Republic;
Denmark; Estonia; Faroe Islands; Finland; France; Germany; Gibraltar; Greece;
Greenland; Hungary; Iceland; Ireland; Italy; Latvia; Lithuania; Luxembourg;
Macedonia; Malta; Republic of Moldova; Monaco; Montenegro; Netherlands;
Norway; Poland; Portugal; San Marino; Serbia; Slovakia; Slovenia; Spain; Sweden;
Switzerland; Turkey; United Kingdom. This is consistent with the DfT’s definition of
‘Western Europe’ as used in their aviation demand modellingSIDs Standard Instrument Departure routes – the planned departure routes within the
noise preferential routesSlots Airport slots are rights allocated to allow airlines and other aircraft operators to
schedule a landing or departure at an airport during a specific time period. Slots are
allocated at ‘Level 3 – Coordinated Airports’ which are defined as those where
demand for airport infrastructure significantly exceed the airport’s capacitySPA A Special Protection Area (SPA) is an area of land, water or sea which has been
identified as being of international importance for the breeding, feeding, wintering or
the migration of rare and vulnerable species of birds found within the European
UnionSpecial Area of
Conservation
Special Areas of Conservation (SACs) are strictly protected sites designated under
the EC Habitats DirectiveSSSI Sites of Special Scientific InterestTDRs Traffic Distribution RulesTEAM Tactically Enhanced Arrival Management. This is a practice seen at Heathrow where
both runways are used to land aircraft when a set of trigger points have been
reached, namely related to the level of delay experienced on arrival

Airports Commission: Interim Report
Theoretical
maximum
capacity
The maximum number of ATMs that can be scheduled safely
Thick routes Thick routes are routes which are served, often by multiple airlines, at high
frequencies. Examples of such thick routes are from London to New York, Hong
Kong or Tokyo. These markets are served with direct connections both by the
members of the airline alliances and by airlines specialising in targeting such
premium markets (e.g. Virgin Atlantic)Transfer traffic Passengers connecting between their origin airport and destination airport through
an intermediate airportUS United StatesVectoring Aircraft departing from airports are required to follow specific paths called Noise
Preferential Routes (NPRs) up to an altitude of 4,000ft, unless directed otherwise by
air traffic control. Vectoring is the practice whereby air traffic control turn aircraft off
the NPR route once the aircraft has reached 4,000ft at any point along the NPR, or
below 4,000 for safety reasonsVFR Visiting friends and relativesWebTAG Department for Transport Appraisal GuidanceWesterly
operations
When aircraft arriving at Heathrow make their final approach over London. The
direction in which the airport operates is dictated by the wind direction and the
westerly preference policyWesterly
preference
Heathrow airport operates a ‘westerly preference’ which means that when there is a
westerly wind arriving aircraft make their final approach over London and departing
aircraft depart over west London. During periods of light easterly winds (up to 5kts),
aircraft will often continue to land in a westerly direction making their final approach
over London. The westerly preference was introduced in the 1960s to reduce
numbers of aircraft taking off in an easterly direction over London, i.e. over the most
heavily populated side of the airportWestern
Europe
For the purposes of this report, ‘Western Europe’ has been defined in the same way
as ‘short-haul’ and comprises the following group of countries: Andorra; Austria;
Belgium; Bosnia Herzegovina; Cape Verde; Croatia; Cyprus; Czech Republic;
Denmark; Estonia; Faroe Islands; Finland; France; Germany; Gibraltar; Greece;
Greenland; Hungary; Iceland; Ireland; Italy; Latvia; Lithuania; Luxembourg;
Macedonia; Malta; Republic of Moldova; Monaco; Montenegro; Netherlands;
Norway; Poland; Portugal; San Marino; Serbia; Slovakia; Slovenia; Spain; Sweden;
Switzerland; Turkey; United Kingdom. This is consistent with the DfT’s definition of
‘Western Europe’ as used in their aviation demand modellingWide bodied
jets
A wide-body aircraft has a typical aircraft cabin width of 5-6 metres allowing for
between 7 and 10 passengers to sit side by side. The total capacity of a wide body
aircraft can be between 200 to 850 passengers.
222
223
List of figures and tables
Executive summary
Figure 1: UK has more seats available and serves more destinations on a daily basis
than any other European country
Figure 2: By 2030, Heathrow, Gatwick, London City and Luton are all predicted to
be full
Chapter 2
Figure 2.1: Liberalisation has resulted in the largest carriers capturing an increasing
share of the market
Figure 2.2: The three major alliances hold over half of global seat capacity
Figure 2.3: Dubai is geographically well-placed to serve emerging markets in Asia and
Africa
Figure 2.4: Different international hubs are better placed to compete in different
markets due to their location
Figure 2.5: Aircraft fuel efficiency has been steadily improving
Figure 2.6: The introduction of new aircraft is reducing aviation noise footprints
Figure 2.7: The strongest growth in passenger demand has been in the Asia-Pacific
region
Figure 2.8: International air freight and passenger flows are correlated
Chapter 3
Figure 3.1: Historically passenger demand for aviation has risen in line with or faster
than GDP since 1960
Figure 3.2: The UK air travel market is highly concentrated at the country’s four
largest airports
Figure 3.3: London has the highest propensity to fly across all the UK’s regions
Figure 3.4: London still retains the biggest OD market in the world
Figure 3.5: London airports play a crucial role in providing long-haul connectivity

Airports Commission: Interim Report
Figure 3.6: At Heathrow passenger numbers and service frequencies have increased
but the numbers of overall destinations served have remained roughly constant
Figure 3.7: The number of people living within Heathrow’s 57LAeq contour has fallen
significantly despite higher numbers of air traffic movements
Figure 3.8 The most significant growth in demand over recent years has been seen in
the low-cost sector
Figure 3.9: The last decade has seen a significant increase in capacity from UK
regional airports to destinations outside Europe
Figure 3.10: Increasing numbers of passengers from UK regional airports are
connecting through hubs other than Heathrow
Figure 3.11: Heathrow and Gatwick have the highest runway utilisation in the world
Figure 3.12: UK has more seats available on a daily basis than any other European
country
Figure 3.13: UK serves more destinations on a daily basis than any other European
country
Figure 3.14: In 2012 Heathrow had a high average delay per departure and arrival
compared to other European hubs
Figure 3.15: Dubai International has seen a dramatic increase in long-haul
destinations served since 2003
Figure 3.16: Heathrow offers fewer total destinations in BRIC countries but more
destinations with at least a daily service than other European hub airports
Figure 3.17(a) and (b): Heathrow’s high levels of connectivity are driven particularly by
its strong links to North America
Figure 3.18: London’s total connectivity to destinations other than North America and
Europe is less than other hubs
Figure 3.19: The number of UK destinations served from Heathrow has steadily
decreased since 1990
Figure 3.20: As the effects of changes in airport capacity are transmitted through the
wider economy, the overall impact becomes dispersed through other sectors and
more difficult to measure
224

225
List of figures
Figure 3.21: CGE modelling captures the interactions between households, firms and
the Government
Chapter 4
Figure 4.1: The Commission’s framework for considering the scale and timing of any
need for additional airport capacity
Figure 4.2: The Commission’s forecasts show unconstrained demand would grow
significantly up to 2050
Figure 4.3: The Commission’s forecasts have a narrower range than DfT’s January
2013 forecasts
Figure 4.4: Without additional capacity, major London and South East airports will be
full by the 2040s, even with a carbon cap in place
Figure 4.5: There is a small reduction in domestic demand as a result of HS2,
particularly from 2033 when phase 2 opens
Figure 4.6: Luton, Birmingham and Stansted see the largest increase in ATMs and
Gatwick sees the biggest fall
Figure 4.7: Even in scenario D, all London airports except for Stansted are full by
2040
Chapter 5
Figure 5.1: London airspace is highly complex and congested
Figure 5.2: Early morning smoothing would be expected to reduce average delays
per flight
Figure 5.3: Early morning smoothing would be expected to reduce average delays
per flight
Chapter 6
Figure 6.1: The Estuary has many areas of protected habitat & flood risk
Figure 6.2: London air space is complex with many interactions between the traffic
streams for the various airports
Figure 6.3: Gatwick Airport: one new runway to the south
Figure 6.4: Environmental impacts of a new runway at Gatwick
Figure 6.5: Site 2 Option (a) one new runway to the northwest

Airports Commission: Interim Report
Figure 6.6: Site 2 Option (b) Extending the northern runway to the west
Figure 6.7: Environmental impacts of Option (a) – one new runway to the northwest
Figure 6.8: Environmental impacts of Option (b) – Extending the northern runway to
the west
Chapter 7
Figure 7.1: Commission’s proposed timings for the next phase of its work on the
short-listed options
Tables
Table 4.1: By 2020 there would be a small reduction in the number of destinations
offered
Table 4.2: By 2020 there would be a small increase in short-haul seat capacity, which
is more than offset by the reduction in long-haul seat capacity
Table 4.3: The Mayor’s analysis of different capacity expansion options point to a
four-runway hub solution
Table 4.4: Gatwick’s analysis suggests an additional runway at Gatwick would add
less traffic than an additional runway at Heathrow, but would further enhance the
benefits of airport competition
Table 4.5: To forecast the future connectivity of various airport models the Mayor of
London and Gatwick Airport made different assumptions on airline economies
Table 4.6: Commission’s forecasts of destinations served, passenger numbers and
ATMs in the two London airport system scenarios are broadly similar
Table 4.7: Four scenarios have been used to inform sensitivity tests around the
baseline forecasts
Table 6.1: New runways may have impacts on system capacity
226

Contact information
Website: www.gov.uk/government/organisations/airports-commission
Email: [email protected]