airsense: an intelligent home-based sensing system …fangbiyi/papers/2016_ubicomp_airsense.pdf ·...
TRANSCRIPT
AirSense: An Intelligent Home-based Sensing System forIndoor Air Quality AnalyticsBiyi Fang‡, Qiumin Xu†, Taiwoo Park‡, Mi Zhang‡
‡Michigan State University, †University of Southern California
ABSTRACTIn the U.S., people spend approximately 90 percent of theirtime indoors. Unfortunately, indoor air quality (IAQ) maybe two to five times worse than the air outdoors, and is of-ten overlooked. Existing IAQ monitoring technologies focuson IAQ measurements and visualization. However, the lackof information about the pollution sources as well as the se-riousness of the pollution makes people feel powerless andfrustrated, resulting in the ignorance of the polluted air attheir homes. In this work, we fill this critical gap by present-ing AirSense, an intelligent home-based IAQ sensing systemthat is able to automatically detect pollution events, identifypollution sources, estimate personal exposure to indoor airpollution, and provide actionable suggestions to help peopleimprove IAQ. We have deployed AirSense at five homes toevaluate its performance and investigate how users interactwith it. We demonstrate that AirSense can accurately de-tect pollution events, identify pollution sources, and forecastIAQ information within five minutes in both controlled andreal-world settings. We further show the great potential ofAirSense in increasing users’ awareness of IAQ and helpingthem better manage IAQ at their homes.
ACM Classification KeywordsC.3 Special-Purpose and Application-Based Systems: Real-time and embedded systems
Author Keywordsindoor air quality; IAQ; smart home; Internet of Things; IoT;human factors; behavior change technology.
INTRODUCTIONIndoor air quality (IAQ) plays a significant role in our dailylives. In the United States, people spend approximately 90percent of their time indoors, consuming about 3400 gallonsof air on average every day [24]. Unfortunately, accordingto Environmental Protection Agency (EPA), indoor air pollu-tion may be two to five times – and on occasion more than 100times – worse than the air outdoors. Poor IAQ could pose sig-nificant risks to people’s health and is the leading cause of res-piratory infections, chronic lung diseases, and cancers [17].
Permission to make digital or hard copies of all or part of this work for personal orclassroom use is granted without fee provided that copies are not made or distributedfor profit or commercial advantage and that copies bear this notice and the full cita-tion on the first page. Copyrights for components of this work owned by others thanACM must be honored. Abstracting with credit is permitted. To copy otherwise, or re-publish, to post on servers or to redistribute to lists, requires prior specific permissionand/or a fee. Request permissions from [email protected].
UbiComp ’16, September 12-16, 2016, Heidelberg, Germany
c© 2016 ACM. ISBN 978-1-4503-4461-6/16/09. . . $15.00
DOI: http://dx.doi.org/10.1145/2971648.2971720
A majority of indoor air pollution is caused by people’s dailyhousehold activities. For example, oil-based cooking couldgenerate remarkable amounts of harmful airborne particulatematter (PM) with a diameter of 2.5 micrometers or less (PM2.5) [15]. Tobacco smoking produces more than 4000 typesof chemicals (with many of them identified as carcinogens)in the form of PM 2.5 and gases including volatile organiccompounds (VOCs) [6, 12]. Many household products forcleaning and maintenance such as disinfectants and pesticidescontain and release PM 2.5 and numerous VOCs more or lessthat lead to long-term health concerns such as child develop-mental and hormonal issues [9, 13].
Although we are potentially exposed to such a variety ofair pollution at home, IAQ is often overlooked for two rea-sons. First, although some of the indoor air pollutants likeformaldehyde have irritating odor, the majority of them is col-orless, odorless, or too tiny to be seen. This makes indoor airpollutants almost impossible to be detected by human beings.Second, many adverse health conditions caused by indoor airpollution such as cancer have no severe symptoms until yearsafter long period of exposure [23]. For immediate adversehealth effects, some of them such as coughs and headachesare very similar to symptoms of colds or other viral diseases.Therefore, it is very difficult to determine whether the symp-toms are results of exposure to indoor air pollutants.
Due to its critical role in health and wellbeing, IAQ has at-tracted considerable attentions in the ubiquitous computingcommunity in recent years. Pioneer work focused on devel-oping IAQ monitoring systems for measuring and visualizingindoor air pollution levels [8, 16, 18, 26]. Although thesesystems could increase users’ awareness of IAQ, the lack ofinformation about the pollution sources, the seriousness ofthe pollution, and the actionable suggestions to help usersreduce the pollution makes people feel powerless and frus-trated, leading to the ignorance of the indoor air pollutionlevels provided by the IAQ monitoring systems.
In this work, we bridge this critical gap by developingAirSense, an intelligent home-based IAQ monitoring and ana-lytics system that is capable of automatically detecting indoorair pollution events, identifying pollution sources, forecastingpollution levels to estimate the seriousness of the pollution,and providing actionable suggestions to help people improveIAQ in a timely manner. Specifically, AirSense is developedupon commercial off-the-shelf air quality sensors that con-tinuously monitor the ambient temperature and humidity aswell as the concentrations of PM 2.5 and VOCs, which aretwo of the most common air pollutants in the indoor environ-ment [23]. To detect the occurrence of air pollution event,
(a) (b) (c)
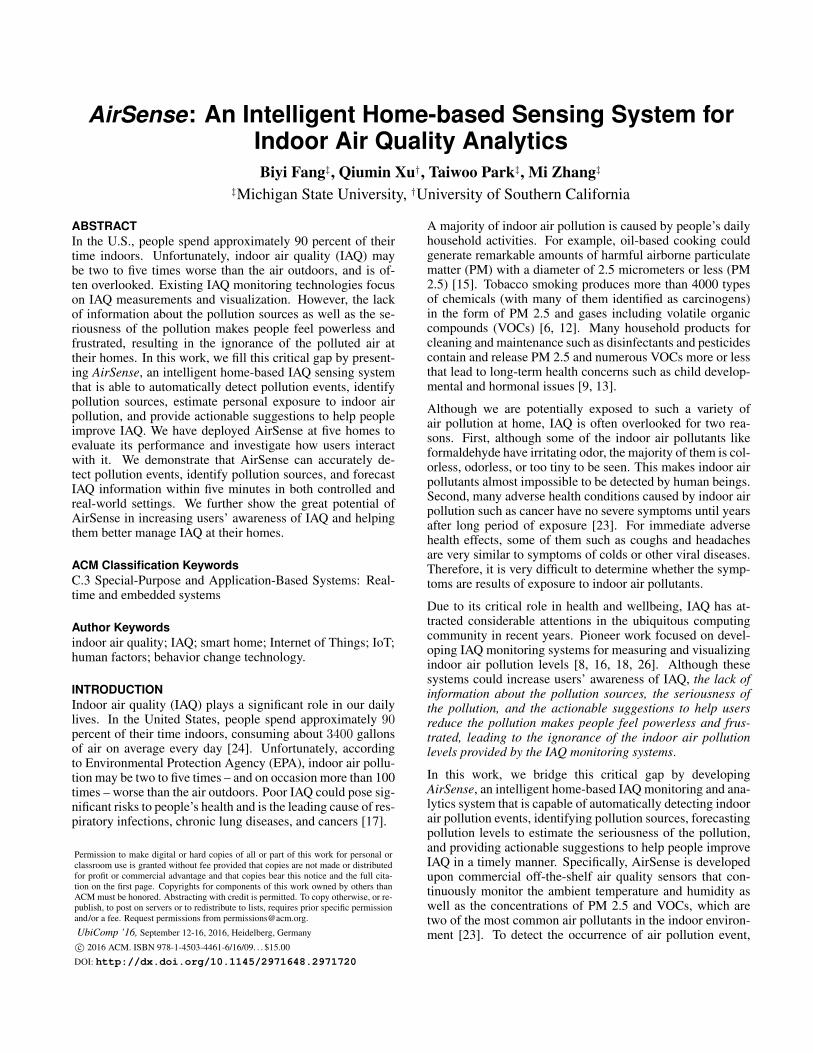
Figure 1: The (a) PM 2.5, (b) humidity, and (c) VOCs sensor measurements of indoor air pollution generated by cooking, smoking, and spraying pesticide.
AirSense uses a normalized standard deviation based schemeto detect the sharp increase of the pollution level at the be-ginning of air pollution event in real-time. To identify thesource of the pollution event, AirSense extracts a set of fea-tures from sensor data that are able to discriminate differentpollution sources. Based on the identified pollution source,AirSense uses a non-parametric regression scheme to predictthe pollution levels in the near future to estimate the serious-ness of the pollution. Finally, AirSense provides suggestionstailored to the identified pollution source to guide people totaking appropriate actions to minimize their exposure to in-door air pollution. It also provides a detailed weekly IAQprofiling report that helps people better understand how theirhousehold activities impact IAQ and pinpoint household ac-tivities that pollute their indoor air the most.
Summary of Experimental Results: We focus on three ofthe most common household activities that generate signifi-cant indoor air pollution – cooking, smoking, and sprayingpesticide – to examine the feasibility of AirSense. We haveevaluated the performance of AirSense by conducting experi-ments at two homes for ten weeks for controlled evaluation aswell as at three homes for nine weeks for uncontrolled real-world deployment. The results of our experiments show that:
• In controlled settings, AirSense can accurately detect thepollution events and identify cooking, smoking, sprayingpesticide and their combinations as pollution sources withan average accuracy of 95.8%. It can forecast pollutionlevels with an average error of less than or equal to 8.1%within five minutes after occurrences of pollution events.• Through controlled experiments, we have also demon-
strated that AirSense is robust to different deployment lo-cations as well as diverse pollution source subcategories.• When deployed in the real world, AirSense shows the great
potential in increasing users’ awareness of IAQ and helpingthem better manage IAQ at their homes.
Summary of Contributions: We introduce AirSense as thefirst IAQ monitoring and analytics system that is able to iden-tify pollution sources, estimate the seriousness of pollution,and provide early warnings to users and assist them to reduceindoor air pollution. Equipped with both monitoring and ana-lytics capabilities, AirSense would be very helpful for peoplewho are sensitive to air quality. Although currently designedfor home uses, AirSense can be extended and find its appli-cations in public buildings such as office rooms, shoppingmalls and subway stations. Therefore, we believe AirSensehas tremendous potential to be widely adopted in real world.
MOTIVATING OBSERVATIONSFigure 1 illustrates the PM 2.5, humidity and VOCs sensormeasurements of indoor air pollution generated by cooking,smoking and spraying pesticide. The design of AirSense ismotivated by two key observations from Figure 1. First, thesethree household activities all cause changes in PM 2.5, hu-midity, and VOCs levels. This motivates us to use PM 2.5,humidity, and VOCs sensors to detect indoor air pollutioncaused by them. For example, it is known from the litera-ture that cooking, smoking and spraying pesticide all gener-ate PM 2.5 [15, 12, 9]. As shown in Figure 1(a), there is asharp increase in PM 2.5 measurements at the beginning ofthese three household activities. This indicates that PM 2.5sensor could be helpful in detecting them. Second, there areunique patterns embedded in the sensor measurements whichcan be leveraged to differentiate these three household activ-ities. This motivates us to develop pattern recognition andclassification algorithms to recognize these household activi-ties as pollution sources from sensor measurements. For ex-ample, in Figure 1(b), the humidity level changes only 1% forsmoking while it increases about 7% for cooking. As anotherexample, in Figure 1(a), the decreasing rate after the peakvalue of cooking is slower than the ones of both smoking andspraying pesticide. We can extract features to capture thesepatterns to help identify pollution sources.
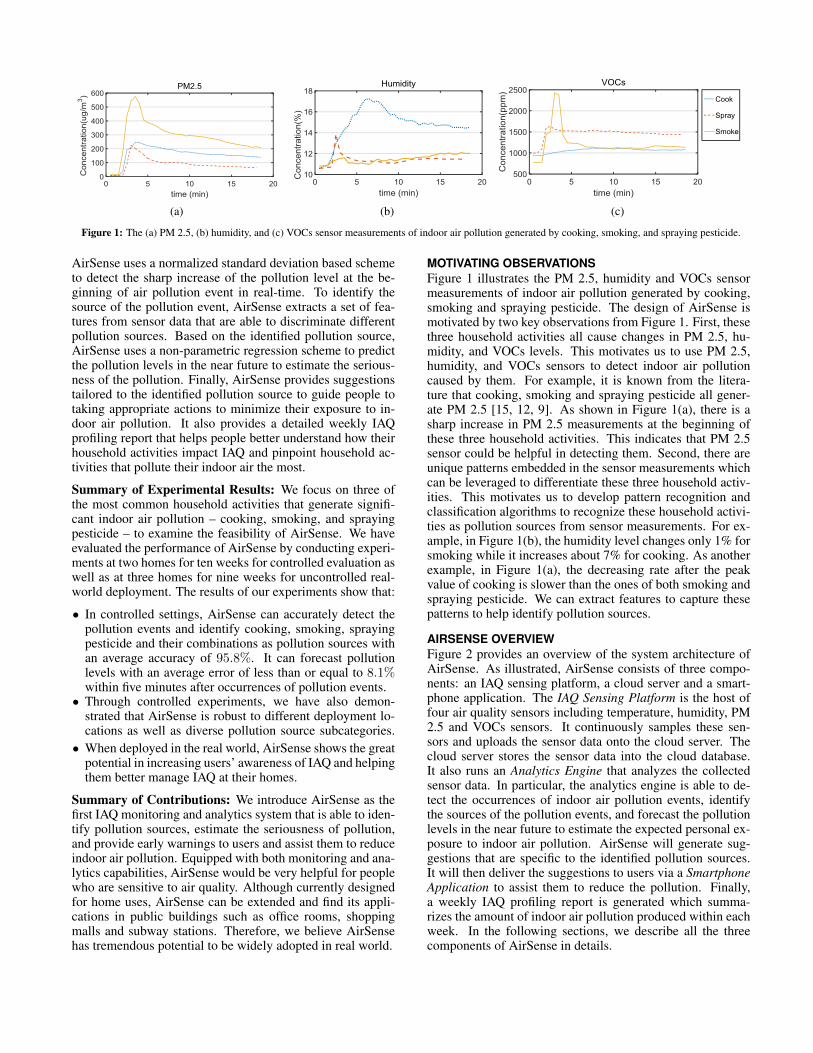
AIRSENSE OVERVIEWFigure 2 provides an overview of the system architecture ofAirSense. As illustrated, AirSense consists of three compo-nents: an IAQ sensing platform, a cloud server and a smart-phone application. The IAQ Sensing Platform is the host offour air quality sensors including temperature, humidity, PM2.5 and VOCs sensors. It continuously samples these sen-sors and uploads the sensor data onto the cloud server. Thecloud server stores the sensor data into the cloud database.It also runs an Analytics Engine that analyzes the collectedsensor data. In particular, the analytics engine is able to de-tect the occurrences of indoor air pollution events, identifythe sources of the pollution events, and forecast the pollutionlevels in the near future to estimate the expected personal ex-posure to indoor air pollution. AirSense will generate sug-gestions that are specific to the identified pollution sources.It will then deliver the suggestions to users via a SmartphoneApplication to assist them to reduce the pollution. Finally,a weekly IAQ profiling report is generated which summa-rizes the amount of indoor air pollution produced within eachweek. In the following sections, we describe all the threecomponents of AirSense in details.
IAQ Sensing Platform
Cloud Server
Visualization
Smartphone Application
Storage
Suggestions Weekly IAQ
ProfilingReport
SENSORS
TEMP
VOCs
HUMIDITY
PM 2.5
+Analysis
+ +
Figure 2: The overview of the system architecture of AirSense.
Temp Humidity
VOCs
3D Printed Case
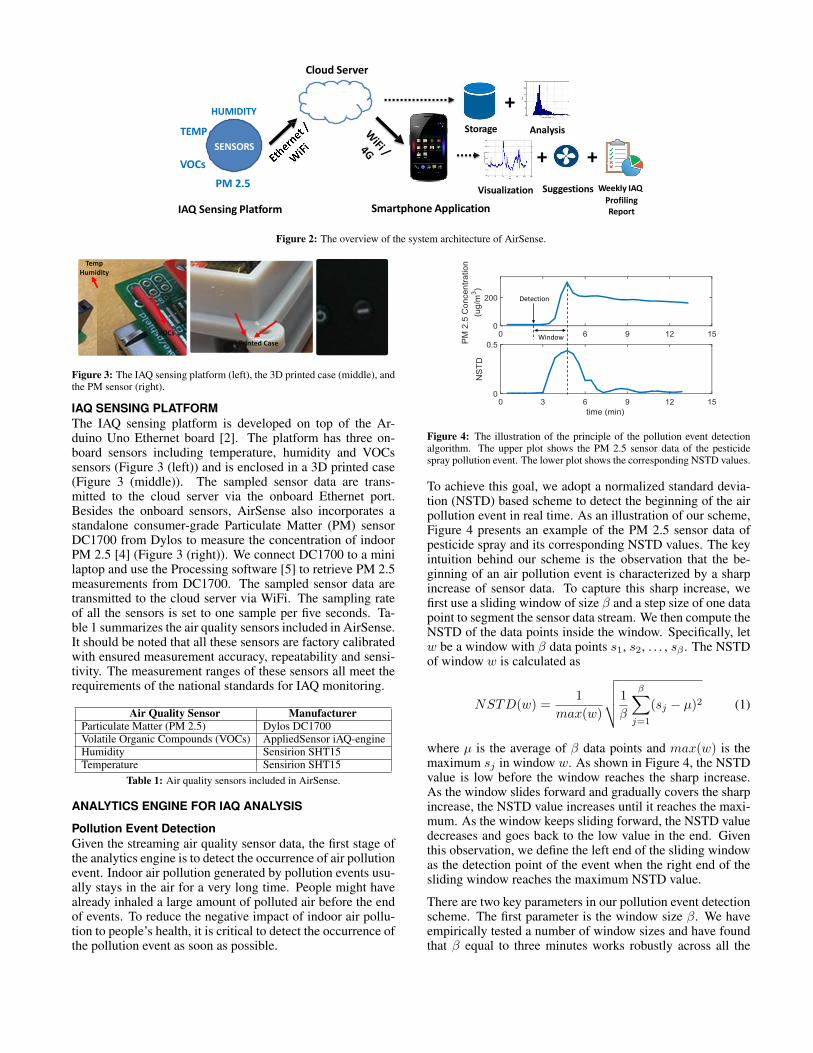
Figure 3: The IAQ sensing platform (left), the 3D printed case (middle), andthe PM sensor (right).
IAQ SENSING PLATFORMThe IAQ sensing platform is developed on top of the Ar-duino Uno Ethernet board [2]. The platform has three on-board sensors including temperature, humidity and VOCssensors (Figure 3 (left)) and is enclosed in a 3D printed case(Figure 3 (middle)). The sampled sensor data are trans-mitted to the cloud server via the onboard Ethernet port.Besides the onboard sensors, AirSense also incorporates astandalone consumer-grade Particulate Matter (PM) sensorDC1700 from Dylos to measure the concentration of indoorPM 2.5 [4] (Figure 3 (right)). We connect DC1700 to a minilaptop and use the Processing software [5] to retrieve PM 2.5measurements from DC1700. The sampled sensor data aretransmitted to the cloud server via WiFi. The sampling rateof all the sensors is set to one sample per five seconds. Ta-ble 1 summarizes the air quality sensors included in AirSense.It should be noted that all these sensors are factory calibratedwith ensured measurement accuracy, repeatability and sensi-tivity. The measurement ranges of these sensors all meet therequirements of the national standards for IAQ monitoring.
Air Quality Sensor ManufacturerParticulate Matter (PM 2.5) Dylos DC1700Volatile Organic Compounds (VOCs) AppliedSensor iAQ-engineHumidity Sensirion SHT15Temperature Sensirion SHT15
Table 1: Air quality sensors included in AirSense.
ANALYTICS ENGINE FOR IAQ ANALYSIS
Pollution Event DetectionGiven the streaming air quality sensor data, the first stage ofthe analytics engine is to detect the occurrence of air pollutionevent. Indoor air pollution generated by pollution events usu-ally stays in the air for a very long time. People might havealready inhaled a large amount of polluted air before the endof events. To reduce the negative impact of indoor air pollu-tion to people’s health, it is critical to detect the occurrence ofthe pollution event as soon as possible.
Detection
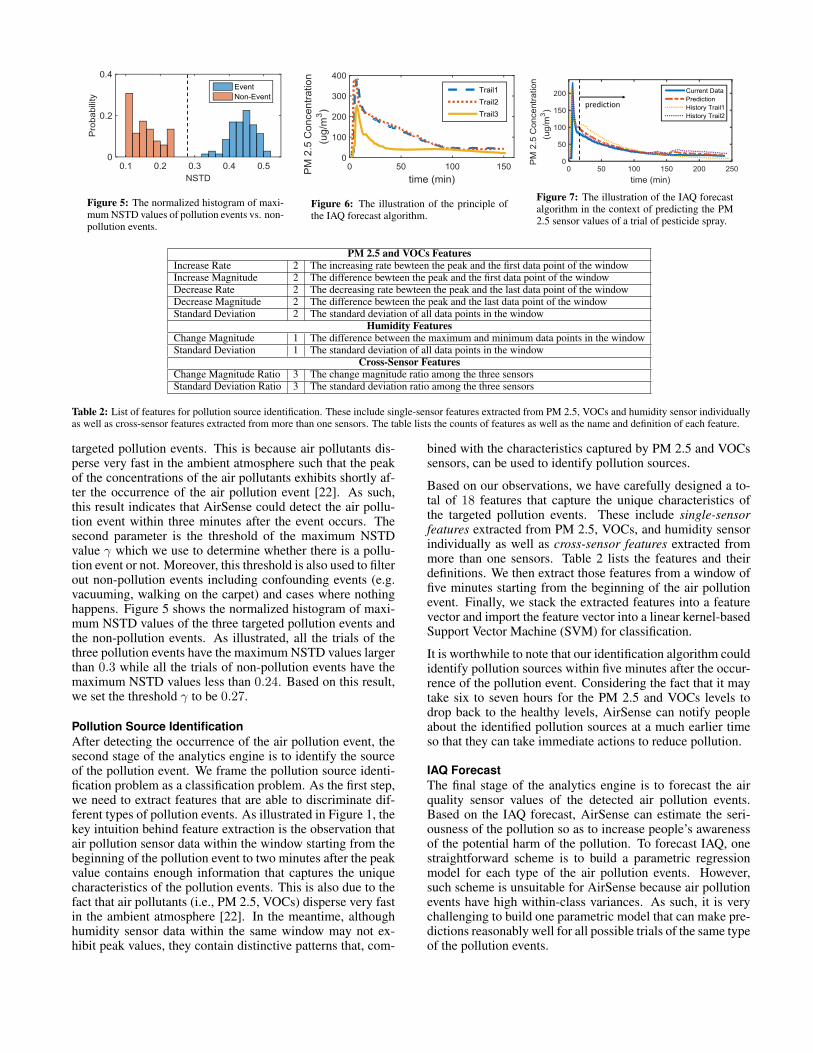
Window
Figure 4: The illustration of the principle of the pollution event detectionalgorithm. The upper plot shows the PM 2.5 sensor data of the pesticidespray pollution event. The lower plot shows the corresponding NSTD values.
To achieve this goal, we adopt a normalized standard devia-tion (NSTD) based scheme to detect the beginning of the airpollution event in real time. As an illustration of our scheme,Figure 4 presents an example of the PM 2.5 sensor data ofpesticide spray and its corresponding NSTD values. The keyintuition behind our scheme is the observation that the be-ginning of an air pollution event is characterized by a sharpincrease of sensor data. To capture this sharp increase, wefirst use a sliding window of size β and a step size of one datapoint to segment the sensor data stream. We then compute theNSTD of the data points inside the window. Specifically, letw be a window with β data points s1, s2, . . . , sβ . The NSTDof window w is calculated as
NSTD(w) =1
max(w)
√√√√ 1
β
β∑j=1
(sj − µ)2 (1)
where µ is the average of β data points and max(w) is themaximum sj in window w. As shown in Figure 4, the NSTDvalue is low before the window reaches the sharp increase.As the window slides forward and gradually covers the sharpincrease, the NSTD value increases until it reaches the maxi-mum. As the window keeps sliding forward, the NSTD valuedecreases and goes back to the low value in the end. Giventhis observation, we define the left end of the sliding windowas the detection point of the event when the right end of thesliding window reaches the maximum NSTD value.
There are two key parameters in our pollution event detectionscheme. The first parameter is the window size β. We haveempirically tested a number of window sizes and have foundthat β equal to three minutes works robustly across all the
prediction
Figure 5: The normalized histogram of maxi-mum NSTD values of pollution events vs. non-pollution events.
prediction
Figure 6: The illustration of the principle ofthe IAQ forecast algorithm.
prediction
Figure 7: The illustration of the IAQ forecastalgorithm in the context of predicting the PM2.5 sensor values of a trial of pesticide spray.
PM 2.5 and VOCs FeaturesIncrease Rate 2 The increasing rate bewteen the peak and the first data point of the windowIncrease Magnitude 2 The difference bewteen the peak and the first data point of the windowDecrease Rate 2 The decreasing rate bewteen the peak and the last data point of the windowDecrease Magnitude 2 The difference bewteen the peak and the last data point of the windowStandard Deviation 2 The standard deviation of all data points in the window
Humidity FeaturesChange Magnitude 1 The difference between the maximum and minimum data points in the windowStandard Deviation 1 The standard deviation of all data points in the window
Cross-Sensor FeaturesChange Magnitude Ratio 3 The change magnitude ratio among the three sensorsStandard Deviation Ratio 3 The standard deviation ratio among the three sensors
Table 2: List of features for pollution source identification. These include single-sensor features extracted from PM 2.5, VOCs and humidity sensor individuallyas well as cross-sensor features extracted from more than one sensors. The table lists the counts of features as well as the name and definition of each feature.
targeted pollution events. This is because air pollutants dis-perse very fast in the ambient atmosphere such that the peakof the concentrations of the air pollutants exhibits shortly af-ter the occurrence of the air pollution event [22]. As such,this result indicates that AirSense could detect the air pollu-tion event within three minutes after the event occurs. Thesecond parameter is the threshold of the maximum NSTDvalue γ which we use to determine whether there is a pollu-tion event or not. Moreover, this threshold is also used to filterout non-pollution events including confounding events (e.g.vacuuming, walking on the carpet) and cases where nothinghappens. Figure 5 shows the normalized histogram of maxi-mum NSTD values of the three targeted pollution events andthe non-pollution events. As illustrated, all the trials of thethree pollution events have the maximum NSTD values largerthan 0.3 while all the trials of non-pollution events have themaximum NSTD values less than 0.24. Based on this result,we set the threshold γ to be 0.27.
Pollution Source IdentificationAfter detecting the occurrence of the air pollution event, thesecond stage of the analytics engine is to identify the sourceof the pollution event. We frame the pollution source identi-fication problem as a classification problem. As the first step,we need to extract features that are able to discriminate dif-ferent types of pollution events. As illustrated in Figure 1, thekey intuition behind feature extraction is the observation thatair pollution sensor data within the window starting from thebeginning of the pollution event to two minutes after the peakvalue contains enough information that captures the uniquecharacteristics of the pollution events. This is also due to thefact that air pollutants (i.e., PM 2.5, VOCs) disperse very fastin the ambient atmosphere [22]. In the meantime, althoughhumidity sensor data within the same window may not ex-hibit peak values, they contain distinctive patterns that, com-
bined with the characteristics captured by PM 2.5 and VOCssensors, can be used to identify pollution sources.
Based on our observations, we have carefully designed a to-tal of 18 features that capture the unique characteristics ofthe targeted pollution events. These include single-sensorfeatures extracted from PM 2.5, VOCs, and humidity sensorindividually as well as cross-sensor features extracted frommore than one sensors. Table 2 lists the features and theirdefinitions. We then extract those features from a window offive minutes starting from the beginning of the air pollutionevent. Finally, we stack the extracted features into a featurevector and import the feature vector into a linear kernel-basedSupport Vector Machine (SVM) for classification.
It is worthwhile to note that our identification algorithm couldidentify pollution sources within five minutes after the occur-rence of the pollution event. Considering the fact that it maytake six to seven hours for the PM 2.5 and VOCs levels todrop back to the healthy levels, AirSense can notify peopleabout the identified pollution sources at a much earlier timeso that they can take immediate actions to reduce pollution.
IAQ ForecastThe final stage of the analytics engine is to forecast the airquality sensor values of the detected air pollution events.Based on the IAQ forecast, AirSense can estimate the seri-ousness of the pollution so as to increase people’s awarenessof the potential harm of the pollution. To forecast IAQ, onestraightforward scheme is to build a parametric regressionmodel for each type of the air pollution events. However,such scheme is unsuitable for AirSense because air pollutionevents have high within-class variances. As such, it is verychallenging to build one parametric model that can make pre-dictions reasonably well for all possible trials of the same typeof the pollution events.
(a) (b) (c) (d)
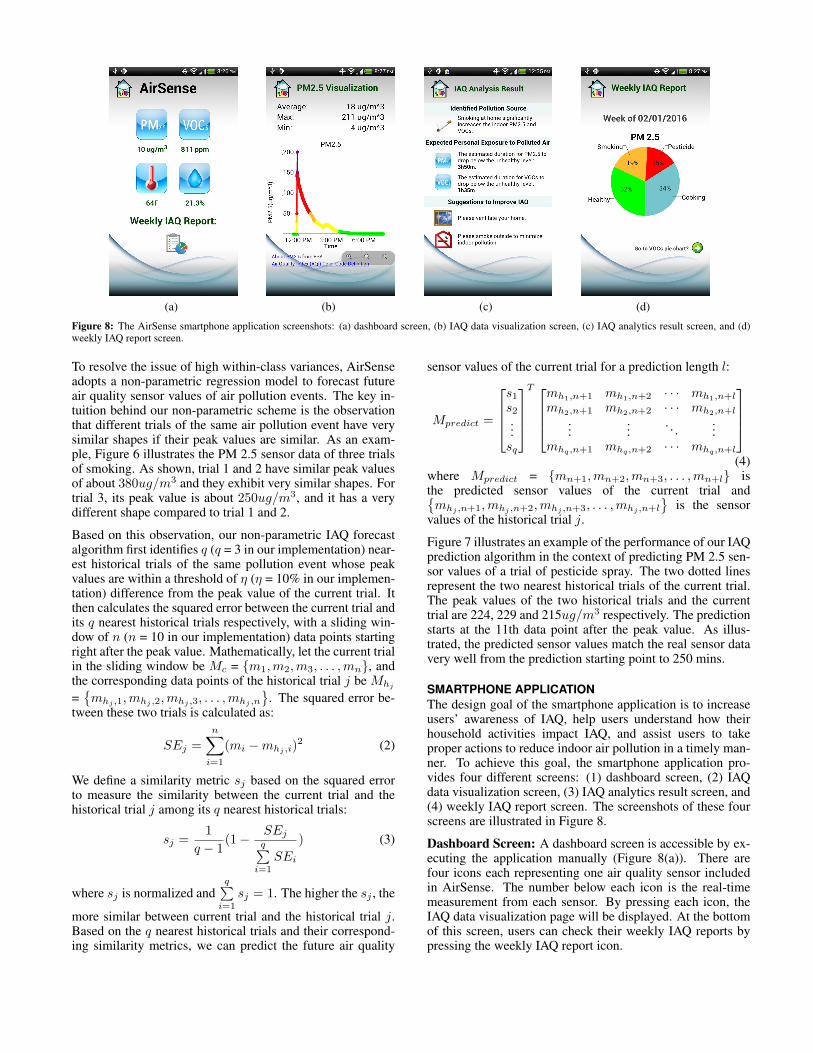
Figure 8: The AirSense smartphone application screenshots: (a) dashboard screen, (b) IAQ data visualization screen, (c) IAQ analytics result screen, and (d)weekly IAQ report screen.
To resolve the issue of high within-class variances, AirSenseadopts a non-parametric regression model to forecast futureair quality sensor values of air pollution events. The key in-tuition behind our non-parametric scheme is the observationthat different trials of the same air pollution event have verysimilar shapes if their peak values are similar. As an exam-ple, Figure 6 illustrates the PM 2.5 sensor data of three trialsof smoking. As shown, trial 1 and 2 have similar peak valuesof about 380ug/m3 and they exhibit very similar shapes. Fortrial 3, its peak value is about 250ug/m3, and it has a verydifferent shape compared to trial 1 and 2.
Based on this observation, our non-parametric IAQ forecastalgorithm first identifies q (q = 3 in our implementation) near-est historical trials of the same pollution event whose peakvalues are within a threshold of η (η = 10% in our implemen-tation) difference from the peak value of the current trial. Itthen calculates the squared error between the current trial andits q nearest historical trials respectively, with a sliding win-dow of n (n = 10 in our implementation) data points startingright after the peak value. Mathematically, let the current trialin the sliding window be Mc = {m1,m2,m3, . . . ,mn}, andthe corresponding data points of the historical trial j be Mhj
={mhj ,1,mhj ,2,mhj ,3, . . . ,mhj ,n
}. The squared error be-
tween these two trials is calculated as:
SEj =
n∑i=1
(mi −mhj ,i)2 (2)
We define a similarity metric sj based on the squared errorto measure the similarity between the current trial and thehistorical trial j among its q nearest historical trials:
sj =1
q − 1(1− SEj
q∑i=1
SEi
) (3)
where sj is normalized andq∑i=1
sj = 1. The higher the sj , the
more similar between current trial and the historical trial j.Based on the q nearest historical trials and their correspond-ing similarity metrics, we can predict the future air quality
sensor values of the current trial for a prediction length l:
Mpredict =
s1s2...sq
T
mh1,n+1 mh1,n+2 · · · mh1,n+l
mh2,n+1 mh2,n+2 · · · mh2,n+l
......
. . ....
mhq,n+1 mhq,n+2 · · · mhq,n+l
(4)
where Mpredict = {mn+1,mn+2,mn+3, . . . ,mn+l} isthe predicted sensor values of the current trial and{mhj ,n+1,mhj ,n+2,mhj ,n+3, . . . ,mhj ,n+l
}is the sensor
values of the historical trial j.
Figure 7 illustrates an example of the performance of our IAQprediction algorithm in the context of predicting PM 2.5 sen-sor values of a trial of pesticide spray. The two dotted linesrepresent the two nearest historical trials of the current trial.The peak values of the two historical trials and the currenttrial are 224, 229 and 215ug/m3 respectively. The predictionstarts at the 11th data point after the peak value. As illus-trated, the predicted sensor values match the real sensor datavery well from the prediction starting point to 250 mins.
SMARTPHONE APPLICATIONThe design goal of the smartphone application is to increaseusers’ awareness of IAQ, help users understand how theirhousehold activities impact IAQ, and assist users to takeproper actions to reduce indoor air pollution in a timely man-ner. To achieve this goal, the smartphone application pro-vides four different screens: (1) dashboard screen, (2) IAQdata visualization screen, (3) IAQ analytics result screen, and(4) weekly IAQ report screen. The screenshots of these fourscreens are illustrated in Figure 8.
Dashboard Screen: A dashboard screen is accessible by ex-ecuting the application manually (Figure 8(a)). There arefour icons each representing one air quality sensor includedin AirSense. The number below each icon is the real-timemeasurement from each sensor. By pressing each icon, theIAQ data visualization page will be displayed. At the bottomof this screen, users can check their weekly IAQ reports bypressing the weekly IAQ report icon.
IAQ Data Visualization Screen: The IAQ data visualizationscreen (Figure 8(b)) provides a detailed visualization of theair quality sensor data in the past as well as IAQ forecast datagenerated by the IAQ forecast scheme described before. Byzooming in and out on the visualization, users can examinethe sensor data in great details. Furthermore, to draw users’attention when the air quality degrades, we map the sensordata to the official air quality index (AQI) from EPA based ona standard lookup table [3]. We use the same color codes ofAQI to visualize the sensor data in different colors [1]. At thebottom of this screen, a web link on the background knowl-edge of the air pollutant from EPA is also provided.
IAQ Analytics Result Screen: Once an indoor air pollutionevent is detected and its source is identified, the analytics en-gine on the cloud server immediately sends a notification tothe smartphone application, which provides a link to the IAQanalytics result screen (Figure 8(c)). The screen lists the airpollution sources identified by the source identification algo-rithm. Moreover, based on the result of the IAQ forecast al-gorithm, it also shows the estimated duration until IAQ willreturn back to healthy level to let users understand how se-rious the indoor air pollution is. This design is based on theprevious observation that proper use of simulations is knownto be effective in persuading people to change their attitudesor behaviors by enabling them to observe immediately thelink between cause (e.g., no action) and effect (e.g., exposureto pollution for 30 minutes) [11]. Finally, to guide users totaking appropriate actions to cope with the detected indoor airpollution event, detailed pollution source-specific suggestionsare provided on the screen. These suggestions are adoptedfrom the authoritative guidance provided by EPA [23]. Ta-ble 3 lists the pollution sources considered in this work andthe corresponding suggestions.
Pollution Source SuggestionCook Please turn on the range hood when cooking and
ventilate your home.Smoke Please smoke outside to minimize indoor pollution
and ventilate your home.Spray Pesticide Please ventilate your home after spraying pesticide.
Table 3: Pollution sources and the corresponding suggestions.
Weekly IAQ Report Screen: The analytics engine gener-ates a weekly IAQ report which summarizes the amount ofindoor air pollution caused by pollution events every week(Figure 8(d)). This screen is designed for self-monitoring,which is known to be beneficial for people in understandinghow well they are performing the target behavior, increasingthe likelihood that they will continue to produce the behav-ior [11]. The weekly IAQ report is illustrated using a piechart, which shows the percentage of time during one weekfor IAQ being either healthy or polluted by the three pollutionsource categories. We followed the AQI standard from EPAto group the AQI categories of good and moderate as healthyand group the other four AQI categories as unhealthy [1]. Fig-ure 8(d) shows a sample weekly IAQ report, illustrating thatthe PM 2.5 is at healthy level for 32% of the week while thePM 2.5 is at unhealthy level for 19%, 15%, and 34% of theweek due to smoking, spraying pesticide, and cooking.
SYSTEM PERFORMANCE EVALUATIONAs the first part of the evaluation, we conduct experiments tobenchmark the performance of AirSense on pollution eventdetection, pollution source identification, and IAQ forecast.We also conduct another two experiments to examine the im-pact of deployment location and diversity of pollution sourceson the performance of AirSense.
Experimental SetupParticipants: We recruited two families who volunteered tohelp collect data and conduct evaluation experiments at theirhome. Family 1 has three members: 1) P11 is a 32-year-oldmale; 2) P12 is a 31-year-old female; and 3) P13 is a 59-year-old female. Family 2 only consists of one member, P21, a25-year-old male.
Deployment Site: We deployed AirSense in the living roomat each home. The approximate size of the living room oftwo homes is 56 m2 and 25 m2, respectively. Figure 13 illus-trates the deployment of AirSense at one home. We chooseliving room as the deployment site of AirSense because it isthe central place that is close to kitchen, bedrooms, restroomsas well as windows for ventilation.
Data Collection: We deployed AirSense at each home for aduration of ten weeks. To collect IAQ data, two families wereinstructed to regularly cook in the kitchen as well as smokeand spray pesticide in the living room. It should be empha-sized that the occupants were allowed to conduct multiplepollution activities simultaneously (e.g., P11 is smoking whileP12 is cooking). Therefore, there are in total seven types ofpollution events (individuals plus combinations). Table 4 liststhese seven types of pollution events and their abbreviations.For ground truth collection, the participants were asked tolabel the pollution events and record the timestamps of theevents using Google Sheets. The time periods other than pol-lution events during the ten-week deployment are categorizedas non-pollution/null events. Table 5 lists the number of pol-lution events and their corresponding time durations collectedduring the ten-week deployment.
Event Cook Smoke Spray Cook+Smoke Smoke+Spray Cook+Spray AllAbbreviation C S P CS SP CP CSP
Table 4: The list of seven types of pollution events and their abbreviations.
Event C S P CS SP CP CSP TotalFamily No. of Sample 23 22 24 18 18 19 15 139
1 Duration (h) 140 112 101 84 89 93 69 688Family No. of Sample 25 25 25 20 20 20 15 150
2 Duration (h) 180 146 164 112 122 108 78 910
Table 5: Summary of data collected from two families during the ten-weekdeployment (see Table 4 for pollution event abbreviations).
Evaluation ResultsPerformance of Pollution Event DetectionTable 6 presents the confusion matrices for detecting the pol-lution events at two families. We observe that the pollutionevent detection rates at both families are very high, whichdemonstrates our algorithm is very accurate at detecting pol-lution events regardless of the differences in floor plans of the
1 2 3 4 5
3.6
0.9
6.1
4.5
2.9
Stove
SmokeSpray
AirSenseLocation
Family
43 5
Family
43 5
Figure 9: Performance of IAQ forecast algorithmon PM 2.5 prediction at two families.
1 2 3 4 5
3.6
0.9
6.1
4.5
2.9
Stove
SmokeSpray
AirSenseLocation
Family
43 5
Family
43 5
Figure 10: Performance of IAQ forecast algo-rithm on VOCs prediction at two families.
1 2 3 4 5
3.6
0.9
6.1
4.5
2.9
Stove
SmokeSpray
AirSenseLocation
Figure 11: Pollution source identification accu-racy at five deployment locations (see Figure 14for deployment location information).
Actual/Predicted Event NullFamily Event 99.8% 0.2%
1 Null 1.1% 98.9%Family Event 100.0% 0.0%
2 Null 0.5% 99.5%
Table 6: Confusion matrices of pollution event detection at two families.
homes as well as living styles of occupants at two families. Inaddition, we also observe that the false positive rates at bothfamilies are very low. This result indicates that our algorithmis very robust to noises caused by environmental changes andother human behaviors.
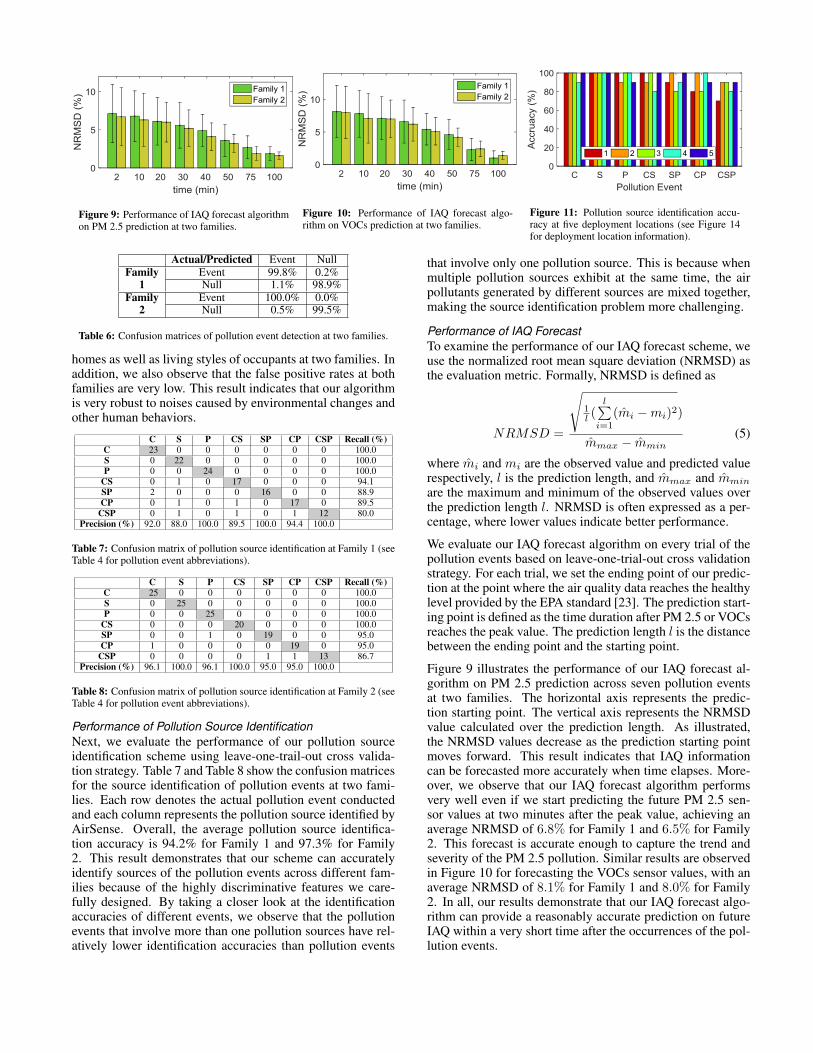
C S P CS SP CP CSP Recall (%)C 23 0 0 0 0 0 0 100.0S 0 22 0 0 0 0 0 100.0P 0 0 24 0 0 0 0 100.0
CS 0 1 0 17 0 0 0 94.1SP 2 0 0 0 16 0 0 88.9CP 0 1 0 1 0 17 0 89.5
CSP 0 1 0 1 0 1 12 80.0Precision (%) 92.0 88.0 100.0 89.5 100.0 94.4 100.0
Table 7: Confusion matrix of pollution source identification at Family 1 (seeTable 4 for pollution event abbreviations).
C S P CS SP CP CSP Recall (%)C 25 0 0 0 0 0 0 100.0S 0 25 0 0 0 0 0 100.0P 0 0 25 0 0 0 0 100.0
CS 0 0 0 20 0 0 0 100.0SP 0 0 1 0 19 0 0 95.0CP 1 0 0 0 0 19 0 95.0
CSP 0 0 0 0 1 1 13 86.7Precision (%) 96.1 100.0 96.1 100.0 95.0 95.0 100.0
Table 8: Confusion matrix of pollution source identification at Family 2 (seeTable 4 for pollution event abbreviations).
Performance of Pollution Source IdentificationNext, we evaluate the performance of our pollution sourceidentification scheme using leave-one-trail-out cross valida-tion strategy. Table 7 and Table 8 show the confusion matricesfor the source identification of pollution events at two fami-lies. Each row denotes the actual pollution event conductedand each column represents the pollution source identified byAirSense. Overall, the average pollution source identifica-tion accuracy is 94.2% for Family 1 and 97.3% for Family2. This result demonstrates that our scheme can accuratelyidentify sources of the pollution events across different fam-ilies because of the highly discriminative features we care-fully designed. By taking a closer look at the identificationaccuracies of different events, we observe that the pollutionevents that involve more than one pollution sources have rel-atively lower identification accuracies than pollution events
that involve only one pollution source. This is because whenmultiple pollution sources exhibit at the same time, the airpollutants generated by different sources are mixed together,making the source identification problem more challenging.
Performance of IAQ ForecastTo examine the performance of our IAQ forecast scheme, weuse the normalized root mean square deviation (NRMSD) asthe evaluation metric. Formally, NRMSD is defined as
NRMSD =
√1l (
l∑i=1
(m̂i −mi)2)
m̂max − m̂min(5)
where m̂i and mi are the observed value and predicted valuerespectively, l is the prediction length, and m̂max and m̂min
are the maximum and minimum of the observed values overthe prediction length l. NRMSD is often expressed as a per-centage, where lower values indicate better performance.
We evaluate our IAQ forecast algorithm on every trial of thepollution events based on leave-one-trial-out cross validationstrategy. For each trial, we set the ending point of our predic-tion at the point where the air quality data reaches the healthylevel provided by the EPA standard [23]. The prediction start-ing point is defined as the time duration after PM 2.5 or VOCsreaches the peak value. The prediction length l is the distancebetween the ending point and the starting point.
Figure 9 illustrates the performance of our IAQ forecast al-gorithm on PM 2.5 prediction across seven pollution eventsat two families. The horizontal axis represents the predic-tion starting point. The vertical axis represents the NRMSDvalue calculated over the prediction length. As illustrated,the NRMSD values decrease as the prediction starting pointmoves forward. This result indicates that IAQ informationcan be forecasted more accurately when time elapses. More-over, we observe that our IAQ forecast algorithm performsvery well even if we start predicting the future PM 2.5 sen-sor values at two minutes after the peak value, achieving anaverage NRMSD of 6.8% for Family 1 and 6.5% for Family2. This forecast is accurate enough to capture the trend andseverity of the PM 2.5 pollution. Similar results are observedin Figure 10 for forecasting the VOCs sensor values, with anaverage NRMSD of 8.1% for Family 1 and 8.0% for Family2. In all, our results demonstrate that our IAQ forecast algo-rithm can provide a reasonably accurate prediction on futureIAQ within a very short time after the occurrences of the pol-lution events.
1 2 3 4 5
3.6
0.9
6.1
4.5
2.9
Stove
SmokeSpray
AirSenseLocation
Figure 12: Pollution source identification la-tency at five deployment locations (see Figure14 for deployment location information).
PM 2.5 Sensor
Arduino Sensor Board
Figure 13: The deployment of AirSense in theliving room at one home.
1 2 3 4 5
5.6
1.4
8.9
7.5
4.9
?
Stove
SmokeSpray
AirSenseLocation
Figure 14: The illustration of the floor plan ofthe living room and the deployment locationsof AirSense (measure unit: meter).
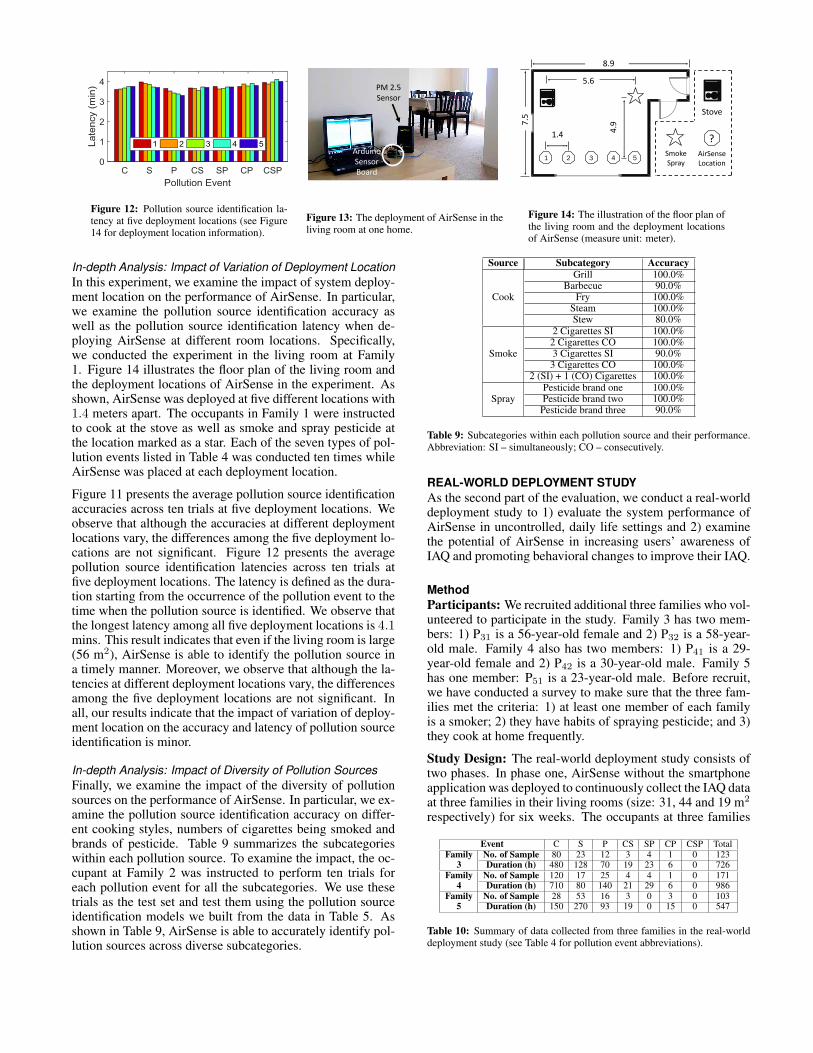
In-depth Analysis: Impact of Variation of Deployment LocationIn this experiment, we examine the impact of system deploy-ment location on the performance of AirSense. In particular,we examine the pollution source identification accuracy aswell as the pollution source identification latency when de-ploying AirSense at different room locations. Specifically,we conducted the experiment in the living room at Family1. Figure 14 illustrates the floor plan of the living room andthe deployment locations of AirSense in the experiment. Asshown, AirSense was deployed at five different locations with1.4 meters apart. The occupants in Family 1 were instructedto cook at the stove as well as smoke and spray pesticide atthe location marked as a star. Each of the seven types of pol-lution events listed in Table 4 was conducted ten times whileAirSense was placed at each deployment location.
Figure 11 presents the average pollution source identificationaccuracies across ten trials at five deployment locations. Weobserve that although the accuracies at different deploymentlocations vary, the differences among the five deployment lo-cations are not significant. Figure 12 presents the averagepollution source identification latencies across ten trials atfive deployment locations. The latency is defined as the dura-tion starting from the occurrence of the pollution event to thetime when the pollution source is identified. We observe thatthe longest latency among all five deployment locations is 4.1mins. This result indicates that even if the living room is large(56 m2), AirSense is able to identify the pollution source ina timely manner. Moreover, we observe that although the la-tencies at different deployment locations vary, the differencesamong the five deployment locations are not significant. Inall, our results indicate that the impact of variation of deploy-ment location on the accuracy and latency of pollution sourceidentification is minor.
In-depth Analysis: Impact of Diversity of Pollution SourcesFinally, we examine the impact of the diversity of pollutionsources on the performance of AirSense. In particular, we ex-amine the pollution source identification accuracy on differ-ent cooking styles, numbers of cigarettes being smoked andbrands of pesticide. Table 9 summarizes the subcategorieswithin each pollution source. To examine the impact, the oc-cupant at Family 2 was instructed to perform ten trials foreach pollution event for all the subcategories. We use thesetrials as the test set and test them using the pollution sourceidentification models we built from the data in Table 5. Asshown in Table 9, AirSense is able to accurately identify pol-lution sources across diverse subcategories.
Source Subcategory AccuracyGrill 100.0%
Barbecue 90.0%Cook Fry 100.0%
Steam 100.0%Stew 80.0%
2 Cigarettes SI 100.0%2 Cigarettes CO 100.0%
Smoke 3 Cigarettes SI 90.0%3 Cigarettes CO 100.0%
2 (SI) + 1 (CO) Cigarettes 100.0%Pesticide brand one 100.0%
Spray Pesticide brand two 100.0%Pesticide brand three 90.0%
Table 9: Subcategories within each pollution source and their performance.Abbreviation: SI – simultaneously; CO – consecutively.
REAL-WORLD DEPLOYMENT STUDYAs the second part of the evaluation, we conduct a real-worlddeployment study to 1) evaluate the system performance ofAirSense in uncontrolled, daily life settings and 2) examinethe potential of AirSense in increasing users’ awareness ofIAQ and promoting behavioral changes to improve their IAQ.
MethodParticipants: We recruited additional three families who vol-unteered to participate in the study. Family 3 has two mem-bers: 1) P31 is a 56-year-old female and 2) P32 is a 58-year-old male. Family 4 also has two members: 1) P41 is a 29-year-old female and 2) P42 is a 30-year-old male. Family 5has one member: P51 is a 23-year-old male. Before recruit,we have conducted a survey to make sure that the three fam-ilies met the criteria: 1) at least one member of each familyis a smoker; 2) they have habits of spraying pesticide; and 3)they cook at home frequently.
Study Design: The real-world deployment study consists oftwo phases. In phase one, AirSense without the smartphoneapplication was deployed to continuously collect the IAQ dataat three families in their living rooms (size: 31, 44 and 19 m2
respectively) for six weeks. The occupants at three families
Event C S P CS SP CP CSP TotalFamily No. of Sample 80 23 12 3 4 1 0 123
3 Duration (h) 480 128 70 19 23 6 0 726Family No. of Sample 120 17 25 4 4 1 0 171
4 Duration (h) 710 80 140 21 29 6 0 986Family No. of Sample 28 53 16 3 0 3 0 103
5 Duration (h) 150 270 93 19 0 15 0 547
Table 10: Summary of data collected from three families in the real-worlddeployment study (see Table 4 for pollution event abbreviations).
1 2 3 4 5
3.6
0.9
6.1
4.5
2.9
Stove
SmokeSpray
AirSenseLocation
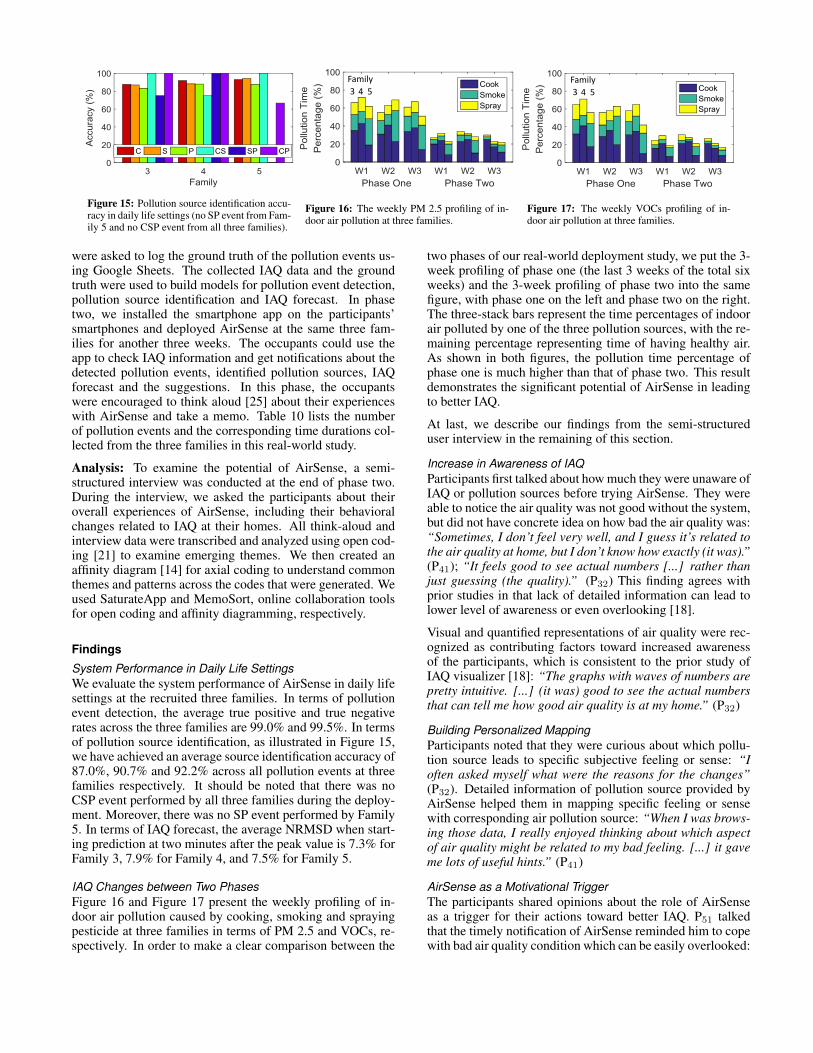
Figure 15: Pollution source identification accu-racy in daily life settings (no SP event from Fam-ily 5 and no CSP event from all three families).
1 2 3 4 5
3.6
0.9
6.1
4.5
2.9
Stove
SmokeSpray
AirSenseLocation
Family
43 5
Family
43 5Family
43 5
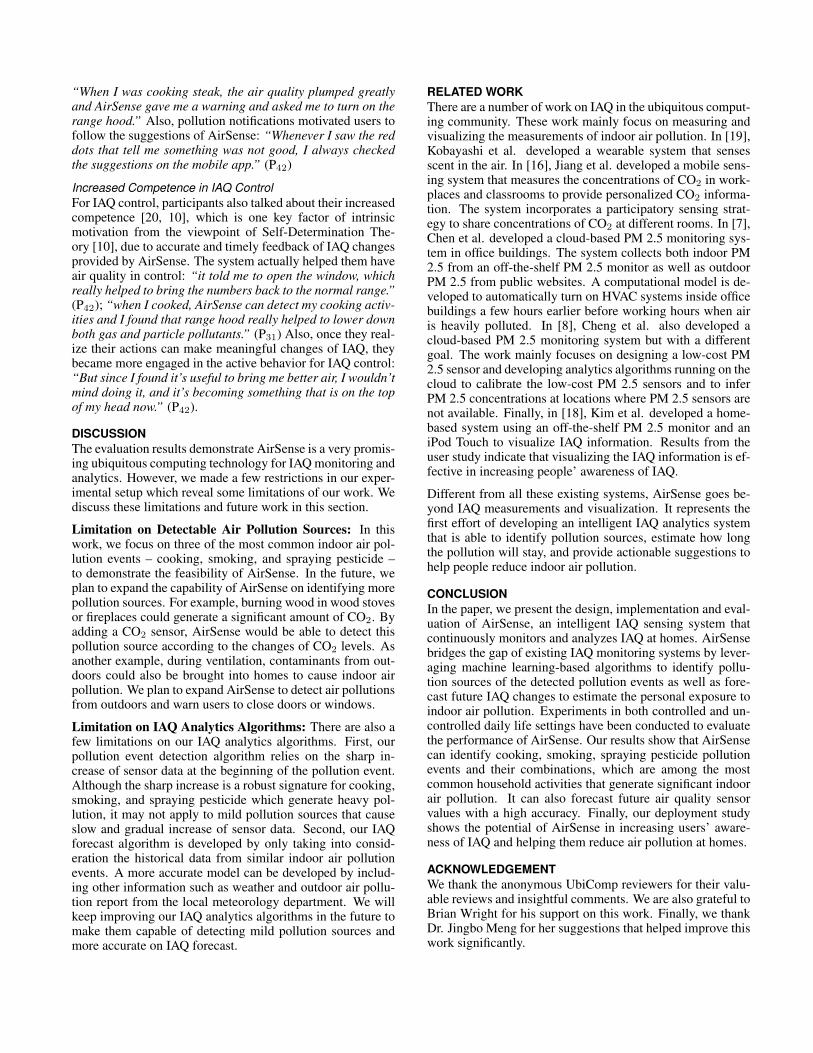
Figure 16: The weekly PM 2.5 profiling of in-door air pollution at three families.
1 2 3 4 5
3.6
0.9
6.1
4.5
2.9
Stove
SmokeSpray
AirSenseLocation
Family
43 5
Family
43 5Family
43 5
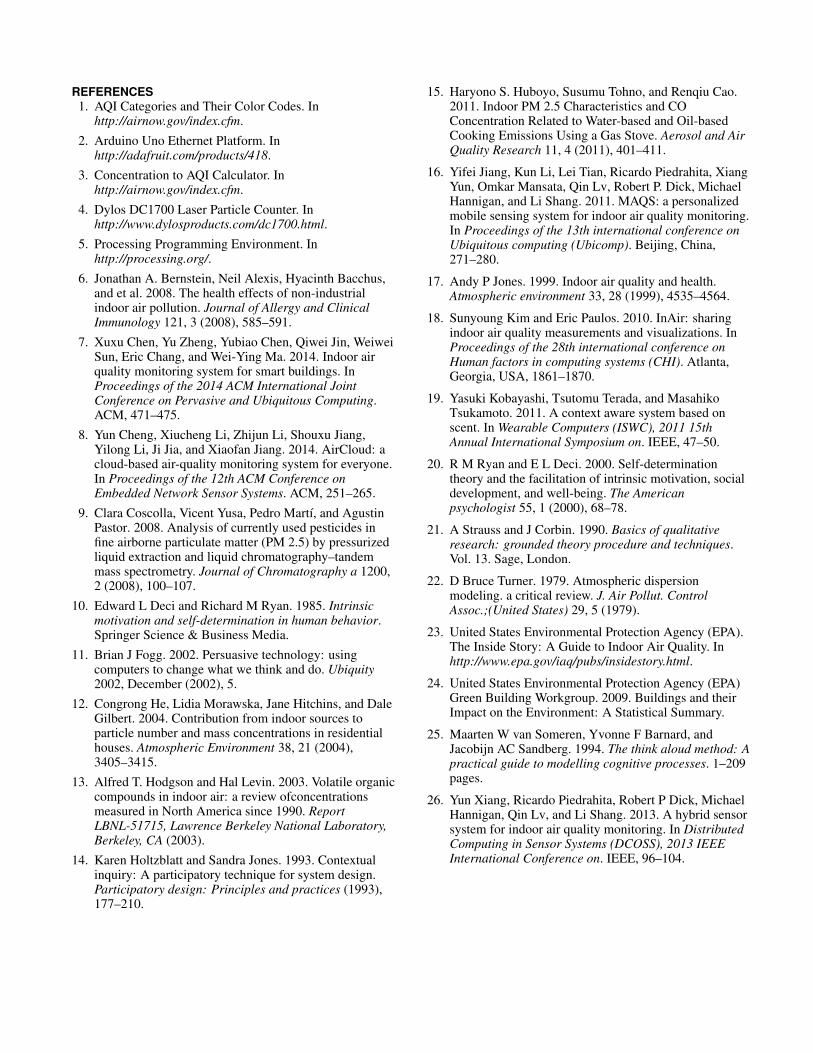
Figure 17: The weekly VOCs profiling of in-door air pollution at three families.
were asked to log the ground truth of the pollution events us-ing Google Sheets. The collected IAQ data and the groundtruth were used to build models for pollution event detection,pollution source identification and IAQ forecast. In phasetwo, we installed the smartphone app on the participants’smartphones and deployed AirSense at the same three fam-ilies for another three weeks. The occupants could use theapp to check IAQ information and get notifications about thedetected pollution events, identified pollution sources, IAQforecast and the suggestions. In this phase, the occupantswere encouraged to think aloud [25] about their experienceswith AirSense and take a memo. Table 10 lists the numberof pollution events and the corresponding time durations col-lected from the three families in this real-world study.
Analysis: To examine the potential of AirSense, a semi-structured interview was conducted at the end of phase two.During the interview, we asked the participants about theiroverall experiences of AirSense, including their behavioralchanges related to IAQ at their homes. All think-aloud andinterview data were transcribed and analyzed using open cod-ing [21] to examine emerging themes. We then created anaffinity diagram [14] for axial coding to understand commonthemes and patterns across the codes that were generated. Weused SaturateApp and MemoSort, online collaboration toolsfor open coding and affinity diagramming, respectively.
Findings
System Performance in Daily Life SettingsWe evaluate the system performance of AirSense in daily lifesettings at the recruited three families. In terms of pollutionevent detection, the average true positive and true negativerates across the three families are 99.0% and 99.5%. In termsof pollution source identification, as illustrated in Figure 15,we have achieved an average source identification accuracy of87.0%, 90.7% and 92.2% across all pollution events at threefamilies respectively. It should be noted that there was noCSP event performed by all three families during the deploy-ment. Moreover, there was no SP event performed by Family5. In terms of IAQ forecast, the average NRMSD when start-ing prediction at two minutes after the peak value is 7.3% forFamily 3, 7.9% for Family 4, and 7.5% for Family 5.
IAQ Changes between Two PhasesFigure 16 and Figure 17 present the weekly profiling of in-door air pollution caused by cooking, smoking and sprayingpesticide at three families in terms of PM 2.5 and VOCs, re-spectively. In order to make a clear comparison between the
two phases of our real-world deployment study, we put the 3-week profiling of phase one (the last 3 weeks of the total sixweeks) and the 3-week profiling of phase two into the samefigure, with phase one on the left and phase two on the right.The three-stack bars represent the time percentages of indoorair polluted by one of the three pollution sources, with the re-maining percentage representing time of having healthy air.As shown in both figures, the pollution time percentage ofphase one is much higher than that of phase two. This resultdemonstrates the significant potential of AirSense in leadingto better IAQ.
At last, we describe our findings from the semi-structureduser interview in the remaining of this section.
Increase in Awareness of IAQParticipants first talked about how much they were unaware ofIAQ or pollution sources before trying AirSense. They wereable to notice the air quality was not good without the system,but did not have concrete idea on how bad the air quality was:“Sometimes, I don’t feel very well, and I guess it’s related tothe air quality at home, but I don’t know how exactly (it was).”(P41); “It feels good to see actual numbers [...] rather thanjust guessing (the quality).” (P32) This finding agrees withprior studies in that lack of detailed information can lead tolower level of awareness or even overlooking [18].
Visual and quantified representations of air quality were rec-ognized as contributing factors toward increased awarenessof the participants, which is consistent to the prior study ofIAQ visualizer [18]: “The graphs with waves of numbers arepretty intuitive. [...] (it was) good to see the actual numbersthat can tell me how good air quality is at my home.” (P32)
Building Personalized MappingParticipants noted that they were curious about which pollu-tion source leads to specific subjective feeling or sense: “Ioften asked myself what were the reasons for the changes”(P32). Detailed information of pollution source provided byAirSense helped them in mapping specific feeling or sensewith corresponding air pollution source: “When I was brows-ing those data, I really enjoyed thinking about which aspectof air quality might be related to my bad feeling. [...] it gaveme lots of useful hints.” (P41)
AirSense as a Motivational TriggerThe participants shared opinions about the role of AirSenseas a trigger for their actions toward better IAQ. P51 talkedthat the timely notification of AirSense reminded him to copewith bad air quality condition which can be easily overlooked:
“When I was cooking steak, the air quality plumped greatlyand AirSense gave me a warning and asked me to turn on therange hood.” Also, pollution notifications motivated users tofollow the suggestions of AirSense: “Whenever I saw the reddots that tell me something was not good, I always checkedthe suggestions on the mobile app.” (P42)
Increased Competence in IAQ ControlFor IAQ control, participants also talked about their increasedcompetence [20, 10], which is one key factor of intrinsicmotivation from the viewpoint of Self-Determination The-ory [10], due to accurate and timely feedback of IAQ changesprovided by AirSense. The system actually helped them haveair quality in control: “it told me to open the window, whichreally helped to bring the numbers back to the normal range.”(P42); “when I cooked, AirSense can detect my cooking activ-ities and I found that range hood really helped to lower downboth gas and particle pollutants.” (P31) Also, once they real-ize their actions can make meaningful changes of IAQ, theybecame more engaged in the active behavior for IAQ control:“But since I found it’s useful to bring me better air, I wouldn’tmind doing it, and it’s becoming something that is on the topof my head now.” (P42).
DISCUSSIONThe evaluation results demonstrate AirSense is a very promis-ing ubiquitous computing technology for IAQ monitoring andanalytics. However, we made a few restrictions in our exper-imental setup which reveal some limitations of our work. Wediscuss these limitations and future work in this section.
Limitation on Detectable Air Pollution Sources: In thiswork, we focus on three of the most common indoor air pol-lution events – cooking, smoking, and spraying pesticide –to demonstrate the feasibility of AirSense. In the future, weplan to expand the capability of AirSense on identifying morepollution sources. For example, burning wood in wood stovesor fireplaces could generate a significant amount of CO2. Byadding a CO2 sensor, AirSense would be able to detect thispollution source according to the changes of CO2 levels. Asanother example, during ventilation, contaminants from out-doors could also be brought into homes to cause indoor airpollution. We plan to expand AirSense to detect air pollutionsfrom outdoors and warn users to close doors or windows.
Limitation on IAQ Analytics Algorithms: There are also afew limitations on our IAQ analytics algorithms. First, ourpollution event detection algorithm relies on the sharp in-crease of sensor data at the beginning of the pollution event.Although the sharp increase is a robust signature for cooking,smoking, and spraying pesticide which generate heavy pol-lution, it may not apply to mild pollution sources that causeslow and gradual increase of sensor data. Second, our IAQforecast algorithm is developed by only taking into consid-eration the historical data from similar indoor air pollutionevents. A more accurate model can be developed by includ-ing other information such as weather and outdoor air pollu-tion report from the local meteorology department. We willkeep improving our IAQ analytics algorithms in the future tomake them capable of detecting mild pollution sources andmore accurate on IAQ forecast.
RELATED WORKThere are a number of work on IAQ in the ubiquitous comput-ing community. These work mainly focus on measuring andvisualizing the measurements of indoor air pollution. In [19],Kobayashi et al. developed a wearable system that sensesscent in the air. In [16], Jiang et al. developed a mobile sens-ing system that measures the concentrations of CO2 in work-places and classrooms to provide personalized CO2 informa-tion. The system incorporates a participatory sensing strat-egy to share concentrations of CO2 at different rooms. In [7],Chen et al. developed a cloud-based PM 2.5 monitoring sys-tem in office buildings. The system collects both indoor PM2.5 from an off-the-shelf PM 2.5 monitor as well as outdoorPM 2.5 from public websites. A computational model is de-veloped to automatically turn on HVAC systems inside officebuildings a few hours earlier before working hours when airis heavily polluted. In [8], Cheng et al. also developed acloud-based PM 2.5 monitoring system but with a differentgoal. The work mainly focuses on designing a low-cost PM2.5 sensor and developing analytics algorithms running on thecloud to calibrate the low-cost PM 2.5 sensors and to inferPM 2.5 concentrations at locations where PM 2.5 sensors arenot available. Finally, in [18], Kim et al. developed a home-based system using an off-the-shelf PM 2.5 monitor and aniPod Touch to visualize IAQ information. Results from theuser study indicate that visualizing the IAQ information is ef-fective in increasing people’ awareness of IAQ.
Different from all these existing systems, AirSense goes be-yond IAQ measurements and visualization. It represents thefirst effort of developing an intelligent IAQ analytics systemthat is able to identify pollution sources, estimate how longthe pollution will stay, and provide actionable suggestions tohelp people reduce indoor air pollution.
CONCLUSIONIn the paper, we present the design, implementation and eval-uation of AirSense, an intelligent IAQ sensing system thatcontinuously monitors and analyzes IAQ at homes. AirSensebridges the gap of existing IAQ monitoring systems by lever-aging machine learning-based algorithms to identify pollu-tion sources of the detected pollution events as well as fore-cast future IAQ changes to estimate the personal exposure toindoor air pollution. Experiments in both controlled and un-controlled daily life settings have been conducted to evaluatethe performance of AirSense. Our results show that AirSensecan identify cooking, smoking, spraying pesticide pollutionevents and their combinations, which are among the mostcommon household activities that generate significant indoorair pollution. It can also forecast future air quality sensorvalues with a high accuracy. Finally, our deployment studyshows the potential of AirSense in increasing users’ aware-ness of IAQ and helping them reduce air pollution at homes.
ACKNOWLEDGEMENTWe thank the anonymous UbiComp reviewers for their valu-able reviews and insightful comments. We are also grateful toBrian Wright for his support on this work. Finally, we thankDr. Jingbo Meng for her suggestions that helped improve thiswork significantly.
REFERENCES1. AQI Categories and Their Color Codes. In
http://airnow.gov/index.cfm.2. Arduino Uno Ethernet Platform. In
http://adafruit.com/products/418.3. Concentration to AQI Calculator. In
http://airnow.gov/index.cfm.4. Dylos DC1700 Laser Particle Counter. In
http://www.dylosproducts.com/dc1700.html.5. Processing Programming Environment. In
http://processing.org/.6. Jonathan A. Bernstein, Neil Alexis, Hyacinth Bacchus,
and et al. 2008. The health effects of non-industrialindoor air pollution. Journal of Allergy and ClinicalImmunology 121, 3 (2008), 585–591.
7. Xuxu Chen, Yu Zheng, Yubiao Chen, Qiwei Jin, WeiweiSun, Eric Chang, and Wei-Ying Ma. 2014. Indoor airquality monitoring system for smart buildings. InProceedings of the 2014 ACM International JointConference on Pervasive and Ubiquitous Computing.ACM, 471–475.
8. Yun Cheng, Xiucheng Li, Zhijun Li, Shouxu Jiang,Yilong Li, Ji Jia, and Xiaofan Jiang. 2014. AirCloud: acloud-based air-quality monitoring system for everyone.In Proceedings of the 12th ACM Conference onEmbedded Network Sensor Systems. ACM, 251–265.
9. Clara Coscolla, Vicent Yusa, Pedro Martı́, and AgustinPastor. 2008. Analysis of currently used pesticides infine airborne particulate matter (PM 2.5) by pressurizedliquid extraction and liquid chromatography–tandemmass spectrometry. Journal of Chromatography a 1200,2 (2008), 100–107.
10. Edward L Deci and Richard M Ryan. 1985. Intrinsicmotivation and self-determination in human behavior.Springer Science & Business Media.
11. Brian J Fogg. 2002. Persuasive technology: usingcomputers to change what we think and do. Ubiquity2002, December (2002), 5.
12. Congrong He, Lidia Morawska, Jane Hitchins, and DaleGilbert. 2004. Contribution from indoor sources toparticle number and mass concentrations in residentialhouses. Atmospheric Environment 38, 21 (2004),3405–3415.
13. Alfred T. Hodgson and Hal Levin. 2003. Volatile organiccompounds in indoor air: a review ofconcentrationsmeasured in North America since 1990. ReportLBNL-51715, Lawrence Berkeley National Laboratory,Berkeley, CA (2003).
14. Karen Holtzblatt and Sandra Jones. 1993. Contextualinquiry: A participatory technique for system design.Participatory design: Principles and practices (1993),177–210.
15. Haryono S. Huboyo, Susumu Tohno, and Renqiu Cao.2011. Indoor PM 2.5 Characteristics and COConcentration Related to Water-based and Oil-basedCooking Emissions Using a Gas Stove. Aerosol and AirQuality Research 11, 4 (2011), 401–411.
16. Yifei Jiang, Kun Li, Lei Tian, Ricardo Piedrahita, XiangYun, Omkar Mansata, Qin Lv, Robert P. Dick, MichaelHannigan, and Li Shang. 2011. MAQS: a personalizedmobile sensing system for indoor air quality monitoring.In Proceedings of the 13th international conference onUbiquitous computing (Ubicomp). Beijing, China,271–280.
17. Andy P Jones. 1999. Indoor air quality and health.Atmospheric environment 33, 28 (1999), 4535–4564.
18. Sunyoung Kim and Eric Paulos. 2010. InAir: sharingindoor air quality measurements and visualizations. InProceedings of the 28th international conference onHuman factors in computing systems (CHI). Atlanta,Georgia, USA, 1861–1870.
19. Yasuki Kobayashi, Tsutomu Terada, and MasahikoTsukamoto. 2011. A context aware system based onscent. In Wearable Computers (ISWC), 2011 15thAnnual International Symposium on. IEEE, 47–50.
20. R M Ryan and E L Deci. 2000. Self-determinationtheory and the facilitation of intrinsic motivation, socialdevelopment, and well-being. The Americanpsychologist 55, 1 (2000), 68–78.
21. A Strauss and J Corbin. 1990. Basics of qualitativeresearch: grounded theory procedure and techniques.Vol. 13. Sage, London.
22. D Bruce Turner. 1979. Atmospheric dispersionmodeling. a critical review. J. Air Pollut. ControlAssoc.;(United States) 29, 5 (1979).
23. United States Environmental Protection Agency (EPA).The Inside Story: A Guide to Indoor Air Quality. Inhttp://www.epa.gov/iaq/pubs/insidestory.html.
24. United States Environmental Protection Agency (EPA)Green Building Workgroup. 2009. Buildings and theirImpact on the Environment: A Statistical Summary.
25. Maarten W van Someren, Yvonne F Barnard, andJacobijn AC Sandberg. 1994. The think aloud method: Apractical guide to modelling cognitive processes. 1–209pages.
26. Yun Xiang, Ricardo Piedrahita, Robert P Dick, MichaelHannigan, Qin Lv, and Li Shang. 2013. A hybrid sensorsystem for indoor air quality monitoring. In DistributedComputing in Sensor Systems (DCOSS), 2013 IEEEInternational Conference on. IEEE, 96–104.