airservices australi amirror.airservicesaustralia.com/wp-content/uploads/canberra_2011_1... ·...
TRANSCRIPT
AI RSERVI CES AUSTRALI A
NOISE AND FLIGHT PATH MONITORING SYSTEM
CANBERRA QUARTERLY REPORT
JANUARY-MARCH 2011

Page 2Canberra Quarterly Report CB11Q1
A I R S E R V I C E S A U S T R A L I A
EXECUTIVE SUMMARY
DISCLAIMER
This report contains a summary of data collected over the specified period and is intended to convey the best
information available from the NFPMS at the time. The system databases are to some extent dependent upon external
sources and errors may occur. All care is taken in preparation of the report but its complete accuracy can not be
guaranteed. Airservices Australia does not accept any legal liability for any losses arising from reliance upon data in
this report which may be found to be inaccurate.
This report presents a summary of data for the period January to March (Quarter 1) 2011 collected
by the Noise and Flight Path Monitoring System (NFPMS) at Canberra Airport.
During quarter 1 of 2011 the Canberra NFPMS detected 6,463 arrivals and 6,438 departures, a total
of 12,901 movements, which is 6.3% below the average for the previous 12
months (4 quarters). Of the 6,438 departures 86.7% used the preferred departure runway 35. Note
the decrease in jet movements for quarter 1 over the previous 12 months was 5.4%. The total number
of movements in quarter 1 of 2011 resulted in a decrease of 648 movements compared to the same
quarter of the previous year.
The noise monitor at Jerrabomberra detected 3,079 aircraft noise events above 70 dB(A) for quarter
1 of 2011. This corresponds to a daily average (or N70 value) of 34.3 (the quarter 4 value was 38.5)
a 10.0% decrease over the average for the previous 12 months. The noise levels for individual
aircraft types detected at the Jerrabomberra noise monitor were approximately the same (that is
within 1 standard deviation) as those recorded over the previous 12 months. The noisiest aircraft
during this quarter was the Boeing - 767-300 on arrival to runway 35 with an LAmax value of 74.1
dB(A).
In rare circumstances, data within the NFPMS may be updated that can cause slight changes to historic data that has been previously published.

Page 3Canberra Quarterly Report CB11Q1
A I R S E R V I C E S A U S T R A L I A
CONTENTS
Page
Executive Summary 2
Figures and Tables 5
Glossary of terms 7
1. Introduction 9
2. NMT locations and noise data summaries 10
3. Quarterly track data 12
3.1. Quarterly track density plots 12
3.2. Jet track plots 15
3.3. Non-jet and helicopter track plots 15
3.4. Scatter plots 15
4. Aircraft movement and aircraft noise data 27
4.1. Movement statistics 27
4.2. Night movement statistics 27
4.3. Daily runway usage per calendar month for arrivals and departures during the quarter 27
4.4. Hourly movements per calendar month for arrivals and departures during the quarter 32
4.5. Quarterly aircraft average noise levels 32
4.6. Data included in Appendix E 32
Appendix A: An overview of the Noise and Flight Path Monitoring System 33
A. System overview 34
A.1. System configuration and features 34
A.2. System applications 35
Page 4Canberra Quarterly Report CB11Q1
A I R S E R V I C E S A U S T R A L I A
Appendix B: Daily N70 value and N70 distribution for each NMT,during the period January to March 2011 36
Appendix C: Daily runway usage per calendar month for arrivals and departuresduring the period January to March 2011 38
Appendix D: Hourly movements per calendar month for arrivals and departuresduring the period January to March 2011 48
Appendix E: Quarterly aircraft average noise levels, January to March 2011 52
Page 5Canberra Quarterly Report CB11Q1
A I R S E R V I C E S A U S T R A L I A
FIGURES AND TABLES
Page
Figure 1: Noise and flight path monitoring locations in Australia 9
Figure 2: Locations of NMTs around Canberra Airport 10
Figure 3: Track density plot for all aircraft movements during the 1st quarter 2011 13
Figure 4: Track density plot for jet operations only during the 1st quarter 2011 14
Figure 5: Track plot coloured by height(ft) above ground level for jet arrivals 17during the period 02/03/2011 to 08/03/2011
Figure 6: Track plot coloured by height(ft) above ground level for jet departures 18during the period 02/03/2011 to 08/03/2011
Figure 7: Track plot coloured by height(ft) above ground level for non-jet and helicopter arrivalsduring the period 02/03/2011 to 08/03/2011 19
Figure 8: Track plot coloured by height(ft) above ground level for non-jet and helicopter departuresduring the period 02/03/2011 to 08/03/2011 20
Figure 9: Track plot for northerly jet arrivals during 1st quarter of 2011 21
Figure 10: Scatter plot for northerly jet arrivals during 1st quarter of 2011 22height(ft) in this figure is relative to ground level
Figure 11: Track plot for northerly jet departures during 1st quarter of 2011 23
Figure 12: Scatter plot for northerly jet departures during 1st quarter of 2011 24height(ft) in this figure is relative to ground level
Figure 13: Track plot for aircraft arriving onto runway 30 during 1st quarter of 2011 25
Figure 14: Scatter plot for aircraft arriving onto runway 30 over Kowen forest 26during the 1st quarter of 2011, height(ft) in this figure isrelative to ground level.
Table 1: Location and noise parameters for each permanent 11NMT about Canberra Airport for the 1st quarter of 2011
Page 6Canberra Quarterly Report CB11Q1
A I R S E R V I C E S A U S T R A L I A
Table 2: Movement statistics for each month of the 1st quarter 2011 28
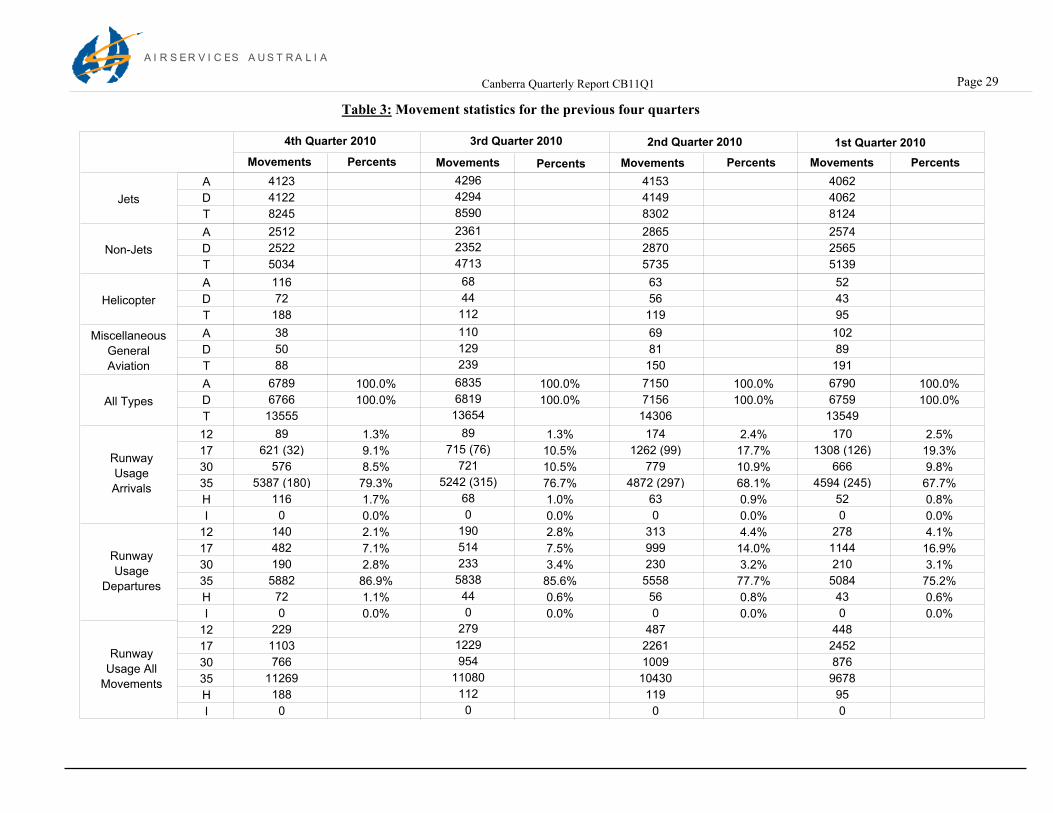
Table 3: Movement statistics for the previous four quarters 29
Table 4: Night movement statistics for the 1st quarter of 2011 30
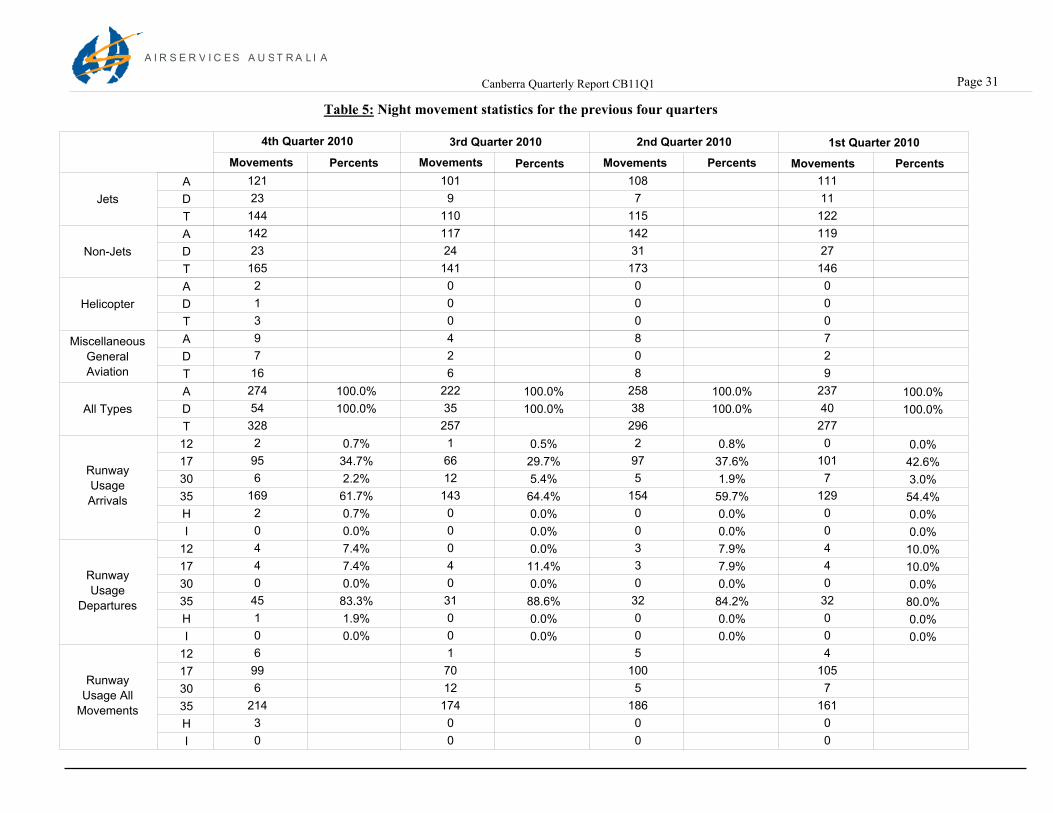
Table 5: Night movement statistics for the previous four quarters 31

Page 7Canberra Quarterly Report CB11Q1
A I R S E R V I C E S A U S T R A L I A
GLOSSARY OF TERMS
A: Arrivals
AA: Airservices Australia
AGL: Above ground level
AMSL: Average mean Sea level
CNE: Correlated noise events - noise events which are correlated with aircraft movements
CNEall: All correlated noise events
CNE70: Only correlated noise events equal to or above 70 dB(A)
D: Departures
H: Helicopters
I: Indeterminate
JET: Jet aircraft
LAeq: Time average A-weighted sound pressure level
Movement: An aircraft operation, such as a take-off or landing
N70: Average daily number of correlated noise events equal to or greater than 70 dB(A)
N80: Average daily number of correlated noise events equal to or greater than 80 dB(A)
N90: Average daily number of correlated noise events equal to or greater than 90 dB(A)
Page 8Canberra Quarterly Report CB11Q1
A I R S E R V I C E S A U S T R A L I A
NFPMS: Noise and Flight Path Monitoring System
NMT: Noise Monitoring Terminal
Noise Event: A noise exceeding the threshold sound pressure level for longer than the threshold duration
NON-JET: Non-jet aircraft
RNP: Required Navigation Performance
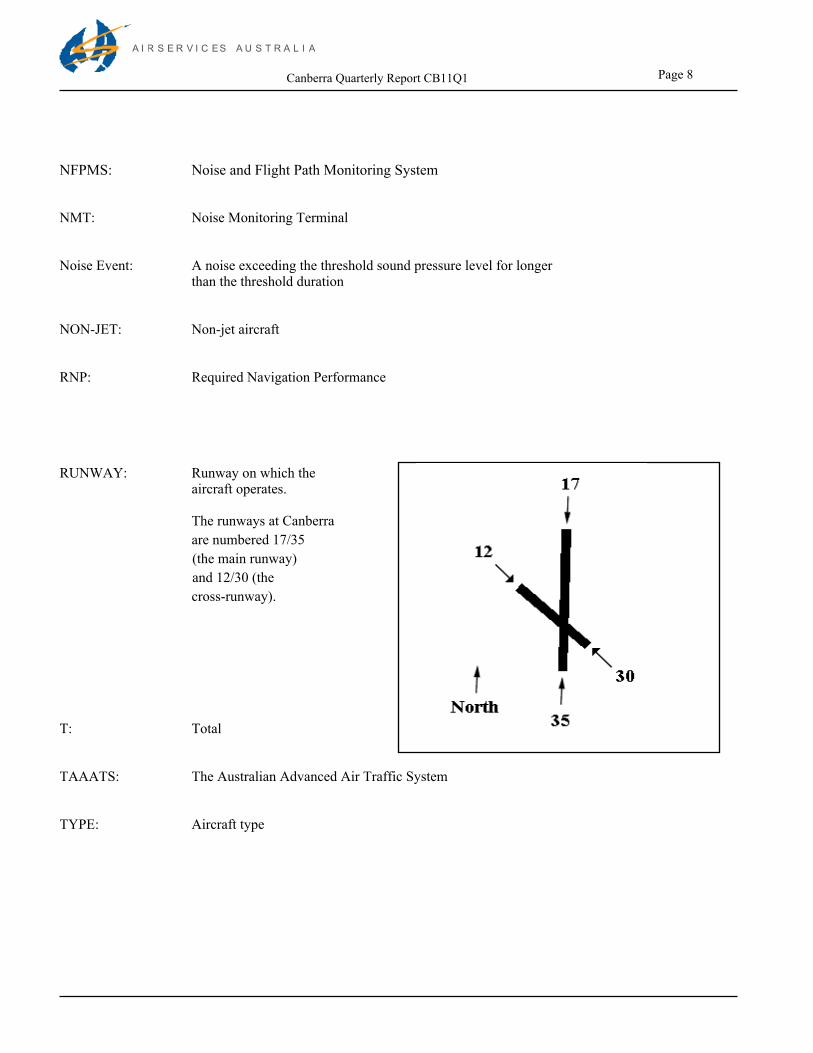
RUNWAY: Runway on which the aircraft operates.
The runways at Canberra
are numbered 17/35
(the main runway)
and 12/30 (the
cross-runway).
T: Total
TAAATS: The Australian Advanced Air Traffic System
TYPE: Aircraft type
Page 9Canberra Quarterly Report CB11Q1
A I R S E R V I C E S A U S T R A L I A
1. INTRODUCTION
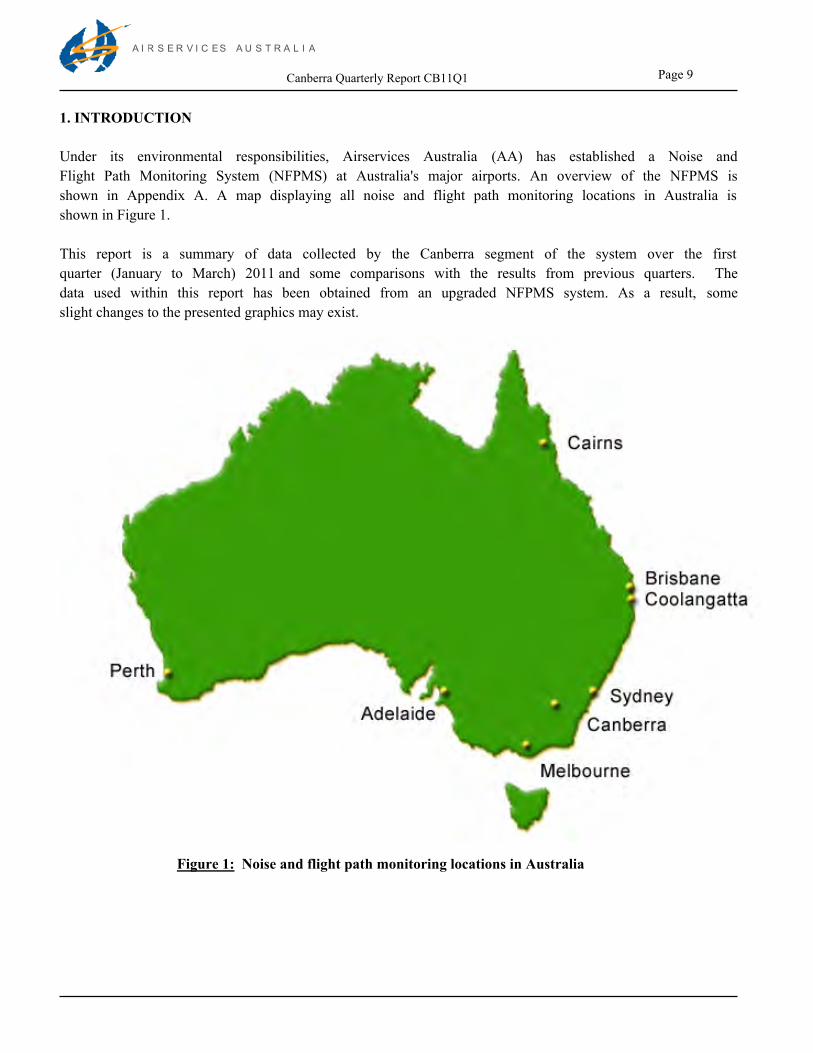
Under its environmental responsibilities, Airservices Australia (AA) has established a Noise and
Flight Path Monitoring System (NFPMS) at Australia's major airports. An overview of the NFPMS is
shown in Appendix A. A map displaying all noise and flight path monitoring locations in Australia is
shown in Figure 1.
This report is a summary of data collected by the Canberra segment of the system over the first
quarter (January to March) 2011 and some comparisons with the results from previous quarters. The
data used within this report has been obtained from an upgraded NFPMS system. As a result, some
slight changes to the presented graphics may exist.
Figure 1: Noise and flight path monitoring locations in Australia
Page 10Canberra Quarterly Report CB11Q1
A I R S E R V I C E S A U S T R A L I A
2. NMT LOCATIONS AND NOISE DATA SUMMARIES
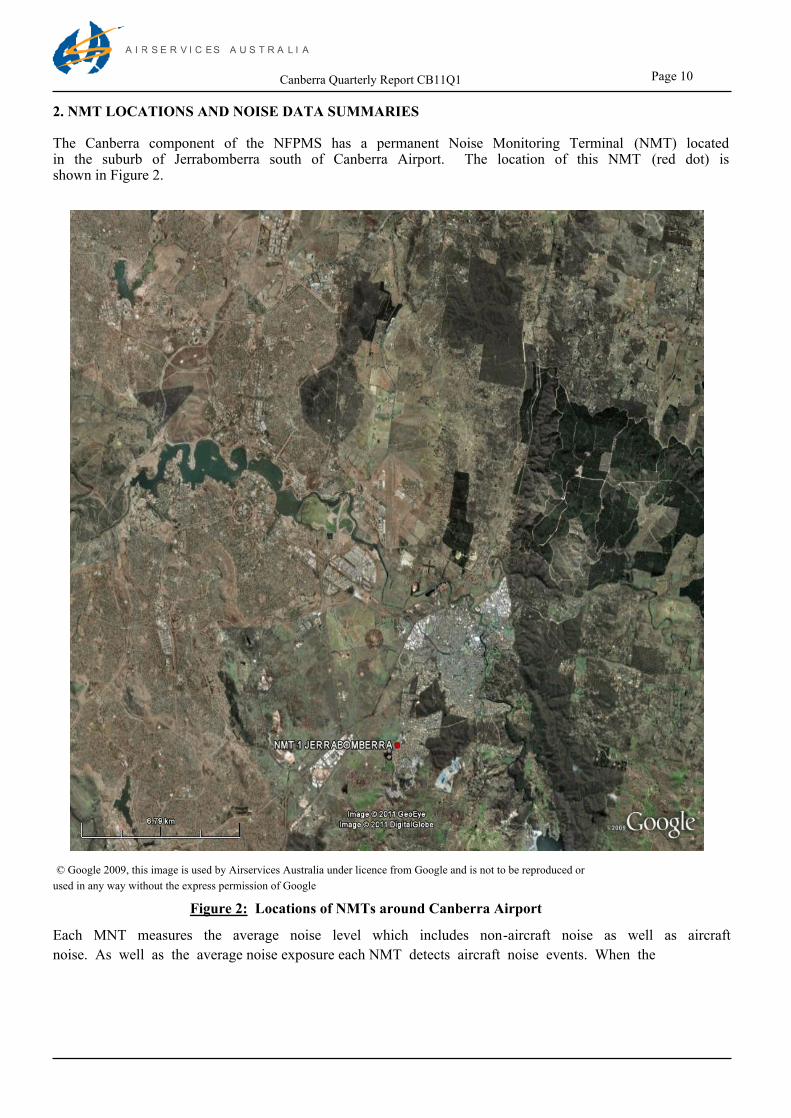
The Canberra component of the NFPMS has a permanent Noise Monitoring Terminal (NMT) located in the suburb of Jerrabomberra south of Canberra Airport. The location of this NMT (red dot) is shown in Figure 2.
Each MNT measures the average noise level which includes non-aircraft noise as well as aircraft
noise. As well as the average noise exposure each NMT detects aircraft noise events. When the
Figure 2: Locations of NMTs around Canberra Airport
© Google 2009, this image is used by Airservices Australia under licence from Google and is not to be reproduced or
used in any way without the express permission of Google
Page 11Canberra Quarterly Report CB11Q1
A I R S E R V I C E S A U S T R A L I A
level and duration of noise from any noise source in the vicinity of a NMT exceed the threshold level and duration, which have been set for the NMT, a “noise event” is recorded. The time at which the noise event is recorded at the NMT location is then checked against movement times and radar tracks of aircraft operating within a cylinder with the base centre at the NMT, correlation zone. If the time and NMT location of the noise event match the movement time and radar track of an aircraft, the noise event is attributed to that aircraft, i.e. it becomes a “correlated noise event” (CNE). Otherwise, it is regarded as part of the background noise. When determining the noise exposure levels for aircraft it is the CNE that are used. The Jerrabomberra NMT (red dot) and it's correlation zone (red circle) is shown in Figure 2.
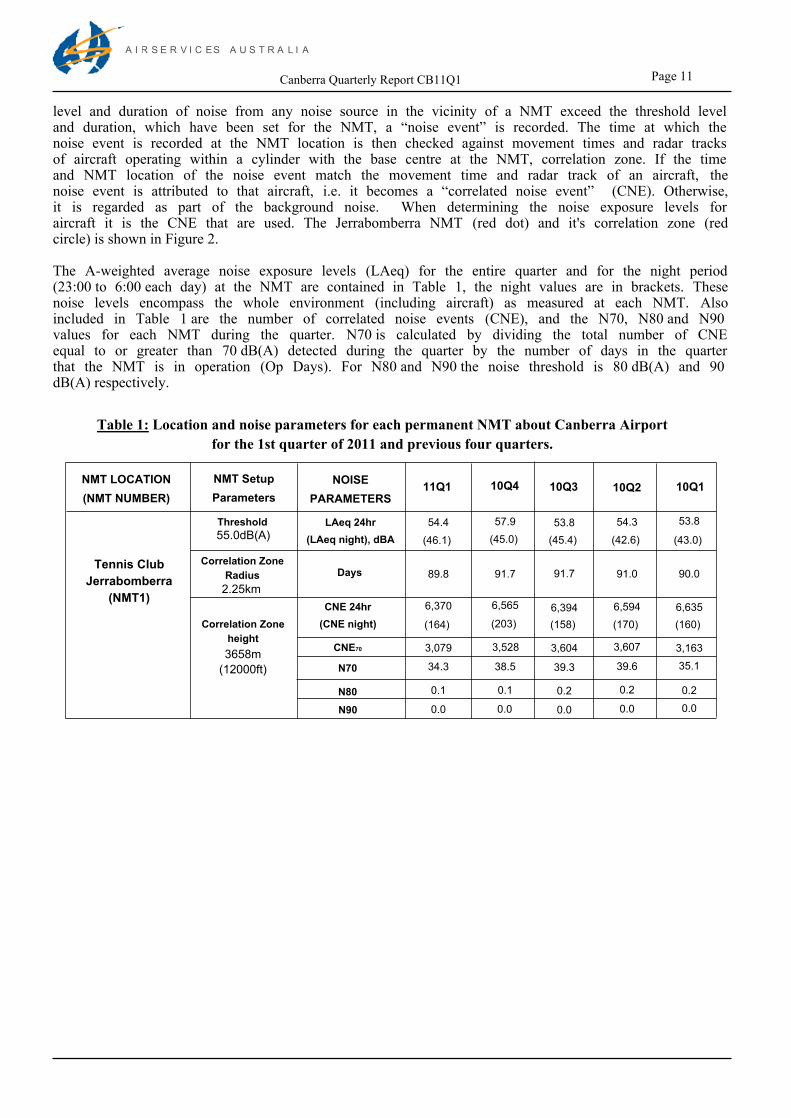
The A-weighted average noise exposure levels (LAeq) for the entire quarter and for the night period (23:00 to 6:00 each day) at the NMT are contained in Table 1, the night values are in brackets. These noise levels encompass the whole environment (including aircraft) as measured at each NMT. Also included in Table 1 are the number of correlated noise events (CNE), and the N70, N80 and N90 values for each NMT during the quarter. N70 is calculated by dividing the total number of CNE equal to or greater than 70 dB(A) detected during the quarter by the number of days in the quarter that the NMT is in operation (Op Days). For N80 and N90 the noise threshold is 80 dB(A) and 90 dB(A) respectively.
Table 1: Location and noise parameters for each permanent NMT about Canberra Airport
for the 1st quarter of 2011 and previous four quarters.
NOISE
PARAMETERS
NMT LOCATION
(NMT NUMBER)11Q1 10Q4 10Q110Q210Q3
NMT Setup
Parameters
54.4LAeq 24hr
(LAeq night), dBA (46.1)
0.0N90
Days
CNE70
CNE 24hr
(CNE night)
N70
N80 0.1
34.3
3,079
(164)
6,370
89.8Tennis Club
Jerrabomberra
(NMT1)
57.9 53.8 54.3 53.8
(45.0) (45.4) (42.6) (43.0)
91.7 91.7 91.0 90.0
6,565 6,394 6,594 6,635
(203) (158) (170) (160)
3,528 3,604 3,607 3,163
38.5 39.3 39.6 35.1
0.1
0.0
0.2
0.0
0.2
0.0
0.2
0.0
Threshold
Correlation Zone
height
Correlation Zone
Radius
2.25km
3658m
(12000ft)
55.0dB(A)
Page 12Canberra Quarterly Report CB11Q1
A I R S E R V I C E S A U S T R A L I A
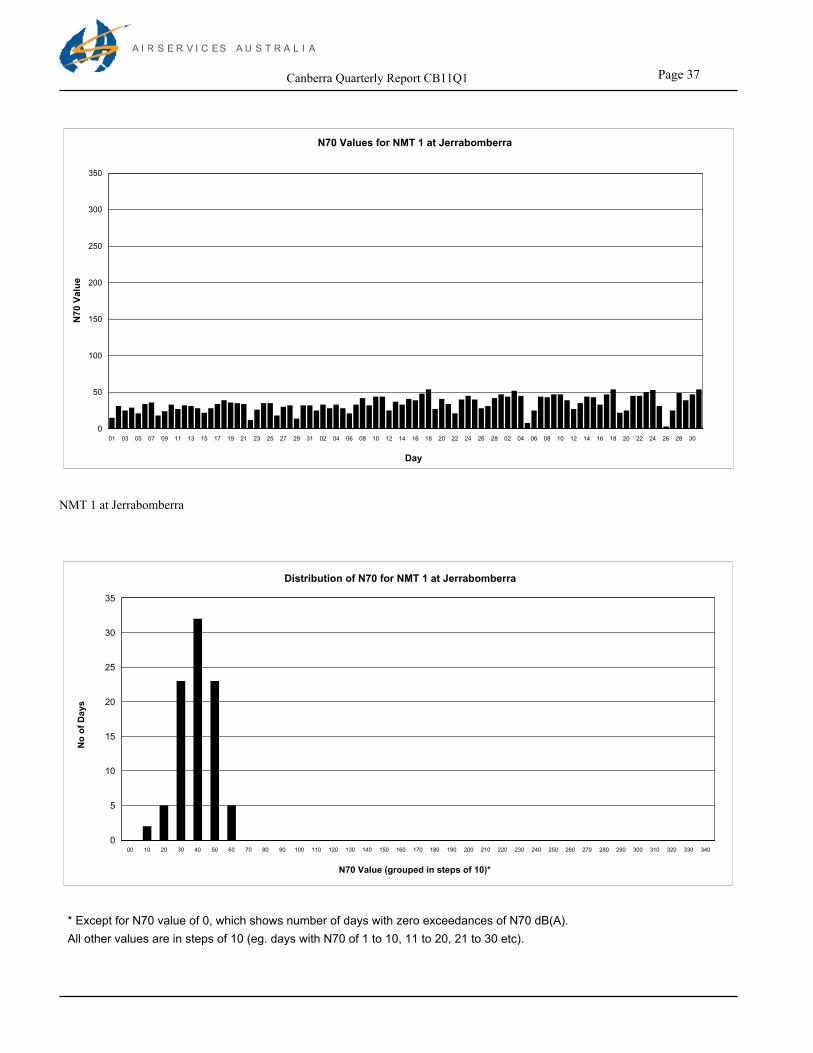
Appendix B includes graphs showing the daily value of N70 at the Jerrabomberra NMT excluding days where the NMT was not operational for a full 24 hours. In some cases the NMT may suffer a hardware outage, for example during routine maintenance. The caption under the graph details such outages for the NMT during the quarter. The distribution of N70 values is also included in Appendix B.
3. QUARTERLY TRACK DATA
3.1. Quarterly track density plots.
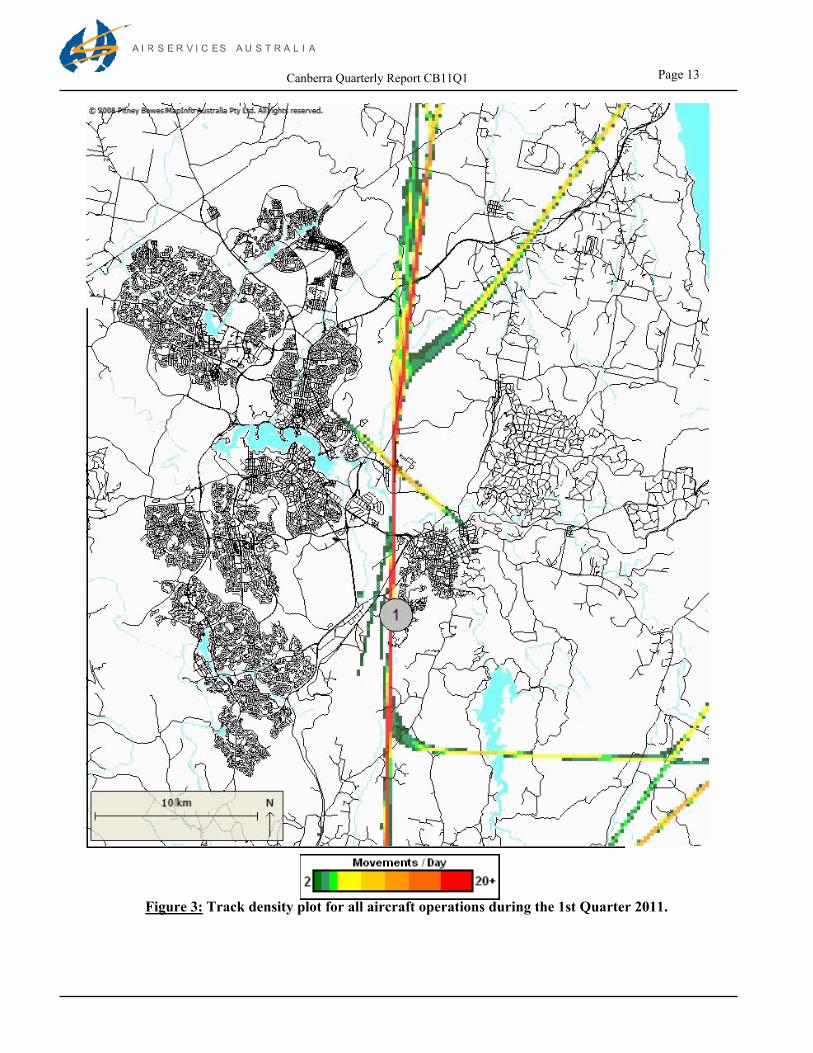
The quarterly track density plot is a map which displays the pattern of aircraft flight tracks passing over the region around the airport during the quarter. The system analyses the number of flights passing over each grid element of an array defined by the user. Grid elements of 200m x 200m have been adopted as a standard. The track density plot takes into account all aircraft and provides a useful indication of the general patterns of the flight operations.
Figure 3 shows the quarterly track density plot for all aircraft operations for the first quarter of 2011. The colour coding from green to red represents the range 180 to 1800 flight tracks (ie. 2 per day to 20 or more per day) over a grid element. If any grid element is not colour-coded, the number of aircraft flight tracks passing over that element during the quarter was less than 180, ie. less than 2 flights per day on average. The grey circles within Figure 3 show the location of each NMT.
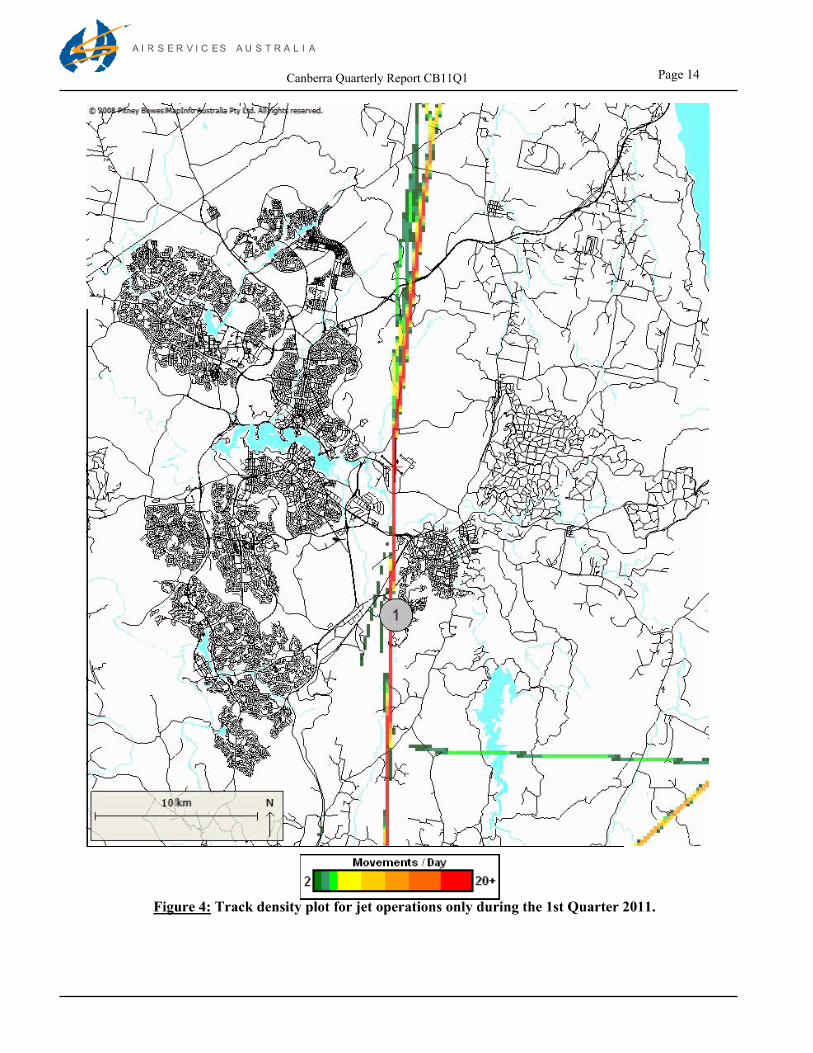
For comparison purposes, the quarterly track density plot for jet operations only for the quarter is shown in Figure 4.
Page 13Canberra Quarterly Report CB11Q1
A I R S E R V I C E S A U S T R A L I A
Figure 3: Track density plot for all aircraft operations during the 1st Quarter 2011.
Page 14Canberra Quarterly Report CB11Q1
A I R S E R V I C E S A U S T R A L I A
Figure 4: Track density plot for jet operations only during the 1st Quarter 2011.
Page 15Canberra Quarterly Report CB11Q1
A I R S E R V I C E S A U S T R A L I A
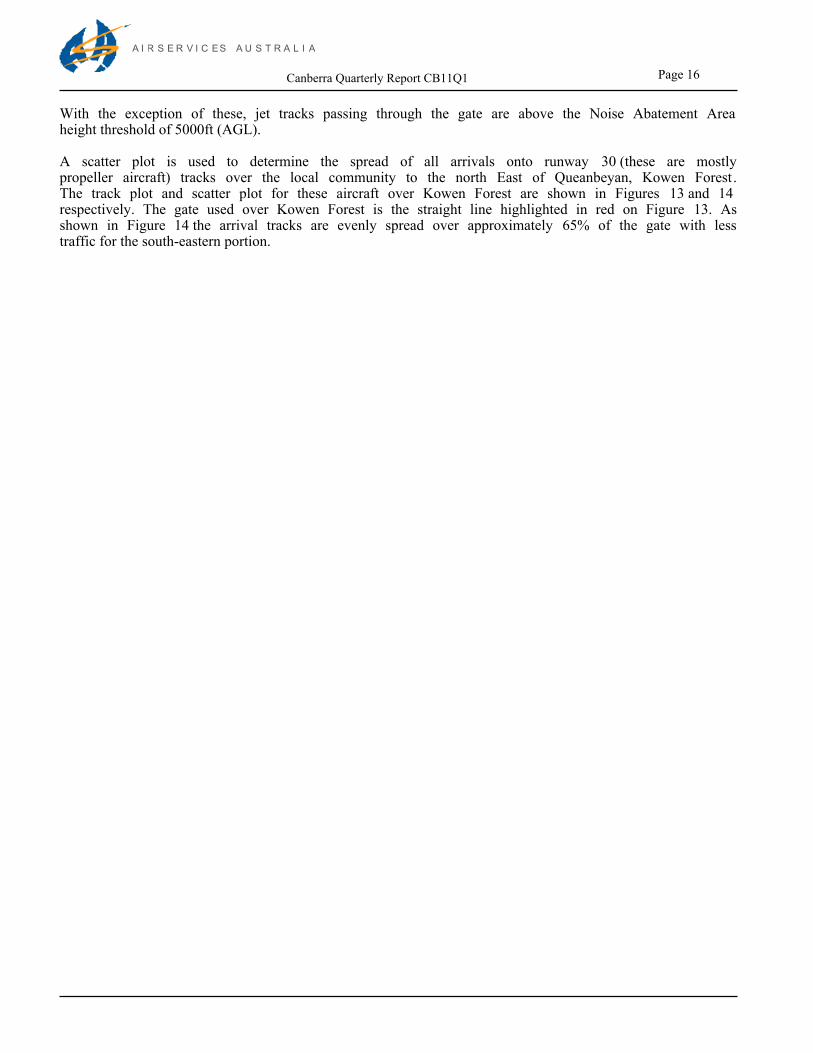
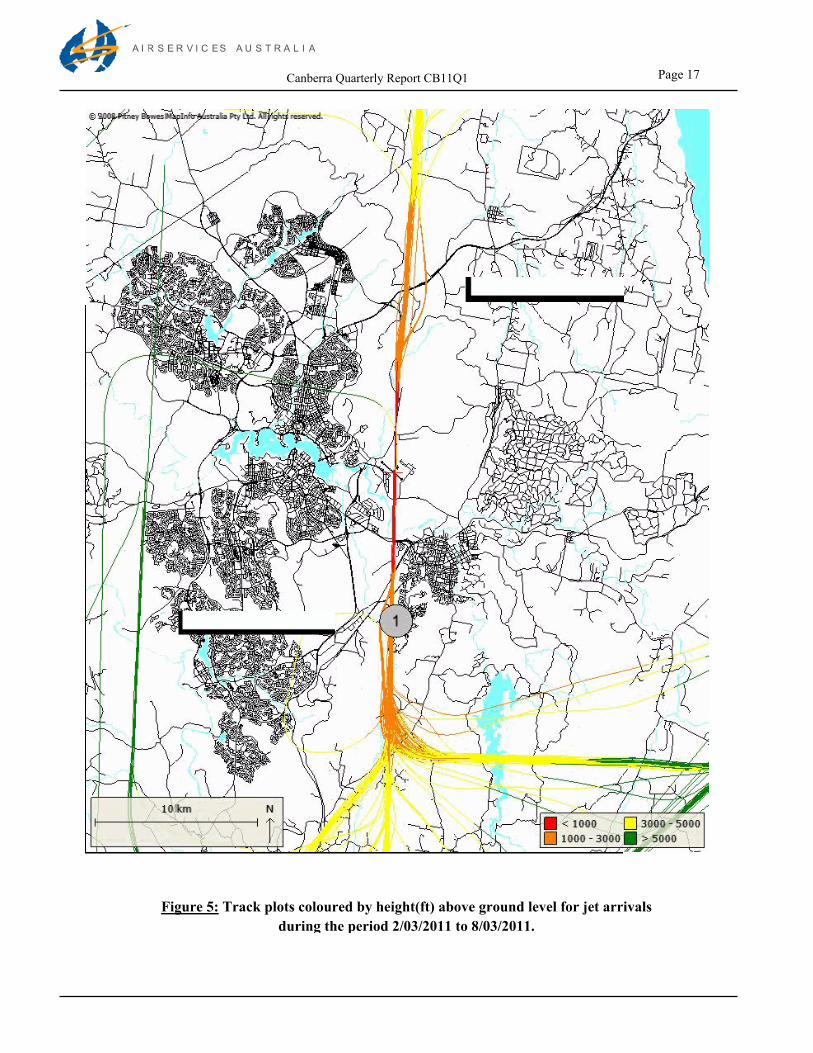
3.2. Jet track plots.
Plots of actual tracks for arrivals and departures of individual aircraft typse or groups can also be obtained from the system. Figures 5 and 6 show the track plots for jet arrivals and departures over the one-week period 2nd to 8th March 2011. These tracks have been coloured according to the aircraft height above ground level. Note that using the upgraded NFPMS, Figures 5 and 6 present track plots in height above ground level. This is slightly different to the previous system where track plots were presented in altitude (height above sea level). Canberra Airport is approximately 2000ft above mean sea level:
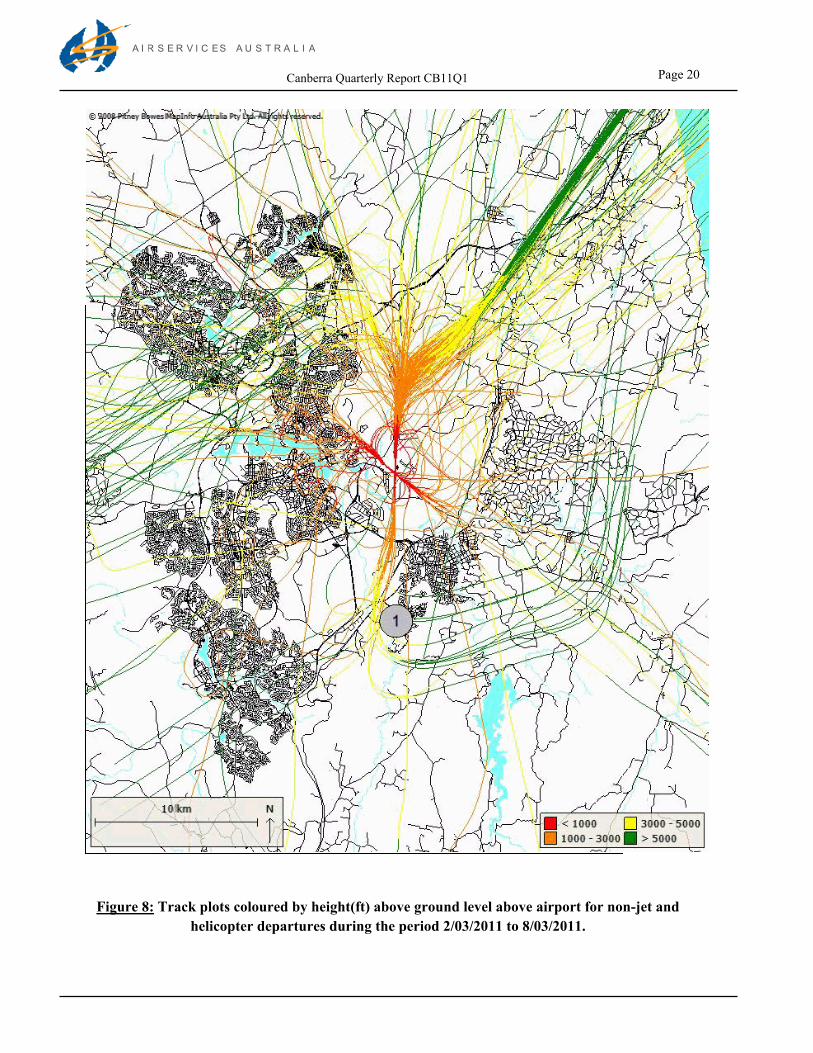
• Red when less than 1000ft• Orange between 1000ft and 3000ft• Yellow between 3000ft and 5000ft• Green above 5000ft.
These heights have been chosen in accordance with the criteria in the document “Environmental Principles and Procedures for Minimising the Impact of Aircraft Noise” produced by Environment Services Branch, Airservices Australia. This document can be found on the Airservices Australia's web site:www.airservicesaustralia.com/projectsservices/reports/
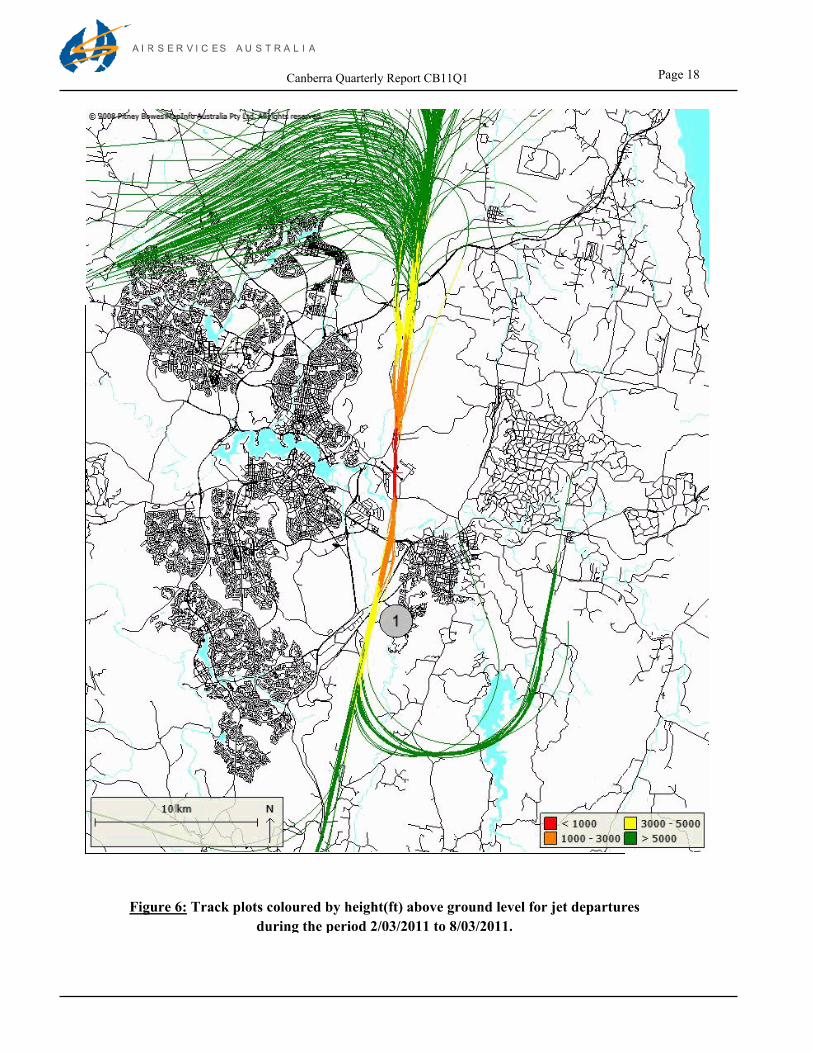
3.3. Non-Jet and helicopter track plots. Non-jet operations are principally the operations of propeller and turbo-prop aircraft. The track plots for the period 2nd to 8th March 2011 for arriving and departing non-jet aircraft and helicopters are shown in Figures 7 and 8 respectively. The same colour coding used for jet track plots is used in these figures. For both arrivals and departures by non-jets, the tracks disperse from the runway centrelines closer to the airport, to allow a clear path for jets, which are significantly faster.
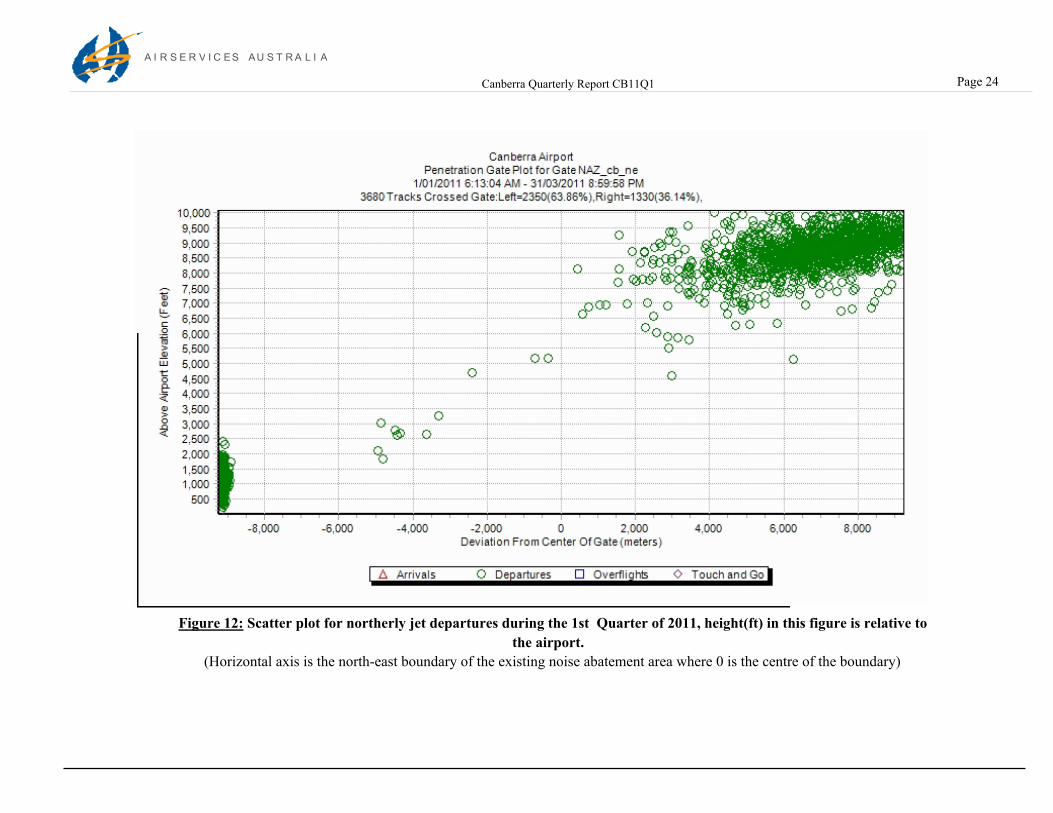
3.4. Scatter plots.
A scatter plot illustrates height, Above Ground Level (AGL) and horizontal dispersion of aircraft flight tracks when the aircraft pass through a predefined vertical gate in the airspace. Scatter plots are useful tools in detecting aircraft flights operating below a certain height.
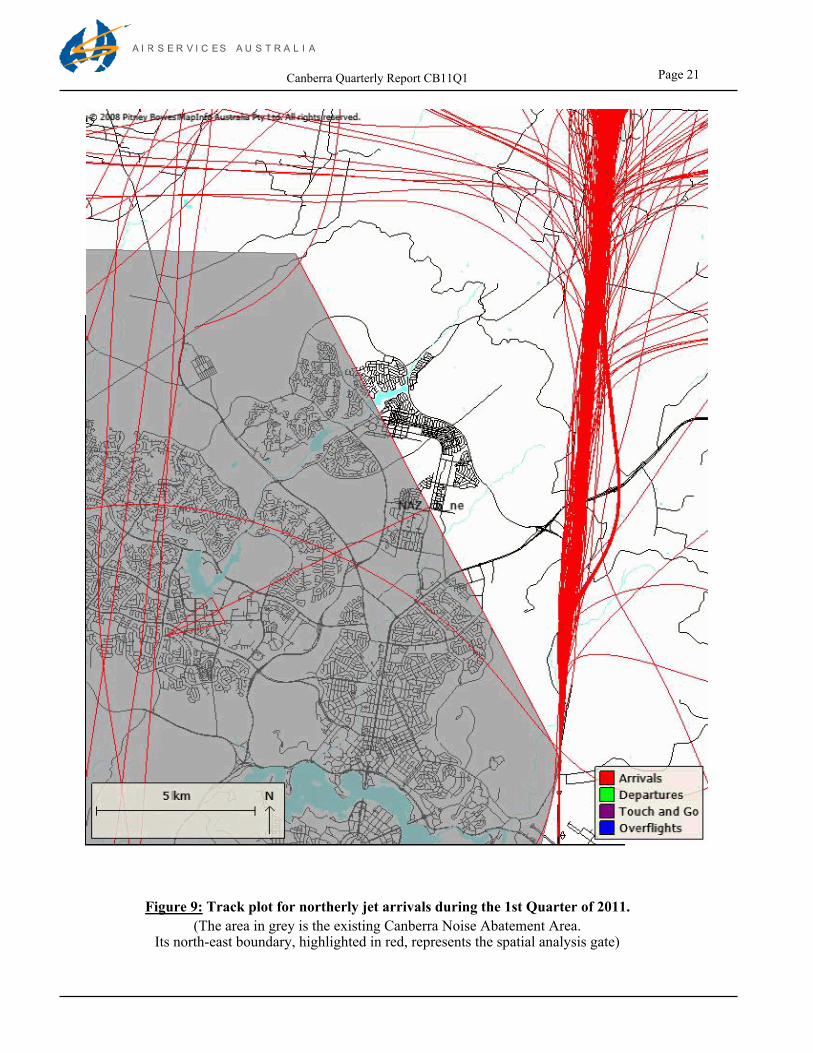
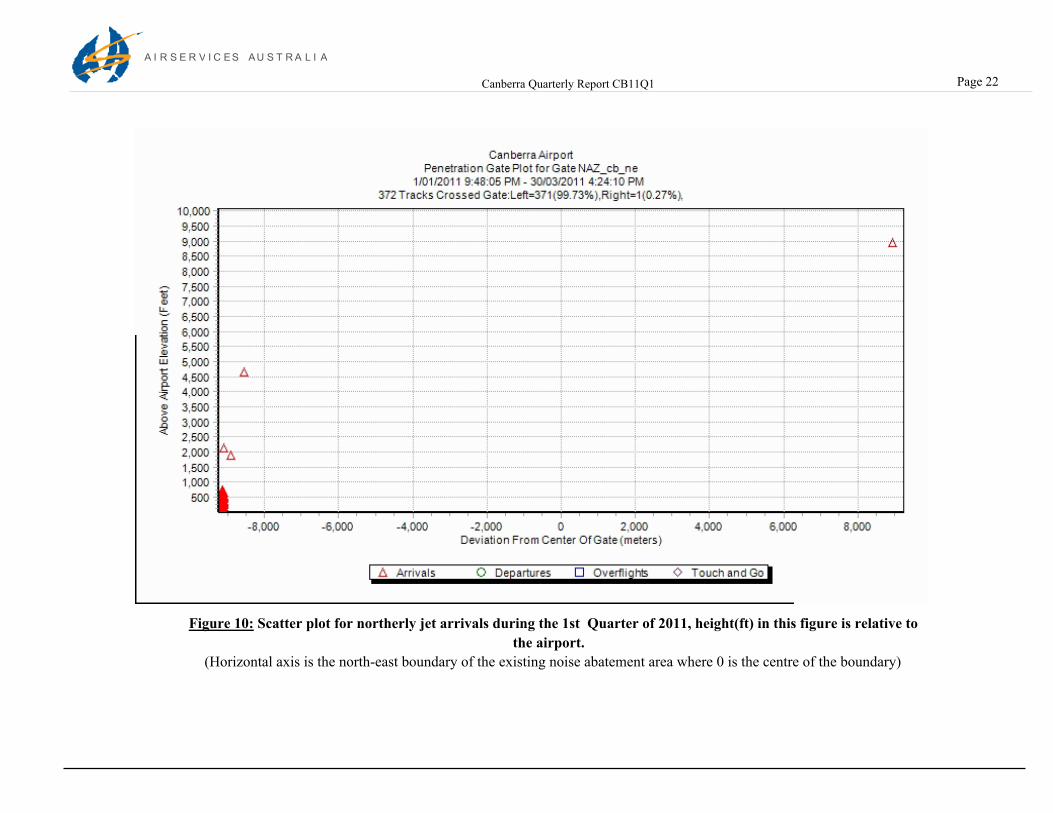
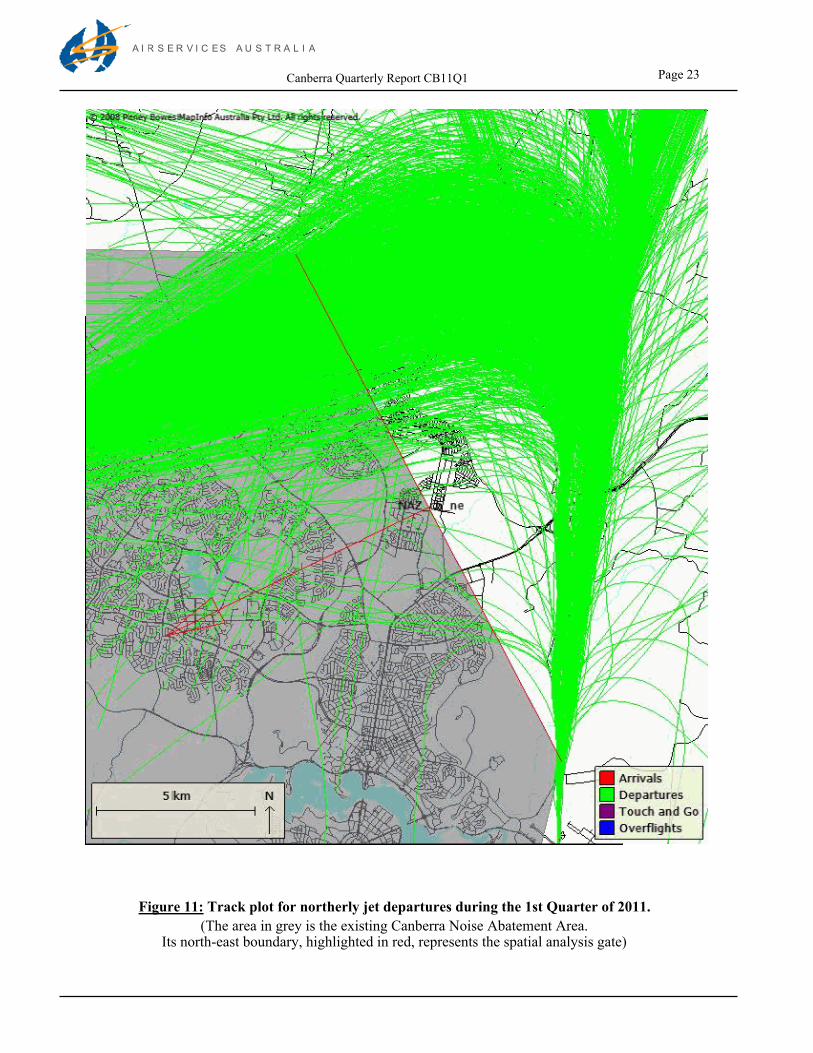
Scatter plots have been used in figures 10 and 12 used to analyse the height of jet aircraft as they pass over the Canberra Noise Abatement Area. The vertical gate used in generating these figures was aligned with the north-east boundary (high-lighted in red) of the Canberra Noise Abatement Area (as shown in Figure 9), and extends to a height of 10,000 feet (AGL). Figure 9 shows the track plot of northerly jet arrivals during the quarter and the scatter plot of these is shown in Figure 10. Similarly, the track plot and scatter plot of northerly jet departures during the quarter are shown in Figures 11 and 12. The large concentration of data points at the bottom left edge of these scatter graphs correspond to aircraft close to the runway and are strictly outside the Noise Abatement Area.
Page 16Canberra Quarterly Report CB11Q1
A I R S E R V I C E S A U S T R A L I A
With the exception of these, jet tracks passing through the gate are above the Noise Abatement Area height threshold of 5000ft (AGL).
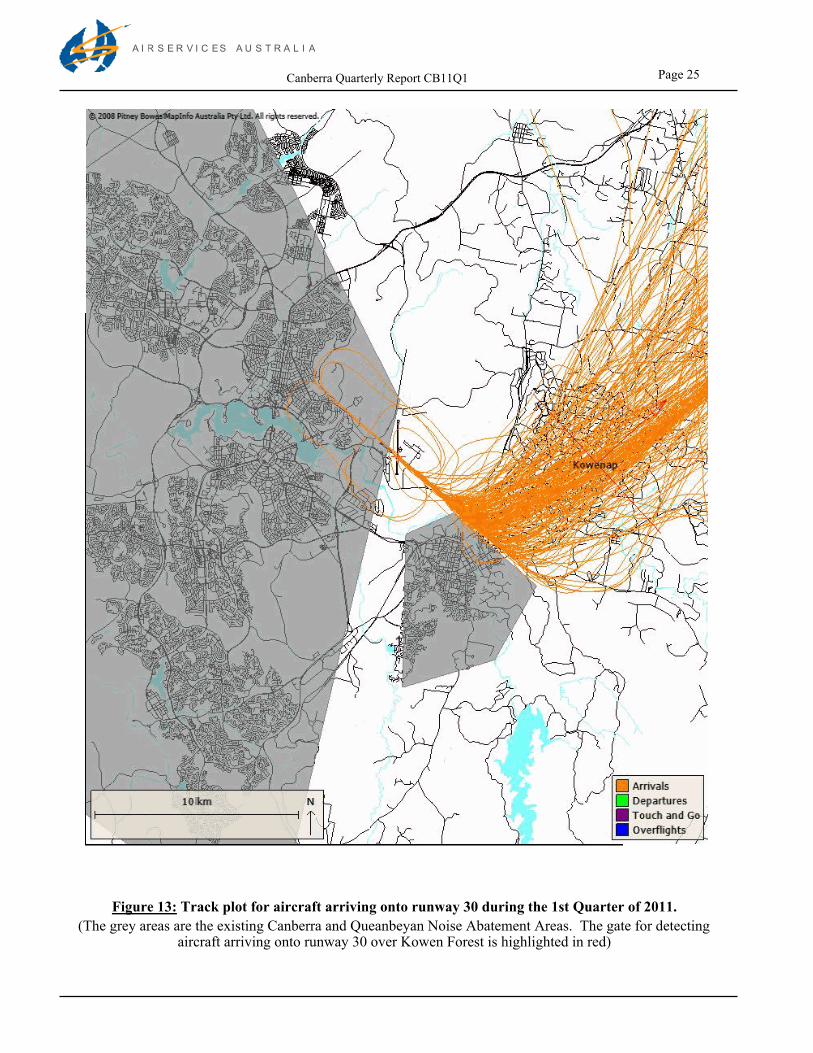
A scatter plot is used to determine the spread of all arrivals onto runway 30 (these are mostly propeller aircraft) tracks over the local community to the north East of Queanbeyan, Kowen Forest . The track plot and scatter plot for these aircraft over Kowen Forest are shown in Figures 13 and 14 respectively. The gate used over Kowen Forest is the straight line highlighted in red on Figure 13. As shown in Figure 14 the arrival tracks are evenly spread over approximately 65% of the gate with less traffic for the south-eastern portion.
Page 17Canberra Quarterly Report CB11Q1
A I R S E R V I C E S A U S T R A L I A
Figure 5: Track plots coloured by height(ft) above ground level for jet arrivals
during the period 2/03/2011 to 8/03/2011.
Page 18Canberra Quarterly Report CB11Q1
A I R S E R V I C E S A U S T R A L I A
Figure 6: Track plots coloured by height(ft) above ground level for jet departures
during the period 2/03/2011 to 8/03/2011.
Page 19Canberra Quarterly Report CB11Q1
A I R S E R V I C E S A U S T R A L I A
Figure 7: Track plots coloured by height(ft) above ground level for non-jet and helicopter
arrivals during the period 2/03/2011 to 8/03/2011.
Page 20Canberra Quarterly Report CB11Q1
A I R S E R V I C E S A U S T R A L I A
Figure 8: Track plots coloured by height(ft) above ground level above airport for non-jet and
helicopter departures during the period 2/03/2011 to 8/03/2011.
Page 21Canberra Quarterly Report CB11Q1
A I R S E R V I C E S A U S T R A L I A
Figure 9: Track plot for northerly jet arrivals during the 1st Quarter of 2011.
(The area in grey is the existing Canberra Noise Abatement Area. Its north-east boundary, highlighted in red, represents the spatial analysis gate)
A I R S E R V I C E S A U S T R A L I A
Canberra Quarterly Report CB11Q1 Page 22
Figure 10: Scatter plot for northerly jet arrivals during the 1st Quarter of 2011, height(ft) in this figure is relative to
the airport.(Horizontal axis is the north-east boundary of the existing noise abatement area where 0 is the centre of the boundary)
Page 23Canberra Quarterly Report CB11Q1
A I R S E R V I C E S A U S T R A L I A
Figure 11: Track plot for northerly jet departures during the 1st Quarter of 2011.
(The area in grey is the existing Canberra Noise Abatement Area. Its north-east boundary, highlighted in red, represents the spatial analysis gate)
A I R S E R V I C E S A U S T R A L I A
Canberra Quarterly Report CB11Q1 Page 24
Figure 12: Scatter plot for northerly jet departures during the 1st Quarter of 2011, height(ft) in this figure is relative to the airport.
(Horizontal axis is the north-east boundary of the existing noise abatement area where 0 is the centre of the boundary)
Page 25Canberra Quarterly Report CB11Q1
A I R S E R V I C E S A U S T R A L I A
Figure 13: Track plot for aircraft arriving onto runway 30 during the 1st Quarter of 2011.
(The grey areas are the existing Canberra and Queanbeyan Noise Abatement Areas. The gate for detecting aircraft arriving onto runway 30 over Kowen Forest is highlighted in red)

A I R S E R V I C E S A U S T R A L I A
Canberra Quarterly Report CB11Q1 Page 26
Figure 14: Scatter plot for aircraft arriving onto runway 30 over Kowen Forest during the 1st Quarter of 2011, height(ft)
in this figure is relative to ground level.
(Horizontal axis is the straight line (gate) crossing over Kowen Forest where 0 is the centre of the gate)
Page 27Canberra Quarterly Report CB11Q1
A I R S E R V I C E S A U S T R A L I A
4. AIRCRAFT MOVEMENT AND AIRCRAFT NOISE DATA
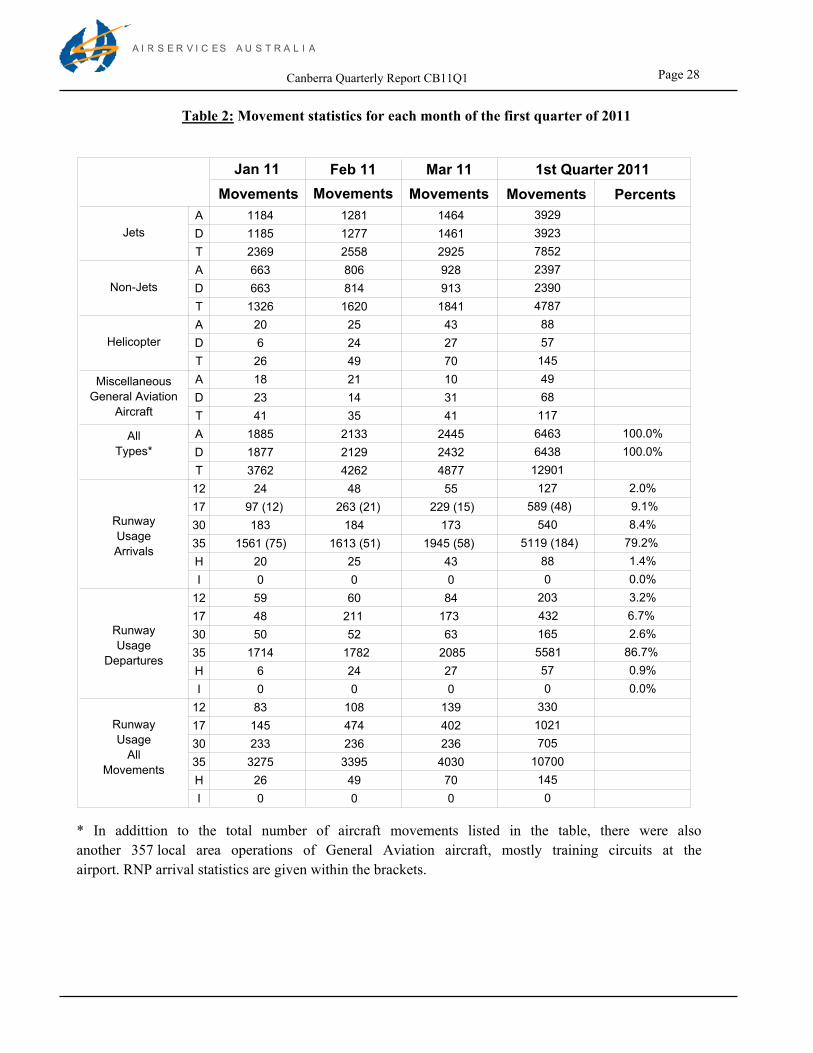
4.1. Movement statistics.
Movement statistics for Canberra Airport expressed in monthly figures are shown in Table 2. Explanations of the terms shown in Table 2 can be found in the Glossary section on Pages 7 and 8. The figures are based on The Australian Advanced Air Traffic System (TAAATS) data.
Table 2 also covers the runway usage for arrivals and departures individually and as a total for each runway. In Table 2 brackets are used to indicate the number of RNP arrivals onto runways 17 and 35. Although their flight tracks may be available in the NFPMS, TAAATS does not always provide operational details for movements by helicopters and light propeller-driven aircraft. This is the main reason that the Table 2 includes figures for operations by miscellaneous General Aviation aircraft, or aircraft with indeterminate runway (I).
The total number of monthly arrival (A) and departure (D) movements of all types (jets, non-jets and helicopters) at Canberra Airport for January was 3762, for February was 4262 and for March was 4877. The total number of arrival and departure movements for all aircraft types during the quarter was 12901.
Note that a training operation involving multiple circuits is counted by the system as a single movement, which may be arrival or departure. This is the reason that numbers of arrivals may differ from the corresponding numbers of departures. It is also the reason that movement numbers obtained from TAAATS data may differ from other ATC-sourced data.
There were also 357 local area operations of General Aviation aircraft recorded in the quarter by the NFPMS. Most of these operations performed multiple training circuits at the airport. Movement statistics for the previous four quarters are shown in Table 3. Note RNP movement numbers are within the brackets.
4.2. Night movement statistics.
Movement statistics for aircraft operating during the night hours (23:00 to 6:00) for Canberra Airport are shown in Table 4. The total number of movements during the night period in the first quarter of 2011 was 283. Movement figures for the previous four quarters are shown in Table 5.
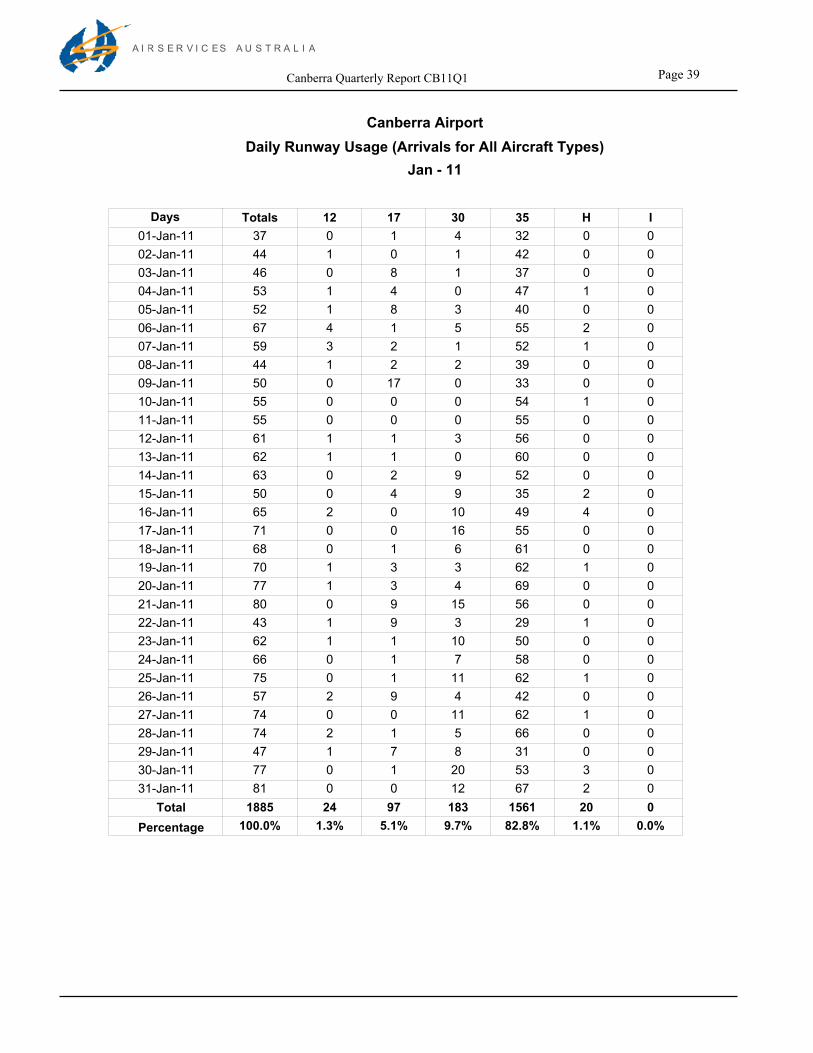
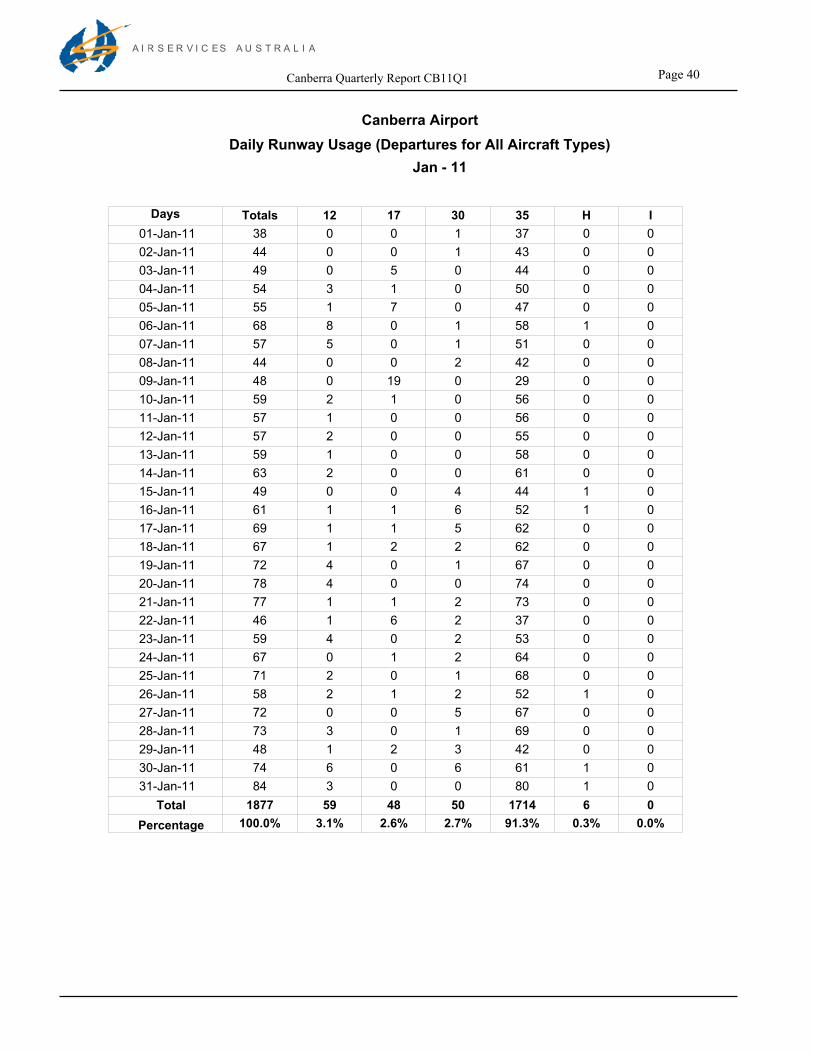
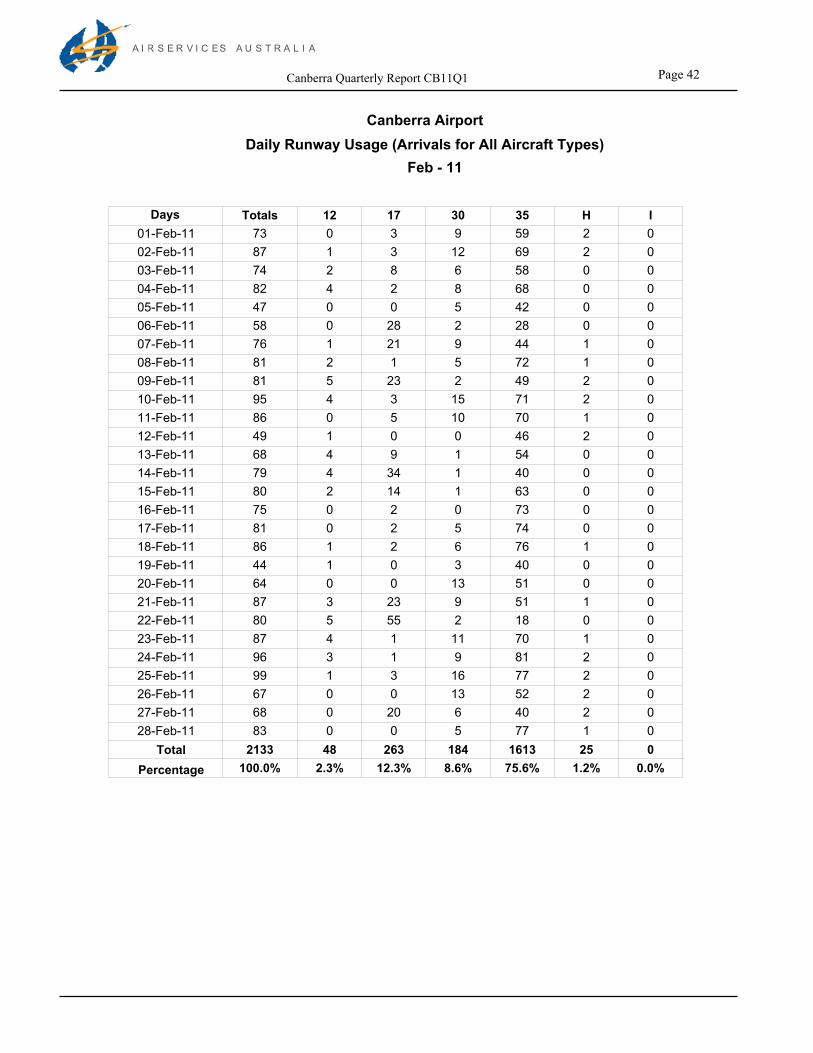
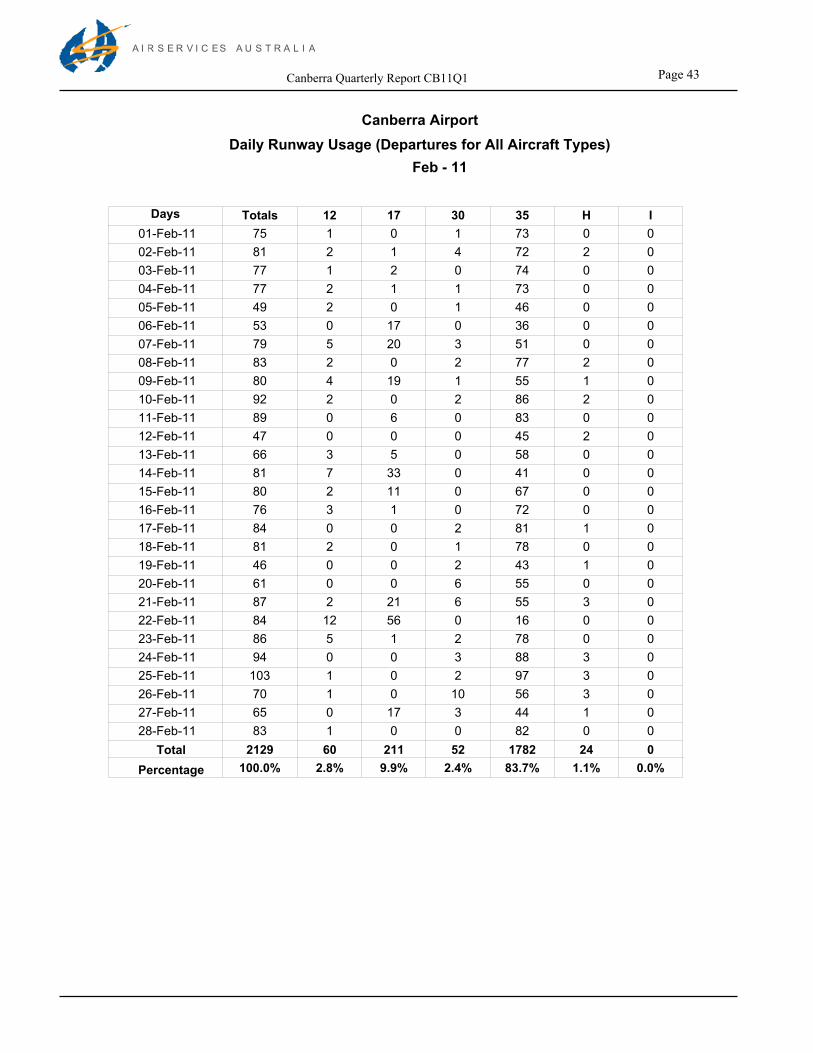
4.3. Daily runway usage per calendar month for arrivals and departures during the quarter.
The daily runway usage per calendar month for arrivals and departures of all aircraft types including jets, non-jets, helicopters and emergency aircraft during the quarter is shown in Appendix C in which the movement figures of aircraft arrivals and departures are counted separately and wholly per runway for each day of the calendar month for the quarter.
Page 28Canberra Quarterly Report CB11Q1
A I R S E R V I C E S A U S T R A L I A
Table 2: Movement statistics for each month of the first quarter of 2011
PercentsMovementsMovementsMovementsMovements
Jan 11 Feb 11 Mar 11 1st Quarter 2011
Jets
A 1184 1281 1464 3929
D 1185 1277 1461 3923
T 2369 2558 2925 7852
Non-Jets
A 663 806 928 2397
D 663 814 913 2390
T 1326 1620 1841 4787
Helicopter
A 20 25 43 88
D 6 24 27 57
T 26 49 70 145
Miscellaneous
General Aviation
Aircraft
A 18 21 10 49
D 23 14 31 68
T 41 35 41 117
All
Types*
A 1885 2133 2445 6463 100.0%
D 1877 2129 2432 6438 100.0%
T 3762 4262 4877 12901
Runway
Usage
Arrivals
12 24 48 55 127 2.0%
17 97 (12) 263 (21) 229 (15) 589 (48) 9.1%
30 183 184 173 540 8.4%
35 1561 (75) 1613 (51) 1945 (58) 5119 (184) 79.2%
H 20 25 43 88 1.4%
I 0 0 0 0 0.0%
Runway
Usage
Departures
12 59 60 84 203 3.2%
17 48 211 173 432 6.7%
30 50 52 63 165 2.6%
35 1714 1782 2085 5581 86.7%
H 6 24 27 57 0.9%
I 0 0 0 0 0.0%
Runway
Usage
All
Movements
12 83 108 139 330
17 145 474 402 1021
30 233 236 236 705
35 3275 3395 4030 10700
H 26 49 70 145
I 0 0 0 0
* In addittion to the total number of aircraft movements listed in the table, there were also
another 357 local area operations of General Aviation aircraft, mostly training circuits at the
airport. RNP arrival statistics are given within the brackets.
A I R S E R V I C E S A U S T R A L I A
Canberra Quarterly Report CB11Q1 Page 29
Table 3: Movement statistics for the previous four quarters
4th Quarter 2010
Movements Percents Movements PercentsMovements Percents PercentsMovements
3rd Quarter 2010 2nd Quarter 2010 1st Quarter 2010
Jets
A 415342964123 4062
D 414942944122 4062
T 830285908245 8124
Non-Jets
A 286523612512 2574
D 287023522522 2565
T 573547135034 5139
Helicopter
A 6368116 52
D 564472 43
T 119112188 95
Miscellaneous
General
Aviation
A 6911038 102
D 8112950 89
T 15023988 191
All Types
A 100.0% 100.0% 100.0% 100.0% 715068356789 6790
D 100.0% 100.0% 100.0% 100.0% 715668196766 6759
T 143061365413555 13549
Runway
Usage
Arrivals
12 2.5% 2.4% 1.3% 1.3% 1748989 170
17 19.3% 17.7% 10.5% 9.1% 1262 (99)715 (76)621 (32) 1308 (126)
30 9.8% 10.9% 10.5% 8.5% 779721576 666
35 67.7% 68.1% 76.7% 79.3% 4872 (297)5242 (315)5387 (180) 4594 (245)
H 0.8% 0.9% 1.0% 1.7% 6368116 52
I 0.0% 0.0% 0.0% 0.0% 000 0
Runway
Usage
Departures
12 4.1% 4.4% 2.8% 2.1% 313190140 278
17 16.9% 14.0% 7.5% 7.1% 999514482 1144
30 3.1% 3.2% 3.4% 2.8% 230233190 210
35 75.2% 77.7% 85.6% 86.9% 555858385882 5084
H 0.6% 0.8% 0.6% 1.1% 564472 43
I 0.0% 0.0% 0.0% 0.0% 000 0
Runway
Usage All
Movements
12 487279229 448
17 226112291103 2452
30 1009954766 876
35 104301108011269 9678
H 119112188 95
I 000 0

Page 30Canberra Quarterly Report CB11Q1
A I R S E R V I C E S A U S T R A L I A
Table 4: Night movement statistics for each month of the first quarter of 2011
PercentsMovementsMovementsMovementsMovements
Jan 11 Feb 11 Mar 11 1st Quarter 2011
Jets
A 27 38 36 101
D 3 4 8 15
T 30 42 44 116
Non-Jets
A 40 39 41 120
D 11 12 13 36
T 51 51 54 156
Helicopter
A 0 1 0 1
D 0 1 1 2
T 0 2 1 3
Miscellaneous
General Aviation
Aircraft
A 0 5 3 8
D 0 0 0 0
T 0 5 3 8
All
Types*
A 67 83 80 230 100.0%
D 14 17 22 53 100.0%
T 81 100 102 283
Runway
Usage
Arrivals
12 1 1 0 2 0.9%
17 20 30 23 73 31.7%
30 3 2 6 11 4.8%
35 43 49 51 143 62.2%
H 0 1 0 1 0.4%
I 0 0 0 0 0.0%
Runway
Usage
Departures
12 0 0 0 0 0.0%
17 1 5 2 8 15.1%
30 0 0 0 0 0.0%
35 13 11 19 43 81.1%
H 0 1 1 2 3.8%
I 0 0 0 0 0.0%
Runway
Usage
All
Movements
12 1 1 0 2
17 21 35 25 81
30 3 2 6 11
35 56 60 70 186
H 0 2 1 3
I 0 0 0 0
* Take offs and landings preferentially use runways 17 and 35.
A I R S E R V I C E S A U S T R A L I A
Canberra Quarterly Report CB11Q1 Page 31
Table 5: Night movement statistics for the previous four quarters
4th Quarter 2010
Movements Percents Movements PercentsMovements Percents PercentsMovements
3rd Quarter 2010 2nd Quarter 2010 1st Quarter 2010
Jets
A 101 121 108 111
D 9 23 7 11
T 110 144 115 122
Non-Jets
A 117 142 142 119
D 24 23 31 27
T 141 165 173 146
Helicopter
A 0 2 0 0
D 0 1 0 0
T 0 3 0 0
Miscellaneous
General
Aviation
A 4 9 8 7
D 2 7 0 2
T 6 16 8 9
All Types
A 100.0% 100.0% 100.0% 100.0% 222 274 258 237
D 100.0% 100.0% 100.0% 100.0% 35 54 38 40
T 257 328 296 277
Runway
Usage
Arrivals
12 0.0% 0.8% 0.5% 0.7% 1 2 2 0
17 42.6% 37.6% 29.7% 34.7% 66 95 97 101
30 3.0% 1.9% 5.4% 2.2% 12 6 5 7
35 54.4% 59.7% 64.4% 61.7% 143 169 154 129
H 0.0% 0.0% 0.0% 0.7% 0 2 0 0
I 0.0% 0.0% 0.0% 0.0% 0 0 0 0
Runway
Usage
Departures
12 10.0% 7.9% 0.0% 7.4% 0 4 3 4
17 10.0% 7.9% 11.4% 7.4% 4 4 3 4
30 0.0% 0.0% 0.0% 0.0% 0 0 0 0
35 80.0% 84.2% 88.6% 83.3% 31 45 32 32
H 0.0% 0.0% 0.0% 1.9% 0 1 0 0
I 0.0% 0.0% 0.0% 0.0% 0 0 0 0
Runway
Usage All
Movements
12 1 6 5 4
17 70 99 100 105
30 12 6 5 7
35 174 214 186 161
H 0 3 0 0
I 0 0 0 0
Page 32Canberra Quarterly Report CB11Q1
A I R S E R V I C E S A U S T R A L I A
4.4. Hourly movements per calendar month for arrivals and departures during the quarter.
The hourly movements per calendar month of the quarter for all aircraft movements operating in and out of the airport including helicopters and emergency aircraft are shown in Appendix D. The data in Appendix D are calculated for whole clock hours within the day.
4.5. Quarterly aircraft average noise levels.
Appendix E presents a summary of movement numbers and noise levels recorded over the quarter for jet and non-jet aircraft types. It shows the actual movements and the correlated noise events of aircraft types operating on specific runways together with the average maximum sound pressure levels and standard deviations of the maxima for overflights by each type at each NMT. The terms used in the data output are explained in the Glossary. The data is sorted in order of descending maximum sound pressure levels.
4.6. Data included in Appendix E.
It may be noted in Appendix E that in some cases there is a difference between the reported number of aircraft movements and the number of correlated noise events.
A noise event occurs when a noise being measured at an NMT stays above a preset level for a preset time duration. When that condition occurs, the NFPMS looks at the radar input to see whether there is an aircraft track within a preset radius around the NMT location. If there is, the noise event is correlated with that aircraft track and registered as a correlated noise event.
Differences between the number of aircraft movements and the number of correlated noise events may be due to the following:
(i) For aircraft operations which are not relatively close to the NMT location, the noise levels received from the aircraft may be below the event threshold level. This results in less correlated noise events than actual aircraft movements.
(ii) Noise events may not be correlated with aircraft tracks due to radar system downtime or transponders on the aircraft being turned off. This also results in less correlated noise events than actual aircraft movements.
(iii) In some cases, extraneous noise events caused by sources other than aircraft occur concurrently with an aircraft operation, and are coincidentally correlated with an aircraft track in the vicinity of the NMT. This may result in more correlated noise events than actual aircraft movements.
For larger data samples, the absence or mistaken identity of some noise events will have minimal effect on the mean data presented in the report. Data for small sample sizes may however not be truly representative. A minimum total of six over flights have been used to establish a mean noise level. As a result, it should be noted that with this small sample size the mean noise level can be viewed as being less accurate.
Page 33Canberra Quarterly Report CB11Q1
A I R S E R V I C E S A U S T R A L I A
APPENDIX A
An overview of the Noise and Flight Path Monitoring System
Page 34Canberra Quarterly Report CB11Q1
A I R S E R V I C E S A U S T R A L I A
A. SYSTEM OVERVIEW
A.1. System configuration and features.
The NFPMS is the world's largest, most geographically-spread system of its type. The complete system is operated and controlled from AA Head Office in Canberra.
Around each of the airports are a number of noise monitoring terminals (NMTs). The NMT basically consists of a microphone, atop a mast of 6m height, and an electronics box. The noise level to which the microphone is exposed over the range 30 to 130 dB(A) is continuously measured and then transmitted, via a data line, to the NFPMS central computer where it is processed and stored for later analysis. Apart from measuring the aircraft noise, the NMT also continuously monitors the background noise levels.
Through the TAAATS system, the NFPMS acquires flight track and operational information on aircraft operating in and out of the airport.
On a map display for each airport, the system displays the noise levels measured by each of the NMTs and the flight tracks of the aircraft in the vicinity of the airport.
When the level and duration of noise from any noise source in the vicinity of an NMT exceed the threshold level and duration which have been set for the NMT, a "noise event" is recorded. The time at which the noise event is recorded at the NMT location is then checked against movement times and radar tracks of aircraft operating in the vicinity. If the time and NMT location of the noise event match the movement time and radar track of an aircraft, the noise event is attributed to that aircraft , i.e. it becomes a “correlated noise event”. Otherwise, it is regarded as part of the background noise.
The incoming data is stored in the central computer and can be recalled to display the tracks flown by any user selection of aircraft operations, together with the noise levels which those operations produced at the NMTs. The track information includes aircraft identity, altitude and speed.
The system includes statistical and acoustical software to undertake analyses of noise or flight track information as required by the user.
Automatically and regularly, the NFPMS produces reports that contain tabular and graphical summaries of noise and aircraft movement data for each airport over selected time periods.
The system includes the capability to analyse aircraft tracks, by selecting and listing the tracks which have passed through defined windows and corridors. The analysis can be selective, e.g. on specification of aircraft type or the route being flown.
Page 35Canberra Quarterly Report CB11Q1
A I R S E R V I C E S A U S T R A L I A
A.2. System applications.
The NFPMS collects noise and flight path data 24 hours a day, seven days per week. It also accumulates flight plan and weather data.
The information collected is used by AA to:
• determine the contribution of aircraft to overall noise exposure;
• detect occurrences of excessive noise levels from aircraft operations;
• assess the effects of operational and administrative procedures for noise control and compliance with these procedures;
• assist in planning of airspace usage;
• validate noise forecasts and forecasting techniques;
• assist relevant authorities in land-use planning for developments on areas in the vicinity of an airport;
• provide reports to, and responses to questions from, Government and other Members of Parliament, industry organisations, airport owners, community groups and individuals; and
• assist in answering noise complaints about aircraft operations from the general public.
Page 36Canberra Quarterly Report CB11Q1
A I R S E R V I C E S A U S T R A L I A
APPENDIX B
Daily value of N70 and N70 distribution for each NMT
during the period January to March 2011
Page 37Canberra Quarterly Report CB11Q1
A I R S E R V I C E S A U S T R A L I A
0
50
100
150
200
250
300
350
01 03 05 07 09 11 13 15 17 19 21 23 25 27 29 31 02 04 06 08 10 12 14 16 18 20 22 24 26 28 02 04 06 08 10 12 14 16 18 20 22 24 26 28 30
Day
N70 V
alu
e
N70 Values for NMT 1 at Jerrabomberra
NMT 1 at Jerrabomberra
0
5
10
15
20
25
30
35
00 10 20 30 40 50 60 70 80 90 100 110 120 130 140 150 160 170 180 190 200 210 220 230 240 250 260 270 280 290 300 310 320 330 340
N70 Value (grouped in steps of 10)*
No
of
Days
Distribution of N70 for NMT 1 at Jerrabomberra
* Except for N70 value of 0, which shows number of days with zero exceedances of N70 dB(A).
All other values are in steps of 10 (eg. days with N70 of 1 to 10, 11 to 20, 21 to 30 etc).

Page 38Canberra Quarterly Report CB11Q1
A I R S E R V I C E S A U S T R A L I A
APPENDIX C
Daily runway usage per calendar month for arrivals and departures
during the period January to March 2011
Page 39Canberra Quarterly Report CB11Q1
A I R S E R V I C E S A U S T R A L I A
Totals 12 17 30 35 H I
01-Jan-11 37 0 1 4 32 0 0
02-Jan-11 44 1 0 1 42 0 0
03-Jan-11 46 0 8 1 37 0 0
04-Jan-11 53 1 4 0 47 1 0
05-Jan-11 52 1 8 3 40 0 0
06-Jan-11 67 4 1 5 55 2 0
07-Jan-11 59 3 2 1 52 1 0
08-Jan-11 44 1 2 2 39 0 0
09-Jan-11 50 0 17 0 33 0 0
10-Jan-11 55 0 0 0 54 1 0
11-Jan-11 55 0 0 0 55 0 0
12-Jan-11 61 1 1 3 56 0 0
13-Jan-11 62 1 1 0 60 0 0
14-Jan-11 63 0 2 9 52 0 0
15-Jan-11 50 0 4 9 35 2 0
16-Jan-11 65 2 0 10 49 4 0
17-Jan-11 71 0 0 16 55 0 0
18-Jan-11 68 0 1 6 61 0 0
19-Jan-11 70 1 3 3 62 1 0
20-Jan-11 77 1 3 4 69 0 0
21-Jan-11 80 0 9 15 56 0 0
22-Jan-11 43 1 9 3 29 1 0
23-Jan-11 62 1 1 10 50 0 0
24-Jan-11 66 0 1 7 58 0 0
25-Jan-11 75 0 1 11 62 1 0
26-Jan-11 57 2 9 4 42 0 0
27-Jan-11 74 0 0 11 62 1 0
28-Jan-11 74 2 1 5 66 0 0
29-Jan-11 47 1 7 8 31 0 0
30-Jan-11 77 0 1 20 53 3 0
31-Jan-11 81 0 0 12 67 2 0
Total
Percentage
1885
100.0%
24
1.3%
97
5.1%
183
9.7%
1561
82.8%
20
1.1%
0
0.0%
Days
Daily Runway Usage (Arrivals for All Aircraft Types)
Jan - 11
Canberra Airport
Page 40Canberra Quarterly Report CB11Q1
A I R S E R V I C E S A U S T R A L I A
Days
Daily Runway Usage (Departures for All Aircraft Types)
Jan - 11
Canberra Airport
Totals 12 17 30 35 H I
01-Jan-11 38 0 0 1 37 0 0
02-Jan-11 44 0 0 1 43 0 0
03-Jan-11 49 0 5 0 44 0 0
04-Jan-11 54 3 1 0 50 0 0
05-Jan-11 55 1 7 0 47 0 0
06-Jan-11 68 8 0 1 58 1 0
07-Jan-11 57 5 0 1 51 0 0
08-Jan-11 44 0 0 2 42 0 0
09-Jan-11 48 0 19 0 29 0 0
10-Jan-11 59 2 1 0 56 0 0
11-Jan-11 57 1 0 0 56 0 0
12-Jan-11 57 2 0 0 55 0 0
13-Jan-11 59 1 0 0 58 0 0
14-Jan-11 63 2 0 0 61 0 0
15-Jan-11 49 0 0 4 44 1 0
16-Jan-11 61 1 1 6 52 1 0
17-Jan-11 69 1 1 5 62 0 0
18-Jan-11 67 1 2 2 62 0 0
19-Jan-11 72 4 0 1 67 0 0
20-Jan-11 78 4 0 0 74 0 0
21-Jan-11 77 1 1 2 73 0 0
22-Jan-11 46 1 6 2 37 0 0
23-Jan-11 59 4 0 2 53 0 0
24-Jan-11 67 0 1 2 64 0 0
25-Jan-11 71 2 0 1 68 0 0
26-Jan-11 58 2 1 2 52 1 0
27-Jan-11 72 0 0 5 67 0 0
28-Jan-11 73 3 0 1 69 0 0
29-Jan-11 48 1 2 3 42 0 0
30-Jan-11 74 6 0 6 61 1 0
31-Jan-11 84 3 0 0 80 1 0
Total
Percentage
1877
100.0%
59
3.1%
48
2.6%
50
2.7%
1714
91.3%
6
0.3%
0
0.0%

Page 41Canberra Quarterly Report CB11Q1
A I R S E R V I C E S A U S T R A L I A
Days Totals 12 17 30 35 H I
01-Jan-11 75 0 1 5 69 0 0
02-Jan-11 88 1 0 2 85 0 0
03-Jan-11 95 0 13 1 81 0 0
04-Jan-11 107 4 5 0 97 1 0
05-Jan-11 107 2 15 3 87 0 0
06-Jan-11 135 12 1 6 113 3 0
07-Jan-11 116 8 2 2 103 1 0
08-Jan-11 88 1 2 4 81 0 0
09-Jan-11 98 0 36 0 62 0 0
10-Jan-11 114 2 1 0 110 1 0
11-Jan-11 112 1 0 0 111 0 0
12-Jan-11 118 3 1 3 111 0 0
13-Jan-11 121 2 1 0 118 0 0
14-Jan-11 126 2 2 9 113 0 0
15-Jan-11 99 0 4 13 79 3 0
16-Jan-11 126 3 1 16 101 5 0
17-Jan-11 140 1 1 21 117 0 0
18-Jan-11 135 1 3 8 123 0 0
19-Jan-11 142 5 3 4 129 1 0
20-Jan-11 155 5 3 4 143 0 0
21-Jan-11 157 1 10 17 129 0 0
22-Jan-11 89 2 15 5 66 1 0
23-Jan-11 121 5 1 12 103 0 0
24-Jan-11 133 0 2 9 122 0 0
25-Jan-11 146 2 1 12 130 1 0
26-Jan-11 115 4 10 6 94 1 0
27-Jan-11 146 0 0 16 129 1 0
28-Jan-11 147 5 1 6 135 0 0
29-Jan-11 95 2 9 11 73 0 0
30-Jan-11 151 6 1 26 114 4 0
31-Jan-11 165 3 0 12 147 3 0
Total
Percentage
3762
100.0%
83
2.2%
145
3.9%
233
6.2%
3275
87.1%
26
0.7%
0
0.0%
Daily Runway Usage (Arrivals and Departures for All Aircraft Types)
Jan - 11
Canberra Airport
Page 42Canberra Quarterly Report CB11Q1
A I R S E R V I C E S A U S T R A L I A
Totals 12 17 30 35 H I
01-Feb-11 73 0 3 9 59 2 0
02-Feb-11 87 1 3 12 69 2 0
03-Feb-11 74 2 8 6 58 0 0
04-Feb-11 82 4 2 8 68 0 0
05-Feb-11 47 0 0 5 42 0 0
06-Feb-11 58 0 28 2 28 0 0
07-Feb-11 76 1 21 9 44 1 0
08-Feb-11 81 2 1 5 72 1 0
09-Feb-11 81 5 23 2 49 2 0
10-Feb-11 95 4 3 15 71 2 0
11-Feb-11 86 0 5 10 70 1 0
12-Feb-11 49 1 0 0 46 2 0
13-Feb-11 68 4 9 1 54 0 0
14-Feb-11 79 4 34 1 40 0 0
15-Feb-11 80 2 14 1 63 0 0
16-Feb-11 75 0 2 0 73 0 0
17-Feb-11 81 0 2 5 74 0 0
18-Feb-11 86 1 2 6 76 1 0
19-Feb-11 44 1 0 3 40 0 0
20-Feb-11 64 0 0 13 51 0 0
21-Feb-11 87 3 23 9 51 1 0
22-Feb-11 80 5 55 2 18 0 0
23-Feb-11 87 4 1 11 70 1 0
24-Feb-11 96 3 1 9 81 2 0
25-Feb-11 99 1 3 16 77 2 0
26-Feb-11 67 0 0 13 52 2 0
27-Feb-11 68 0 20 6 40 2 0
28-Feb-11 83 0 0 5 77 1 0
Total
Percentage
2133
100.0%
48
2.3%
263
12.3%
184
8.6%
1613
75.6%
25
1.2%
0
0.0%
Days
Daily Runway Usage (Arrivals for All Aircraft Types)
Feb - 11
Canberra Airport
Page 43Canberra Quarterly Report CB11Q1
A I R S E R V I C E S A U S T R A L I A
Days
Daily Runway Usage (Departures for All Aircraft Types)
Feb - 11
Canberra Airport
Totals 12 17 30 35 H I
01-Feb-11 75 1 0 1 73 0 0
02-Feb-11 81 2 1 4 72 2 0
03-Feb-11 77 1 2 0 74 0 0
04-Feb-11 77 2 1 1 73 0 0
05-Feb-11 49 2 0 1 46 0 0
06-Feb-11 53 0 17 0 36 0 0
07-Feb-11 79 5 20 3 51 0 0
08-Feb-11 83 2 0 2 77 2 0
09-Feb-11 80 4 19 1 55 1 0
10-Feb-11 92 2 0 2 86 2 0
11-Feb-11 89 0 6 0 83 0 0
12-Feb-11 47 0 0 0 45 2 0
13-Feb-11 66 3 5 0 58 0 0
14-Feb-11 81 7 33 0 41 0 0
15-Feb-11 80 2 11 0 67 0 0
16-Feb-11 76 3 1 0 72 0 0
17-Feb-11 84 0 0 2 81 1 0
18-Feb-11 81 2 0 1 78 0 0
19-Feb-11 46 0 0 2 43 1 0
20-Feb-11 61 0 0 6 55 0 0
21-Feb-11 87 2 21 6 55 3 0
22-Feb-11 84 12 56 0 16 0 0
23-Feb-11 86 5 1 2 78 0 0
24-Feb-11 94 0 0 3 88 3 0
25-Feb-11 103 1 0 2 97 3 0
26-Feb-11 70 1 0 10 56 3 0
27-Feb-11 65 0 17 3 44 1 0
28-Feb-11 83 1 0 0 82 0 0
Total
Percentage
2129
100.0%
60
2.8%
211
9.9%
52
2.4%
1782
83.7%
24
1.1%
0
0.0%
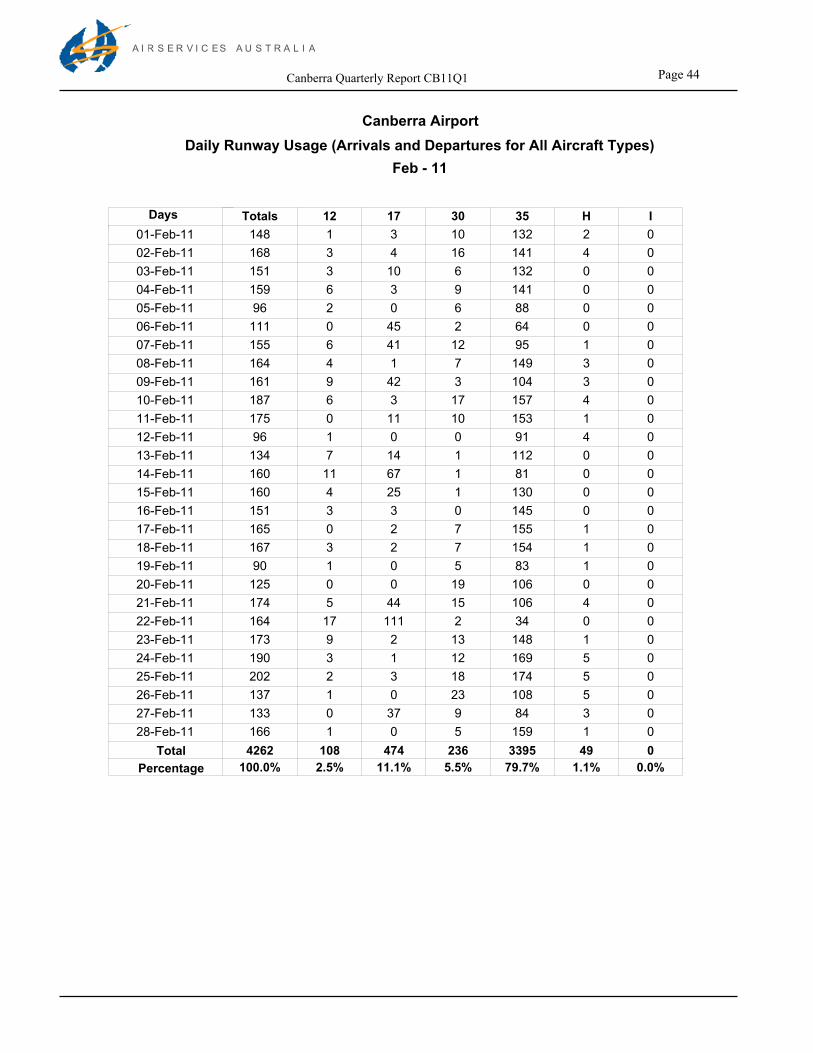
Page 44Canberra Quarterly Report CB11Q1
A I R S E R V I C E S A U S T R A L I A
Days Totals 12 17 30 35 H I
01-Feb-11 148 1 3 10 132 2 0
02-Feb-11 168 3 4 16 141 4 0
03-Feb-11 151 3 10 6 132 0 0
04-Feb-11 159 6 3 9 141 0 0
05-Feb-11 96 2 0 6 88 0 0
06-Feb-11 111 0 45 2 64 0 0
07-Feb-11 155 6 41 12 95 1 0
08-Feb-11 164 4 1 7 149 3 0
09-Feb-11 161 9 42 3 104 3 0
10-Feb-11 187 6 3 17 157 4 0
11-Feb-11 175 0 11 10 153 1 0
12-Feb-11 96 1 0 0 91 4 0
13-Feb-11 134 7 14 1 112 0 0
14-Feb-11 160 11 67 1 81 0 0
15-Feb-11 160 4 25 1 130 0 0
16-Feb-11 151 3 3 0 145 0 0
17-Feb-11 165 0 2 7 155 1 0
18-Feb-11 167 3 2 7 154 1 0
19-Feb-11 90 1 0 5 83 1 0
20-Feb-11 125 0 0 19 106 0 0
21-Feb-11 174 5 44 15 106 4 0
22-Feb-11 164 17 111 2 34 0 0
23-Feb-11 173 9 2 13 148 1 0
24-Feb-11 190 3 1 12 169 5 0
25-Feb-11 202 2 3 18 174 5 0
26-Feb-11 137 1 0 23 108 5 0
27-Feb-11 133 0 37 9 84 3 0
28-Feb-11 166 1 0 5 159 1 0
Total
Percentage
4262
100.0%
108
2.5%
474
11.1%
236
5.5%
3395
79.7%
49
1.1%
0
0.0%
Daily Runway Usage (Arrivals and Departures for All Aircraft Types)
Feb - 11
Canberra Airport

Page 45Canberra Quarterly Report CB11Q1
A I R S E R V I C E S A U S T R A L I A
Totals 12 17 30 35 H I
01-Mar-11 80 0 2 7 69 2 0
02-Mar-11 90 2 1 7 80 0 0
03-Mar-11 108 0 1 18 85 4 0
04-Mar-11 85 0 8 12 65 0 0
05-Mar-11 51 7 33 0 11 0 0
06-Mar-11 74 12 21 0 41 0 0
07-Mar-11 90 1 1 12 74 2 0
08-Mar-11 81 0 2 13 64 2 0
09-Mar-11 85 0 1 13 69 2 0
10-Mar-11 82 0 1 0 81 0 0
11-Mar-11 85 1 0 1 82 1 0
12-Mar-11 47 1 0 3 42 1 0
13-Mar-11 59 0 0 8 50 1 0
14-Mar-11 73 1 0 0 69 3 0
15-Mar-11 77 0 1 4 71 1 0
16-Mar-11 81 1 16 1 61 2 0
17-Mar-11 85 0 0 3 82 0 0
18-Mar-11 87 0 0 1 83 3 0
19-Mar-11 50 2 6 0 41 1 0
20-Mar-11 64 2 12 0 50 0 0
21-Mar-11 83 0 0 0 82 1 0
22-Mar-11 80 0 1 6 73 0 0
23-Mar-11 92 0 1 13 78 0 0
24-Mar-11 90 0 1 4 83 2 0
25-Mar-11 89 6 47 7 28 1 0
26-Mar-11 52 10 42 0 0 0 0
27-Mar-11 75 8 23 4 37 3 0
28-Mar-11 84 1 0 7 73 3 0
29-Mar-11 85 0 6 12 63 4 0
30-Mar-11 93 0 2 16 71 4 0
31-Mar-11 88 0 0 1 87 0 0
Total
Percentage
2445
100.0%
55
2.2%
229
9.4%
173
7.1%
1945
79.6%
43
1.8%
0
0.0%
Days
Daily Runway Usage (Arrivals for All Aircraft Types)
Mar - 11
Canberra Airport
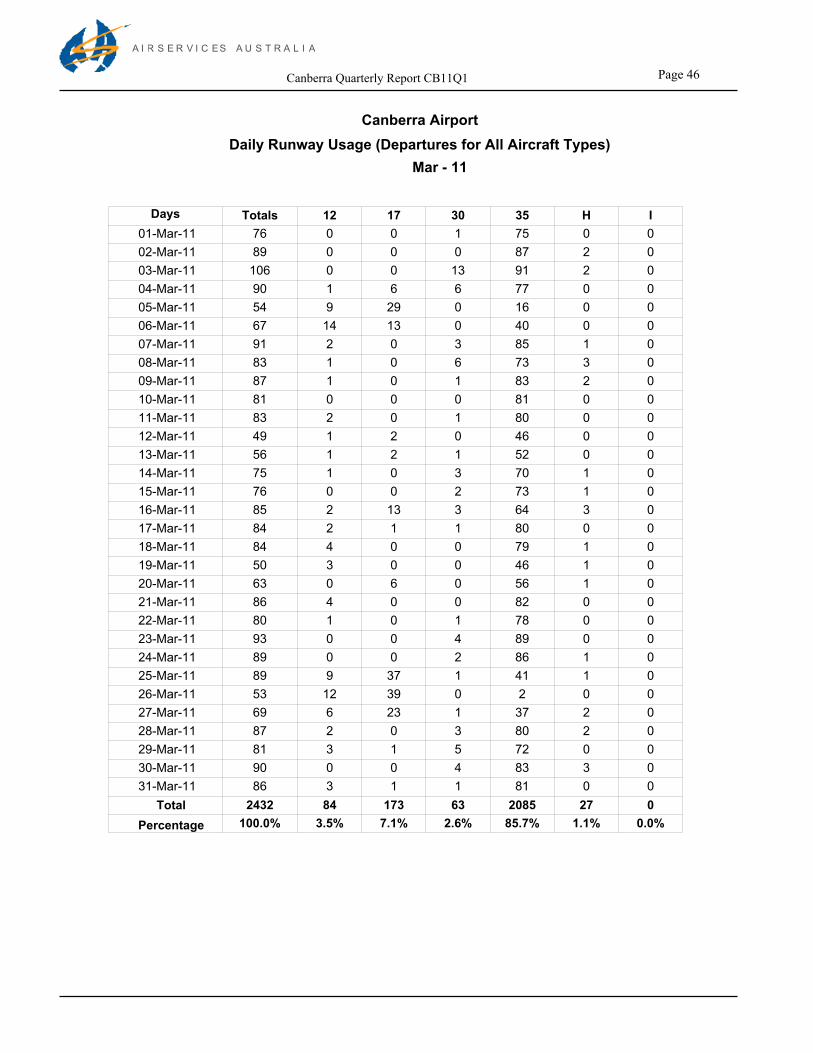
Page 46Canberra Quarterly Report CB11Q1
A I R S E R V I C E S A U S T R A L I A
Days
Daily Runway Usage (Departures for All Aircraft Types)
Mar - 11
Canberra Airport
Totals 12 17 30 35 H I
01-Mar-11 76 0 0 1 75 0 0
02-Mar-11 89 0 0 0 87 2 0
03-Mar-11 106 0 0 13 91 2 0
04-Mar-11 90 1 6 6 77 0 0
05-Mar-11 54 9 29 0 16 0 0
06-Mar-11 67 14 13 0 40 0 0
07-Mar-11 91 2 0 3 85 1 0
08-Mar-11 83 1 0 6 73 3 0
09-Mar-11 87 1 0 1 83 2 0
10-Mar-11 81 0 0 0 81 0 0
11-Mar-11 83 2 0 1 80 0 0
12-Mar-11 49 1 2 0 46 0 0
13-Mar-11 56 1 2 1 52 0 0
14-Mar-11 75 1 0 3 70 1 0
15-Mar-11 76 0 0 2 73 1 0
16-Mar-11 85 2 13 3 64 3 0
17-Mar-11 84 2 1 1 80 0 0
18-Mar-11 84 4 0 0 79 1 0
19-Mar-11 50 3 0 0 46 1 0
20-Mar-11 63 0 6 0 56 1 0
21-Mar-11 86 4 0 0 82 0 0
22-Mar-11 80 1 0 1 78 0 0
23-Mar-11 93 0 0 4 89 0 0
24-Mar-11 89 0 0 2 86 1 0
25-Mar-11 89 9 37 1 41 1 0
26-Mar-11 53 12 39 0 2 0 0
27-Mar-11 69 6 23 1 37 2 0
28-Mar-11 87 2 0 3 80 2 0
29-Mar-11 81 3 1 5 72 0 0
30-Mar-11 90 0 0 4 83 3 0
31-Mar-11 86 3 1 1 81 0 0
Total
Percentage
2432
100.0%
84
3.5%
173
7.1%
63
2.6%
2085
85.7%
27
1.1%
0
0.0%
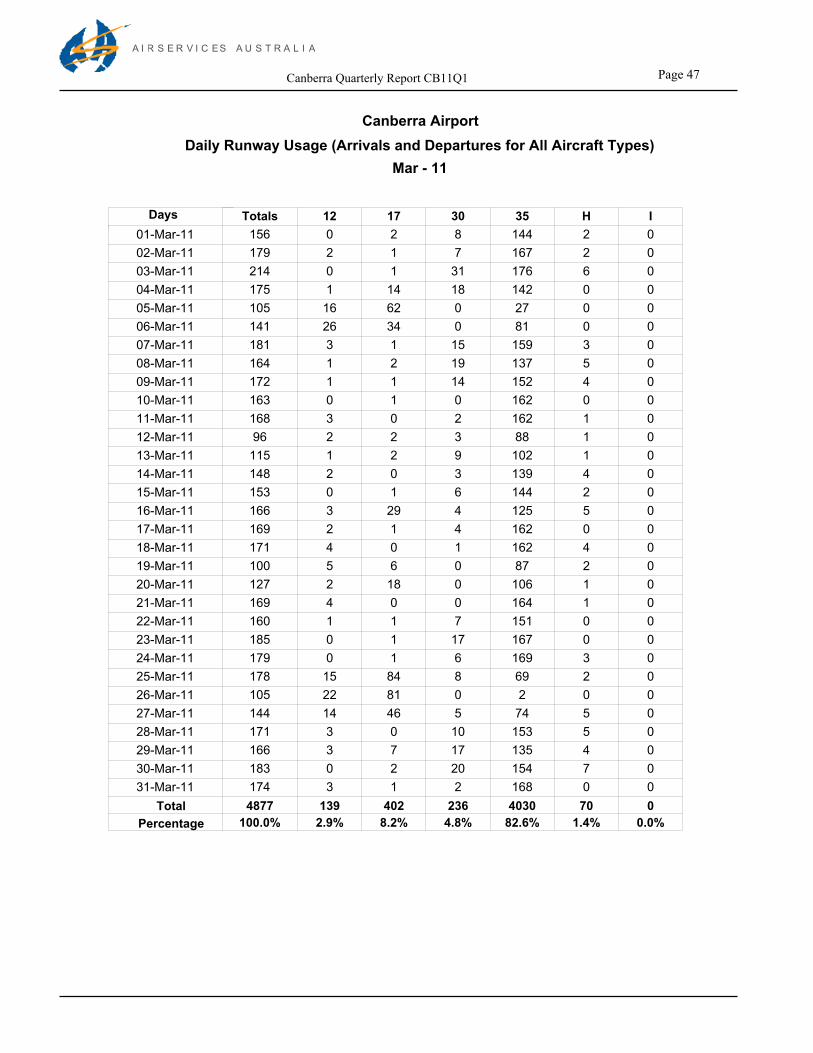
Page 47Canberra Quarterly Report CB11Q1
A I R S E R V I C E S A U S T R A L I A
Days Totals 12 17 30 35 H I
01-Mar-11 156 0 2 8 144 2 0
02-Mar-11 179 2 1 7 167 2 0
03-Mar-11 214 0 1 31 176 6 0
04-Mar-11 175 1 14 18 142 0 0
05-Mar-11 105 16 62 0 27 0 0
06-Mar-11 141 26 34 0 81 0 0
07-Mar-11 181 3 1 15 159 3 0
08-Mar-11 164 1 2 19 137 5 0
09-Mar-11 172 1 1 14 152 4 0
10-Mar-11 163 0 1 0 162 0 0
11-Mar-11 168 3 0 2 162 1 0
12-Mar-11 96 2 2 3 88 1 0
13-Mar-11 115 1 2 9 102 1 0
14-Mar-11 148 2 0 3 139 4 0
15-Mar-11 153 0 1 6 144 2 0
16-Mar-11 166 3 29 4 125 5 0
17-Mar-11 169 2 1 4 162 0 0
18-Mar-11 171 4 0 1 162 4 0
19-Mar-11 100 5 6 0 87 2 0
20-Mar-11 127 2 18 0 106 1 0
21-Mar-11 169 4 0 0 164 1 0
22-Mar-11 160 1 1 7 151 0 0
23-Mar-11 185 0 1 17 167 0 0
24-Mar-11 179 0 1 6 169 3 0
25-Mar-11 178 15 84 8 69 2 0
26-Mar-11 105 22 81 0 2 0 0
27-Mar-11 144 14 46 5 74 5 0
28-Mar-11 171 3 0 10 153 5 0
29-Mar-11 166 3 7 17 135 4 0
30-Mar-11 183 0 2 20 154 7 0
31-Mar-11 174 3 1 2 168 0 0
Total
Percentage
4877
100.0%
139
2.9%
402
8.2%
236
4.8%
4030
82.6%
70
1.4%
0
0.0%
Daily Runway Usage (Arrivals and Departures for All Aircraft Types)
Mar - 11
Canberra Airport
Page 48Canberra Quarterly Report CB11Q1
A I R S E R V I C E S A U S T R A L I A
APPENDIX D
Hourly movements per calendar month for arrivals and departures
during the period January to March 2011
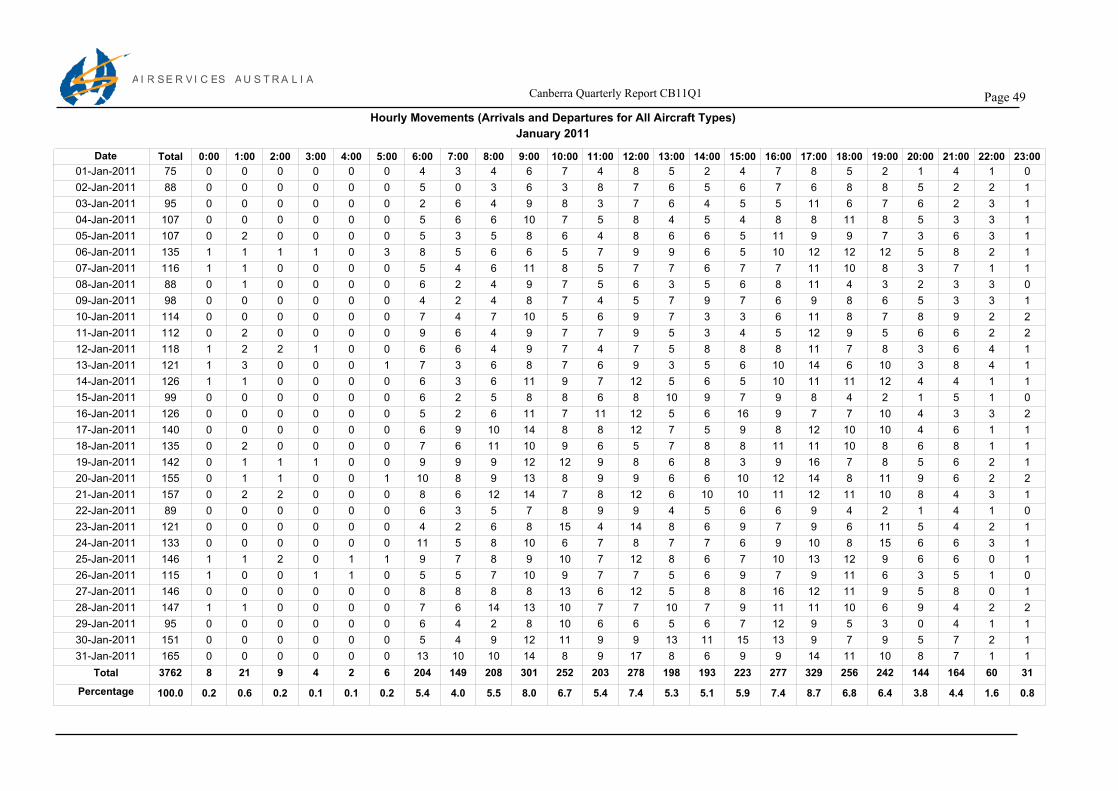
A I R S E R V I C E S A U S T R A L I A Canberra Quarterly Report CB11Q1 Page 49
Total 0:00 1:00 2:00 3:00 4:00 5:00 6:00 7:00 8:00 9:00 10:00 11:00 12:00 13:00 14:00 15:00 16:00 17:00 18:00 19:00 20:00 21:00 22:00 23:00
01-Jan-2011 75 0 0 0 0 0 0 4 3 4 6 7 4 8 5 2 4 7 8 5 2 1 4 1 0
02-Jan-2011 88 0 0 0 0 0 0 5 0 3 6 3 8 7 6 5 6 7 6 8 8 5 2 2 1
03-Jan-2011 95 0 0 0 0 0 0 2 6 4 9 8 3 7 6 4 5 5 11 6 7 6 2 3 1
04-Jan-2011 107 0 0 0 0 0 0 5 6 6 10 7 5 8 4 5 4 8 8 11 8 5 3 3 1
05-Jan-2011 107 0 2 0 0 0 0 5 3 5 8 6 4 8 6 6 5 11 9 9 7 3 6 3 1
06-Jan-2011 135 1 1 1 1 0 3 8 5 6 6 5 7 9 9 6 5 10 12 12 12 5 8 2 1
07-Jan-2011 116 1 1 0 0 0 0 5 4 6 11 8 5 7 7 6 7 7 11 10 8 3 7 1 1
08-Jan-2011 88 0 1 0 0 0 0 6 2 4 9 7 5 6 3 5 6 8 11 4 3 2 3 3 0
09-Jan-2011 98 0 0 0 0 0 0 4 2 4 8 7 4 5 7 9 7 6 9 8 6 5 3 3 1
10-Jan-2011 114 0 0 0 0 0 0 7 4 7 10 5 6 9 7 3 3 6 11 8 7 8 9 2 2
11-Jan-2011 112 0 2 0 0 0 0 9 6 4 9 7 7 9 5 3 4 5 12 9 5 6 6 2 2
12-Jan-2011 118 1 2 2 1 0 0 6 6 4 9 7 4 7 5 8 8 8 11 7 8 3 6 4 1
13-Jan-2011 121 1 3 0 0 0 1 7 3 6 8 7 6 9 3 5 6 10 14 6 10 3 8 4 1
14-Jan-2011 126 1 1 0 0 0 0 6 3 6 11 9 7 12 5 6 5 10 11 11 12 4 4 1 1
15-Jan-2011 99 0 0 0 0 0 0 6 2 5 8 8 6 8 10 9 7 9 8 4 2 1 5 1 0
16-Jan-2011 126 0 0 0 0 0 0 5 2 6 11 7 11 12 5 6 16 9 7 7 10 4 3 3 2
17-Jan-2011 140 0 0 0 0 0 0 6 9 10 14 8 8 12 7 5 9 8 12 10 10 4 6 1 1
18-Jan-2011 135 0 2 0 0 0 0 7 6 11 10 9 6 5 7 8 8 11 11 10 8 6 8 1 1
19-Jan-2011 142 0 1 1 1 0 0 9 9 9 12 12 9 8 6 8 3 9 16 7 8 5 6 2 1
20-Jan-2011 155 0 1 1 0 0 1 10 8 9 13 8 9 9 6 6 10 12 14 8 11 9 6 2 2
21-Jan-2011 157 0 2 2 0 0 0 8 6 12 14 7 8 12 6 10 10 11 12 11 10 8 4 3 1
22-Jan-2011 89 0 0 0 0 0 0 6 3 5 7 8 9 9 4 5 6 6 9 4 2 1 4 1 0
23-Jan-2011 121 0 0 0 0 0 0 4 2 6 8 15 4 14 8 6 9 7 9 6 11 5 4 2 1
24-Jan-2011 133 0 0 0 0 0 0 11 5 8 10 6 7 8 7 7 6 9 10 8 15 6 6 3 1
25-Jan-2011 146 1 1 2 0 1 1 9 7 8 9 10 7 12 8 6 7 10 13 12 9 6 6 0 1
26-Jan-2011 115 1 0 0 1 1 0 5 5 7 10 9 7 7 5 6 9 7 9 11 6 3 5 1 0
27-Jan-2011 146 0 0 0 0 0 0 8 8 8 8 13 6 12 5 8 8 16 12 11 9 5 8 0 1
28-Jan-2011 147 1 1 0 0 0 0 7 6 14 13 10 7 7 10 7 9 11 11 10 6 9 4 2 2
29-Jan-2011 95 0 0 0 0 0 0 6 4 2 8 10 6 6 5 6 7 12 9 5 3 0 4 1 1
30-Jan-2011 151 0 0 0 0 0 0 5 4 9 12 11 9 9 13 11 15 13 9 7 9 5 7 2 1
31-Jan-2011 165 0 0 0 0 0 0 13 10 10 14 8 9 17 8 6 9 9 14 11 10 8 7 1 1
Total
Percentage
3762
100.0
8
0.2
21
0.6
9
0.2
4
0.1
2
0.1
6
0.2
204
5.4
149
4.0
208
5.5
301
8.0
252
6.7
203
5.4
278
7.4
198
5.3
193
5.1
223
5.9
277
7.4
329
8.7
256
6.8
242
6.4
144
3.8
164
4.4
60
1.6
31
0.8
Date
Hourly Movements (Arrivals and Departures for All Aircraft Types)
January 2011
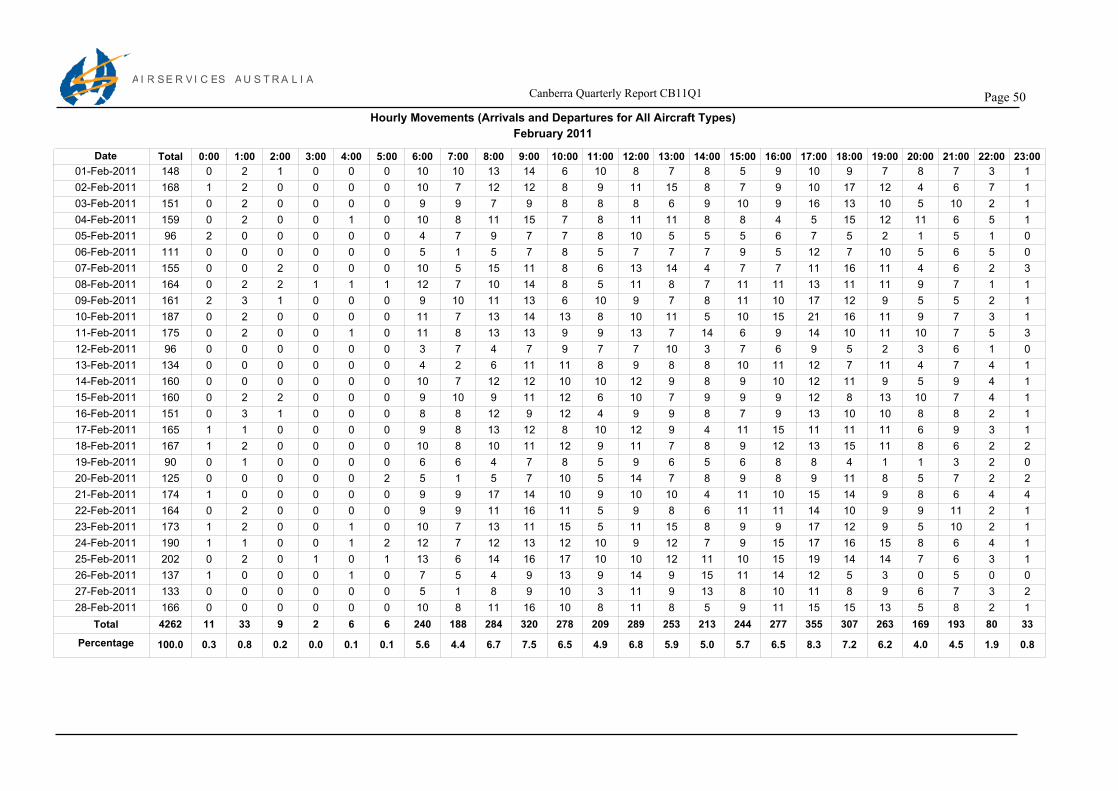
A I R S E R V I C E S A U S T R A L I A Canberra Quarterly Report CB11Q1 Page 50
Total 0:00 1:00 2:00 3:00 4:00 5:00 6:00 7:00 8:00 9:00 10:00 11:00 12:00 13:00 14:00 15:00 16:00 17:00 18:00 19:00 20:00 21:00 22:00 23:00
01-Feb-2011 148 0 2 1 0 0 0 10 10 13 14 6 10 8 7 8 5 9 10 9 7 8 7 3 1
02-Feb-2011 168 1 2 0 0 0 0 10 7 12 12 8 9 11 15 8 7 9 10 17 12 4 6 7 1
03-Feb-2011 151 0 2 0 0 0 0 9 9 7 9 8 8 8 6 9 10 9 16 13 10 5 10 2 1
04-Feb-2011 159 0 2 0 0 1 0 10 8 11 15 7 8 11 11 8 8 4 5 15 12 11 6 5 1
05-Feb-2011 96 2 0 0 0 0 0 4 7 9 7 7 8 10 5 5 5 6 7 5 2 1 5 1 0
06-Feb-2011 111 0 0 0 0 0 0 5 1 5 7 8 5 7 7 7 9 5 12 7 10 5 6 5 0
07-Feb-2011 155 0 0 2 0 0 0 10 5 15 11 8 6 13 14 4 7 7 11 16 11 4 6 2 3
08-Feb-2011 164 0 2 2 1 1 1 12 7 10 14 8 5 11 8 7 11 11 13 11 11 9 7 1 1
09-Feb-2011 161 2 3 1 0 0 0 9 10 11 13 6 10 9 7 8 11 10 17 12 9 5 5 2 1
10-Feb-2011 187 0 2 0 0 0 0 11 7 13 14 13 8 10 11 5 10 15 21 16 11 9 7 3 1
11-Feb-2011 175 0 2 0 0 1 0 11 8 13 13 9 9 13 7 14 6 9 14 10 11 10 7 5 3
12-Feb-2011 96 0 0 0 0 0 0 3 7 4 7 9 7 7 10 3 7 6 9 5 2 3 6 1 0
13-Feb-2011 134 0 0 0 0 0 0 4 2 6 11 11 8 9 8 8 10 11 12 7 11 4 7 4 1
14-Feb-2011 160 0 0 0 0 0 0 10 7 12 12 10 10 12 9 8 9 10 12 11 9 5 9 4 1
15-Feb-2011 160 0 2 2 0 0 0 9 10 9 11 12 6 10 7 9 9 9 12 8 13 10 7 4 1
16-Feb-2011 151 0 3 1 0 0 0 8 8 12 9 12 4 9 9 8 7 9 13 10 10 8 8 2 1
17-Feb-2011 165 1 1 0 0 0 0 9 8 13 12 8 10 12 9 4 11 15 11 11 11 6 9 3 1
18-Feb-2011 167 1 2 0 0 0 0 10 8 10 11 12 9 11 7 8 9 12 13 15 11 8 6 2 2
19-Feb-2011 90 0 1 0 0 0 0 6 6 4 7 8 5 9 6 5 6 8 8 4 1 1 3 2 0
20-Feb-2011 125 0 0 0 0 0 2 5 1 5 7 10 5 14 7 8 9 8 9 11 8 5 7 2 2
21-Feb-2011 174 1 0 0 0 0 0 9 9 17 14 10 9 10 10 4 11 10 15 14 9 8 6 4 4
22-Feb-2011 164 0 2 0 0 0 0 9 9 11 16 11 5 9 8 6 11 11 14 10 9 9 11 2 1
23-Feb-2011 173 1 2 0 0 1 0 10 7 13 11 15 5 11 15 8 9 9 17 12 9 5 10 2 1
24-Feb-2011 190 1 1 0 0 1 2 12 7 12 13 12 10 9 12 7 9 15 17 16 15 8 6 4 1
25-Feb-2011 202 0 2 0 1 0 1 13 6 14 16 17 10 10 12 11 10 15 19 14 14 7 6 3 1
26-Feb-2011 137 1 0 0 0 1 0 7 5 4 9 13 9 14 9 15 11 14 12 5 3 0 5 0 0
27-Feb-2011 133 0 0 0 0 0 0 5 1 8 9 10 3 11 9 13 8 10 11 8 9 6 7 3 2
28-Feb-2011 166 0 0 0 0 0 0 10 8 11 16 10 8 11 8 5 9 11 15 15 13 5 8 2 1
Total
Percentage
4262
100.0
11
0.3
33
0.8
9
0.2
2
0.0
6
0.1
6
0.1
240
5.6
188
4.4
284
6.7
320
7.5
278
6.5
209
4.9
289
6.8
253
5.9
213
5.0
244
5.7
277
6.5
355
8.3
307
7.2
263
6.2
169
4.0
193
4.5
80
1.9
33
0.8
Date
Hourly Movements (Arrivals and Departures for All Aircraft Types)
February 2011

A I R S E R V I C E S A U S T R A L I A Canberra Quarterly Report CB11Q1 Page 51
Total 0:00 1:00 2:00 3:00 4:00 5:00 6:00 7:00 8:00 9:00 10:00 11:00 12:00 13:00 14:00 15:00 16:00 17:00 18:00 19:00 20:00 21:00 22:00 23:00
01-Mar-2011 156 1 1 1 0 1 1 9 8 9 14 11 9 11 8 7 9 7 12 9 12 7 5 3 1
02-Mar-2011 179 0 2 0 0 0 1 9 9 11 12 10 9 16 9 7 12 9 15 12 10 14 8 3 1
03-Mar-2011 214 0 2 0 0 0 0 10 7 13 16 12 12 15 13 15 16 13 23 14 13 8 9 1 2
04-Mar-2011 175 0 1 1 0 0 0 10 7 12 16 12 7 11 7 9 11 10 16 14 9 9 6 3 4
05-Mar-2011 105 1 1 0 0 0 0 4 6 6 7 13 7 7 10 5 8 7 8 4 3 2 5 1 0
06-Mar-2011 141 3 0 0 0 0 0 6 1 5 7 9 7 13 10 10 11 13 11 11 10 4 7 2 1
07-Mar-2011 181 0 0 0 0 1 0 12 9 13 14 11 11 13 8 9 11 11 13 13 12 5 10 4 1
08-Mar-2011 164 0 2 0 0 0 1 10 10 12 13 9 7 10 7 8 13 8 14 13 12 6 7 1 1
09-Mar-2011 172 0 2 0 0 0 0 9 12 15 15 10 8 12 9 5 10 13 18 11 6 7 7 3 0
10-Mar-2011 163 0 3 0 0 0 1 7 10 11 13 6 5 10 9 8 11 12 13 12 10 8 12 2 0
11-Mar-2011 168 0 2 0 0 0 2 7 7 14 11 8 7 9 12 10 9 10 14 17 13 7 5 3 1
12-Mar-2011 96 2 0 0 0 0 1 4 5 3 8 11 5 8 7 4 6 8 9 6 2 0 5 2 0
13-Mar-2011 115 0 0 0 0 0 1 4 2 3 7 7 5 7 10 10 7 7 12 8 8 6 5 4 2
14-Mar-2011 148 0 0 0 0 0 0 8 10 12 13 9 6 10 8 6 8 6 13 12 9 8 5 4 1
15-Mar-2011 153 1 1 0 0 0 0 10 6 10 13 9 7 8 8 9 8 10 13 11 12 6 5 4 2
16-Mar-2011 166 1 2 0 0 0 0 8 11 11 16 9 6 13 11 7 6 10 16 13 10 7 5 4 0
17-Mar-2011 169 0 2 0 0 0 1 9 7 13 10 8 11 9 7 7 10 12 18 13 9 11 6 6 0
18-Mar-2011 171 1 2 0 0 0 1 8 10 12 11 13 6 10 8 8 6 9 18 14 11 12 8 3 0
19-Mar-2011 100 1 1 1 0 0 0 6 4 6 7 9 4 8 7 6 7 9 8 6 4 0 4 1 1
20-Mar-2011 127 0 0 0 0 0 1 5 4 6 7 7 6 14 9 7 7 8 11 10 9 6 6 2 2
21-Mar-2011 169 0 0 0 0 0 0 9 7 15 13 12 9 11 11 5 9 9 12 13 10 12 7 5 0
22-Mar-2011 160 0 2 0 0 0 0 8 7 15 13 11 7 9 6 5 12 11 15 13 9 9 6 1 1
23-Mar-2011 185 0 2 0 0 0 0 8 9 13 12 11 11 11 12 11 13 9 19 14 12 7 6 4 1
24-Mar-2011 179 0 2 0 0 1 0 8 8 17 13 8 8 11 6 7 12 12 15 15 11 13 8 2 2
25-Mar-2011 178 0 2 0 0 0 0 6 12 13 15 9 9 11 11 8 12 12 17 15 10 6 7 2 1
26-Mar-2011 105 1 0 0 0 0 0 4 6 4 7 11 6 9 8 9 8 10 6 5 6 0 3 2 0
27-Mar-2011 144 1 1 0 0 0 0 4 2 5 11 8 10 11 10 8 13 11 11 12 12 6 3 2 3
28-Mar-2011 171 1 0 0 0 0 0 8 8 14 16 10 13 13 9 6 9 7 15 14 14 5 5 4 0
29-Mar-2011 166 0 2 0 0 0 0 8 7 13 16 10 5 9 7 10 7 12 17 14 12 9 5 2 1
30-Mar-2011 183 0 2 0 0 0 1 8 12 12 16 13 6 11 8 8 12 11 17 17 13 8 5 3 0
31-Mar-2011 174 0 3 0 0 0 0 9 9 11 13 11 7 11 11 6 9 14 15 14 13 7 8 2 1
Total
Percentage
4877
100.0
14
0.3
40
0.8
3
0.1
0
0.0
3
0.1
12
0.2
235
4.8
232
4.8
329
6.7
375
7.7
307
6.3
236
4.8
331
6.8
276
5.7
240
4.9
302
6.2
310
6.4
434
8.9
369
7.6
306
6.3
215
4.4
193
4.0
85
1.7
30
0.6
Date
Hourly Movements (Arrivals and Departures for All Aircraft Types)
March 2011
Page 52Canberra Quarterly Report CB11Q1
A I R S E R V I C E S A U S T R A L I A
APPENDIX E
Aircraft Average Noise Levels
January to March 2011

A I R S E R V I C E S A U S T R A L I A
Canberra Quarterly Report CB11Q1 Page 53
Average Aircraft Noise Levels
Canberra Airport
Location: Jerrabomberra NMT: 1
TYPE DESCRIPTION OPERATION RUNWAY MOVEMENTS CORRELATED
NOISE EVENTS
MEAN MAXIMUM SOUND LEVEL (Std Dev), dB(A)
11Q1 10Q4 10Q3 10Q2 10Q1
RESULTS FROM PREVIOUS QUARTERS*
First Quarter 2011 and Previous Four Quarters
B763 Boeing - 767-300 A 35 31 31 74.7 74.1 75.3 76.0 75.1( 1.9 ) ( 1.8 ) ( 2.0 ) ( 1.7 ) ( 1.7 )
B734 Boeing - 737-400 A 35 1154 1151 73.8 73.4 74.2 74.7 74.3( 1.8 ) ( 1.8 ) ( 1.7 ) ( 1.5 ) ( 1.6 )
A320 Airbus - A320 A 35 78 78 71.2 71.1 72.2 72.4 72.0( 1.7 ) ( 1.8 ) ( 2.2 ) ( 1.8 ) ( 2.0 )
E190 Embraer ERJ-190 A 35 534 529 71.2 71.0 71.8 72.3 71.6( 1.4 ) ( 1.6 ) ( 1.4 ) ( 1.4 ) ( 1.9 )
B737 Boeing - 737-700 A 35 264 264 71.3 70.9 71.7 72.3 72.0( 1.6 ) ( 1.5 ) ( 1.3 ) ( 1.5 ) ( 1.3 )
E170 Embraer - ERJ - 170/175 A 35 789 785 70.5 70.1 70.9 71.5 71.1( 1.4 ) ( 1.6 ) ( 1.3 ) ( 1.4 ) ( 1.3 )
B738 Boeing - 737-800 A 35 561 554 69.3 69.2 69.4 69.2 68.6( 4.6 ) ( 4.6 ) ( 4.7 ) ( 5.0 ) ( 4.9 )
DH8D Dehavilland - Dash 8, DHC8 - 400 A 35 896 888 69.5 69.2 69.8 70.5 69.9( 2.3 ) ( 2.0 ) ( 2.1 ) ( 2.1 ) ( 2.2 )
B734 Boeing - 737-400 D 17 90 88 68.5 69.0 68.9 69.1 69.0( 1.8 ) ( 2.1 ) ( 1.4 ) ( 1.8 ) ( 2.3 )
GLEX Bomabardier Global Express BD - 700 - 1A10, SentinelA 35 7 7 70.2 68.4 69.0 68.4 67.8( 1.7 ) ( 2.5 ) ( 1.5 ) ( 3.1 ) ( 2.7 )
DH8C Dehavilland - Dash 8, DHC8 - 300 A 35 108 106 68.8 68.2 68.4 69.9 69.4( 2.2 ) ( 3.2 ) ( 2.8 ) ( 2.6 ) ( 2.9 )
CL60 Canadair Bomb- CL600 A 35 97 96 67.0 66.8 67.0 68.3 67.4( 2.3 ) ( 1.3 ) ( 1.4 ) ( 1.8 ) ( 1.2 )
B738 Boeing - 737-800 D 17 50 45 66.1 66.6 66.1 66.8 66.2( 1.9 ) ( 2.4 ) ( 1.5 ) ( 2.1 ) ( 1.8 )
E190 Embraer ERJ-190 D 17 52 46 66.1 66.5 66.7 67.2 66.5( 2.2 ) ( 1.7 ) ( 1.2 ) ( 1.9 ) ( 2.1 )
B350 Beech - Super King Air 350 A 35 23 23 66.3 66.2 66.8 68.6 66.6( 2.1 ) ( 2.4 ) ( 1.7 ) ( 1.3 ) ( 2.2 )
BE58 Beech - Baron58,Foxstar A 35 16 8 65.9 66.2 65.5 67.9 66.5( 1.1 ) ( 2.9 ) ( 4.5 ) ( 1.8 ) ( 1.9 )
BE20 Beech - Super King Air 200, 1300 A 35 39 31 67.0 66.1 67.5 69.0 66.9( 2.9 ) ( 2.1 ) ( 3.1 ) ( 1.8 ) ( 3.0 )
C680 Cessna Citation Sovereign (C680) Aircraft, L2J/MA 35 7 7 65.3 65.3 70.8( 1.1 ) ( 1.9 ) ( 0.0 )
SW4 Fairchild - Metro, Merlin 4 A 35 150 144 64.8 65.3 65.9 66.6 65.6( 2.1 ) ( 1.7 ) ( 1.6 ) ( 1.9 ) ( 2.0 )
C404 Cessna - Titan 404 A 35 11 8 66.9 65.2 66.0 66.9 65.0( 0.9 ) ( 2.1 ) ( 1.6 ) ( 2.3 ) ( 2.5 )
C441 Cessna - Conquest 2 - 441 A 35 28 25 66.0 64.7 65.8 66.4 65.8( 3.0 ) ( 2.1 ) ( 2.3 ) ( 2.0 ) ( 2.2 )
B763 Boeing - 767-300 D 17 6 6 67.1 64.6 65.6 66.4 65.0( 1.5 ) ( 1.1 ) ( 1.4 ) ( 2.8 ) ( 1.6 )
A320 Airbus - A320 D 17 9 8 64.7 64.6 64.6 65.9 65.1( 1.4 ) ( 1.7 ) ( 1.7 ) ( 4.5 ) ( 1.9 )
E170 Embraer - ERJ - 170/175 D 17 62 55 64.8 64.3 65.2 65.3 65.3( 2.2 ) ( 1.6 ) ( 2.1 ) ( 1.8 ) ( 2.6 )
JS41 BAe-4100 Jetstream 41 A 35 53 48 66.0 64.3 66.8 66.5 66.2( 2.0 ) ( 2.7 ) ( 2.0 ) ( 1.4 ) ( 3.4 )
*Data in the first 6 columns apply to the current quarter only.