airum 2011 pmr costs and portfolio fileairum 2011 peter m. radcliffe executive director office of...
TRANSCRIPT

Educational Costs and the Instructional Portfolio: Challenges and Solutions for
Analyzing Educational Costs
AIRUM 2011Peter M. RadcliffeExecutive Director
Office of Planning and AnalysisUniversity of Minnesota

Presentation Plan
1. Why do we care about costs?2. How do we think about costs?3. How has the Delta Cost Project thought about
costs?4. What issues are there with the Delta Cost
Project approach?5. How might we try to address those issues?6. What does that tell us?7. Where do we go from there?

Inflation Indexes: 1983 to 2009
1983 1984 1985 1986 1987 1988 1989 1990 1991 1992 1993 1994 1995 1996 1997 1998 1999 2000 2001 2002 2003 2004 2005 2006 2007 2008 2009
DPI 100. 110. 116. 122. 127. 137. 145. 153. 158. 166. 170. 177. 184. 192. 200. 212. 219. 233. 241. 250. 259. 273. 282. 298. 310. 319. 320.
HEPI 100. 104. 110. 116. 120. 126. 132. 140. 148. 153. 157. 163. 168. 173. 178. 184. 189. 196. 208. 212. 223. 231. 240. 253. 260. 273. 279.
CPI 100. 103. 107. 110. 113. 118. 123. 129. 136. 140. 145. 148. 153. 157. 161. 164. 167. 172. 178. 181. 185. 189. 195. 202. 208. 215. 218.
100
150
200
250
300
350
Inde
x Va
lue (1983=100)

Minnesota Higher Education Expenditures per $1,000 Disposable Income: FY1961 to FY2011
$‐
$2.00
$4.00
$6.00
$8.00
$10.00
$12.00
$14.00
$16.00
1961 1965 1969 1973 1977 1981 1985 1989 1993 1997 2001 2005 2009

Average Sticker Price: Four‐Year Public Tuition and Fees
$0
$1,000
$2,000
$3,000
$4,000
$5,000
$6,000
$7,000
$8,000
$9,000

Costs vs PriceValue of required inputs Amount paid by consumer
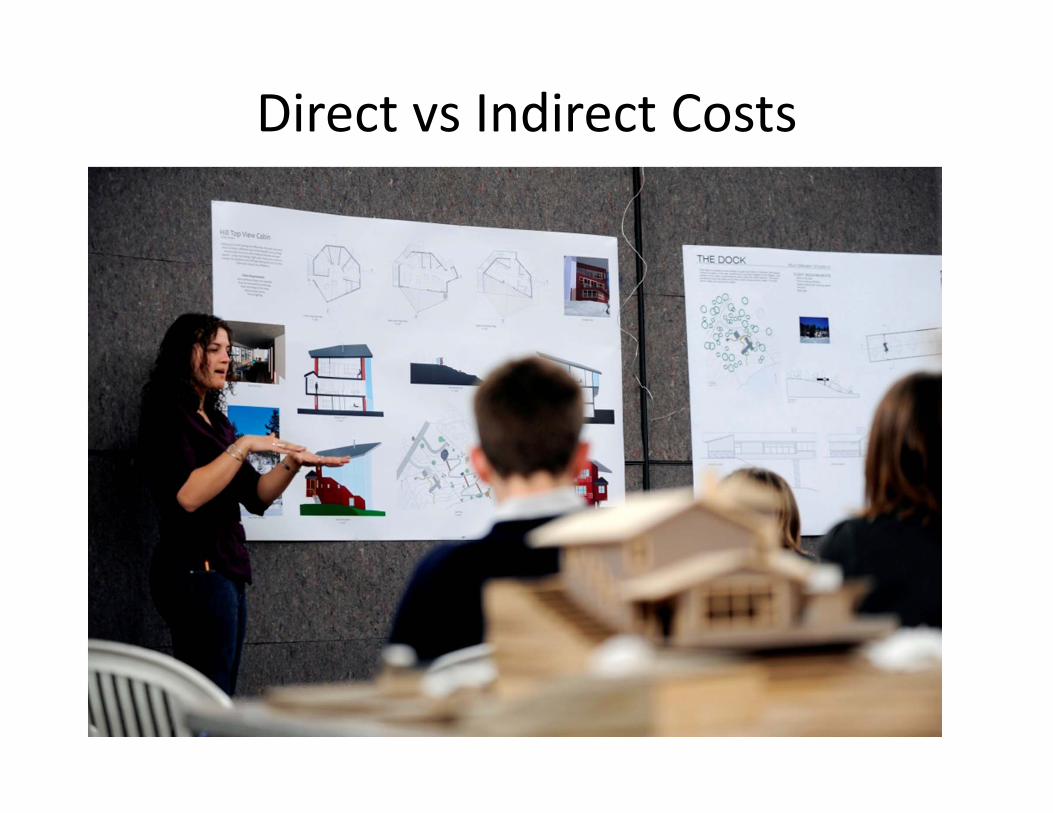
Direct vs Indirect Costs

Delta Cost Project
• Funded by Lumina Foundation• Produces report on costs annually with associated data repository and web tools
• Generates additional papers and presentations• Attempts to compare across sectors and levels of institutions to look at relative costs, and share paid by students or subsidized

IPEDS Financial Reporting: Core Expenses
• Instruction• Research • Public Service• Student Services• Academic Support• Institutional Support• Operation and Maintenance of Plant• Depreciation• Scholarships and Fellowships• Other Expenses and Deductions• Total Non‐Operating Expenses and Deductions

Expense Categories used by Delta Cost Project
Instruction Research Public Service
Student Support
Academic Support
InstitutionalSupport
Operation andMaintenance
Of Plant

Delta Cost Project: Education and Related Spending
Instruction Research Public Service
Student Support
Academic Support
InstitutionalSupport
Operation andMaintenance
Of Plant

E&R Spending Reporting
• Raw totals• Per full‐time equivalent (FTE) student• Per degree awarded• Per completion (degree or certificate)

Delta State Level Public Research Sector Cost and Subsidy Reporting: Top 10 States
$0 $5,000 $10,000 $15,000 $20,000 $25,000 $30,000
PANYHIDEVTCAWAAKMNCT
Net Tuition Subsidy

The challenge of state averages
Minnesota• University of Minnesota –
Twin Cities
California• UC Berkeley• UC Davis• UC Irvine • UC Los Angeles• UC Riverside• UC San Diego• UC Santa Barbara• UC Santa Cruz• San Diego State University

FTEs: Equivalent to what?
• Undergraduate student FTE is calculated as total annual credit hours divided by thirty
• Graduate and professional FTE is calculated as total annual credit hours divided by twenty
• If graduate and professional instruction is 50% more expensive than undergraduate, this correction works
• Our best evidence is graduate and professional instruction is well more than 50% more expensive

E&R per FTE 2008 vs UG Enrollment
y = ‐31678x + 40271R² = 0.1834
$0
$5,000
$10,000
$15,000
$20,000
$25,000
$30,000
$35,000
$40,000
$45,000
50.0% 55.0% 60.0% 65.0% 70.0% 75.0% 80.0% 85.0% 90.0% 95.0% 100.0%

Simulated E&R 2009 Model coefficients: Total E&R Spending per Degree Awarded
$20,558 $39,248 $16,671
$588,288
$227,888
$‐
$100,000
$200,000
$300,000
$400,000
$500,000
$600,000
$700,000
Associates Baccalaureate Masters Doctoral Professional

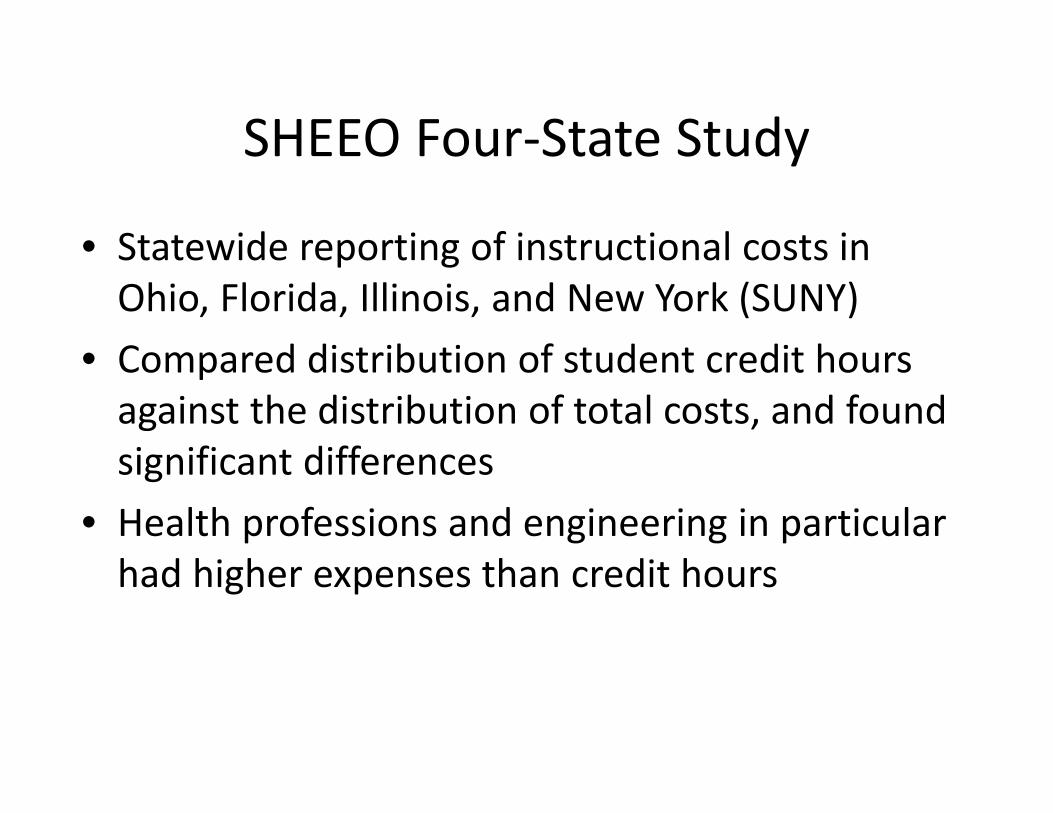
SHEEO Four‐State Study
• Statewide reporting of instructional costs in Ohio, Florida, Illinois, and New York (SUNY)
• Compared distribution of student credit hours against the distribution of total costs, and found significant differences
• Health professions and engineering in particular had higher expenses than credit hours

Classification of Instructional Program (CIP)1Agriculture, agriculture operations, and related sciences.
3Natural resources and conservation.
4Architecture and related services.
5Area, ethnic, cultural, and gender studies.
9Communication, journalism, and related programs.
10Communications technologies/technicians and support services.
11Computer and information sciences and support services.
12Personal and culinary services.
13Education.
14Engineering.
15Engineering technologies/technicians.
16Foreign languages, literatures, and linguistics.
19 Family and consumer sciences/human sciences.
22 Legal professions and studies.
23English language and literature/letters.
24 Liberal arts and sciences, general studies and humanities.
25 Library science.
26Biological and biomedical sciences.
27Mathematics and statistics.
29Military technologies.
30Multi/interdisciplinary studies.
31Parks, recreation, leisure, and fitness studies.
38Philosophy and religious studies.
39Theology and religious vocations.
40Physical sciences.
41Science technologies/technicians.
42Psychology.
43Security and protective services.
44Public administration and social service professions.
45Social sciences.
46Construction trades.
47Mechanic and repair technologies/technicians.
48Precision production.
49Transportation and materials moving.
50Visual and performing arts.
51Health professions and related clinical sciences.
52Business, management, marketing, and related support services.
54History

Simulated 2009 E&R Model cofficients: Spending per Degree by Level and Field
$(10,000,000)
$(8,000,000)
$(6,000,000)
$(4,000,000)
$(2,000,000)
$‐
$2,000,000
$4,000,000
$6,000,000
$8,000,000aacip1
aacip1
3aacip1
9aacip2
4aacip4
3aacip5
0aacip5
2ba
ch2cip3
bachcip5
bach2cip10
bachcip1
3ba
chcip1
5ba
chcip1
9ba
ch2cip23
bach2cip26
bachcip3
0ba
chcip3
8ba
ch2cip41
bachcip4
3ba
ch2cip45
bachcip5
0ba
chcip5
2mastcip1
mastcip4
mastcip9
mastcip13
mast2cip1
5mastcip19
mastcip23
mast2cip2
5mastcip27
mastcip31
mastcip40
mastcip43
mastcip45
mastcip51
mastcip54
doc2cip3
doc2cip5
doc2cip1
1do
c2cip1
4do
c2cip1
9do
c2cip2
6do
c2cip3
0do
c2cip3
8dp
cip4
2do
c2cip4
4dp
cip5
0do
c2cip5
2dp
cip2
2
100 level‐field combinations
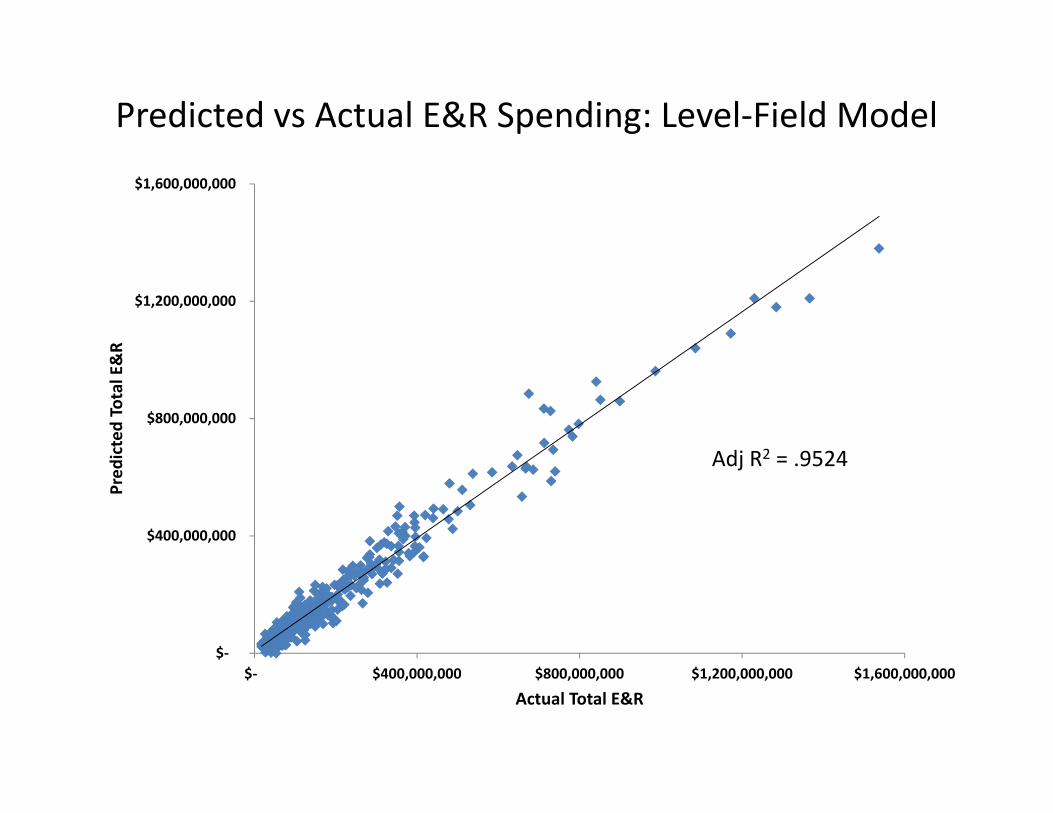
Predicted vs Actual E&R Spending: Level‐Field Model
Adj R2 = .9524
$‐
$400,000,000
$800,000,000
$1,200,000,000
$1,600,000,000
$‐ $400,000,000 $800,000,000 $1,200,000,000 $1,600,000,000
Pred
icted Total E&R
Actual Total E&R

Selected Institutional Estimates: Level‐Field Model
Institution Actual E&R Predicted E&R Variance % VarPennsylvania State University $ 1,366,000,000 $ 1,210,000,000 $ 156,000,000 13%
University of California Los Angeles $ 1,537,000,000 $ 1,380,000,000 $ 157,000,000 11%
University of Washington Seattle $ 1,284,000,000 $ 1,180,000,000 $ 104,000,000 9%
The Ohio State University $ 1,172,000,000 $ 1,090,000,000 $ 82,000,000 8%
University of Minnesota Twin Cities $ 1,085,000,000 $ 1,040,000,000 $ 45,000,000 4%
University of Michigan Ann Arbor $ 1,230,000,000 $ 1,210,000,000 $ 20,000,000 2%
University of Texas Austin $ 851,300,000 $ 864,000,000 $ (12,700,000) ‐1%
University of California Berkeley $ 841,000,000 $ 926,000,000 $ (85,000,000) ‐9%
University of Florida $ 728,500,000 $ 826,000,000 $ (97,500,000) ‐12%
University of Illinois Urbana‐Champaign $ 712,200,000 $ 834,000,000 $ (121,800,000) ‐15%
University of Wisconsin Madison $ 675,100,000 $ 885,000,000 $ (209,900,000) ‐24%

Where to next?
• Undergraduate institutions– Model separately– Include in comprehensive model
• Re‐examine and group CIP categories• Examine stability over time• Bring private institutions back into modeling• Look at additional potential cost drivers, e.g. spill‐over impacts of research, service, athletics

Peter M. RadcliffeExecutive DirectorOffice of Planning and AnalysisUniversity of [email protected]://www.academic.umn.edu/planning/
Thank you!

References and Resources
• College Tuition and Fees– http://trends.collegeboard.org/college_pricing/
• Delta Cost Project– http://www.deltacostproject.org/ (home page)– http://www.deltacostproject.org/data/download/index.php (data files)
– http://www.tcs‐online.org/Home.aspx (online data and reports)
• State spending on higher education– http://www.postsecondary.org/

More References and Resources
• Inflation Indexes– http://www.bls.gov/cpi/ (Consumer Price Index)– http://www.commonfund.org/CommonfundInstitute/HEPI/Pages/default.aspx (Higher Education Price Index)
– http://www.bea.gov/histdata/Releases/Regional/2009/PI/state/revised_September‐20‐2010/SA51‐53_1948_2009.csv (Personal Disposable Income)