ajinomoto bulletin 32 en
DESCRIPTION
Ajinomoto BulletinTRANSCRIPT
INFORMATION N°32SPECIAL ISSUE - November 2008
TABLES INCLUDED
Measuring and PredictingAmino Acid Contents in Feedingstuffs
AJINOMOTO EUROLYSINE S.A.S.Formulator’s Handbook
Relandeau C. and Eudaimon M.
AJINOMOTO EUROLYSINE S.A.S.
A J I N O M O T O A N I M A L N U T R I T I O N
Amino acid contents of 27 feedingstuffs. Intra-ingredient variability First flapAmino acid profile of 27 feedingstuffs. Inter-ingredient variability Pages 14-15Native free amino acid contents of 27 feedingstuffs Pages 14-15Equations of prediction of the amino acid contents of 11 feedingstuffs Final flap
G O T O E S S E N T I A L S
Chr
omat
ogra
mm
e
PrefaceIt is the formulator’s task (and headache) to produce feed recipes with given nutritional values, despite the raw materials to be mixed having different and variable characteristics. This guide is designed for all the nutritionists (in the feedindustry as well as in research and education) who formulate diets and/or are involved in ingredient and feed evaluations. The objective is, based on our ownexperience in amino acids, to propose and compare several practical tools to determine the nutritional value of ingredients, with a view of better controlling thenutritional value of the resulting compound feeds.
The first and only direct way to assess amino acid contents in feedstuffs is toanalyze samples using a specific method. Amino acid contents can be measured with good precision using a reference method in a renowned
laboratory. The repeatability and reproducibility levels are at least similar to those of proximal analyses. This guide advises how to choose the analytical method and the laboratory, and how to interpret analytical reports.
In case analyses cannot be performed, the formulator may need indirect evaluations of amino acid contents.AJINOMOTO EUROLYSINE S.A.S. Customer Laboratory routinely analyzes ingredients, and therefore compiles a database. This database was computed in order to supply information on the variations in amino acid contents of ingredients for predictive purpose.
The dataset contains 27 ingredients commonly used in animal nutrition in Europe. It is based on the systematic analysis of all 20 amino acids (no missing values) in more than 500 samples. A table in the first flap reports theminimum, maximum, median and mean amino acid contents, as well as the standard deviation and the number of samples analyzed. The variability explained by the experimental procedure was minimized due to the application of astrict analytical procedure (same reference method in one unique laboratory), so that the remaining variability could bemostly assigned to the feedstuff origins. Intra- and inter-feedstuffs variability should be interpreted with care becausesampling was not meant to study the origin of variability (they were received for quality control from external requests).In general, any table should be regarded as informative and not explanatory.
Crude protein, as defined by the nitrogen content multiplied by the conventional conversion factor 6.25, is generallyused to represent the total amino acid content of feedstuffs and mixtures. Based on our feedstuffs data, we have demonstrated using linear regression that the estimation is generally biased and that the bias depends on feedstuffs categories, which is a problem for feed formulation. Using crude protein as a nutritional criterion is therefore not recommended.
Nitrogen content itself is of little nutritional relevance (what is the meaning and the level of the requirement in nitrogenof an animal?), but tends to be a good predictor of individual amino acid contents in many feedstuff categories. Linearregressions between nitrogen (as independent variable) and individual amino acids (as dependent variables) have beenestablished for every amino acid and the 18 ingredients with sufficient number of observations. The quality of the statistical models was checked using not only the coefficient of determination R², but also the distribution of residualsand the confidence interval of the coefficients. Among the 18 feedstuffs, 11 showed clear regressions, which are presented in the feedstuffs monographs in the final flap. The monographs provide not only the slope and intercept ofeach regression, but also an upper bound of the prediction limits. Finally, the accuracy of the prediction of amino acidcontents based on the regressions is compared with the accuracy of the estimation based on the mean table values.
In summary, amino acid contents in a formulation matrix can be estimated, inter alia, by direct analysis, by table values,or by analysis of nitrogen and application of linear regressions. The present document provides for these three methodsan estimation of the error of prediction, so that the reader is able to estimate the cost:benefit ratio of updating hisformulation matrix or not, through one or another method. Statistics provide guidance, but the decision will always bethe responsibility of the expert. We do hope that not only the data, but also the evaluation of the dataset, based on oursensibilities, may help formulators in their mission.
Claire RELANDEAU (Nutritionist) and Marcelle EUDAIMON (Analyst)
0.260.340.190.340.490.260.501.140.270.901.782.402.092.973.981.740.951.365.750.650.422.662.064.016.530.240.01
0.410.500.260.420.510.260.781.380.921.182.143.072.413.484.452.011.021.586.732.741.843.212.386.176.900.260.01
0.320.380.230.37
0.601.250.700.97
2.832.253.194.181.88
1.456.102.270.942.85
5.42
0.320.390.230.370.500.260.601.260.660.991.962.822.243.244.191.890.991.486.121.901.022.932.225.396.670.250.01
0.030.040.020.02
0.070.080.200.08
0.140.100.150.140.09
0.070.250.680.420.24
0.39
11%10%7%5%
11%6%30%8%
5%5%5%3%5%
5%4%36%41%8%
7%
Min642635293212133312251191711152122115547243322
n Max Median Mean Std CV
L y s i n e %
0.240.300.240.310.400.240.451.880.871.852.211.571.141.952.451.420.950.714.100.340.341.961.342.404.540.290.01
0.420.450.330.390.420.250.582.071.082.152.391.961.592.222.751.551.010.815.021.511.522.411.493.184.620.310.01
0.320.350.280.33
0.491.951.002.00
1.811.412.112.611.50
0.774.511.260.702.18
2.88
0.320.360.280.340.410.250.491.970.991.992.301.801.412.102.601.490.980.774.491.080.752.171.422.894.570.300.01
0.040.040.020.02
0.030.060.050.08
0.090.110.070.100.04
0.030.220.380.310.17
0.17
12%11%7%6%
6%3%5%4%
5%8%3%4%3%
4%5%35%41%8%
6%
Min Max Median Mean Std CV
T h r e o n i n e %
0.130.140.120.160.180.190.191.140.411.221.850.530.440.650.820.620.570.171.550.100.060.550.441.450.680.130.02
Min
Cereals
Cerealsby-products
Vegetableproteinsources
Dairyproducts
Misc.
0.360.420.310.410.580.350.533.841.263.523.322.081.652.623.151.261.170.894.660.240.161.021.772.163.980.430.07
0.660.800.440.570.640.360.644.281.764.033.562.612.042.973.631.441.211.035.461.661.111.281.963.084.440.480.08
0.490.520.370.48
0.603.951.543.80
2.351.862.733.331.32
0.994.961.320.371.15
2.71
0.490.540.370.480.600.360.593.991.513.803.442.351.852.743.371.331.190.974.981.140.421.161.872.734.140.460.08
0.070.090.030.03
0.030.140.120.16
0.110.100.070.160.05
0.040.200.420.210.11
0.18
15%17%9%7%
5%3%8%4%
5%5%3%5%3%
4%4%37%49%9%
6%
Min642635293212133312251191711152122115547243322
Wheat BarleyCornTriticaleOatsRiceWheat middlingsWheat glutenWheat DDGSCorn glutenRice proteinSoybean mealFull fat soyaSoya prot. conc. 52-56%Soya prot. conc. 65%Rapeseed mealSunflower mealPeasPotato proteinMilkWhey powderWhey protein conc.YoghurtFish mealPlasma Bakery by-productsTapioca
n Max Median Mean Std CV
P h e n y l a l a n i n e %
0.220.230.230.230.340.260.322.520.872.943.281.511.201.872.290.970.680.624.120.190.120.841.241.793.970.250.04
0.420.420.310.300.380.280.432.861.163.383.481.921.472.212.681.090.680.714.911.521.031.151.312.554.300.320.06
0.280.300.260.25
0.402.611.053.16
1.711.362.002.451.04
0.684.531.210.290.99
2.24
0.290.300.260.250.360.270.402.651.033.183.381.721.352.012.471.040.680.674.521.050.350.981.282.234.080.290.05
0.050.050.020.02
0.030.110.070.14
0.080.070.080.120.03
0.030.200.430.200.10
0.17
16%17%8%6%
8%4%7%4%
5%5%4%5%3%
5%4%41%58%10%
7%
Min Max Median Mean Std CV
T y r o s i n e %
Cereals
Cerealsby-products
Vegetableproteinsources
Dairyproducts
Misc.
Wheat BarleyCornTriticaleOatsRiceWheat middlingsWheat glutenWheat DDGSCorn glutenRice proteinSoybean mealFull fat soyaSoya prot. conc. 52-56%Soya prot. conc. 65%Rapeseed mealSunflower mealPeasPotato proteinMilkWhey powderWhey protein conc.YoghurtFish mealPlasma Bakery by-productsTapioca
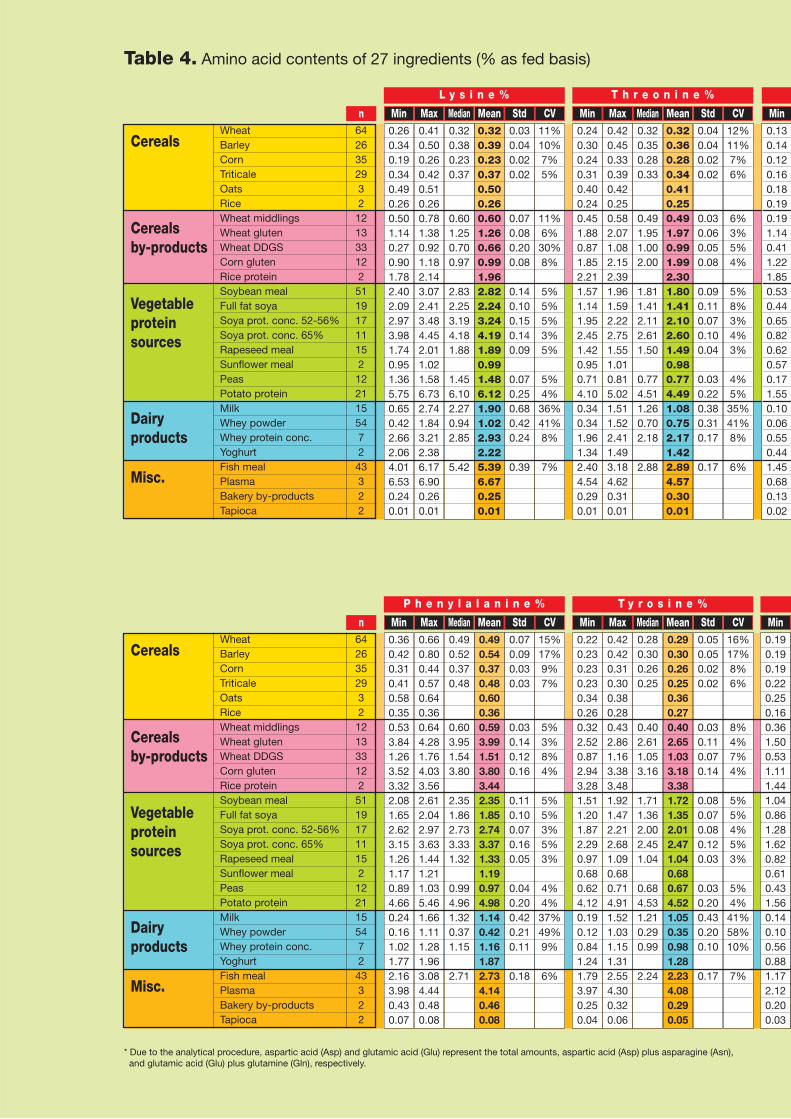
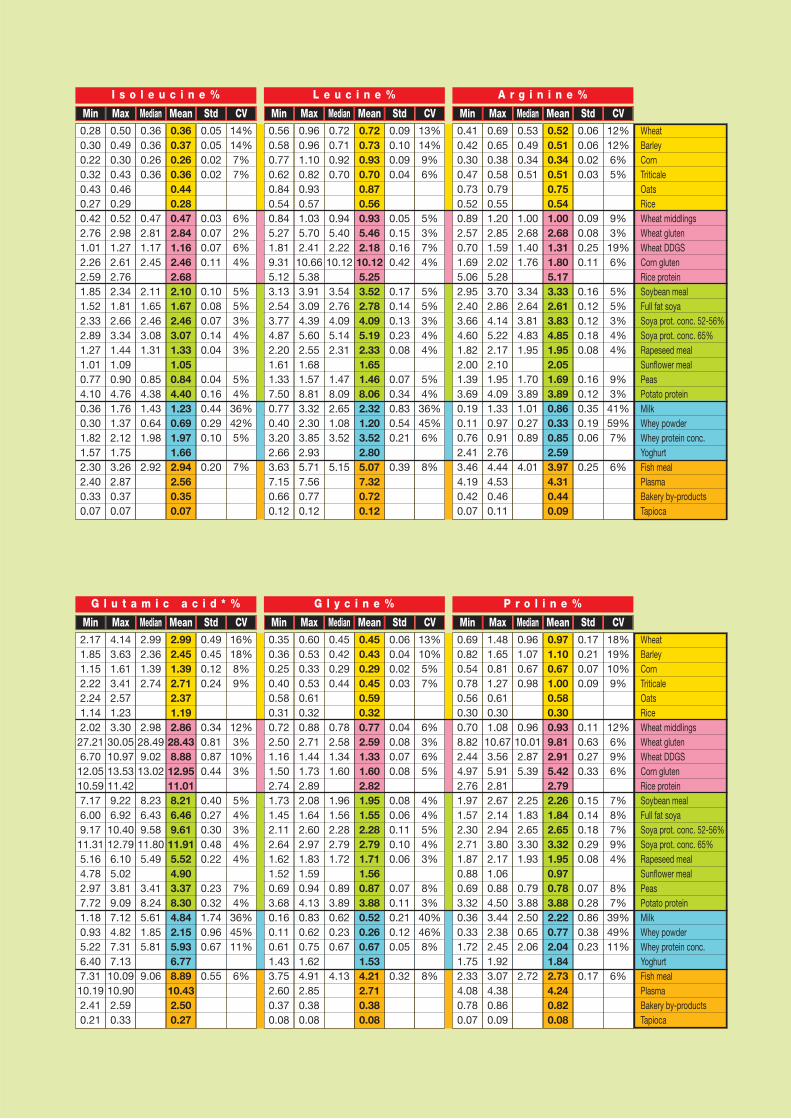
* Due to the analytical procedure, aspartic acid (Asp) and glutamic acid (Glu) represent the total amounts, aspartic acid (Asp) plus asparagine (Asn), and glutamic acid (Glu) plus glutamine (Gln), respectively.
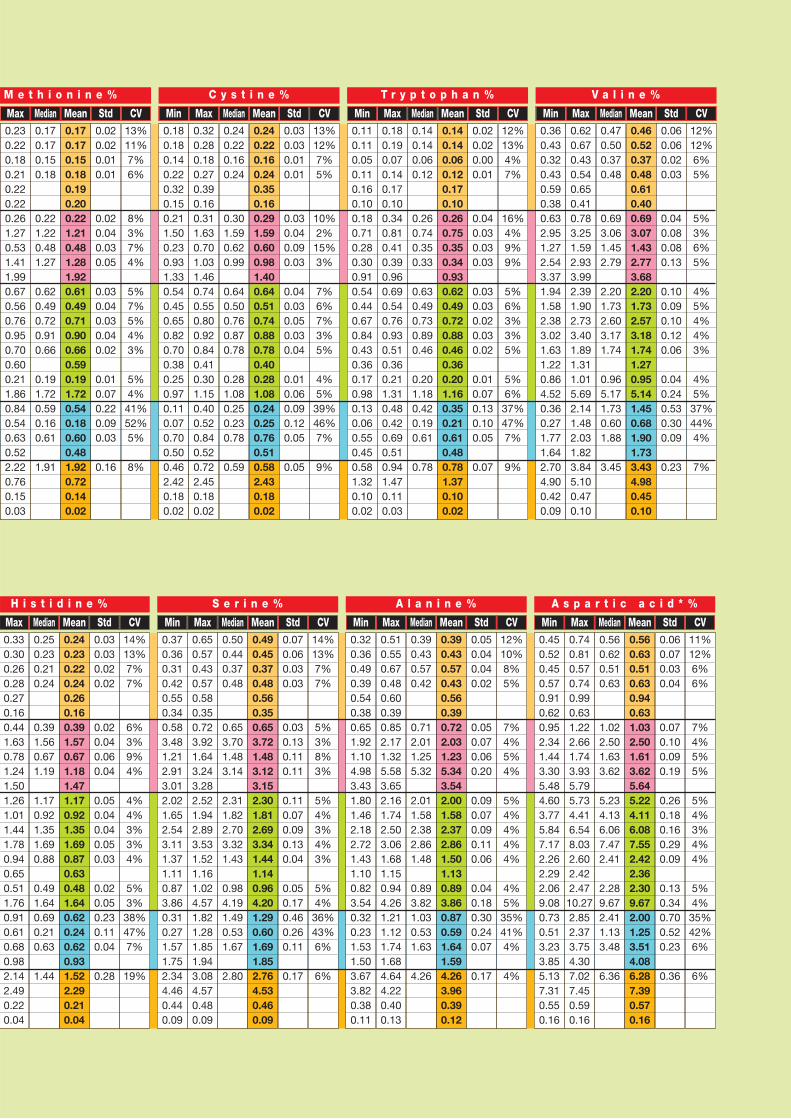
Table 4. Amino acid contents of 27 ingredients (% as fed basis)
0.190.190.190.220.250.160.361.500.531.111.441.040.861.281.620.820.610.431.560.140.100.560.881.172.120.200.03
Min
0.230.220.180.210.220.220.261.270.531.411.990.670.560.760.950.700.600.211.860.840.540.630.522.220.760.150.03
0.170.170.150.18
0.221.220.481.27
0.620.490.720.910.66
0.191.720.590.160.61
1.91
0.170.170.150.180.190.200.221.210.481.281.920.610.490.710.900.660.590.191.720.540.180.600.481.920.720.140.02
0.020.020.010.01
0.020.040.030.05
0.030.040.030.040.02
0.010.070.220.090.03
0.16
13%11%7%6%
8%3%7%4%
5%7%5%4%3%
5%4%41%52%5%
8%
Max Median Mean Std CV
M e t h i o n i n e %
0.180.180.140.220.320.150.211.500.230.931.330.540.450.650.820.700.380.250.970.110.070.700.500.462.420.180.02
0.320.280.180.270.390.160.311.630.701.031.460.740.550.800.920.840.410.301.150.400.520.840.520.722.450.180.02
0.240.220.160.24
0.301.590.620.99
0.640.500.760.870.78
0.281.080.250.230.78
0.59
0.240.220.160.240.350.160.291.590.600.981.400.640.510.740.880.780.400.281.080.240.250.760.510.582.430.180.02
0.030.030.010.01
0.030.040.090.03
0.040.030.050.030.04
0.010.060.090.120.05
0.05
13%12%7%5%
10%2%15%3%
7%6%7%3%5%
4%5%39%46%7%
9%
Min Max Median Mean Std CV
C y s t i n e %
0.110.110.050.110.160.100.180.710.280.300.910.540.440.670.840.430.360.170.980.130.060.550.450.581.320.100.02
0.180.190.070.140.170.100.340.810.410.390.960.690.540.760.930.510.360.211.310.480.420.690.510.941.470.110.03
0.140.140.060.12
0.260.740.350.33
0.630.490.730.890.46
0.201.180.420.190.61
0.78
0.140.140.060.120.170.100.260.750.350.340.930.620.490.720.880.460.360.201.160.350.210.610.480.781.370.100.02
0.020.020.000.01
0.040.030.030.03
0.030.030.020.030.02
0.010.070.130.100.05
0.07
12%13%4%7%
16%4%9%9%
5%6%3%3%5%
5%6%37%47%7%
9%
Min Max Median Mean Std CV
T r y p t o p h a n %
0.360.430.320.430.590.380.632.951.272.543.371.941.582.383.021.631.220.864.520.360.271.771.642.704.900.420.09
0.620.670.430.540.650.410.783.251.592.933.992.391.902.733.401.891.311.015.692.141.482.031.823.845.100.470.10
0.470.500.370.48
0.693.061.452.79
2.201.732.603.171.74
0.965.171.730.601.88
3.45
0.460.520.370.480.610.400.693.071.432.773.682.201.732.573.181.741.270.955.141.450.681.901.733.434.980.450.10
0.060.060.020.03
0.040.080.080.13
0.100.090.100.120.06
0.040.240.530.300.09
0.23
12%12%6%5%
5%3%6%5%
4%5%4%4%3%
4%5%37%44%4%
7%
Min Max Median Mean Std CV
V a l i n e %
0.370.360.310.420.550.340.583.481.212.913.012.021.652.543.111.371.110.873.860.310.271.571.752.344.460.440.09
0.650.570.430.570.580.350.723.921.643.243.282.521.942.893.531.521.161.024.571.821.281.851.943.084.570.480.09
0.500.440.370.48
0.653.701.483.14
2.311.822.703.321.43
0.984.191.490.531.67
2.80
0.490.450.370.480.560.350.653.721.483.123.152.301.812.693.341.441.140.964.201.290.601.691.852.764.530.460.09
0.070.060.030.03
0.030.130.110.11
0.110.070.090.130.04
0.050.170.460.260.11
0.17
14%13%7%7%
5%3%8%3%
5%4%3%4%3%
5%4%36%43%6%
6%
Min Max Median Mean Std CV
S e r i n e %
0.320.360.490.390.540.380.651.921.104.983.431.801.462.182.721.431.100.823.540.320.231.531.503.673.820.380.11
0.510.550.670.480.600.390.852.171.325.583.652.161.742.503.061.681.150.944.261.211.121.741.684.644.220.400.13
0.390.430.570.42
0.712.011.255.32
2.011.582.382.861.48
0.893.821.030.531.63
4.26
0.390.430.570.430.560.390.722.031.235.343.542.001.582.372.861.501.130.893.860.870.591.641.594.263.960.390.12
0.050.040.040.02
0.050.070.060.20
0.090.070.090.110.06
0.040.180.300.240.07
0.17
12%10%8%5%
7%4%5%4%
5%4%4%4%4%
4%5%35%41%4%
4%
Min Max Median Mean Std CV
A l a n i n e %
0.450.520.450.570.910.620.952.341.443.305.484.603.775.847.172.262.292.069.080.730.513.233.855.137.310.550.16
0.740.810.570.740.990.631.222.661.743.935.795.734.416.548.032.602.422.4710.272.852.373.754.307.027.450.590.16
0.560.620.510.63
1.022.501.633.62
5.234.136.067.472.41
2.289.672.411.133.48
6.36
0.560.630.510.630.940.631.032.501.613.625.645.224.116.087.552.422.362.309.672.001.253.514.086.287.390.570.16
0.060.070.030.04
0.070.100.090.19
0.260.180.160.290.09
0.130.340.700.520.23
0.36
11%12%6%6%
7%4%5%5%
5%4%3%4%4%
5%4%35%42%6%
6%
Min Max Median Mean Std CV
A s p a r t i c a c i d * %
0.330.300.260.280.270.160.441.630.781.241.501.261.011.441.780.940.650.511.760.910.610.680.982.142.490.220.04
0.250.230.210.24
0.391.560.671.19
1.170.921.351.690.88
0.491.640.690.210.63
1.44
0.240.230.220.240.260.160.391.570.671.181.471.170.921.351.690.870.630.481.640.620.240.620.931.522.290.210.04
0.030.030.020.02
0.020.040.060.04
0.050.040.040.050.03
0.020.050.230.110.04
0.28
14%13%7%7%
6%3%9%4%
4%4%3%3%4%
5%3%38%47%7%
19%
Max Median Mean Std CV
H i s t i d i n e %
2.171.851.152.222.241.142.0227.216.7012.0510.597.176.009.1711.315.164.782.977.721.180.935.226.407.3110.192.410.21
4.143.631.613.412.571.233.3030.0510.9713.5311.429.226.9210.4012.796.105.023.819.097.124.827.317.1310.0910.902.590.33
2.992.361.392.74
2.9828.499.0213.02
8.236.439.5811.805.49
3.418.245.611.855.81
9.06
2.992.451.392.712.371.192.8628.438.8812.9511.018.216.469.6111.915.524.903.378.304.842.155.936.778.8910.432.500.27
0.490.450.120.24
0.340.810.870.44
0.400.270.300.480.22
0.230.321.740.960.67
0.55
16%18%8%9%
12%3%10%3%
5%4%3%4%4%
7%4%36%45%11%
6%
Min Max Median Mean Std CV
G l u t a m i c a c i d * %
0.350.360.250.400.580.310.722.501.161.502.741.731.452.112.641.621.520.693.680.160.110.611.433.752.600.370.08
0.600.530.330.530.610.320.882.711.441.732.892.081.642.602.971.831.590.944.130.830.620.751.624.912.850.380.08
0.450.420.290.44
0.782.581.341.60
1.961.562.282.791.72
0.893.890.620.230.67
4.13
0.450.430.290.450.590.320.772.591.331.602.821.951.552.282.791.711.560.873.880.520.260.671.534.212.710.380.08
0.060.040.020.03
0.040.080.070.08
0.080.060.110.100.06
0.070.110.210.120.05
0.32
13%10%5%7%
6%3%6%5%
4%4%5%4%3%
8%3%40%46%8%
8%
Min Max Median Mean Std CV
G l y c i n e %
0.690.820.540.780.560.300.708.822.444.972.761.971.572.302.711.870.880.693.320.360.331.721.752.334.080.780.07
1.481.650.811.270.610.301.0810.673.565.912.812.672.142.943.802.171.060.884.503.442.382.451.923.074.380.860.09
0.961.070.670.98
0.9610.012.875.39
2.251.832.653.301.93
0.793.882.500.652.06
2.72
0.971.100.671.000.580.300.939.812.915.422.792.261.842.653.321.950.970.783.882.220.772.041.842.734.240.820.08
0.170.210.070.09
0.110.630.270.33
0.150.140.180.290.08
0.070.280.860.380.23
0.17
18%19%10%9%
12%6%9%6%
7%8%7%9%4%
8%7%39%49%11%
6%
Min Max Median Mean Std CV
P r o l i n e %
Wheat BarleyCornTriticaleOatsRiceWheat middlingsWheat glutenWheat DDGSCorn glutenRice proteinSoybean mealFull fat soyaSoya prot. conc. 52-56%Soya prot. conc. 65%Rapeseed mealSunflower mealPeasPotato proteinMilkWhey powderWhey protein conc.YoghurtFish mealPlasma Bakery by-productsTapioca
Wheat BarleyCornTriticaleOatsRiceWheat middlingsWheat glutenWheat DDGSCorn glutenRice proteinSoybean mealFull fat soyaSoya prot. conc. 52-56%Soya prot. conc. 65%Rapeseed mealSunflower mealPeasPotato proteinMilkWhey powderWhey protein conc.YoghurtFish mealPlasma Bakery by-productsTapioca
0.280.300.220.320.430.270.422.761.012.262.591.851.522.332.891.271.010.774.100.360.301.821.572.302.400.330.07
0.500.490.300.430.460.290.522.981.272.612.762.341.812.663.341.441.090.904.761.761.372.121.753.262.870.370.07
0.360.360.260.36
0.472.811.172.45
2.111.652.463.081.31
0.854.381.430.641.98
2.92
0.360.370.260.360.440.280.472.841.162.462.682.101.672.463.071.331.050.844.401.230.691.971.662.942.560.350.07
0.050.050.020.02
0.030.070.070.11
0.100.080.070.140.04
0.040.160.440.290.10
0.20
14%14%7%7%
6%2%6%4%
5%5%3%4%3%
5%4%36%42%5%
7%
Min Max Median Mean Std CV
I s o l e u c i n e %
0.560.580.770.620.840.540.845.271.819.315.123.132.543.774.872.201.611.337.500.770.403.202.663.637.150.660.12
0.960.961.100.820.930.571.035.702.4110.665.383.913.094.395.602.551.681.578.813.322.303.852.935.717.560.770.12
0.720.710.920.70
0.945.402.2210.12
3.542.764.095.142.31
1.478.092.651.083.52
5.15
0.720.730.930.700.870.560.935.462.1810.125.253.522.784.095.192.331.651.468.062.321.203.522.805.077.320.720.12
0.090.100.090.04
0.050.150.160.42
0.170.140.130.230.08
0.070.340.830.540.21
0.39
13%14%9%6%
5%3%7%4%
5%5%3%4%4%
5%4%36%45%6%
8%
Min Max Median Mean Std CV
L e u c i n e %
0.410.420.300.470.730.520.892.570.701.695.062.952.403.664.601.822.001.393.690.190.110.762.413.464.190.420.07
0.690.650.380.580.790.551.202.851.592.025.283.702.864.145.222.172.101.954.091.330.970.912.764.444.530.460.11
0.530.490.340.51
1.002.681.401.76
3.342.643.814.831.95
1.703.891.010.270.89
4.01
0.520.510.340.510.750.541.002.681.311.805.173.332.613.834.851.952.051.693.890.860.330.852.593.974.310.440.09
0.060.060.020.03
0.090.080.250.11
0.160.120.120.180.08
0.160.120.350.190.06
0.25
12%12%6%5%
9%3%19%6%
5%5%3%4%4%
9%3%41%59%7%
6%
Min Max Median Mean Std CV
A r g i n i n e %
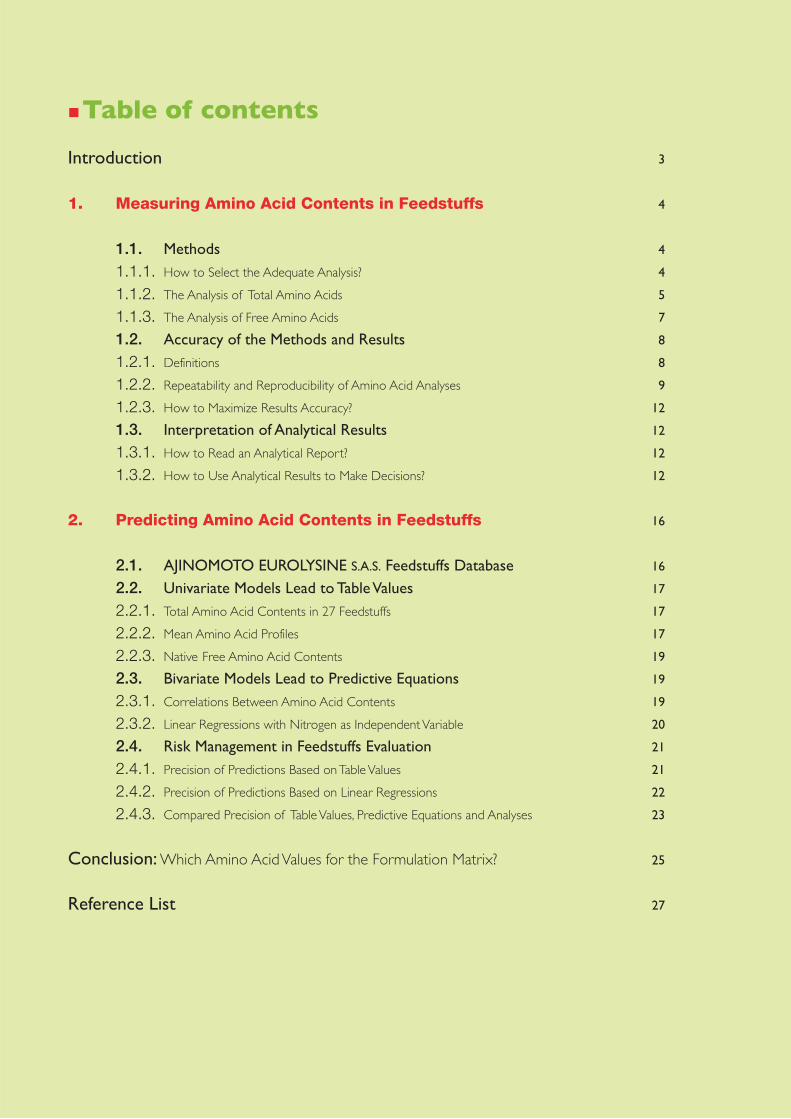
�Table of contents
Introduction 3
1. Measuring Amino Acid Contents in Feedstuffs 4
1.1. Methods 4
1.1.1. How to Select the Adequate Analysis? 4
1.1.2. The Analysis of Total Amino Acids 5
1.1.3. The Analysis of Free Amino Acids 7
1.2. Accuracy of the Methods and Results 8
1.2.1. Definitions 8
1.2.2. Repeatability and Reproducibility of Amino Acid Analyses 9
1.2.3. How to Maximize Results Accuracy? 12
1.3. Interpretation of Analytical Results 12
1.3.1. How to Read an Analytical Report? 12
1.3.2. How to Use Analytical Results to Make Decisions? 12
2. Predicting Amino Acid Contents in Feedstuffs 16
2.1. AJINOMOTO EUROLYSINE S.A.S. Feedstuffs Database 16
2.2. Univariate Models Lead to Table Values 17
2.2.1. Total Amino Acid Contents in 27 Feedstuffs 17
2.2.2. Mean Amino Acid Profiles 17
2.2.3. Native Free Amino Acid Contents 19
2.3. Bivariate Models Lead to Predictive Equations 19
2.3.1. Correlations Between Amino Acid Contents 19
2.3.2. Linear Regressions with Nitrogen as Independent Variable 20
2.4. Risk Management in Feedstuffs Evaluation 21
2.4.1. Precision of Predictions Based on Table Values 21
2.4.2. Precision of Predictions Based on Linear Regressions 22
2.4.3. Compared Precision of Table Values, Predictive Equations and Analyses 23
Conclusion: Which Amino Acid Values for the Formulation Matrix? 25
Reference List 27
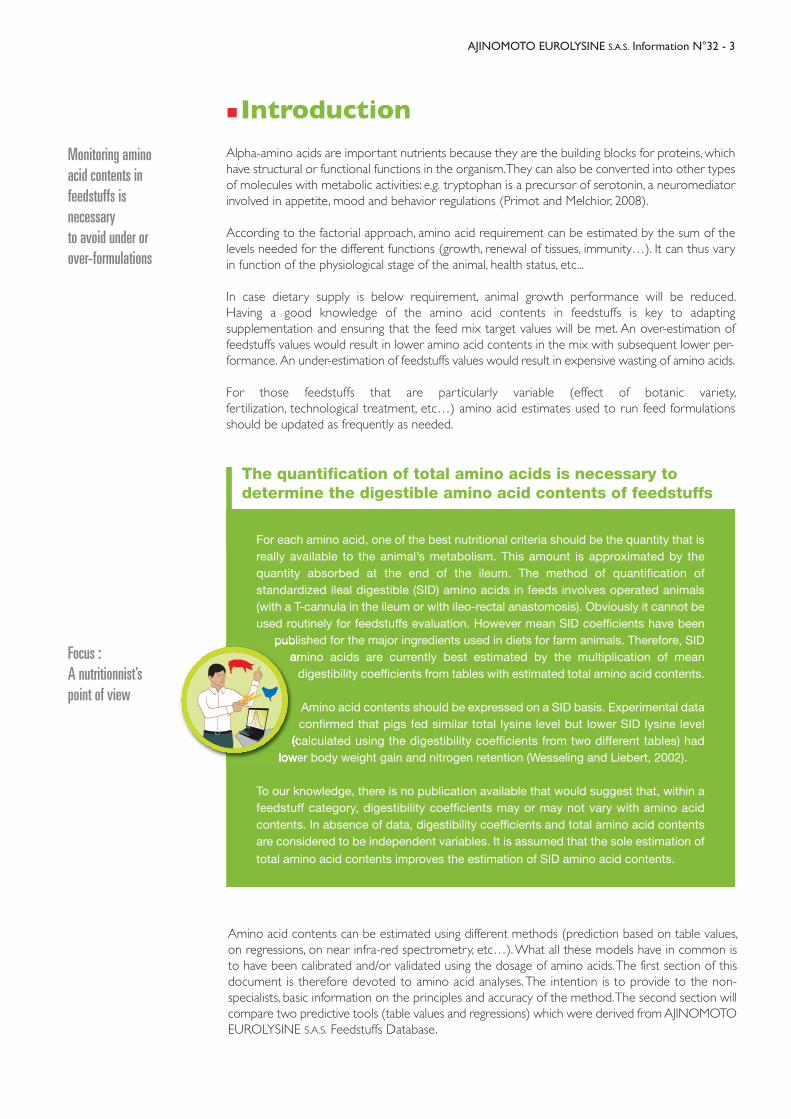
�IntroductionAlpha-amino acids are important nutrients because they are the building blocks for proteins, whichhave structural or functional functions in the organism. They can also be converted into other typesof molecules with metabolic activities: e.g. tryptophan is a precursor of serotonin, a neuromediatorinvolved in appetite, mood and behavior regulations (Primot and Melchior, 2008).
According to the factorial approach, amino acid requirement can be estimated by the sum of thelevels needed for the different functions (growth, renewal of tissues, immunity…). It can thus varyin function of the physiological stage of the animal, health status, etc...
In case dietary supply is below requirement, animal growth performance will be reduced. Having a good knowledge of the amino acid contents in feedstuffs is key to adapting supplementation and ensuring that the feed mix target values will be met. An over-estimation offeedstuffs values would result in lower amino acid contents in the mix with subsequent lower per-formance. An under-estimation of feedstuffs values would result in expensive wasting of amino acids.
For those feedstuffs that are particularly variable (effect of botanic variety, fertilization, technological treatment, etc…) amino acid estimates used to run feed formulationsshould be updated as frequently as needed.
Amino acid contents can be estimated using different methods (prediction based on table values,on regressions, on near infra-red spectrometry, etc…). What all these models have in common isto have been calibrated and/or validated using the dosage of amino acids. The first section of thisdocument is therefore devoted to amino acid analyses. The intention is to provide to the non-specialists, basic information on the principles and accuracy of the method. The second section willcompare two predictive tools (table values and regressions) which were derived from AJINOMOTOEUROLYSINE S.A.S. Feedstuffs Database.
AJINOMOTO EUROLYSINE S.A.S. Information N°32 - 3
Monitoring amino acid contents in feedstuffs is necessary to avoid under or over-formulations
Focus :A nutritionnist’spoint of view
For each amino acid, one of the best nutritional criteria should be the quantity that isreally available to the animal’s metabolism. This amount is approximated by the quantity absorbed at the end of the ileum. The method of quantification of standardized ileal digestible (SID) amino acids in feeds involves operated animals(with a T-cannula in the ileum or with ileo-rectal anastomosis). Obviously it cannot beused routinely for feedstuffs evaluation. However mean SID coefficients have been
published for the major ingredients used in diets for farm animals. Therefore, SIDamino acids are currently best estimated by the multiplication of mean
digestibility coefficients from tables with estimated total amino acid contents.
Amino acid contents should be expressed on a SID basis. Experimental data confirmed that pigs fed similar total lysine level but lower SID lysine level
(calculated using the digestibility coefficients from two different tables) hadlower body weight gain and nitrogen retention (Wesseling and Liebert, 2002).
To our knowledge, there is no publication available that would suggest that, within afeedstuff category, digestibility coefficients may or may not vary with amino acidcontents. In absence of data, digestibility coefficients and total amino acid contentsare considered to be independent variables. It is assumed that the sole estimation of
total amino acid contents improves the estimation of SID amino acid contents.
The quantification of total amino acids is necessary to determine the digestible amino acid contents of feedstuffs
Nitrogen analysis is not specific of amino acids
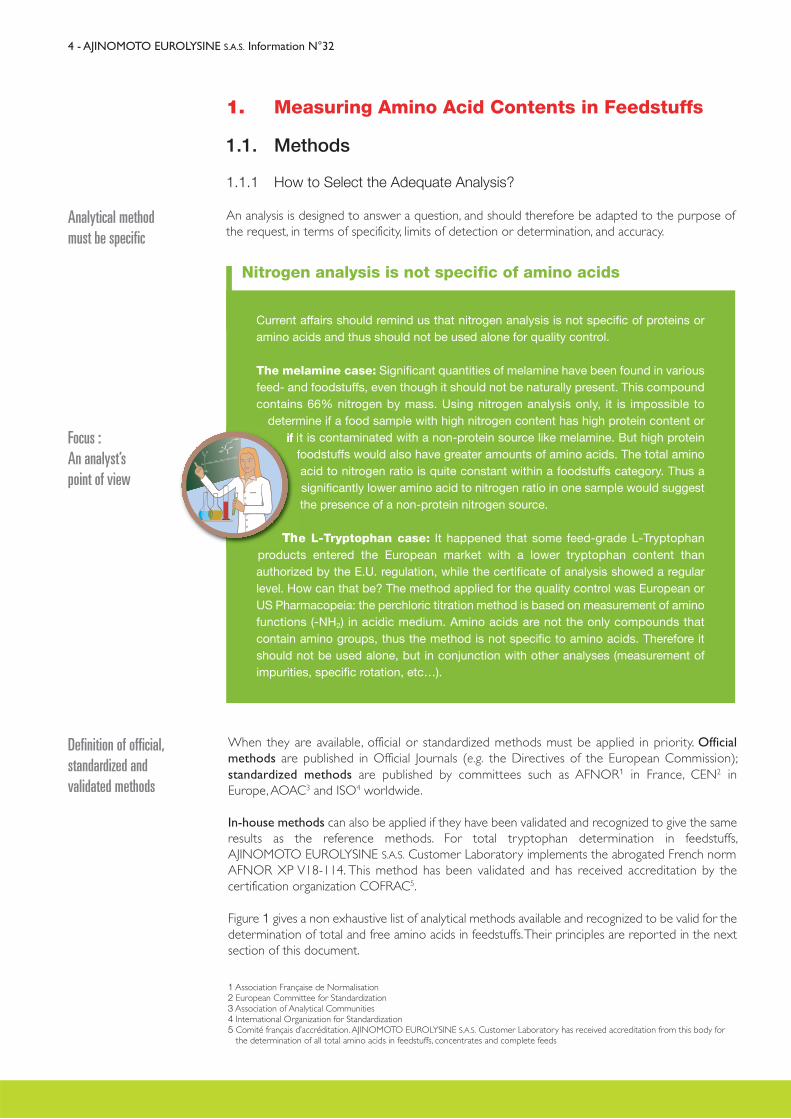
1. Measuring Amino Acid Contents in Feedstuffs
1.1. Methods
1.1.1 How to Select the Adequate Analysis?
An analysis is designed to answer a question, and should therefore be adapted to the purpose ofthe request, in terms of specificity, limits of detection or determination, and accuracy.
When they are available, official or standardized methods must be applied in priority. Official methods are published in Official Journals (e.g. the Directives of the European Commission); standardized methods are published by committees such as AFNOR1 in France, CEN2 in Europe, AOAC3 and ISO4 worldwide.
In-house methods can also be applied if they have been validated and recognized to give the sameresults as the reference methods. For total tryptophan determination in feedstuffs, AJINOMOTO EUROLYSINE S.A.S. Customer Laboratory implements the abrogated French normAFNOR XP V18-114. This method has been validated and has received accreditation by the certification organization COFRAC5.
Figure 1 gives a non exhaustive list of analytical methods available and recognized to be valid for thedetermination of total and free amino acids in feedstuffs. Their principles are reported in the nextsection of this document.
1 Association Française de Normalisation2 European Committee for Standardization3 Association of Analytical Communities4 International Organization for Standardization5 Comité français d’accréditation. AJINOMOTO EUROLYSINE S.A.S. Customer Laboratory has received accreditation from this body for
the determination of all total amino acids in feedstuffs, concentrates and complete feeds
4 - AJINOMOTO EUROLYSINE S.A.S. Information N°32
Analytical methodmust be specific
Focus :An analyst’spoint of view
Definition of official,standardized and validated methods
Current affairs should remind us that nitrogen analysis is not specific of proteins oramino acids and thus should not be used alone for quality control.
The melamine case: Significant quantities of melamine have been found in variousfeed- and foodstuffs, even though it should not be naturally present. This compoundcontains 66% nitrogen by mass. Using nitrogen analysis only, it is impossible to
determine if a food sample with high nitrogen content has high protein content orif it is contaminated with a non-protein source like melamine. But high protein
foodstuffs would also have greater amounts of amino acids. The total aminoacid to nitrogen ratio is quite constant within a foodstuffs category. Thus a significantly lower amino acid to nitrogen ratio in one sample would suggestthe presence of a non-protein nitrogen source.
The L-Tryptophan case: It happened that some feed-grade L-Tryptophan products entered the European market with a lower tryptophan content than authorized by the E.U. regulation, while the certificate of analysis showed a regularlevel. How can that be? The method applied for the quality control was European orUS Pharmacopeia: the perchloric titration method is based on measurement of aminofunctions (-NH2) in acidic medium. Amino acids are not the only compounds thatcontain amino groups, thus the method is not specific to amino acids. Therefore itshould not be used alone, but in conjunction with other analyses (measurement ofimpurities, specific rotation, etc…).
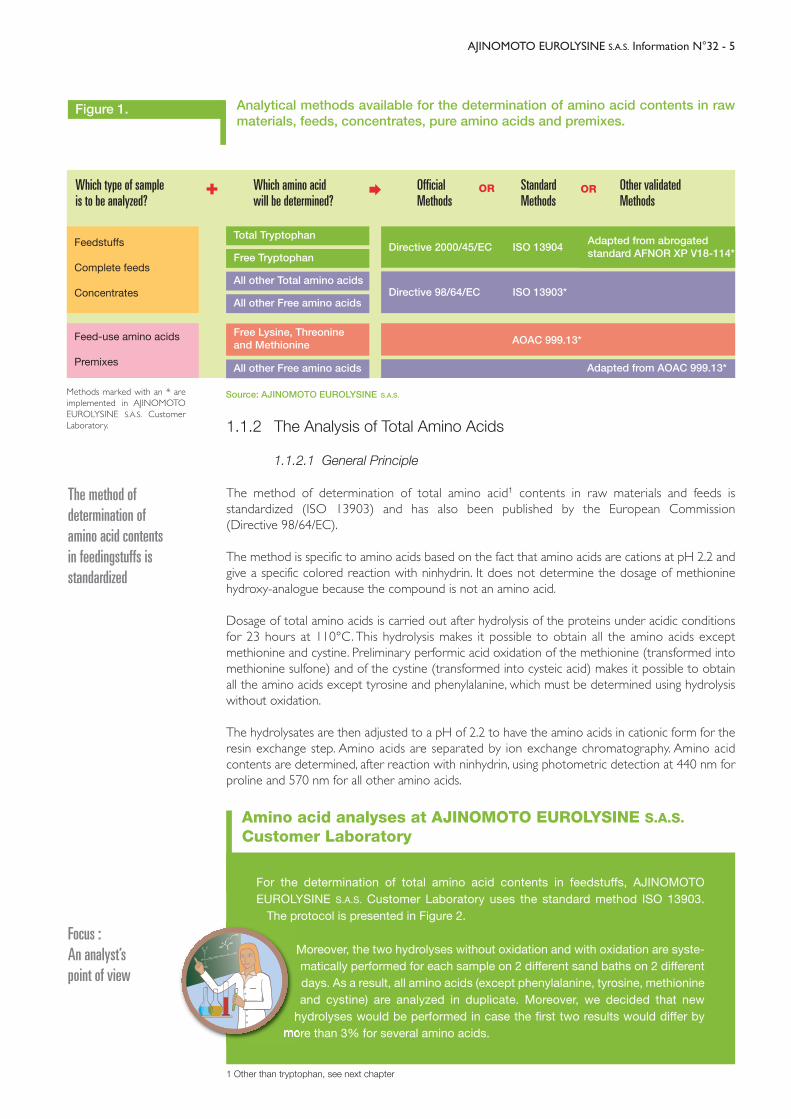
Analytical methods available for the determination of amino acid contents in rawmaterials, feeds, concentrates, pure amino acids and premixes.
Source: AJINOMOTO EUROLYSINE S.A.S.
1.1.2 The Analysis of Total Amino Acids
1.1.2.1 General Principle
The method of determination of total amino acid1 contents in raw materials and feeds is standardized (ISO 13903) and has also been published by the European Commission (Directive 98/64/EC).
The method is specific to amino acids based on the fact that amino acids are cations at pH 2.2 andgive a specific colored reaction with ninhydrin. It does not determine the dosage of methionine hydroxy-analogue because the compound is not an amino acid.
Dosage of total amino acids is carried out after hydrolysis of the proteins under acidic conditionsfor 23 hours at 110°C. This hydrolysis makes it possible to obtain all the amino acids except methionine and cystine. Preliminary performic acid oxidation of the methionine (transformed intomethionine sulfone) and of the cystine (transformed into cysteic acid) makes it possible to obtainall the amino acids except tyrosine and phenylalanine, which must be determined using hydrolysiswithout oxidation.
The hydrolysates are then adjusted to a pH of 2.2 to have the amino acids in cationic form for theresin exchange step. Amino acids are separated by ion exchange chromatography. Amino acidcontents are determined, after reaction with ninhydrin, using photometric detection at 440 nm forproline and 570 nm for all other amino acids.
Figure 1.
AJINOMOTO EUROLYSINE S.A.S. Information N°32 - 5
The method of determination of amino acid contents in feedingstuffs is standardized
1 Other than tryptophan, see next chapter
Focus :An analyst’spoint of view
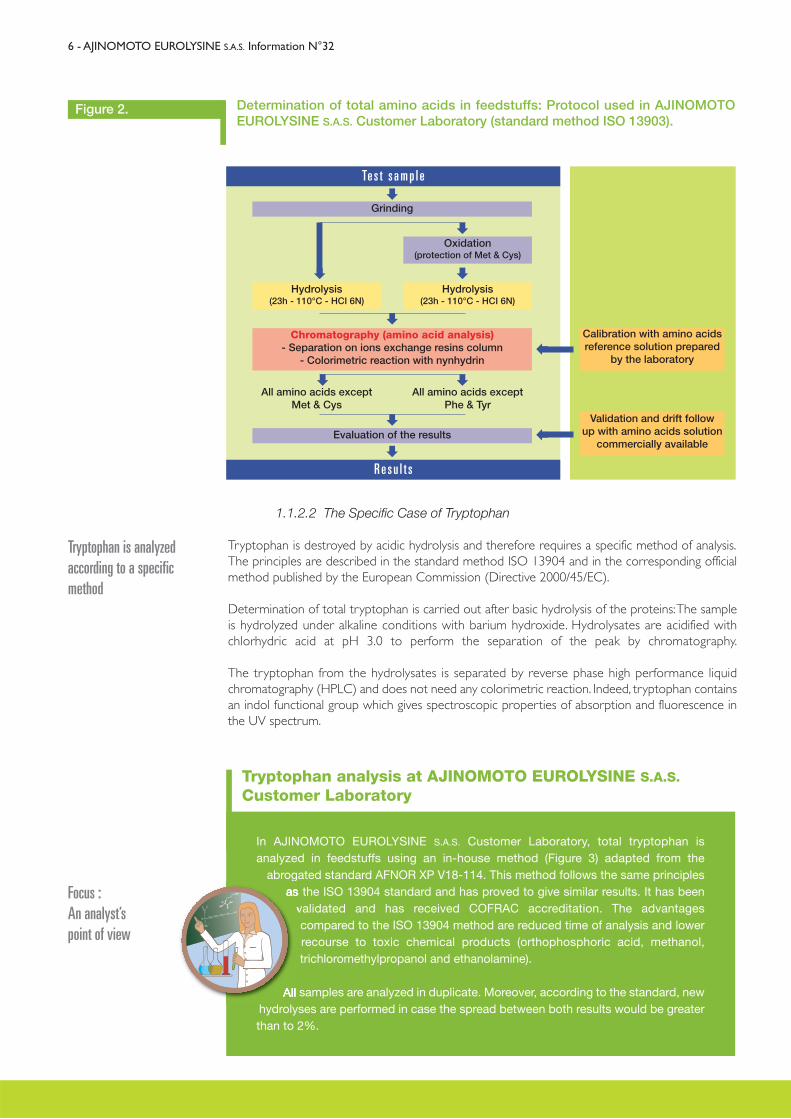
For the determination of total amino acid contents in feedstuffs, AJINOMOTO EUROLYSINE S.A.S. Customer Laboratory uses the standard method ISO 13903.
The protocol is presented in Figure 2.
Moreover, the two hydrolyses without oxidation and with oxidation are syste-matically performed for each sample on 2 different sand baths on 2 differentdays. As a result, all amino acids (except phenylalanine, tyrosine, methionineand cystine) are analyzed in duplicate. Moreover, we decided that new
hydrolyses would be performed in case the first two results would differ bymore than 3% for several amino acids.
Amino acid analyses at AJINOMOTO EUROLYSINE S.A.S.Customer Laboratory
Methods marked with an * areimplemented in AJINOMOTOEUROLYSINE S.A.S. CustomerLaboratory.
Which type of sample is to be analyzed?
Feedstuffs
Complete feeds
Concentrates
Feed-use amino acids
Premixes
Total TryptophanDirective 2000/45/EC ISO 13904
Adapted from abrogatedstandard AFNOR XP V18-114*
Directive 98/64/EC ISO 13903*
AOAC 999.13*
Adapted from AOAC 999.13*
Free Tryptophan
All other Total amino acids
All other Free amino acids
Free Lysine, Threonineand Methionine
All other Free amino acids
Which amino acidwill be determined?
OfficialMethods
StandardMethods
Other validatedMethods
+ � OR OR
1.1.2.2 The Specific Case of Tryptophan
Tryptophan is destroyed by acidic hydrolysis and therefore requires a specific method of analysis.The principles are described in the standard method ISO 13904 and in the corresponding officialmethod published by the European Commission (Directive 2000/45/EC).
Determination of total tryptophan is carried out after basic hydrolysis of the proteins: The sampleis hydrolyzed under alkaline conditions with barium hydroxide. Hydrolysates are acidified with chlorhydric acid at pH 3.0 to perform the separation of the peak by chromatography.
The tryptophan from the hydrolysates is separated by reverse phase high performance liquid chromatography (HPLC) and does not need any colorimetric reaction. Indeed, tryptophan containsan indol functional group which gives spectroscopic properties of absorption and fluorescence inthe UV spectrum.
6 - AJINOMOTO EUROLYSINE S.A.S. Information N°32
Tryptophan is analyzedaccording to a specificmethod
In AJINOMOTO EUROLYSINE S.A.S. Customer Laboratory, total tryptophan is analyzed in feedstuffs using an in-house method (Figure 3) adapted from the
abrogated standard AFNOR XP V18-114. This method follows the same principlesas the ISO 13904 standard and has proved to give similar results. It has been
validated and has received COFRAC accreditation. The advantages compared to the ISO 13904 method are reduced time of analysis and lowerrecourse to toxic chemical products (orthophosphoric acid, methanol, trichloromethylpropanol and ethanolamine).
All samples are analyzed in duplicate. Moreover, according to the standard, newhydrolyses are performed in case the spread between both results would be greaterthan to 2%.
Tryptophan analysis at AJINOMOTO EUROLYSINE S.A.S.Customer Laboratory
Determination of total amino acids in feedstuffs: Protocol used in AJINOMOTO EUROLYSINE S.A.S. Customer Laboratory (standard method ISO 13903).
Figure 2.
Te s t s a m p l e
R e s u l t s
Grinding
Chromatography (amino acid analysis)- Separation on ions exchange resins column
- Colorimetric reaction with nynhydrin
Oxidation(protection of Met & Cys)
Hydrolysis(23h - 110°C - HCI 6N)
Hydrolysis(23h - 110°C - HCI 6N)
All amino acids exceptPhe & Tyr
All amino acids exceptMet & Cys
Evaluation of the results
Calibration with amino acidsreference solution prepared
by the laboratory
Validation and drift followup with amino acids solution
commercially available
�
�
�
�
�
�
�
�
� �
�
Focus :An analyst’spoint of view
1.1.3 The Analysis of Free Amino Acids
If the goal of the analysis is to control the quality of feed manufacturing, samples can be analyzedfor total and/or free amino acids: total amino acid contents should be compared to the expectedlevels in the formula; free amino acids should be compared to the fraction coming from the supplemented feed-use amino acids (see Chapter 1.3.2. How to use analytical results to make decisions?).
1.1.3.1 General principle
Free amino acid contents are determined by Directive 98/64/CE equivalent to the standard methodISO 13903. The principles are the same as for total amino acids: only the preparation of the sample changes with a simple extraction instead of a hydrolysis.
The amino acids are extracted using chlorhydric acid. Co-extracted nitrogenous macromoleculesare precipitated with sulfosalicylic acid and removed by centrifugation. The solution is filtered andadjusted to a pH of 2.2. The amino acids are separated on ions exchange resins and measured by photometric detection at 570 nm (440 nm for proline) after reaction with ninhydrin on a specificamino acid analyzer.
1.1.3.2 The Specific Case of Tryptophan
The principles of the method are the same as for total tryptophan determination, with the exception of the preparation of the sample. Free tryptophan is extracted using chlorhydric acid.Tryptophan in the filtered solution is separated by reverse phase high performance liquid chromatography (HPLC) and determined by fluorometric detection.
AJINOMOTO EUROLYSINE S.A.S. Information N°32 - 7
Methods for the determination of freeamino acid contents in feedingstuffs arealso standardized
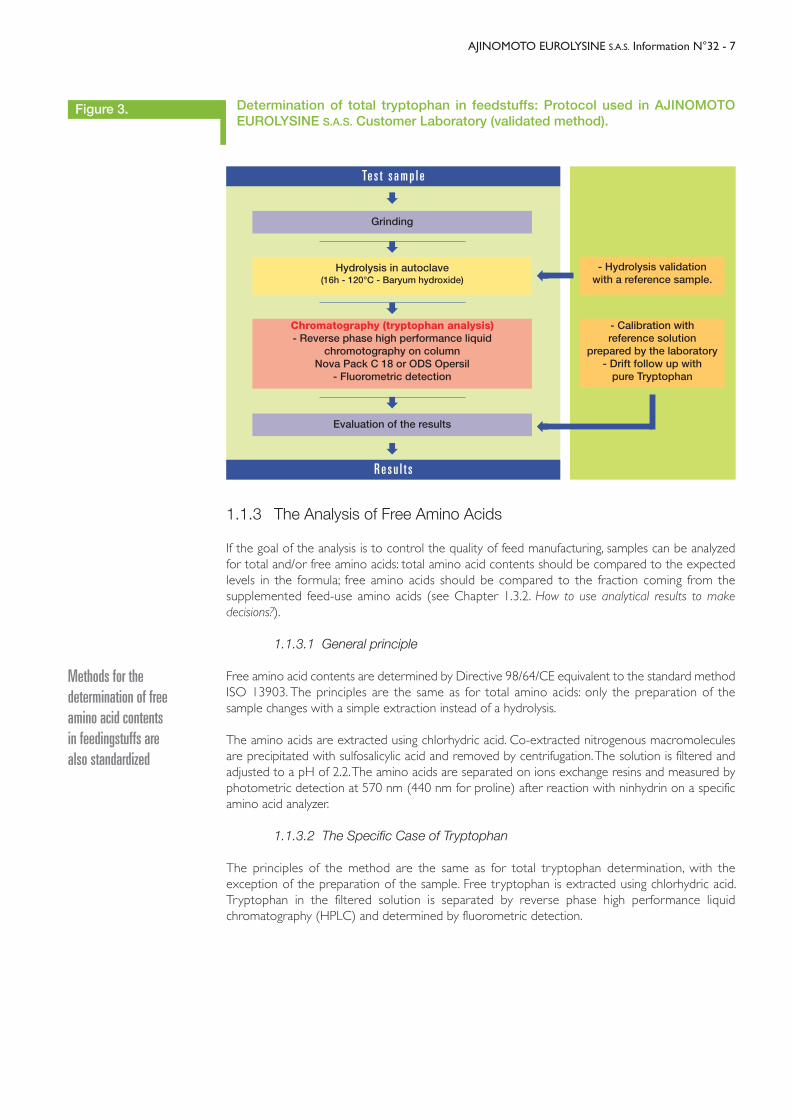
Determination of total tryptophan in feedstuffs: Protocol used in AJINOMOTO EUROLYSINE S.A.S. Customer Laboratory (validated method).
Figure 3.
Te s t s a m p l e
R e s u l t s
Grinding
Chromatography (tryptophan analysis)- Reverse phase high performance liquid
chromotography on column Nova Pack C 18 or ODS Opersil
- Fluorometric detection
Hydrolysis in autoclave(16h - 120°C - Baryum hydroxide)
Evaluation of the results
- Hydrolysis validationwith a reference sample.
- Calibration withreference solution
prepared by the laboratory- Drift follow up with
pure Tryptophan
�
�
�
�
�
��
8 - AJINOMOTO EUROLYSINE S.A.S. Information N°32
Precision includes repeatability and reproducibility
1.2. Accuracy of the Methods and Results
1.2.1. Definitions
1.2.1.1. Trueness and Precision
An analytical method should have a high level of accuracy. The concept of accuracy refers to twoparameters defined by the standard ISO 5725:
- Trueness refers to the closeness of agreement between the arithmetic mean of a large numberof test results and the true value (which is not known in the case of chemical assays) or the acceptedreference value.
- Precision refers to the closeness of agreement between independent test results obtained understipulated conditions (with repeatability and reproducibility data). The need to consider “precision”arises because tests performed on presumably identical raw materials in presumably identical circumstances do not give in general identical results. This is attributed to unavoidable random errors inherent in every measurement procedure: if the difference between two results can be attributed to the inherent variation of the measurement method, then the two results can be considered as similar. The measure of precision is usually expressed in terms of imprecision andcomputed as a standard deviation of the test results measured within a laboratory or undertakenby several laboratories. A lower precision is reflected by a larger standard deviation.
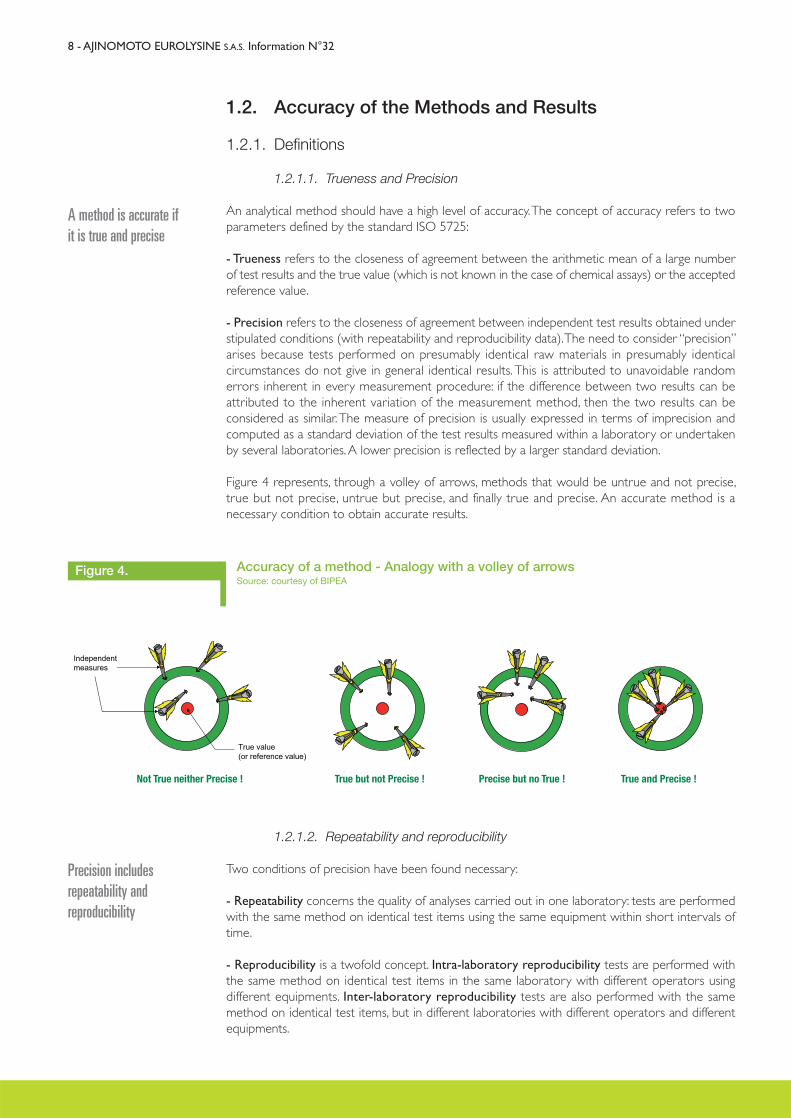
Figure 4 represents, through a volley of arrows, methods that would be untrue and not precise,true but not precise, untrue but precise, and finally true and precise. An accurate method is a necessary condition to obtain accurate results.
1.2.1.2. Repeatability and reproducibility
Two conditions of precision have been found necessary:
- Repeatability concerns the quality of analyses carried out in one laboratory: tests are performedwith the same method on identical test items using the same equipment within short intervals oftime.
- Reproducibility is a twofold concept. Intra-laboratory reproducibility tests are performed withthe same method on identical test items in the same laboratory with different operators using different equipments. Inter-laboratory reproducibility tests are also performed with the same method on identical test items, but in different laboratories with different operators and differentequipments.
A method is accurate ifit is true and precise
Accuracy of a method - Analogy with a volley of arrowsSource: courtesy of BIPEA
Figure 4.
Not True neither Precise ! True but not Precise ! True and Precise !Precise but no True !
Analytical results areaccurate if both biasand uncertainty are low
Accuracy of amino acid analyses is similarto the accuracy ofproximal analyses
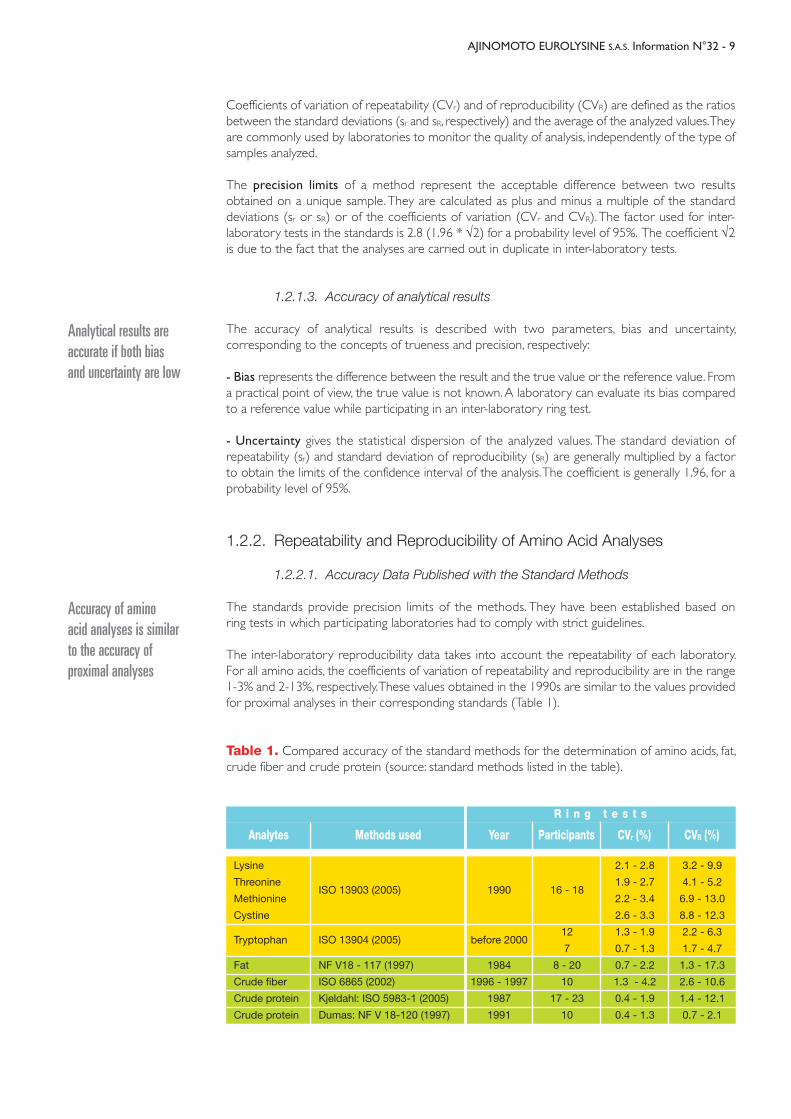
Coefficients of variation of repeatability (CVr) and of reproducibility (CVR) are defined as the ratiosbetween the standard deviations (sr and sR, respectively) and the average of the analyzed values. Theyare commonly used by laboratories to monitor the quality of analysis, independently of the type ofsamples analyzed.
The precision limits of a method represent the acceptable difference between two results obtained on a unique sample. They are calculated as plus and minus a multiple of the standard deviations (sr or sR) or of the coefficients of variation (CVr and CVR). The factor used for inter-laboratory tests in the standards is 2.8 (1.96 * √2) for a probability level of 95%. The coefficient √2is due to the fact that the analyses are carried out in duplicate in inter-laboratory tests.
1.2.1.3. Accuracy of analytical results
The accuracy of analytical results is described with two parameters, bias and uncertainty, corresponding to the concepts of trueness and precision, respectively:
- Bias represents the difference between the result and the true value or the reference value. Froma practical point of view, the true value is not known. A laboratory can evaluate its bias comparedto a reference value while participating in an inter-laboratory ring test.
- Uncertainty gives the statistical dispersion of the analyzed values. The standard deviation of repeatability (sr) and standard deviation of reproducibility (sR) are generally multiplied by a factorto obtain the limits of the confidence interval of the analysis. The coefficient is generally 1.96, for aprobability level of 95%.
1.2.2. Repeatability and Reproducibility of Amino Acid Analyses
1.2.2.1. Accuracy Data Published with the Standard Methods
The standards provide precision limits of the methods. They have been established based on ring tests in which participating laboratories had to comply with strict guidelines.
The inter-laboratory reproducibility data takes into account the repeatability of each laboratory. For all amino acids, the coefficients of variation of repeatability and reproducibility are in the range1-3% and 2-13%, respectively. These values obtained in the 1990s are similar to the values providedfor proximal analyses in their corresponding standards (Table 1).
Table 1. Compared accuracy of the standard methods for the determination of amino acids, fat,crude fiber and crude protein (source: standard methods listed in the table).
AJINOMOTO EUROLYSINE S.A.S. Information N°32 - 9
Lysine
Threonine
Methionine
Cystine
Tryptophan
Fat
Crude fiber
Crude protein
Crude protein
ISO 13903 (2005)
ISO 13904 (2005)
NF V18 - 117 (1997)
ISO 6865 (2002)
Kjeldahl: ISO 5983-1 (2005)
Dumas: NF V 18-120 (1997)
1990
before 2000
1984
1996 - 1997
1987
1991
16 - 18
12
7
8 - 20
10
17 - 23
10
2.1 - 2.8
1.9 - 2.7
2.2 - 3.4
2.6 - 3.3
1.3 - 1.9
0.7 - 1.3
0.7 - 2.2
1.3 - 4.2
0.4 - 1.9
0.4 - 1.3
3.2 - 9.9
4.1 - 5.2
6.9 - 13.0
8.8 - 12.3
2.2 - 6.3
1.7 - 4.7
1.3 - 17.3
2.6 - 10.6
1.4 - 12.1
0.7 - 2.1
Analytes Methods used Year Participants CVr (%) CVR (%)
R i n g t e s t s
1.2.2.2. Accuracy Data Obtained in Recent Ring Tests
The Bureau Inter Professionnel d'Etude Analytique (BIPEA) is a non-profit making association basedin France. It was created in 1970, on the initiative of the professional organizations of the fields ofproduction, storage and transformation of cereals and of manufacture of feed for animal. They organize inter-laboratory comparison tests to define the laboratory abilities and bring them assistance to manage, maintain or improve their performances.
Results of the ring tests are sent to the participants after a statistical study. Each laboratory can thenevaluate its trueness by calculating the bias with the reference value calculated as the average of allthe laboratories (except outliers) or calculated from a number of selected laboratories decided bythe commission in charge of the test.
Contrary to the standards where every laboratory analyses samples in duplicate, the ring test procedure here requires only one analytical result per laboratory. Reproducibility data therefore do not include within-laboratory variations. The robust standard deviation instead is defined in ISO 13528 giving the rules for the inter-laboratory tests to evaluate the competence of laboratories.
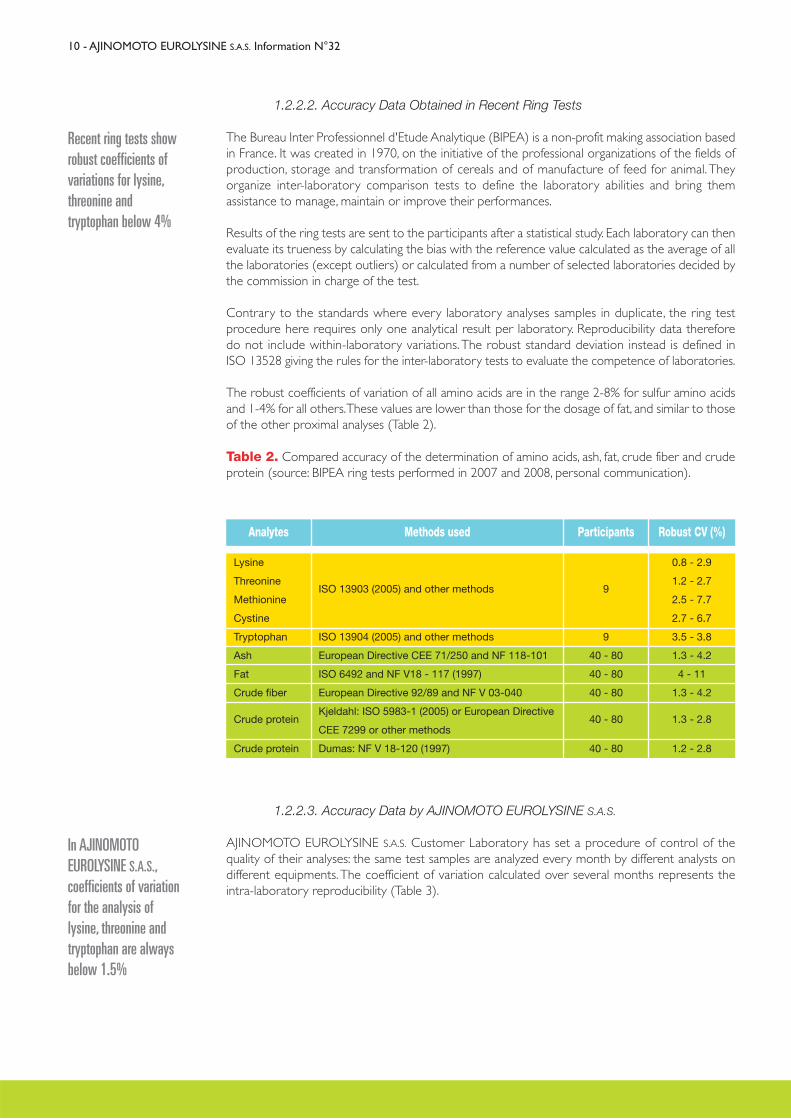
The robust coefficients of variation of all amino acids are in the range 2-8% for sulfur amino acidsand 1-4% for all others. These values are lower than those for the dosage of fat, and similar to thoseof the other proximal analyses (Table 2).
Table 2. Compared accuracy of the determination of amino acids, ash, fat, crude fiber and crudeprotein (source: BIPEA ring tests performed in 2007 and 2008, personal communication).
10 - AJINOMOTO EUROLYSINE S.A.S. Information N°32
Recent ring tests showrobust coefficients ofvariations for lysine,threonine and tryptophan below 4%
In AJINOMOTO EUROLYSINE S.A.S.,coefficients of variationfor the analysis of lysine, threonine andtryptophan are alwaysbelow 1.5%
1.2.2.3. Accuracy Data by AJINOMOTO EUROLYSINE S.A.S.
AJINOMOTO EUROLYSINE S.A.S. Customer Laboratory has set a procedure of control of the quality of their analyses: the same test samples are analyzed every month by different analysts ondifferent equipments. The coefficient of variation calculated over several months represents theintra-laboratory reproducibility (Table 3).
Lysine
Threonine
Methionine
Cystine
Tryptophan
Ash
Fat
Crude fiber
Crude protein
Crude protein
ISO 13903 (2005) and other methods
ISO 13904 (2005) and other methods
European Directive CEE 71/250 and NF 118-101
ISO 6492 and NF V18 - 117 (1997)
European Directive 92/89 and NF V 03-040
Kjeldahl: ISO 5983-1 (2005) or European Directive
CEE 7299 or other methods
Dumas: NF V 18-120 (1997)
Analytes Methods used
9
9
40 - 80
40 - 80
40 - 80
40 - 80
40 - 80
Participants
0.8 - 2.9
1.2 - 2.7
2.5 - 7.7
2.7 - 6.7
3.5 - 3.8
1.3 - 4.2
4 - 11
1.3 - 4.2
1.3 - 2.8
1.2 - 2.8
Robust CV (%)
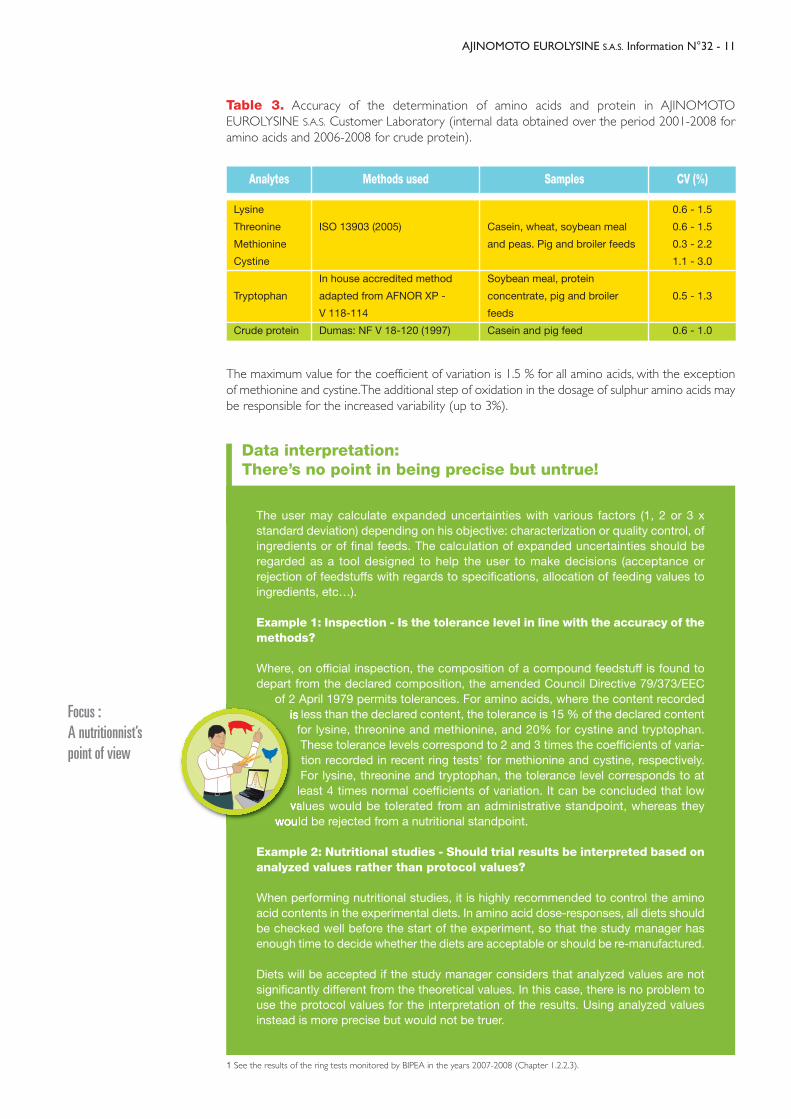
Table 3. Accuracy of the determination of amino acids and protein in AJINOMOTO EUROLYSINE S.A.S. Customer Laboratory (internal data obtained over the period 2001-2008 foramino acids and 2006-2008 for crude protein).
The maximum value for the coefficient of variation is 1.5 % for all amino acids, with the exceptionof methionine and cystine. The additional step of oxidation in the dosage of sulphur amino acids maybe responsible for the increased variability (up to 3%).
AJINOMOTO EUROLYSINE S.A.S. Information N°32 - 11
The user may calculate expanded uncertainties with various factors (1, 2 or 3 x standard deviation) depending on his objective: characterization or quality control, ofingredients or of final feeds. The calculation of expanded uncertainties should be regarded as a tool designed to help the user to make decisions (acceptance or rejection of feedstuffs with regards to specifications, allocation of feeding values to ingredients, etc…).
Example 1: Inspection - Is the tolerance level in line with the accuracy of themethods?
Where, on official inspection, the composition of a compound feedstuff is found to depart from the declared composition, the amended Council Directive 79/373/EEC
of 2 April 1979 permits tolerances. For amino acids, where the content recordedis less than the declared content, the tolerance is 15 % of the declared content
for lysine, threonine and methionine, and 20% for cystine and tryptophan.These tolerance levels correspond to 2 and 3 times the coefficients of varia-tion recorded in recent ring tests1 for methionine and cystine, respectively.For lysine, threonine and tryptophan, the tolerance level corresponds to at
least 4 times normal coefficients of variation. It can be concluded that low values would be tolerated from an administrative standpoint, whereas they
would be rejected from a nutritional standpoint.
Example 2: Nutritional studies - Should trial results be interpreted based onanalyzed values rather than protocol values?
When performing nutritional studies, it is highly recommended to control the aminoacid contents in the experimental diets. In amino acid dose-responses, all diets shouldbe checked well before the start of the experiment, so that the study manager has enough time to decide whether the diets are acceptable or should be re-manufactured.
Diets will be accepted if the study manager considers that analyzed values are not significantly different from the theoretical values. In this case, there is no problem touse the protocol values for the interpretation of the results. Using analyzed values instead is more precise but would not be truer.
Data interpretation: There’s no point in being precise but untrue!
1 See the results of the ring tests monitored by BIPEA in the years 2007-2008 (Chapter 1.2.2.3).
Lysine
Threonine
Methionine
Cystine
Tryptophan
Crude protein
ISO 13903 (2005)
In house accredited method
adapted from AFNOR XP -
V 118-114
Dumas: NF V 18-120 (1997)
Analytes Methods used
Casein, wheat, soybean meal
and peas. Pig and broiler feeds
Soybean meal, protein
concentrate, pig and broiler
feeds
Casein and pig feed
Samples
0.6 - 1.5
0.6 - 1.5
0.3 - 2.2
1.1 - 3.0
0.5 - 1.3
0.6 - 1.0
CV (%)
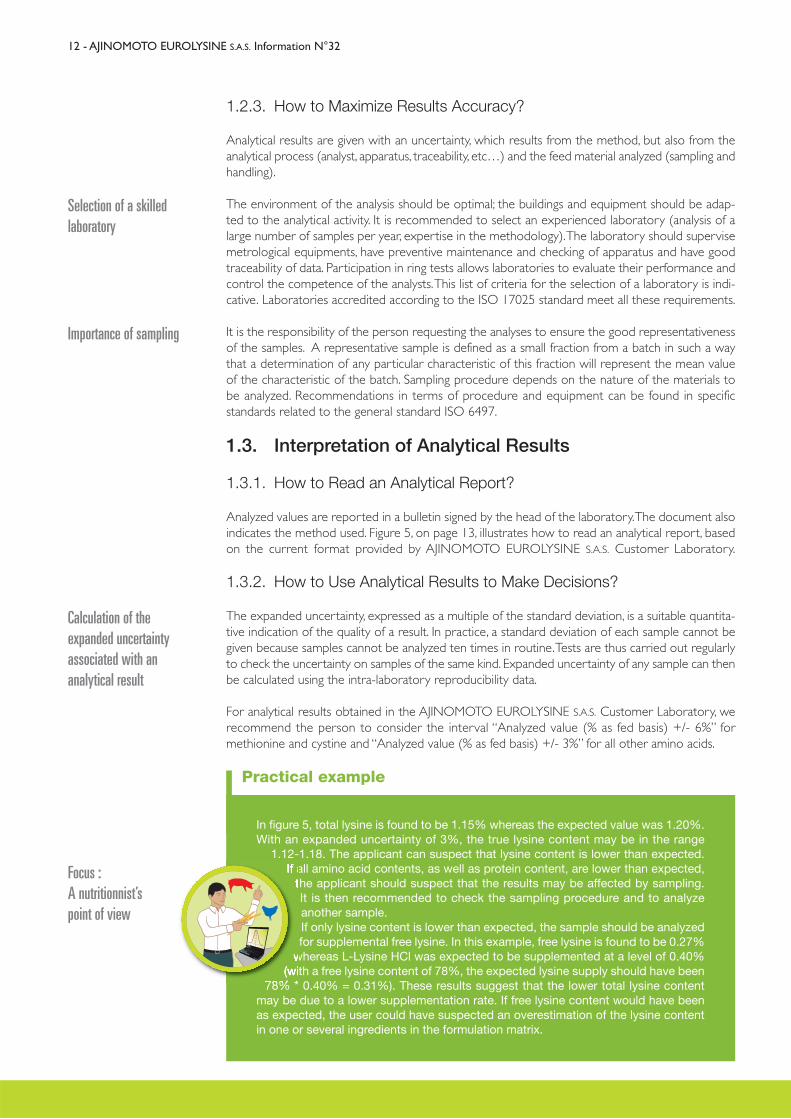
Focus :A nutritionnist’spoint of view
1.2.3. How to Maximize Results Accuracy?
Analytical results are given with an uncertainty, which results from the method, but also from theanalytical process (analyst, apparatus, traceability, etc…) and the feed material analyzed (sampling andhandling).
The environment of the analysis should be optimal; the buildings and equipment should be adap-ted to the analytical activity. It is recommended to select an experienced laboratory (analysis of alarge number of samples per year, expertise in the methodology). The laboratory should supervisemetrological equipments, have preventive maintenance and checking of apparatus and have goodtraceability of data. Participation in ring tests allows laboratories to evaluate their performance andcontrol the competence of the analysts. This list of criteria for the selection of a laboratory is indi-cative. Laboratories accredited according to the ISO 17025 standard meet all these requirements.
It is the responsibility of the person requesting the analyses to ensure the good representativenessof the samples. A representative sample is defined as a small fraction from a batch in such a waythat a determination of any particular characteristic of this fraction will represent the mean valueof the characteristic of the batch. Sampling procedure depends on the nature of the materials tobe analyzed. Recommendations in terms of procedure and equipment can be found in specific standards related to the general standard ISO 6497.
1.3. Interpretation of Analytical Results
1.3.1. How to Read an Analytical Report?
Analyzed values are reported in a bulletin signed by the head of the laboratory. The document alsoindicates the method used. Figure 5, on page 13, illustrates how to read an analytical report, basedon the current format provided by AJINOMOTO EUROLYSINE S.A.S. Customer Laboratory.
1.3.2. How to Use Analytical Results to Make Decisions?
The expanded uncertainty, expressed as a multiple of the standard deviation, is a suitable quantita-tive indication of the quality of a result. In practice, a standard deviation of each sample cannot begiven because samples cannot be analyzed ten times in routine. Tests are thus carried out regularlyto check the uncertainty on samples of the same kind. Expanded uncertainty of any sample can thenbe calculated using the intra-laboratory reproducibility data.
For analytical results obtained in the AJINOMOTO EUROLYSINE S.A.S. Customer Laboratory, werecommend the person to consider the interval “Analyzed value (% as fed basis) +/- 6%” for methionine and cystine and “Analyzed value (% as fed basis) +/- 3%” for all other amino acids.
12 - AJINOMOTO EUROLYSINE S.A.S. Information N°32
Selection of a skilledlaboratory
Calculation of the expanded uncertaintyassociated with an analytical result
Importance of sampling
Practical example
In figure 5, total lysine is found to be 1.15% whereas the expected value was 1.20%.With an expanded uncertainty of 3%, the true lysine content may be in the range
1.12-1.18. The applicant can suspect that lysine content is lower than expected.If all amino acid contents, as well as protein content, are lower than expected,
the applicant should suspect that the results may be affected by sampling. It is then recommended to check the sampling procedure and to analyze another sample.If only lysine content is lower than expected, the sample should be analyzedfor supplemental free lysine. In this example, free lysine is found to be 0.27%
whereas L-Lysine HCl was expected to be supplemented at a level of 0.40%(with a free lysine content of 78%, the expected lysine supply should have been
78% * 0.40% = 0.31%). These results suggest that the lower total lysine contentmay be due to a lower supplementation rate. If free lysine content would have beenas expected, the user could have suspected an overestimation of the lysine contentin one or several ingredients in the formulation matrix.
Focus :A nutritionnist’spoint of view
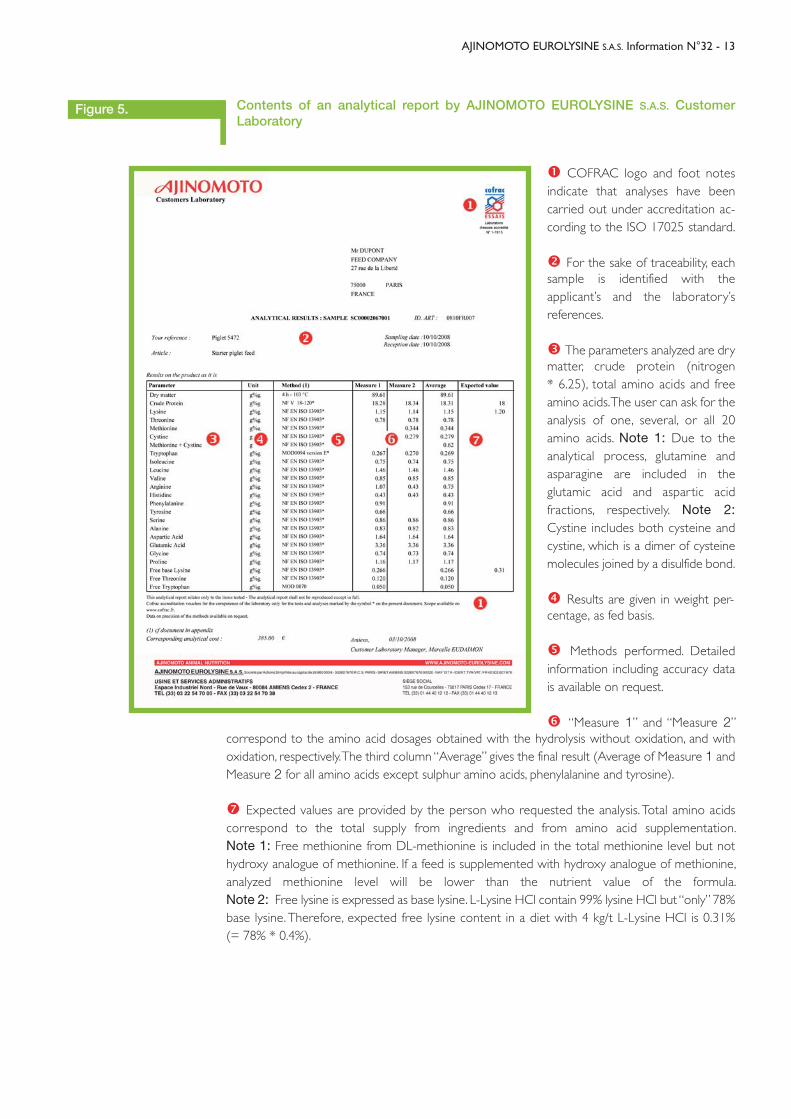
� COFRAC logo and foot notes indicate that analyses have been carried out under accreditation ac-cording to the ISO 17025 standard.
� For the sake of traceability, eachsample is identified with the applicant’s and the laboratory’s references.
� The parameters analyzed are drymatter, crude protein (nitrogen * 6.25), total amino acids and freeamino acids. The user can ask for theanalysis of one, several, or all 20amino acids. Note 1: Due to the analytical process, glutamine and asparagine are included in the glutamic acid and aspartic acid fractions, respectively. Note 2: Cystine includes both cysteine andcystine, which is a dimer of cysteinemolecules joined by a disulfide bond.
� Results are given in weight per-centage, as fed basis.
� Methods performed. Detailed information including accuracy datais available on request.
� “Measure 1” and “Measure 2”correspond to the amino acid dosages obtained with the hydrolysis without oxidation, and with oxidation, respectively. The third column “Average” gives the final result (Average of Measure 1 andMeasure 2 for all amino acids except sulphur amino acids, phenylalanine and tyrosine).
Expected values are provided by the person who requested the analysis. Total amino acids correspond to the total supply from ingredients and from amino acid supplementation. Note 1: Free methionine from DL-methionine is included in the total methionine level but not hydroxy analogue of methionine. If a feed is supplemented with hydroxy analogue of methionine,analyzed methionine level will be lower than the nutrient value of the formula. Note 2: Free lysine is expressed as base lysine. L-Lysine HCl contain 99% lysine HCl but “only” 78%base lysine. Therefore, expected free lysine content in a diet with 4 kg/t L-Lysine HCl is 0.31% (= 78% * 0.4%).
AJINOMOTO EUROLYSINE S.A.S. Information N°32 - 13
Contents of an analytical report by AJINOMOTO EUROLYSINE S.A.S. Customer Laboratory
Figure 5.
14 - AJINOMOTO EUROLYSINE S.A.S. Information N°32
0.0030.0040.0080.0020.0030.0010.0070.0050.0040.0230.0000.0130.0210.1110.0110.0070.0110.0120.0170.0130.0080.0050.0130.0920.0070.0040.003
Mean0.0010.0020.0040.0010.001
0.0040.0070.0060.0110.0000.0030.0360.0970.0030.002
0.0030.0120.0330.0070.004
0.0450.001
Std1%1%3%1%1%0%1%0%1%2%0%0%1%3%0%0%1%1%0%1%1%0%1%2%0%2%31%
% tot642635293212133312251191711152122115547243322
Wheat BarleyCornTriticaleOatsRiceWheat middlingsWheat glutenWheat DDGSCorn glutenRice proteinSoybean mealFull fat soyaSoya prot. conc. 52-56%Soya prot. conc. 65%Rapeseed mealSunflower mealPeasPotato proteinMilkWhey powderWhey protein conc.YoghurtFish mealPlasma Bakery by-productsTapioca
n
Native Free Lys %
0.0010.0020.0010.0120.0000.0000.0010.0030.0020.0180.0000.0010.0250.0000.0000.0000.0010.0000.0070.0050.0040.0010.0050.0660.0040.0010.007
Mean0.0040.0060.0040.0130.000
0.0030.0050.0040.0240.0000.0050.0470.0010.0000.000
0.0000.0070.0050.0050.001
0.0440.002
Std0%0%0%4%0%0%0%0%0%1%0%0%2%0%0%0%0%0%0%1%1%0%0%2%0%1%
82%
% tot
Native Free Thr %
Cereals
Cerealsby-products
Vegetableproteinsources
Dairyproducts
Misc.
10.110.07.410.011.16.713.378.129.862.962.544.835.452.265.030.423.919.181.024.511.933.635.662.678.79.01.4
Mean3.13.93.13.74.53.94.51.62.21.63.16.36.36.26.46.24.17.77.67.88.68.76.28.68.52.80.7
Lys3.13.63.73.43.73.73.72.53.33.23.74.04.04.04.04.94.14.05.54.46.46.54.04.65.83.30.6
Thr1.71.72.01.81.73.11.71.51.62.03.11.41.41.41.42.22.51.02.12.21.51.81.33.10.91.61.7
Met2.32.22.22.43.12.32.22.02.01.62.21.41.41.41.32.61.71.51.31.02.12.31.40.93.12.01.5
Cys1.41.40.81.21.51.51.91.01.20.51.51.41.41.41.41.51.51.01.41.41.71.81.31.21.71.21.7
Trp642635293212133312251191711152122115547243322
Wheat BarleyCornTriticaleOatsRiceWheat middlingsWheat glutenWheat DDGSCorn glutenRice proteinSoybean mealFull fat soyaSoya prot. conc. 52-56%Soya prot. conc. 65%Rapeseed mealSunflower mealPeasPotato proteinMilkWhey powderWhey protein conc.YoghurtFish mealPlasma Bakery by-productsTapioca
n
∑AA, % Mean amino acid profile =
Cereals
Cerealsby-products
Vegetableproteinsources
Dairyproducts
Misc.
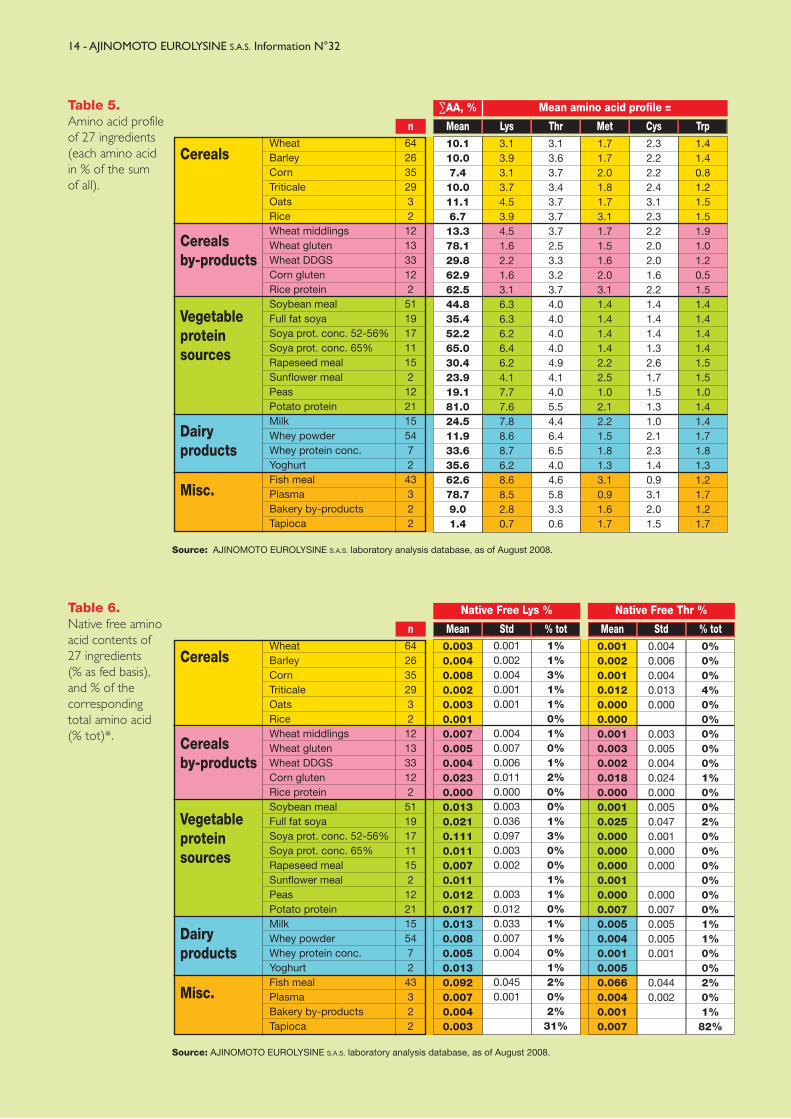
Table 6.Native free aminoacid contents of 27 ingredients (% as fed basis),and % of the corresponding total amino acid (% tot)*.
Table 5.Amino acid profile of 27 ingredients (each amino acid in % of the sum of all).
Source: AJINOMOTO EUROLYSINE S.A.S. laboratory analysis database, as of August 2008.
Source: AJINOMOTO EUROLYSINE S.A.S. laboratory analysis database, as of August 2008.
AJINOMOTO EUROLYSINE S.A.S. Information N°32 - 15
0.0000.0010.0010.0010.0000.0000.0000.0030.0010.0200.0000.0040.0130.0030.0000.0000.0020.0010.0040.0030.0010.0010.0180.0330.0040.0010.000
Mean0.0010.0010.0010.0010.000
0.0010.0080.0030.0090.0000.0020.0300.0040.0000.000
0.0010.0030.0090.0010.001
0.0350.005
Std0%0%0%0%0%0%0%0%0%2%0%1%2%0%0%0%0%0%0%1%0%0%4%2%1%1%0%
% tot
Native Free Met%
0.0250.0090.0010.0150.0090.0010.0690.0130.0050.0150.0000.0240.0210.0250.0020.0050.0330.0070.0050.0030.0010.0010.0230.0080.0080.0060.004
Mean0.0090.0040.0010.0080.003
0.0300.0040.0090.0030.0000.0040.0090.0060.0020.001
0.0010.0040.0060.0010.004
0.0070.004
Std17%7%2%
12%6%1%
26%2%1%4%0%4%4%4%0%1%9%3%0%1%0%0%5%1%1%5%
13%
% tot
Native Free Trp %
0.0030.0050.0050.0040.0030.0020.0070.0060.0100.0370.0000.0080.0070.0150.0000.0090.0080.0070.0180.0060.0060.0020.0100.1030.0120.0090.005
Mean0.0020.0030.0020.0020.001
0.0030.0090.0160.0180.0000.0030.0030.0060.0000.002
0.0020.0140.0110.0070.003
0.0610.004
Std1%1%1%1%1%1%1%0%1%1%0%0%0%1%0%1%1%1%0%1%1%0%1%3%0%2%6%
% tot
Native Free Val %
0.0120.0090.0110.0130.0070.0040.0360.0150.0050.0140.0000.1480.1100.1640.1290.0180.0360.2650.0480.0140.0060.0040.1660.0600.0030.0090.023
Mean0.0050.0040.0050.0060.001
0.0230.0180.0040.0180.0000.0360.0410.0470.0380.004
0.0790.0350.0210.0050.002
0.0370.002
Std2%2%3%3%1%1%4%1%0%1%0%4%4%4%3%1%2%15%1%2%2%0%6%2%0%2%22%
% tot
Native Free Arg %
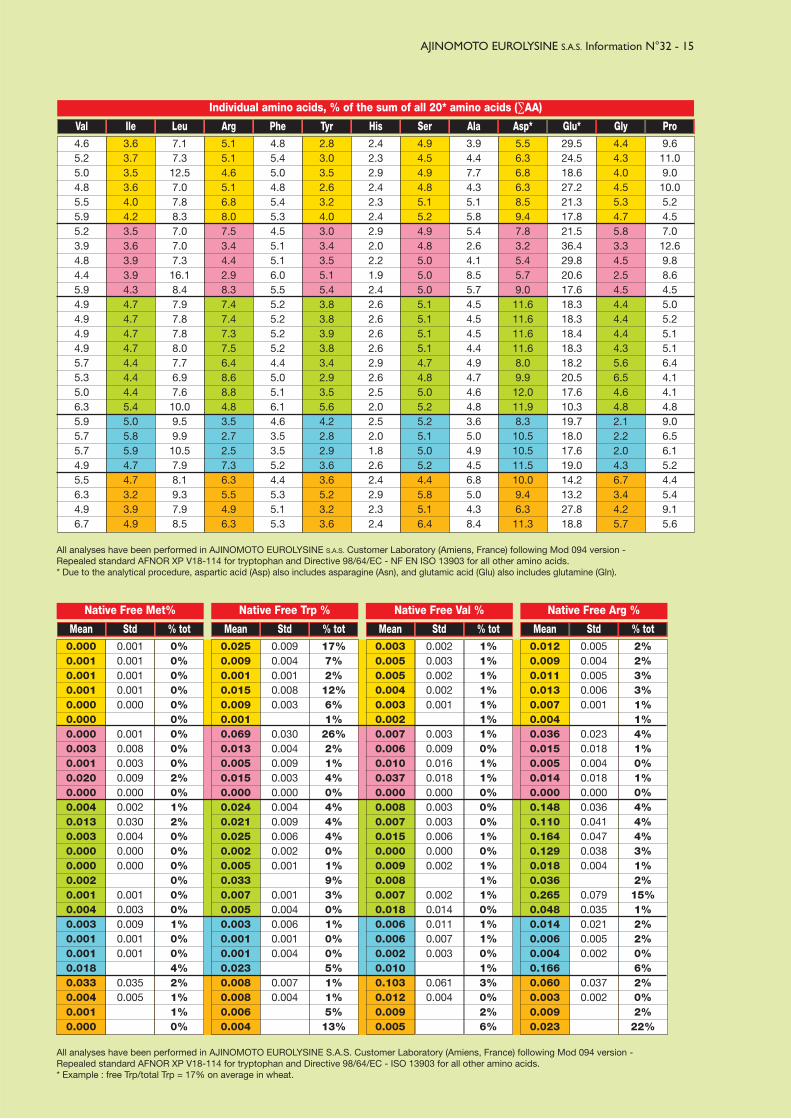
All analyses have been performed in AJINOMOTO EUROLYSINE S.A.S. Customer Laboratory (Amiens, France) following Mod 094 version - Repealed standard AFNOR XP V18-114 for tryptophan and Directive 98/64/EC - ISO 13903 for all other amino acids.* Example : free Trp/total Trp = 17% on average in wheat.
All analyses have been performed in AJINOMOTO EUROLYSINE S.A.S. Customer Laboratory (Amiens, France) following Mod 094 version - Repealed standard AFNOR XP V18-114 for tryptophan and Directive 98/64/EC - NF EN ISO 13903 for all other amino acids.* Due to the analytical procedure, aspartic acid (Asp) also includes asparagine (Asn), and glutamic acid (Glu) also includes glutamine (Gln).
4.65.25.04.85.55.95.23.94.84.45.94.94.94.94.95.75.35.06.35.95.75.74.95.56.34.96.7
Val3.63.73.53.64.04.23.53.63.93.94.34.74.74.74.74.44.44.45.45.05.85.94.74.73.23.94.9
Ile7.17.312.57.07.88.37.07.07.316.18.47.97.87.88.07.76.97.610.09.59.910.57.98.19.37.98.5
Leu5.15.14.65.16.88.07.53.44.42.98.37.47.47.37.56.48.68.84.83.52.72.57.36.35.54.96.3
Arg4.85.45.04.85.45.34.55.15.16.05.55.25.25.25.24.45.05.16.14.63.53.55.24.45.35.15.3
Phe2.83.03.52.63.24.03.03.43.55.15.43.83.83.93.83.42.93.55.64.22.82.93.63.65.23.23.6
Tyr2.42.32.92.42.32.42.92.02.21.92.42.62.62.62.62.92.62.52.02.52.01.82.62.42.92.32.4
His4.94.54.94.85.15.24.94.85.05.05.05.15.15.15.14.74.85.05.25.25.15.05.24.45.85.16.4
Ser3.94.47.74.35.15.85.42.64.18.55.74.54.54.54.44.94.74.64.83.65.04.94.56.85.04.38.4
Ala5.56.36.86.38.59.47.83.25.45.79.011.611.611.611.68.09.912.011.98.310.510.511.510.09.46.311.3
Asp*29.524.518.627.221.317.821.536.429.820.617.618.318.318.418.318.220.517.610.319.718.017.619.014.213.227.818.8
Glu*4.44.34.04.55.34.75.83.34.52.54.54.44.44.44.35.66.54.64.82.12.22.04.36.73.44.25.7
Gly9.611.09.010.05.24.57.012.69.88.64.55.05.25.15.16.44.14.14.89.06.56.15.24.45.49.15.6
Pro
Individual amino acids, % of the sum of all 20* amino acids (∑AA)
2. Predicting Amino Acid Contents in Feedstuffs
The best estimation of amino acid contents is based on the analysis of a representative feedstuff sample. Amino acid analyses however are generally not performed routinely in the feed industry, because the method requires specific apparatus, dedicated analyst, and time (it takes at least a weekto get results, while the ingredients might already have been mixed in the feed mill). In practice, formulators will have recourse to indirect estimations of the amino acid contents.
One technique consists of the accumulation of analyses of batches of ingredients of the same type,statistical analysis of the dataset, elaboration of a model and utilization of the model with a view offorecasting the value of a new sample.
A collaborative study between the Customer Laboratory and the Nutrition Department of AJINOMOTO EUROLYSINE S.A.S. is presented below. It shows how a database can be used in twodifferent ways as a support for the prediction of amino acid contents in various feedstuffs categories.
2.1. AJINOMOTO EUROLYSINE S.A.S. Feedstuffs Database
AJINOMOTO EUROLYSINE S.A.S. Customer Laboratory routinely analyzes feedstuffs and recordsthe results in a database. This document is built on the basis of the results recorded since the year2003. All total and native free amino acid contents, including tryptophan, have been determined inevery sample, as well as nitrogen.
Samples have been collected in Europe. They have been classified into feedstuffs categories, whichmight sound quite generic to the formulator (e.g. whey powders include sweet, acid, and non-specified products). Indeed precise description has not always been available at the time ofsampling, with the result that larger categories may include sub-populations. Within-feedstuff variability is therefore magnified, compared to the variability that could be observed in one feed millbuying products on more restrictive specifications. An extended range of variations can however be considered as an advantage with regard to our objective of prediction.
At the date of writing, and after the withdrawal of outliers, AJINOMOTO EUROLYSINE S.A.S.
Feedstuffs Database contains more than 500 samples, grouped in 27 feedstuffs categories. For clarification, a brief description of some categories is given below.
• Wheat: Most samples were identified as whole seeds. Some samples of processed wheat such as extruded wheat have also been included.
• Corn: Most samples were identified as whole seeds. Some samples of processed corn (for very young piglets) have also been included.
• Triticale: All samples were collected in France in 2006.
• Rice: Samples were collected in Spain and include cooked rice.
• Wheat middlings: Samples were identified either as wheat middlings or wheat bran.Because ranges of crude protein (nitrogen * 6.25) and amino acid contents were almostcompletely overlapping, the two populations were put together.
• Soybean meal: Samples were identified as soybean meal 43, 44, 48, 50 or high. The category includes toasted soybean meals. Samples were collected in Europe with various origins (when mentioned) such as Argentina, Brazil and Italy.
16 - AJINOMOTO EUROLYSINE S.A.S. Information N°32
AJINOMOTO EUROLYSINE S.A.S.
Feedstuffs Database includes more than 500samples grouped in 27feedstuffs categories
• Full fat soya: Samples were identified as whole seeds. When mentioned, process was dehulling, toasting, extrusion and/or expansion. The category includes genetically modified(GM) and non-GM seeds. Samples were collected in Europe with various origins including the US and Brazil.
• Soybean protein concentrate 52-56%: All samples show a crude protein contentbelow 60%. This category includes products identified with 52%, 55% or 56% crude protein.
• Soybean protein concentrate 65%: All samples have a crude protein contentabove 60%. This category includes products identified with 65% crude protein.
• Potato protein: This category includes products identified with 76.5%, 78% or 79.5% crude protein.
• Milk: This category pools a large variety of dried dairy products. It includes buttermilkand milk powders, without further identification, or identified as delactosed, defatted or denatured.
• Whey powder: Samples were identified as whey powders, without indication or oneor several of the following ones: sweet, acid, low lactose, delactosed, filled with fat.
• Fish meal: This category pools a large variety of products. Indications include herringmeal, standard or low temperature or low ash, 70% or 72% crude protein. Origins include Chile, Peru and North Atlantic.
2.2. Univariate Models Lead to Table Values
2.2.1. Total Amino Acid Contents in 27 Feedstuffs
Table 4 on the first flap presents the descriptive statistics for each individual amino acid in the 27feedstuffs. Minimum and maximum contents (on % as fed basis) as well as coefficients of variationprovide an insight of the within-feedstuffs variability. Moreover, the closeness in agreement betweenthe arithmetic mean and the median is a sign that the distribution of samples may be Gaussian.
For the prediction of the values of a new sample (not included in the dataset), it is common to usethe average of the observations in the dataset. However the user could select the median, the mode(not shown), etc…
2.2.2. Mean Amino Acid Profiles
For feedstuffs comparison, the reader can refer to the amino acid profiles: each amino acid is expressed as a fraction of their sum (on a weight basis). Table 5 on pages 14-15 presents the meanamino acid profile of the 27 feedstuffs.
Soya products (full fat soya, soybean meal and various soybean protein concentrates) show very similar profiles. Dairy products on the contrary have contrasted profiles. Indeed, the proteins of thewhey fraction of milk (lactoglobulines and lactalbumines) contain more lysine, threonine, cystine andtryptophan than caseins, resulting in a more interesting amino acid profile from a nutritional standpoint.
AJINOMOTO EUROLYSINE S.A.S. Information N°32 - 17
Table of compositionand within-feedstuffsvariability
Mean amino acid profiles and between-feedstuffs variability
18 - AJINOMOTO EUROLYSINE S.A.S. Information N°32
Amino acid profile vs. protein profile
In publications from other authors (Sauvant et al., 2004 for instance), aminoacid profiles are generally expressed as a percentage of crude protein (CP), defined as nitrogen content * 6.25. The purpose is to give a practical tool toadapt the amino acid contents (on % as fed basis) once nitrogen has beenmeasured in a sample.
In ingredients however, nitrogen from the proteins only accounts for a fractionof the total nitrogen content, and this fraction depends on the feedstuffs. Profiles
established on CP under-estimate the amino acid contributions of all amino acids infeedstuffs where the non-protein fraction is considerably high (e.g. fish meal) and aretherefore not adapted for feedstuffs comparisons.
For the same reason, profiles from different tables (established on CP or on the sumof all amino acids) should be compared with care. Although not recommended, ourprofile can be converted into a profile based on CP, using mean CP contents reported in Table 8 on page 22.
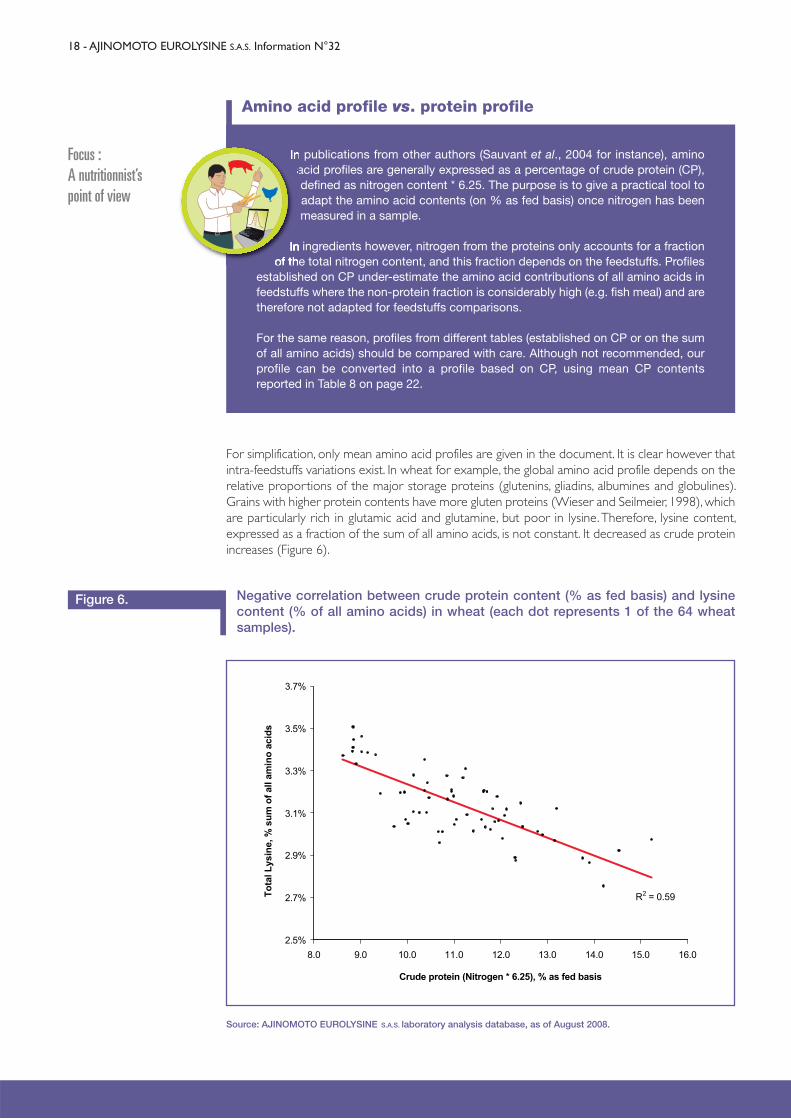
For simplification, only mean amino acid profiles are given in the document. It is clear however thatintra-feedstuffs variations exist. In wheat for example, the global amino acid profile depends on therelative proportions of the major storage proteins (glutenins, gliadins, albumines and globulines).Grains with higher protein contents have more gluten proteins (Wieser and Seilmeier, 1998), whichare particularly rich in glutamic acid and glutamine, but poor in lysine. Therefore, lysine content, expressed as a fraction of the sum of all amino acids, is not constant. It decreased as crude proteinincreases (Figure 6).
Negative correlation between crude protein content (% as fed basis) and lysinecontent (% of all amino acids) in wheat (each dot represents 1 of the 64 wheat samples).
Source: AJINOMOTO EUROLYSINE S.A.S. laboratory analysis database, as of August 2008.
Figure 6.
Focus :A nutritionnist’spoint of view
AJINOMOTO EUROLYSINE S.A.S. Information N°32 - 19
2.2.3. Native Free Amino Acid Contents
In feedstuffs, amino acids are mainly included in proteins, but a small fraction, generally less than 2%,is present in a free form.
Native free lysine, threonine and methionine contents in all 27 feedstuffs are low (Table 6, on pages14-15). The supply from feedstuffs is negligible, compared to usual supplementation levels. Consequently, the analysis of free amino acids in a diet supplemented with feed-use amino acids willgive a good estimate of lysine, threonine and methionine supplementation.
Considerable amounts of native free tryptophan (completely free or bound to albumin for circulation) can be found in wheat (grains and by-products) and in soya. It is therefore recommen-ded to take into account the native content of the feedstuffs when L-tryptophan supplementationis estimated based on free tryptophan analysis. Table 6 provides information on the native free tryptophan levels observed in the 27 feedstuffs.
It can be noted that some feedstuffs also contain considerable amounts of native free arginine.Conversely, the native free fractions of valine (Table 6) and isoleucine (data not shown) are generally negligible.
2.3. Bivariate Models Lead to Predictive Equations
Amino acid profiles of ingredients are affected by changes in the relative proportions of the constitutive proteins. Amino acid levels do not vary independently. This characteristic can be usedto improve predictions.
2.3.1. Correlations Between Amino Acid Contents
For the 18 feedstuffs with at least 10 samples, correlations were searched between the individualamino acids (153 correlations per feedstuff in total).
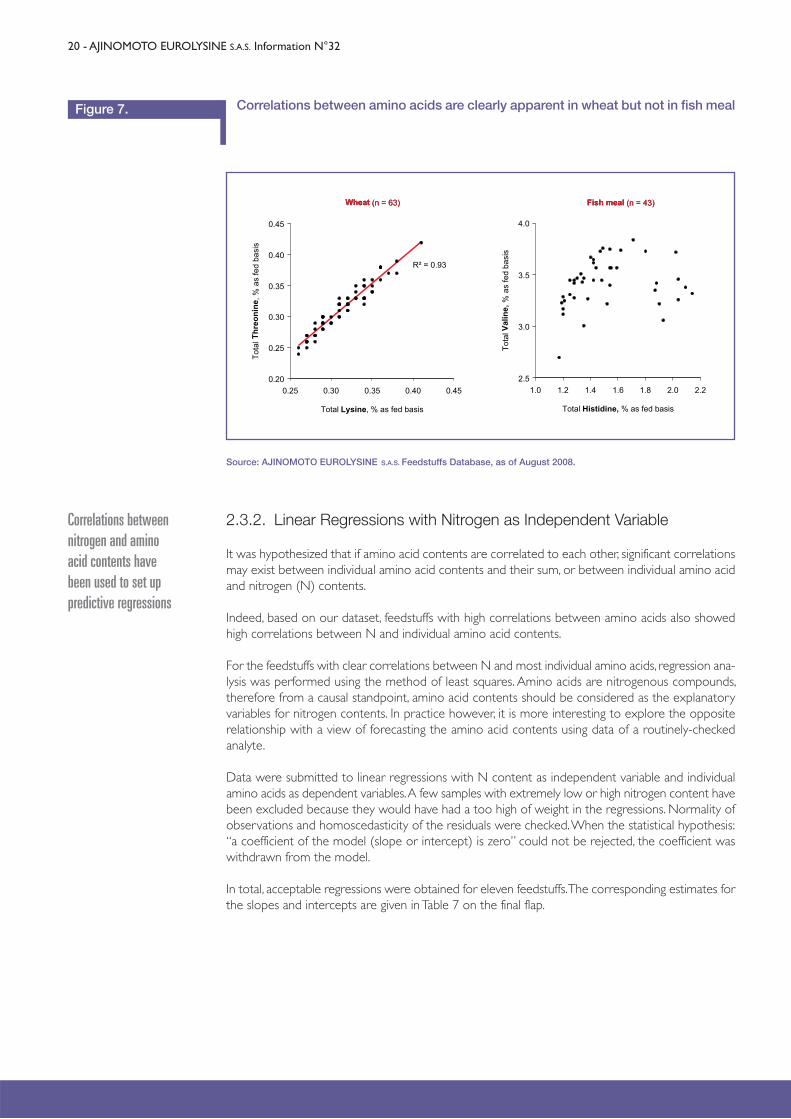
Positive and high correlation coefficients (r > 0.80) were found for almost all amino acids in the following ingredients: wheat, barley, milk and whey powder (Figure 7). On the contrary, poor correlation coefficients (׀r׀ < 0.50) were found for most amino acids in the following ingredients:whey protein concentrate, wheat gluten, wheat middlings, wheat DDGS, full fat soya, soya proteinconcentrates 52-56%, corn, fish meal, RSM and corn gluten. The remaining ingredients (triticale, soybean meal, soya protein concentrates 65%, potato protein and peas) showed variable correlation coefficients depending on the amino acids considered.
At least two reasons might explain the poor correlations.
First, industrial products like potato protein, wheat gluten or corn gluten have standardized specifications. Since nitrogen content varies within a short range, it is difficult to characterize variability.
At the opposite, some categories like fish meal contain very different products. In the absence ofadequate information, it was not possible to distinguish sub-populations. Some correlations mightexist in sub-populations, but have been masked on a global basis. It is well known for example thatfish meal made from tuna contains more histidine than others. Figure 7, on page 20, shows how correlation between valine and histidine appears when samples with high histidine contents are excluded from the dataset.
It can be concluded that the absence of correlations between amino acids in some feedstuffs shouldnot be regarded as an internal characteristic of the ingredients but may result from dataset artifacts.
α-amino acids aremainly but not exclusively included in peptidic chains infeedstuffs
Correlations betweenamino acid contents canbe observed in variousfeedstuffs categories
20 - AJINOMOTO EUROLYSINE S.A.S. Information N°32
2.3.2. Linear Regressions with Nitrogen as Independent Variable
It was hypothesized that if amino acid contents are correlated to each other, significant correlationsmay exist between individual amino acid contents and their sum, or between individual amino acidand nitrogen (N) contents.
Indeed, based on our dataset, feedstuffs with high correlations between amino acids also showedhigh correlations between N and individual amino acid contents.
For the feedstuffs with clear correlations between N and most individual amino acids, regression ana-lysis was performed using the method of least squares. Amino acids are nitrogenous compounds,therefore from a causal standpoint, amino acid contents should be considered as the explanatoryvariables for nitrogen contents. In practice however, it is more interesting to explore the oppositerelationship with a view of forecasting the amino acid contents using data of a routinely-checked analyte.
Data were submitted to linear regressions with N content as independent variable and individualamino acids as dependent variables. A few samples with extremely low or high nitrogen content havebeen excluded because they would have had a too high of weight in the regressions. Normality ofobservations and homoscedasticity of the residuals were checked. When the statistical hypothesis:“a coefficient of the model (slope or intercept) is zero” could not be rejected, the coefficient was withdrawn from the model.
In total, acceptable regressions were obtained for eleven feedstuffs. The corresponding estimates forthe slopes and intercepts are given in Table 7 on the final flap.
Correlations between amino acids are clearly apparent in wheat but not in fish meal Figure 7.
Source: AJINOMOTO EUROLYSINE S.A.S. Feedstuffs Database, as of August 2008.
Correlations betweennitrogen and amino acid contents have been used to set up predictive regressions
AJINOMOTO EUROLYSINE S.A.S. Information N°32 - 21
2.4. Risk Management in Feedstuffs Evaluation
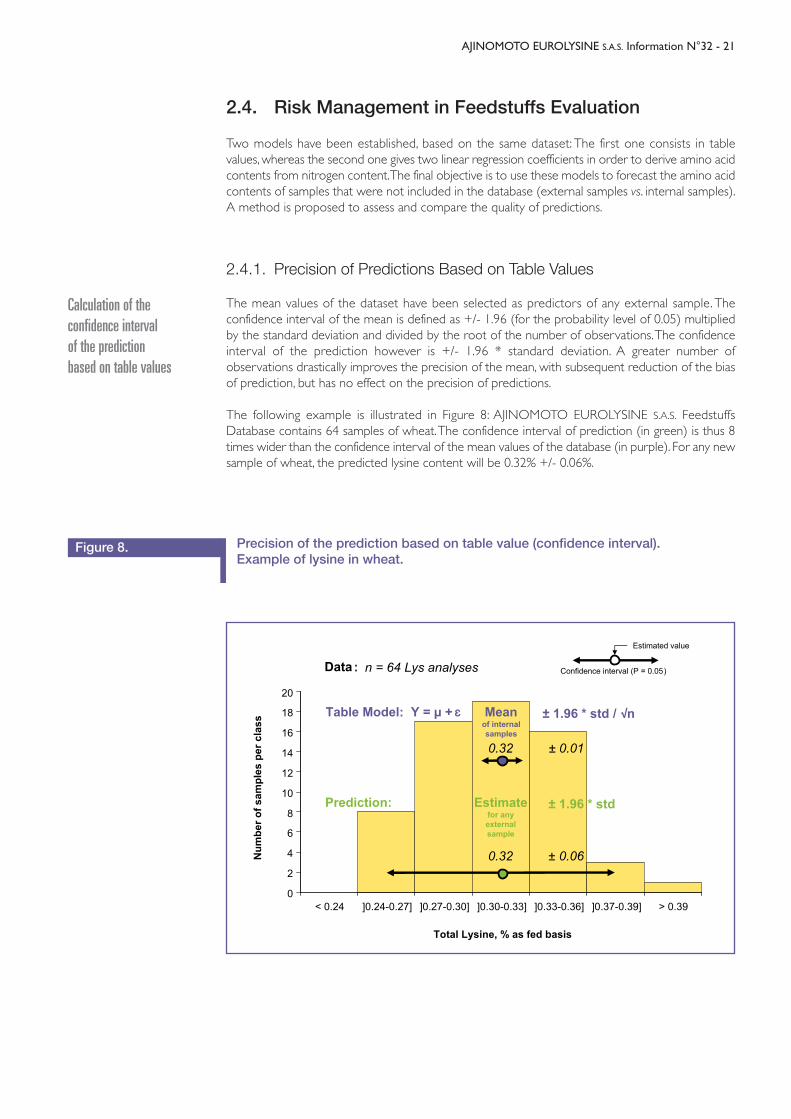
Two models have been established, based on the same dataset: The first one consists in table values, whereas the second one gives two linear regression coefficients in order to derive amino acidcontents from nitrogen content. The final objective is to use these models to forecast the amino acidcontents of samples that were not included in the database (external samples vs. internal samples).A method is proposed to assess and compare the quality of predictions.
Precision of the prediction based on table value (confidence interval).Example of lysine in wheat.
Figure 8.
3 √
2.4.1. Precision of Predictions Based on Table Values
The mean values of the dataset have been selected as predictors of any external sample. The confidence interval of the mean is defined as +/- 1.96 (for the probability level of 0.05) multipliedby the standard deviation and divided by the root of the number of observations. The confidenceinterval of the prediction however is +/- 1.96 * standard deviation. A greater number of observations drastically improves the precision of the mean, with subsequent reduction of the biasof prediction, but has no effect on the precision of predictions.
The following example is illustrated in Figure 8: AJINOMOTO EUROLYSINE S.A.S. Feedstuffs Database contains 64 samples of wheat. The confidence interval of prediction (in green) is thus 8times wider than the confidence interval of the mean values of the database (in purple). For any newsample of wheat, the predicted lysine content will be 0.32% +/- 0.06%.
Calculation of the confidence interval of the prediction based on table values
22 - AJINOMOTO EUROLYSINE S.A.S. Information N°32
Source: AJINOMOTO EUROLYSINE S.A.S. laboratory analysis database, as of August 2008. All nitrogen analyses have been performed in AJINOMOTO EUROLYSINE S.A.S. Customer Laboratory (Amiens, France) following Dumas method NF V18-120.
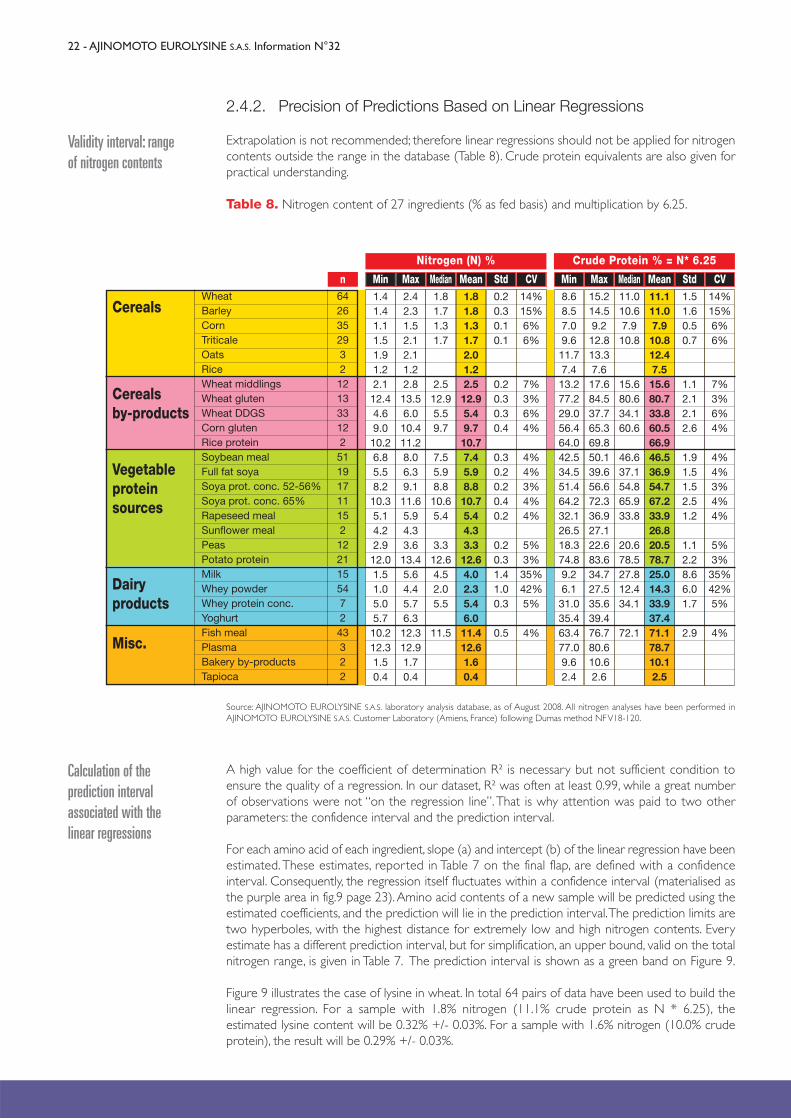
2.4.2. Precision of Predictions Based on Linear Regressions
Extrapolation is not recommended; therefore linear regressions should not be applied for nitrogencontents outside the range in the database (Table 8). Crude protein equivalents are also given forpractical understanding.
Table 8. Nitrogen content of 27 ingredients (% as fed basis) and multiplication by 6.25.
Validity interval: rangeof nitrogen contents
1.41.41.11.51.91.22.112.44.69.010.26.85.58.210.35.14.22.912.01.51.05.05.710.212.31.50.4
2.42.31.52.12.11.22.813.56.010.411.28.06.39.111.65.94.33.613.45.64.45.76.312.312.91.70.4
1.81.71.31.7
2.512.95.59.7
7.55.98.810.65.4
3.312.64.52.05.5
11.5
1.81.81.31.72.01.22.512.95.49.710.77.45.98.810.75.44.33.312.64.02.35.46.011.412.61.60.4
0.20.30.10.1
0.20.30.30.4
0.30.20.20.40.2
0.20.31.41.00.3
0.5
14%15%6%6%
7%3%6%4%
4%4%3%4%4%
5%3%35%42%5%
4%
Min642635293212133312251191711152122115547243322
Wheat BarleyCornTriticaleOatsRiceWheat middlingsWheat glutenWheat DDGSCorn glutenRice proteinSoybean mealFull fat soyaSoya prot. conc. 52-56%Soya prot. conc. 65%Rapeseed mealSunflower mealPeasPotato proteinMilkWhey powderWhey protein conc.YoghurtFish mealPlasma Bakery by-productsTapioca
n Max Median Mean Std CV
Nitrogen (N) %
8.68.57.09.611.77.413.277.229.056.464.042.534.551.464.232.126.518.374.89.26.131.035.463.477.09.62.4
15.214.59.212.813.37.617.684.537.765.369.850.139.656.672.336.927.122.683.634.727.535.639.476.780.610.62.6
11.010.67.910.8
15.680.634.160.6
46.637.154.865.933.8
20.678.527.812.434.1
72.1
11.111.07.910.812.47.515.680.733.860.566.946.536.954.767.233.926.820.578.725.014.333.937.471.178.710.12.5
1.51.60.50.7
1.12.12.12.6
1.91.51.52.51.2
1.12.28.66.01.7
2.9
14%15%6%6%
7%3%6%4%
4%4%3%4%4%
5%3%35%42%5%
4%
Min Max Median Mean Std CV
Crude Protein % = N* 6.25
Cereals
Cerealsby-products
Vegetableproteinsources
Dairyproducts
Misc.
A high value for the coefficient of determination R² is necessary but not sufficient condition to ensure the quality of a regression. In our dataset, R² was often at least 0.99, while a great numberof observations were not “on the regression line”. That is why attention was paid to two other parameters: the confidence interval and the prediction interval.
For each amino acid of each ingredient, slope (a) and intercept (b) of the linear regression have been estimated. These estimates, reported in Table 7 on the final flap, are defined with a confidence interval. Consequently, the regression itself fluctuates within a confidence interval (materialised asthe purple area in fig.9 page 23). Amino acid contents of a new sample will be predicted using theestimated coefficients, and the prediction will lie in the prediction interval. The prediction limits aretwo hyperboles, with the highest distance for extremely low and high nitrogen contents. Every estimate has a different prediction interval, but for simplification, an upper bound, valid on the totalnitrogen range, is given in Table 7. The prediction interval is shown as a green band on Figure 9.
Figure 9 illustrates the case of lysine in wheat. In total 64 pairs of data have been used to build thelinear regression. For a sample with 1.8% nitrogen (11.1% crude protein as N * 6.25), the estimated lysine content will be 0.32% +/- 0.03%. For a sample with 1.6% nitrogen (10.0% crudeprotein), the result will be 0.29% +/- 0.03%.
Calculation of the prediction interval associated with the linear regressions
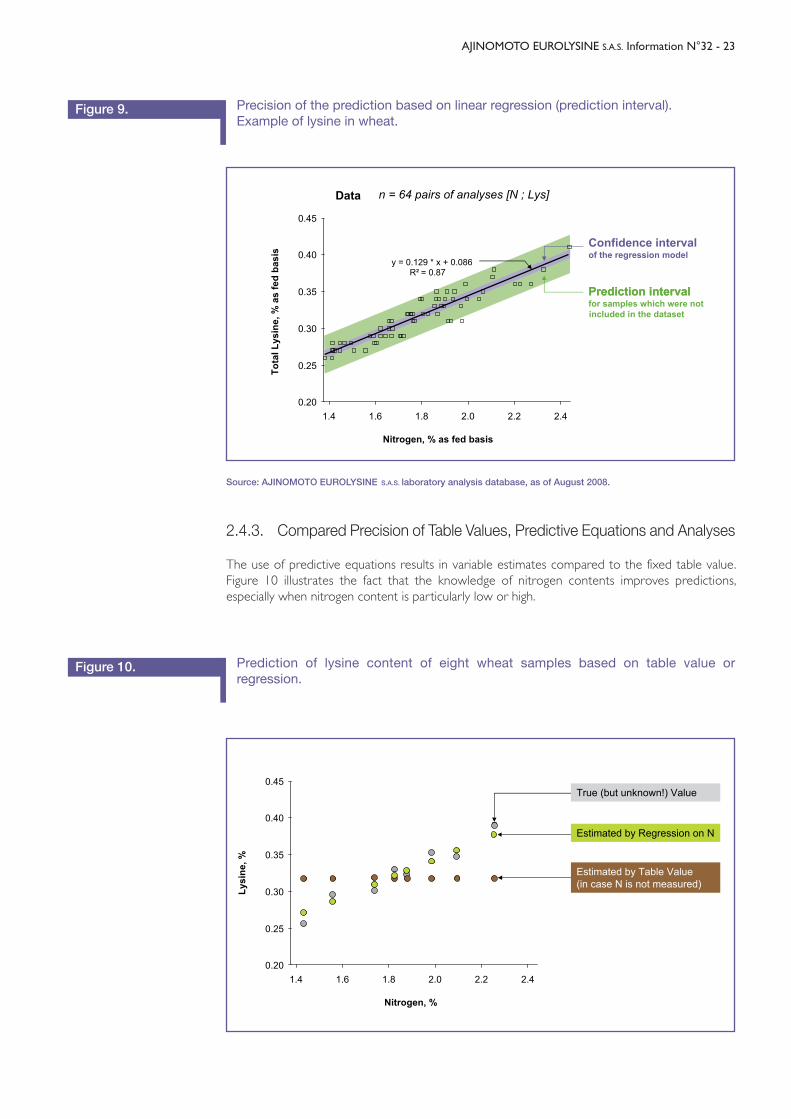
AJINOMOTO EUROLYSINE S.A.S. Information N°32 - 23
2.4.3. Compared Precision of Table Values, Predictive Equations and Analyses
The use of predictive equations results in variable estimates compared to the fixed table value. Figure 10 illustrates the fact that the knowledge of nitrogen contents improves predictions, especially when nitrogen content is particularly low or high.
Precision of the prediction based on linear regression (prediction interval).Example of lysine in wheat.
Figure 9.
Prediction of lysine content of eight wheat samples based on table value or regression.
Figure 10.
Source: AJINOMOTO EUROLYSINE S.A.S. laboratory analysis database, as of August 2008.
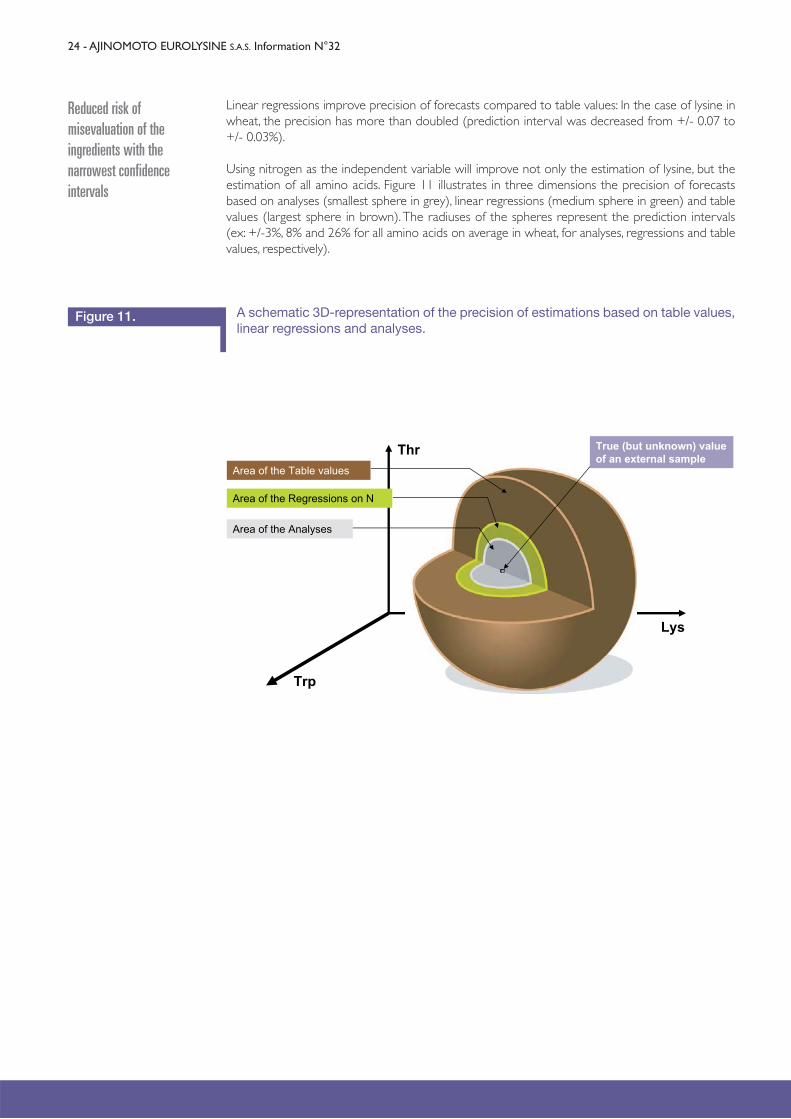
24 - AJINOMOTO EUROLYSINE S.A.S. Information N°32
Linear regressions improve precision of forecasts compared to table values: In the case of lysine inwheat, the precision has more than doubled (prediction interval was decreased from +/- 0.07 to+/- 0.03%).
Using nitrogen as the independent variable will improve not only the estimation of lysine, but theestimation of all amino acids. Figure 11 illustrates in three dimensions the precision of forecastsbased on analyses (smallest sphere in grey), linear regressions (medium sphere in green) and tablevalues (largest sphere in brown). The radiuses of the spheres represent the prediction intervals (ex: +/-3%, 8% and 26% for all amino acids on average in wheat, for analyses, regressions and tablevalues, respectively).
Reduced risk of misevaluation of the ingredients with thenarrowest confidenceintervals
A schematic 3D-representation of the precision of estimations based on table values, linear regressions and analyses.
Figure 11.
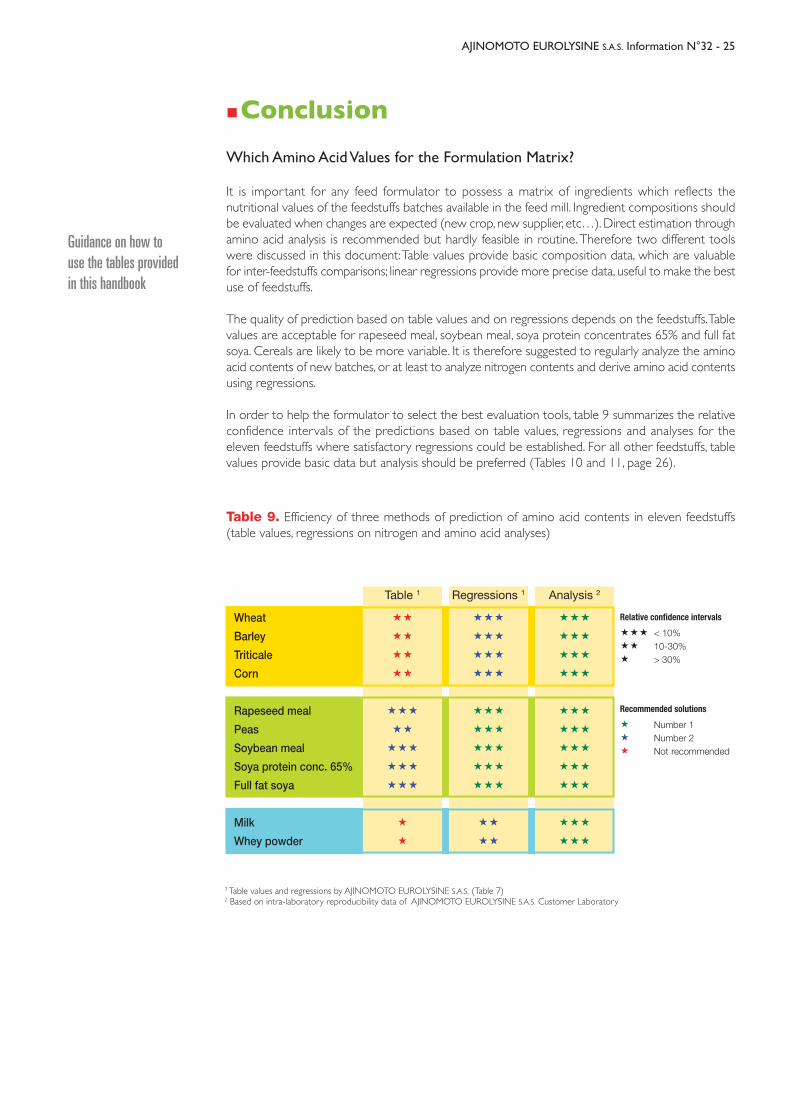
Wheat
Barley
Triticale
Corn
Rapeseed meal
Peas
Soybean meal
Soya protein conc. 65%
Full fat soya
Milk
Whey powder
Table 1
Regressions 1
Analysis 2
Relative confidence intervals
< 10% 10-30% > 30%
Recommended solutions
Number 1 Number 2 Not recommended
AJINOMOTO EUROLYSINE S.A.S. Information N°32 - 25
Table 9. Efficiency of three methods of prediction of amino acid contents in eleven feedstuffs(table values, regressions on nitrogen and amino acid analyses)
�Conclusion
Which Amino Acid Values for the Formulation Matrix?
It is important for any feed formulator to possess a matrix of ingredients which reflects the nutritional values of the feedstuffs batches available in the feed mill. Ingredient compositions shouldbe evaluated when changes are expected (new crop, new supplier, etc…). Direct estimation throughamino acid analysis is recommended but hardly feasible in routine. Therefore two different toolswere discussed in this document: Table values provide basic composition data, which are valuablefor inter-feedstuffs comparisons; linear regressions provide more precise data, useful to make the bestuse of feedstuffs.
The quality of prediction based on table values and on regressions depends on the feedstuffs. Tablevalues are acceptable for rapeseed meal, soybean meal, soya protein concentrates 65% and full fatsoya. Cereals are likely to be more variable. It is therefore suggested to regularly analyze the aminoacid contents of new batches, or at least to analyze nitrogen contents and derive amino acid contentsusing regressions.
In order to help the formulator to select the best evaluation tools, table 9 summarizes the relativeconfidence intervals of the predictions based on table values, regressions and analyses for the eleven feedstuffs where satisfactory regressions could be established. For all other feedstuffs, tablevalues provide basic data but analysis should be preferred (Tables 10 and 11, page 26).
Guidance on how to use the tables providedin this handbook
1 Table values and regressions by AJINOMOTO EUROLYSINE S.A.S. (Table 7)2 Based on intra-laboratory reproducibility data of AJINOMOTO EUROLYSINE S.A.S. Customer Laboratory

26 - AJINOMOTO EUROLYSINE S.A.S. Information N°32
Table 10. Efficiency of three methods of prediction of amino acid contents in seven feedstuffs withpoor regressions
1 Table values by AJINOMOTO EUROLYSINE S.A.S. (Table 7)2 Data not shown3 Based on intra-laboratory reproducibility data of AJINOMOTO EUROLYSINE S.A.S. Customer Laboratory
Table 11. Efficiency of three methods of prediction of amino acid contents in nine feedstuffs withno regressions tested due to the too small number of samples
1 Table values by AJINOMOTO EUROLYSINE S.A.S. (Table 7)2 Based on intra-laboratory reproducibility data of AJINOMOTO EUROLYSINE S.A.S. Customer Laboratory
Table 1
Regressions 2
Poor
Poor
Poor
Analysis 3
Relative confidence intervals
< 10% 10-30% > 30%
Recommended solutions
Number 1 Number 2 Not recommended
Oats
Rice
Rice protein
Sunflower meal
Whey protein conc.
Yoghurt
Plasma
Bakery by-products
Tapioca
Table 1
Few samples
Few samples
Few samples
Few samples
Few samples
Regressions
Not tested
Not tested
Not tested
Not tested
Not tested
Analysis 2
Relative confidence intervals
< 10% 10-30% > 30%
Recommended solutions
Number 1 Number 2 Not recommended
Wheat middlings
Wheat gluten
Wheat DDGS
Corn gluten
Soya protein conc. 52-56%
Potato protein
Fish meal
�Reference list
AFNOR. Accuracy (trueness and precision) of measurement methods and results. Part 1: General principles and definitions. NF ISO 5725-1. 1994.
AFNOR. Accuracy (trueness and precision) of measurement methods and results. Part 2: Basic methods for the determinationof repeatability and reproducibility of a standard measurement method. NF ISO 5725-2. 1994.
AFNOR. Accuracy (trueness and precision) of measurement methods and results. Part 3: Intermediate measures of the precision of a standard measurement method. NF ISO 5725-3. 1994.
AFNOR. Accuracy (trueness and precision) of measurement methods and results. Part 4: Basic methods for the determinationof the trueness of a standard measurement method. NF ISO 5725-4. 1994.
AFNOR. Accuracy (trueness and precision) of measurement methods and results. Part 5: Alternative methods for the determination of the precision of a standard measurement method. NF ISO 5725-5. 1998
AFNOR. Accuracy (trueness and precision) of measurement methods and results. Part 6: Use in practice of accuracy values. NFISO 5725-6. 1994.
AFNOR. Animal Feeding Stuffs - Determination of tryptophan. NF V 18-114. 1998.
AFNOR. Animal Feeding Stuffs - Determination of amino acids content. NF V 18-113. 2005.
AFNOR. Animal Feeding Stuffs - Determination of tryptophan content. NF V 18-114. 2005.
AFNOR. Statistical methods for use in proficiency testing by interlaboratory comparisons. NF ISO 13528. 2005.
AFNOR. General requirements for the competence of testing and calibration laboratories (ISO/IEC 17025:2005). NF EN ISO/CEI 17025. 2005.
AFNOR. Animal Feeding Stuffs - Sampling. NF EN ISO 6497. 2005.
Council Directive. 79/373/EEC of 2 April 1979 on the M15 circulation of compound feedingstuffs (Official Journal of the European Communities. L86 of 6.4.1979). 1979.
Directive. 98/64/EC of 3 September 1998 establishing Community methods of analysis for the de termination of amino-acids,crude oils and fats, and olaquindox in feedingstuffs and amending Directive 71/393/EEC (Official Journal of the European Communities. Nr L257/14-15 of 19.09.1998). 1998.
Directive. 2000/45/EC of 6 July 2000 establishing Community methods of analysis for the determination of vitamin A, vitaminE and tryptophan in feedingstuffs (Official Journal of the European Communities. Nr L174/32 of 13.7.2000). 2000.
Primot, Y. and D. Melchior. 2008. Tryptophan in young pigs: An essential nutrient with numerous biological functions. AJINOMOTO EUROLYSINE Technical information n°30.
Sauvant, D., J. M. Perez, and G. Tran. 2004. Tables of composition and nutritional value of feed materials. Wageningen AcademicPublishers, INRA Editions and AFZ, Paris.
Wesseling, B. and F. Liebert. Untersuchungen zum Vergleich von Aminosäurenwirksamkeit und ilealer Verdaulichkeit von Aminosäuren in Bezug zur gemessenen Leistung (investigations comparing diet formulation based on amino acid efficiency andileal amino acid digestibility relating to performance). 7 Tagung Schweine - Und Geflügelernährung, 21-23. 2002.
Wieser, H. and W. Seilmeier. 1998. The influence of nitrogen fertilisation on quantities and proportions of different protein typesin wheat flour. J.Sci.Food.Agric. 76, 49-55.
AJINOMOTO EUROLYSINE S.A.S. Information N°32 - 27

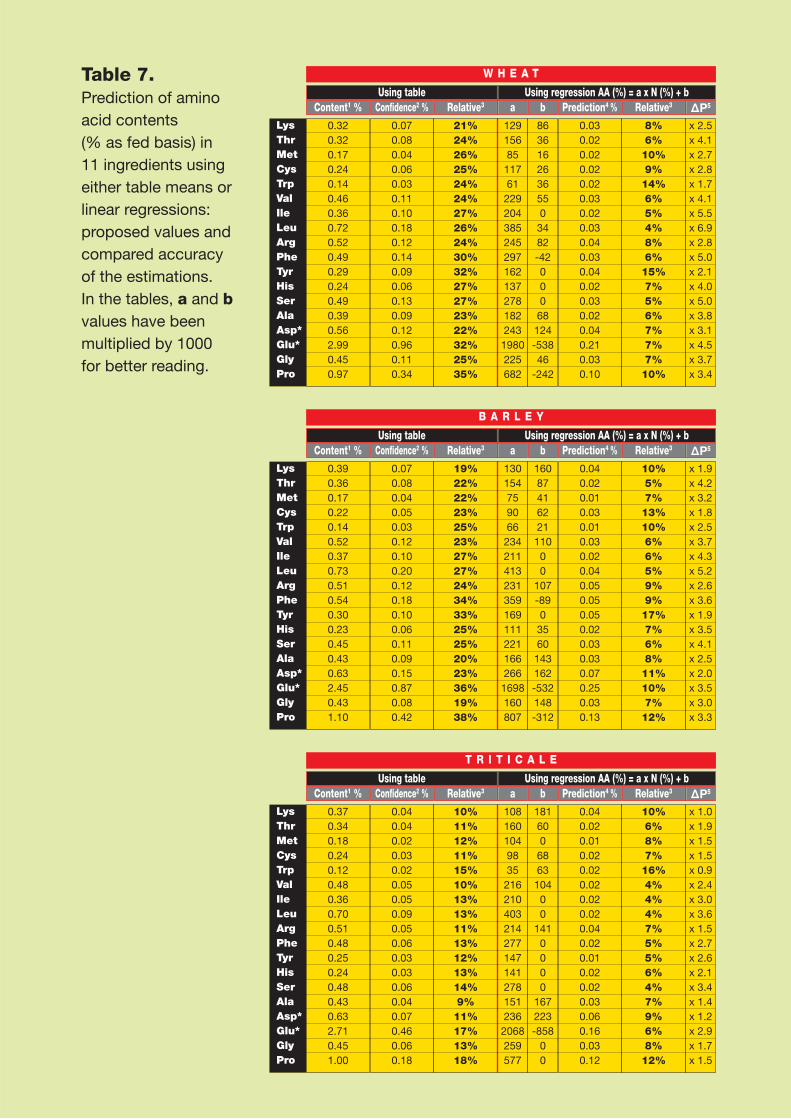
Using tableContent1 % Confidence2 % Relative3 Prediction4 % Relative3 ΔP5a b
Using regression AA (%) = a x N (%) + b
0.320.320.170.240.140.460.360.720.520.490.290.240.490.390.562.990.450.97
0.070.080.040.060.030.110.100.180.120.140.090.060.130.090.120.960.110.34
21%24%26%25%24%24%27%26%24%30%32%27%27%23%22%32%25%35%
0.030.020.020.020.020.030.020.030.040.030.040.020.030.020.040.210.030.10
8%6%10%9%14%6%5%4%8%6%15%7%5%6%7%7%7%10%
12915685117612292043852452971621372781822431980225682
86361626365503482-4200068124-53846
-242
x 2.5x 4.1x 2.7x 2.8x 1.7x 4.1x 5.5x 6.9x 2.8x 5.0x 2.1x 4.0x 5.0x 3.8x 3.1x 4.5x 3.7x 3.4
W H E A T
LysThrMetCysTrpValIleLeuArgPheTyrHisSerAlaAsp*Glu*GlyPro
Using tableContent1 % Confidence2 % Relative3 Prediction4 % Relative3 ΔP5a b
Using regression AA (%) = a x N (%) + b
0.390.360.170.220.140.520.370.730.510.540.300.230.450.430.632.450.431.10
0.070.080.040.050.030.120.100.200.120.180.100.060.110.090.150.870.080.42
19%22%22%23%25%23%27%27%24%34%33%25%25%20%23%36%19%38%
0.040.020.010.030.010.030.020.040.050.050.050.020.030.030.070.250.030.13
10%5%7%13%10%6%6%5%9%9%17%7%6%8%11%10%7%12%
1301547590662342114132313591691112211662661698160807
1608741622111000
107-8903560143162-532148-312
x 1.9x 4.2x 3.2x 1.8x 2.5x 3.7x 4.3x 5.2x 2.6x 3.6x 1.9x 3.5x 4.1x 2.5x 2.0x 3.5x 3.0x 3.3
B A R L E Y
LysThrMetCysTrpValIleLeuArgPheTyrHisSerAlaAsp*Glu*GlyPro
Using tableContent1 % Confidence2 % Relative3 Prediction4 % Relative3 ΔP5a b
Using regression AA (%) = a x N (%) + b
0.370.340.180.240.120.480.360.700.510.480.250.240.480.430.632.710.451.00
0.040.040.020.030.020.050.050.090.050.060.030.030.060.040.070.460.060.18
10%11%12%11%15%10%13%13%11%13%12%13%14%9%11%17%13%18%
0.040.020.010.020.020.020.020.020.040.020.010.020.020.030.060.160.030.12
10%6%8%7%16%4%4%4%7%5%5%6%4%7%9%6%8%12%
10816010498352162104032142771471412781512362068259577
181600686310400
1410000
167223-858
00
x 1.0x 1.9x 1.5x 1.5x 0.9x 2.4x 3.0x 3.6x 1.5x 2.7x 2.6x 2.1x 3.4x 1.4x 1.2x 2.9x 1.7x 1.5
T R I T I C A L E
LysThrMetCysTrpValIleLeuArgPheTyrHisSerAlaAsp*Glu*GlyPro
Table 7.Prediction of amino acid contents (% as fed basis) in 11 ingredients using either table means or linear regressions: proposed values andcompared accuracy of the estimations.In the tables, a and bvalues have been multiplied by 1000 for better reading.
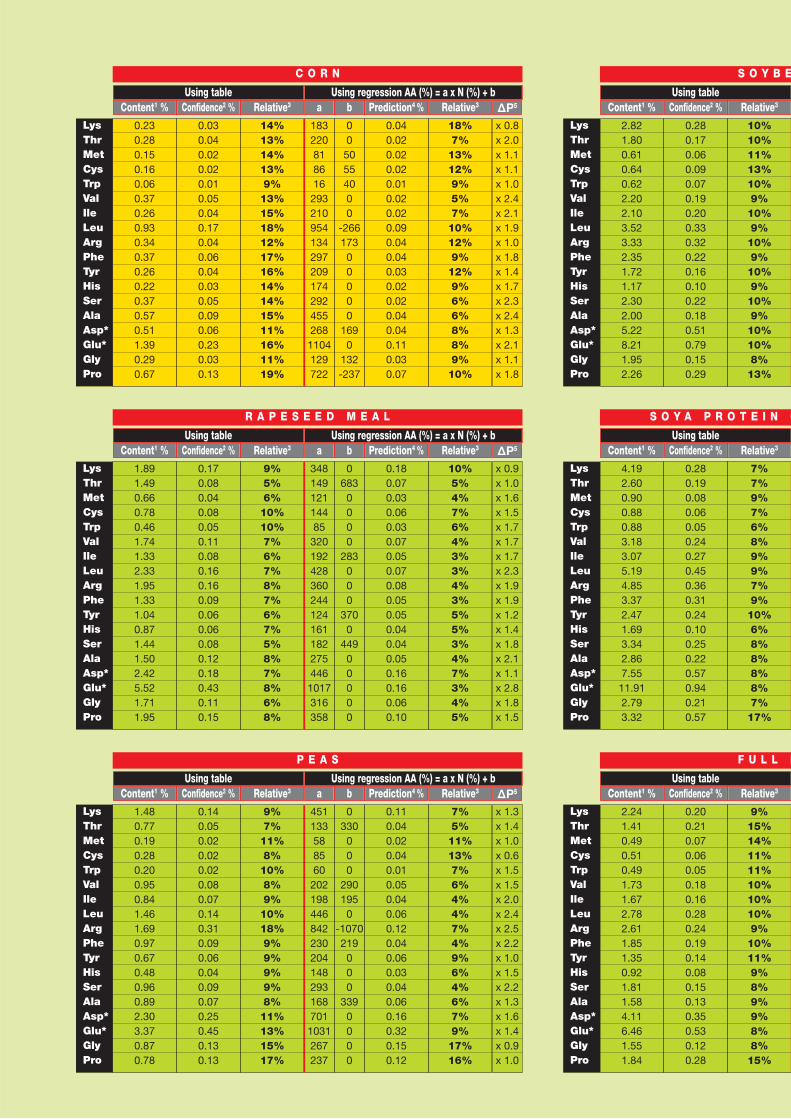
Using tableContent1 % Confidence2 % Relative3 Prediction4 % Relative3 ΔP5a b
Using regression AA (%) = a x N (%) + b
0.230.280.150.160.060.370.260.930.340.370.260.220.370.570.511.390.290.67
0.030.040.020.020.010.050.040.170.040.060.040.030.050.090.060.230.030.13
14%13%14%13%9%
13%15%18%12%17%16%14%14%15%11%16%11%19%
0.040.020.020.020.010.020.020.090.040.040.030.020.020.040.040.110.030.07
18%7%13%12%9%5%7%10%12%9%12%9%6%6%8%8%9%10%
1832208186162932109541342972091742924552681104129722
0050554000
-26617300000
1690
132-237
x 0.8x 2.0x 1.1x 1.1x 1.0x 2.4x 2.1x 1.9x 1.0x 1.8x 1.4x 1.7x 2.3x 2.4x 1.3x 2.1x 1.1x 1.8
C O R N
LysThrMetCysTrpValIleLeuArgPheTyrHisSerAlaAsp*Glu*GlyPro
Using tableContent1 % Confidence2 % Relative3 Prediction4 % Relative3 ΔP5a b
Using regression AA (%) = a x N (%) + b
1.891.490.660.780.461.741.332.331.951.331.040.871.441.502.425.521.711.95
0.170.080.040.080.050.110.080.160.160.090.060.060.080.120.180.430.110.15
9%5%6%
10%10%7%6%7%8%7%6%7%5%8%7%8%6%8%
0.180.070.030.060.030.070.050.070.080.050.050.040.040.050.160.160.060.10
10%5%4%7%6%4%3%3%4%3%5%5%3%4%7%3%4%5%
348149121144853201924283602441241611822754461017316358
06830000
283000
3700
44900000
x 0.9x 1.0x 1.6x 1.5x 1.7x 1.7x 1.7x 2.3x 1.9x 1.9x 1.2x 1.4x 1.8x 2.1x 1.1x 2.8x 1.8x 1.5
R A P E S E E D M E A L
LysThrMetCysTrpValIleLeuArgPheTyrHisSerAlaAsp*Glu*GlyPro
Using tableContent1 % Confidence2 % Relative3 Prediction4 % Relative3 ΔP5a b
Using regression AA (%) = a x N (%) + b
1.480.770.190.280.200.950.841.461.690.970.670.480.960.892.303.370.870.78
0.140.050.020.020.020.080.070.140.310.090.060.040.090.070.250.450.130.13
9%7%
11%8%
10%8%9%
10%18%9%9%9%9%8%
11%13%15%17%
0.110.040.020.040.010.050.040.060.120.040.060.030.040.060.160.320.150.12
7%5%11%13%7%6%4%4%7%4%9%6%4%6%7%9%17%16%
4511335885602021984468422302041482931687011031267237
0330000
2901950
-1070219000
3390000
x 1.3x 1.4x 1.0x 0.6x 1.5x 1.5x 2.0x 2.4x 2.5x 2.2x 1.0x 1.5x 2.2x 1.3x 1.6x 1.4x 0.9x 1.0
P E A S
LysThrMetCysTrpValIleLeuArgPheTyrHisSerAlaAsp*Glu*GlyPro
Using tableContent1 % Confidence2 % Relative3
2.821.800.610.640.622.202.103.523.332.351.721.172.302.005.228.211.952.26
0.280.170.060.090.070.190.200.330.320.220.160.100.220.180.510.790.150.29
10%10%11%13%10%9%
10%9%
10%9%
10%9%
10%9%
10%10%8%
13%
S O Y B E
LysThrMetCysTrpValIleLeuArgPheTyrHisSerAlaAsp*Glu*GlyPro
Using tableContent1 % Confidence2 % Relative3
4.192.600.900.880.883.183.075.194.853.372.471.693.342.867.5511.912.793.32
0.280.190.080.060.050.240.270.450.360.310.240.100.250.220.570.940.210.57
7%7%9%7%6%8%9%9%7%9%
10%6%8%8%8%8%7%
17%
S O Y A P R O T E I N C
LysThrMetCysTrpValIleLeuArgPheTyrHisSerAlaAsp*Glu*GlyPro
Using tableContent1 % Confidence2 % Relative3
2.241.410.490.510.491.731.672.782.611.851.350.921.811.584.116.461.551.84
0.200.210.070.060.050.180.160.280.240.190.140.080.150.130.350.530.120.28
9%15%14%11%11%10%10%10%9%
10%11%9%8%9%9%8%8%
15%
F U L L F
LysThrMetCysTrpValIleLeuArgPheTyrHisSerAlaAsp*Glu*GlyPro
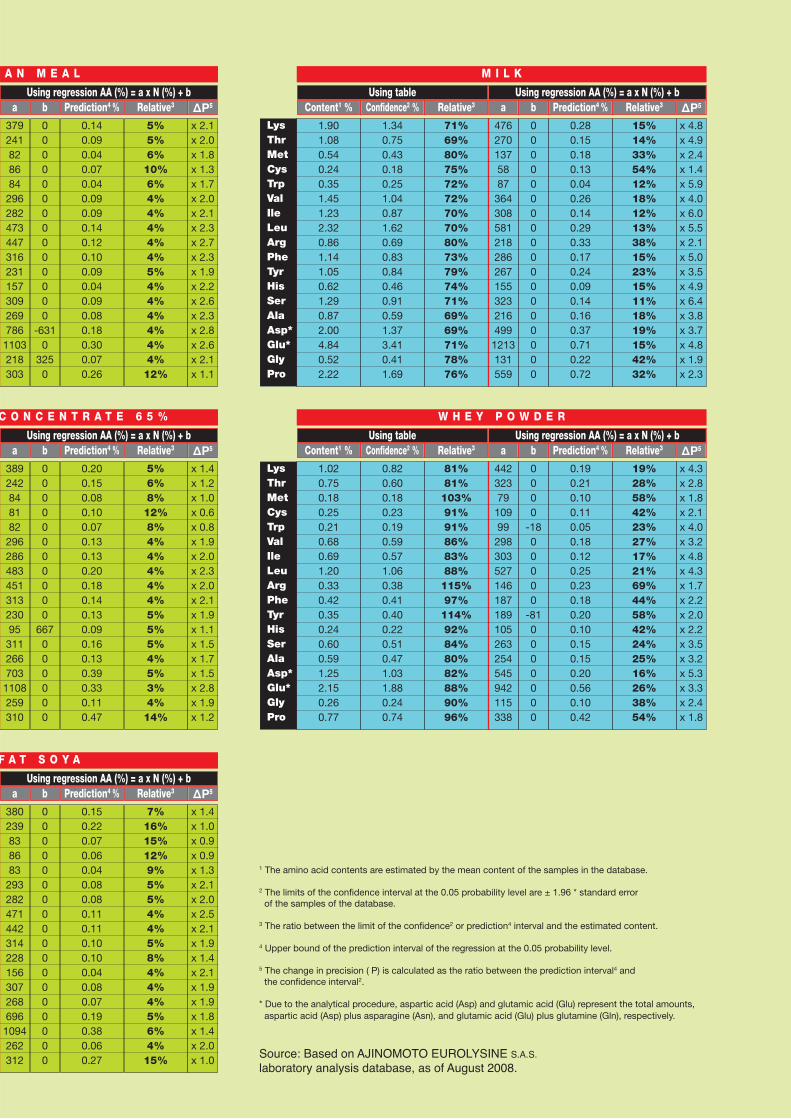
1 The amino acid contents are estimated by the mean content of the samples in the database.
2 The limits of the confidence interval at the 0.05 probability level are ± 1.96 * standard error of the samples of the database.
3 The ratio between the limit of the confidence2 or prediction4 interval and the estimated content.
4 Upper bound of the prediction interval of the regression at the 0.05 probability level.
5 The change in precision ( P) is calculated as the ratio between the prediction interval4 and the confidence interval2.
* Due to the analytical procedure, aspartic acid (Asp) and glutamic acid (Glu) represent the total amounts, aspartic acid (Asp) plus asparagine (Asn), and glutamic acid (Glu) plus glutamine (Gln), respectively.
Source: Based on AJINOMOTO EUROLYSINE S.A.S.
laboratory analysis database, as of August 2008.
Prediction4 % Relative3 ΔP5a bUsing regression AA (%) = a x N (%) + b
0.140.090.040.070.040.090.090.140.120.100.090.040.090.080.180.300.070.26
5%5%6%10%6%4%4%4%4%4%5%4%4%4%4%4%4%12%
3792418286842962824734473162311573092697861103218303
00000000000000
-6310
3250
x 2.1x 2.0x 1.8x 1.3x 1.7x 2.0x 2.1x 2.3x 2.7x 2.3x 1.9x 2.2x 2.6x 2.3x 2.8x 2.6x 2.1x 1.1
A N M E A L
Prediction4 % Relative3 ΔP5a bUsing regression AA (%) = a x N (%) + b
0.200.150.080.100.070.130.130.200.180.140.130.090.160.130.390.330.110.47
5%6%8%12%8%4%4%4%4%4%5%5%5%4%5%3%4%14%
389242848182296286483451313230953112667031108259310
00000000000
667000000
x 1.4x 1.2x 1.0x 0.6x 0.8x 1.9x 2.0x 2.3x 2.0x 2.1x 1.9x 1.1x 1.5x 1.7x 1.5x 2.8x 1.9x 1.2
C O N C E N T R A T E 6 5 %
Using tableContent1 % Confidence2 % Relative3 Prediction4 % Relative3 ΔP5a b
Using regression AA (%) = a x N (%) + b
1.901.080.540.240.351.451.232.320.861.141.050.621.290.872.004.840.522.22
1.340.750.430.180.251.040.871.620.690.830.840.460.910.591.373.410.411.69
71%69%80%75%72%72%70%70%80%73%79%74%71%69%69%71%78%76%
0.280.150.180.130.040.260.140.290.330.170.240.090.140.160.370.710.220.72
15%14%33%54%12%18%12%13%38%15%23%15%11%18%19%15%42%32%
47627013758873643085812182862671553232164991213131559
000000000000000000
x 4.8x 4.9x 2.4x 1.4x 5.9x 4.0x 6.0x 5.5x 2.1x 5.0x 3.5x 4.9x 6.4x 3.8x 3.7x 4.8x 1.9x 2.3
M I L K
LysThrMetCysTrpValIleLeuArgPheTyrHisSerAlaAsp*Glu*GlyPro
Using tableContent1 % Confidence2 % Relative3 Prediction4 % Relative3 ΔP5a b
Using regression AA (%) = a x N (%) + b
1.020.750.180.250.210.680.691.200.330.420.350.240.600.591.252.150.260.77
0.820.600.180.230.190.590.571.060.380.410.400.220.510.471.031.880.240.74
81%81%103%91%91%86%83%88%115%97%114%92%84%80%82%88%90%96%
0.190.210.100.110.050.180.120.250.230.180.200.100.150.150.200.560.100.42
19%28%58%42%23%27%17%21%69%44%58%42%24%25%16%26%38%54%
4423237910999298303527146187189105263254545942115338
0000
-1800000
-810000000
x 4.3x 2.8x 1.8x 2.1x 4.0x 3.2x 4.8x 4.3x 1.7x 2.2x 2.0x 2.2x 3.5x 3.2x 5.3x 3.3x 2.4x 1.8
W H E Y P O W D E R
LysThrMetCysTrpValIleLeuArgPheTyrHisSerAlaAsp*Glu*GlyPro
Prediction4 % Relative3 ΔP5a bUsing regression AA (%) = a x N (%) + b
0.150.220.070.060.040.080.080.110.110.100.100.040.080.070.190.380.060.27
7%16%15%12%9%5%5%4%4%5%8%4%4%4%5%6%4%15%
3802398386832932824714423142281563072686961094262312
000000000000000000
x 1.4x 1.0x 0.9x 0.9x 1.3x 2.1x 2.0x 2.5x 2.1x 1.9x 1.4x 2.1x 1.9x 1.9x 1.8x 1.4x 2.0x 1.0
F A T S O Y A

Illustrations : Front cover: Privilège. Pictogrammes and sphere: Nicolas Rochereau.
DisclaimerThe document and the original data contained therein are the property of:AJINOMOTO EUROLYSINE S.A.S.
Registered office: 153 rue de Courcelles, 75817 Paris Cedex 17, FranceTel.: +33 1 44 40 12 12 - Fax: +33 1 44 40 12 13
The company AJINOMOTO EUROLYSINE S.A.S. has taken all steps to check the authenticity and relevanceof the information provided in this bulletin. However, AJINOMOTO EUROLYSINE S.A.S. declines all responsibility for any use made of this data and may not, under any circumstances, be held liable for anydamage suffered by third parties.
Already issued:
INFORMATION N°32 - November 2008AJINOMOTO EUROLYSINE S.A.S. Formulator’s Handbook.Measuring and predicting amino acids contents in feedingstuffs
INFORMATION N°31 - June 2008Threonine in pigs and broilers: a crucial amino acid for growth and gut function
INFORMATION N°30 - March 2008Tryptophan in young pigs: an essential nutrient with numerous biological functions
INFORMATION N°29 - June 2006Impact of the withdrawal of antimicrobial growth promoters and health statuson the amino acid requirement of the pig
INFORMATION N°28 - June 2005Tryptophan in young pigs: a key nutrient for growth and feed intake
INFORMATION N°27 - June 2004Amino acid nutrition of the broiler chicken - Update on lysine, threonine and other amino acids
INFORMATION N°26 - September 2002Threonine requirement in pigs - Benefits of L-Threonine supplementation
INFORMATION N°25 - March 2002Low protein diets for piglets
INFORMATION N°24 - May 2001Managing growth and carcass quality of growing pigs fed low protein diets
INFORMATION N°23 - September 2000L-Tryptophan supplementation to enhance piglet growth
INFORMATION N°22 - June 2000Prevention of nitrogen pollution from pig husbandry through feeding measures
www.ajinomoto-eurolysine.com
priv
ilège
+ 3
3 1
47 4
7 20
80
AJINOMOTO EUROLYSINE S.A.S.
A J I N O M O T O A N I M A L N U T R I T I O N