ajitava raychaudhuri department of economics jadavpur ... 2 regional-integration.pdf · ajitava...
TRANSCRIPT
Regional Integration
Ajitava Raychaudhuri Department of Economics
Jadavpur University Kolkata
9 May, 2016 Yangon
Trade Creation – Through common external tariff but zero internal tariff trade is created within the regionally integrated economy Trade Diversion – Trade gets diverted from the most efficient producers, which may violate the basic principle of Comparative Advantage So this has short term gains versus long term efficiency issues There are stages of regional integration
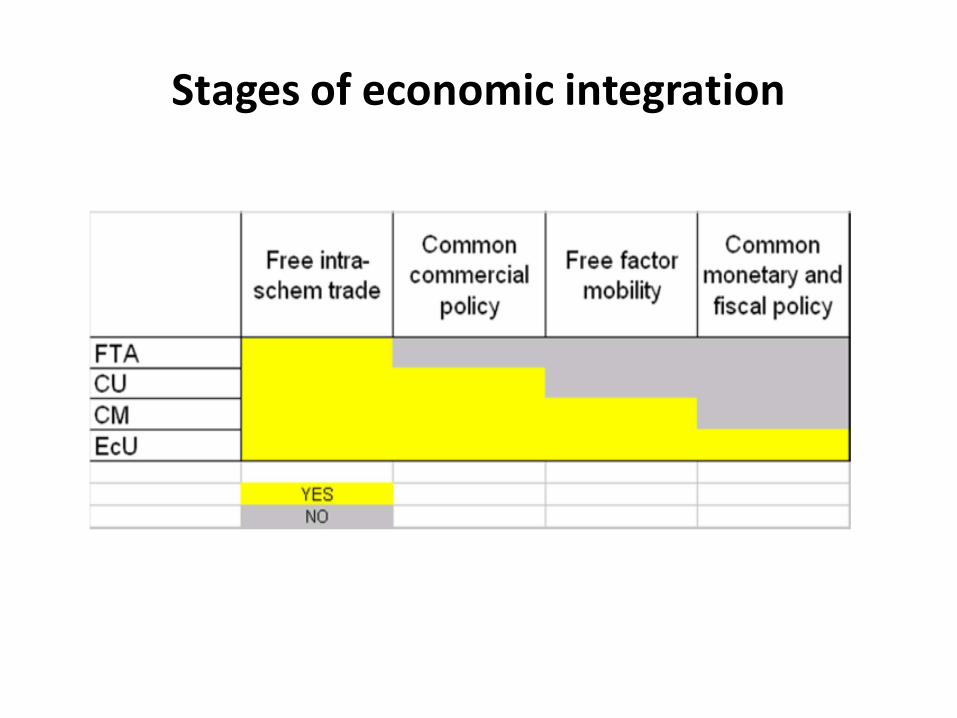
Stages of economic integration
South Asian integration
• South Asia is one of the least economically integrated regions
• Most efforts for economic integration in this region is done through bilateral as well as multilateral agreements like SAFTA or Bilateral FTA like India-Sri Lanka FTA or Pakistan Sri-Lanka FTA
• Unfortunately, little effort is done to try integration through markets which creates true economic inter-dependence, which is the cornerstone of ASEAN
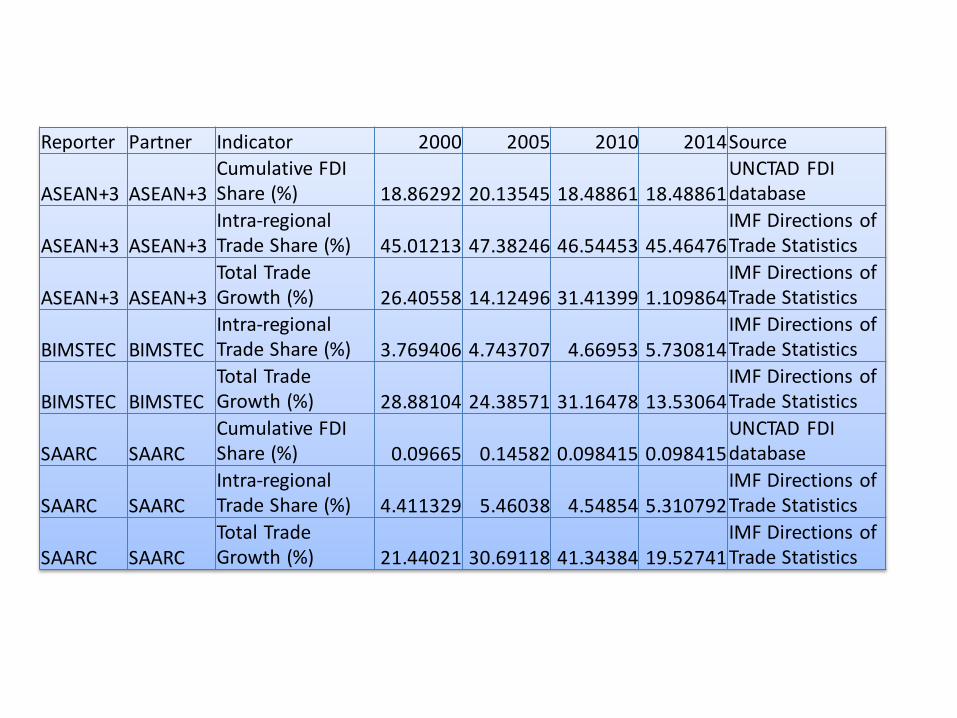
Reporter Partner Indicator 2000 2005 2010 2014 Source
ASEAN+3 ASEAN+3 Cumulative FDI Share (%) 18.86292 20.13545 18.48861 18.48861
UNCTAD FDI database
ASEAN+3 ASEAN+3 Intra-regional Trade Share (%) 45.01213 47.38246 46.54453 45.46476
IMF Directions of Trade Statistics
ASEAN+3 ASEAN+3 Total Trade Growth (%) 26.40558 14.12496 31.41399 1.109864
IMF Directions of Trade Statistics
BIMSTEC BIMSTEC Intra-regional Trade Share (%) 3.769406 4.743707 4.66953 5.730814
IMF Directions of Trade Statistics
BIMSTEC BIMSTEC Total Trade Growth (%) 28.88104 24.38571 31.16478 13.53064
IMF Directions of Trade Statistics
SAARC SAARC Cumulative FDI Share (%) 0.09665 0.14582 0.098415 0.098415
UNCTAD FDI database
SAARC SAARC Intra-regional Trade Share (%) 4.411329 5.46038 4.54854 5.310792
IMF Directions of Trade Statistics
SAARC SAARC Total Trade Growth (%) 21.44021 30.69118 41.34384 19.52741
IMF Directions of Trade Statistics
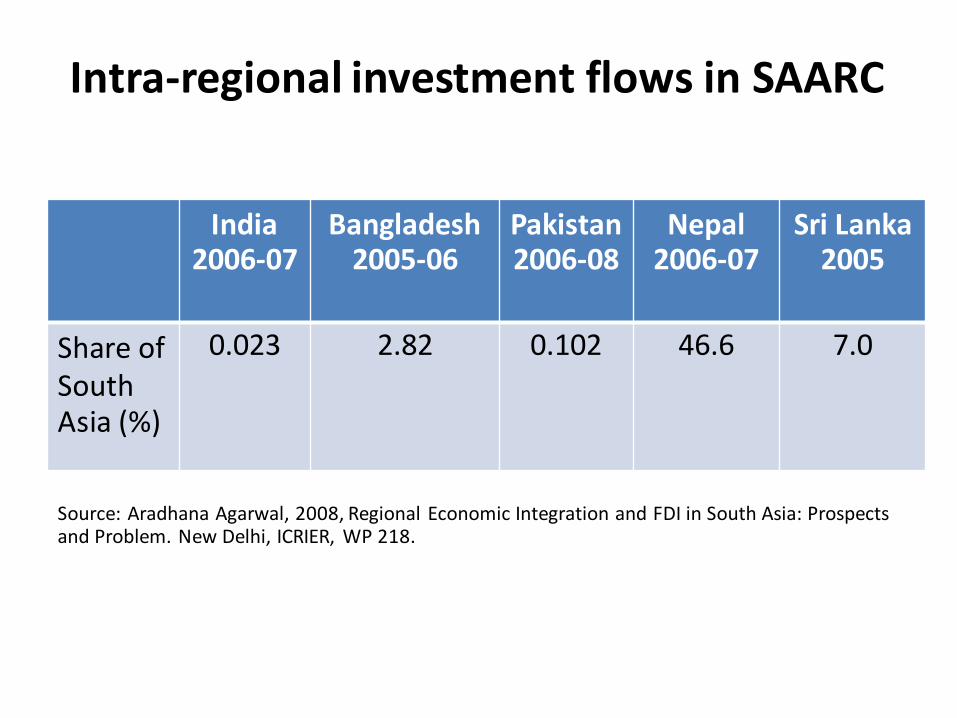
Intra-regional investment flows in SAARC
India 2006-07
Bangladesh 2005-06
Pakistan 2006-08
Nepal 2006-07
Sri Lanka 2005
Share of South Asia (%)
0.023 2.82 0.102 46.6 7.0
Source: Aradhana Agarwal, 2008, Regional Economic Integration and FDI in South Asia: Prospects and Problem. New Delhi, ICRIER, WP 218.
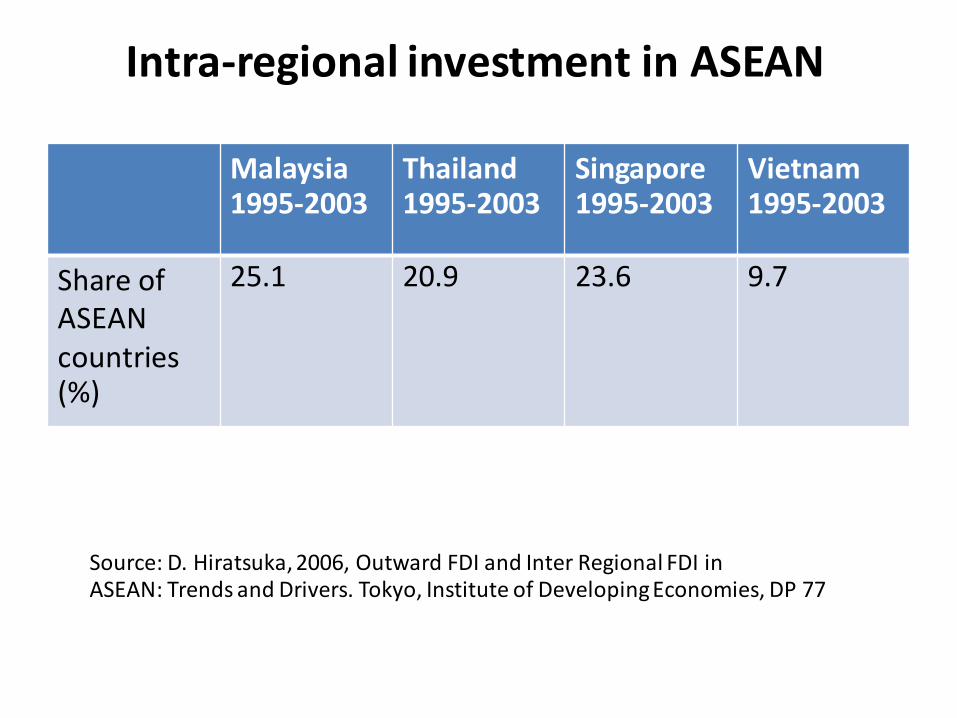
Intra-regional investment in ASEAN
Malaysia 1995-2003
Thailand 1995-2003
Singapore 1995-2003
Vietnam 1995-2003
Share of ASEAN countries (%)
25.1 20.9 23.6 9.7
Source: D. Hiratsuka, 2006, Outward FDI and Inter Regional FDI in ASEAN: Trends and Drivers. Tokyo, Institute of Developing Economies, DP 77
Nature of ASEAN +3 intra-regional trade
• Intra -regional Exports of Parts and Components of ASEAN+3 countries touched 59.3 % in 2005. Thus there was stress on Intermediate goods trade intra regionally.
• Aminian, Fung and Ng (2008) showed that RCA reveals that ASEAN+3 have transcended to more export oriented ‘Processing’ stage compared to import based ‘Assembling’ stage.
• This has helped MNCs as well as smaller sized Local companies in this region to fragment their production process
• This vertical specialisation across borders developed for economic needs. Thus this market driven integration preceded the rather slow moving and complicated agreement formulation stages.
• Regional Integration Indices.xlsx
Multinational enterprises (MNCs) and foreign direct investment (FDI)
• MNCs are enterprises that operates from several countries.
• FDI is building plants or production facilities in foreign countries
• The link between MNCs and FDI arises due to the fact the MNCs have high intangible assets, especially in terms of knowledge of a production process, including industrial organisation
These are MNCs which chooses to locate their production facilities across different countries
Research has shown that MNCs have horizontal FDI when the following conditions are met (Feenstra, 2006, p.389): Transport costs of exporting goods are high Setting up costs of plants in a foreign country is low GDPs are high or more similar across countries
The above are quite intuitive. The last condition makes the market size large. This is a reason why most FDIs flow among developed economies if one leaves outlier like China Additional reasons may be agglomeration effects and Strong Intellectual Property regimes
Horizontal multinational
These are MNCs which have headquarter in one country but fragments production by outsourcing components across different countries. Vertical MNCs will have FDI according to the following conditions: There should be sufficient difference in factor prices so as to locate some component production in a foreign country The production is carried out by foreign affiliates of the original MNC The presence of such FDI may help bring the intangible assets of the MNCs to the country where components are manufactured This may also lead to higher trade between the countries involved through intra-firm trade.
Vertical multinationals
Outsourcing by MNCs to Non-affiliates This phenomenon has gained ground from the last decade of the last century giving rise to Increased FDI by MNCs through component production by low wage cost non-affiliates Increase in services trade whereby many developing countries took advantage of advancement of technology by which services could be fragmented from the manufacturing process and outsourced by MNCs based in developed countries to developing countries.
Outsourcing by MNCs to Non-affiliates
“Infrastructure investment facilitates regional economic integration through trade and investment expansion, it motivates regional cooperation, including cooperation in infrastructure development, generating a virtuous cycle. The diversity of Asian economies, combined with infrastructure expansion and improvement to lower trade costs, has helped the region to benefit as a leader in global patterns of production fragmentation, expanding intraregional trade, and diversification of development opportunities. (Brooks, ADBI Working Paper no 123, 2008)” “Factors like high freight costs, delays in customs clearance, unofficial payment solicitations, slow port loading or landing and handling, and poor governance create barriers to trade. Institutional bottlenecks (administrative, legal, financial, regulatory, and other logistics infrastructure), information asymmetries, and discretionary powers that give rise to rent seeking activities by government officials at various steps of trade transactions also impose costs. These costs can be lowered through cooperation that facilitates merchandise and services trade logistics, for both inbound and outbound shipments. (Brooks, ibid)
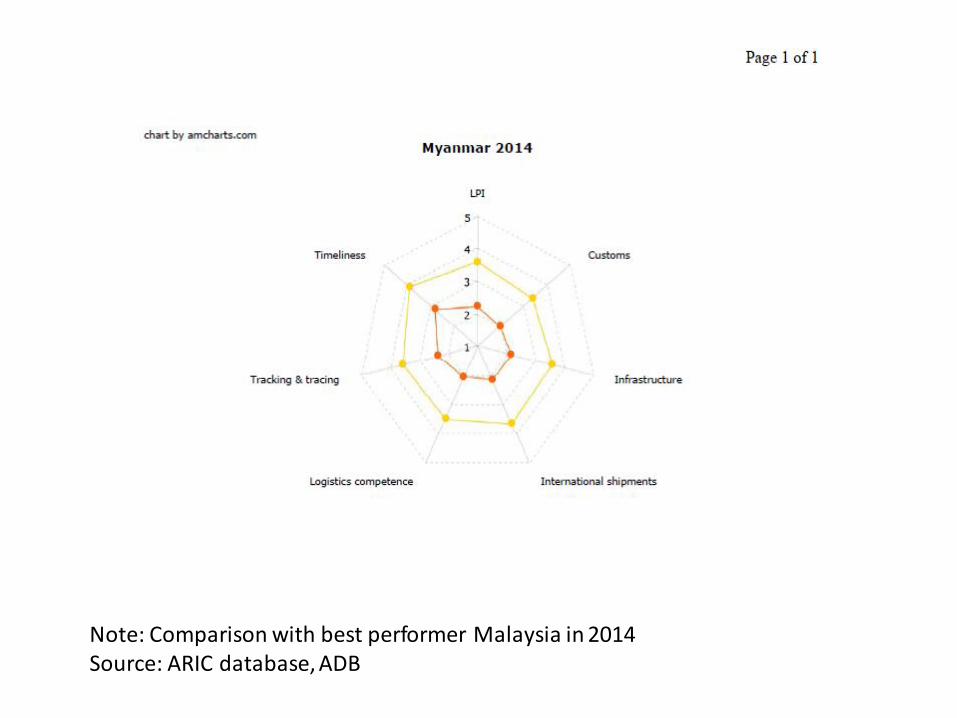
Note: Comparison with best performer Malaysia in 2014 Source: ARIC database, ADB
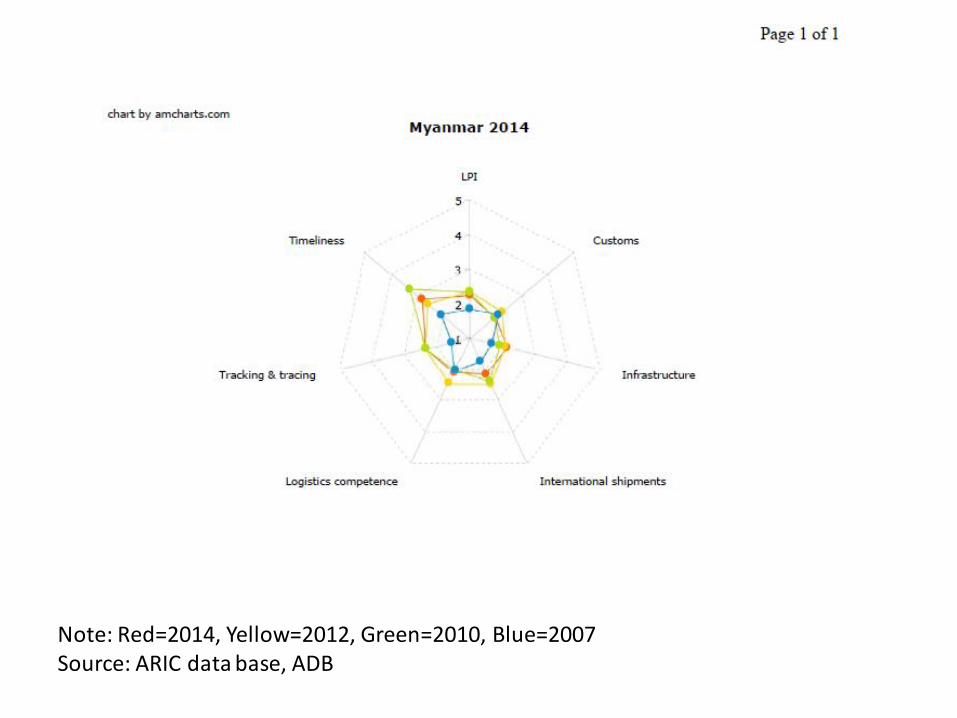
Note: Red=2014, Yellow=2012, Green=2010, Blue=2007 Source: ARIC data base, ADB
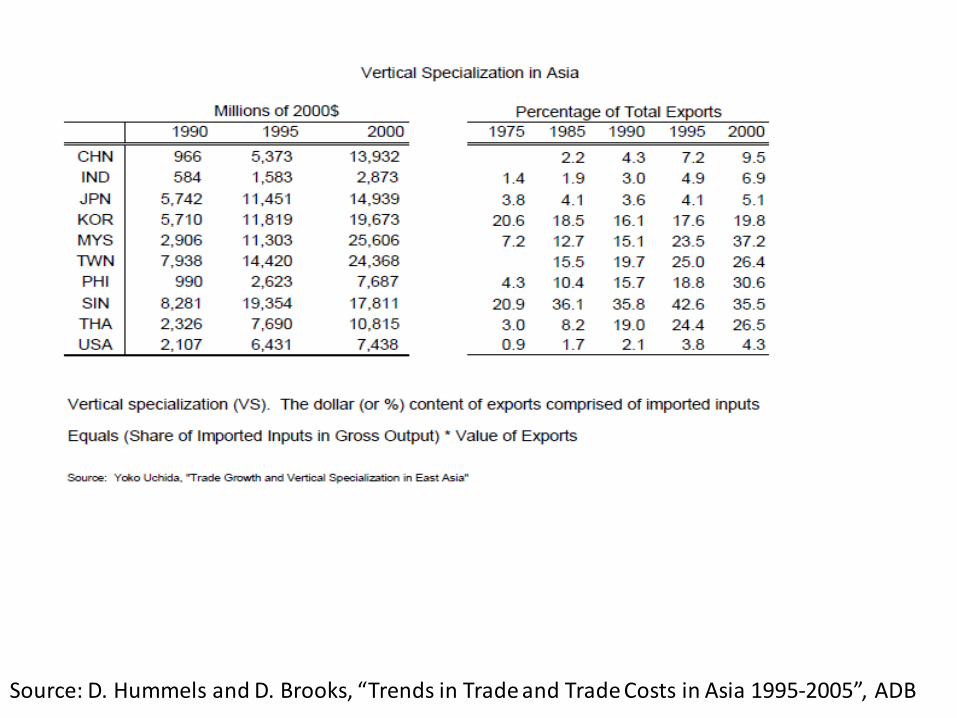
Source: D. Hummels and D. Brooks, “Trends in Trade and Trade Costs in Asia 1995-2005”, ADB
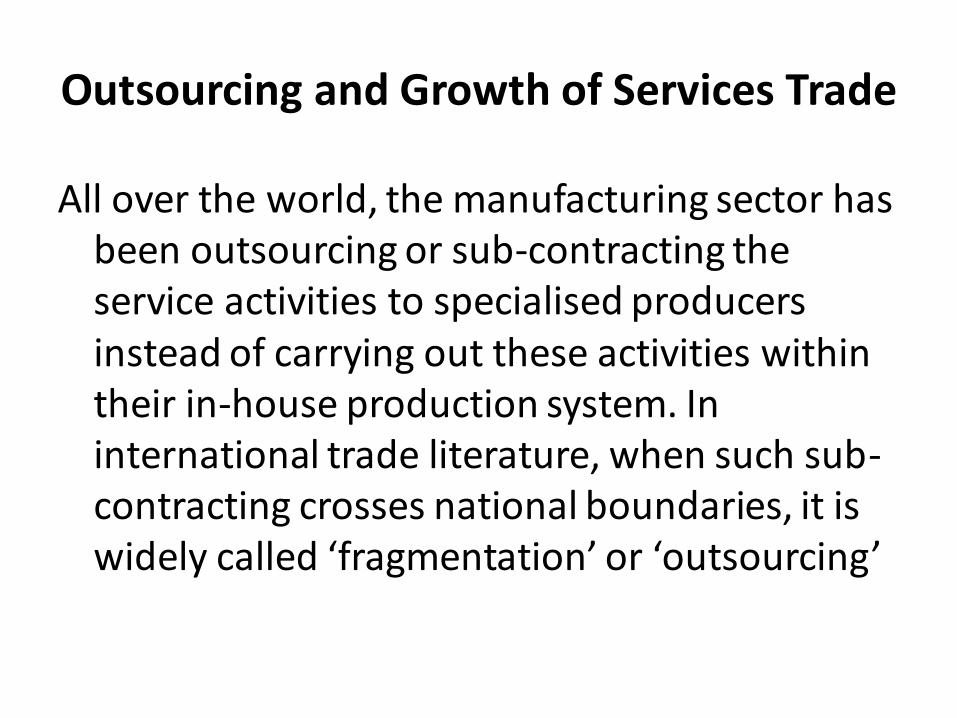
Outsourcing and Growth of Services Trade
All over the world, the manufacturing sector has been outsourcing or sub-contracting the service activities to specialised producers instead of carrying out these activities within their in-house production system. In international trade literature, when such sub-contracting crosses national boundaries, it is widely called ‘fragmentation’ or ‘outsourcing’
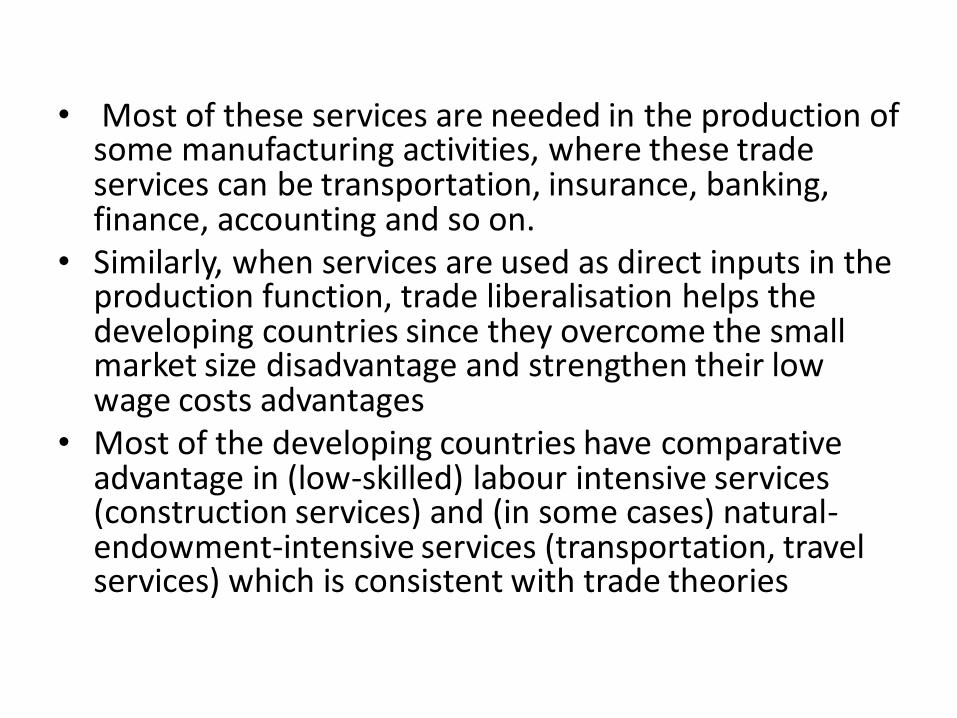
• Most of these services are needed in the production of some manufacturing activities, where these trade services can be transportation, insurance, banking, finance, accounting and so on.
• Similarly, when services are used as direct inputs in the production function, trade liberalisation helps the developing countries since they overcome the small market size disadvantage and strengthen their low wage costs advantages
• Most of the developing countries have comparative advantage in (low-skilled) labour intensive services (construction services) and (in some cases) natural-endowment-intensive services (transportation, travel services) which is consistent with trade theories
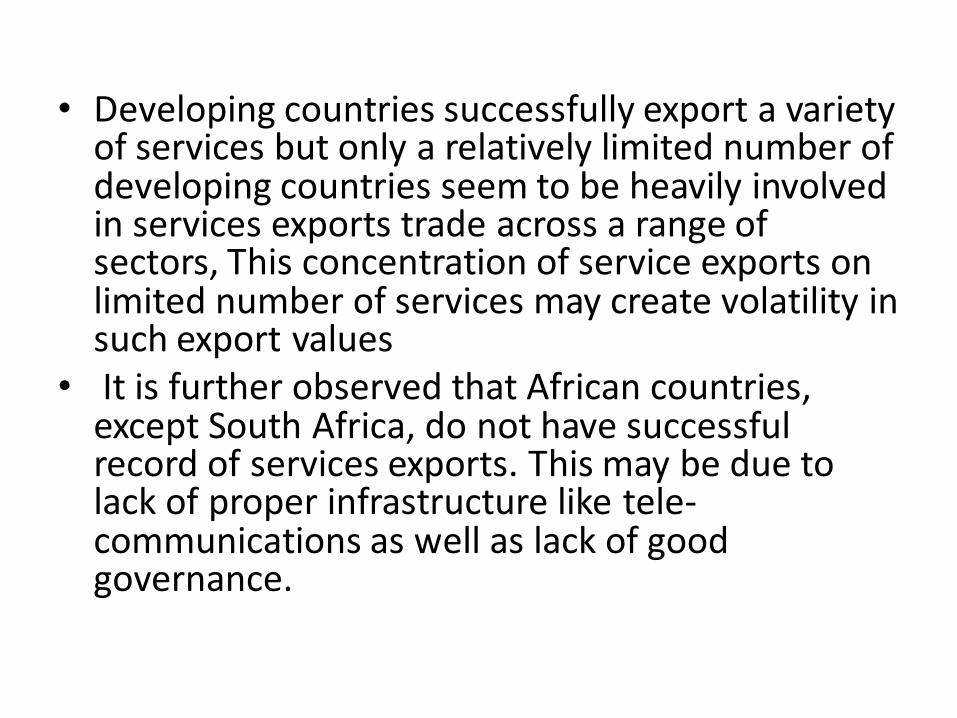
• Developing countries successfully export a variety of services but only a relatively limited number of developing countries seem to be heavily involved in services exports trade across a range of sectors, This concentration of service exports on limited number of services may create volatility in such export values
• It is further observed that African countries, except South Africa, do not have successful record of services exports. This may be due to lack of proper infrastructure like tele-communications as well as lack of good governance.
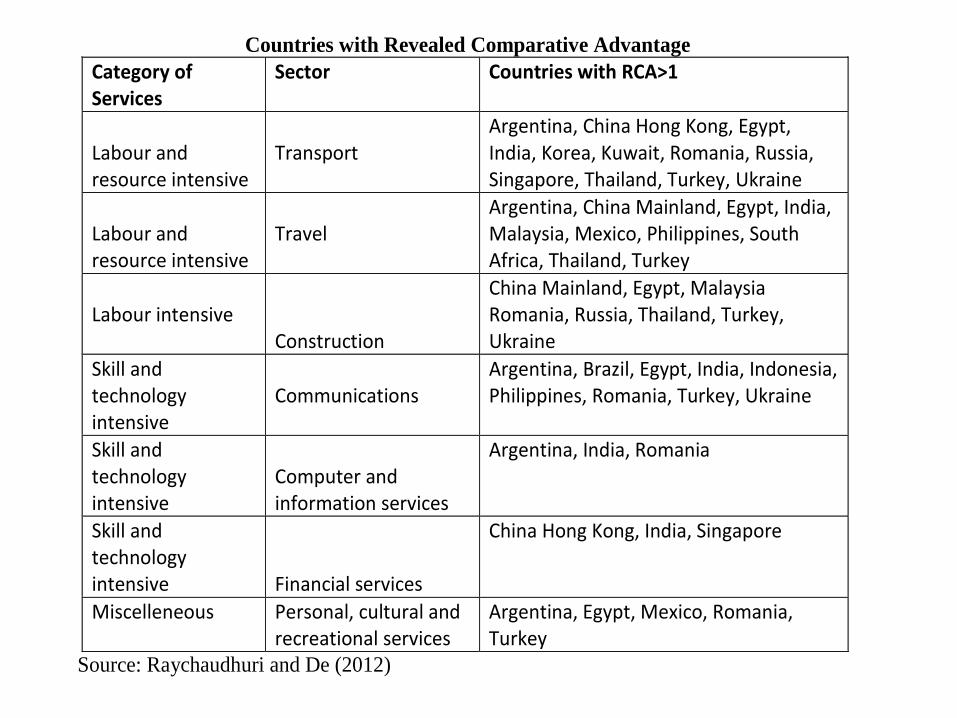
Countries with Revealed Comparative Advantage
Category of Services
Sector
Countries with RCA>1
Labour and resource intensive
Transport
Argentina, China Hong Kong, Egypt, India, Korea, Kuwait, Romania, Russia, Singapore, Thailand, Turkey, Ukraine
Labour and resource intensive
Travel
Argentina, China Mainland, Egypt, India, Malaysia, Mexico, Philippines, South Africa, Thailand, Turkey
Labour intensive
Construction
China Mainland, Egypt, Malaysia Romania, Russia, Thailand, Turkey, Ukraine
Skill and technology intensive
Communications
Argentina, Brazil, Egypt, India, Indonesia, Philippines, Romania, Turkey, Ukraine
Skill and technology intensive
Computer and information services
Argentina, India, Romania
Skill and technology intensive Financial services
China Hong Kong, India, Singapore
Miscelleneous Personal, cultural and recreational services
Argentina, Egypt, Mexico, Romania, Turkey
Source: Raychaudhuri and De (2012)
Economic geography and location
• Centripetal forces like availability of large variety of intermediate inputs, skilled labour force and large market size promote agglomeration
• Centrifugal forces act against this- for example congestion as well as trade barriers
• The relative strengths of the two determine geographical locations.
• Sometime it leads to core-periphery models if transporting manufacturing goods is high

Thank you