a.k.m waresul karim and jamal uddin ahmed, does regulatory change improve financial reporting...
TRANSCRIPT

Does Regulatory Change Improve Financial Reporting Timeliness? Evidence
from Bangladeshi Listed Companies
WORKING PAPER SERIES Working Paper no. 30
2005
A.K.M Waresul Karim a* and Jamal Uddin Ahmed b
a School of Accounting and Commercial Law, Victoria University of Wellington, PO Box 600, Wellington, New Zealand
b Hoda Vasi Chowdhury & Co, Dhaka, Bangladesh
*Correspondence to: A.K.M Waresul Karim, School of Accounting and Commercial Law, Victoria University of Wellington, PO Box 600, Wellington, New Zealand
Email: [email protected] Tel: ++(64)(4) 463 5233 extn 8547 Fax: ++(64)(4) 463 5076
Centre for Accounting, Governance and Taxation Research School of Accounting and Commercial Law Victoria University of Wellington PO Box 600 Wellington NEW ZEALAND
Tel. + 64 4 463 6957 Fax. + 64 4 463 5076 http://www.accountingresearch.org.nz

1
Does regulatory change improve financial reporting timeliness? Evidence from Bangladeshi listed companies
A K M Waresul Karim* Senior Lecturer
School of Accounting and Commercial Law Victoria University of Wellington
P O Box 600 Wellington New Zealand
Email: [email protected]
and
Jamal Uddin Ahmed Senior Partner
Hoda Vasi Chowdhury & Co Dhaka, Bangladesh
Email: [email protected]
*Corresponding author

2
Does regulatory change improve financial reporting timeliness? Evidence from Bangladeshi listed companies
Abstract
The present study is an attempt to empirically test a research question: whether regulatory
change can improve financial reporting timeliness in developing countries. Financial
reporting delays in Bangladesh have historically been long. In some cases companies are
found to publish results of as many as five financial years at a time. Even in 2003, company
audits in many cases can be found to take longer than eighteen months. Long audit delay is
one of the main causes behind chronic delay observed in issuing financial statements to
shareholders. In a significant move to reduce such delays, the country’s Securities and
Exchange Commission (SEC), in the year 2000, imposed a mandatory maximum of 120 days
to complete audits of listed companies. This provides an interesting setting to examine the
research question set out at the beginning. The paper reports the results of multiple linear
regressions to test the possible association between financial reporting timeliness and
regulatory change while controlling for relevant corporate and auditor attributes. Two levels
of analyses were carried out. First, using observations from 1999 and 2001, and then using the
observations from 1999 and 2003. The results show that audit delays could be reduced by
effective regulatory change. Subsidiaries of MNCs demonstrate significantly shorter delay
while companies who do not pay dividends show significantly longer delays. Company size,
audit complexity, return on equity, and audit fees (except for one model) do not appear to
have any bearing on audit delay.

3
I. Introduction and Motivation
Timeliness has long been recognised as one of the qualitative attributes of general purpose
financial reports (AICPA, 1973; APB, 1970; FASB, 1979). Empirical research on timeliness
of financial reporting provides evidence that the degree of timeliness of information release
has information content (Beaver, 1968) and affects firm value (Kross and Schroeder, 1984;
Chambers and Penman, 1984; Givoly and Palmon, 1982; Schwartz and Soo, 1996).
Recognising the theoretical and practical importance of timely release of financial
information, regulatory agencies around the world have set statutory maximum time limits
within which public companies are required to issue audited financial statements to
shareholders and other external users and/or file them with regulatory bodies (for a summary
of maximum allowable reporting lags in different countries, see Alford et al., 1993, pp. 188
190). Most organised stock exchanges have similar or more stringent reporting and/or filing
requirements.
In emerging economies, the provision of timely information in corporate reports assumes
greater importance since other nonfinancial statement sources such as media releases, news
conferences and financial analysts forecasts are not well developed and the regulatory bodies
are not as effective as in Western developed countries (Wallace, 1993). The motivation for
this study derives from a longstanding problem of a lack of timely provision of corporate
financial information in Bangladesh. A survey of 650 financial statement users and preparers
of financial reports in Bangladesh revealed that an overwhelming majority of respondents,
both preparers and users (93.8 percent), believe that the observed time lag in publishing
corporate annual reports is too long and should be reduced substantially (Karim, 1995). While
approximately 10 percent of listed companies do not publish annual reports even three years
after fiscal yearend dates, considerable delays are also observed among those who publish
their annual reports on a more timely basis. The average audit delay of all listed companies
that published annual reports during the period 1990 to 2003 is 175.13 days. The maximum
audit delays recorded in those 14 years ranged from 505 days (in 2003) to 1,487 days (in
2000).
The long audit delay normally leads to an even longer publication delay as companies in
Bangladesh are reluctant to convene the annual general meeting (AGM) of shareholders in
years with poor financial performance and/or low or no dividend announcement prospects.
4
Although the Companies Act requires all companies, listed and unlisted, to furnish their
annual accounts before the AGM within nine months of expiry of their respective financial
years, a significant portion of these companies do not comply with this requirement. Many
companies do not submit their annual accounts with the Registrar of Joint Stock Companies
for several years. Some companies are found to take up to seven years to present audited
financial statements before the AGM of shareholders. Although it is generally believed that
audit delay is ‘[T]he single most important determinant of the timeliness of earnings
announcement’ (Givoly and Palmon, 1982; p 491), the case in Bangladesh is not necessarily
so. Even after completion of the audit process, a few companies are found to have taken few
more years to release the audited financial statements to outsiders including shareholders.
Together with this postaudit delay, the total delay in releasing audited information to external
users can be extremely long, potentially defeating the whole purpose of external financial
reporting. A few companies were seen to present four to five years’ annual reports in one
annual general meeting. One such company, Kohinoor Chemical Co. (BD) Ltd held its 8 th , 9 th ,
10 th , 11 th , 12 th , and 13 th AGMs corresponding to financial years 199495 through 199900 on
the same day on 8 th of June 2001. The same company held its 4 th , 5 th , 6 th , and 7 th AGMs – all
on the same day on 27 February 1995. Another such company, Orion Infusion Ltd held its
14 th , 15 th , 16 th , and 17 th AGMs corresponding to 199697 through 199900 financial years on
27 July 2000. Similar examples can be found in MAQ Enterprise Ltd (combined 4 AGMs),
MAQ Paper Industries Ltd (combined 3 AGMs), and Mark Bangladesh Shilpa and
Engineering Ltd (combined 3 AGMs) etc. In the backdrop of this unsatisfactory picture there
are examples of more timely reporting too. The auditors of two of the largest multinationals
operating in Bangladesh – Bangladesh Oxygen Ltd and Glaxo Wellcome Ltd took only 41
days (1992) and 45 days (1996) respectively to complete their respective audits. Auditors of a
domestic listed company, Tallu Spinning Mills, completed their 1995 audit in just 27 days.
Until the enactment of the Companies Act 1994, the unusually long audit and publication
delays were normally attributed to outdated legislative provisions, weak enforcement
mechanism and a less than sound regulatory framework governing corporate reporting and
disclosure (Parry and Groves, 1990). It was argued that the Companies Act of 1913, the main
component of the financial reporting regulatory framework, was long outdated and there was
a lack of adequate oversight on securities markets and on companies listed on the stock
exchanges.

5
Six major developments, directly or indirectly relevant to corporate financial reporting, took
place in Bangladesh between 1993 and 2000. First, a Securities and Exchange Commission
(SEC) was established with effect from 3 May 1993 under the SEC Act of 1993. The SEC
Act, in its preamble, states that the SEC was established ‘for the purpose of protection of
interest of investors in securities, for the development of (securities) markets and for matters
connected therewith or incidental thereto’ (GOB, 1993). One of the functions of the
Commission, as specified by the SEC Act, is to call for information from issuers of securities.
Although the SEC Act does not directly deal with the issue of timeliness of financial
reporting, it empowers the Commission to issue new rules or amend existing rules, as it
considers appropriate to improve the capital market and ensure its smooth functioning.
Second, a new Companies Act was enacted in 1994 that came into force on 1 October 1995,
replacing the Companies Act of 1913. The Companies Act 1994 maintained the provisions of
the 1913 Act with regard to the 9month time limit within which companies were required to
furnish their financial statements before an AGM of shareholders. However, the new Act
increases the penalty for noncompliance with this provision by ten times the penalty imposed
by the old Act. Under the Companies Act 1913, the company and every officer of the
company, party to the default, could be fined of an amount up to Tk 500 (NZ$11) for failure
to comply with this provision. On the other hand, the new Act provides for a penalty of up to
Tk 5,000 (NZ$ 110) on each director of the company for failure to comply with the said
provision. A third development took place in October 1997 when the SEC amended the
Securities and Exchange Rules (SER) of 1987 to require listed companies to prepare half
yearly financial statements within one month of the close of the first halfyear of its
accounting year and issue those statements to the stock exchange(s) in which its securities are
listed, to holders of its securities, and to the Commission. Fourth, the country’s capital market
saw an unprecedented boom and a subsequent collapse in stock prices during 199697. One of
the reasons contributing to the unusual rise and fall in securities prices was found to be
artificial manipulation of securities prices by a number of securities dealers and issuers in the
absence of timely provision of reliable financial information in the market (Report of the
Inquiry Committee, 1998). Fifth, after the stock market crash in 1996, the SEC has been
insisting on listed companies holding regular AGMs and publishing up to date annual reports.
The fact that some companies were found to hold up to 5 AGMs and publish financial
statements of up to 5 consecutive years on the same day is most likely to be in response to the
SEC pressure. Finally, on the 4 th of January 2000, the SEC amended the SER 1987, to require,

6
among other things, that the financial statements of an issuer shall be audited within 120 days
(or within a period as extended by the SEC on good cause).
The above events that took place in Bangladesh over the period 1993 – 2000 provide an ideal
setting to study whether regulatory change(s) can improve financial reporting timeliness in
developing countries. It is plausible to expect more timely provision of annual financial
information after the 120day maximum had been set by the SEC and in view of the above
developments for the following reasons:
(i) The creation of the SEC in 1993 would mean listed companies would come under
the SEC oversight leading to improvement in all aspects of corporate financial
reporting including timeliness;
(ii) The increase in penalty for noncompliance with the time limit for holding the
AGMs under the Companies Act 1994 could be expected to improve the overall
timeliness in corporate financial reporting following enactment of the Act;
(iii) The amendment of the SER in 1997 requiring publication of halfyearly financial
statements within one month of the first half of the year should make it easy for
companies to prepare annual financial statements sooner as they would already
have prepared halfyearly financial statements;
(iv) In the aftermath of the biggest stock market crash in Bangladesh history in 1996
97, listed companies could be expected to be extra careful in maintaining and/or
increasing shareholder confidence in the company and its management. They could
also be expected to install internal audit and/or improve existing internal audits to
improve accountability within the organization. Timely provision of financial
information and regular holding of AGMs could be two of the ways management
might want to signal their commitment to the shareholders; and
(v) Until 2000, the 6month time limit set by the Companies Act was the maximum
allowable limit for companies to hold AGMs. No time limit was stipulated for the
completion of audit of companies listed or otherwise. Now that a specific limit is
set for audit completion, one would expect a significant improvement in financial
reporting timeliness of listed companies.
In addition to the above, the steady increase in foreign investment into the country and greater
degree of financial liberalisation could be expected to improve the timeliness of financial

7
reporting in the country over time. This study focuses on one aspect of corporate financial
reporting – timeliness. The study aims to see whether the change in the financial reporting
regulatory environment has been successful in significantly reducing the time lag in
publishing financial statements by companies in Bangladesh.
The motivation of the study is derived from the longstanding problem of lack of timely
provision of corporate financial information in Bangladesh. A survey of 650 financial
statement users and preparers of financial reports in Bangladesh revealed that an
overwhelming majority of respondents both preparers and users (93.8 percent), believe that
the observed time lag in publishing corporate annual reports could be substantially reduced
(Karim, 1995). Having outlined the motivation for the study in the current section, the rest of
the paper is organised as follows: Section II reviews prior research on the issue of audit delay
and its determinants, Section III shows the trend in audit delay over the last 14 years since
1990. Section IV outlines the methodology of the present study and discusses the rational for
using specific variables in the study. Section V discusses the results of the analysis carried out
in the paper while Section VI summarises the findings and concludes the paper.
II. Prior Research
A number of studies have been undertaken on the issue of timeliness in Australia (Dyer and
McHugh, 1975; Whittred, 1980 and 1980a; Davies and Whittred, 1980; Whittred and Zimmer,
1984; and Simnett, 1995), in New Zealand (Courtis, 1976; Gilling, 1977 and 1983; and
Carslaw and Kaplan, 1991), in the United States (Garsombke, 1977; Kross, 1981 and 1982;
Givoly and Palmon, 1982; Kross and Schroeder, 1984; Chambers and Penman, 1984; Zeghal,
1984; Keller, 1986; Ashton et al, 1987; Williams and Dirsmith, 1988; Kinney and McDaniel,
1993; Bamber et al, 1993; Schwartz and Soo, 1996; Lawrence and Glover, 1998; Knechel and
Payne, 2001; and Payne and Jensen, 2002), in Canada (Ashton et al, 1989; Newton and
Ashton, 1989; ), in Hong Kong (Ng and Tai, 1994 and Jaggi and Tsui, 1999), in Bahrain
(Abdulla, 1996), in Bangladesh (Imam et al, 2001; Ahmed, 2003; and Karim, 2003), in
Zimbabwe (OwusuAnsah, 2000), in France (Soltani, 2002), in Saudi Arabia (AlSehali and
Spear, 2004) and in Greece (Leventis and Weetman, 2004). The body of literature on financial
reporting timeliness can be categorised into two broad categories: studies attempting to
identify the determinants of audit delay and studies on the association between information
content and timeliness.
8
The first category of studies generally assumes that crosssection variation in audit delay is
not a random phenomenon. It is functionally related to certain client and auditor attributes.
These studies, therefore, aim to identify those attributes that might explain, at least to a certain
extent, the variations in audit delay (Dyer and McHugh, 1975; Courtis, 1976; Gilling, 1977;
Garsombke, 1977; Davies and Whittred, 1980; Whittred, 1980; Gilling, 1983; Ashton et al.,
1987; Ashton et al, 1989; Carslaw and Kaplan, 1991; Ng and Tai, 1994; Simnett, 1995;
Abdulla, 1996; Jaggi and Tsui, 1999; OwusuAnsah, 2000; Knechel and Payne, 2001; Ahmed,
2003; Payne and Jensen, 2002; and Leventis and Weetman, 2004). Apart from looking at the
determinants of audit delay, a few studies in this category looked at the association of audit
delay with specific issues such as audit technology (Williams and Dirsmith, 1988; Newton
and Ashton, 1989; and Bamber et al, 1993), audit qualification (Whittred, 1980a and Keller,
1986), auditor switch (Schwartz and Soo, 1996, audit firm merger (Lawrence and Glover,
1998), auditor’s international link (Imam et al, 2001), financial distress (Whittred and
Zimmer, 1984), correction of previously reported earnings (Kinney and McDaniel, 1993 and
Simnett, 1995), and relationship between decision relevance of accounting earnings and
timeliness of earnings disclosure.
The second category of studies tend to argue that if accounting reports have information
content they must cause the market to react to that information. They also argue that reactions
surrounding announcement period should be different from that in nonannouncement period
(Beaver, 1968). These studies mainly examine whether timeliness is associated with
information content, i.e., whether bad news is systematically delayed (Kross, 1981 and Givoly
and Palmon, 1982) and whether market reacts differently to early and late release of
information (Kross, 1982; Zeghal, 1984; Kross and Schroeder, 1984, and Chambers and
Penman, 1984).
The corporate attributes examined in the first category of studies include size, profitability,
leverage, audit risk, audit complexity, fiscal yearend, listing status, industry sector, quality of
internal control, dividend, presence of extraordinary items, presence of contingencies,
ownership, financial condition, correction of earnings, company age etc. The auditor attributes
examined include auditor size, type of audit opinion, auditor’s international link, audit
technology, auditor change, incremental audit effort, etc. Empirical evidence is
overwhelmingly in favour of an inverse relationship between audit delay and client size

9
(Givoly and Palmon, 1982; Chambers and Penman, 1984; Williams and Dirsmith, 1988;
Newton and Ashton, 1989; Ashton et al., 1989; Carslaw and Kaplan, 1991; Bamber et al.,
1993; Ng and Tai, 1994; Abdulla, 1996; and OwusuAnsah, 2000). However, Davies and
Whittred (1980) find that both small and large firms have significantly shorter delays than
moderatesized companies. Schwartz and Soo (1996) find a direct relationship between audit
delay and size while Ashton et al (1987) find mixed results with regard to size and audit
delay. Simnett (1995) and Courtis (1976) do not find any significance for size in explaining
audit delay.
Dyer and McHugh (1975) and Davies and Whittred (1980) do not find any relationship
between relative profitability and audit delay. Similarly, Garsombke (1977) reports that good
news is not reported more timely than bad news. Courtis (1976) on the other hand, suggests
slow reporters tend to be less profitable. Kross (1981 and 1982), Givoly and Palmon (1982)
reveal that late announcements have a higher probability of containing bad news. Chambers
and Penman (1984) and Kross and Schroeder (1984) find that the market greets early
announcement as good news and viceversa. Ashton et al (1989) find the sign of net income to
be significant in explaining audit delay. Carslaw and Kaplan (1991), Simnett (1995) and
OwusuAnsah (2000) find that audit delay is positively associated with existence of loss.
Some measure of audit risk has been used in many studies (Ashton et al, 1989; Bamber et al,
1993; and Schwarz and Soo, 1996; and Simnett, 1995). Simnett (1995) argue that auditors
may be extra cautious while auditing companies with high debt levels. Abdulla (1996) argues
that highly geared firms would be under greater monitoring and scrutiny by debt holders,
which might provide incentives to early release of financial information. Carslaw and Kaplan
(1991) find that companies with low debt proportions had shorter audit delay while Simnett
(1995), Abdulla (1996), and OwusuAnsah (2000) did not find any such relationship.
Ashton et al (1987) find significant association between audit delay and complexity of
operations. Ashton et al (1989) argue that presence of extraordinary items and contingencies
could lead to increases in audit delay. Other studies finding significant association between
audit complexity and audit delay include Givoly and Palmon (1982), Bamber et al (1993), Ng
and Tai (1994), Jaggi and Tsui (1999), OwusuAnsah (2000).
10
A number of studies examine association of audit delay with audit firm size and/or its
international link. They have generally hypothesised an inverse relationship between auditor
size and audit delay (for example, Gilling, 1977; Garsombke, 1977; Davies and Whittred,
1980; Ashton et al, 1989; Carslaw and Kaplan, 1991; Ng and Tai, 1994; and Simnett, 1995).
They rely on the argument that the big firms invest more to maintain the reputation of audit
quality (DeAngelo, 1981) and therefore, clients of larger audit firms are likely to have shorter
audit delay. Empirical results, however, do not support the hypothesis as none of the above
studies except Ashton et al (1989) find any significance of auditor size in explaining audit
delay. The only study using auditors’ international link found a direct relationship between
international link and audit delay (Imam et al, 2001).
Some studies test whether month of the yearend is associated with audit delay. Garsombke
(1977) finds inconclusive evidence that firms with ‘busy season’ yearends have longer audit
delays while Ashton et al, (1987) and Newton and Aston (1989) find the opposite. Ashton et
al (1989) find yearend to be significant in three of the six years studied while Carslaw and
Kaplan (1991) do not find any significance for yearend.
Williams and Dirsmith (1988), Newton and Ashton (1989) and Bamber et al (1993) study the
impact of audit technology on audit delay. All of them proxy audit technology by the degree
of structure vs. judgment involved in the audit process using Kinney’s (1986) classification.
Williams and Dirsmith (1988) find structured audit approach associated with shorter audit
delay while Newton and Ashton (1989) find a direct association between the two. Cushing
(1989) questions Newton and Ashton’s (1989) rationale behind expecting a positive
association between audit structure and audit efficiency. He argues that a more structured
approach does not necessarily increase audit efficiency and even if it did, he doubts whether
audit efficiency necessarily translates into reduced audit delay. Bamber et al (1993) attempt to
resolve the conflicting findings reported by Williams and Dirsmith (1988) and Newton and
Ashton (1989) and find results consistent with Newton and Ashton (1989). However, they
find that when an unanticipated event occurs, structured audit firms are able to adapt more
quickly.
Kross (1981 and 1982) examines whether firms systematically report bad news later than
good news and whether the market interprets a later than expected delay as a sign of bad
news. In both cases the findings confirm a systematic relationship between the type of news
11
and announcement time lag. In terms of market reactions to early vs. late announcements,
Kross (1982) finds that late reporters earned lower residual returns than early reporters around
the actual announcement dates. Kross and Schroeder (1984) examine both the association
between earnings announcement timing and type of news and between stock returns around
announcement dates and announcement timing. They find that earlier (later) announcements
are characterised by higher (lower) unexpected earnings and that earnings announcement
timing is associated with abnormal stock returns around the earnings announcement date. In a
similar study, Chambers and Penman (1984) find that with the exception of the reports of
relatively small firms bearing good news, there is no significant relationship between
reporting lags and the variability of stock returns associated with earnings releases. They
observe larger market reactions to earnings reports of small firms than to those of large firms.
They also find that unexpectedly early reports bring good news and vice versa and that reports
released earlier than expected tend to have larger price reactions than reports published on
time or later than expected. Abdulla (1996) also studies the impact of type of news on audit
delay and finds that good news is significant in explaining audit delay in Bahrain.
III. Trend in Audit Delays Since 1990
This section provides a general idea of the secular trend in audit and reporting delays of
corporate annual reports in Bangladesh over the period 1990–2003. To draw a reasonably
comprehensive picture of the audit lag situation, we report the summary statistics in two
levels. First, we report the results based on the whole population of companies whose annual
reports were available. Second, we concentrate on the lag pattern of a matched sample of only
61 companies throughout the period. Graphs 1 (whole sample) and 2 (matched sample) show
the trends in mean values of audit lag for the whole study period. Both the graphs show
somewhat similar trends. The lags steadily increased for 2 to 3 years after 1990, then dropped
for 2 to 3 years before rising again for 4 years and finally dropped to their 1990 levels by the
end of the decade. However, after the SEC’s 120day limit has been imposed, the audit lag
saw somewhat significant decline in the years since 2000 in both the samples.
Insert graph 1 here
Insert graph 2 here

12
Table 1 presents the summary statistics of the lags for the 14 years under study using all listed
firms. The table shows that the mean audit lag over the 14year period ranges from
Insert Table 1 about here
131 days in 2003 to 212 days in 1998 with a mean delay of 175.12 days for the entire
population. The median ranges from 118 days in 2003 to 173 days in 1998. The medians are
considerably lower than the means for all ten years suggesting a nonnormal, positively
skewed distribution.
The unusually long audit delays of some companies can be observed from the maximum audit
delay statistic in Table 1. Some companies are found to have taken more than 1,400 days to
complete an audit. These companies are clearly well outside any reasonable limit allowable.
These are companies who are mostly nonfunctional, nonoperating and in clear violation of
the securities and company regulations.
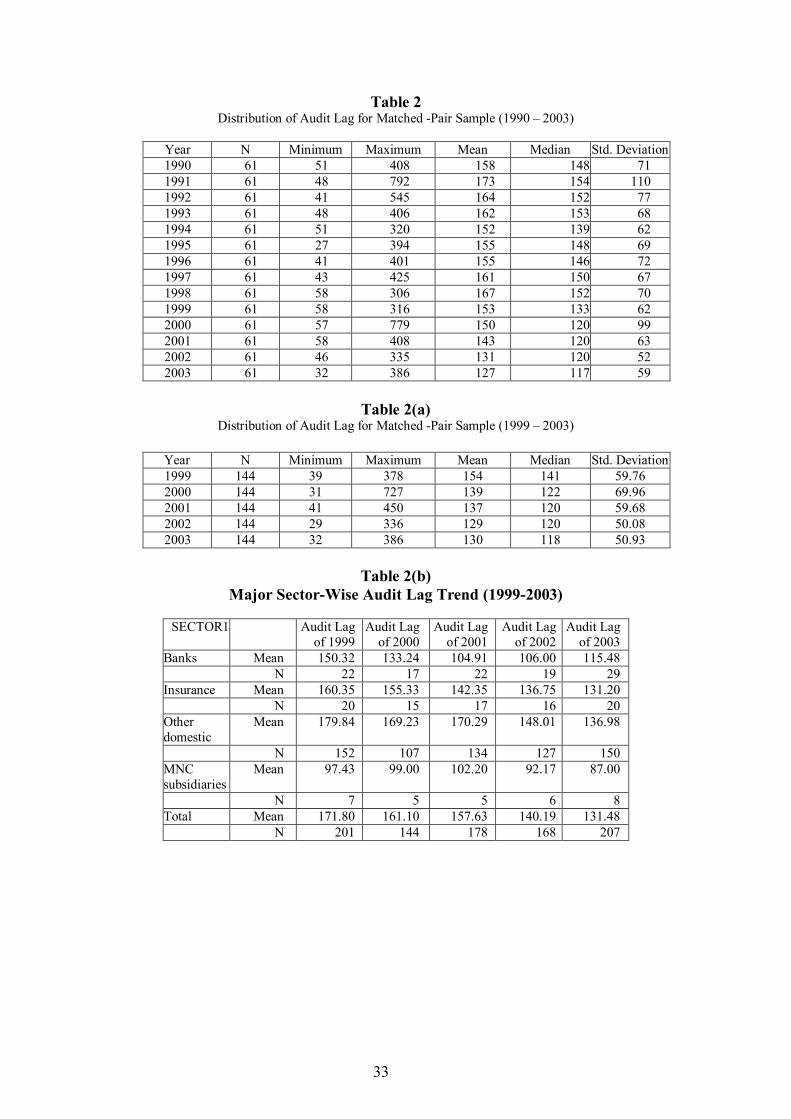
Table 2 presents summary statistics on the matched sample of 61 companies whose annual
reports were available for each of the sample years and who held an AGM every year, i.e.,
who had never doubledup AGMs during the study period. Since they never held two AGMs
on one date, these companies are unlikely to have unusually long audit or reporting delays.
Insert Table 2 about here
Table 2 shows that the lowest average audit delay (127 days) is observed in 2003, the year
with the lowest median audit delay (118 days) as well. At the beginning of the study period,
the average audit delay was 180 days, rose by a few days for two years until dropping to 169
days in 1994, remained steady at 172 days in 1995, then kept rising for 3 years to reach its
highest level of 212 days in 1998. Since 1998, audit lag continued to decline and the trend
remains declining until now. The median audit delay was the highest in 1998 but had drooped
by 27 days in 1999.
Insert Tables 2(a) and 2(b) about here
13
Both Tables 1 and 2 have limitations of own kinds. Movements in average audit lag shown in
Table 1 are of limited value, as the averages in each year are not based on the same set of
companies. To overcome heterogeneity in yeartoyear samples, we produce a matched
sample in Table 2 whereby we show the average audit delays of the same set of companies
over the period. However, in doing so, we lose many observations as our samples include only
61 companies each year. In order to provide a bigger picture of the lag situation, we produce
Table 2(a) that shows the lag situation of a matched sample of 144 companies over a
relatively shorter period, 1999 to 2003.
Table 2(b) summarises the audit lag pattern of significant subgroupings within the whole
sample for the period 1999 to 2003. It shows how banks and insurance companies differ from
nonfinancial domestic companies and how multinational subsidiaries stand out by having
some of the shortest audit lags.
IV. The Present Study
Research Design
The regulatory change taking place in the year 2000 via amendment of the SER 1987 is the
event under the present study. Using event study methodology, the study first intends to
identify if there was an impact of the said regulatory change on timeliness of financial
reporting and then measure such impact (if any) by comparing the audit delays of a sample of
companies for a period prior to and a period after the event took place. For the purpose of the
study audit delays in the year immediately preceding the regulatory change and in two years
after the regulatory change are examined. The year 1999 is selected as the preregulatory
change year while the years 2001 and 2003 are chosen as postregulatory change years. The
year 1999 is selected as it is the last year before the imposition of the 120day time limit to
complete audit of listed companies. Therefore, it is expected to be the year least affected by
any noise taking place between the selected preevent year and the event. The years 2001 and
2003 are selected to make separate comparisons with the year 1999. The year 2001 is first
compared with the year 1999 to see the immediate effect of the regulatory change while the
year 2003 is compared with the year 1999 to see if the effect of the regulatory change is more
visible as some time is allowed for the new ruling to take effect. For each company audit
delay was measured as the number of days between company’s accounting yearend and the

14
date appearing in the audit report as the date of signing the report. A dummy variable, labelled
regchnge differentiates firm years before the regulatory change from those after the change.
Data on selected corporate attributes, e.g., size, leverage, profitability, audit risk, audit
complexity, etc., were also collected from the annual reports for each company. Multiple
linear regression technique was used to examine the impact of the regulatory change on the
delay measure. The regression models use audit delay as dependent variable and regchnge as
the main explanatory variable in all the models while controlling for selected corporate
attributes that might also be associated with the concerned delay measures. It is argued that
controlling for relevant corporate attributes, the emergence of regchnge as a significant
variable with a negative beta coefficient would imply a positive impact of the study event on
audit, issue, and total delay and viceversa for a significant positive coefficient. If one the
other hand, regchnge does not emerge as a significant variable, it would imply that the
regulatory change did not have any significant impact, positive or negative, on the delay
measures.
Matched Pair Sample and Data Collection
On 31 December 2003 there were 267 listed securities issued by 248 companies. On the same
date 11 mutual funds and 8 debentures were also listed on the two exchanges. Among the
listed securities, 58 were issued commercial banks (21), NonBank Financial Institutions (5
leasing, 11 mutual funds and ICB shares) and Insurance companies (20). The number of
securities on 31 December 1999 was 220. Some companies listed in 1999 were delisted in the
later years while many new companies got their securities listed on the DSE since 1999.
Annual reports of many companies listed throughout the period were either not published or
were not available. Two matched pair samples were developed for this study, one between the
years 1999 and 2001 and the other between the years 1999 and 2003. The matchedpair
samples were constructed using the following criteria: (i) the company was listed in the DSE
during the period under study, i.e., from 1999 to 2001 for the first sample and from 1999 to
2003 for the second sample; (ii) the annual reports of the concerned years were available; and
(iii) the company held separate AGMs for each accounting year under study. The exercise
produced 320 firm years (160X2 = 320) in the 1999 v 2001 sample and 330 firm years (165X2
= 330) in the 1999 v 2003 sample.
15
Measuring Timeliness
Financial reporting timeliness is a function of a number of auditor and clientrelated factors
such as (i) the time taken to complete the audit; (ii) management decision with regard to the
timing of issuing financial statements; (iii) statutory requirement of a minimum number of
days’ that have to be allowed between AGM date and the date of serving the notice of holding
the AGM; and (iv) other logistical barriers, e.g., availability of a suitable date and/or venue for
holding the AGM. For the purpose of this study, we concentrate on the first component
mentioned above, that is, the time taken by auditors and their clients in completing an audit.
We focus on audit delay for two reasons: first, it is an unavoidable part of the financial
reporting process, ceteris paribus, the longer it takes to complete the audit, the longer it is
going to take to issue audited financial statements to interested users and second, the
regulatory change that we examine in this paper affects this component only. Therefore, audit
timeliness is used as a proxy for overall financial reporting timeliness in this study. Audit
delay represents the number of days elapsed between the accounting yearend and the date
auditor(s) sign(s) the financial statements.
In order to test whether there have been significant improvement in audit lag, we use two
matchedpair samples, one using observations from the years 1999 and 2001 and the other
using observations from 1999 and 2003. For each matched pair, we run two separate
regressions – one based on all companies and the other based on nonfinancial companies
alone. The descriptive statistics for both pre and postregulatory change years is given in
Tables 3 and 3(a) respectively for the 1999 v 2001 matched pair and the 1999 v 2003 matched
pair.
Insert Tables 3 and 3(a) about here
It may be observed from the descriptive statistics that the mean audit delays in each of the
years under study are above the statutory maximum of 120 days. Although steady
improvement could be observed in the delay pattern, it is somewhat disturbing that the
majority of the companies fail to comply with the relevant regulation. As a distinct group,
only the MNC subsidiaries are showing greater urgency in completing audits. As shown in
Table 2(b), their average audit delay is consistently below 100 days and is only 87 days in the
year 2003. Once we take a closer look at the audit delay situation of individual companies,

16
we find that in 1999, only 27.5% (44 out of 160) companies of the 1999 v 2001 matched pair
sample have completed their audits within the 120day period. However, the percentage of
companies completing audits within 120 days increased to 48.12% (77 out of 160) in 2001
and to 55.15% (91 out of 165) in 2003. While this improvement is encouraging, it is a matter
of concern that so many companies are still failing to comply with the regulatory ruling of the
SEC. This combined with the fact that the present study only covers the companies whose
annual reports were published and available to this researcher. By the time we have completed
collecting annual reports for this study (June 2005), many companies would not have
convened their AGM and it is likely that many of them would not have completed their audits
either. Overall, it is encouraging to see significant improvements taking place in financial
reporting timeliness as in 2003 only 14 companies (out of 165) appear to have taken longer
than 6 months in completing their audits while in 1999, 47 companies in the same sample of
165 companies took longer than 6 months.
Hypothesis of the Study
The study tests the following hypothesis:
Ho1: There is no significant difference between audit delays in corporate financial
reporting prior to and after the regulatory change taking place in the year 2000.
Multiple linear regressions have been used to examine the impact of regulatory change
on audit delay. A total of four models have been developed – two using 1999 v 2001 matched
pair sample and two using 1999 v 2003 matched pair. Within each of the matched pair
samples, there are two models one based on all companies (i.e., both financial and non
financial companies) and the other based on nofinancial companies alone. In each of the four
regression models, the crucial variable, regchnge represents regulatory change.
The Dependent and Explanatory Variables
Dependent Variables
The only measure of timeliness (or lack of it) that has been used in the study is audit delay.
17
Explanatory Variable
Regchnge: The main explanatory variable in the study is regchnge – the variable
representing regulatory change. The variable is used under the assumption that if the
regulatory change was effective in improving timeliness in corporate financial reporting, then
after controlling for relevant control variables explained later, the observed audit delays in the
postregulatory change, i.e., in 2001 and 2003, should be significantly less than those in the
preregulatory change period, i.e., 1999. The variable captures regulatory change by
separating the annual report belonging to the 1999 subsample from those belonging to 2001
or 2003 subsample. The two subsamples represent the periods prior to and after the study
event respectively. Each company in the 1999 subsample is present in the 2001 and 2003
subsamples too. The variable is coded 0 if it belongs to 1999 subsample and 1 if it
represents 2001 or 2003 subsamples. If postregulatory change audit and publication delays
were significantly longer (shorter) than those of preregulatory change, this variable would
emerge significant with a positive (negative) coefficient. An insignificant regchnge would
mean the regulatory change over the two subperiods were not significantly different from
each other. We expect an improvement in audit delay in the postregulatory change period and
hence expect a negative sign with a significant beta for this variable.
Control Variables
While examining the impact of regulatory change on financial reporting timeliness, it is
important to control for possible corporate and auditor attributes that are likely to affect
timeliness. A number of such corporate and auditor attributes have been identified from a
review of literature and analysis of bivariate correlations between timeliness measures and
such attributes. The rationale for using them in the regression models and the procedures of
operationalizing them are explained in the following paragraphs.
Client Size: The size of the reporting company has been a major variable of interest in most
studies examining audit and publication delays. It is argued that large firms are likely to have
stronger internal control, more sophisticated accounting information system, internal audit,
and greater accountability – all of which should make it easier to audit large number of
transactions in a relatively shorter time. On the other hand, it could also be argued that it is
likely to take longer to audit larger companies because of the volume of audit work involved.
However, Ashton et al (1989) rebut this argument suggesting that greater volume of audit
work might not necessarily lead to longer audit delay, as the auditor has flexibility in timing

18
the audit work, e.g., commencing the audit before the yearend date. The other reason why a
large client should not necessarily take longer to audit is that the presumably higher audit fees
paid by larger clients allow auditors to deploy more audit personnel or more efficient audit
personnel, in larger clients, to cope with the extra volume of work. Apart from auditors’
perspective, there are economic reasons why larger clients have incentives to opt for smaller
audit lag. Such reasons include larger companies’ being politically visible, having more
external stakeholders, being more closely monitored by analysts, having more to lose from a
negative signal provided by a longer than expected audit delay, and being able to exert
pressure on the auditor to expedite the audit process. We considered several size measures
such as log of total assets, log of sales, and log of market capitalisation, for inclusion in our
audit delay models. However, each of the size measures shows possible multicollinearity with
log audit fee, audit firm size, and multinational subsidiary variables. Hence all size measures
were dropped from the models.
Profitability: Corporate profitability affects timeliness in many ways. Studies on the
understandability of financial statement messages have found that narrative disclosures in
corporate annual reports are deliberately made complex to communicate bad news and made
more lucid and easily understandable to communicate good news (Adelberg, 1979).
Companies are likely to feel more comfortable when disclosing favourable rather than
unfavourable information. Higher than expected profits tend to be good news for investors
and other corporate stakeholders unless the company is a regulated utility. With regard to
timeliness, it is expected that companies would be eager to release ‘good news’ without delay
and be reluctant in releasing ‘bad news’ or ‘not so good’ news. In years of high profit, they
are likely to feel more confident to face the shareholders than in other years. Therefore, at
least the meeting lag should be minimal in profitable years. The audit delays could also be
shorter in profit years compared to the loss years as there would be less perceived audit risk
(discussed later) in profit years. On the other hand, the existence of a loss could induce
auditors to carry out additional tests as the likelihood of lawsuits against auditors increase
when the company fails.
In this study, a number of profitability measures were computed from the annual report data,
but return on equity (ROE) was selected for the analysis. The reasons for selecting this
variable as the profitability measure are as follows. First, many marketbased measures of

19
profitability like priceearning ratio are not calculable for companies incurring losses.
Second, dividendbased measures could not be used because many companies in the sample
were found to have earned profits but to have paid no dividends and viceversa during the
years under study. These problems limited the choice of profitability measures to: net profit
to sales, return on total assets, and return on equity. The correlation coefficients of all three
measures showed that return on equity (ROE) had the highest correlation with the dependent
variable and so it was used as the profitability measure in the regression models and is
labelled ROE. No specific sign is expected for this variable, as more profitable companies are
likely to demonstrate smaller improvement in audit delays, because they are likely to have
shorter delays in the preregulatory change period anyway.
Leverage: The degree to which a firm's financial structure is geared has been used in a few
timeliness studies to examine if there exists any association between gearing ratio and
timeliness in financial reporting. Simnett (1995) argue that auditors may be extra cautious
while auditing companies with high debt levels as the riskiness of a company’s equity
securities generally increases with increases in its degree of financial leverage. The increased
risk leading to increased audit work is likely to lead to an increase in audit delay. On the other
hand, Abdulla (1996) argues that highly geared firms would be under greater monitoring and
scrutiny by debt holders which might provide incentives to directors to release of financial
statements as earlier rather than later. Carslaw and Kaplan (1991) find that companies with
low debt proportions had shorter audit delay while Simnett (1995), Abdulla (1996), and
OwusuAnsah (2000) did not find any significance of debt levels in explaining audit delay.
Nevertheless, we decided to use leverage in the present study as a control variable. The debt
equity ratio is used as the measure of leverage. Some other leverage measures were also
computed such as debt to total assets, total debt, and capital gearing ratio. The debtequity
ratio was selected for analysis because it showed the highest correlation with the dependent
variable. However, due to possible multicollinearity problem, the variable was later dropped
from the analysis, as it appears to be significantly correlated with other variables in the model,
e.g., accountant, multinational subsidiary, and size of audit firms.
Audit Risk: Audit risk is likely to explain cross section variations in audit delays because the
volume and scope of audit work normally increases as audit risk increases. Auditors being risk
averse have incentives to take longer, if necessary, to form an opinion when the financial
position and performance of the client signals presence of audit risk. It can be argued that
20
auditors generally exercise more caution certifying financial statements of loss firms than they
do with profit firms. Firms making current year losses or having accumulated losses are more
likely to draw litigation, sometimes involving auditors, than profit firms. Therefore, it is likely
to take longer to complete audit of a lossmaking client than that of a profitmaking client. So
the audit delay is argued to be positively associated with audit risk. Some measure of audit
risk has been used in many studies as an explanatory variable to audit and/or publication
delays (see for example, Ashton et al, 1989; Bamber et al, 1993; and Schwarz and Soo, 1996;
and Simnett, 1995).
In addition, companies with a current year operating loss or accumulated losses for
consecutive years would be reluctant to release timely information and hold timely AGMs.
Hence they would not insist that their auditors complete the audit on a timely basis. Since they
would not be in a position to declare any or reasonable dividends, they would have less
incentive to call for AGMs early or on time. On the other hand, the companies with profits or
higher than expected profits are more likely to announce dividends and call for early AGMs,
leading to more timely publication of financial statements. Therefore, even if the audit is
complete, loss companies are likely to have more meeting delay leading to increases in
publication delay. The measures of audit risk used in previous studies include: leverage ratio,
operating loss in the year of study, and existence of accumulated loss. In this study, leverage
(as already discussed) and the existence of accumulated loss in companies’ accounts were
used as the measures of audit risk. Neither of the variables has been included in the
multivariate analysis due to multicollinearity problem with the market category (mktcat)
variable.
Audit Complexity: Audit complexity has also been used to explain audit delay. It is
plausible to expect a positive association between audit delays and audit complexity. Ceteris
paribus, a more complex audit can, of course, take longer than a less complex one. The
potential measures to proxy audit complexity include number of branches, number of
subsidiaries, number of overseas subsidiaries, number of industries in which the client
operates, the absolute amount of inventory and receivables, and the proportion of assets in
inventory and receivables. Givoly and Palmon (1982) suggested the ratio of inventory to total
assets as a complexity measure. Ashton et al (1987) use four measures of audit complexity in
their study of audit delay in the US. Their measures include complexity of operations,
accounting and financial control systems, electronic data processing systems, and the number

21
of separate audit reports issued. Among the four variables, they find significant association
between audit delay and complexity of operations. Ashton et al (1989), in their Canadian
study, argue that presence of extraordinary items and contingencies could lead to increases in
audit delay. Other studies that find a significant association between audit complexity and
audit delay include Bamber et al (1993), Ng and Tai (1994), Jaggi and Tsui (1999), Owusu
Ansah (2000). In the present study, the proportion of assets in the form of inventory and
receivables was used as the measure of audit complexity. The use of a relative measure of
audit complexity meant that the size effect was not affected by the inclusion of the variable.
The variable was labelled COMPLEX. A positive sign is expected, as more complex audit
clients are likely to show smaller improvements in the postregulatory change periods.
Size of the Audit Firm and its International Link: The size of the company's audit firm
and/or its international link is believed to influence audit delay. Studies on audit delays have
generally hypothesised an inverse relationship between auditor size and audit delay (for
example, Gilling, 1977; Garsombke, 1977; Davies and Whittred, 1980; Ashton et al, 1989;
Carslaw and Kaplan, 1991; Ng and Tai, 1994; and Simnett, 1995). They rely on the argument
that clients of larger audit firms are able to publish their annual reports much earlier than the
clients of smaller audit firms because the big firms invest more on training and are equipped
with modern techniques of performing an audit than their nonbig counterparts. They are also
likely to attract more efficient audit personnel. DeAngelo (1981) argued that larger audit firms
invest more to maintain the reputation of their audit quality. Empirical results, however, do
not support the hypothesis as none of the above studies except Ashton et al (1989) find any
significance of auditor size in explaining audit delay. The only study using auditors’
international link found a direct relationship between international link and audit delay (Imam
et al, 2001).
In Bangladesh, none of the BigFour audit firms have a named branch. However, some of the
larger Bangladeshi firms claim affiliations with the international BigFour. These few big
firms are responsible for auditing most of the big companies in the private sector and almost
all the multinational companies operating in Bangladesh. In the present study, both size and
international link of audit firms were considered for use as explanatory variables, but there
was no obvious cutoff point for firm size. Moreover, since information on the audit firms'
international links was available, it was considered a more objective measure of audit quality
than using any arbitrary measure of auditor size. Therefore, two criteria were used to capture

22
auditfirm size and quality. They were: number of chartered accountants (partners and
employees) employed by an audit firm and the international link of the audit firm. The use of
the above two criteria meant that the selected variable is capable of capturing both auditor size
and the influence of international audit firms. Audit firms having four or more chartered
accountants (including partners) and an affiliation with an international BigFour or a non
BigFour firm were treated as 'Big' and audit firms failing to meet either criteria were treated
as nonBig firms in the context of Bangladesh. Six audit firms were found to have
international links, five of which were with an international BigFour firm and the remaining
firm with a nonBigFour firm. On the other hand, eight firms were found to have four or
more chartered accountants, four of them having links with international BigFour and one
with an international nonBigFour firm. Using both the criteria, five audit firms were found
to satisfy both the criteria. These five firms together audited 49 percent of the sample firms.
In order to see if the auditor's international link and size had any impact on timeliness, this
was used as an explanatory variable labelled AUDITOR. The variable was operationalised by
assigning one if the company's audit firm was big and zero if it was not. A negative sign is
expected for the auditor variable, as clients of auditors with international links are likely to
show greater improvements in audit delays in the postregulatory change periods.
Influence of Multinational Parent: Subsidiaries of multinational corporations operating in
developing countries are expected to provide timely information and observe higher standards
of reporting for a number of reasons. First, they have to comply with the regulations of not
only the host country but also the parent company whose financial reporting is much more
timely. Any delay at the subsidiary end in publishing financial reports would delay the
parent’s preparation of consolidated financial statements. Therefore, subsidiaries of
multinational companies have incentives and pressure to make timely provision of
information. Second, they are usually equipped with more competent and efficient
management and are more likely to have installed sophisticated accounting systems and so,
they have the resources to cut down publication delay without much incremental costs. The
influence of a multinational parent is operationalised by means of a dummy variable labelled
MNCSUBSI with one for MNC subsidiaries and zero for domestic companies. A negative
sign is expected for this variable signifying lower audit delays for MNC subsidiaries.
23
Audit Fee: The production of audit services involves cost to the auditor. Such costs of
performing an audit theoretically depends on a number of factors including auditee size, audit
complexity, audit risk and so on. Ceteris paribus, the cost of producing a higher quality audit
should involve additional costs as evidenced in the fee premia charged by the international
big4 audit firms. Similarly, ceteris paribus, the cost of producing a timely audit could involve
additional costs to the auditor. The auditor, therefore, should charge higher audit fees from
clients requiring timely audit or audit in a shorter period of time. We capture the impact of
audit fees on audit delay by incorporating audit fees paid by the sample companies into our
regression models. In the model based on combined sample, we control for audit fees while
examining the impact of regulatory change on audit delay. The actual audit fees paid by the
companies are used for this purpose. Since audit fees were not normally distributed, log
transformations of actual audit fees are carried out to ensure normality of the distribution. The
variable is labelled LOGADTFE. A negative sign is expected for this variable, as companies
paying higher audit fees are likely to take shorter audit delays.
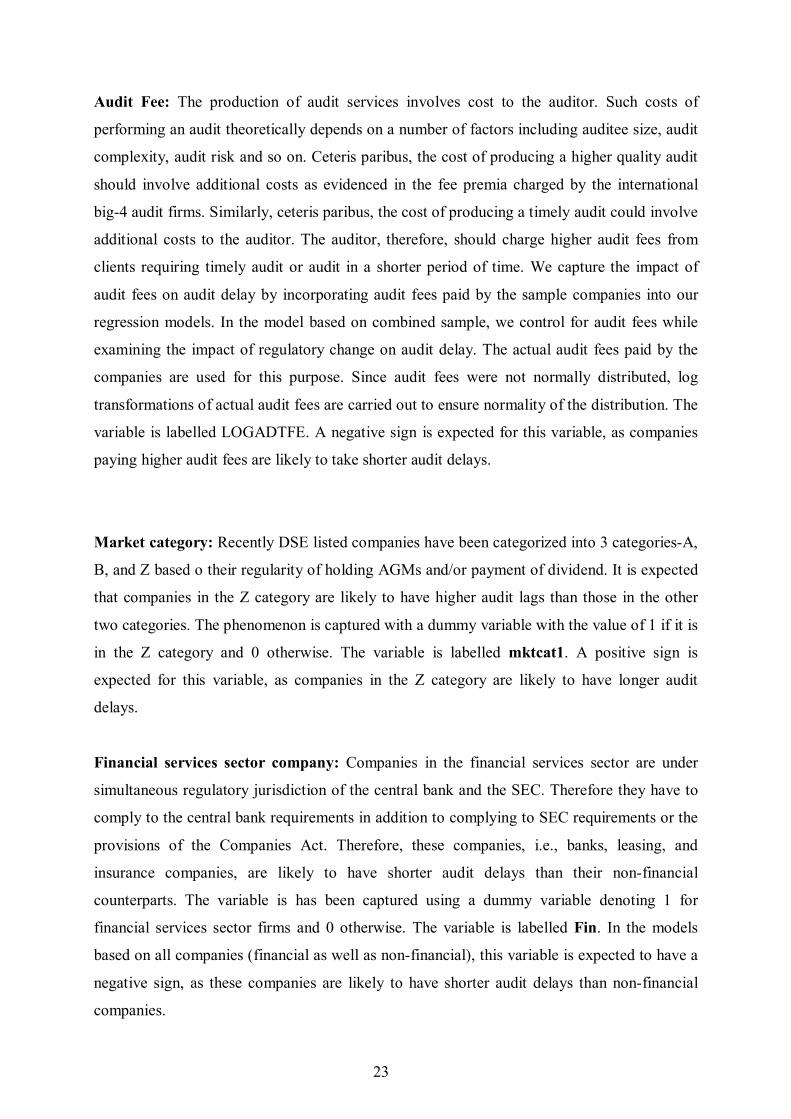
Market category: Recently DSE listed companies have been categorized into 3 categoriesA,
B, and Z based o their regularity of holding AGMs and/or payment of dividend. It is expected
that companies in the Z category are likely to have higher audit lags than those in the other
two categories. The phenomenon is captured with a dummy variable with the value of 1 if it is
in the Z category and 0 otherwise. The variable is labelled mktcat1. A positive sign is
expected for this variable, as companies in the Z category are likely to have longer audit
delays.
Financial services sector company: Companies in the financial services sector are under
simultaneous regulatory jurisdiction of the central bank and the SEC. Therefore they have to
comply to the central bank requirements in addition to complying to SEC requirements or the
provisions of the Companies Act. Therefore, these companies, i.e., banks, leasing, and
insurance companies, are likely to have shorter audit delays than their nonfinancial
counterparts. The variable is has been captured using a dummy variable denoting 1 for
financial services sector firms and 0 otherwise. The variable is labelled Fin. In the models
based on all companies (financial as well as nonfinancial), this variable is expected to have a
negative sign, as these companies are likely to have shorter audit delays than nonfinancial
companies.

24
V. Results
Multivariate Analysis of Audit Delays
In the multiple linear regression analysis the proposed dependent and independent variables
and their expected signs are shown in Table 4.
Insert Table 4 about here
Two correlation matrices for the two matched pair samples are constructed. They are shown in
Tables 5 and 5(a).
Insert Tables 5 and 5(a) about here
Dependent Variable:
ADITLAG = Audit lag (in days)
Independent Variables:
REGCHNGE = Regulatory change
LOGADTFE = Natural log of audit fees
COMPLEX = Audit complexity
ROE = Return on equity
MKTCAT = Market category
AUDITOR = Auditor size and international link
MNCSUBSI = Multinational subsidiary
FIN = Financial sector company
The models:
Two models have been developed for each of the two matched pair samples. The only
difference between the two models is the inclusion or exclusion of the FIN variable. The first
model includes the FIN variable as it is based on all (both financial and nonfinancial

25
companies) observations while the second model does not have the FIN variable as it is based
on nonfinancial companies only.
Model based on all observations:
AUDITLAG = α + β1REGCHNGE + β2LOGADTFE + β3COMPLEX + β4ROE+
β5MKTCAT + β6 AUDITOR + β7MNCSUBSI + β8FIN + ε ..................(1)
Model based on nonfinancial companies only:
AUDITLAG = α + β1REGCHNGE + β2LOGADTFE + β3COMPLEX + β4ROE+
β5MKTCAT + β6 AUDITOR + β7MNCSUBSI + ε ..................(2)
The regression results are reported in Tables 6 and 6(a).
Insert Tables 6 and 6(a) about here
Discussion of the Results
The results of multivariate analysis as presented in Tables 6 and 6(a). They show that the main
explanatory variable, regchnge, is significant in all four models based on both the matched
pairs and on both the whole samples and the nonfinancial company samples. In the two
models based on 1999 and 2001 data, the regchnge variable is significant although only
marginally (at 10% and 5% levels of significance respectively). This implies that regulatory
change may be an effective in reducing audit delay. As shown in Table 6(a), the beta co
efficients for the regchange variable are –19.84 and –22.27 respectively. This implies that it
took the nonfinancial companies almost 20 fewer days 2001 than in 1999 to complete their
audits. When we turn to both financial and nonfinancial companies together, we find that in
2001 their audits took 22 fewer days than in 1999.
Turning to Table 6 where 1999 and 2003 audit delays are matched, we find a more
encouraging picture. The regulatory change variable is significant in both the models.
Interestingly, the level of improvement is greater among nonfinancial companies (32.27

26
days) than among all companies together. The reason for this might be the fact that the audit
delays of the financial sector companies used to be shorter than their nonfinancial peers and
hence they did not have to shorten their audit lag by as much as their nonfinancial peers.
Nevertheless, there is clear evidence to support that both financial and nonfinancial
companies have reduced their audit lags as a result of the 120day maximum set by the
regulatory change.
From among the 7 control variables, audit fee (at 10% level of significance), multinational
subsidiary (at 5% level), market category (at 1% level of significance) and financial services
sector (at 10% level of significance) appear to be significant in one or more models. The audit
fee variable is significant in only tone model – the model based on all companies in the 1999 v
2003 sample. The MNC subsidiary variable is significant in all four models. However, the
levels of significance of the multinational variable are not very high. It is significant at 5%
level in only one of the models while in the three other models it is significant at only 10%
level. The market category variable is significant at 1% level in both the models based on
1999 v 2003 sample. The variable could not be tested on the 1999 v 2001 sample as security
categorisation into A, B, and Z, did not start until the year 2002. The high level of
significance of the variable shows that Z category companies are likely to take more than a
month longer to complete their audits than companies in the two other categories. The
financial services sector (FIN) variable also emerged as a significant variable in the 1999 v
2003 sample showing significant improvement in their audit delays. Most of the significant
variables have expected signs. The beta coefficient of mnc subsidiary variable is negative
suggesting that mnc subsidiaries have shorter audit delays than their domestic counterparts.
The beta coefficient of the market category variable suggests a significant additional lag for
firms belonging to the Z category. The audit fee variable emerged significant, albeit at 10%,
in the 1999 and 2003 model based on all observations. However, the sign of the beta co
efficient is contrary to expectations. A positive and significant beta implies that companies
who pay higher audit fees take longer to complete the audit. This is counterintuitive.
The findings of the multivariate analysis could be summarised as follows: (i) the regulatory
change via amending the SER has led to significant reductions in the number of days taken to
complete audits of listed companies in Bangladesh. However, such reductions in audit delays
are more significant in 2003 than in 2001, suggesting that the companies are taking some time
to comply with the SEC imposed maximum of 120 days; (ii) subsidiaries of multinational

27
companies and companies in the financial services sector have significantly shorter audit
delays; (iii) companies in the Z category of DSE take significantly longer to complete their
audits; (iv) audit complexity, profitability (ROE), and auditor size are generally not significant
in determining audit delays; (v) the impact of audit fee on audit delay is also fairly weak; (vi)
despite significant improvements overall, there exists widespread noncompliance with the
statutory maximum of 120 days to complete audits of listed companies; and (vii) less than 9%
(14 out of 165) of the companies have taken longer than six months to complete their audits in
2003.
VI. Summary and Conclusion
The paper reported the results of multiple linear regressions of the association between
financial reporting timeliness and regulatory change while controlling for relevant corporate
attributes. Two levels of analyses were carried out. First, using observations of 1999 and
2001, and then using the observations of 1999 and 2003.
The results showed that audit delays could be reduced by regulatory change. The variables
that were found to be significant in determining timeliness during the two subperiods were
multinational subsidiaries and market category. Company size, audit complexity, return on
equity, and audit fees (except for one model) do not appear to have any bearing on audit
delay. Most of the findings are consistent with findings other studies. One explanatory
variable, audit fees, does not show predicted signs. The findings of this study can be used in
the debate on the efficacy of regulatory pressure on financial reporting.

28
References
Abdulla, J M A (1996). The timeliness of Bahraini annual report, Advances in International Accounting, 9: pp 7388.
Adelberg, A H (1979) Narrative Disclosures Contained in Financial Reports: Means of Communication or Manipulation? Accounting and Business Research, Summer: pp 179190.
Ahmed, K (2003) A comparative study of timeliness of corporate financial reporting in South Asia, Advances in International Accounting, 16, pp 1742.
Ahmed, K and Nicholls, D (1994) The Impact of Nonfinancial Company Characteristics on Mandatory Disclosure Compliance in Developing Countries: The Case of Bangladesh, The International Journal of Accounting Education and Research, 29: pp 6277.
Alford, A, Jones, J, Leftwich, R, and Zmijewski, M (1993) The Relative Informativeness of Accounting Disclosures in Different Countries, Journal of Accounting Research, 31 Supplement, pp 183223.
Ashton, R H, Graul, P R, and Newton, J D (1989) Audit delay and the timeliness of corporate reporting. Contemporary Accounting Research (Spring): pp 65773.
Ashton, R H, Willingham, J J and Elliott, R K (1987) An Empirical Analysis of Audit Delay; Journal of Accounting Research, Chicago; Autumn, 25(2): pp 275292.
Bamber, E M, Bamber, L S and Schoderbek, M P (1993) Audit structure and other determinants of audit report lag: An empirical analysis. Auditing A Journal of Practice & Theory Spring, Vol. 12(1): pp 123.
Beaver, W H (1968) The information content of annual earnings announcements, Journal of Accounting Research, Empirical Research in Accounting: Selected Studies (1968) pp. 6799.
Carslaw, C A P N and Kaplan, S (1991) An Examination of Audit Delay: Further Evidence from New Zealand, Accounting and Business Research, London, Winter, 22: pp 21 32.
Chambers, A E and Penman, S H (1984) Timeliness of Reporting and the Stock Price Reactions to Earnings Announcements, Journal of Accounting Research, Spring: pp 2147.
Courtis, J K (1976) Relationships Between Timeliness in Corporate Reporting and Corporate Attributes, Accounting and Business Research, Winter: pp 4556.
Cushing, B E (1989) Discussion of the association between audit technology and audit delay. Auditing: A Journal of Practice & Theory (Supplement): pp 3847.

29
Davies, M W and Whittred G P (1980) The association between selected corporate attributes and timeliness in corporate reporting: Further analysis. Abacus (June): pp 4860.
DeAngelo L E (1981) Auditor Size and Audit Quality, Journal of Accounting and Economics, 3, pp 183199.
Dwyer, P D and Wilson, E R (1989) An empirical investigation into the factors affecting the timeliness of reporting of municipalities. Journal of Accounting and Public Policy, 8(1), pp 2955.
Dyer, J D and McHugh, A J (1975) The Timeliness of the Australian Annual Report, Journal of Accounting Research, Autumn, pp 204219.
Garsombke, H P (1981) The Timeliness in Corporate Financial Disclosure. In Communication via Annual Reports, ed. J K Courtis. AFM Exploratory Series, No. 11, Armidale: University of New England, 1981.
Gilling, D M (1977) Timeliness in Corporate Reporting: Some Further Comment. Accounting and Business Research, Winter, pp 3436.
Gilling, D M (1983) The Timeliness of New Zealand Corporate Reporting. Working Paper # 5/83, Department of Accountancy, University of Canterbury, New Zealand.
Givoly, D and Palmon, D (1982) Timeliness of annual earnings announcements: Some empirical evidence, The Accounting Review (July): 486508.
Imam, S., Ahmed, Z U and Khan, S H (2001) Association of Audit Delay and Audit Firms’ International Links: Evidence from Bangladesh. Managerial Auditing Journal, 16(3), pp 129133.
Jaggi, B and Tsui, J (1999) Determinants of audit report lag: Further evidence from Hong Kong, Accounting and Business Research, London, Winter, 30 (1), pp 1728.
Johnson, L E (1998) Further evidence on the determinants of local government audit delay. Journal of Public Budgeting, Accounting & Financial Management, Boca Raton; Fall, 1998; 10(3), pp 375397.
Karim, A K M W (2003) Impact of Regulatory Change on Financial Reporting Timeliness in Bangladesh, The Bangladesh Accountant, January – March 2003
Keller, S B (1986) Reporting Timeliness in the presence of subject to audit qualifications. Journal of Business Finance and Accounting, 13(1), Spring, pp 117124.
Kellogg, R L (1984) Accounting activities, securities prices, and class action lawsuits. Journal of Accounting and Economics (December): pp 158204.
Kross, W (1981) Earnings and Announcement Time Lags, Journal of Business Research, September, pp 267281.

30
Kross, W (1982) Profitability, earnings announcements time lags, and stock prices. Journal of Business Finance and Accounting, Autumn, pp313328.
Kross, W and Schroeder, D A (1984) An Empirical Investigation of the Effect of Quarterly Earning Announcement Timing on Stock Returns. Journal of Accounting Research, Spring, pp 153176.
Kinney, William R Jr and McDaniel, Linda S (1989) Characteristics of firms correcting previously reported quarterly earnings. Journal of Accounting and Economics (March) pp 7193.
Kinney, William R Jr and McDaniel, Linda S (1993) Audit delay for firms correcting quarterly earnings; Auditing, Sarasota; Fall, 12(2), pp 135
Knechel, W R and Payne, J L (2001) Additional evidence on audit report lag. Auditing: A Journal of Practice & Theory, 20(1), pp 137146.
Lawrence, J and Bryan, B (1998) Characteristics associated with audit delay in the monitoring of low income housing projects, Journal of Public Budgeting, Accounting & Financial Management, Boca Raton; Summer 1998; 10(2), pp 173191.
Lawrence, J E and Glover H D (1998) The effect of audit firm mergers on audit delay, Journal of Managerial Issues, Pittsburg; Summer 1998; X(2) pp 151164.
Leventis, S and Weetman, P (2004) Timeliness of financial reporting: applicability of disclosure theories in an emerging capital market, Accounting and Business Research, 34(1), pp 4356.
McLelland, A J and Giroux, G (2000) An empirical analysis of auditor report timing by large municipalities, Journal of Accounting and Public Policy, 19(3) pp 263281.
Newton, J D, and Ashton, R H (1989) The association between audit technology and audit delays. Auditing: A Journal of Practice & Theory (Supplement): pp 2237.
Ng, Patrick P H and Tai, Benjamin Y K (1994) An empirical examination of the determinants of audit delay in Hong Kong, The British Accounting Review, London; March, 26(1), pp 4359.
OwusuAnsah, S (2000). Timeliness of corporate financial reporting in emerging capital markets: empirical evidence from the Zimbabwe Stock Exchange, Accounting and Business Research, 30(3), Summer, pp 241254.
Palmrose, Z (1988) An analysis of auditor litigation and audit service quality. The Accounting Review (January): pp 5573.
Payne, J L and Jensen, K L (2002) An examination of municipal audit delay; Journal of Accounting and Public Policy, New York, Spring, 21(1), pp 129.
Schwartz, K B and Soo, B S (1996) The Association Between Auditor Changes and Reporting Lags. Contemporary Accounting Research, 13(1), Spring: pp 353 – 370.

31
Simnett, R (1995) Determinants of audit delay, Advances in Accounting, Greenwich, 13, pp 1 26.
Soltani, B (2002). Timeliness of corporate and audit reports: some empirical evidence in the French context, The International Journal of Accounting, 37, pp 215246.
Whittred, G P (1980a) Audit qualification and the timeliness of corporate annual reports. The Accounting Review (October): pp 56377.
Whittred, G P (1980b) The Timeliness of the Australian Annual Report: 1972 – 1977. Journal of Accounting Research, Autumn. pp 623 – 628.
Whittred, G P and Zimmer, I (1984) Timeliness of Financial Reporting and Financial Distress. The Accounting Review, April, pp 287295.
Williams, D D, and Dirsmith, M W (1988). The effects of audit technology on auditor efficiency: Auditing and the timeliness of client earnings announcements. Accounting, Organizations and Society (September): pp 487508.
Zeghal, D (1984) Timeliness of accounting reports and their informational content on the capital market, Journal of Business Finance & Accounting, 11(3), Autumn, pp 367 380.

32
Graph 1
Trend in audit lag (19902003) Combined Sample
0 50 100 150 200 250
1990 1991 1992 1993 1994 1995 1996 1997 1998 1999 2000 2001 2002 2003
Years
Aud
it lag (days)
Audit lag
Graph 2
Trend in audit lag (19902003) Matched Sample
0 50 100 150 200
1990 1991 1992 1993 1994 1995 1996 1997 1998 1999 2000 2001 2002 2003 Years
Aud
it lag (d
ays)
Audit lag
Table 1 Distribution of Audit Lag for the Whole Sample
Year N Minimum Maximum Mean Median Std. Deviation 1990 90 51 693 180 155 104 1991 97 48 1068 209 161 152 1992 98 41 993 207 164 159 1993 99 46 782 198 158 125 1994 111 36 877 169 149 100 1995 129 27 775 172 149 120 1996 140 41 1065 190 159 139 1997 154 43 1054 206 161 157 1998 159 47 870 212 173 141 1999 201 39 515 172 146 90 2000 144 27 1487 161 124 155 2001 178 41 1121 158 121 118 2002 168 24 757 140 120 83 2003 207 32 505 131 118 60
33
Table 2 Distribution of Audit Lag for Matched Pair Sample (1990 – 2003)
Year N Minimum Maximum Mean Median Std. Deviation 1990 61 51 408 158 148 71 1991 61 48 792 173 154 110 1992 61 41 545 164 152 77 1993 61 48 406 162 153 68 1994 61 51 320 152 139 62 1995 61 27 394 155 148 69 1996 61 41 401 155 146 72 1997 61 43 425 161 150 67 1998 61 58 306 167 152 70 1999 61 58 316 153 133 62 2000 61 57 779 150 120 99 2001 61 58 408 143 120 63 2002 61 46 335 131 120 52 2003 61 32 386 127 117 59
Table 2(a) Distribution of Audit Lag for Matched Pair Sample (1999 – 2003)
Year N Minimum Maximum Mean Median Std. Deviation 1999 144 39 378 154 141 59.76 2000 144 31 727 139 122 69.96 2001 144 41 450 137 120 59.68 2002 144 29 336 129 120 50.08 2003 144 32 386 130 118 50.93
Table 2(b) Major SectorWise Audit Lag Trend (19992003)
SECTOR1 Audit Lag of 1999
Audit Lag of 2000
Audit Lag of 2001
Audit Lag of 2002
Audit Lag of 2003
Banks Mean 150.32 133.24 104.91 106.00 115.48 N 22 17 22 19 29
Insurance Mean 160.35 155.33 142.35 136.75 131.20 N 20 15 17 16 20
Other domestic
Mean 179.84 169.23 170.29 148.01 136.98
N 152 107 134 127 150 MNC subsidiaries
Mean 97.43 99.00 102.20 92.17 87.00
N 7 5 5 6 8 Total Mean 171.80 161.10 157.63 140.19 131.48
N 201 144 178 168 207

34
Table 3 Descriptive Statistics
1999 v 2001 matched pair sample (N = 160)
Preregulatory change year (1999) Preregulatory change year (2001) Mean Std.
Deviation Percentage Mean Std.
Deviation Percentage
Audit lag 170.580 86.27 159.750 122.63 Log of audit fee 4.660 0.345 4.697 0.359 Audit complexity 0.345 0.194 0.367 0.205 Return on equity 0.051 1.061 0.047 0.333 Audit firm size 26% 26% Multinational subsidiary
5% 5%
Financial services sector company
23% 23%
Table 3(a) Descriptive Statistics
1999 v 2003 matched pair sample (N = 165)
Preregulatory change year (1999) Preregulatory change year (2003) Mean Std.
Deviation Percentage Mean Std.
Deviation Percentage
Audit lag 165.460 90.026 135.510 63.139 Log of audit fee 4.654 0.352 4.718 0.386 Audit complexity 0.332 0.199 0.415 0.332 Return on equity 0.049 0.850 0.062 0.193 Market category 27% 33% Audit firm size 30% 36% Multinational subsidiary
4% 4%
Financial services sector company
19% 19%
Table 4 Variable Description and Expected Sign
Variable Label Variable Expected sign Regulatory change
Whether the data belong to preregulatory change or not
Log of audit fee Natural log of audit fee paid by the company Audit complexity Audit complexity: Ratio of inventory plus
receivables to total assets +
Return on equity Return on equity +/ Market category Whether the company belongs to Z category or not + Audit firm size Size and international link of audit firm Multinational subsidiary
Whether the company is a subsidiary of a multinational company
Financial services sector company
Whether the company belongs to the financial services sector or not

35
Table 5 Correlation Matrix 1999 v 2001 matched pair sample (N=160)
Audit lag
Regulatory change
Log of audit fee
Audit complexity
Return on equity
Audit firm size
Multinatio nal subsidiary
Financial services sector company
Audit lag 1.00
Regulatory change
0.05 1.00
Log of audit fee 0.14* 0.05 1.00
Audit complexity 0.76 0.06 0.01 1.00
Return on equity 0.03 0.05 0.03 0.04 1.00
Audit firm size 0.10 0.02 0.35** 0.12 0.03 1.00
Multinational subsidiary
0.10 0.00 0.19** 0.11 0.01 0.15** 1.00
Financial services sector company
0.11* 0.00 0.58** n/a .02 0.08 0.12* 1.00
* Significant at 5% * *Significant at 1%
Table 5a Correlation Matrix 1999 v 2003 matched pair sample (N=165)
Audit lag
Regulatory change
Log of audit fee
Audit complexity
Return on equity
Market category
Audit firm size
Multinatio nal subsidiary
Financial services sector company
Audit lag 1.000
Regulatory change
.190** 1.000
Log of audit fee .070 .086 1.000
Audit complexity .081 .145* .108 1.000
Return on equity .041 .052 .016 .032 1.000
Market category .200** .000 .253**
.121* .072 1.000
Audit firm size .139* .071 .352** .140* .029 .207** 1.000
Multinational subsidiary
.135* .000 .317** .054 .002 .131* .268** 1.000
Financial services sector company
.057 .000 .503** .232** .016 .100 .096 .103 1.000
* Significant at 5% * *Significant at 1%
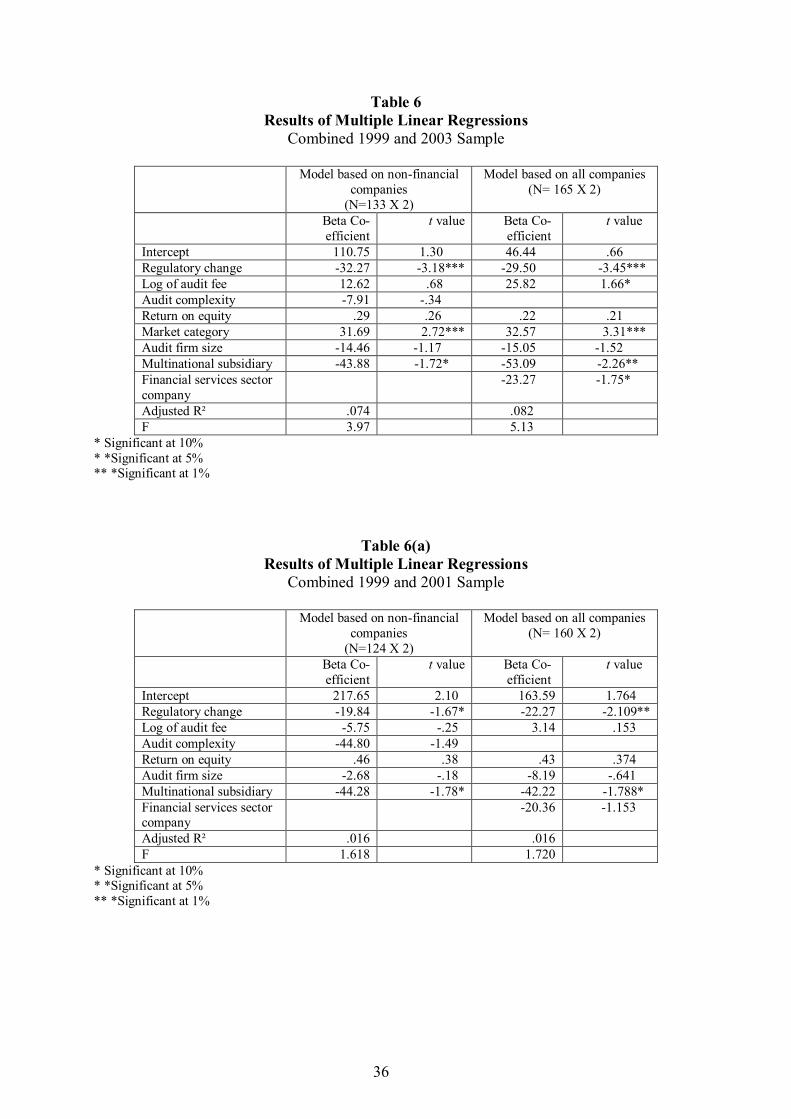
36
Table 6 Results of Multiple Linear Regressions
Combined 1999 and 2003 Sample
Model based on nonfinancial companies (N=133 X 2)
Model based on all companies (N= 165 X 2)
Beta Co efficient
t value Beta Co efficient
t value
Intercept 110.75 1.30 46.44 .66 Regulatory change 32.27 3.18*** 29.50 3.45*** Log of audit fee 12.62 .68 25.82 1.66* Audit complexity 7.91 .34 Return on equity .29 .26 .22 .21 Market category 31.69 2.72*** 32.57 3.31*** Audit firm size 14.46 1.17 15.05 1.52 Multinational subsidiary 43.88 1.72* 53.09 2.26** Financial services sector company
23.27 1.75*
Adjusted R² .074 .082 F 3.97 5.13
* Significant at 10% * *Significant at 5% ** *Significant at 1%
Table 6(a) Results of Multiple Linear Regressions
Combined 1999 and 2001 Sample
Model based on nonfinancial companies (N=124 X 2)
Model based on all companies (N= 160 X 2)
Beta Co efficient
t value Beta Co efficient
t value
Intercept 217.65 2.10 163.59 1.764 Regulatory change 19.84 1.67* 22.27 2.109** Log of audit fee 5.75 .25 3.14 .153 Audit complexity 44.80 1.49 Return on equity .46 .38 .43 .374 Audit firm size 2.68 .18 8.19 .641 Multinational subsidiary 44.28 1.78* 42.22 1.788* Financial services sector company
20.36 1.153
Adjusted R² .016 .016 F 1.618 1.720
* Significant at 10% * *Significant at 5% ** *Significant at 1%