akzonobel q1 2015 results investor update presentation
TRANSCRIPT

255-255-255
185-201-208
068-105-125
085-190-207
000-146-187
000-139-197
000-081-146
134-134-136
000-000-000
183-185-186
000-139-197
000-081-146
134-134-136
183-185-186
185-201-208
255-255-255
Text Bk D1
Color 6
Color 5
Color 4
Color 3
Color 2
Color 1
Text Bk D2
Text Bk L1
Text Bk L2
Hyper
F. Hyper
Text D2
Text L2
Agenda main
Agenda main 2nd
Investor Update Q1 2015 results
Maëlys Castella
April 21, 2015

2 Investor Update Q1 2015 results
Highlights
Operational and financial review
Conclusion
Questions
Agenda
255-255-255
185-201-208
068-105-125
085-190-207
000-146-187
000-139-197
000-081-146
134-134-136
000-000-000
183-185-186
000-139-197
000-081-146
134-134-136
183-185-186
185-201-208
255-255-255
Text Bk D1
Color 6
Color 5
Color 4
Color 3
Color 2
Color 1
Text Bk D2
Text Bk L1
Text Bk L2
Hyper
F. Hyper
Text D2
Text L2
Agenda main
Agenda main 2nd
Q1 2014 Q1 2015
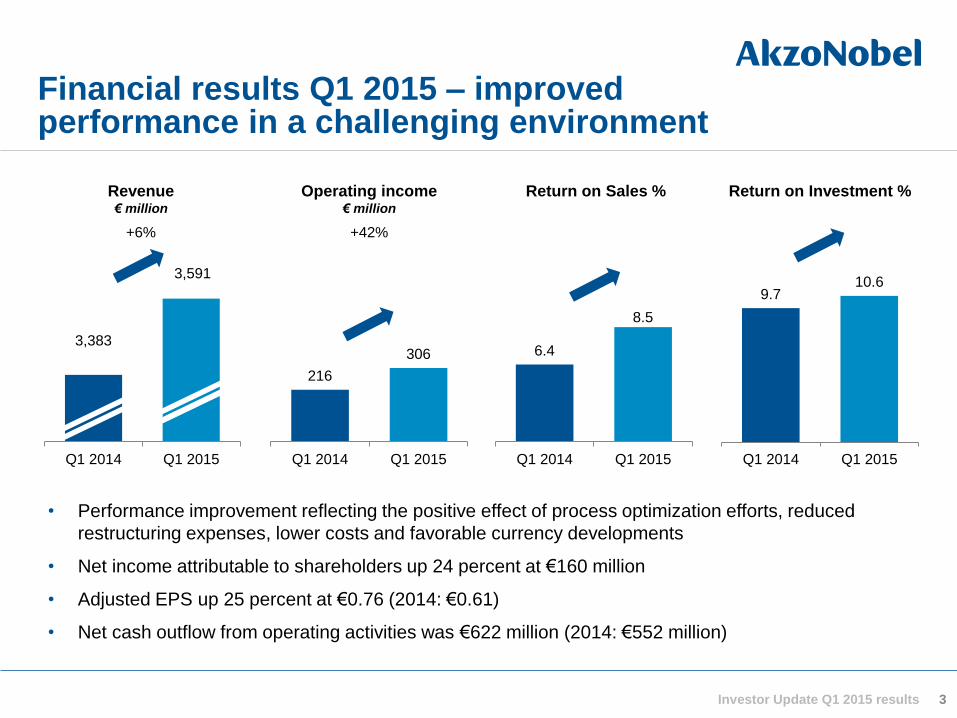
Financial results Q1 2015 – improved performance in a challenging environment
3 Investor Update Q1 2015 results
6.4
8.5
Q1 2014 Q1 2015
9.7 10.6
Q1 2014 Q1 2015
Revenue € million
Return on Investment %
• Performance improvement reflecting the positive effect of process optimization efforts, reduced
restructuring expenses, lower costs and favorable currency developments
• Net income attributable to shareholders up 24 percent at €160 million
• Adjusted EPS up 25 percent at €0.76 (2014: €0.61)
• Net cash outflow from operating activities was €622 million (2014: €552 million)
216
306
Q1 2014 Q1 2015
Operating income € million
3,383
3,591
+6% +42%
Return on Sales %

4 Investor Update Q1 2015 results
Operational and financial review

255-255-255
185-201-208
068-105-125
085-190-207
000-146-187
000-139-197
000-081-146
134-134-136
000-000-000
183-185-186
000-139-197
000-081-146
134-134-136
183-185-186
185-201-208
255-255-255
Text Bk D1
Color 6
Color 5
Color 4
Color 3
Color 2
Color 1
Text Bk D2
Text Bk L1
Text Bk L2
Hyper
F. Hyper
Text D2
Text L2
Agenda main
Agenda main 2nd
-2%
0% 0% 8% 6%
Volume Price/Mix Acquisitions/Divestments
Exchange rates Total
Q1 2015 revenue and operating income – continuing to deliver improved performance
€ million Q1 2014 Q1 2015 Δ%
Revenue 3,383 3,591 6
Operating income 216 306 42
Ratio, % Q1 2014 Q1 2015
Return on sales 6.4 8.5
Return on sales (excluding restructuring costs) 7.7 8.8
Moving average return on investment 9.7 10.6
Increase
Decrease
Revenue development Q1 2015 vs. Q1 2014
5 Investor Update Q1 2015 results

255-255-255
185-201-208
068-105-125
085-190-207
000-146-187
000-139-197
000-081-146
134-134-136
000-000-000
183-185-186
000-139-197
000-081-146
134-134-136
183-185-186
185-201-208
255-255-255
Text Bk D1
Color 6
Color 5
Color 4
Color 3
Color 2
Color 1
Text Bk D2
Text Bk L1
Text Bk L2
Hyper
F. Hyper
Text D2
Text L2
Agenda main
Agenda main 2nd
Challenging economic environment continues to impact all Business Areas
-6
-2
2
6
Decorative Paints Performance Coatings Specialty Chemicals AkzoNobel
Quarterly volume development in % year-on-year
-4
-1
2
5
Decorative Paints Performance Coatings Specialty Chemicals AkzoNobel
Quarterly price/mix development in % year-on-year
-3% -3% -2% 0%
-1% +1%
0% 0%
2014
2015
6 Investor Update Q1 2015 results

255-255-255
185-201-208
068-105-125
085-190-207
000-146-187
000-139-197
000-081-146
134-134-136
000-000-000
183-185-186
000-139-197
000-081-146
134-134-136
183-185-186
185-201-208
255-255-255
Text Bk D1
Color 6
Color 5
Color 4
Color 3
Color 2
Color 1
Text Bk D2
Text Bk L1
Text Bk L2
Hyper
F. Hyper
Text D2
Text L2
Agenda main
Agenda main 2nd
-1% -3% 0%
+7% 3%
Volume Price/Mix Acquisitions/Divestments
Exchange rates Total
-4%
7
= • Revenues up, due to favorable
currency effects. Volume growth
in Latin America more than
offset by soft demand in Europe
and Asia
• Price/mix down largely due to
impact from the sale of the
German stores in Q1 2014
• Operating income up due to
benefits from new operating
model, lower restructuring
charges, strict cost containment
and favorable currency effects
Decorative Paints Q1 2015 highlights
€ million Q1 2014 Q1 2015 Δ%
Revenue 865 890 3
Operating income 17 50 194
Ratio, % Q1 2014 Q1 2015
Return on sales 2.0 5.6
Return on sales (excl. restr. costs) 4.5 6.2
Increase
Decrease
Revenue development Q1 2015 vs. Q1 2014
Investor Update Q1 2015 results

255-255-255
185-201-208
068-105-125
085-190-207
000-146-187
000-139-197
000-081-146
134-134-136
000-000-000
183-185-186
000-139-197
000-081-146
134-134-136
183-185-186
185-201-208
255-255-255
Text Bk D1
Color 6
Color 5
Color 4
Color 3
Color 2
Color 1
Text Bk D2
Text Bk L1
Text Bk L2
Hyper
F. Hyper
Text D2
Text L2
Agenda main
Agenda main 2nd
8
Performance Coatings Q1 2015 highlights
Increase
Decrease
-3%
+1%
0%
+10% +8%
Volume Price/Mix Acquisitions/Divestments
Exchange rates Total
Revenue development Q1 2015 vs. Q1 2014
• Revenue higher in all
businesses; favorable
currencies and price/mix offset
lower volumes
• Volumes up in Automotive and
Specialty Coatings although
down in other businesses.
Regionally, volumes up in North
America and lower in other
regions, with performance
across segments mixed
regionally
• Operating income up due to
simplified business structure,
improvement activities and
reduced restructuring expenses
-1%
€ million Q1 2014 Q1 2015 Δ%
Revenue 1,319 1,430 8
Operating income 126 170 35
Ratio, % Q1 2014 Q1 2015
Return on sales 9.6 11.9
Return on sales (excl. restr. costs) 10.7 12.3
Investor Update Q1 2015 results

Updated to segment reporting for Performance Coatings
Marine & Protective
Coatings
• Protective
• Marine
• Yacht
Automotive &
Aerospace Coatings
• Vehicle Refinishes
• Specialty Finishes
• Aerospace
Industrial Coatings • Wood
• Coil
• Packaging
Powder Coatings • Powder
Business Unit Market sectors
9 Investor Update Q1 2015 results
Powder Coatings
Wood Coatings
Marine &
Protective
Coatings
Automotive &
Aerospace
Coatings
Industrial
Coatings
• Protective
• Marine
• Yacht
• Aerospace
• Specialty Finishes
• Vehicle Refinishes
• Wood
• Coil
• Packaging
• Powder
Marine &
Protective Coatings
Automotive &
Specialty Coatings
Industrial &
Powder Coatings
• Protective Coatings
• Marine Coatings
• Specialty Coatings
- Yacht
- Aerospace
- Specialty
Finishes
• Vehicle Refinishes
• Wood Coatings
• Metal Coatings
- Coil
- Packaging
• Powder Coatings
Old reporting New reporting – aligned with Strategic Market Units

10
• Revenue up, mainly due to
favorable currency effects ;
volumes and price/mix were flat
• Developments in bleaching and
chelates segments positive
while volumes in oil drilling were
lower. US continued to show
good developments; China and
regions such as Russia and
Middle East were challenging
• Operating income up due to
improvement actions, cost
containment, and lower
restructuring costs
• Closing of Paper Chemicals
divestment expected in Q2 2015
Specialty Chemicals Q1 2015 highlights
Increase
Decrease
0% 0%
+6%
Volume Price/Mix Acquisitions/ Divestments Exchange rates Total
0%
Revenue development Q1 2015 vs. Q1 2014
€ million Q1 2014 Q1 2015 Δ%
Revenue 1,222 1,296 6
Operating income 135 163 21
Ratio, % Q1 2014 Q1 2015
Return on sales 11.0 12.6
Return on sales (excl. restr. costs) 11.6 12.6
+6%
Investor Update Q1 2015 results

255-255-255
185-201-208
068-105-125
085-190-207
000-146-187
000-139-197
000-081-146
134-134-136
000-000-000
183-185-186
000-139-197
000-081-146
134-134-136
183-185-186
185-201-208
255-255-255
Text Bk D1
Color 6
Color 5
Color 4
Color 3
Color 2
Color 1
Text Bk D2
Text Bk L1
Text Bk L2
Hyper
F. Hyper
Text D2
Text L2
Agenda main
Agenda main 2nd
Income – adjusted earnings per share up 25% to €0.76
€ million Q1 2014 Q1 2015 Δ%
EBITDA 364 462 +27%
Amortization and depreciation (148) (156)
Operating income before incidentals 216 306 +42%
Incidentals - -
Operating income 216 306 +42%
Net financing expenses (37) (41)
Minorities and associates (10) (20)
Income tax (43) (82)
Discontinued operations 3 (3)
Net income attributable to shareholders 129 160 +24%
Ratio Q1 2014 Q1 2015
Earnings per share from total operations (in €) 0.53 0.65 +23%
Adjusted earnings per share (in €) 0.61 0.76 +25%
11 Investor Update Q1 2015 results

255-255-255
185-201-208
068-105-125
085-190-207
000-146-187
000-139-197
000-081-146
134-134-136
000-000-000
183-185-186
000-139-197
000-081-146
134-134-136
183-185-186
185-201-208
255-255-255
Text Bk D1
Color 6
Color 5
Color 4
Color 3
Color 2
Color 1
Text Bk D2
Text Bk L1
Text Bk L2
Hyper
F. Hyper
Text D2
Text L2
Agenda main
Agenda main 2nd
Cash flows – impacted by currencies, seasonal working capital and pension top-ups
€ million Q1 2014 Q1 2015 Δ%
Profit for the period from continuing operations 142 181
Amortization and depreciation 148 156
Change working capital (471) (576)
Change provisions (294) (410)
Other changes (77) 27
Net cash from operating activities (552) (622) -19%
Capital expenditures (115) (123)
Acquisitions and divestments net of cash acquired - (2)
Changes from borrowings (492) (14)
Dividends (2) (21)
Other changes (3) (6)
Cash flows before discontinued operations (1,134) (788)
Cash flows from discontinued operations (3) (1)
Net change in cash and cash equivalents of total operations (1,137) (789) +31%
12 Investor Update Q1 2015 results

255-255-255
185-201-208
068-105-125
085-190-207
000-146-187
000-139-197
000-081-146
134-134-136
000-000-000
183-185-186
000-139-197
000-081-146
134-134-136
183-185-186
185-201-208
255-255-255
Text Bk D1
Color 6
Color 5
Color 4
Color 3
Color 2
Color 1
Text Bk D2
Text Bk L1
Text Bk L2
Hyper
F. Hyper
Text D2
Text L2
Agenda main
Agenda main 2nd
IAS19 pension deficit remains at €0.8 billion, including ICI PF buy-in during Q1 2015
Investor Update Q1 2015 results
Key pension assumptions metrics Q1 2015 Q4 2014
Discount rate 3.1% 3.4%
Inflation rate 2.8% 2.9%
330
106
530
20
(844)
(822)
(110)
(790)
Deficit end Q42014
Top-ups Discount rateson DBO
Inflationon DBO
Asset returnover P&L
ICIPF Buy-in Other Deficit end Q12015
Decrease
Increase
Pension deficit development during Q1 2015 € million
13

14 Investor Update Q1 2015 results
Conclusion

255-255-255
185-201-208
068-105-125
085-190-207
000-146-187
000-139-197
000-081-146
134-134-136
000-000-000
183-185-186
000-139-197
000-081-146
134-134-136
183-185-186
185-201-208
255-255-255
Text Bk D1
Color 6
Color 5
Color 4
Color 3
Color 2
Color 1
Text Bk D2
Text Bk L1
Text Bk L2
Hyper
F. Hyper
Text D2
Text L2
Agenda main
Agenda main 2nd
Conclusion
15 Investor Update Q1 2015 results
• Improved performance reflects benefits from improvement programs, reduced restructuring expenses,
lower costs and favorable currency effects
• Higher return on sales and return on investment, despite challenging market conditions in many regions
• Exchange rate movements and lower growth rates in high growth economies, will principally determine
dynamics of 2015
• Preparations made in 2013 and 2014 form a sound basis for improved performance
• We are on track to deliver the 2015 targets

16 Investor Update Q1 2015 results
Questions

255-255-255
185-201-208
068-105-125
085-190-207
000-146-187
000-139-197
000-081-146
134-134-136
000-000-000
183-185-186
000-139-197
000-081-146
134-134-136
183-185-186
185-201-208
255-255-255
Text Bk D1
Color 6
Color 5
Color 4
Color 3
Color 2
Color 1
Text Bk D2
Text Bk L1
Text Bk L2
Hyper
F. Hyper
Text D2
Text L2
Agenda main
Agenda main 2nd
Safe Harbor Statement
This presentation contains statements which address such key issues as
AkzoNobel’s growth strategy, future financial results, market positions, product development, products in
the pipeline, and product approvals. Such statements should be carefully considered, and it should be
understood that many factors could cause forecasted and actual results to differ from these statements.
These factors include, but are not limited to, price fluctuations, currency fluctuations, developments in raw
material and personnel costs, pensions, physical and environmental risks, legal issues, and legislative,
fiscal, and other regulatory measures. Stated competitive positions are based on management estimates
supported by information provided by specialized external agencies. For a more comprehensive discussion
of the risk factors affecting our business please see our latest Annual Report, a copy of which can be found
on the company’s corporate website www.akzonobel.com.
17 Investor Update Q1 2015 results

18 Investor Update Q1 2015 results
Appendices

255-255-255
185-201-208
068-105-125
085-190-207
000-146-187
000-139-197
000-081-146
134-134-136
000-000-000
183-185-186
000-139-197
000-081-146
134-134-136
183-185-186
185-201-208
255-255-255
Text Bk D1
Color 6
Color 5
Color 4
Color 3
Color 2
Color 1
Text Bk D2
Text Bk L1
Text Bk L2
Hyper
F. Hyper
Text D2
Text L2
Agenda main
Agenda main 2nd
Q1 2015 Operating income – Cash bridge
19
€ million Q1 2014 Q1 2015
Operating Income 216 306
Incidentals - -
Depreciation & amortization 148 156
EBITDA before incidentals 364 462
Other 10 (6)
Change working capital (471) (576)
Change provisions (294) (410)
Interest paid (116) (48)
Income tax paid (45) (44)
Net cash from operating activities (552) (622)
Investor Update Q1 2015 results

255-255-255
185-201-208
068-105-125
085-190-207
000-146-187
000-139-197
000-081-146
134-134-136
000-000-000
183-185-186
000-139-197
000-081-146
134-134-136
183-185-186
185-201-208
255-255-255
Text Bk D1
Color 6
Color 5
Color 4
Color 3
Color 2
Color 1
Text Bk D2
Text Bk L1
Text Bk L2
Hyper
F. Hyper
Text D2
Text L2
Agenda main
Agenda main 2nd
Restructuring charges by quarter
20
€ million Q1 2014 Q2 2014 Q3 2014 Q4 2014 FY 2014 Q1 2015
Decorative Paints 22 23 1 34 80 5
Performance Coatings 15 17 41 75 148 6
Specialty Chemicals 7 2 6 2 17 0
Other 0 3 7 -2 8 0
Total 44 45 55 109 253 11
Investor Update Q1 2015 results

255-255-255
185-201-208
068-105-125
085-190-207
000-146-187
000-139-197
000-081-146
134-134-136
000-000-000
183-185-186
000-139-197
000-081-146
134-134-136
183-185-186
185-201-208
255-255-255
Text Bk D1
Color 6
Color 5
Color 4
Color 3
Color 2
Color 1
Text Bk D2
Text Bk L1
Text Bk L2
Hyper
F. Hyper
Text D2
Text L2
Agenda main
Agenda main 2nd
Revenue for Performance Coatings – Updated following change in business structure
21
€ million Q1 2014 Q2 2014 Q3 2014 Q4 2014 FY 2014
Marine & Protective Coatings 323 362 360 369 1,414
Automotive & Specialty Coatings 343 365 357 375 1,440
Industrial & Powder Coatings 660 715 714 680 2,769
Other/intragroup eliminations -7 -8 -12 -7 -34
Total 1,319 1,434 1,419 1,417 5,589
Investor Update Q1 2015 results

255-255-255
185-201-208
068-105-125
085-190-207
000-146-187
000-139-197
000-081-146
134-134-136
000-000-000
183-185-186
000-139-197
000-081-146
134-134-136
183-185-186
185-201-208
255-255-255
Text Bk D1
Color 6
Color 5
Color 4
Color 3
Color 2
Color 1
Text Bk D2
Text Bk L1
Text Bk L2
Hyper
F. Hyper
Text D2
Text L2
Agenda main
Agenda main 2nd
Revenue for Specialty Chemicals – Financial reporting aligned with chemical platforms
22
€ million Q1 2014 Q2 2014 Q3 2014 Q4 2014 FY 2014
Functional Chemicals 440 447 446 423 1,756
Industrial Chemicals 322 305 308 295 1,230
Surface Chemistry 250 256 257 247 1,010
Pulp and Performance Chemicals 243 250 258 258 1,009
Other/ intragroup eliminations -33 -30 -30 -29 -122
Total 1,222 1,228 1,239 1,194 4,883
Investor Update Q1 2015 results

255-255-255
185-201-208
068-105-125
085-190-207
000-146-187
000-139-197
000-081-146
134-134-136
000-000-000
183-185-186
000-139-197
000-081-146
134-134-136
183-185-186
185-201-208
255-255-255
Text Bk D1
Color 6
Color 5
Color 4
Color 3
Color 2
Color 1
Text Bk D2
Text Bk L1
Text Bk L2
Hyper
F. Hyper
Text D2
Text L2
Agenda main
Agenda main 2nd
23 Investor Update Q1 2015 results
A new report developed by the
Economist Intelligence Unit and AkzoNobel
is now available which explores how cities
create optimal environments for citizens.
Called Tomorrow’s cities, we worked
together to collect opinions from leading
city experts and executives, who share their
views on a number or important themes
and topics.
To download the report visit:
www.akzonobel.com/humancities
Human Cities in action

255-255-255
185-201-208
068-105-125
085-190-207
000-146-187
000-139-197
000-081-146
134-134-136
000-000-000
183-185-186
000-139-197
000-081-146
134-134-136
183-185-186
185-201-208
255-255-255
Text Bk D1
Color 6
Color 5
Color 4
Color 3
Color 2
Color 1
Text Bk D2
Text Bk L1
Text Bk L2
Hyper
F. Hyper
Text D2
Text L2
Agenda main
Agenda main 2nd
Decorative Paints
Up to 10% annual energy savings
Doing more with less
We supplied a low carbon
construction project in eastern
China with solar-reflecting paint to
coat more than 260,000 square
meters of exterior walls.
24 Investor Update Q1 2015 results
Performance Coatings
Major automotive agreement signed
Driving innovation
We extended our official supplier
partnership with McLaren Racing
and will continue learning from
Formula 1 to drive innovations in
other industries.
Business highlights Q1 2015
Specialty Chemicals
Ningbo investment passes
€400million
Organic growth
We broke ground on a
new alkoxylation facility at
our Ningbo multi-site, strengthening
our position as one of the leading
surfactant producers in China.

Customer Benefits
• Enables users to see in real-
time what a room would look
like in a wide range of colors
– without the use of paint
• Easy to use and
visualizations can be saved
• Compatible with iOS and
Android devices
Preview your room transformed before painting
Key Features
• A world first consumer
application of augmented
reality technology for
visualizing decorated
backgrounds
• Developed in collaboration
with String, Tessella and
Webcredible
• Winner of 2014 UK Innovative
Mobile App of the Year Award
Growth Potential
• Downloaded ~1.3 million times
in 125+ countries since its launch
Q2 2014
• Marketed through the company's
leading decorative paints brands:
Dulux, Coral, Flexa, Sikkens
Innovation Pipeline Q1 2015 Decorative Paints – Visualizer App
Investor Update Q1 2015 results 25

Customer Benefits
• Reduced steam consumption
and glycol byproduct
formation resulting in a more
effective use of energy and
raw materials
• Improved environmental
profile of our products and
manufacturing processes
• Incremental changes with
limited capital requirement
delivering substantial savings
Improved ethylene amines manufacturing processes in Ningbo and Stenungsund
Key Features
• Significant efficiency
improvements of our ethylene
amine production processes
• Incremental technological
changes driven by best
practices such as Lean Six
Sigma for the identification,
evaluation and ranking of
improvement opportunities
Growth Potential
• Delivering structural annual
savings and a substantial Carbon
Footprint reduction
• Improvements were applied to
our two plants in Stenungsund
and Ningbo
Innovation Pipeline Q1 2015 Ethylene and Sulfur Derivatives – Process Improvement
Investor Update Q1 2015 results 26

Overall market conditions remain challenging in many countries
27 Investor Update Q1 2015 results
Brazil
Russia
France
China
Japan India
Germany
Sweden
UK
US
40
50
60
Ma
nu
fac
turi
ng
PM
I
*Bubble size=manufacturing value-added output, 2015e (US$bn: 2010 prices)
Source: Oxford Economics
Purchase Managers’ Index (PMI)*
March 2015

28 Investor Update Q1 2015 results
Reference

255-255-255
185-201-208
068-105-125
085-190-207
000-146-187
000-139-197
000-081-146
134-134-136
000-000-000
183-185-186
000-139-197
000-081-146
134-134-136
183-185-186
185-201-208
255-255-255
Text Bk D1
Color 6
Color 5
Color 4
Color 3
Color 2
Color 1
Text Bk D2
Text Bk L1
Text Bk L2
Hyper
F. Hyper
Text D2
Text L2
Agenda main
Agenda main 2nd
AkzoNobel today
29
• Revenue €14.3 billion
• 47,210 employees
• 44% of revenue from high growth markets
• Major producer of Paints, Coatings and
Specialty Chemicals
• Leadership positions in many markets
25%
28%
34%
13% PerformanceCoatings
DecorativePaints
SpecialtyChemicals
Other
42%
19%
39% 39%
27%
34%
Revenue by
Business Area
Operating income
by Business Area
Invested capital by
Business Area
6.9%
Return on sales
(operating income/revenue)
10.0%
Return on investment
(Operating income/average
12 months invested capital)
Investor Update Q1 2015 results

255-255-255
185-201-208
068-105-125
085-190-207
000-146-187
000-139-197
000-081-146
134-134-136
000-000-000
183-185-186
000-139-197
000-081-146
134-134-136
183-185-186
185-201-208
255-255-255
Text Bk D1
Color 6
Color 5
Color 4
Color 3
Color 2
Color 1
Text Bk D2
Text Bk L1
Text Bk L2
Hyper
F. Hyper
Text D2
Text L2
Agenda main
Agenda main 2nd
30
High growth markets are 44% of revenue and their importance will increase
% of 2014 revenue
37%
Mature Europe
26%
Asia Pacific
4%
Other regions
10%
Latin America
15%
North America 8%
Emerging Europe
Share of revenues from high growth markets will increase over time
Investor Update Q1 2015 results
255-255-255
185-201-208
068-105-125
085-190-207
000-146-187
000-139-197
000-081-146
134-134-136
000-000-000
183-185-186
000-139-197
000-081-146
134-134-136
183-185-186
185-201-208
255-255-255
Text Bk D1
Color 6
Color 5
Color 4
Color 3
Color 2
Color 1
Text Bk D2
Text Bk L1
Text Bk L2
Hyper
F. Hyper
Text D2
Text L2
Agenda main
Agenda main 2nd
Our proposition: Leading market
positions delivering leading performance
31
AkzoNobel has gone through a significant amount of
strategic change over the past five years
Today, the company has
• Excellent portfolio of businesses
• Good long term growth potential on the basis of end-user segment growth
• Strong positions in high growth markets (44% of revenue)
• Leadership positions in many markets
• Clear leader in sustainability
• Track record of delivering sustainable innovations and products
• Strong brands, both in consumer and industrial markets
Clear focus to deliver on our significant potential
• Improved returns and cash flow
• Leveraging scale
• Simplification and standardization
• Continued innovation
Investor Update Q1 2015 results

32 Investor Update Q1 2015 results
~42% of revenues
New Build Projects
Maintenance, Renovation & Repair
Building Products & Components
~16% of revenues
Automotive OEM, Parts and Assembly
Automotive Repair
Marine and Air Transport
~17% of revenues
Consumer Durables
Consumer Packaged Goods
~25% of revenues
Natural Resource and Energy Industries
Process Industries

255-255-255
185-201-208
068-105-125
085-190-207
000-146-187
000-139-197
000-081-146
134-134-136
000-000-000
183-185-186
000-139-197
000-081-146
134-134-136
183-185-186
185-201-208
255-255-255
Text Bk D1
Color 6
Color 5
Color 4
Color 3
Color 2
Color 1
Text Bk D2
Text Bk L1
Text Bk L2
Hyper
F. Hyper
Text D2
Text L2
Agenda main
Agenda main 2nd
< 8.9 9.6
10.0 14.0
0
4
8
12
16
2012 2013 2014 2015
Return on sales
(Operating income/revenue)
%
33
Return on investment
(Operating income/average
12 months invested capital)
%
Net debt/EBITDA
x
2015 financial targets focused on quality of earnings and value creation
On track to achieve 2015 targets
* 2012 excluding impairment (€2.1 billion) and after IAS19
5.9 6.6
6.9 9.0
0
4
8
12
2012 2013 2014 2015
1.4 1.0 1.0
2.0
0
1
2
3
2012 2013 2014 2015
* *
Investor Update Q1 2015 results

255-255-255
185-201-208
068-105-125
085-190-207
000-146-187
000-139-197
000-081-146
134-134-136
000-000-000
183-185-186
000-139-197
000-081-146
134-134-136
183-185-186
185-201-208
255-255-255
Text Bk D1
Color 6
Color 5
Color 4
Color 3
Color 2
Color 1
Text Bk D2
Text Bk L1
Text Bk L2
Hyper
F. Hyper
Text D2
Text L2
Agenda main
Agenda main 2nd
2,2
9,5 9,0 7,5
12,0 12,0
0
4
8
12
16
Decorative Paints Performance Coatings Specialty Chemicals
3,0
21,7
13,6 12,0
25,0
15,0
0
8
16
24
32
Decorative Paints Performance Coatings Specialty Chemicals
Realistic expected 2015 outcomes
Return on
sales
Return on
investment
2012
2015
%
%
Expected Outcomes
34 Investor Update Q1 2015 results
255-255-255
185-201-208
068-105-125
085-190-207
000-146-187
000-139-197
000-081-146
134-134-136
000-000-000
183-185-186
000-139-197
000-081-146
134-134-136
183-185-186
185-201-208
255-255-255
Text Bk D1
Color 6
Color 5
Color 4
Color 3
Color 2
Color 1
Text Bk D2
Text Bk L1
Text Bk L2
Hyper
F. Hyper
Text D2
Text L2
Agenda main
Agenda main 2nd
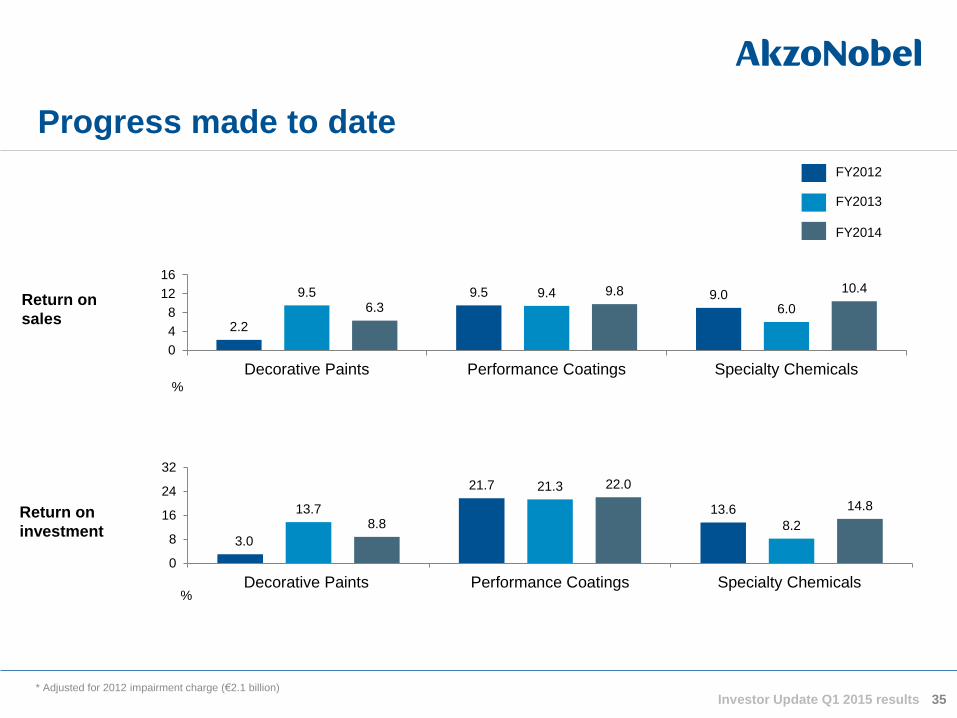
Progress made to date
35
2.2
9.5 9.0 9.5 9.4
6.0 6.3
9.8 10.4
0
4
8
12
16
Decorative Paints Performance Coatings Specialty Chemicals%
FY2012
FY2013
Return on
sales
3.0
21.7
13.6 13.7
21.3
8.2 8.8
22.0
14.8
0
8
16
24
32
Decorative Paints Performance Coatings Specialty Chemicals
Return on
investment
%
* Adjusted for 2012 impairment charge (€2.1 billion)
FY2014
Investor Update Q1 2015 results

255-255-255
185-201-208
068-105-125
085-190-207
000-146-187
000-139-197
000-081-146
134-134-136
000-000-000
183-185-186
000-139-197
000-081-146
134-134-136
183-185-186
185-201-208
255-255-255
Text Bk D1
Color 6
Color 5
Color 4
Color 3
Color 2
Color 1
Text Bk D2
Text Bk L1
Text Bk L2
Hyper
F. Hyper
Text D2
Text L2
Agenda main
Agenda main 2nd
36
AkzoNobel strategy introduced in 2013
• Organic growth
• Operational excellence
Investor Update Q1 2015 results

255-255-255
185-201-208
068-105-125
085-190-207
000-146-187
000-139-197
000-081-146
134-134-136
000-000-000
183-185-186
000-139-197
000-081-146
134-134-136
183-185-186
185-201-208
255-255-255
Text Bk D1
Color 6
Color 5
Color 4
Color 3
Color 2
Color 1
Text Bk D2
Text Bk L1
Text Bk L2
Hyper
F. Hyper
Text D2
Text L2
Agenda main
Agenda main 2nd
By end-user segment
2014, 100% = ~ €100 billion
The global paints and coatings market is around €100 billion
By market sector
2014, 100% = ~ €100 billion
Decorative
Paints
(43%)
Powder
Auto OEM Performance
Coatings
(57%)
Protective
Wood Fin
Vehicle
refinish
Coil
Marine
Packaging
Aerospace
Yacht
Buildings and
Infrastructure
Transportation
Consumer
Goods
Industrial
37
Source: Orr & Boss; management analysis Investor Update Q1 2015 results
Others
Spec. finishes

255-255-255
185-201-208
068-105-125
085-190-207
000-146-187
000-139-197
000-081-146
134-134-136
000-000-000
183-185-186
000-139-197
000-081-146
134-134-136
183-185-186
185-201-208
255-255-255
Text Bk D1
Color 6
Color 5
Color 4
Color 3
Color 2
Color 1
Text Bk D2
Text Bk L1
Text Bk L2
Hyper
F. Hyper
Text D2
Text L2
Agenda main
Agenda main 2nd
AkzoNobel has many leading market positions
No.1 Position Other key players
Decorative
Multiple regions
outside North
America
PPG, regional players
North America* Sherwin-Williams PPG, regional players
Protective Sherwin-Williams, Jotun
Powder Axalta, Jotun, regional players
Auto refinish Axalta PPG, AkzoNobel
Wood Sherwin-Williams, Valspar
Marine Jotun, Chugoku
Coil PPG, Beckers
* AkzoNobel not present with North America divestment to PPG 38 Investor Update Q1 2015 results
255-255-255
185-201-208
068-105-125
085-190-207
000-146-187
000-139-197
000-081-146
134-134-136
000-000-000
183-185-186
000-139-197
000-081-146
134-134-136
183-185-186
185-201-208
255-255-255
Text Bk D1
Color 6
Color 5
Color 4
Color 3
Color 2
Color 1
Text Bk D2
Text Bk L1
Text Bk L2
Hyper
F. Hyper
Text D2
Text L2
Agenda main
Agenda main 2nd
0%
100%
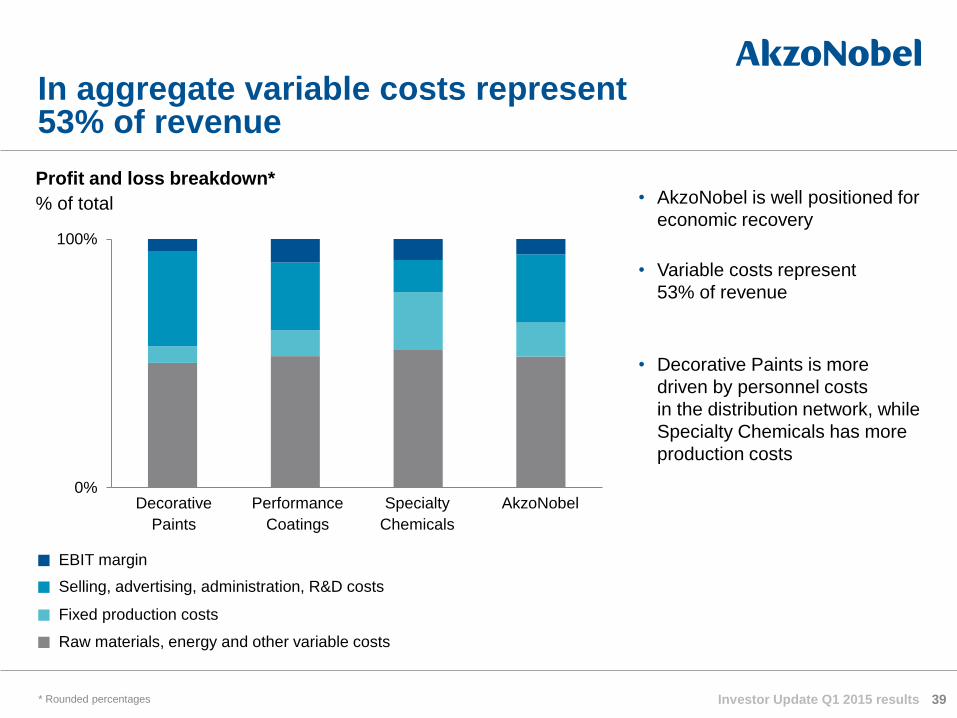
Profit and loss breakdown*
% of total
In aggregate variable costs represent 53% of revenue
Decorative
Paints
Performance
Coatings
Specialty
Chemicals
AkzoNobel
Raw materials, energy and other variable costs
Fixed production costs
Selling, advertising, administration, R&D costs
EBIT margin
* Rounded percentages 39
• AkzoNobel is well positioned for
economic recovery
• Variable costs represent
53% of revenue
• Decorative Paints is more
driven by personnel costs
in the distribution network, while
Specialty Chemicals has more
production costs
Investor Update Q1 2015 results

40
We are actively addressing all components of operating expenses
* All costs in € billion for 2013
Operating expenses
General &
Administrative Selling Expenses
Research,
Development &
Innovation
Global Business
Services Commercial Excellence Initiatives
Drives organic growth
Operating expense
components
Addressed by
Investor Update Q1 2015 results

255-255-255
185-201-208
068-105-125
085-190-207
000-146-187
000-139-197
000-081-146
134-134-136
000-000-000
183-185-186
000-139-197
000-081-146
134-134-136
183-185-186
185-201-208
255-255-255
Text Bk D1
Color 6
Color 5
Color 4
Color 3
Color 2
Color 1
Text Bk D2
Text Bk L1
Text Bk L2
Hyper
F. Hyper
Text D2
Text L2
Agenda main
Agenda main 2nd
• We are moving into continuous improvement which will enable us to achieve the 2015 targets
– 2014 restructuring charges amounted to €253 million
– From 2015 onwards, more normalized levels of restructuring costs, around 1% of revenues
Ongoing initiatives in 2015 and beyond:
Drive towards continuous improvement and commercial excellence
41
Commercial Excellence
• Delivering quality products and innovations to our customers at a lower cost
to serve
− Improve customer satisfaction
− Drive organic growth
− Improve margin management
− Sales and marketing productivity
Global Business Services
• Streamlining corporate functions (Finance, HR, IM et cetera) by introducing
a new Global Business Services function responsible for implementing
standardized core functional processes throughout the organization
• Centers of Excellence, Shared Service Centers, Business Partnering
Investor Update Q1 2015 results

255-255-255
185-201-208
068-105-125
085-190-207
000-146-187
000-139-197
000-081-146
134-134-136
000-000-000
183-185-186
000-139-197
000-081-146
134-134-136
183-185-186
185-201-208
255-255-255
Text Bk D1
Color 6
Color 5
Color 4
Color 3
Color 2
Color 1
Text Bk D2
Text Bk L1
Text Bk L2
Hyper
F. Hyper
Text D2
Text L2
Agenda main
Agenda main 2nd
42
Sustainability is business; business is sustainability
(Resource Efficiency Index)
A new indicator measuring how efficiently we generate value
(expressed as gross profit divided by cradle-to-grave carbon footprint)
of revenue by 2020 from products that are more sustainable for
our customers than the products of our competitors
more efficient resource and energy use across the entire value chain
by 2020 (measured by carbon footprint reduction)
AkzoNobel ranked #1 again in the Dow Jones Sustainability Index for the Materials Industry group
Investor Update Q1 2015 results

255-255-255
185-201-208
068-105-125
085-190-207
000-146-187
000-139-197
000-081-146
134-134-136
000-000-000
183-185-186
000-139-197
000-081-146
134-134-136
183-185-186
185-201-208
255-255-255
Text Bk D1
Color 6
Color 5
Color 4
Color 3
Color 2
Color 1
Text Bk D2
Text Bk L1
Text Bk L2
Hyper
F. Hyper
Text D2
Text L2
Agenda main
Agenda main 2nd
Human Cities
• By 2050, more than 75 percent of the world’s
population will live in cities. 60 percent of our
products are in the Buildings & Infrastructure
and Transportation
• In 2014, we launched our Human Cities
initiative, which is designed to engage with the
challenges and opportunities of the 21st
century city via color, heritage, transport,
education, sport & leisure, and sustainability
• We made a commitment to the Clinton Global
Initiative by establishing a partnership with The
Rockefeller Foundation through its 100
Resilient Cities program
Investor Update Q1 2015 results 43

255-255-255
185-201-208
068-105-125
085-190-207
000-146-187
000-139-197
000-081-146
134-134-136
000-000-000
183-185-186
000-139-197
000-081-146
134-134-136
183-185-186
185-201-208
255-255-255
Text Bk D1
Color 6
Color 5
Color 4
Color 3
Color 2
Color 1
Text Bk D2
Text Bk L1
Text Bk L2
Hyper
F. Hyper
Text D2
Text L2
Agenda main
Agenda main 2nd
44
AkzoNobel values drive cultural change
Investor Update Q1 2015 results

Leading performance; gaining momentum
• ROS below peers
• Not earning our cost
of capital
• Inadequate free cash
flow
• Operating expenses
too high
• Not leveraging scale
Historical
issues
DP
7.5%
12%
PC
12%
25%
SC
12%
15%
Vision
& Strategy
2015 Targets
& Incentives
Culture
& Values
• Organic growth
• Operational
excellence
• ROS 9%
• ROI 14%
• Operating income -
not adjusted EBITDA
• CO₂ & Eco-premium
products
• Cash flow
• Incentives aligned
• Customer Focused
• Deliver on
Commitments
• Passion for
Excellence
• Winning Together
Business Area
Strategies
Business Area
Expected Outcomes
ROS
ROI
45 Investor Update Q1 2015 results

46%
28%
14%
8% 4%
Mature Europe
Asia Pacific
Latin America
Emerging Europe
Other regions
Decorative Paints business at a glance
46
Revenue by geographic spread
• We are the global leader in size in the attractive global
Decorative Paints market
• We are pursuing a vision of becoming the leading
global Decorative Paints company in size and performance
• Strategic priorities:
– Fix Europe
– Grow profitably in high-growth markets
€ million 2014
Revenue 3,909
EBITDA 405
Operating income 248
Return on sales 6.3%
Return on investment 8.8%
Employees 15,200
Revenue by end-user
sub-segment
Decorative Paints key figures Key messages
75%
25% Maintenance,renovation and repair
New build projects
Investor Update Q1 2015 results

47
• Our well-known brands are one of our
key competitive advantages
• We have a number of powerful, relevant
brands occupying a number of positions
across different markets (consumer,
professional, and other such as
woodcare)
• Where possible, we have leveraged our
scale and created a single global identity
• We have rationalized our brand portfolio –
concentrating our investment behind
fewer, bigger, better brands
We have very strong brands linked by a global approach to branding
Co
ns
um
er
Pro
fes
sio
na
l
Oth
er
Investor Update Q1 2015 results

48
Fix Europe
Objectives:
• Improve performance by driving organic growth and operational excellence
and changing the operating model in Europe
Actions:
• Implement a central operating model and simplify our organizational structure
• Consolidate our manufacturing and distribution footprint
• Develop and implement standardized and efficient marketing and sales
platforms
• Redesign back office processes to support back office consolidation and
restructuring
• Maintain a strong focus on customers and markets through the transition
period
Investor Update Q1 2015 results

49
Changing our operating model in Europe
Action
2012
2013
2014
2015
Integrate relevant European activities and management
Rationalize product portfolio and raw materials
Rationalize manufacturing footprint
Fully implement sales excellence
Outsource certain finance businesses
Implement central operating model
Leverage repeatable models globally
Investor Update Q1 2015 results

50
Grow profitably in high-growth markets
Objectives:
• Outgrow the market
• Ensure that we leverage our (global) scale to ensure
that we improve relative profitability while we grow
Actions:
• Develop profitable mid-market business model(s)
• Build and implement a robust distribution strategy framework
• Leverage global marketing and innovation scale to win locally
• Leverage our strong brands
• Create and implement a digital marketing strategy
Investor Update Q1 2015 results

27%
20% 31%
8%
11% 3% Mature Europe
North America
Asia Pacific
Latin America
Emerging Europe
Other regions
21%
37%
28%
14% Buildings andInfrastructure
Transportation
ConsumerGoods
Industrial
Performance Coatings business at a glance
Key messages
• We have leading market positions
• Strategic priorities include:
– Performance improvement initiatives
– Differentiated growth strategies
Performance Coatings key figures
Revenue by end-user segment
Revenue by geographic spread
€ million 2014
Revenue 5,589
EBITDA 687
Operating income 545
Return on sales 9.8%
Return on investment 22.0%
Employees 20,500
51 Investor Update Q1 2015 results

25%
26%
49%
Marine & ProtectiveCoatings
Automotive & SpecialtyCoatings
Industrial & PowderCoatings
2014 revenue by Business Unit
We are organized in four Business Units
Marine & Protective
Coatings
• Protective
• Marine
• Yacht
Automotive &
Aerospace Coatings
• Vehicle Refinishes
• Specialty Finishes
• Aerospace
Industrial Coatings • Wood
• Coil
• Packaging
Powder Coatings • Powder
Business Unit Market sectors
52
• Vehicle Refinishes
• Specialty Finishes
• Aerospace
• Yacht
Automotive &
Specialty Coatings
• Protective
• Marine
Marine &
Protective Coatings
• Wood
• Coil
• Packaging
• Powder
Industrial & Powder
Coatings
Investor Update Q1 2015 results
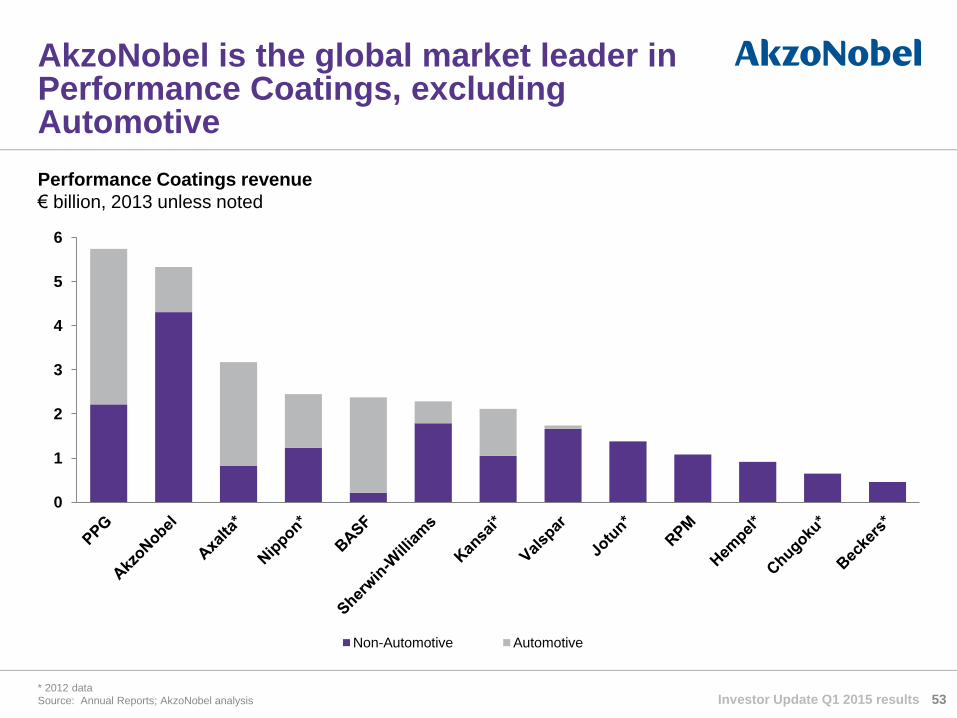
AkzoNobel is the global market leader in Performance Coatings, excluding Automotive
Performance Coatings revenue
€ billion, 2013 unless noted
* 2012 data
Source: Annual Reports; AkzoNobel analysis 53
0
1
2
3
4
5
6
Non-Automotive Automotive
Investor Update Q1 2015 results

0
1
2
3
4
5
6
7
Protective VehicleRefinishes
Powder Wood Marine SpecialtyFinishes
Coil Packaging Aerospace Yacht
AkzoNobel has many leading market sector positions in Performance Coatings
Performance Coatings market sectors
€ billion, 2013
AkzoNobel market share
position (by value) 2013 x
3
1
1
1/2
1
1 1
2
1/2 1
54 Source: Orr & Boss 2012 for base data on market sectors; AkzoNobel analysis Investor Update Q1 2015 results

55
Outgrow the market organically
• Marine
• Protective
• Powder
• Specialty Finishes
Improve performance by
driving operational excellence
• Industrial (Wood, Coil, Packaging)
• Vehicle Refinishes
• Yacht
• Aerospace
Expected outcomes
• Improved market share
• Costs don’t grow as fast as revenue
• Improved return on sales
in percentage terms
Expected outcomes
• Growth with the market
• Reduced absolute operating expenditure
• Improved return on sales based on
cost reduction
Pursue differentiated growth strategies
Investor Update Q1 2015 results

Business at a glance
56
Key messages
• Serving attractive markets, growing over the cycle
• Leading positions in five main platforms
• 57% of revenues generated outside of mature Europe
• Significant expansion investments now operational
• Driving functional excellence
Specialty Chemicals key figures
Revenue by end user segment
Revenue by geographic spread
18%
6%
19%57%
Buildings and
infrastructure
Transportation
Consumer
goods
Industrial
43%
22%
18%
10%
5%2%
Mature Europe
North America
Asia Pacific
Latin America
Emerging Europe
Other regions
€ million 2014
Revenue 4,883
EBITDA 815
Operating income 508
Return on sales 10.4%
Return on investment 14.8%
Employees 9,800
Investor Update Q1 2015 results
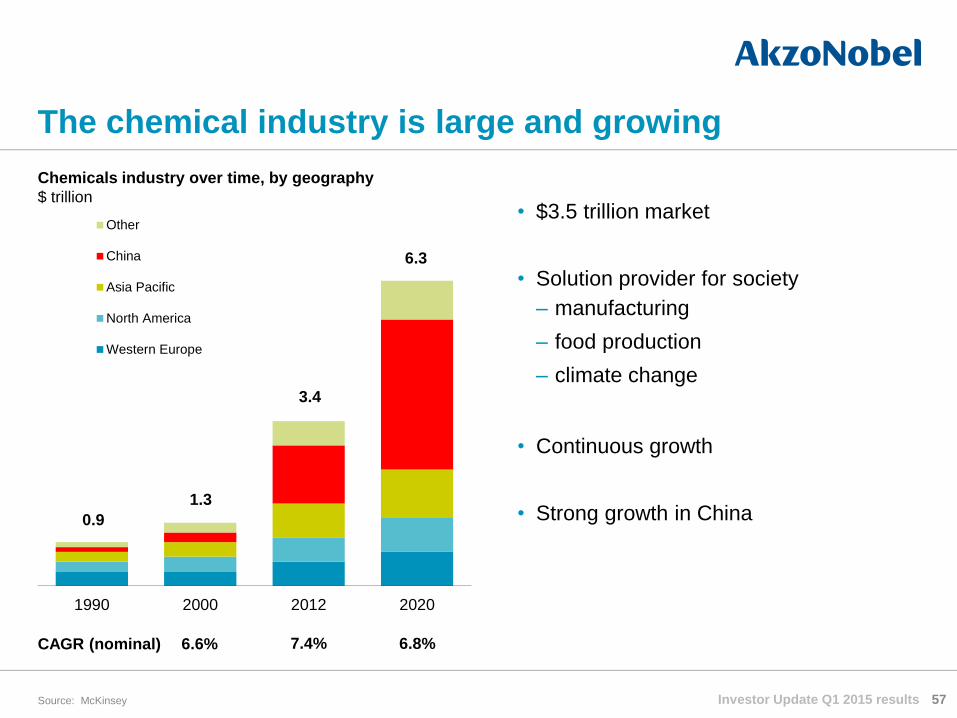
57
• $3.5 trillion market
• Solution provider for society
– manufacturing
– food production
– climate change
• Continuous growth
• Strong growth in China
1990 2000 2012 2020
Other
China
Asia Pacific
North America
Western Europe
0.9
1.3
3.4
6.3
Chemicals industry over time, by geography
$ trillion
The chemical industry is large and growing
Source: McKinsey
6.6%
%
6.8%
%
7.4%
% CAGR (nominal)
Investor Update Q1 2015 results

Salt-chlorine chain
100% of Industrial Chemicals
Ethylene Oxide Network
40% of Functional Chemicals
Surfactants
85% of Surface Chemistry
Bleaching Chemicals
60% of Pulp & Performance chemicals
58
Our Business Units Our Platforms
Five well positioned platforms in their industries
Industrial Chemicals
Pulp & Performance chemicals
Surface Chemistry
Polymer Catalysts
40% of Functional Chemicals
Functional Chemicals
Investor Update Q1 2015 results

• Sodium chlorate
• Hydrogen peroxide
• Ethylene oxide
• Ethylene amines
• Cellulosics
• Organic peroxides
• Metal alkyls
• Ethyoxylates
• Natural oil and fat based nitrogen surfactants
• Energy/Salt
• Chlorine
Platforms operate world scale plants based on advanced technologies
• Monochloroacetic acid
• Chloromethanes
Our main chemical platforms Key products
Salt-chlorine chain
Bleaching chemicals
Ethylene oxide network
Polymer catalysts
Surfactants
• Chelates
• Micronutrients
59 Investor Update Q1 2015 results

Major projects and timing of spend
• Capital expenditure peaked at 8.7%
of revenue in 2012
• Infrastructure is now in place and ready to take
on additional demand
0
100
200
300
400
500
2010 2011 2012 2013 2014
Capital Expenditure Depreciation and Amortization
BA Specialty Chemicals capital expenditure
€ million
We have invested in the recent past and are well-prepared for future growth
Investment project 2010 2011 2012 2013 2014 2015
Ningbo multisite
Frankfurt membrane
Brazil Eldorado
Brazil Suzano
Boxing
60 Investor Update Q1 2015 results

61
Four operational improvement initiatives
Improve
productivity of
supply chain and
operations
• Asset optimization
• Production system
roll out
• Lean six sigma
• Industrial IT platform
• Yield, waste
and quality focus
Strengthen
commercial
excellence
• Customer value
creation
• Organic growth
• Margin management
• Sales force
productivity
Reduce
organizational
costs
• Restructuring
• Organization
delayering
• Restricted
recruitment
Enhance product
and process
innovation
• New applications
and products
• Variable cost
reduction
• Process
intensification
• Standard processes
Investor Update Q1 2015 results

Improve performance by driving
operational excellence
~50% of portfolio
Main platforms
• Salt-chlorine chain
• Polymer catalysts
• Ethylene oxide network
62
Outgrow the market organically
~ 50% of portfolio
Main platforms
• Bleaching chemicals
• Surfactants
Actions
• Reduce costs and further
improve productivity in
operations
• Improve raw material
(cost) position
Differentiated strategies per platform
Actions
• Capitalize on investments
• Grow by successfully
commercializing products
for attractive applications
Investor Update Q1 2015 results

63
Salt-Chlorine chain: Right at the heart of the customer base
* Pipelines transporting crude oil (RAPL), nafta (PALL), industrial gasses, ethylene and
propylene
Refinery Steam cracker
Pipelines*
Refinery & olefin producer Olefin consumer
Investor Update Q1 2015 results

Ethylene oxide network: Capitalizing on China investments
Site plan
Hydrogen
Cyanide Organic
Peroxides
Ethylene
Amines Cellulosics
Surfactants
Chelates Bio-treatment
facility
Ethylene
Oxide
64 Investor Update Q1 2015 results

Surfactants: Growing with attractive end markets
Oilfield
Mining
Lubricants
Agriculture
65 Investor Update Q1 2015 results

Our platforms build on value chains
Raw materials
Base chemicals
Chemical inter-mediates
Performance/ functional chemicals
‘End’ products
66
Bleaching chemicals
Salt-chlorine chain
Ethylene oxide network
Polymer catalysts
Surfactants
Investor Update Q1 2015 results

255-255-255
185-201-208
068-105-125
085-190-207
000-146-187
000-139-197
000-081-146
134-134-136
000-000-000
183-185-186
000-139-197
000-081-146
134-134-136
183-185-186
185-201-208
255-255-255
Text Bk D1
Color 6
Color 5
Color 4
Color 3
Color 2
Color 1
Text Bk D2
Text Bk L1
Text Bk L2
Hyper
F. Hyper
Text D2
Text L2
Agenda main
Agenda main 2nd
Disciplined cash management
67
1.834 1.572 1.384
1.418
12.9%
10.7% 9.9% 10.1%
0%
2%
4%
6%
8%
10%
12%
14%
16%
0
500
1.000
1.500
2.000
2.500
2011 2012 2013 2014
Operating Working Capital
€ million
€ 666
€ 826
4.6%
5.4%
€ 708
4.5%
3.7%
€ 534
2013 2012 2011 2010 2014
€ 588
4.1%
Capital Expenditures
€ million
Other
Decorative Paints
Performance Coatings
Specialty Chemicals
Investor Update Q1 2015 results
Operating Working Capital
OWC as % of LQ revenue * 4

255-255-255
185-201-208
068-105-125
085-190-207
000-146-187
000-139-197
000-081-146
134-134-136
000-000-000
183-185-186
000-139-197
000-081-146
134-134-136
183-185-186
185-201-208
255-255-255
Text Bk D1
Color 6
Color 5
Color 4
Color 3
Color 2
Color 1
Text Bk D2
Text Bk L1
Text Bk L2
Hyper
F. Hyper
Text D2
Text L2
Agenda main
Agenda main 2nd
Cash flow sources and uses
68
• Restructuring and pension
top-ups consume a significant
proportion of cash
• Performance improvement
focus starts to address
cash challenge
• Remuneration metrics
include cash generation
• Positive cash in 2013 driven by
divestments of Decorative
Paints North-America and
Building Adhesives
• 2014 cash flow impacted by
incidentals and other
exceptional items
Operational cash inflow close to covering uses of cash
2012 2013
Source Use Source Use
Dividends
Divestments** EBITDA
Other* Working Cap
CapEx
Provisions
Pensions
* Including interest and tax ** Including acquisitions, divestments and discontinued operations
2014
Investor Update Q1 2015 results
Source Use

255-255-255
185-201-208
068-105-125
085-190-207
000-146-187
000-139-197
000-081-146
134-134-136
000-000-000
183-185-186
000-139-197
000-081-146
134-134-136
183-185-186
185-201-208
255-255-255
Text Bk D1
Color 6
Color 5
Color 4
Color 3
Color 2
Color 1
Text Bk D2
Text Bk L1
Text Bk L2
Hyper
F. Hyper
Text D2
Text L2
Agenda main
Agenda main 2nd
825 622
800 750
500 320
2014 2015 2016 2017 2018 2019 2020 2021 2022 2023 2024
€ bonds £ bonds $ bonds
69 Investor Update Q1 2015 results
Debt maturities
€ million
Continuously reducing costs of long term bonds
Average cost of long term bonds
%
7.29 6.35 5.62 4.89 3.63
0
2
4
6
8
2010 2011 2012 2013 2014
• Debt duration 4.8 years
• Net interest expense down
by €74 million compared
to 2013
Repaid
7.75%
7.25%
8.00%
4.00% 2.625%
1.75%
255-255-255
185-201-208
068-105-125
085-190-207
000-146-187
000-139-197
000-081-146
134-134-136
000-000-000
183-185-186
000-139-197
000-081-146
134-134-136
183-185-186
185-201-208
255-255-255
Text Bk D1
Color 6
Color 5
Color 4
Color 3
Color 2
Color 1
Text Bk D2
Text Bk L1
Text Bk L2
Hyper
F. Hyper
Text D2
Text L2
Agenda main
Agenda main 2nd
0,0
0,5
1,0
1,5
2010 2011 2012 2013 2014
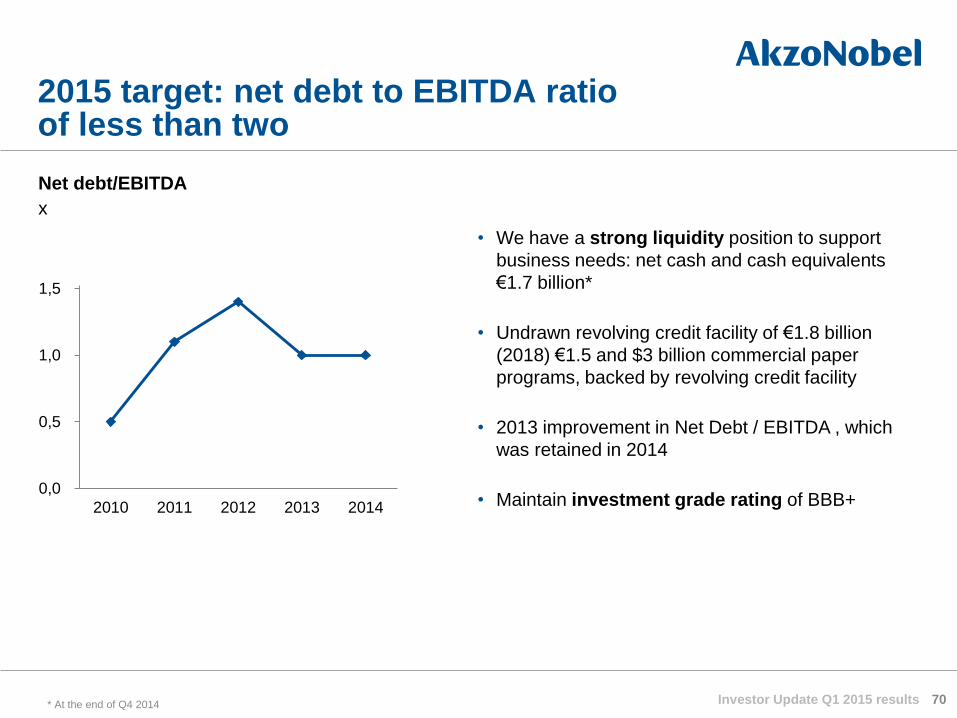
2015 target: net debt to EBITDA ratio of less than two
70
Net debt/EBITDA
x
• We have a strong liquidity position to support
business needs: net cash and cash equivalents
€1.7 billion*
• Undrawn revolving credit facility of €1.8 billion
(2018) €1.5 and $3 billion commercial paper
programs, backed by revolving credit facility
• 2013 improvement in Net Debt / EBITDA , which
was retained in 2014
• Maintain investment grade rating of BBB+
* At the end of Q4 2014 Investor Update Q1 2015 results

255-255-255
185-201-208
068-105-125
085-190-207
000-146-187
000-139-197
000-081-146
134-134-136
000-000-000
183-185-186
000-139-197
000-081-146
134-134-136
183-185-186
185-201-208
255-255-255
Text Bk D1
Color 6
Color 5
Color 4
Color 3
Color 2
Color 1
Text Bk D2
Text Bk L1
Text Bk L2
Hyper
F. Hyper
Text D2
Text L2
Agenda main
Agenda main 2nd
Dividend policy unchanged – stable to rising dividend
71
• Our dividend policy is to pay a stable to rising
dividend each year
• An interim and final dividend will be paid in
cash unless shareholders elect to receive a
stock dividend
0.33 0.33
2013 2012
1.12 1.12
2011
0.33
1.12
2010
0.32
1.08
2009
0.30
1.05
Final dividend Interim dividend
Dividends paid (€)
2014
0.33
1.12
Investor Update Q1 2015 results

255-255-255
185-201-208
068-105-125
085-190-207
000-146-187
000-139-197
000-081-146
134-134-136
000-000-000
183-185-186
000-139-197
000-081-146
134-134-136
183-185-186
185-201-208
255-255-255
Text Bk D1
Color 6
Color 5
Color 4
Color 3
Color 2
Color 1
Text Bk D2
Text Bk L1
Text Bk L2
Hyper
F. Hyper
Text D2
Text L2
Agenda main
Agenda main 2nd
Proactively managing or removing pension liabilities
72
Interest rate /
Inflation hedging
• Active management of interest rate and inflation
exposure, with around 70% of overall defined benefit
obligation (DBO) risks hedged
Longevity hedging • Courtaulds (CPS) longevity swap with Swiss Re in 2012
(€1.75billion)
Buy-in
• UK ICIPF’s annuity buy-in’s with Legal & General
and Prudential in 2014 and 2015, covers GBP 4.4
billion (around €6 billion) pension liabilities
Divestments
• Sale of Decorative Paints Canada in 2013
(DBO reduced by €301 million)
• Sale of National Starch in 2011 resulted in substantial
DBO reduction
Cash out /
Sleeper management
• US plan deferred members offered a cash out in 2013
(red. €85 million)
• UK CPS cash out in 2013 (DBO reduced by €39 million)
Buy-out • USA buy-out with MetLife in 2013 (DBO reduced by
€493 million)
Retain and
Manage Risk
Remove Risk
Investor Update Q1 2015 results
255-255-255
185-201-208
068-105-125
085-190-207
000-146-187
000-139-197
000-081-146
134-134-136
000-000-000
183-185-186
000-139-197
000-081-146
134-134-136
183-185-186
185-201-208
255-255-255
Text Bk D1
Color 6
Color 5
Color 4
Color 3
Color 2
Color 1
Text Bk D2
Text Bk L1
Text Bk L2
Hyper
F. Hyper
Text D2
Text L2
Agenda main
Agenda main 2nd
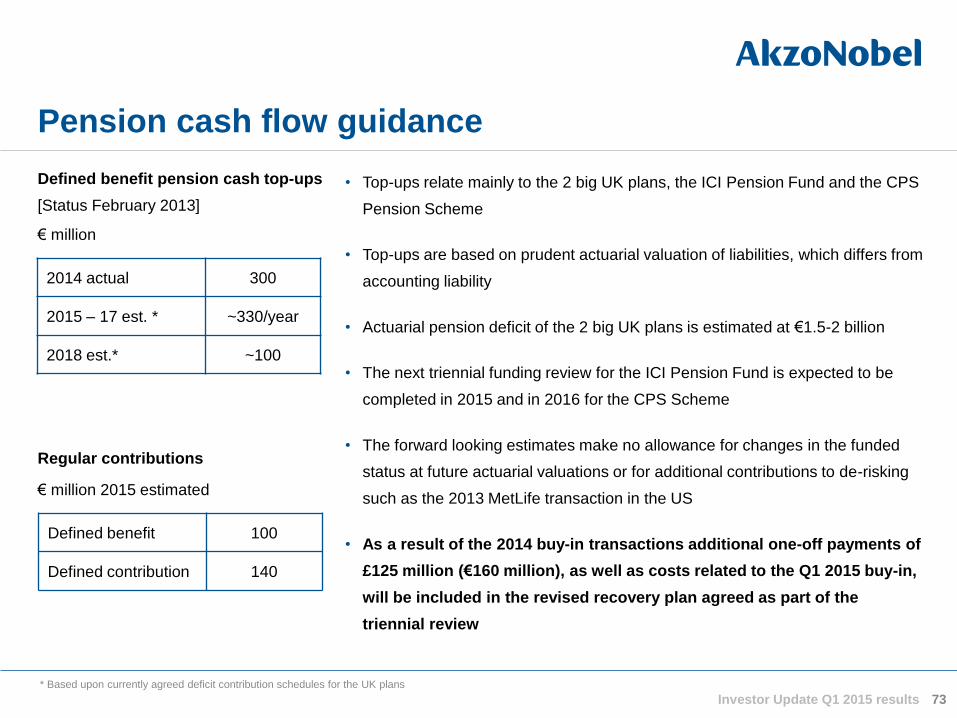
Pension cash flow guidance
73
• Top-ups relate mainly to the 2 big UK plans, the ICI Pension Fund and the CPS
Pension Scheme
• Top-ups are based on prudent actuarial valuation of liabilities, which differs from
accounting liability
• Actuarial pension deficit of the 2 big UK plans is estimated at €1.5-2 billion
• The next triennial funding review for the ICI Pension Fund is expected to be
completed in 2015 and in 2016 for the CPS Scheme
• The forward looking estimates make no allowance for changes in the funded
status at future actuarial valuations or for additional contributions to de-risking
such as the 2013 MetLife transaction in the US
• As a result of the 2014 buy-in transactions additional one-off payments of
£125 million (€160 million), as well as costs related to the Q1 2015 buy-in,
will be included in the revised recovery plan agreed as part of the
triennial review
Defined benefit pension cash top-ups
[Status February 2013]
€ million
2014 actual 300
2015 – 17 est. * ~330/year
2018 est.* ~100
* Based upon currently agreed deficit contribution schedules for the UK plans
Make sure line weight is
consistent
Regular contributions
€ million 2015 estimated
Defined benefit 100
Defined contribution 140
Investor Update Q1 2015 results

255-255-255
185-201-208
068-105-125
085-190-207
000-146-187
000-139-197
000-081-146
134-134-136
000-000-000
183-185-186
000-139-197
000-081-146
134-134-136
183-185-186
185-201-208
255-255-255
Text Bk D1
Color 6
Color 5
Color 4
Color 3
Color 2
Color 1
Text Bk D2
Text Bk L1
Text Bk L2
Hyper
F. Hyper
Text D2
Text L2
Agenda main
Agenda main 2nd
Both short & long term incentives are aligned with our priorities
74
• Covers more than 600 executives
• Priorities are aligned with strategy and 2015 targets
Executive short term incentive 2015
STI
Element
Metric
20% Return on investment
20% Operating income
30% Operating cash flow
30% Personal targets
LTI
Element
Metric
35% Return on investment
35% Total Shareholder Return
30% Sustainability / RobecoSAM -
DJSI
Executive long term incentive 2015
Investor Update Q1 2015 results

255-255-255
185-201-208
068-105-125
085-190-207
000-146-187
000-139-197
000-081-146
134-134-136
000-000-000
183-185-186
000-139-197
000-081-146
134-134-136
183-185-186
185-201-208
255-255-255
Text Bk D1
Color 6
Color 5
Color 4
Color 3
Color 2
Color 1
Text Bk D2
Text Bk L1
Text Bk L2
Hyper
F. Hyper
Text D2
Text L2
Agenda main
Agenda main 2nd
Variable costs analysis
2014
* Other variable costs include variable selling costs (e.g. freight) and products for resale ** Other raw materials include cardolite, hylar etc.
*** Chemicals and intermediates include caustic soda, acetic acid, tallow, ethylene, ethylene oxide, sulfur, amines etc. 75 Investor Update Q1 2015 results
26%
4%
5%
6%
16% 3%
10%
17%
7%
6%
Energy & other variable costs*
Raw materials
Other raw materials**
Titanium
dioxide
Coatings’
specialties
Resins
Pigments
Additives
Solvents
Chemicals and
intermediates***
Packaging

The net impact of a sustained lower oil price can have a positive impact in 2015
76
Inventories
GDP
Investor Update Q1 2015 results
Fre
igh
t an
d lo
gis
tics
F
reig
ht a
nd
log
istic
s
Sales Raw materials Production

255-255-255
185-201-208
068-105-125
085-190-207
000-146-187
000-139-197
000-081-146
134-134-136
000-000-000
183-185-186
000-139-197
000-081-146
134-134-136
183-185-186
185-201-208
255-255-255
Text Bk D1
Color 6
Color 5
Color 4
Color 3
Color 2
Color 1
Text Bk D2
Text Bk L1
Text Bk L2
Hyper
F. Hyper
Text D2
Text L2
Agenda main
Agenda main 2nd
Investor Update Q1 2015 results
Monomers,
Precursors, etc.
Downstream oil related products have clearly different dynamics
77
Feedstocks Base (petro)chemicals
Intermediates and more complex molecules
Methanol
Ethylene
Ethanol
Propylene
Benzene
Xylenes
Etc.
Intermediates More complex
molecules
Monomers & Latex
Resins
Packaging
Additives
Solvents
Crude Oil
(Shale) Gas
Coal
Bio based
Renewables