alamo ozone advance program: regional … ozone advance program: regional sustainability initiatives...
TRANSCRIPT
Alamo Ozone Advance Program: Regional Sustainability Initiatives
Voluntary Measures for the AACOG Ozone Advance Path Forward
As approved by the
Air Improvement Resources Executive Committee
on July 24, 2013
2015 Update approved on July 23, 2015
Prepared by
2
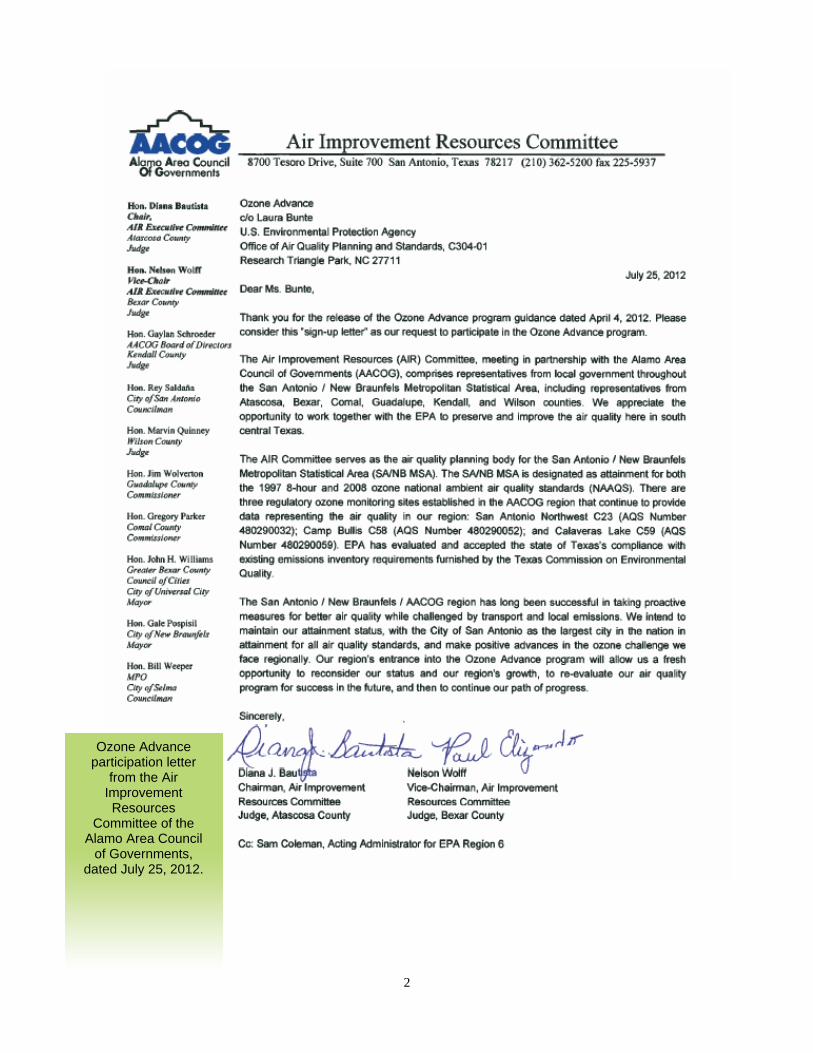
Ozone Advance participation letter
from the Air Improvement
Resources Committee of the Alamo Area
Council of Governments, dated
July 25, 2012
Ozone Advance participation letter
from the Air Improvement Resources
Committee of the Alamo Area Council
of Governments, dated July 25, 2012.
3
Chapter 1: Introduction ………………………………………………………………… 5 Chapter 2: Background………………………………………………………………… 7
2.1 Ozone Monitoring……………………………………………………………… 8 2.2 Air Quality Trends and Design Values……………………………………….. 9 2.3 Seasonal Variations in Ozone Concentrations……………………………… 10 2.4 Meteorology and Ozone Concentrations…………………………………….. 11 2.5 Emission Sources and Trends………………………………………………… 11 2.6 Photochemical Models…………………………………………………………. 13 2.7 Predicted Ozone Concentration Comparisons: 2006, 2012, and 2018…… 14 2.8 Next Steps……………………………………………………………………….. 16
Chapter 3: Ongoing Strategies…………………………………………………………. 18
3.1 Voluntary Emission Reduction Strategies……………………………………. 18 3.1.1 CPS Energy………………………………………………………………. 18 3.1.2 City of San Antonio………………………………………………………. 19 3.1.3 Local Cement Industry…………………………………………………… 21 3.1.4 Local Oil & Gas Industry: Eagle Ford Shale…………………………… 22 3.1.5 VIA Metropolitan Transit…………………………………………………. 24 3.1.6 Alamo Area Metropolitan Planning Organization……………………… 25 3.1.7 San Antonio Water System……………………………………………… 25 3.1.8 Texas Department of Transportation – San Antonio…………………… 25 3.1.9 Build San Antonio Green……………………………………………… 26
3.2 Air Quality Outreach and Education Programs………………………………. 27 Chapter 4: New/Proposed Strategies…………………………………………………. 35
4.1 City of San Antonio……………………………………………………………… 35 4.2 San Antonio Metropolitan Health District Air Quality Program Proposal….. 35 4.3 Local Oil & Gas Industry: Eagle Ford Shale…………………………………. 36
Chapter 5: Public/Stakeholder Involvement………………………………………….. 37
Appendix A: Major Stationary Sources in the SA-NB MSA, 2012…………………. 38 Appendix B: Potential Control Strategies List………………………………………… 41
Table of Contents
4
Table 2-1: 2010, 2013 and 2014 population estimates for the SA-NB MSA, U.S. Census data……………………………………………………………………………… 8 Table 2-2: Ozone-measuring monitors in the San Antonio region with locations, types of data collected, and reporting details………………………………………… 9 Table 2-3: San Antonio design values between 2010 and 2015…………………… 10 Table 2-4: Tons of anthropogenic NOX and VOC emissions per ozone season weekday, San Antonio - New Braunfels MSA, 2012, 2018, 2023…………………. 12 Figure 2-1: Map of the 13-county AACOG region and 8-county San Antonio-New Braunfels Metropolitan Statistical Area………………………………………………. 7 Figure 2-2: Locations of regulatory and non-regulatory ozone monitors in the San Antonio area………………………………………………………………………… 8 Figure 2-3: Annual fourth highest 8-hour average ozone concentrations in ppb recorded at regulatory monitors in the San Antonio area, 2008 – 2015…………… 10 Figure 2-4: Map of the most heavily-traveled roadways in the AACOG region…… 13 Figure 2-5: Change in San Antonio-New Braunfels MSA Eight-Hour Design Values, 2018……………………………………………………………………………… 14 Figure 2-6: Predicted daily maximum 8-hour ozone concentrations in the 4-km subdomain for selected episode days, 2006, 2012 Eagle Ford, and 2018 Eagle Ford moderate scenario………………………………………………………………… 15 Figure 3-1: Annual VMT reductions recorded by NuRide participants…………….. 30 Figure 3-2: Annual VOC and NOx reductions (lbs.) from decreases in VMT, as recorded by NuRide participants………………………………………………………. 30
5
As a “near-nonattainment” area for ozone, the San Antonio region has a long history of air quality planning and voluntary control implementation aimed at keeping the region’s air quality within the thresholds established by the National Ambient Air Quality Standards (NAAQS). As early as 1995, the first air committee was formed by the Alamo Area Council of Governments to address air quality issues. This committee requested the first emissions inventory for the region, for inventory year 1994. In January 1996, the San Antonio Mayor's Blue Ribbon Committee on Air Quality merged with the Air Quality Committee of the Alamo Area Council of Governments (AACOG) to form the Air Quality Task Force (AQTF). The charge of the AQTF was to develop public education and provide advice to elected officials on air quality issues. The major accomplishment of the early AQTF was the establishment of the Ozone Action Day program. During FY 1996 - 1997, the AQTF provided input on the first Near Non-Attainment grant, authorized by the 1997 Texas Legislature. However, when the U.S. Environmental Protection Agency (EPA) proposed the new eight-hour ozone NAAQS in the summer of 1996, the focus of the AQTF began to shift, first by providing comments and guidance on the impact of the new eight-hour ozone NAAQS. Monitor results indicated that on high ozone level days, background levels coming into Bexar County were at or near ozone NAAQS threshold levels. Later that year when EPA finalized the eight-hour NAAQS it became apparent that, based on historical data, the San Antonio Metropolitan Statistical Area (SA/MSA) could well be designated non-attainment when the EPA made the first eight-hour non-attainment designations initially scheduled for July 2000. During July 1998, the City of San Antonio (COSA), San Antonio-Bexar County Metropolitan Planning Organization (MPO), Bexar County, and AACOG staff recommended to elected officials that the AQTF be revised to fit the structure advised by the Texas Commission on Environmental Quality (TCEQ), then known as the Texas Natural Resource Conservation Commission (TNRCC). During January - February 1999, AACOG’s Boards of Directors and other responsible parties representing COSA, Bexar County, and the MPO approved the formation of the Air Improvement Resources (AIR) Committee consortium including the Executive/Advisory, Technical, and Public Education Committees and member appointments. The AIR Committee conducted their first official meeting during April 1999 with the goal to establish an organized, comprehensive, and aggressive plan of action to keep the SA/MSA from slipping into nonattainment of the ozone standard. In 2002, EPA announced the Early Action Compact (EAC) protocol for helping regions achieve and maintain the 8-hour ozone NAAQS by facilitating early, voluntary ozone reduction plans in a manner consistent with applicable local, state, and federal air
Chapter 1: Introduction
6
quality policies. The protocol outlined specific deliverables and reporting requirements for participation. Later that year, the elected officials serving on the AIR Executive Committee, with the approval of the local municipalities and counties they represented, signed an EAC in partnership with the Chairman of the TNRCC (now the TCEQ) and the Regional Administrator for the EPA. Although EPA designated the San Antonio region as being nonattainment deferred due to a recorded design value of 89 parts per billion (ppb) during the 2001-2003 averaging period, the EAC agreement allowed the region time to implement voluntary strategies that helped to reduce ozone precursor emissions. By the end of the effective term of the EAC on December 31, 2007, regulatory monitors were again showing compliance with the ozone standard. Under the terms of the EAC, the region was re-designated as being in attainment, that is, as being in full compliance with the federal ozone standard. With the promulgation of a revised 8-hour average ozone standard in 2008, however, the San Antonio region again faced the possibility of a nonattainment designation. In April 2012, EPA designated 46 areas as nonattainment of the 75 ppb threshold established by the 2008 standard. Although the San Antonio region’s ozone values met the standard at the time, within a few months, the three-year average on which attainment is based had climbed above the health-based standard. The on-going challenge the region faces in meeting the 2008 standard as well as past successes with the EAC program provided local leaders the incentive to participate in EPA’s Ozone Advance program. Although the program does not shield an area from a nonattainment designation, it does facilitate efforts aimed at reducing ozone pollution and maintaining healthy air quality. Therefore, the program has the potential for helping a region avoid a nonattainment designation and the requirements associated with such a designation. In July 2012, the AIR Executive Committee submitted to EPA a letter of participation in the Ozone Advance program. In 2013 and 2014, the Committee submitted a Path Forward plan for the region that described activities implemented by multiple regional government agencies, industries, and organizations to reduce NOx and VOC emissions. This document is the 2015 update to the Alamo Ozone Advance plan and describes successes, program enhancements, and new and proposed strategies for improving air quality and community health in the San Antonio region. Differences between the 2014 and 2015 Path Forward include updates to sections addressing background information and new/proposed control strategies in the 2015 version. Any subsections in the chapter listing ongoing strategies for which AACOG was provided updated information have been identified as updated from the 2014 Path Forward.
7
San Antonio, located in south-central Texas, is the second largest city in the state and the seventh largest in the nation.1
The U.S. Census Bureau estimates that, among the nation’s municipalities, San Antonio experienced the third largest numeric increase in population from April 1, 2010, to July 1, 2011. Nearby Austin was ranked fourth for numeric increase.
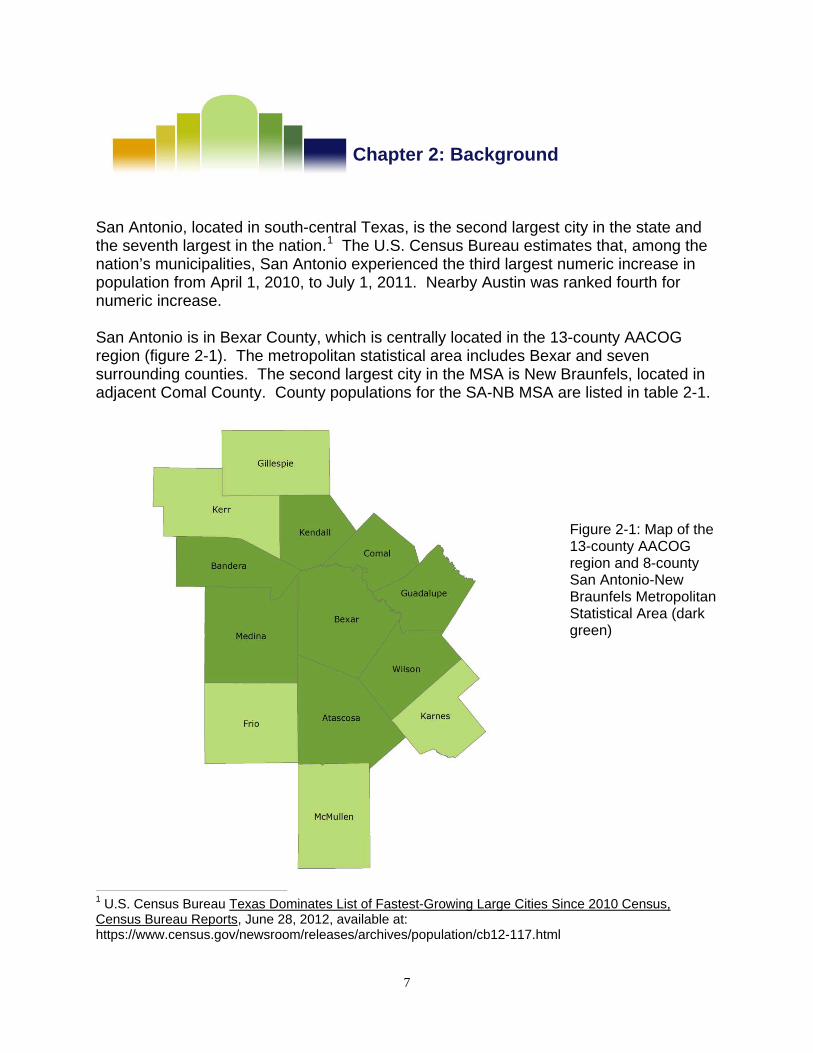
San Antonio is in Bexar County, which is centrally located in the 13-county AACOG region (figure 2-1). The metropolitan statistical area includes Bexar and seven surrounding counties. The second largest city in the MSA is New Braunfels, located in adjacent Comal County. County populations for the SA-NB MSA are listed in table 2-1.
Figure 2-1: Map of the 13-county AACOG region and 8-county San Antonio-New Braunfels Metropolitan Statistical Area (dark green)
1 U.S. Census Bureau Texas Dominates List of Fastest-Growing Large Cities Since 2010 Census, Census Bureau Reports, June 28, 2012, available at: https://www.census.gov/newsroom/releases/archives/population/cb12-117.html
Chapter 2: Background
8
Table 2-1: 2010, 2013, and 2014 population estimates for the SA-NB MSA, U.S. Census data2 MSA County 2010 Population 2013 Population 2014 Population
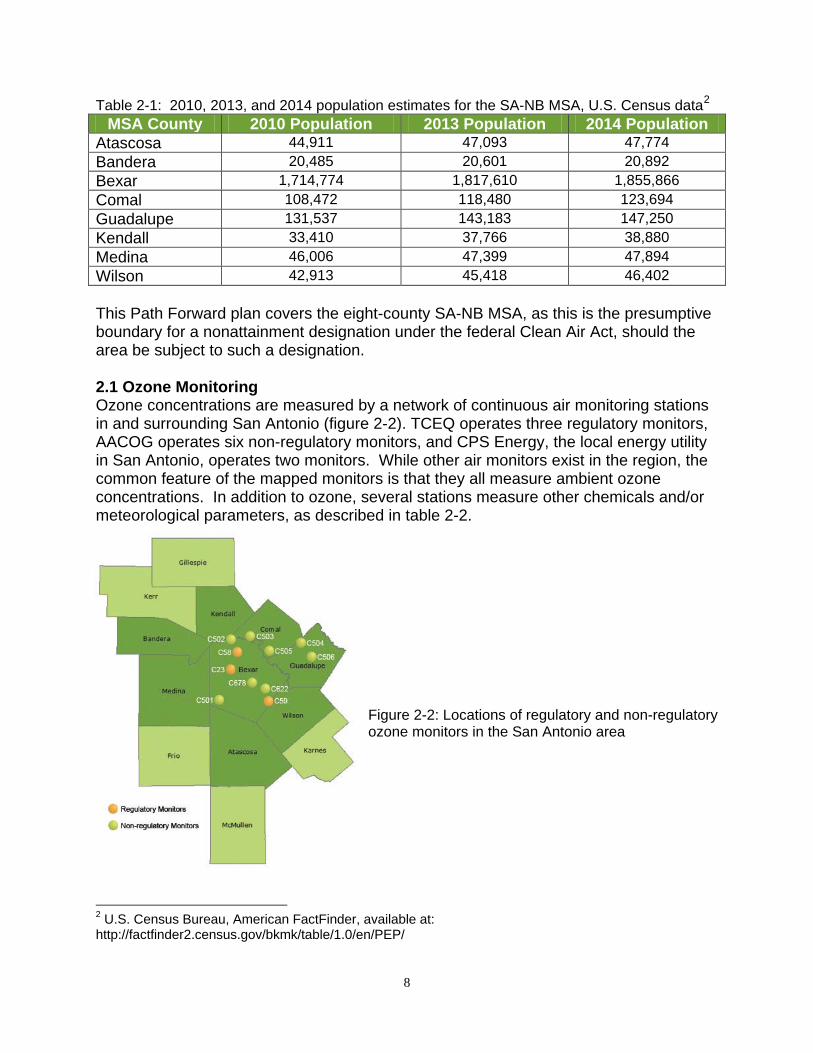
Atascosa 44,911 47,093 47,774 Bandera 20,485 20,601 20,892 Bexar 1,714,774 1,817,610 1,855,866 Comal 108,472 118,480 123,694 Guadalupe 131,537 143,183 147,250 Kendall 33,410 37,766 38,880 Medina 46,006 47,399 47,894 Wilson 42,913 45,418 46,402 This Path Forward plan covers the eight-county SA-NB MSA, as this is the presumptive boundary for a nonattainment designation under the federal Clean Air Act, should the area be subject to such a designation. 2.1 Ozone Monitoring Ozone concentrations are measured by a network of continuous air monitoring stations in and surrounding San Antonio (figure 2-2). TCEQ operates three regulatory monitors, AACOG operates six non-regulatory monitors, and CPS Energy, the local energy utility in San Antonio, operates two monitors. While other air monitors exist in the region, the common feature of the mapped monitors is that they all measure ambient ozone concentrations. In addition to ozone, several stations measure other chemicals and/or meteorological parameters, as described in table 2-2.
Figure 2-2: Locations of regulatory and non-regulatory ozone monitors in the San Antonio area
2 U.S. Census Bureau, American FactFinder, available at: http://factfinder2.census.gov/bkmk/table/1.0/en/PEP/
9
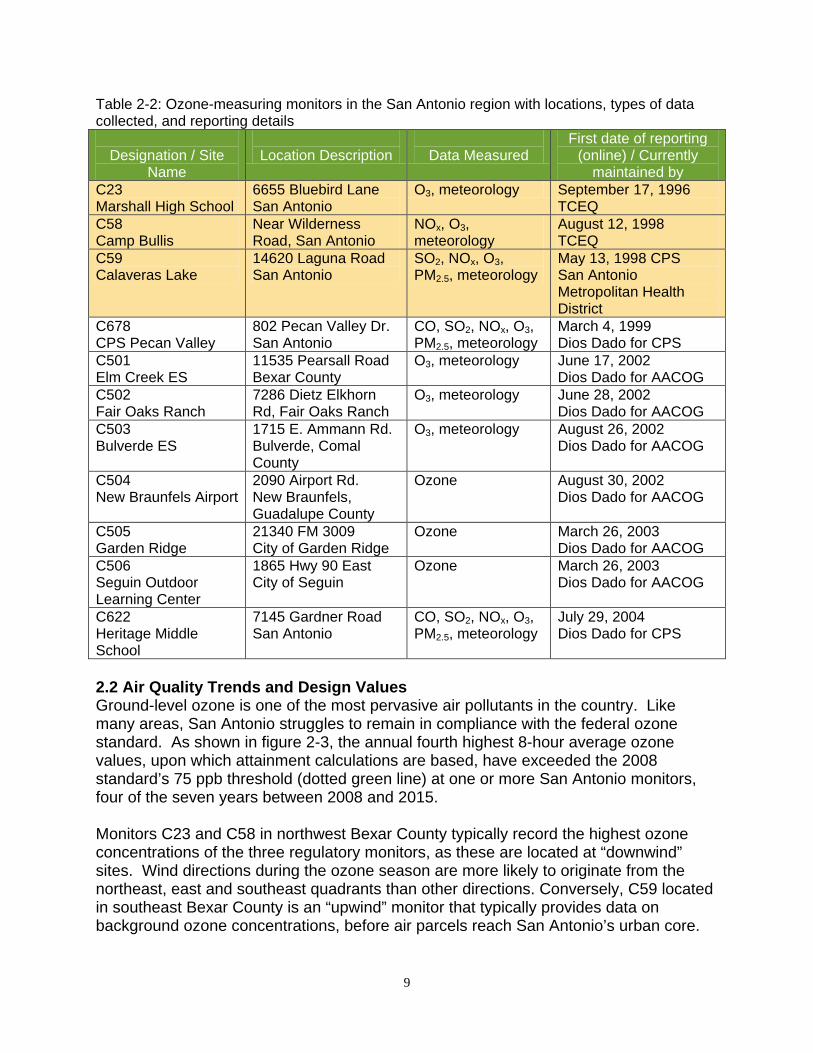
Table 2-2: Ozone-measuring monitors in the San Antonio region with locations, types of data collected, and reporting details
Designation / Site
Name
Location Description
Data Measured
First date of reporting (online) / Currently
maintained by C23 Marshall High School
6655 Bluebird Lane San Antonio
O3, meteorology September 17, 1996 TCEQ
C58 Camp Bullis
Near Wilderness Road, San Antonio
NOx, O3, meteorology
August 12, 1998 TCEQ
C59 Calaveras Lake
14620 Laguna Road San Antonio
SO2, NOx, O3, PM2.5, meteorology
May 13, 1998 CPS San Antonio Metropolitan Health District
C678 CPS Pecan Valley
802 Pecan Valley Dr. San Antonio
CO, SO2, NOx, O3, PM2.5, meteorology
March 4, 1999 Dios Dado for CPS
C501 Elm Creek ES
11535 Pearsall Road Bexar County
O3, meteorology June 17, 2002 Dios Dado for AACOG
C502 Fair Oaks Ranch
7286 Dietz Elkhorn Rd, Fair Oaks Ranch
O3, meteorology June 28, 2002 Dios Dado for AACOG
C503 Bulverde ES
1715 E. Ammann Rd. Bulverde, Comal County
O3, meteorology August 26, 2002 Dios Dado for AACOG
C504 New Braunfels Airport
2090 Airport Rd. New Braunfels, Guadalupe County
Ozone August 30, 2002 Dios Dado for AACOG
C505 Garden Ridge
21340 FM 3009 City of Garden Ridge
Ozone March 26, 2003 Dios Dado for AACOG
C506 Seguin Outdoor Learning Center
1865 Hwy 90 East City of Seguin
Ozone March 26, 2003 Dios Dado for AACOG
C622 Heritage Middle School
7145 Gardner Road San Antonio
CO, SO2, NOx, O3, PM2.5, meteorology
July 29, 2004 Dios Dado for CPS
2.2 Air Quality Trends and Design Values Ground-level ozone is one of the most pervasive air pollutants in the country. Like many areas, San Antonio struggles to remain in compliance with the federal ozone standard. As shown in figure 2-3, the annual fourth highest 8-hour average ozone values, upon which attainment calculations are based, have exceeded the 2008 standard’s 75 ppb threshold (dotted green line) at one or more San Antonio monitors, four of the seven years between 2008 and 2015. Monitors C23 and C58 in northwest Bexar County typically record the highest ozone concentrations of the three regulatory monitors, as these are located at “downwind” sites. Wind directions during the ozone season are more likely to originate from the northeast, east and southeast quadrants than other directions. Conversely, C59 located in southeast Bexar County is an “upwind” monitor that typically provides data on background ozone concentrations, before air parcels reach San Antonio’s urban core.
10
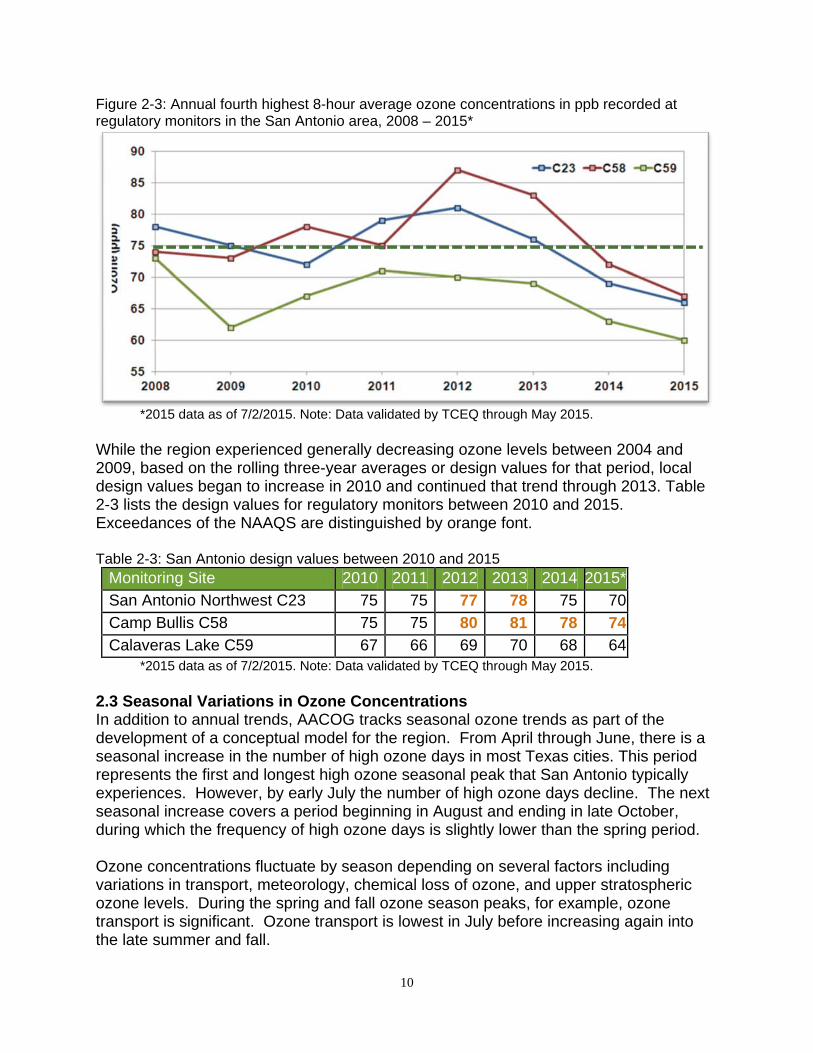
Figure 2-3: Annual fourth highest 8-hour average ozone concentrations in ppb recorded at regulatory monitors in the San Antonio area, 2008 – 2015*
*2015 data as of 7/2/2015. Note: Data validated by TCEQ through May 2015. While the region experienced generally decreasing ozone levels between 2004 and 2009, based on the rolling three-year averages or design values for that period, local design values began to increase in 2010 and continued that trend through 2013. Table 2-3 lists the design values for regulatory monitors between 2010 and 2015. Exceedances of the NAAQS are distinguished by orange font. Table 2-3: San Antonio design values between 2010 and 2015
Monitoring Site 2010 2011 2012 2013 2014 2015* San Antonio Northwest C23 75 75 77 78 75 70 Camp Bullis C58 75 75 80 81 78 74 Calaveras Lake C59 67 66 69 70 68 64
*2015 data as of 7/2/2015. Note: Data validated by TCEQ through May 2015. 2.3 Seasonal Variations in Ozone Concentrations In addition to annual trends, AACOG tracks seasonal ozone trends as part of the development of a conceptual model for the region. From April through June, there is a seasonal increase in the number of high ozone days in most Texas cities. This period represents the first and longest high ozone seasonal peak that San Antonio typically experiences. However, by early July the number of high ozone days decline. The next seasonal increase covers a period beginning in August and ending in late October, during which the frequency of high ozone days is slightly lower than the spring period. Ozone concentrations fluctuate by season depending on several factors including variations in transport, meteorology, chemical loss of ozone, and upper stratospheric ozone levels. During the spring and fall ozone season peaks, for example, ozone transport is significant. Ozone transport is lowest in July before increasing again into the late summer and fall.
11
2.4 Meteorology and Ozone Concentrations Certain identifiable regional-scale meteorological pressure systems are associated with high ozone events. Prevailing wind directions, wind speeds, mixing, and dispersion conditions are influenced by high-pressure systems. High-pressure systems suppress vertical mixing of pollutants and influence wind direction, and are characterized by clear skies, relatively low wind speeds, and low humidity in San Antonio. These meteorological conditions typically increase ozone formation and transport of pollutants into the San Antonio area and generate elevated concentrations of local ozone. An analysis between meteorology and ambient ozone indicates a number of local meteorological factors that contribute to elevated ozone concentrations in the San Antonio region. The following summarize the relationship between local meteorology and ozone photochemistry:
• Meteorological conditions on days with elevated ozone typically include stagnated
winds over Texas, limited frontal movement, lack of precipitation, reduced mixing between layers, and clear skies.
• High ozone days are typically absent of strong synoptic weather systems. • Local meteorological conditions associated with high ozone days include lack of
precipitation, low atmospheric moisture content in the afternoon, and clear skies. • Wind vectors on high ozone days were more stagnated and often originated from the
east and northeast. • Mixing heights are typically lower in the early morning hours and experience a rapid
rise in the late morning through early afternoon on high ozone days. Low nighttime mixing height can trap nocturnal pollutants from the local area as well as emissions from the previous day. When combined with a rapid rise in mixing height that allows downward mixing of transported pollutants from higher inversion layers, ozone can become significantly elevated.
2.5 Emission Sources and Trends AACOG develops periodic emissions inventories of non-road, off-road, and area sources in the region. Combining AACOG data with point and on-road emissions calculated by other state agencies provides an indication of the daily and annual anthropogenic VOC and NOx emissions generated in the region by sector. Despite a consistently increasing population in the region and escalating activity in the nearby Eagle Ford Shale play, analyses of emissions trends indicates that regionally-generated NOX emissions should continue a downward trend, in large part due to improvements in vehicle emission standards. Local VOC emissions are expected to remain static (table 2-4).
12
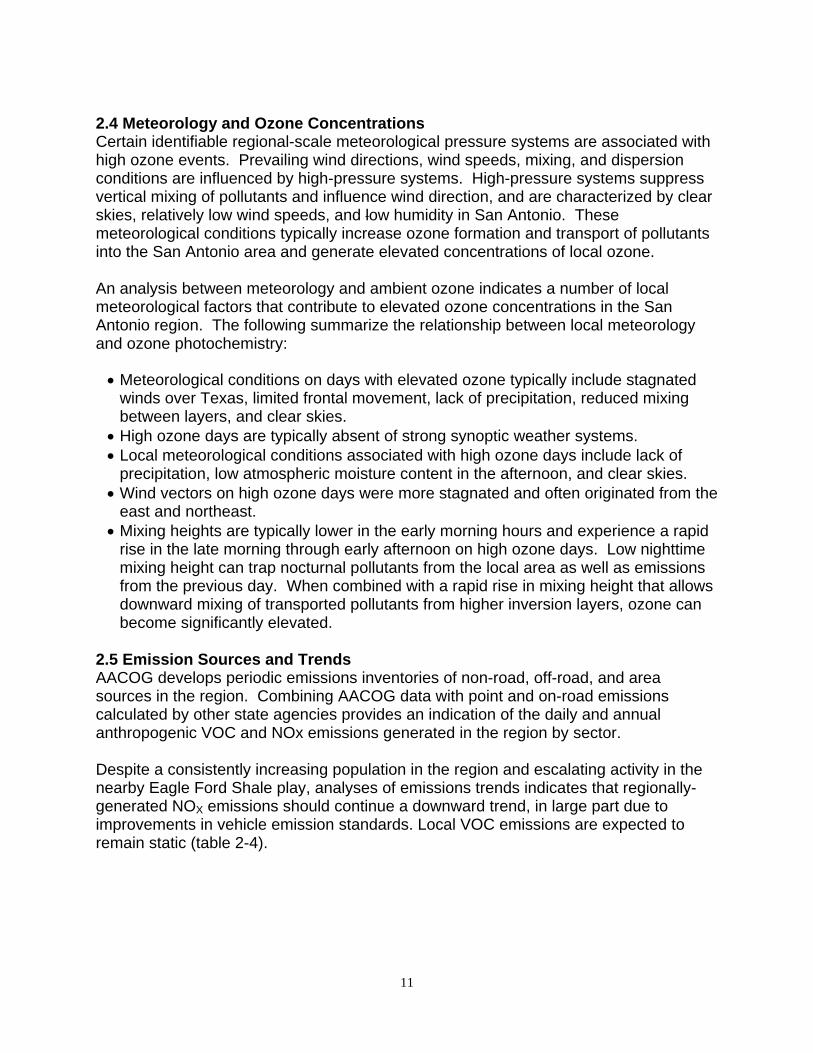
Table 2-4: Tons of anthropogenic NOX and VOC emissions per ozone season weekday, San Antonio - New Braunfels MSA, 2012, 2018, 2023
Source VOC NOX
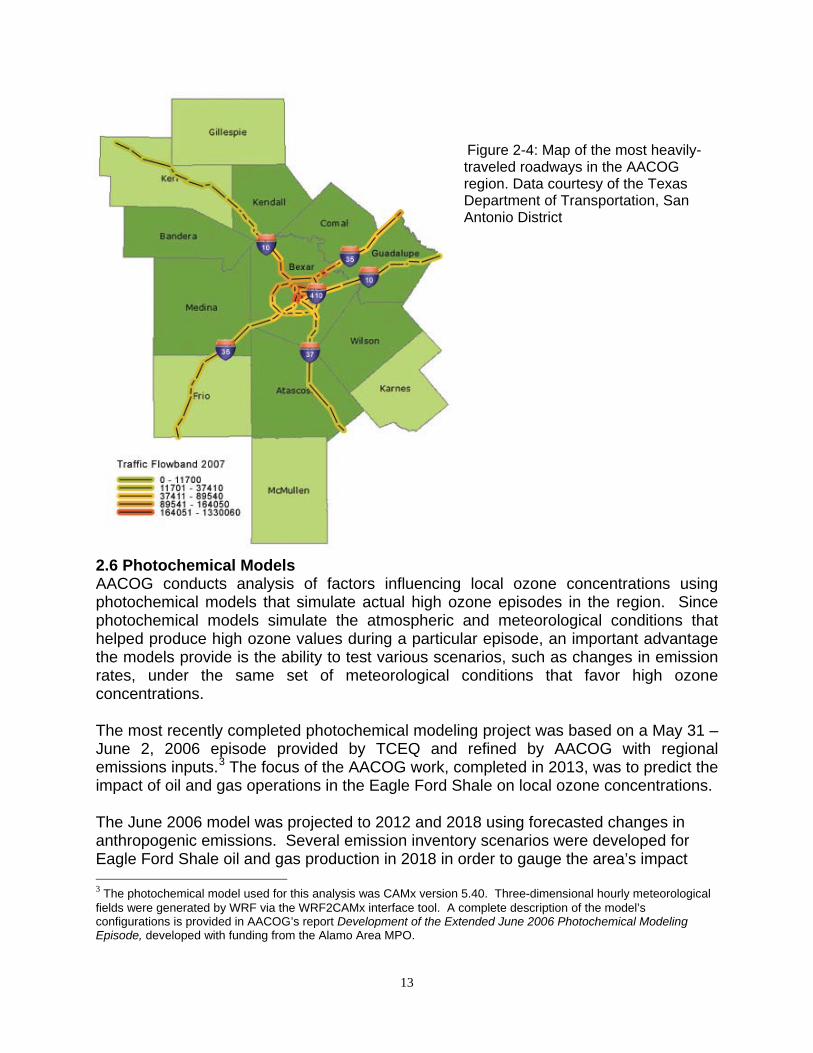
2012 2018 2023 2012 2018 2023 Eagle Ford 3 7 7 4 4 4 Non-Road 27 19 17 20 11 8 Off-Road 3 3 3 8 8 7 Area 151 154 190 16 16 17 Point 6 7 7 66 64 57 On-Road 33 22 19 77 43 32 Total 224 213 244 190 146 125 On-road vehicles have traditionally represented the largest source of NOx in the region. San Antonio is transected by a number of major highways and its proximity to multiple land and ocean ports guarantees an abundance of heavy duty vehicle traffic. Development of the Eagle Ford Shale area has served to further increase the use of heavy-duty vehicles on the region’s roadways. Figure 2-4 highlights the most heavily-traveled roads in the region. Weekday NOx emissions for 2012 from on-road sources in the SA-NB MSA were estimated at 77 tons per day, followed by point sources at 66 tons per day. By 2018, that trend is expected to reverse, so that point sources are expected to be the largest source of NOx, at 64 tons per day, and on-road sources fall to second largest at 43 tons per day. The largest point sources for NOx emissions in the region are coal-fired power plants and cement plants. Other point sources include military bases, research facilities, and manufacturing operations. Appendix A lists major stationary sources in the SA-NB MSA. In terms of anthropogenic emissions, most VOCs generated in the SA-NB MSA are the facilities and activities collectively categorized as area sources. This trend is expected to continue through 2023, the last date for which emissions have been estimated. Modeling and other analyses indicate the SA-NB MSA is NOx limited. Therefore, air quality planning tends to focus on controls that reduce NOx emissions, although VOC controls are also evaluated.
13
Figure 2-4: Map of the most heavily-traveled roadways in the AACOG region. Data courtesy of the Texas Department of Transportation, San Antonio District
2.6 Photochemical Models AACOG conducts analysis of factors influencing local ozone concentrations using photochemical models that simulate actual high ozone episodes in the region. Since photochemical models simulate the atmospheric and meteorological conditions that helped produce high ozone values during a particular episode, an important advantage the models provide is the ability to test various scenarios, such as changes in emission rates, under the same set of meteorological conditions that favor high ozone concentrations. The most recently completed photochemical modeling project was based on a May 31 – June 2, 2006 episode provided by TCEQ and refined by AACOG with regional emissions inputs.3
The focus of the AACOG work, completed in 2013, was to predict the impact of oil and gas operations in the Eagle Ford Shale on local ozone concentrations.
The June 2006 model was projected to 2012 and 2018 using forecasted changes in anthropogenic emissions. Several emission inventory scenarios were developed for Eagle Ford Shale oil and gas production in 2018 in order to gauge the area’s impact 3 The photochemical model used for this analysis was CAMx version 5.40. Three-dimensional hourly meteorological fields were generated by WRF via the WRF2CAMx interface tool. A complete description of the model’s configurations is provided in AACOG’s report Development of the Extended June 2006 Photochemical Modeling Episode, developed with funding from the Alamo Area MPO.
14
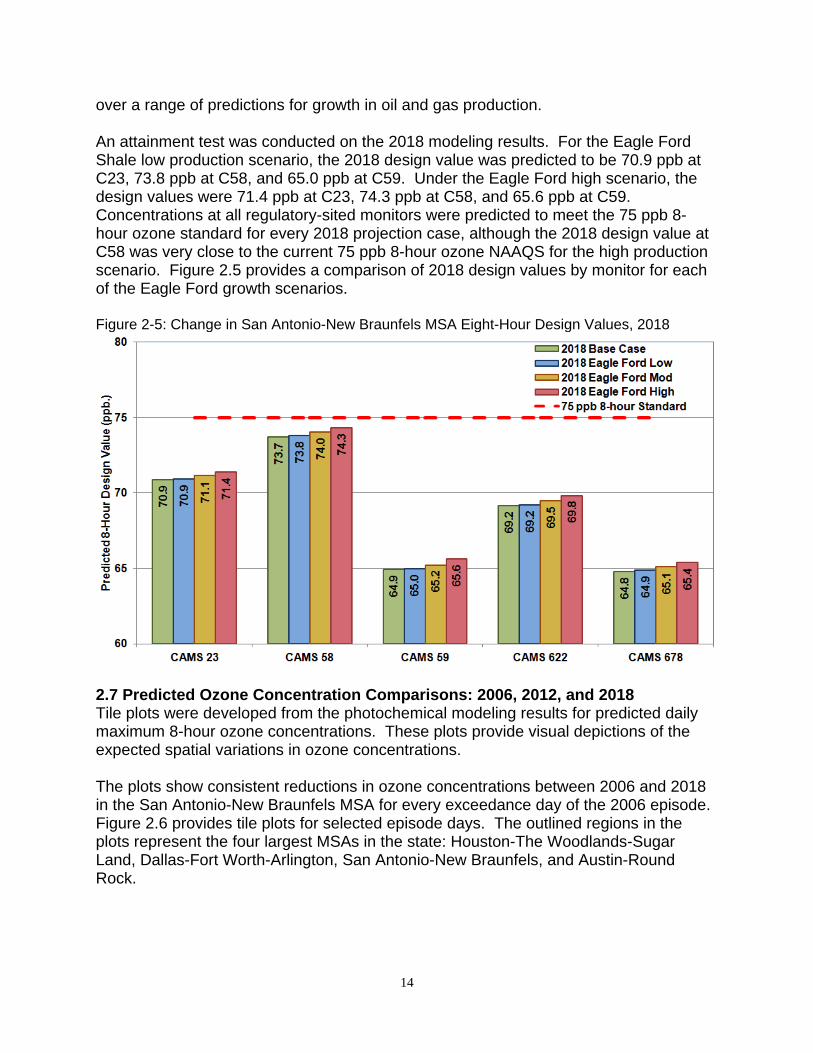
over a range of predictions for growth in oil and gas production. An attainment test was conducted on the 2018 modeling results. For the Eagle Ford Shale low production scenario, the 2018 design value was predicted to be 70.9 ppb at C23, 73.8 ppb at C58, and 65.0 ppb at C59. Under the Eagle Ford high scenario, the design values were 71.4 ppb at C23, 74.3 ppb at C58, and 65.6 ppb at C59. Concentrations at all regulatory-sited monitors were predicted to meet the 75 ppb 8-hour ozone standard for every 2018 projection case, although the 2018 design value at C58 was very close to the current 75 ppb 8-hour ozone NAAQS for the high production scenario. Figure 2.5 provides a comparison of 2018 design values by monitor for each of the Eagle Ford growth scenarios. Figure 2-5: Change in San Antonio-New Braunfels MSA Eight-Hour Design Values, 2018
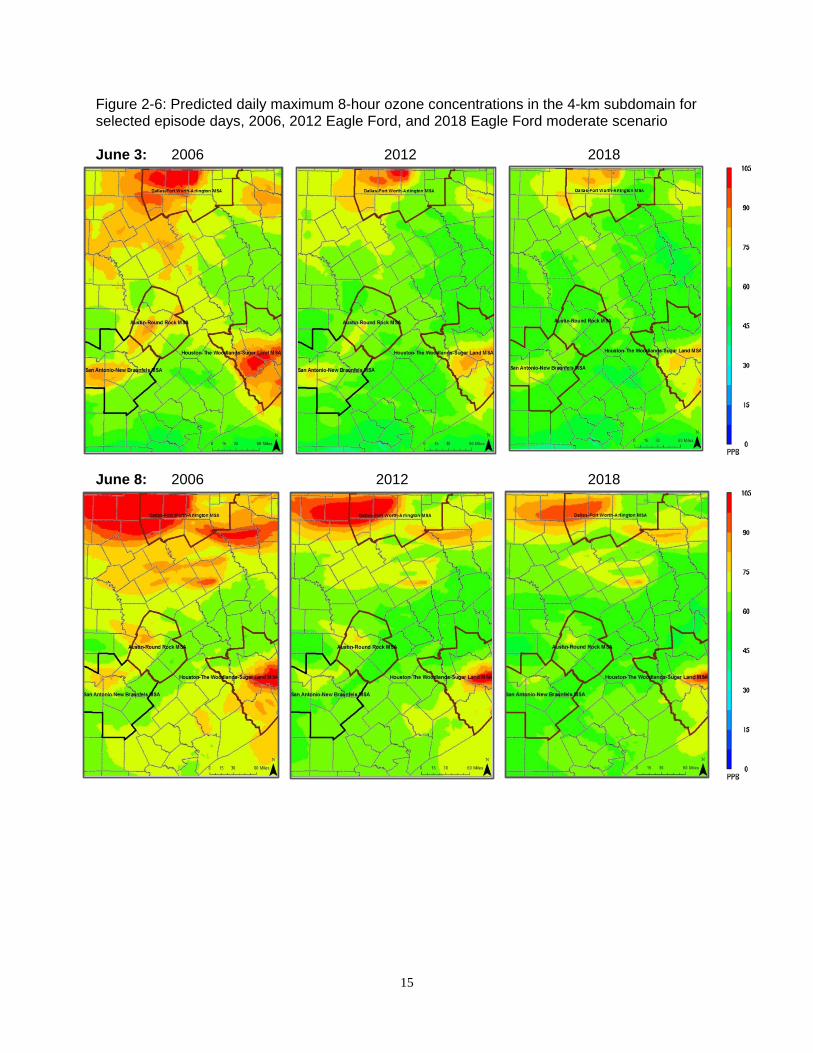
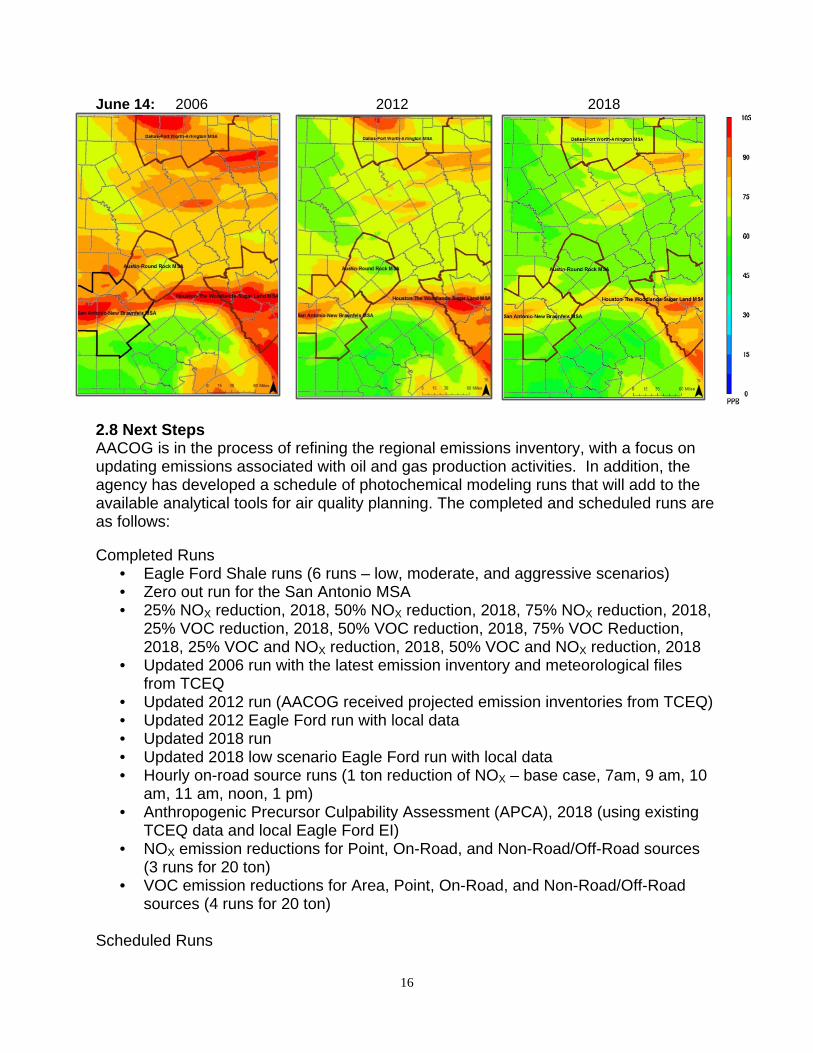
2.7 Predicted Ozone Concentration Comparisons: 2006, 2012, and 2018 Tile plots were developed from the photochemical modeling results for predicted daily maximum 8-hour ozone concentrations. These plots provide visual depictions of the expected spatial variations in ozone concentrations. The plots show consistent reductions in ozone concentrations between 2006 and 2018 in the San Antonio-New Braunfels MSA for every exceedance day of the 2006 episode. Figure 2.6 provides tile plots for selected episode days. The outlined regions in the plots represent the four largest MSAs in the state: Houston-The Woodlands-Sugar Land, Dallas-Fort Worth-Arlington, San Antonio-New Braunfels, and Austin-Round Rock.
15
Figure 2-6: Predicted daily maximum 8-hour ozone concentrations in the 4-km subdomain for selected episode days, 2006, 2012 Eagle Ford, and 2018 Eagle Ford moderate scenario June 3: 2006 2012 2018
June 8: 2006 2012 2018
16
June 14: 2006 2012 2018
2.8 Next Steps AACOG is in the process of refining the regional emissions inventory, with a focus on updating emissions associated with oil and gas production activities. In addition, the agency has developed a schedule of photochemical modeling runs that will add to the available analytical tools for air quality planning. The completed and scheduled runs are as follows: Completed Runs
• Eagle Ford Shale runs (6 runs – low, moderate, and aggressive scenarios) • Zero out run for the San Antonio MSA • 25% NOX reduction, 2018, 50% NOX reduction, 2018, 75% NOX reduction, 2018,
25% VOC reduction, 2018, 50% VOC reduction, 2018, 75% VOC Reduction, 2018, 25% VOC and NOX reduction, 2018, 50% VOC and NOX reduction, 2018
• Updated 2006 run with the latest emission inventory and meteorological files from TCEQ
• Updated 2012 run (AACOG received projected emission inventories from TCEQ) • Updated 2012 Eagle Ford run with local data • Updated 2018 run • Updated 2018 low scenario Eagle Ford run with local data • Hourly on-road source runs (1 ton reduction of NOX – base case, 7am, 9 am, 10
am, 11 am, noon, 1 pm) • Anthropogenic Precursor Culpability Assessment (APCA), 2018 (using existing
TCEQ data and local Eagle Ford EI) • NOX emission reductions for Point, On-Road, and Non-Road/Off-Road sources
(3 runs for 20 ton) • VOC emission reductions for Area, Point, On-Road, and Non-Road/Off-Road
sources (4 runs for 20 ton)
Scheduled Runs
17
• Hourly on-road source runs (1 ton reduction of NOX – 8am) • Runs on individual Point Sources (Capitol, CEMEX, TXI, Spruce1, Deely, San
Miguel, Alamo Cement, Chemical Lime) • Control Strategy Runs (5 runs) • Anthropogenic Precursor Culpability Assessment (APCA) run with individual San
Antonio New Braunfels MSA Counties as regions , 2018 • Start running the June 2012 photochemical modeling episode • Create projection cases for 2020 • Create projection cases for 2023
Finally, AACOG has compiled a list of potential control strategies that were provided to local governments and elected officials (Appendix B). These may be considered potential contingency measures in the event that current voluntary measures are deemed insufficient for maintaining the ozone NAAQS.
18
Local agencies and stakeholders have taken actions that will remain ongoing into the future and will have a positive impact on ozone levels in the region. Their actions and willingness to list measures are key leadership features of the Alamo Ozone Advance effort. 3.1 Voluntary Emission Reduction Strategies The ongoing strategies chapter is divided into two major divisions: voluntary emission reduction strategies and air quality outreach and education programs. These strategies and projects are listed by the organization or industry responsible for strategy implementation. 3.1.1 CPS Energy Updated since 2014 Path Forward Submission Programs
One important source of ozone precursors is power generation when fossil fuel is used. CPS Energy has created as series of consumer-based reduction programs, including:
: Save For Tomorrow Energy Program, Solar Generation
• Residential and commercial energy conservation and solar rebate program to help avoid 771 MW of electric load-Save for Tomorrow Energy Program (STEP); 345 MW of savings as of February 2015. For FY2015 the goal is to reduce demand by 142 MW (141,641 kilowatts).
• Home Area Network (HAN), a NEST thermostat rebate program and Think Eco program for customers to manage energy and provide peak load reductions Commercial demand response program that includes an automated demand response program that opened the door for smaller commercial customers Installing LED street lights with the City of San Antonio to increase lighting energy efficiency; 23,492 lights installed as of 4/28/15.
• 1500 MW of renewable energy capacity by 2020 (approx. 20% of generation capacity); as of April 28, 2015, 1,207.4 MW in commercial operation which includes 134 MW of utility-scale solar with about 310 MW of utility-scale solar scheduled to come online by 2017; also have about 21.5 MW of rooftop solar as of April, 2015
• Reducing emissions by “rebalancing” generation portfolio with additional renewable energy, Summit Texas Clean Energy Project (IGCC technology and 90% carbon capture) and recent purchase of natural gas plant
• Invested over $253 M in emission control technologies at its coal units since 1997, including Separated Over Fired Air (SOFA), bag houses, NOx combustion
Chapter 3: Ongoing Strategies
19
controls, Selective Catalytic Reduction (SCR) technology, and mercury controls. CPS Energy NOx emissions have been reduced over 70% from 1997 to 2012.
• Mow Down Smog Program to provide customers rebates for purchasing electric lawn equipment instead of gasoline. In 2014, CPS Energy issued 408 rebates for electric lawn equipment.
Key among these is the STEP program for the reduction in emissions which accompanies the reduction in generation using fossil fuel power. In 2009-2010, with support funding provided by the TCEQ, CPS Energy partnered with the Texas A&M Energy Systems Laboratory (ESL) and AACOG to provide an assessment of the ozone impacts derived from the STEP program. The final4
report, delivered in October of 2010, showed that “according to the TCEQ/ESL, the total annual NOx emissions reductions estimated through 2009 energy savings were 114.03 ton/year.”
However, since that time, the STEP program has continued and CPS Energy has also established a series of solar photovoltaic facilities. Solar PV installations represent a reduction in NOx emissions produced by traditional fossil-fuel power generation. In addition, they have announced a proposal to take the two Deely coal-fired power plants offline in 2018, with replacement generation capacity basically provided by the natural gas fired power generation facilities at Rio Nogales near Seguin and increased generation capacity using renewable energy. The reductions in oxides of nitrogen (NOx) resulting from this outstanding effort were documented for 2011 and estimated for 2020 by the Energy Systems Laboratory. The latter is the target year for the STEP goals of 771 MW reduction in power consumption through the energy efficiency measures in the program. Perhaps more critically, the energy savings which might be achieved through the voluntary, cost-efficient program can grow to become 35 times greater by 2020 than the energy savings reductions achieved in 2011, according to the analysis for growth potential noted in the report. This potential represents a tremendous path for involvement by the citizens of the region who are CPS Energy customers. The willingness of the residential, commercial, and industrial sectors to participate and grow the success of the STEP program is targeted for strong support by the AIR Committee. 3.1.2 City of San Antonio Updated since 2014 Path Forward Submission The City of San Antonio has been a leader in identifying and deploying environmental measures that benefit air quality. Those measures include:
4 "NOx Emissions Reduction from CPS Energy's 'Save For Tomorrow Energy Plan' Within the Alamo Area Council of Governments Report to the Texas Commission on Environmental Quality," Energy Systems Laboratory at the Texas Engineering Experiment Station, Texas A&M University System; October 2010; available online: http://repository.tamu.edu/bitstream/handle/1969.1/93369/ESL-TR-10-10-01.pdf
20
• The largest solar power capacity of any city in Texas (in partnership with CPS Energy).
• The largest wind power portfolio of any municipal utility in the U.S. (in partnership with CPS Energy)
• Network of over 140 electric vehicle charging stations, many with multiple chargers. • The first public utility to purchase power (200 MW) from the Texas Clean Energy
Project with 99% carbon dioxide capture. • An adopted City goal of meeting the 2030 Challenge of zero net carbon buildings. • The State’s largest fleet of CNG-powered refuse trucks. For the purposes of the Ozone Advance partnership, the City of San Antonio provides a series of programs that benefits the region’s clean air planning process. Programs
The City of San Antonio has created a series of programs
: Solar PV Installations, Energy Efficiency Building Retrofits, Clean Transportation
5
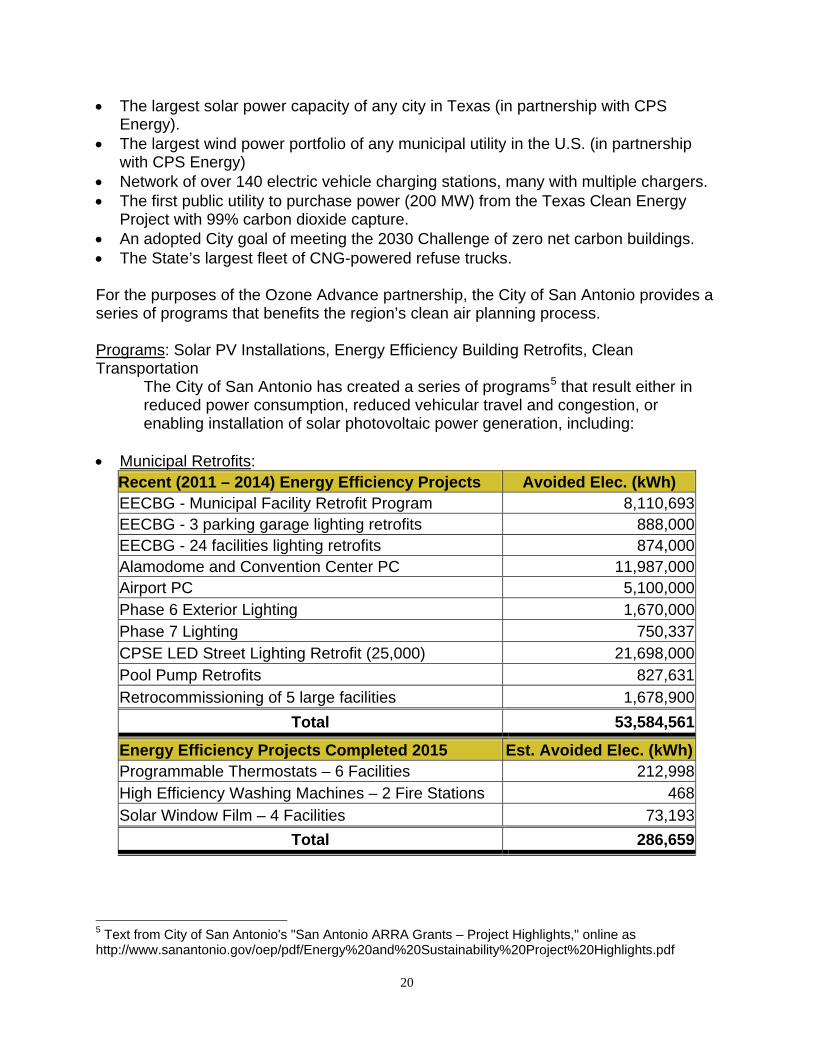
that result either in reduced power consumption, reduced vehicular travel and congestion, or enabling installation of solar photovoltaic power generation, including:
• Municipal Retrofits: Recent (2011 – 2014) Energy Efficiency Projects Avoided Elec. (kWh) EECBG - Municipal Facility Retrofit Program 8,110,693 EECBG - 3 parking garage lighting retrofits 888,000 EECBG - 24 facilities lighting retrofits 874,000 Alamodome and Convention Center PC 11,987,000 Airport PC 5,100,000 Phase 6 Exterior Lighting 1,670,000 Phase 7 Lighting 750,337 CPSE LED Street Lighting Retrofit (25,000) 21,698,000 Pool Pump Retrofits 827,631 Retrocommissioning of 5 large facilities 1,678,900
Total 53,584,561
Energy Efficiency Projects Completed 2015 Est. Avoided Elec. (kWh) Programmable Thermostats – 6 Facilities 212,998 High Efficiency Washing Machines – 2 Fire Stations 468 Solar Window Film – 4 Facilities 73,193
Total 286,659
5 Text from City of San Antonio's "San Antonio ARRA Grants – Project Highlights," online as http://www.sanantonio.gov/oep/pdf/Energy%20and%20Sustainability%20Project%20Highlights.pdf
21
• Revolving Energy Efficiency Fund
•
: Rebates and energy savings from Municipal Retrofits are being allocated into a revolving Energy Efficiency Fund, which provides a mechanism to finance future energy efficiency projects. This resulted in the creation of a permanent Energy Management program to continue targeting efficiency opportunities throughout City facilities as an alternative to relying on performance contracts. COSA remains the only major municipality in the State of Texas with this type of dedicated revolving energy fund. Transportation Enhancements
• The City of San Antonio has allocated funds through its City Wide Bond Program from 2012-2017 to complete approximately $337M in congestion mitigation measures for streets, bridges and sidewalks. The 41 projects include improved access management and traffic signalization along with the addition of bike lanes and sidewalks.
: San Antonio’s B-Cycle bike share program, with a total of 55 locations, provides opportunities to enhance personal health and provides active transportation choices to residents and visitors. According to program data, riders logged over 295,000 B-Cycle trips - burning 38.6 million calories and offsetting over 1,130,000 pounds of carbon since the program launched in 2011.
• The City of San Antonio has installed 25 solar trash compactors in city parks to reduce miles driven from reduced need for trips to empty the trash bins.
• COSA’s measures to regulate development within the inner city were established by the “Inner City Reinvestment and Infill Policy.” This policy establishes priority areas of the City targeted for development to coordinate public incentives in these areas. The incentives include financial assistance, such as fee waivers and tax abatements for eligible projects, and staff support to expedite regulatory and procedural obstacles that sometimes serve as a hindrance to infill development.
• Other Development measures include the City of San Antonio’s “Tree Ordinance.” On May 6, 2010, San Antonio’s City Council amended Chapter 35 of the City of San Antonio’s Unified Development Code relating to tree preservation and adequate canopy coverage (Ordinance 2010-05-06-0376). The goal of the ordinance is to increase the canopy coverage of the City and its ETJ within residential and commercial development. For example, the required tree canopy coverage for single-family residential construction is 38% of the lot. The final tree canopy requirement will be accomplished after meeting two requirements (1) the tree preservation requirements of 35% of the lot and (2) the canopy shade value of the new two trees required for planting.
3.1.3 Local Cement Industry Programs
: in the past, AACOG worked with industrial consultants to gauge effectiveness and reduction totals achievable through implementation of reduction technologies. Strategies implemented voluntarily in 2007 lowered NOx pollution by about 4.5 tons/day, and are likely to have been one of the reasons for our recent history of success.
The cement manufacturing industry in the San Antonio-New Braunfels Metropolitan Statistical Area (SA-NB MSA) consists of four facilities: Alamo Cement, Capitol Aggregates, Inc./Capitol Cement, Cemex Construction Materials South LLC and TXI
22
Hunter Cement. To date these facilities have made significant investments in technology and modifications to operational practices which have resulted in emissions reductions. Nitrogen Oxide (NOX) Control – Selective Non-Catalytic Reduction: Each of the facilities has installed SNCR, which represents the most modern and efficient control technology available for the cement industry for this ozone precursor. Typical reductions can range widely, between 10-50%, based on a variety of test data, but site-specific factors at each plant must be considered. As mentioned above, the addition of SNCR represents a significant capital and operational investment for these facilities, which will cumulatively approach $9.5 million in the next 12 months. Improvements to Efficiency in Manufacturing Processes: Each of the facilities has made improvements to manufacturing technology to lower emissions and reduce energy consumption in recent years. These plants utilize the most modern dry-process technology available for manufacture of cement, referred to as Preheater-Precalciner. In addition, equipment used in the process includes modern low-NOX firing systems as well as use of feed materials that require significantly lower energy amounts to process. According to the U.S. Portland Cement Association, since 1972 energy consumption has been reduced industry-wide by 37.5% per unit produced, and the producers in the SA-NB MSA region also reflect this continued improvement, which ultimately results in lowered emissions and improvements to ground level ozone. Upgrades to Mobile Fleets: Upgrades have been ongoing at all facilities to incorporate use of lower-emitting engines for mobile equipment at the plants. Some facilities have worked through the Texas Emissions Reduction Program (TERP) while others have voluntarily upgraded fleets to further enhance efficiency. 3.1.4 Local Oil & Gas Industry: Eagle Ford Shale Updated since 2013 Path Forward Submission As the oil and gas industry in the Eagle Ford continues to mature, improvements in infrastructure, operations, and technology provide improvements to regional air quality. These improvements occur through the following practices:
• Companies are moving to a “pad drilling model” wherein multiple wells are drilled and completed sequentially from a single pad at a single time, eliminating the emissions associated with multiple rig up/rig down activities and the transportation between those events.
• As technology improves and knowledge of the characteristics of the resource increases, well drilling efficiencies are realized. In general, longer laterals are being drilled in 2/3 the time and with less energy required of an Eagle Ford well just two years previous.
• Industry continues to focus on long-term advanced planning to ensure timely construction of the required infrastructure, such as processing facilities for initial separation of water, oil, and gas before sending it to pipelines. They rely heavily on pipeline infrastructure as part of the development of this asset, which keeps
23
the product in the pipeline and reduces the volume of gas flared. To date, almost $1 billion has been invested in approximately 1,000 miles of pipeline infrastructure to ensure gas is captured and transported to market. The industry continues to increase this investment to further minimize the incidents of flaring in the play.
• Contracts and coordination with 3rd party midstream (transportation) companies to ensure downstream assets are in place and operational to support production without flaring. Oil and gas production companies depend on pipeline and terminal companies to receive their product and transport to market.
• As the play matures, more and more operators in the Eagle Ford are choosing to utilize a central processing facility concept, which enables numerous wells to be routed to one facility for processing. This minimizes flaring by ensuring equipment is in place to handle multi-well oil and gas production as opposed to the need for processing equipment at every wellhead. At gas gathering facilities, atmospheric storage tanks are being replaced with pressurized tanks, which reduce gas flashing of volatile liquids, thereby eliminating the need for flaring. Additionally, vapor recovery units are being installed at central processing facilities at the last stage of separation in an attempt to maximize the recovery of gas and direct it to sales, as opposed to flaring the last stage low pressure gas.
• Companies are improving engineering design and operation to allow production directly from the facility separation equipment to gas (high and low pressure) and liquid pipelines. This improvement reduces the air emissions associated with the storage of condensate in tanks, the use of flares as a control device, and the loading of tucks and subsequent transportation on roadways. The storage tanks, flares, and truck loading are only used during times of maintenance or downtime on the production collection equipment or pipelines.
• The use of multi stage separation technology (i.e. HLP separators or VRTs) helps to reduce the amount of potential flash gas at the tanks, which in turn reduces the amount of gas flared.
Partnerships with the Oil and Gas IndustryThe growing development of the Eagle Ford shale play represents an important economic generator in south central Texas, as well as a potentially large source of emissions. AACOG staff is working to address these emissions concerns in three programs.
1) Because the rate of ozone precursors from the Eagle Ford shale play development is very poorly understood, with the support of the TCEQ, AACOG staff and many important stakeholders in the Eagle Ford development have partnered to create an ozone precursor emissions inventory of the development. This is a critical component to understanding the ozone impacts from the development by including them in AACOG’s photochemical modeling analysis.
2) AACOG and the Alamo Area Development Corporation6
• The purpose of the South Central Texas Natural Gas Vehicle Consortium is to focus on expanding natural gas transportation markets and refueling
have supported the creation of the South Central Texas Natural Gas Vehicle Consortium.
6 The consortium is described on AACOG’s web site at http://www.aacog.com/index.aspx?nid=404
24
infrastructure in the Central and South Texas regions (Austin, Corpus Christi, Laredo, San Antonio, and surrounding counties). The Consortium plays a role in addressing emissions from the Eagle Ford shale development since every older diesel-powered vehicle or engine that can be replaced with a cleaner Compressed Natural Gas, Liquefied Natural Gas, or clean diesel vehicle or engine represents an advance in air quality.
• In addition, Ryder, known for transportation and supply chain management products and its fleet of rental trucks, is now integrating natural gas into their 160,000 truck fleet. They are joining the effort in Texas to increase natural gas fueled transportation by promoting natural gas vehicles, building more fueling stations, and adding maintenance capabilities for natural gas vehicles.
3) Established in 2001 by the State of Texas, the Texas Emissions Reduction Plan (TERP) provides a series of programs to reduce NOx and monitor the reductions, including grants to upgrade or replace on-road vehicles, non-road equipment and other mobile sources in the Emissions Reduction Incentive Grants (ERIG) program (see http://www.terpgrants.org/). The 83rd Regular Session of the Texas Legislature concluded in late May 2013 and provided SB 1727, modifying ERIG to allow the TCEQ to place a priority on programs that include the
“reduction of emissions from the operation of drilling, production, completions, and related heavy-duty on-road vehicles or non-road equipment in oil and gas production fields where the commission determines that the programs can help prevent that area or an adjacent area from being in violation of national ambient air quality standards.”
This provides another avenue of support for making reductions in the nearby Eagle Ford shale play. AACOG staff is pursuing this possibility by working with industry to understand how this program might best be used.
3.1.5 VIA Metropolitan Transit Updated since 2014 Path Forward Submission VIA staff has implemented a series of transportation fleet projects that include:
• Diesel repower project provided a 30% certified NOx reduction for some vehicles; • A series of replacements of vehicles averaging 4 gr NOx/horsepower-hour down
to 0.15 gr NOx/hp-hr; • Replacement of 94 diesel-powered paratransit vans with propane-powered vans. • Gasoline powered buses that were replaced by propane and compressed natural
gas powered buses. • A Bus Rapid Transit line powered with 19 compressed natural gas (CNG)
articulated vehicles. • Three 100% electric battery buses in the downtown area • Four 40’ CNG buses • Thirty diesel-electric hybrid buses
25
3.1.6 Alamo Area Metropolitan Planning Organization Added since 2013 Path Forward Submission The Alamo Area MPO has submitted the 2015-2018 Transportation Improvement Program (TIP) for Mobile Source Emission Reduction Strategies (MOSERS) analysis for tons per day reductions in VOCs and NOx. This analysis is currently being conducted by the Texas Transportation Institute (TTI). The MPO plans to submit these noted projects and associated reductions for inclusion in the next Ozone Advance update. 3.1.7 San Antonio Water System Updated since 2013 Path Forward Submission The San Antonio Water System (SAWS) has implemented numerous energy efficiency measures. These measures include:
• Sponsorship of VIA Bus Pass Program for SAWS employees Ongoing
• Commercial and Residential Water Conservation Programs • Medio Mixer Project • Biogas Reuse at Dos Rios • An international reputation in water conservation accommodating a 67% increase
in population over the last 25 years without an increase in overall water consumption.
o In 2012, SAWS indoor and outdoor conservation rebate programs saved 735 million gallons of water, equivalent to 2,254 acre-feet.
• The nation’s largest (110 miles) direct recycled water delivery system in the nation for use by golf courses, parks, commercial and industrial customers, as well as San Antonio's famous River Walk.
• The nation’s second largest Aquifer Storage and Recovery Facility. • The only U.S. city in which all three products of wastewater treatment (gas, solids
and water) are commercially sold or recycled.
• In-Conduit Hydropower generation New and Upcoming
• Compressed Natural Gas vehicle pilot project 3.1.8 The Texas Department of Transportation - San Antonio District Added since 2014 Path Forward Submission Since 2005, TxDOT has sponsored an agency-wide Clean Air Program that encourages employees to practice commute reduction activities such as ridesharing, biking, walking, public transportation, as well as reducing other trips during the work day by encouraging employees to brown-bag their lunches. Employees are reminded and encouraged to perform regular maintenance on their vehicles to help reduce vehicle emissions. Employees earn points for participating in these activities from May through September and leave time is granted once enough points are earned, up to 8 hours. To the extent practical, the district office uses clean business practices such as:
• Using low-emission diesel fuel;
26
• Avoiding refueling between the hours of 6-10 am; • Limiting the idling of vehicles; • Sending ozone action day notifications to district employees; • Avoid mowing on TxDOT properties on Ozone Action Days; • Encourage contractors to use efficient equipment as well as properly maintain
equipment to mow right-of-ways; • Continue to purchase solar-powered light and sign boards; • Continue to install LED signal bulbs; • Purchase energy star products; • Encourage contractors to apply for grants such as TERP for highway equipment • Continue to allow flexible work schedules and compressed work schedules.
TxDOT also sponsors the “Drive Clean Across Texas” partnership program between TxDOT, TCEQ, and EPA to educate the public about the impact of car emissions on air quality. The program helps to educate the public on ways they can reduce emissions. The program includes educational material for school curriculum, provides vehicle replacement assistance, and information on how to report a smoking vehicle. http://www.drivecleanacrosstexas.org. In addition to these statewide measures, TxDOT-San Antonio District sponsored a Travel Demand Management Study that aimed to assist the region in managing traffic flow by influencing travel behavior. This study introduced 9 major San Antonio employers to traditional TDM programs and provided them with strategies that emphasize livability, sustainability, transit, walking and biking, transportation and land use planning, systems operations, economic development and improved air quality. This study was completed in early 2015 and detailed summary reports of survey data are being developed with recommendations for each employer. An overall summary report is being compiled as well.. TXDOT also completed a variable speed study (VSL) on Loop 1604 between US 281 and IH 10 which looked at the operational and safety impacts of lowered speed limits during times of inclement weather, congestion and road construction to decrease the number of rear end collisions along major corridors. Researchers designed and procured the field equipment for the project and integrated the hardware and software systems that trigger lower speed limits along the VSL corridors. As a result of the study, the legislature could give TxDOT the authority to create permanent speed limit management systems across the state. 3.1.9 Build San Antonio Green Added since 2014 Path Forward Submission Build San Antonio Green (BSAG) is San Antonio’s residential green building program. As a voluntary, third party certification program, BSAG works with the homebuilding community to help create homes with increased efficiency, comfort, and durability. To date, they have certified 5,050 homes, with 1,111 in 2015 alone. The program has also certified 54 retrofits and 5 multifamily homes to date.
27
These certifications saved over 74 million kWh, with 9,277 kW of peak demand reduction. This calculates to more than 63 million lbs of CO2 and over 48,000 lbs of NOx prevented. The energy saved equated to the yearly energy of 4,625 homes, and the emissions reduced equal over 5,000 cars removed from the road for one year. 3.2 Air Quality Outreach and Education Programs Alamo Area Council of Governments Updated since 2014 Path Forward Submission In 1998, AACOG and partnering agencies established the Air Improvement Resources (AIR) Committees to guide the local air quality planning efforts of the region. At the time, AACOG covered a 12-county7
area, making the agency ideally suited for planning activities that cross multiple political boundaries. The committees were led by the AIR Executive Committee, whose membership included elected officials representing the four-county San Antonio MSA. As the MSA region grew, invitations to participate in the AIR Executive Committees were extended to representatives of the entire eight-county San Antonio-New Braunfels Metropolitan Statistical Area (SA-NB MSA).
In addition to the Executive Committee, there are two other AIR Committees that advise and conduct work directed by the Executive Committee. The three AIR committees and their responsibilities are as follows: • AIR Executive Committee
In addition to guiding the activities of the other AIR Committees and AACOG staff, the Executive Committee facilitates the completion of and updates to local air quality studies and necessary planning activities for attainment under the current 8-hour average ozone NAAQS. The Committee’s mission includes developing a comprehensive emission reduction plan that will guide the region's actions to attain the 8-hour ozone NAAQS. Membership of the Executive committee includes judges or commissioners from county governments and city mayors or council people from municipal governments in the MSA, as follows:
o Bexar County o Comal County o Floresville, City of o Guadalupe County o New Braunfels, City of o San Antonio, City of o Seguin, City of o Wilson County
o Pleasanton, City of o Bandera, City of o Boerne, City of o Hondo, City of o Bandera County o Kendall County o Medina County o Atascosa County
The following entities may also appoint a representative to the Executive Committee: o Alamo Area Council of Governments Board of Directors (AACOG) o Greater Bexar County Council of Cities (GBCCC) o Alamo Area Metropolitan Planning Organization (MPO)
7 A thirteenth county – McMullen County – was added in 2013.
28
• AIR Advisory Committee: The AIR Advisory Committee acts as liaison between the AIR Executive Committee and the greater citizen sectors, both public and private. AIR Advisory Committee membership invitations are extended among the following groups and individuals, and others as determined by the AIR Executive Committee.
o Business representatives o Environmental groups o Education agencies o Transportation organizations o Utilities o Industry representatives
o Chambers of Commerce o Health organizations o Neighborhood
organizations o Other elected officials o Minority organizations
• AIR Technical Committee
The Technical Committee provides recommendations and assistance on air quality technical issues to the AIR Executive Committee for the planning meetings held by the AIR Executive Committee. Membership includes state and federal agencies (ex-officio membership) and the following local agencies and organizations: AACOG Atascosa County Bandera, City of Bandera County Bexar County Boerne, City of CPS Energy Comal County Floresville, City of Guadalupe County
Hondo, City of Kendall County Medina County Metropolitan Health District Alamo Area Metropolitan
Planning Organization New Braunfels, City of Pleasanton, City of San Antonio, City of Seguin, City of
TCEQ (ex-officio) Texas Department Of
Transportation (TxDOT) District Office
EPA (ex-officio) VIA Metropolitan Transit Wilson County
Public input on air quality matters is sought through multiple venues including the various AIR Committee meetings. These meetings are open to the public and the agendas are posted on state and county web sites, as well as AACOG’s AIR Committee web pages. The bylaws of the committees are written to encourage public participation by ensuring that time is allotted during each meeting for citizen comments.
Public Input
Comments can also be submitted to AACOG through some of the agency’s air-related web pages. Contact information listed on several AACOG web pages and the CleanAirDrive.com site, described later in this section, allows readers to ask questions or make comments. Because public perception and opinion are important considerations for the air quality planning and outreach efforts of the region, AACOG’s Natural Resources staff conducts surveys, at least annually, to gauge public understanding of ozone pollution, knowledge of voluntary strategies, the types of controls residents are willing to adopt on a voluntary
29
basis, and their understanding of terms used in educational messages. The surveys are primarily conducted at outreach events, but may also be available on AACOG’s web site or partners’ sites. Due to the non-random nature of the data collection and the low numbers of surveys gathered, the results cannot be considered representative of the region. However, the information does guide the outreach activities of AACOG’s Natural Resources staff and often helps to identify public concerns and misunderstandings about air quality topics. In addition it provides a feedback mechanism for public opinion that is important to both staff and to the AIR Committees.
AACOG has administered a Commute Solutions program for more than 16 years. The program focuses on educating people about the connection between air quality and transportation, informing them of what they could do differently to
Commute Solutions
use less gas, and offering them viable alternatives to driving as a single occupant in a vehicle. Those who commute to work or school may help reduce traffic and save fuel costs through AACOG’s rideshare program. For short commutes, people in the Alamo Region are encouraged to burn calories rather than gasoline by walking or biking instead of driving. Commuters may also consider participating in an alternative work schedule. Employers can help make their workplace commuter-friendly by considering Commute Solutions employer options. Schools can help reduce traffic congestion and harmful pollution around their campuses by adopting one or more of Commute Solutions school programs.
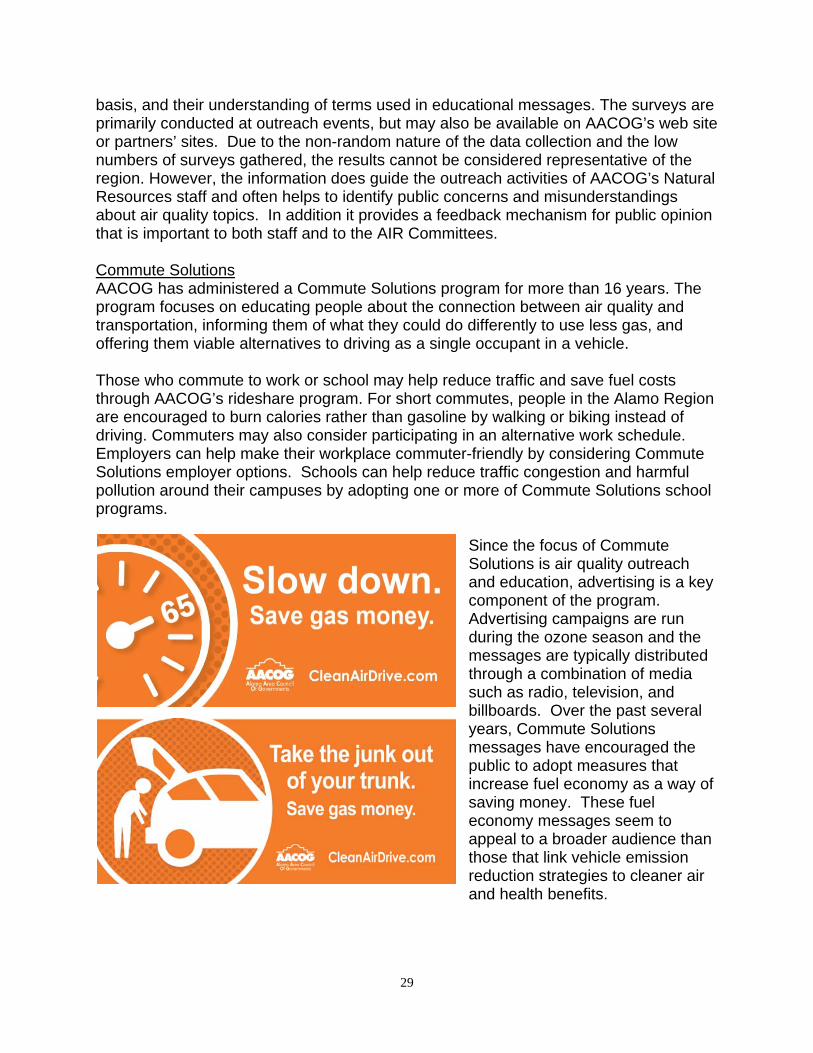
Since the focus of Commute Solutions is air quality outreach and education, advertising is a key component of the program. Advertising campaigns are run during the ozone season and the messages are typically distributed through a combination of media such as radio, television, and billboards. Over the past several years, Commute Solutions messages have encouraged the public to adopt measures that increase fuel economy as a way of saving money. These fuel economy messages seem to appeal to a broader audience than those that link vehicle emission reduction strategies to cleaner air and health benefits.
30
When an Ozone Action Alert has been issued by the TCEQ, AACOG’s Air Quality Health Alert (AQHA) program sends an email or a text message to all those in the Greater San Antonio area who are registered for this service that announces the alert, what it means, and how one best responds to avoid associated health risks and help reduce the likelihood that an exceedance will actually occur. The program actively recruits recipients and assists individuals in the registration process, particularly at environmental and health events. As of June 30, 2015, 1,716 individuals, media representatives, school nurses, city officials, and other interested parties were registered to receive these notices. In the coming year, the program plans to target the news media as an ally in assisting to build awareness of the service and increase the number of notification recipients. To increase the number of AQHA recipients by at least 200 within the next year is a program goal.
Air Quality Health Alert Program
The AQHA banner program complements the goals of the alert program by providing a visual reminder to the public that an alert is in effect. The program received a substantial boost in 2006 when the City of San Antonio funded banners for all 353 schools in San Antonio, to be placed in a prominent campus location when an AQHA was issued. Since then, banners have also been distributed to new schools in San Antonio upon request and provided, for a replacement fee, new banners to those schools that have lost or misplaced their banners. In addition, banners have been sold (at cost) to schools outside of San Antonio as well as to businesses and agencies. As in previous years, the program was promoted in an email message to all area school nurses during May 2015, with a reminder that the Ozone Season had begun. Note: Attempts to gauge the actual display of these banners per school have been thwarted by low response rates to surveys conducted to gather such information.
Air Quality Health Alert Banner Program
NuRide is a free, online carpool matching system, contracted to operate in Greater San Antonio by AACOG, through which members who do not have carpool partners can search for them. This service also rewards people who record, at Nuride.com, the trips they take by walking, biking, busing, carpooling, or vanpooling, along with the trips they save through telecommuting and working a compressed schedule, so that we may track emissions savings through these modes of transportation. Over 100 participating businesses are providing those rewards. From July 1, 2014 to June 30, 2015, the number of individuals registered on this site who live within or commute to the San Antonio-New Braunfels MSA rose to 11,090. Collectively that year, they recorded 998,513 trips resulting in a savings of 18 million vehicle miles traveled, and a reduction of over 28 tons of ozone-forming chemicals, NOx and VOCs. During 2015, promotion of the carpool matching program has included the use of digital billboard advertising along major commuting corridors..
NuRide Carpool Matching and Emissions Reduction Tracking System
31
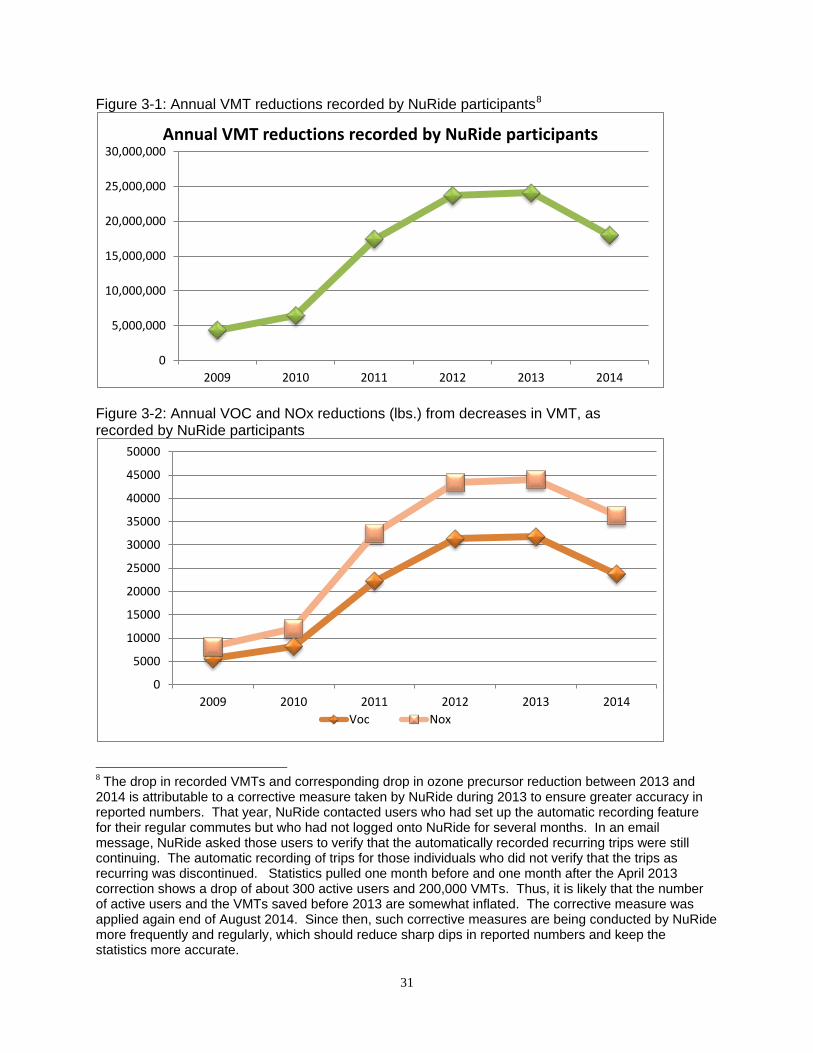
Figure 3-1: Annual VMT reductions recorded by NuRide participants8
Figure 3-2: Annual VOC and NOx reductions (lbs.) from decreases in VMT, as recorded by NuRide participants
8 The drop in recorded VMTs and corresponding drop in ozone precursor reduction between 2013 and 2014 is attributable to a corrective measure taken by NuRide during 2013 to ensure greater accuracy in reported numbers. That year, NuRide contacted users who had set up the automatic recording feature for their regular commutes but who had not logged onto NuRide for several months. In an email message, NuRide asked those users to verify that the automatically recorded recurring trips were still continuing. The automatic recording of trips for those individuals who did not verify that the trips as recurring was discontinued. Statistics pulled one month before and one month after the April 2013 correction shows a drop of about 300 active users and 200,000 VMTs. Thus, it is likely that the number of active users and the VMTs saved before 2013 are somewhat inflated. The corrective measure was applied again end of August 2014. Since then, such corrective measures are being conducted by NuRide more frequently and regularly, which should reduce sharp dips in reported numbers and keep the statistics more accurate.
0
5,000,000
10,000,000
15,000,000
20,000,000
25,000,000
30,000,000
2009 2010 2011 2012 2013 2014
Annual VMT reductions recorded by NuRide participants
0
5000
10000
15000
20000
25000
30000
35000
40000
45000
50000
2009 2010 2011 2012 2013 2014 Voc Nox
32
To alleviate a concern that acts as a deterrent to commuting to work by alternative transportation, namely, that an emergency will arise while at work and the commuter will have no immediate way home, AAGOG offers the Certified Auto Ride in case of Emergency (CARE) program. Those who live and work within the MSA, regularly commute by alternative means, and record their trips on NuRide.com are qualified, and are offered reimbursement for up to 4 cab rides home from work per year, of up to $50 each, when an emergency arises for which they must go home. During any given week, approximately 1,500 area NuRide members qualify and have access to this service. While a very small portion of that number actually uses the offer for a ride in the case of an emergency, knowing that it’s there provides a certain sense of security to others, and helps to maintain the emissions reductions reported through NuRide. More promotion of the existence of the program as a way to encourage new users of alternative transportation is needed, however, and a revised pamphlet, along with more public service announcement (PSA) promotion, is in the plan for the coming year.
CARE Program
Green Patrol is an anti-idling vehicle program offered to schools in San Antonio and its eight surrounding counties. As a part of the basic Green Patrol design, which may vary from school to school, “No-Idle Zones” are created on school campuses where school staff deem necessary. Children deliver a letter to their parents asking that they not idle their vehicles in these zones. Attached to the letter is a “No-Idle Pledge” that parents are encouraged to sign and return to the school with their children. To further engage the students, Green Patrol Officers, usually 5th graders, are assigned to observe “No Idle Zones” and remind parents of the pledge they took by wearing green jerseys and holding up “No-Idle” signs.
Green Patrol School Anti-idling Program
Program enhancements:
• Redesigned Clean Air Drive to allow easy Patrol Material. • Developed a new Green Patrol Logo (at left).
“Ozzy,” the official mascot of the Green Patrol
program, encourages students to
engage in air quality projects and educational
activities.
33
Goals • Increase awareness of vehicle idling and the program through press releases. • Have at least two schools participate in the program and have at least two more schools actively pursuing the program for this year or early next school year. • Continue to develop the program to make it more marketable to schools.
Although the public may obtain information about AACOG’s technical and educational air quality activities on the agency’s web site, a second site is maintained by AACOG’s Natural Resources staff that is devoted entirely to air quality outreach and education. The site, CleanAirDrive.com, provides basic information about ground-level ozone, its health effects, and measures everyone can adopt to help reduce the chemicals that form ozone. All materials distributed at outreach and educational events refer to this web site.
CleanAirDrive.com
AACOG’s air quality outreach staff conducts an ozone season kickoff at the beginning of April, referred to as “Fresh Air Friday.” The event is conducted at lunchtime as an environmental fair on a plaza in the heart of San Antonio. Although open to the public, downtown employees are invited to bring a brown bag or carry out from a nearby restaurant instead of driving out to eat—which is emphasized as a way to help improve air quality. Photochemical models developed in the past by AACOG predicted that reduced vehicle trips during the late morning – early afternoon timeframe were associated with greater reductions in peak ozone concentrations than trip reductions in the early morning or late afternoon. Consequently, the event is used to emphasize alternative transportation choices for noon time activities.
Fresh Air Friday
During Fresh Air Friday, approximately 25 partner organizations set up exhibits along with AACOG’s clean air programs table, each displaying a sign that briefly describes a way in which their organization promotes or contributes to cleaner air. Typically 500 people attend. During 2015 AACOG’s air quality has extended the Fresh Air Friday concept throughout the ozone season by asking the public, largely through social media, to collectively focus on one way to help keep the air clean each Friday, such as asking everyone to check their tire pressure that day, or to substitute a short vehicle trip – a mile or less – with walking or biking. If evaluated as successful, this Fresh Air Friday Ozone Actions campaign may be repeated in 2016.
34
For the past 10 years, AACOG’s air quality staff has conducted the Walk & Roll Challenge, a month-long competition in which businesses, agencies, and other
organizations vie with one another to see whose employees can record the most trips taken by walking, biking, carpooling, or busing, as well as trips saved through telecommuting and compressed work schedules, which are referred to as “smart” trips. Organizations with the most alternative trips recorded per employee are the winners. Regardless of whether their employers are officially participating,
individuals can also participate in the Walk & Roll Challenge simply by recording the trips they take by alternative means at NuRide.com. This past September, 16 organizations and 1,848 individuals participated, recording 69,196 trips that month, reducing vehicle miles traveled by 786,917, and keeping over a ton of ozone precursors from the air. Instead of September, which is towards the end of the ozone season and typically extremely hot in San Antonio, this challenge will be held in May next year, with the hopes that, if held near the beginning of the ozone season, its effect on new transportation habits will last far into the season, and that the more moderate temperature will encourage more walking and biking. Its timing will also be concurrent with National Bike Month, for which staff plans to leverage the focus on biking activities with their clean air partners.
Walk & Roll Challenge
AACOG’s Air Quality Stewardship Award annually recognizes businesses, agencies, schools, and other organizations that have made significant voluntary efforts to reduce air pollution. Eligible for an Air Quality Stewardship Award is any organization with a physical presence within San Antonio or one of its eight surrounding counties that has helped to improve air quality in at least one of the following categories; Commuter Assistance, Fleet Management, Energy Efficiency and Sustainable Building, Industrial Process Pollution Reduction, Landscaping and Air Quality Education.
Air Quality Stewardship Awards
The varying sizes, structures, and missions of nominated organizations are taken into consideration in the selection process. These awards provide an opportunity to acknowledge and showcase the efforts of air quality stewards in the Greater San Antonio area and to inspire others to greater action.
35
4.1 City of San Antonio At the request of the City of San Antonio, TCEQ arranged a study that provided the municipality with a list of control strategies they may implement to reduce ozone precursor emissions originating from sources within the City’s boundaries and extra territorial jurisdiction. The study provided an evaluation of potential controls including the estimated NOx and VOC emission reductions and cost per ton of reduction for each strategy. The results were provided to AACOG for use in photochemical model runs to determine their estimated impact on regional ambient ozone concentrations. Timeline The control strategy report was completed in early 2015. Based on the results of the study, COSA staff developed a draft air quality plan. The plan will be presented to their City Council in August of 2015 for adoption along with recommended air quality ordinances that address viable strategies identified in the study. 4.2 San Antonio Metropolitan Health District Air Quality Program Proposal The San Antonio Metropolitan Health District (SAMHD) proposes to develop an air program that will require the registration of businesses that are sources of air pollution within the city. Registration will provide information that can be used in determining strategies to lower ozone levels. SAMHD would recommend changes to Chapter 26, “Pollution Control”, Article II, of the City Code of the City of San Antonio, Texas pertaining to the regulation of air pollution which will update the references to state law in the current ordinance and require that facilities with sources of air pollution register with Metro Health. The City Council will consider the changes to Chapter 26 during FY15. One position in the program has been identified to address resident complaints and work with small businesses currently considered “minor point sources.” This work will include outreach efforts to these small businesses to address reductions in air pollution emissions. It is believed that many of these small businesses are not aware of operational changes that could be made to improve their businesses and also air quality. There are many of these small businesses that individually are considered minor sources of air pollution but when added together they become a much larger source of air pollution.
Chapter 4: New/Proposed Strategies
36
4.3 Local Oil & Gas Industry: Eagle Ford Shale Multiple companies in the oil and gas industry proactively seek measures that will help reduce emissions from their activities and operations. While the number of participants is unknown, the following example describes one such project by a company operating in the Eagle Ford Shale (EFS).
The company’s Eagle Ford Shale (EFS) asset team analyzed and improved the standard industry practice of using natural gas in back pressure dump valves on production separators, resulting in significant emissions reductions.
Background
Point of Delivery (POD) locations in EFS have production separators which separate the gas, oil and water into their appropriate flow lines. Both the oil and water are automated with dump valves on their outlet legs. The water leg utilizes a snap-acting dump valve while the oil uses a throttle dump valve; both are intermittent bleed valves. Industry practice is to use natural gas as the medium to hold back pressure on these valves.
Each time the separator dumps liquid, some portion of the back pressure gas is vented to the atmosphere. Economically feasible solutions were sought to reduce or eliminate air emissions released during this process.
Problem:
A pilot project was conducted to test the effectiveness of implementing compressed air as a supply fluid to control the dump valves. The initial installation and operation proved successful, as all natural gas emissions were eliminated from the dump valves at the POD, and production was unaffected by the change. Because of this, a decision was made to switch over as many PODs as economically feasible.
Activity:
By the end of 2014, convert 16 PODs (170 compressors) to use compressed instrument air instead of natural gas. This is equal to 34% of the total separators in the EFS.
Timeline:
Using natural gas to control the dump valves, on average, 0.72 mcf was believed to have been potentially emitted per dump, per day on a separator. By utilizing instrument air instead of natural gas, separator dump valve emissions will likely be reduced by approximately 30% in 2014.
Emission Reductions:
No additional emissions will be created in order to eliminate these current emissions, as an electric powered compressor will be used.
37
AACOG’s Community Survey AACOG encourages public and stakeholder involvement at the various AIR Committee meetings, as described in earlier sections. Public opinion is obtained by other methods as well, such as through periodic surveys. While AACOG’s Natural Resources staff conducts public surveys on air quality topics at least annually, these surveys represent a very small sample size and limited geographic scope. Neither are the surveys diverse from a demographic standpoint, as the surveys tend to be distributed at similar types of events, typically with a health or environmental focus. AACOG is in the process of developing a community project that proposes to survey a representative sample of those registered to vote in the SA-NB MSA regarding some of their underlying assumptions about air quality, their support for selected ozone emissions strategies, and their willingness to take individual action to help improve air quality, with the ultimate goals of:
• building community awareness and knowledge of air quality issues in the Greater San Antonio area,
• providing a channel for public input that may lead to a greater sense of ownership of air quality issues and the desire to help work toward possible solutions,
• gathering knowledge of public sentiments that may influence community leaders to select, support, and act upon particular strategies to reduce emissions; and
• Avoiding public resistance that has put other local plans, such as transportation projects, on indefinite hold, and allowing the region to collectively move forward in confidence to effectively reduce ozone pollution.
Timeline The survey design was completed by the end of 2014. AACOG is seeking funding to conduct the study during FY 2016.
Chapter 5: Public/Stakeholder Involvement
38
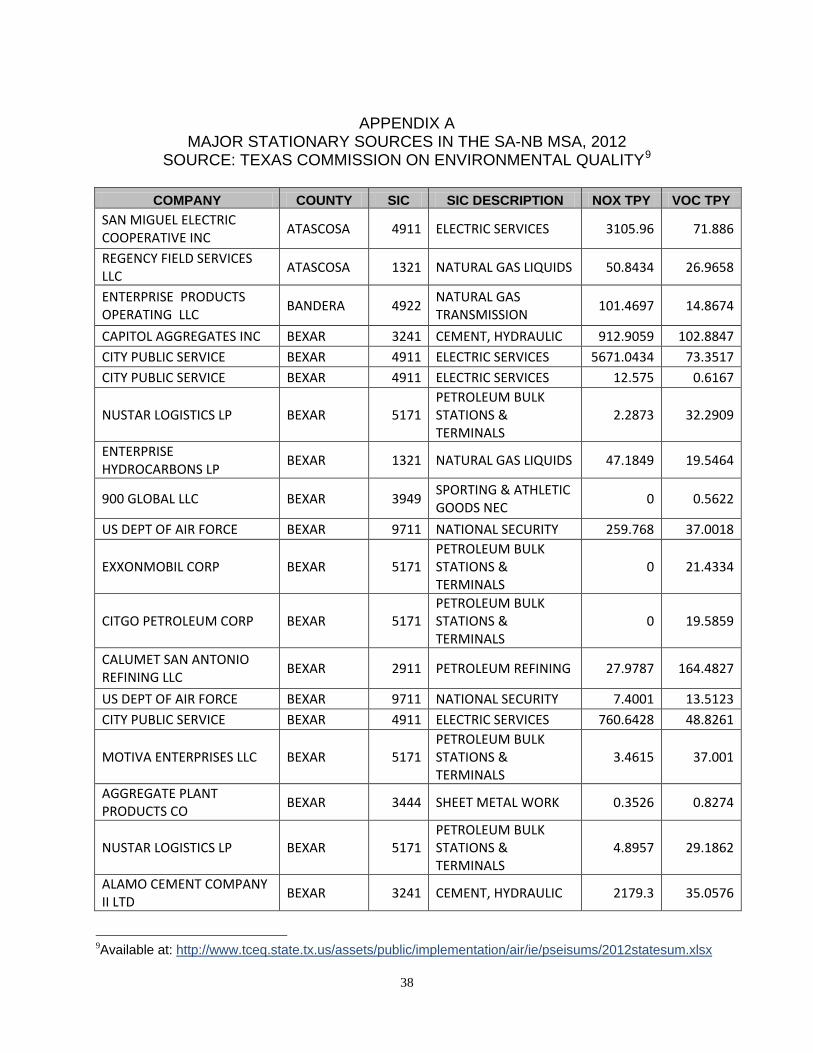
APPENDIX A
MAJOR STATIONARY SOURCES IN THE SA-NB MSA, 2012 SOURCE: TEXAS COMMISSION ON ENVIRONMENTAL QUALITY9
COMPANY COUNTY SIC SIC DESCRIPTION NOX TPY VOC TPY SAN MIGUEL ELECTRIC COOPERATIVE INC ATASCOSA 4911 ELECTRIC SERVICES 3105.96 71.886
REGENCY FIELD SERVICES LLC ATASCOSA 1321 NATURAL GAS LIQUIDS 50.8434 26.9658
ENTERPRISE PRODUCTS OPERATING LLC BANDERA 4922 NATURAL GAS
TRANSMISSION 101.4697 14.8674
CAPITOL AGGREGATES INC BEXAR 3241 CEMENT, HYDRAULIC 912.9059 102.8847 CITY PUBLIC SERVICE BEXAR 4911 ELECTRIC SERVICES 5671.0434 73.3517 CITY PUBLIC SERVICE BEXAR 4911 ELECTRIC SERVICES 12.575 0.6167
NUSTAR LOGISTICS LP BEXAR 5171 PETROLEUM BULK STATIONS & TERMINALS
2.2873 32.2909
ENTERPRISE HYDROCARBONS LP BEXAR 1321 NATURAL GAS LIQUIDS 47.1849 19.5464
900 GLOBAL LLC BEXAR 3949 SPORTING & ATHLETIC GOODS NEC 0 0.5622
US DEPT OF AIR FORCE BEXAR 9711 NATIONAL SECURITY 259.768 37.0018
EXXONMOBIL CORP BEXAR 5171 PETROLEUM BULK STATIONS & TERMINALS
0 21.4334
CITGO PETROLEUM CORP BEXAR 5171 PETROLEUM BULK STATIONS & TERMINALS
0 19.5859
CALUMET SAN ANTONIO REFINING LLC BEXAR 2911 PETROLEUM REFINING 27.9787 164.4827
US DEPT OF AIR FORCE BEXAR 9711 NATIONAL SECURITY 7.4001 13.5123 CITY PUBLIC SERVICE BEXAR 4911 ELECTRIC SERVICES 760.6428 48.8261
MOTIVA ENTERPRISES LLC BEXAR 5171 PETROLEUM BULK STATIONS & TERMINALS
3.4615 37.001
AGGREGATE PLANT PRODUCTS CO BEXAR 3444 SHEET METAL WORK 0.3526 0.8274
NUSTAR LOGISTICS LP BEXAR 5171 PETROLEUM BULK STATIONS & TERMINALS
4.8957 29.1862
ALAMO CEMENT COMPANY II LTD BEXAR 3241 CEMENT, HYDRAULIC 2179.3 35.0576
9Available at: http://www.tceq.state.tx.us/assets/public/implementation/air/ie/pseisums/2012statesum.xlsx
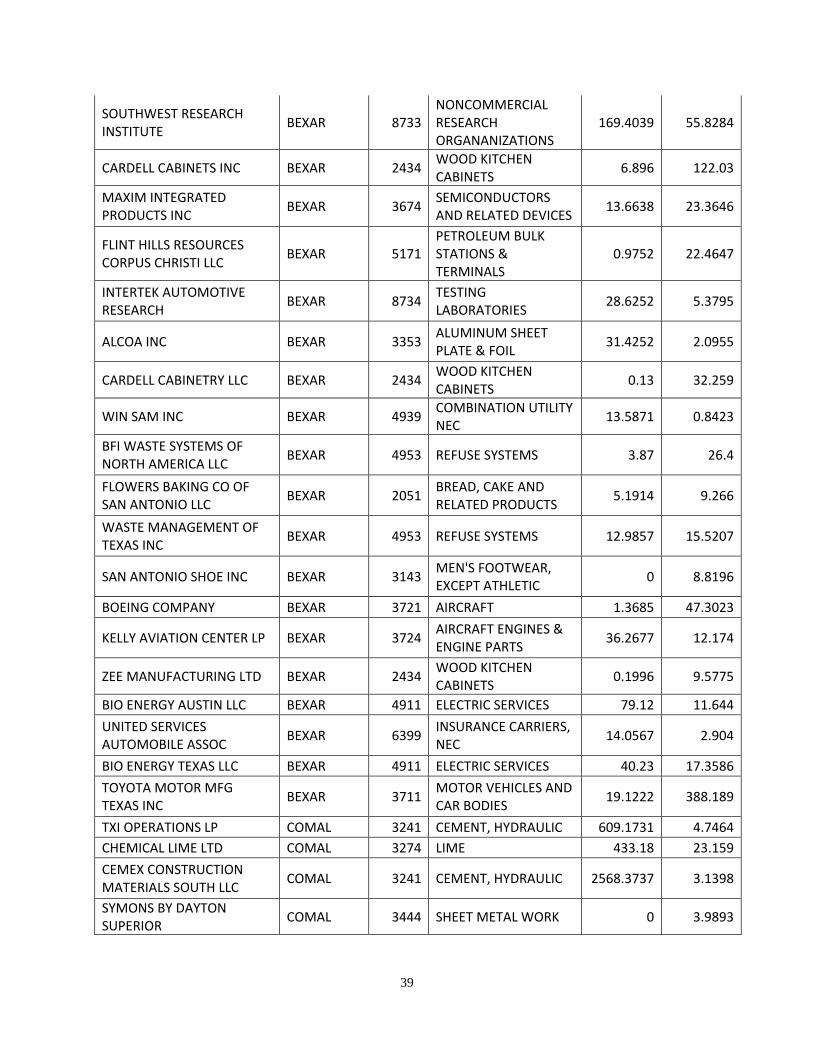
39
SOUTHWEST RESEARCH INSTITUTE BEXAR 8733
NONCOMMERCIAL RESEARCH ORGANANIZATIONS
169.4039 55.8284
CARDELL CABINETS INC BEXAR 2434 WOOD KITCHEN CABINETS 6.896 122.03
MAXIM INTEGRATED PRODUCTS INC BEXAR 3674 SEMICONDUCTORS
AND RELATED DEVICES 13.6638 23.3646
FLINT HILLS RESOURCES CORPUS CHRISTI LLC BEXAR 5171
PETROLEUM BULK STATIONS & TERMINALS
0.9752 22.4647
INTERTEK AUTOMOTIVE RESEARCH BEXAR 8734 TESTING
LABORATORIES 28.6252 5.3795
ALCOA INC BEXAR 3353 ALUMINUM SHEET PLATE & FOIL 31.4252 2.0955
CARDELL CABINETRY LLC BEXAR 2434 WOOD KITCHEN CABINETS 0.13 32.259
WIN SAM INC BEXAR 4939 COMBINATION UTILITY NEC 13.5871 0.8423
BFI WASTE SYSTEMS OF NORTH AMERICA LLC BEXAR 4953 REFUSE SYSTEMS 3.87 26.4
FLOWERS BAKING CO OF SAN ANTONIO LLC BEXAR 2051 BREAD, CAKE AND
RELATED PRODUCTS 5.1914 9.266
WASTE MANAGEMENT OF TEXAS INC BEXAR 4953 REFUSE SYSTEMS 12.9857 15.5207
SAN ANTONIO SHOE INC BEXAR 3143 MEN'S FOOTWEAR, EXCEPT ATHLETIC 0 8.8196
BOEING COMPANY BEXAR 3721 AIRCRAFT 1.3685 47.3023
KELLY AVIATION CENTER LP BEXAR 3724 AIRCRAFT ENGINES & ENGINE PARTS 36.2677 12.174
ZEE MANUFACTURING LTD BEXAR 2434 WOOD KITCHEN CABINETS 0.1996 9.5775
BIO ENERGY AUSTIN LLC BEXAR 4911 ELECTRIC SERVICES 79.12 11.644 UNITED SERVICES AUTOMOBILE ASSOC BEXAR 6399 INSURANCE CARRIERS,
NEC 14.0567 2.904
BIO ENERGY TEXAS LLC BEXAR 4911 ELECTRIC SERVICES 40.23 17.3586 TOYOTA MOTOR MFG TEXAS INC BEXAR 3711 MOTOR VEHICLES AND
CAR BODIES 19.1222 388.189
TXI OPERATIONS LP COMAL 3241 CEMENT, HYDRAULIC 609.1731 4.7464 CHEMICAL LIME LTD COMAL 3274 LIME 433.18 23.159 CEMEX CONSTRUCTION MATERIALS SOUTH LLC COMAL 3241 CEMENT, HYDRAULIC 2568.3737 3.1398
SYMONS BY DAYTON SUPERIOR COMAL 3444 SHEET METAL WORK 0 3.9893
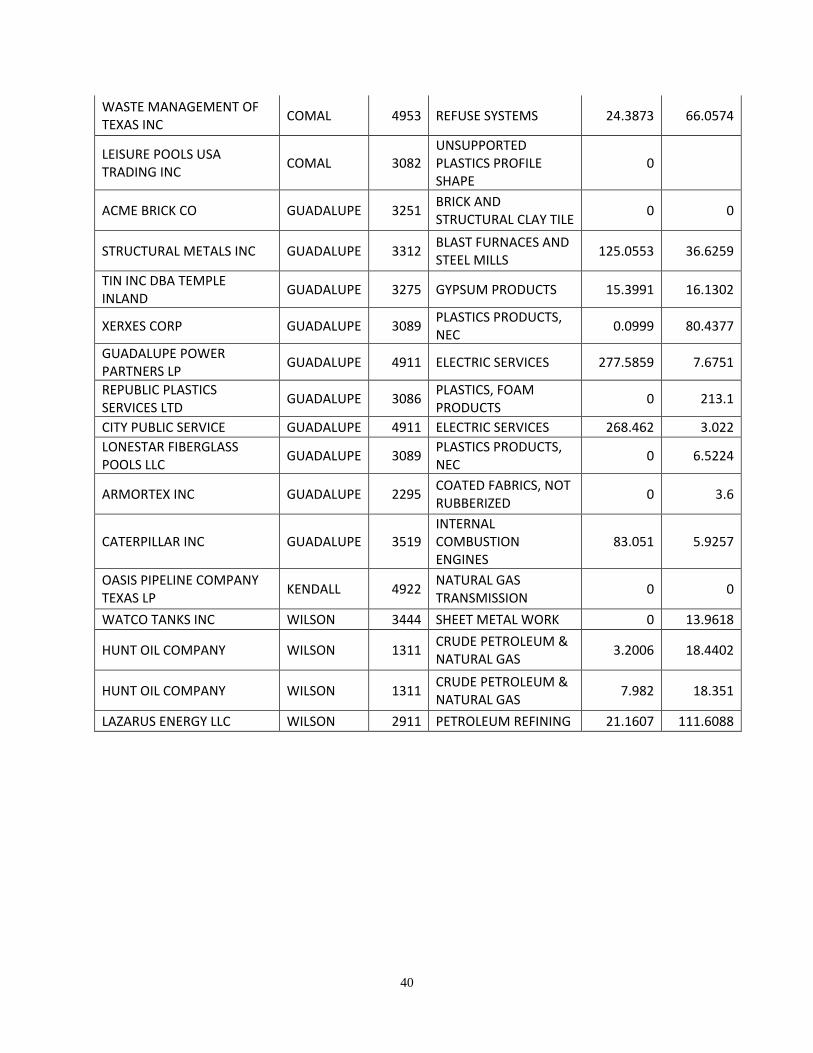
40
WASTE MANAGEMENT OF TEXAS INC COMAL 4953 REFUSE SYSTEMS 24.3873 66.0574
LEISURE POOLS USA TRADING INC COMAL 3082
UNSUPPORTED PLASTICS PROFILE SHAPE
0
ACME BRICK CO GUADALUPE 3251 BRICK AND STRUCTURAL CLAY TILE 0 0
STRUCTURAL METALS INC GUADALUPE 3312 BLAST FURNACES AND STEEL MILLS 125.0553 36.6259
TIN INC DBA TEMPLE INLAND GUADALUPE 3275 GYPSUM PRODUCTS 15.3991 16.1302
XERXES CORP GUADALUPE 3089 PLASTICS PRODUCTS, NEC 0.0999 80.4377
GUADALUPE POWER PARTNERS LP GUADALUPE 4911 ELECTRIC SERVICES 277.5859 7.6751
REPUBLIC PLASTICS SERVICES LTD GUADALUPE 3086 PLASTICS, FOAM
PRODUCTS 0 213.1
CITY PUBLIC SERVICE GUADALUPE 4911 ELECTRIC SERVICES 268.462 3.022 LONESTAR FIBERGLASS POOLS LLC GUADALUPE 3089 PLASTICS PRODUCTS,
NEC 0 6.5224
ARMORTEX INC GUADALUPE 2295 COATED FABRICS, NOT RUBBERIZED 0 3.6
CATERPILLAR INC GUADALUPE 3519 INTERNAL COMBUSTION ENGINES
83.051 5.9257
OASIS PIPELINE COMPANY TEXAS LP KENDALL 4922 NATURAL GAS
TRANSMISSION 0 0
WATCO TANKS INC WILSON 3444 SHEET METAL WORK 0 13.9618
HUNT OIL COMPANY WILSON 1311 CRUDE PETROLEUM & NATURAL GAS 3.2006 18.4402
HUNT OIL COMPANY WILSON 1311 CRUDE PETROLEUM & NATURAL GAS 7.982 18.351
LAZARUS ENERGY LLC WILSON 2911 PETROLEUM REFINING 21.1607 111.6088
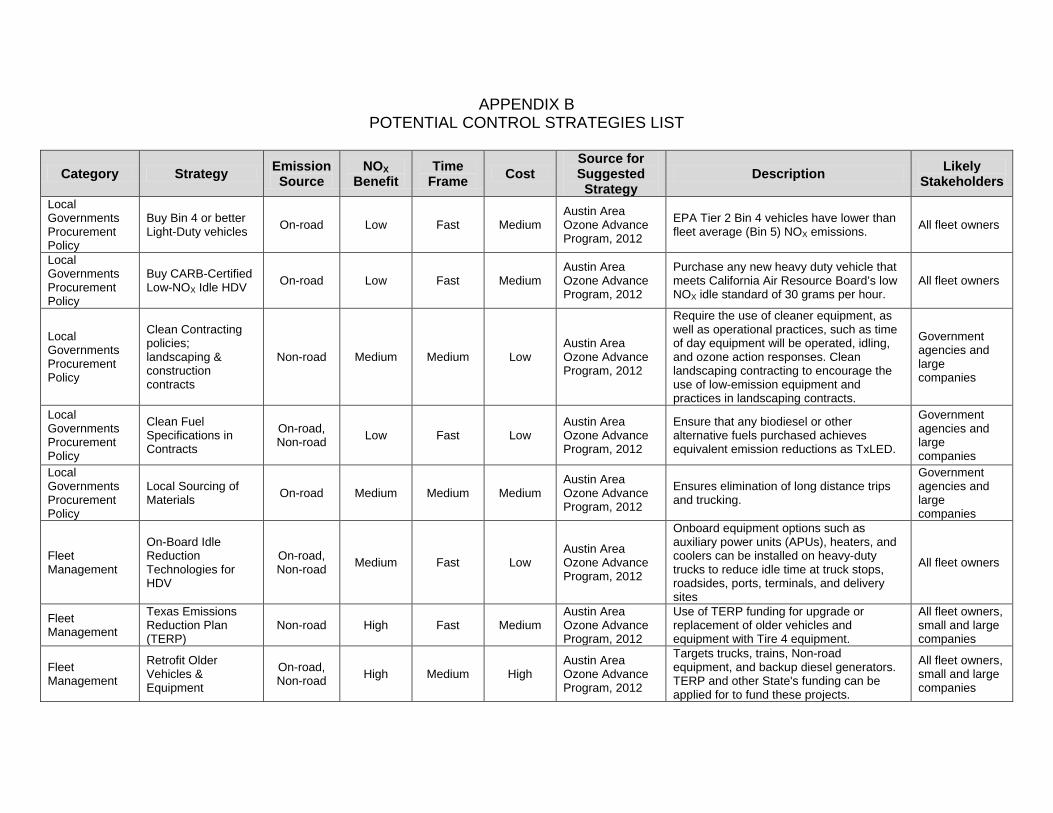
APPENDIX B POTENTIAL CONTROL STRATEGIES LIST
Category Strategy Emission Source
NOX Benefit
Time Frame Cost
Source for Suggested
Strategy Description Likely
Stakeholders Local Governments Procurement Policy
Buy Bin 4 or better Light-Duty vehicles On-road Low Fast Medium
Austin Area Ozone Advance Program, 2012
EPA Tier 2 Bin 4 vehicles have lower than fleet average (Bin 5) NOX emissions. All fleet owners
Local Governments Procurement Policy
Buy CARB-Certified Low-NOX Idle HDV On-road Low Fast Medium
Austin Area Ozone Advance Program, 2012
Purchase any new heavy duty vehicle that meets California Air Resource Board’s low NOX idle standard of 30 grams per hour.
All fleet owners
Local Governments Procurement Policy
Clean Contracting policies; landscaping & construction contracts
Non-road Medium Medium Low Austin Area Ozone Advance Program, 2012
Require the use of cleaner equipment, as well as operational practices, such as time of day equipment will be operated, idling, and ozone action responses. Clean landscaping contracting to encourage the use of low-emission equipment and practices in landscaping contracts.
Government agencies and large companies
Local Governments Procurement Policy
Clean Fuel Specifications in Contracts
On-road, Non-road Low Fast Low
Austin Area Ozone Advance Program, 2012
Ensure that any biodiesel or other alternative fuels purchased achieves equivalent emission reductions as TxLED.
Government agencies and large companies
Local Governments Procurement Policy
Local Sourcing of Materials On-road Medium Medium Medium
Austin Area Ozone Advance Program, 2012
Ensures elimination of long distance trips and trucking.
Government agencies and large companies
Fleet Management
On-Board Idle Reduction Technologies for HDV
On-road, Non-road Medium Fast Low
Austin Area Ozone Advance Program, 2012
Onboard equipment options such as auxiliary power units (APUs), heaters, and coolers can be installed on heavy-duty trucks to reduce idle time at truck stops, roadsides, ports, terminals, and delivery sites
All fleet owners
Fleet Management
Texas Emissions Reduction Plan (TERP)
Non-road High Fast Medium Austin Area Ozone Advance Program, 2012
Use of TERP funding for upgrade or replacement of older vehicles and equipment with Tire 4 equipment.
All fleet owners, small and large companies
Fleet Management
Retrofit Older Vehicles & Equipment
On-road, Non-road High Medium High
Austin Area Ozone Advance Program, 2012
Targets trucks, trains, Non-road equipment, and backup diesel generators. TERP and other State's funding can be applied for to fund these projects.
All fleet owners, small and large companies
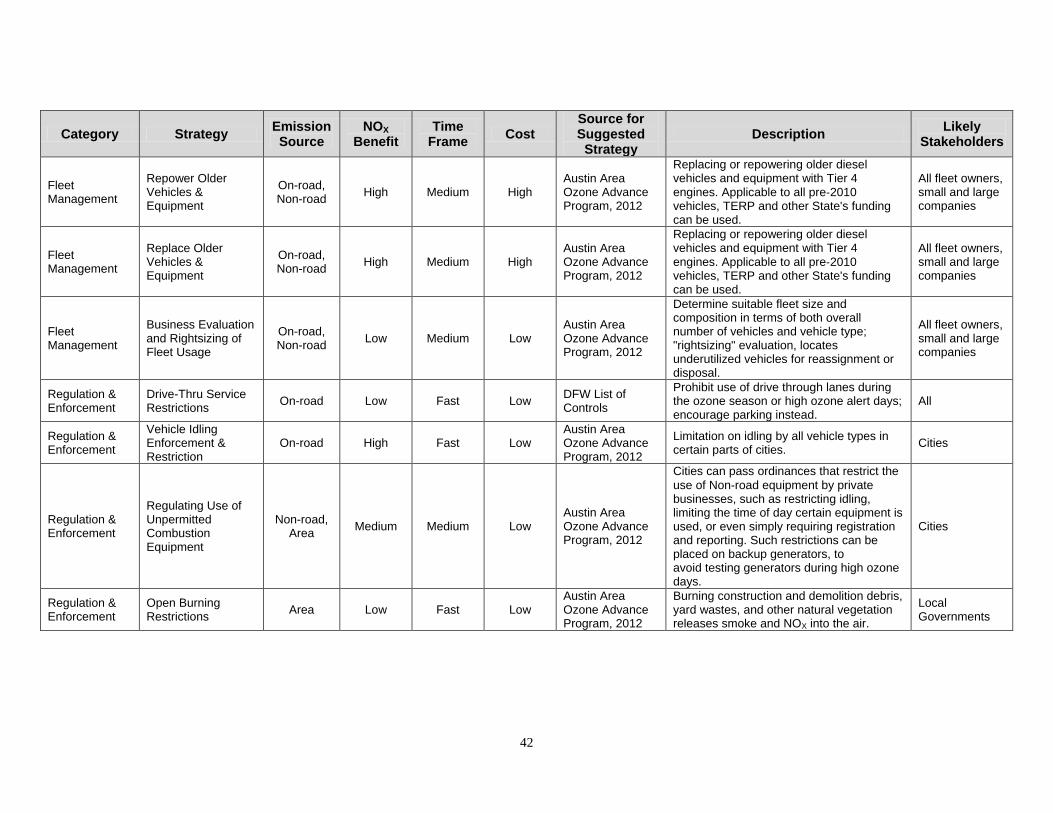
42
Category Strategy Emission Source
NOX Benefit
Time Frame Cost
Source for Suggested
Strategy Description Likely
Stakeholders
Fleet Management
Repower Older Vehicles & Equipment
On-road, Non-road High Medium High
Austin Area Ozone Advance Program, 2012
Replacing or repowering older diesel vehicles and equipment with Tier 4 engines. Applicable to all pre‐2010 vehicles, TERP and other State's funding can be used.
All fleet owners, small and large companies
Fleet Management
Replace Older Vehicles & Equipment
On-road, Non-road High Medium High
Austin Area Ozone Advance Program, 2012
Replacing or repowering older diesel vehicles and equipment with Tier 4 engines. Applicable to all pre‐2010 vehicles, TERP and other State's funding can be used.
All fleet owners, small and large companies
Fleet Management
Business Evaluation and Rightsizing of Fleet Usage
On-road, Non-road Low Medium Low
Austin Area Ozone Advance Program, 2012
Determine suitable fleet size and composition in terms of both overall number of vehicles and vehicle type; "rightsizing" evaluation, locates underutilized vehicles for reassignment or disposal.
All fleet owners, small and large companies
Regulation & Enforcement
Drive-Thru Service Restrictions On-road Low Fast Low DFW List of
Controls
Prohibit use of drive through lanes during the ozone season or high ozone alert days; encourage parking instead.
All
Regulation & Enforcement
Vehicle Idling Enforcement & Restriction
On-road High Fast Low Austin Area Ozone Advance Program, 2012
Limitation on idling by all vehicle types in certain parts of cities. Cities
Regulation & Enforcement
Regulating Use of Unpermitted Combustion Equipment
Non-road, Area Medium Medium Low
Austin Area Ozone Advance Program, 2012
Cities can pass ordinances that restrict the use of Non‐road equipment by private businesses, such as restricting idling, limiting the time of day certain equipment is used, or even simply requiring registration and reporting. Such restrictions can be placed on backup generators, to avoid testing generators during high ozone days.
Cities
Regulation & Enforcement
Open Burning Restrictions Area Low Fast Low
Austin Area Ozone Advance Program, 2012
Burning construction and demolition debris, yard wastes, and other natural vegetation releases smoke and NOX into the air.
Local Governments
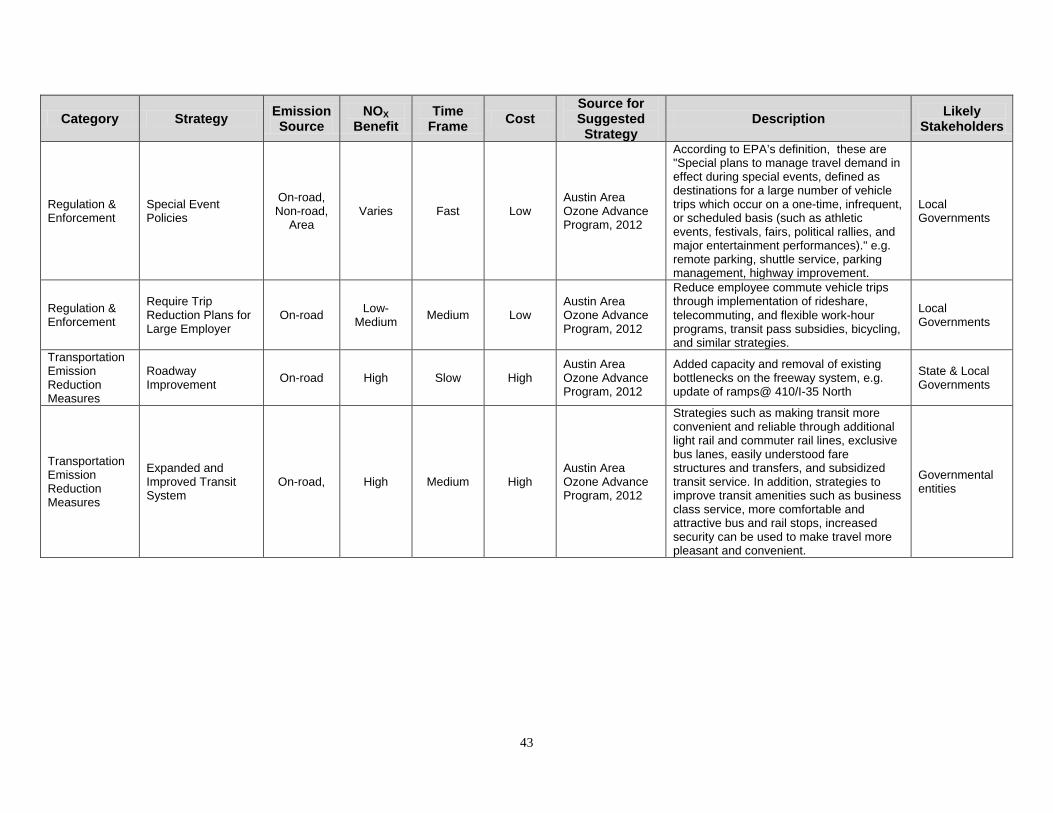
43
Category Strategy Emission Source
NOX Benefit
Time Frame Cost
Source for Suggested
Strategy Description Likely
Stakeholders
Regulation & Enforcement
Special Event Policies
On-road, Non-road,
Area Varies Fast Low
Austin Area Ozone Advance Program, 2012
According to EPA’s definition, these are "Special plans to manage travel demand in effect during special events, defined as destinations for a large number of vehicle trips which occur on a one-time, infrequent, or scheduled basis (such as athletic events, festivals, fairs, political rallies, and major entertainment performances)." e.g. remote parking, shuttle service, parking management, highway improvement.
Local Governments
Regulation & Enforcement
Require Trip Reduction Plans for Large Employer
On-road Low-Medium Medium Low
Austin Area Ozone Advance Program, 2012
Reduce employee commute vehicle trips through implementation of rideshare, telecommuting, and flexible work‐hour programs, transit pass subsidies, bicycling, and similar strategies.
Local Governments
Transportation Emission Reduction Measures
Roadway Improvement On-road High Slow High
Austin Area Ozone Advance Program, 2012
Added capacity and removal of existing bottlenecks on the freeway system, e.g. update of ramps@ 410/I-35 North
State & Local Governments
Transportation Emission Reduction Measures
Expanded and Improved Transit System
On-road, High Medium High Austin Area Ozone Advance Program, 2012
Strategies such as making transit more convenient and reliable through additional light rail and commuter rail lines, exclusive bus lanes, easily understood fare structures and transfers, and subsidized transit service. In addition, strategies to improve transit amenities such as business class service, more comfortable and attractive bus and rail stops, increased security can be used to make travel more pleasant and convenient.
Governmental entities
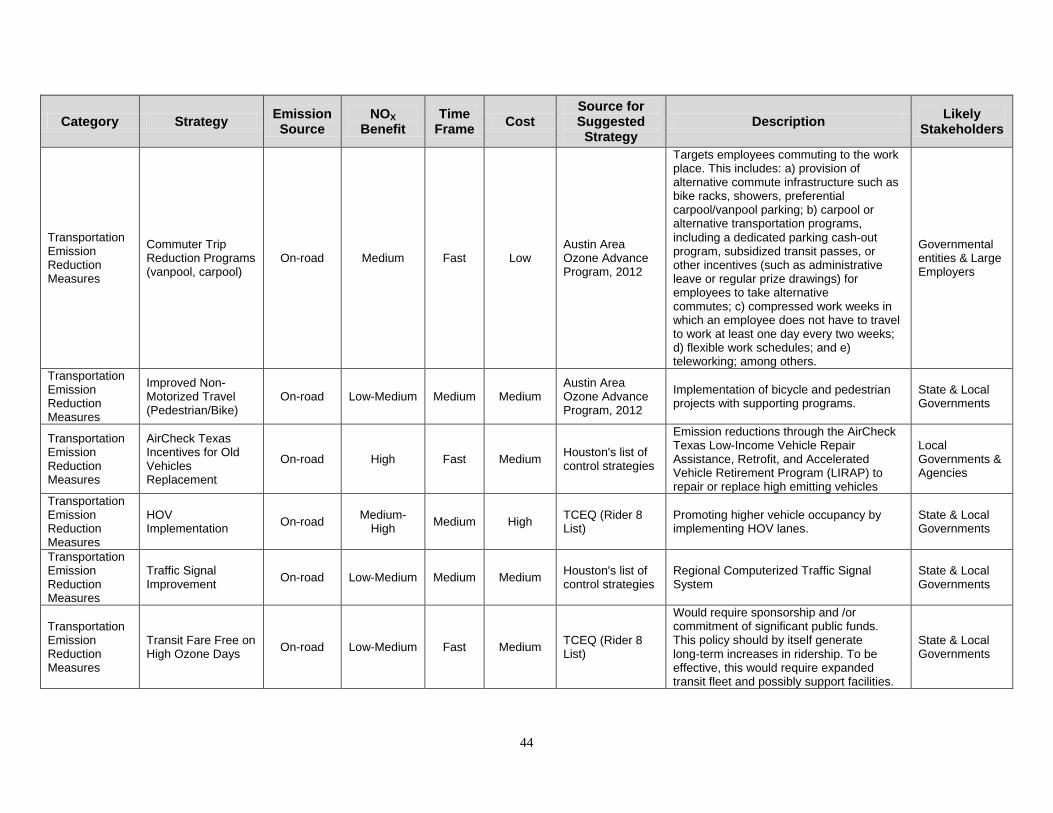
44
Category Strategy Emission Source
NOX Benefit
Time Frame Cost
Source for Suggested
Strategy Description Likely
Stakeholders
Transportation Emission Reduction Measures
Commuter Trip Reduction Programs (vanpool, carpool)
On-road Medium Fast Low Austin Area Ozone Advance Program, 2012
Targets employees commuting to the work place. This includes: a) provision of alternative commute infrastructure such as bike racks, showers, preferential carpool/vanpool parking; b) carpool or alternative transportation programs, including a dedicated parking cash‐out program, subsidized transit passes, or other incentives (such as administrative leave or regular prize drawings) for employees to take alternative commutes; c) compressed work weeks in which an employee does not have to travel to work at least one day every two weeks; d) flexible work schedules; and e) teleworking; among others.
Governmental entities & Large Employers
Transportation Emission Reduction Measures
Improved Non-Motorized Travel (Pedestrian/Bike)
On-road Low-Medium Medium Medium Austin Area Ozone Advance Program, 2012
Implementation of bicycle and pedestrian projects with supporting programs.
State & Local Governments
Transportation Emission Reduction Measures
AirCheck Texas Incentives for Old Vehicles Replacement
On-road High Fast Medium Houston's list of control strategies
Emission reductions through the AirCheck Texas Low-Income Vehicle Repair Assistance, Retrofit, and Accelerated Vehicle Retirement Program (LIRAP) to repair or replace high emitting vehicles
Local Governments & Agencies
Transportation Emission Reduction Measures
HOV Implementation On-road Medium-
High Medium High TCEQ (Rider 8 List)
Promoting higher vehicle occupancy by implementing HOV lanes.
State & Local Governments
Transportation Emission Reduction Measures
Traffic Signal Improvement On-road Low-Medium Medium Medium Houston's list of
control strategies Regional Computerized Traffic Signal System
State & Local Governments
Transportation Emission Reduction Measures
Transit Fare Free on High Ozone Days On-road Low-Medium Fast Medium TCEQ (Rider 8
List)
Would require sponsorship and /or commitment of significant public funds. This policy should by itself generate long‐term increases in ridership. To be effective, this would require expanded transit fleet and possibly support facilities.
State & Local Governments
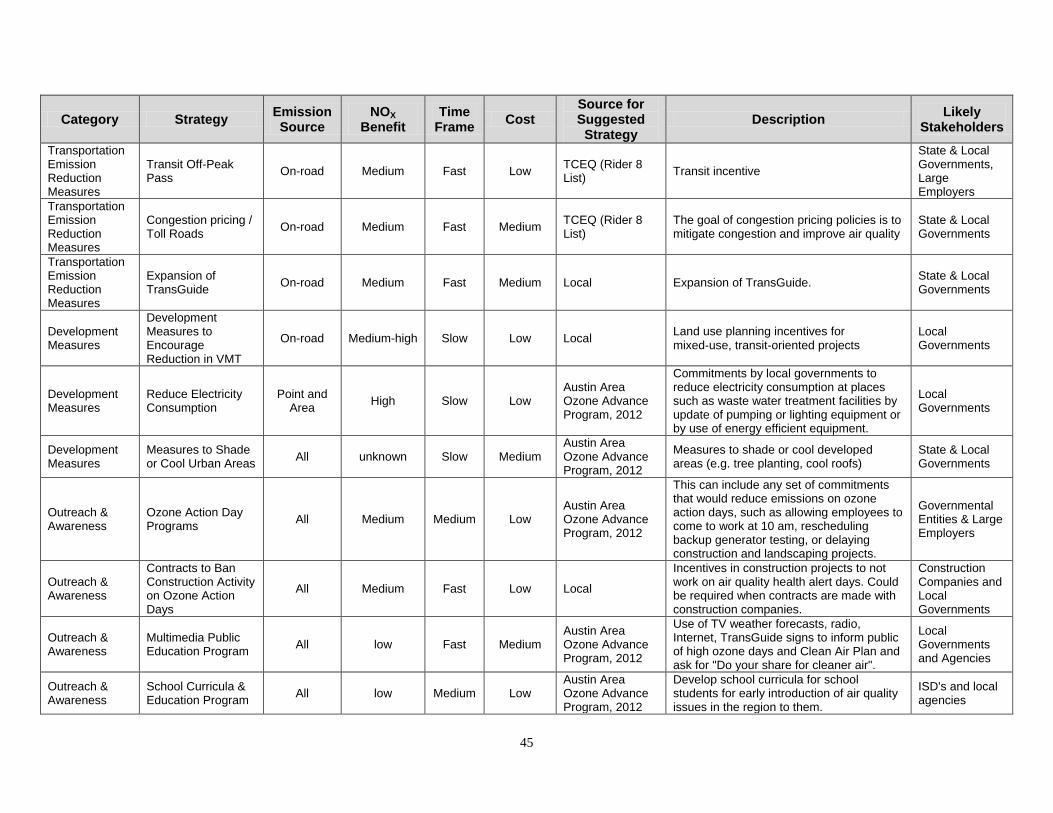
45
Category Strategy Emission Source
NOX Benefit
Time Frame Cost
Source for Suggested
Strategy Description Likely
Stakeholders Transportation Emission Reduction Measures
Transit Off-Peak Pass On-road Medium Fast Low TCEQ (Rider 8
List) Transit incentive
State & Local Governments, Large Employers
Transportation Emission Reduction Measures
Congestion pricing / Toll Roads On-road Medium Fast Medium TCEQ (Rider 8
List) The goal of congestion pricing policies is to mitigate congestion and improve air quality
State & Local Governments
Transportation Emission Reduction Measures
Expansion of TransGuide On-road Medium Fast Medium Local Expansion of TransGuide. State & Local
Governments
Development Measures
Development Measures to Encourage Reduction in VMT
On-road Medium-high Slow Low Local Land use planning incentives for mixed‐use, transit‐oriented projects
Local Governments
Development Measures
Reduce Electricity Consumption
Point and Area High Slow Low
Austin Area Ozone Advance Program, 2012
Commitments by local governments to reduce electricity consumption at places such as waste water treatment facilities by update of pumping or lighting equipment or by use of energy efficient equipment.
Local Governments
Development Measures
Measures to Shade or Cool Urban Areas All unknown Slow Medium
Austin Area Ozone Advance Program, 2012
Measures to shade or cool developed areas (e.g. tree planting, cool roofs)
State & Local Governments
Outreach & Awareness
Ozone Action Day Programs All Medium Medium Low
Austin Area Ozone Advance Program, 2012
This can include any set of commitments that would reduce emissions on ozone action days, such as allowing employees to come to work at 10 am, rescheduling backup generator testing, or delaying construction and landscaping projects.
Governmental Entities & Large Employers
Outreach & Awareness
Contracts to Ban Construction Activity on Ozone Action Days
All Medium Fast Low Local
Incentives in construction projects to not work on air quality health alert days. Could be required when contracts are made with construction companies.
Construction Companies and Local Governments
Outreach & Awareness
Multimedia Public Education Program All low Fast Medium
Austin Area Ozone Advance Program, 2012
Use of TV weather forecasts, radio, Internet, TransGuide signs to inform public of high ozone days and Clean Air Plan and ask for "Do your share for cleaner air".
Local Governments and Agencies
Outreach & Awareness
School Curricula & Education Program All low Medium Low
Austin Area Ozone Advance Program, 2012
Develop school curricula for school students for early introduction of air quality issues in the region to them.
ISD's and local agencies
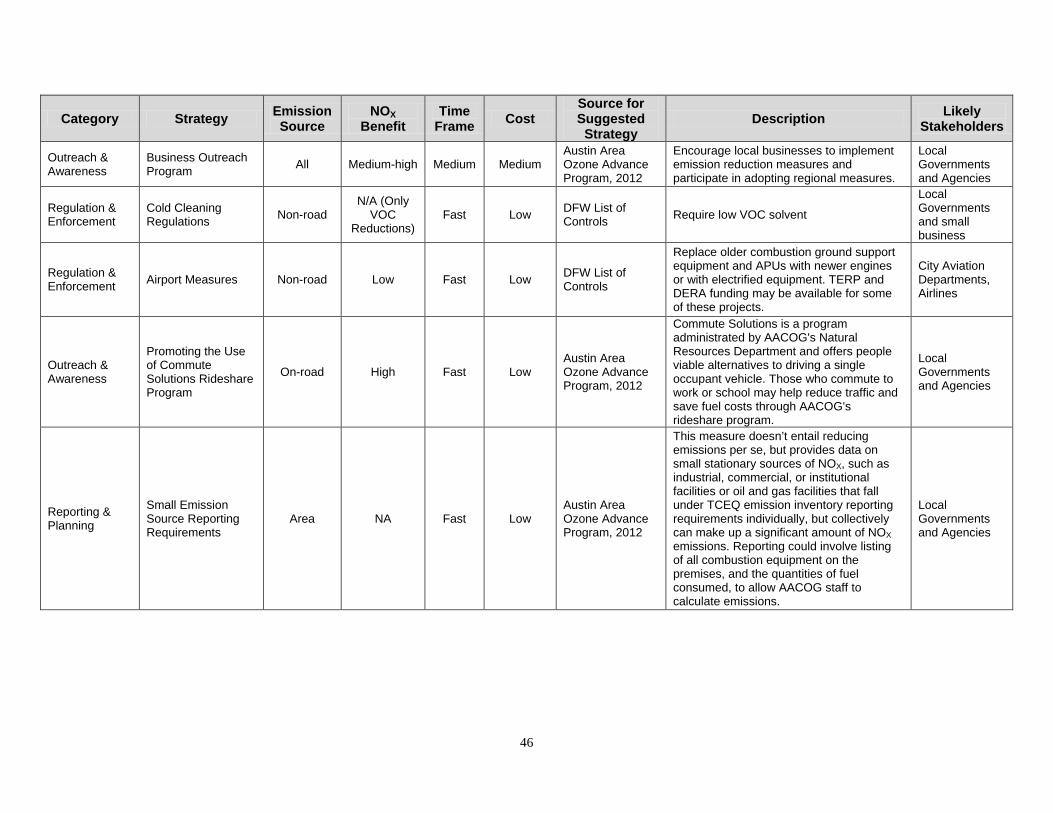
46
Category Strategy Emission Source
NOX Benefit
Time Frame Cost
Source for Suggested
Strategy Description Likely
Stakeholders
Outreach & Awareness
Business Outreach Program All Medium-high Medium Medium
Austin Area Ozone Advance Program, 2012
Encourage local businesses to implement emission reduction measures and participate in adopting regional measures.
Local Governments and Agencies
Regulation & Enforcement
Cold Cleaning Regulations Non-road
N/A (Only VOC
Reductions) Fast Low DFW List of
Controls Require low VOC solvent
Local Governments and small business
Regulation & Enforcement Airport Measures Non-road Low Fast Low DFW List of
Controls
Replace older combustion ground support equipment and APUs with newer engines or with electrified equipment. TERP and DERA funding may be available for some of these projects.
City Aviation Departments, Airlines
Outreach & Awareness
Promoting the Use of Commute Solutions Rideshare Program
On-road High Fast Low Austin Area Ozone Advance Program, 2012
Commute Solutions is a program administrated by AACOG's Natural Resources Department and offers people viable alternatives to driving a single occupant vehicle. Those who commute to work or school may help reduce traffic and save fuel costs through AACOG's rideshare program.
Local Governments and Agencies
Reporting & Planning
Small Emission Source Reporting Requirements
Area NA Fast Low Austin Area Ozone Advance Program, 2012
This measure doesn’t entail reducing emissions per se, but provides data on small stationary sources of NOX, such as industrial, commercial, or institutional facilities or oil and gas facilities that fall under TCEQ emission inventory reporting requirements individually, but collectively can make up a significant amount of NOX emissions. Reporting could involve listing of all combustion equipment on the premises, and the quantities of fuel consumed, to allow AACOG staff to calculate emissions.
Local Governments and Agencies
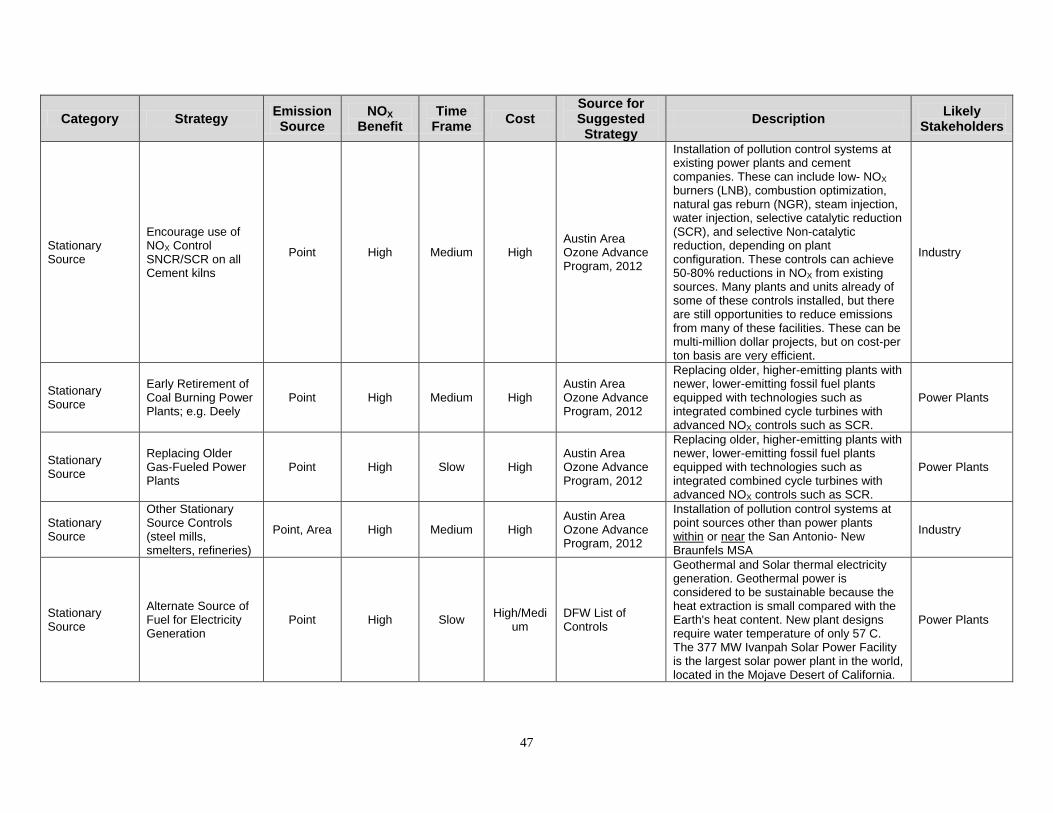
47
Category Strategy Emission Source
NOX Benefit
Time Frame Cost
Source for Suggested
Strategy Description Likely
Stakeholders
Stationary Source
Encourage use of NOX Control SNCR/SCR on all Cement kilns
Point High Medium High Austin Area Ozone Advance Program, 2012
Installation of pollution control systems at existing power plants and cement companies. These can include low- NOX burners (LNB), combustion optimization, natural gas reburn (NGR), steam injection, water injection, selective catalytic reduction (SCR), and selective Non-catalytic reduction, depending on plant configuration. These controls can achieve 50-80% reductions in NOX from existing sources. Many plants and units already of some of these controls installed, but there are still opportunities to reduce emissions from many of these facilities. These can be multi-million dollar projects, but on cost-per ton basis are very efficient.
Industry
Stationary Source
Early Retirement of Coal Burning Power Plants; e.g. Deely
Point High Medium High Austin Area Ozone Advance Program, 2012
Replacing older, higher-emitting plants with newer, lower-emitting fossil fuel plants equipped with technologies such as integrated combined cycle turbines with advanced NOX controls such as SCR.
Power Plants
Stationary Source
Replacing Older Gas-Fueled Power Plants
Point High Slow High Austin Area Ozone Advance Program, 2012
Replacing older, higher-emitting plants with newer, lower-emitting fossil fuel plants equipped with technologies such as integrated combined cycle turbines with advanced NOX controls such as SCR.
Power Plants
Stationary Source
Other Stationary Source Controls (steel mills, smelters, refineries)
Point, Area High Medium High Austin Area Ozone Advance Program, 2012
Installation of pollution control systems at point sources other than power plants within or near Industry the San Antonio- New Braunfels MSA
Stationary Source
Alternate Source of Fuel for Electricity Generation
Point High Slow High/Medium
DFW List of Controls
Geothermal and Solar thermal electricity generation. Geothermal power is considered to be sustainable because the heat extraction is small compared with the Earth's heat content. New plant designs require water temperature of only 57 C. The 377 MW Ivanpah Solar Power Facility is the largest solar power plant in the world, located in the Mojave Desert of California.
Power Plants
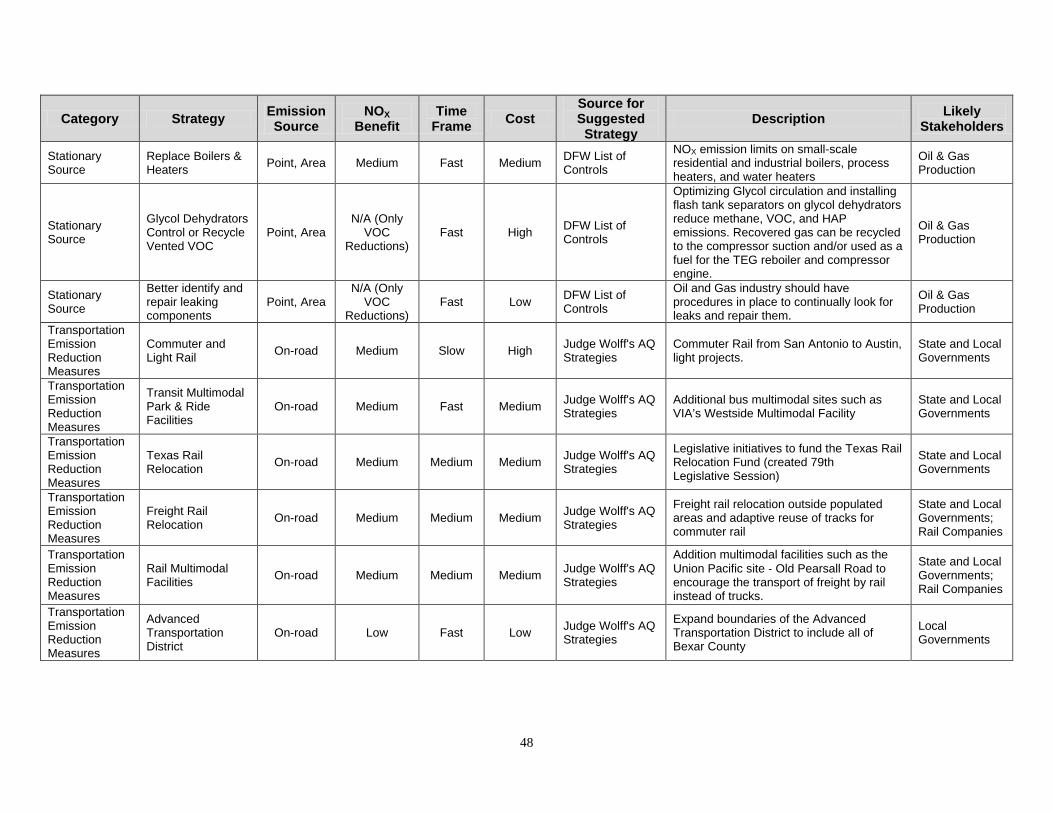
48
Category Strategy Emission Source
NOX Benefit
Time Frame Cost
Source for Suggested
Strategy Description Likely
Stakeholders
Stationary Source
Replace Boilers & Heaters Point, Area Medium Fast Medium DFW List of
Controls
NOX emission limits on small-scale residential and industrial boilers, process heaters, and water heaters
Oil & Gas Production
Stationary Source
Glycol Dehydrators Control or Recycle Vented VOC
Point, Area N/A (Only
VOC Reductions)
Fast High DFW List of Controls
Optimizing Glycol circulation and installing flash tank separators on glycol dehydrators reduce methane, VOC, and HAP emissions. Recovered gas can be recycled to the compressor suction and/or used as a fuel for the TEG reboiler and compressor engine.
Oil & Gas Production
Stationary Source
Better identify and repair leaking components
Point, Area N/A (Only
VOC Reductions)
Fast Low DFW List of Controls
Oil and Gas industry should have procedures in place to continually look for leaks and repair them.
Oil & Gas Production
Transportation Emission Reduction Measures
Commuter and Light Rail On-road Medium Slow High Judge Wolff's AQ
Strategies Commuter Rail from San Antonio to Austin, light projects.
State and Local Governments
Transportation Emission Reduction Measures
Transit Multimodal Park & Ride Facilities
On-road Medium Fast Medium Judge Wolff's AQ Strategies
Additional bus multimodal sites such as VIA’s Westside Multimodal Facility
State and Local Governments
Transportation Emission Reduction Measures
Texas Rail Relocation On-road Medium Medium Medium Judge Wolff's AQ
Strategies
Legislative initiatives to fund the Texas Rail Relocation Fund (created 79th Legislative Session)
State and Local Governments
Transportation Emission Reduction Measures
Freight Rail Relocation On-road Medium Medium Medium Judge Wolff's AQ
Strategies
Freight rail relocation outside populated areas and adaptive reuse of tracks for commuter rail
State and Local Governments; Rail Companies
Transportation Emission Reduction Measures
Rail Multimodal Facilities On-road Medium Medium Medium Judge Wolff's AQ
Strategies
Addition multimodal facilities such as the Union Pacific site ‐ Old Pearsall Road to encourage the transport of freight by rail instead of trucks.
State and Local Governments; Rail Companies
Transportation Emission Reduction Measures
Advanced Transportation District
On-road Low Fast Low Judge Wolff's AQ Strategies
Expand boundaries of the Advanced Transportation District to include all of Bexar County
Local Governments
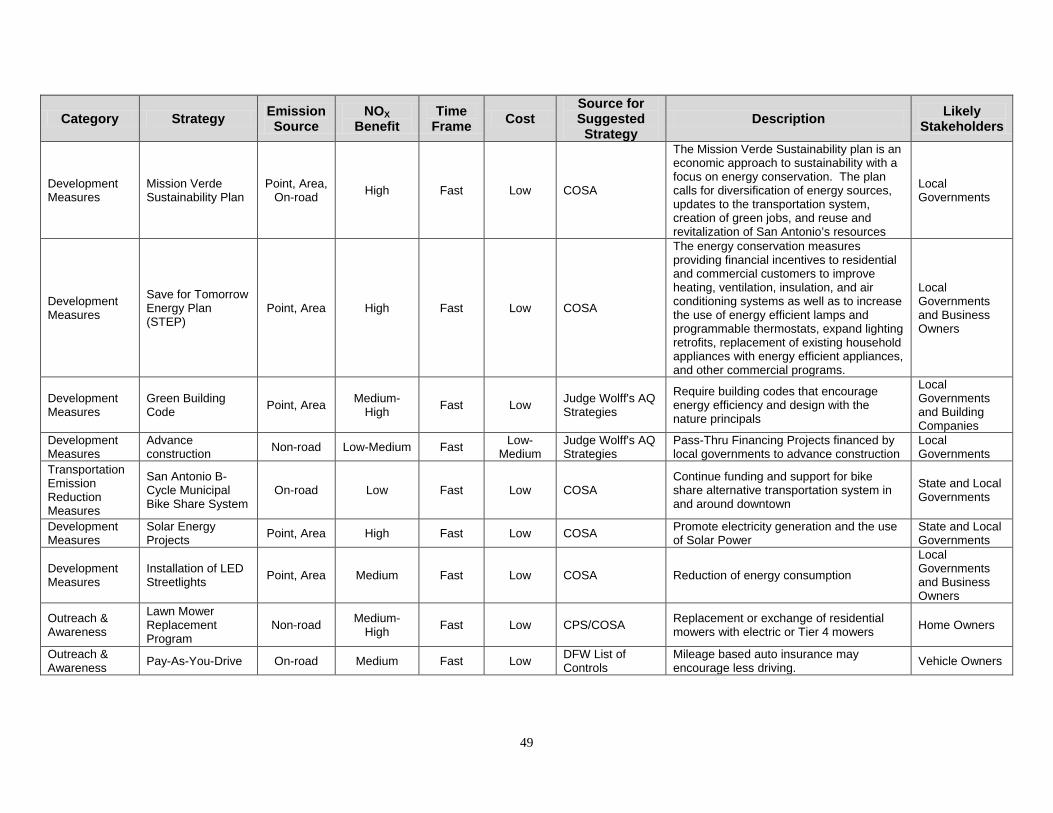
49
Category Strategy Emission Source
NOX Benefit
Time Frame Cost
Source for Suggested
Strategy Description Likely
Stakeholders
Development Measures
Mission Verde Sustainability Plan
Point, Area, On-road High Fast Low COSA
The Mission Verde Sustainability plan is an economic approach to sustainability with a focus on energy conservation. The plan calls for diversification of energy sources, updates to the transportation system, creation of green jobs, and reuse and revitalization of San Antonio’s resources
Local Governments
Development Measures
Save for Tomorrow Energy Plan (STEP)
Point, Area High Fast Low COSA
The energy conservation measures providing financial incentives to residential and commercial customers to improve heating, ventilation, insulation, and air conditioning systems as well as to increase the use of energy efficient lamps and programmable thermostats, expand lighting retrofits, replacement of existing household appliances with energy efficient appliances, and other commercial programs.
Local Governments and Business Owners
Development Measures
Green Building Code Point, Area Medium-
High Fast Low Judge Wolff's AQ Strategies
Require building codes that encourage energy efficiency and design with the nature principals
Local Governments and Building Companies
Development Measures
Advance construction Non-road Low-Medium Fast Low-
Medium Judge Wolff's AQ Strategies
Pass-Thru Financing Projects financed by local governments to advance construction
Local Governments
Transportation Emission Reduction Measures
San Antonio B-Cycle Municipal Bike Share System
On-road Low Fast Low COSA Continue funding and support for bike share alternative transportation system in and around downtown
State and Local Governments
Development Measures
Solar Energy Projects Point, Area High Fast Low COSA Promote electricity generation and the use
of Solar Power State and Local Governments
Development Measures
Installation of LED Streetlights Point, Area Medium Fast Low COSA Reduction of energy consumption
Local Governments and Business Owners
Outreach & Awareness
Lawn Mower Replacement Program
Non-road Medium-High Fast Low CPS/COSA Replacement or exchange of residential
mowers with electric or Tier 4 mowers Home Owners
Outreach & Awareness Pay-As-You-Drive On-road Medium Fast Low DFW List of
Controls Mileage based auto insurance may encourage less driving. Vehicle Owners
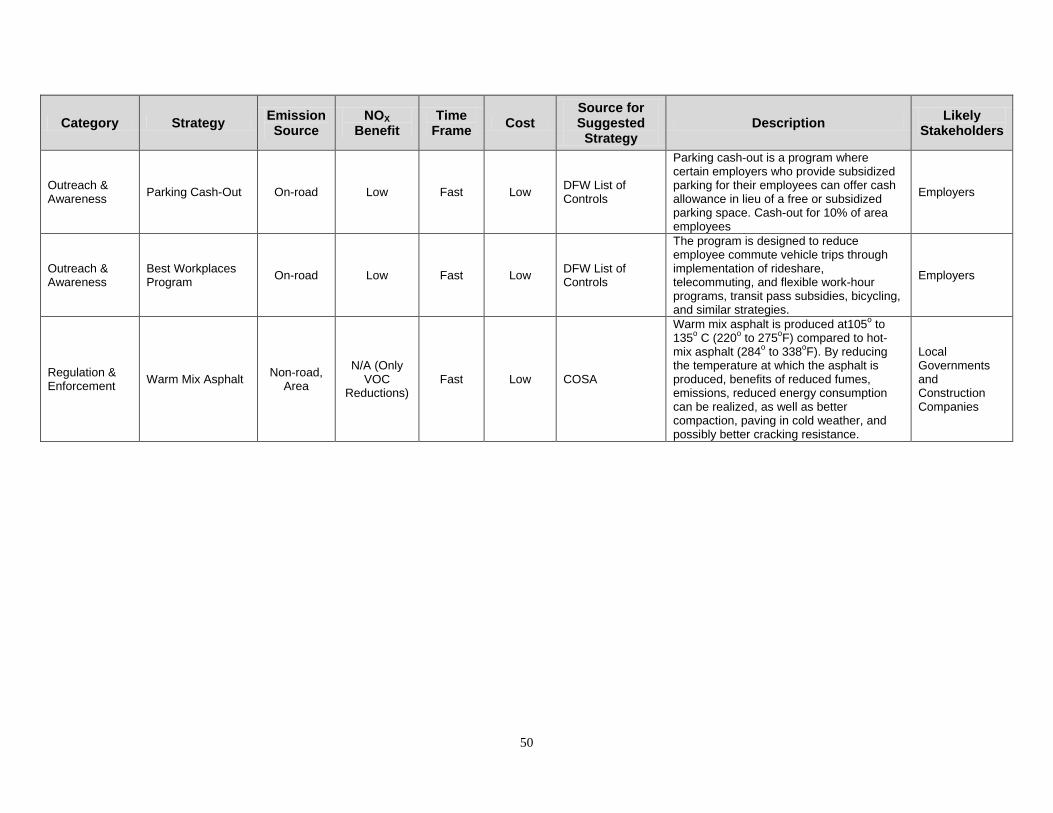
50
Category Strategy Emission Source
NOX Benefit
Time Frame Cost
Source for Suggested
Strategy Description Likely
Stakeholders
Outreach & Awareness Parking Cash-Out On-road Low Fast Low DFW List of
Controls
Parking cash-out is a program where certain employers who provide subsidized parking for their employees can offer cash allowance in lieu of a free or subsidized parking space. Cash-out for 10% of area employees
Employers
Outreach & Awareness
Best Workplaces Program On-road Low Fast Low DFW List of
Controls
The program is designed to reduce employee commute vehicle trips through implementation of rideshare, telecommuting, and flexible work-hour programs, transit pass subsidies, bicycling, and similar strategies.
Employers
Regulation & Enforcement Warm Mix Asphalt Non-road,
Area
N/A (Only VOC
Reductions) Fast Low COSA
Warm mix asphalt is produced at105o to 135o C (220o to 275oF) compared to hot-mix asphalt (284o to 338oF). By reducing the temperature at which the asphalt is produced, benefits of reduced fumes, emissions, reduced energy consumption can be realized, as well as better compaction, paving in cold weather, and possibly better cracking resistance.
Local Governments and Construction Companies
