alaska department of environmental conservation …
TRANSCRIPT

ALASKA DEPARTMENT OF ENVIRONMENTAL CONSERVATION
Air Permits Program
TECHNICAL ANALYSIS REPORT for
Air Quality Control Construction Permit AQ0934CPT01
Donlin Gold LLC Donlin Gold Project
MINE CONSTRUCTION
Prepared by: Brittany Crutchfield Supervisor: Patrick Dunn Date: Final – June 30, 2017
G:\AQ\PERMITS\AIRFACS\Donlin\Construct\AQ0934CPT01\Prelim\AQ0934CPT01 Pre TAR.docx

Donlin Gold LLC – Donlin Gold Project Final – June 30, 2017 Construction Permit AQ0934CPT01
Page 2 of 88
Table of Contents 1. INTRODUCTION ............................................................................................................. 4
1.1 Description of Source ........................................................................................................ 4 1.2 Application Description ..................................................................................................... 4 1.3 Project Description ............................................................................................................ 4 1.4 PSD Description ................................................................................................................ 6
2. EMISSIONS SUMMARY AND PERMIT APPLICABILITY ........................................ 7
2.1. Emissions Summary and Permit Applicability .................................................................. 7 2.2. Department Findings ....................................................................................................... 10
3. PSD PERMIT REQUIREMENTS .................................................................................. 11
3.1. State Emission Standards................................................................................................. 12 3.1.1. 18 AAC 50.055(a)(1): Industrial Process and Fuel-Burning VE Standards ................ 13 3.1.2. 18 AAC 50.055(b)(1): Industrial Process and Fuel-Burning PM Standards................ 13 3.1.3. 18 AAC 50.055(c): Sulfur Compound Emissions Standards ....................................... 13 3.1.4. 18 AAC 50.050: Incinerator Emission Standards ........................................................ 13 3.2. Standard Permit Conditions ............................................................................................. 13
4. PERMIT ADMINISTRATION ....................................................................................... 13
APPENDIX A: EMISSIONS CALCULATIONS ........................................................................ 15
APPENDIX B: BEST AVAILABLE CONTROL TECHNOLOGY ........................................... 25
APPENDIX C: BACT SUMMARY ............................................................................................. 85
APPENDIX D: MODELING REPORT ....................................................................................... 88

Donlin Gold LLC – Donlin Gold Project Final – June 30, 2017 Construction Permit AQ0934CPT01
Page 3 of 88
Abbreviations/Acronyms AAC ..............................Alaska Administrative Code AAAQS .........................Alaska Ambient Air Quality Standards BACT ............................Best Available Control Technology CAA .............................Clean Air Act C.F.R. ............................Code of Federal Regulations Department ....................Alaska Department of Environmental Conservation DLN ...............................Dry Low NOx EPA ...............................Environmental Protection Agency EU..................................Emission Unit HAP ...............................Hazardous Air Pollutant MR&R ...........................Monitoring, Recording, and Reporting NA .................................Not Applicable NESHAPS .....................National Emission Standards for Hazardous Air Pollutants NSPS .............................New Source Performance Standards ORL ...............................Owner Requested Limit PSD................................Prevention of Significant Deterioration PTE ................................Potential to Emit RICE, ICE .....................Reciprocating Internal Combustion Engine, Internal Combustion Engine SCR ...............................Selective Catalytic Reduction SIP .................................Alaska State Implementation Plan TAR ...............................Technical Analysis Report ULSD ............................Ultra Low Sulfur Diesel VE..................................Visible Emissions
Units and Measures gal/hr ..............................gallons per hour g/kWh ............................grams per kilowatt hour g/hphr ............................grams per horsepower hour hr/day .............................hours per day hr/yr ...............................hours per year hp ...................................horsepower lb/hr ...............................pounds per hour lb/MMBtu ......................pounds per million British thermal units lb/1000 gal .....................pounds per 1,000 gallons kW .................................kilowatts MMBtu/hr ......................million British thermal units per hour MMscf/hr .......................million standard cubic feet per hour ppmv ..............................parts per million by volume tpy ..................................tons per year
Pollutants CO .................................Carbon Monoxide CO2e ..............................Carbon Dioxide Equivalent GHG ..............................Greenhouse Gases HAP ...............................Hazardous Air Pollutant NOx ...............................Oxides of Nitrogen PM .................................Particulate Matter PM-2.5 ...........................Particulate Matter with an aerodynamic diameter not exceeding 2.5 microns PM-10 ............................Particulate Matter with an aerodynamic diameter not exceeding 10 microns SO2 ................................Sulfur Dioxide VOC ..............................Volatile Organic Compound

Donlin Gold LLC – Donlin Gold Project Final – June 30, 2017 Construction Permit AQ0934CPT01
Page 4 of 88
1. INTRODUCTION This Technical Analysis Report (TAR) provides the Alaska Department of Environmental Conservation’s (Department’s) basis for issuing Air Quality Control Construction Permit AQ0934CPT01 to Donlin Gold LLC (Donlin) for their Donlin Gold Project (DGP). The project triggers Prevention of Significant Deterioration (PSD) review under 18 AAC 50.306 for oxides of nitrogen (NOx), carbon monoxide (CO), particulate matter (PM), particulate matter with an aerodynamic diameter not exceeding 10 microns (PM-10), particulate matter with an aerodynamic diameter not exceeding 2.5 microns (PM-2.5), volatile organic compounds (VOCs), and greenhouse gases (GHGs). This project is classified under 18 AAC 50.502(b)(3) for the construction, operation, or relocation of a stationary source containing a rock crusher with a rated capacity of at least five tons per hour. The project also includes an Owner Requested Limit (ORL) under 18 AAC 50.508(5) to avoid PSD review for sulfur dioxide (SO2) and to avoid Hazardous Air Pollutants major classification. Owner Requested Limit AQ0934ORL01 will be rescinded upon issuance of Construction Permit AQ0934CPT01.
1.1 Description of Source The DGP is an existing stationary source located on the western slopes of the Kuskokwim Mountains in the Yukon-Kuskokwim region of southwestern Alaska, approximately 280 miles west of Anchorage.
Donlin currently operates the stationary source under Owner Requested Limit AQ0934ORL01 issued January 9, 2009. This limit allowed Donlin to install and operate two electric generators, a waste incinerator, an auxiliary generator, and two standby generators while avoiding all permitting obligations under AS 46.14.130.
1.2 Application Description Donlin submitted an application for this project on October 15, 2015 and submitted several addenda through April 4, 2017. Donlin is requesting authorization to install and operate reciprocating internal combustion engines, boilers, heaters, autoclaves, incinerators, a gyratory crusher, a pebble crusher, carbon regeneration kilns, electrowinning circuit cells, a smelting furnace, a mercury retort, laboratories, and a tank farm to support gold mining and processing.
1.3 Project Description The DGP deposit consists of two main areas, ACMA and Lewis, which will ultimately be mined as a single open pit. In addition to the mining operations Donlin will be constructing a natural gas pipeline, a power generation facility, an onsite employee accommodation complex, roads, ports, shipping and barging infrastructure, and an airstrip. This permitting action covers only the mining and processing operations, power generation facility, haul roads, camp to mine site access road, airport to camp access road, and emission units supporting the onsite employee accommodation complex and airstrip. Mining operations at DGP include surveying and drilling of blast holes. Donlin will use an ammonium nitrate and fuel oil (ANFO)-based explosive emulsion for blasting. Ore and waste will be loaded by front-end loaders and hydraulic shovels into end-dump haul trucks. The trucks will haul the waste rock to the waste rock facility while ore will be hauled to the gyratory crusher. From the gyratory crusher the ore will be directly fed to the gyratory crusher dump pocket with a rock breaker or stockpiled. Alternatively, the ore could be hauled to a long-term ore stockpile before being taken to the gyratory crusher.

Donlin Gold LLC – Donlin Gold Project Final – June 30, 2017 Construction Permit AQ0934CPT01
Page 5 of 88
Ore will be discharged from the gyratory crusher dump pocket onto the discharge conveyor and transferred to the stockpile feed conveyor where it will be discharged onto a covered coarse ore stockpile. The course ore will be transferred via four reclaim apron feeders to the semi-autogenous grinding (SAG) mill feed conveyor for transport to the SAG mill. Donlin will utilize an open circuit SAG mill followed by a “mill-chemical-float-mill-chemical-float” (MCF2) circuit for the grinding process. Copper sulfate will be added to the SAG mill feed to activate sulfide mineralization. Discharge from the SAG mill will be screened to send oversized pebbles to two large cone pebble crushers. The oversized pebbles will be returned to the SAG mill feed via conveyors after passing through the pebble crushers. The MCF2 circuit following the SAG mill will consist of a primary ball mill and primary rougher flotation followed by a secondary ball mill, secondary rougher flotation, and thickening. During this process several reagents, such as acidic solution from the pressure oxidation (POX) counter-current decantation (CCD), washing circuit, lime, copper sulfate, potassium amyl xanthate, soda ash, caustic soda, flocculants, dispersants, and frothers, will be added to condition the concentration slurry. Donlin will install associated process equipment for reagent handling and mixing. The thickener concentrate from the MCF2 process will proceed to an acidulation circuit. Acidic solution recovered from the POX CCD washing circuit will be added to the concentrate slurry to reduce the carbonate gangue component. The acidulated concentrate slurry will be washed in a three-thickener CCD circuit to remove chlorides and pumped to the POX circuit. Concentrate POX is carried out in one of two autoclaves operating in parallel. High-pressure steam will be supplied to the process when needed by two dual-fuel POX boilers. The dual-fuel oxygen plant boiler will provide high pressure oxygen gas for the POX reaction. Discharge from the autoclaves will be sent to flash vessels to depressurize the autoclaved concentrate slurry. The slurry will then be transferred to three POX hot cure tanks. After the POX circuit the concentrate slurry will be washed in a four-thickener CCD circuit. Washed concentrate slurry in the underflow from the final thickener will be pumped to the CIL solids neutralization circuit and the overflow will be clarified and used within the plant to provide acidification to the acidulation circuit. The CIL neutralization circuit will consist of mechanically agitated tanks where lime slurry will be added to the concentrate slurry in the presence of oxygen to bring the pH to approximately 9 before being pumped to the CIL circuit. The carbon-in-leach (CIL) circuit will consist of six CIL tanks that will hold the concentrate slurry for four hours. Here a sodium cyanide solution will be pumped into the CIL circuit for cyanide leaching. Lime slurry and caustic soda will be added to maintain a pH of approximately 10.5.
Donlin Gold LLC – Donlin Gold Project Final – June 30, 2017 Construction Permit AQ0934CPT01
Page 6 of 88
After the CIL circuit will be the cyanide destruction system which include an agitated tank where compressed air and gaseous SO2 generated in the SO2 burner will be added to oxidize the residual cyanide. Copper sulfate solution will be added to maintain the reaction kinetics and lime slurry will be used to maintain the pH level. The loaded carbon from the CIL circuit will then be washed with a 3 percent nitric acid solution, neutralized with a caustic solution in two acid wash vessels, and pumped to two strip vessels. A solution of 1 percent sodium hydroxide and 1 percent sodium cyanide will be added to the strip vessels to strip the gold adsorbed on the carbon. The dual-fuel carbon elution heater will provide the hot glycol solution for the heat exchanger that the pregnant solution passes through after the strip vessels. After the heat exchanger the stripped carbon will be washed and sent to the carbon regeneration kiln for reuse in the CIL circuit, and the pregnant solution will be sent to the pregnant solution tank. The pregnant solution will then be pumped through two parallel trains of electrowinning cells to remove the precious metals. The remaining solution will be sent to the barren solution tanks for recirculation through the strip vessels. The precious metal bearing sludge from the electrowinning circuit will be washed, press-filtered, and loaded into the mercury retort. Here it will be electrically heated for 12 hours to remove mercury. After the mercury retort, the sludge will be mixed with smelting fluxes and charged to the induction smelting furnace. Doré bars will be poured from the smelting furnace and shipped offsite for additional refining. Donlin will generate electric power from a dual-fuel reciprocating engine onsite power plant with a steam turbine. The power plant will consist of 12 engines rated at 17 MW each, a steam turbine, two black start ULSD generators rated at 600 kW (used to restore power plant operations if there is a plant shutdown), and two ULSD fired engines rated at 200 kW each will be used to power the airstrip and associated operations. Additional units include SO2 burners, heaters, building space heating, a water conditioning system, a camp waste incinerator, a sewage sludge incinerator, a sample preparation laboratory, an assay analysis laboratory, a metallurgical analysis laboratory, and multiple fuel tanks.
1.4 PSD Description The basic elements of the PSD program may be found in Title I, Part C of the Clean Air Act (CAA). Congress developed the program to protect public health, preserve, protect and enhance air quality in national areas of interest, ensure that economic growth will occur in a manner consistent with the preservation of existing clean air resources and ensure permitting decisions are made after careful evaluation of all consequences. EPA promulgated the detailed requirements in 40 C.F.R. 51.166 (PSD requirements within a State Implementation Plan) and 40 C.F.R. 52.21 (federal implementation of the PSD program). The Department has adopted the various aspects of the federal PSD program by reference in 18 AAC 50.040(h), and requires PSD applicants to follow those provisions, except as noted, in 18 AAC 50.306.

Donlin Gold LLC – Donlin Gold Project Final – June 30, 2017 Construction Permit AQ0934CPT01
Page 7 of 88
40 C.F.R. 52.21(b)(1) of the federal PSD regulations defines a “major stationary source” as either (a) any of 28 designated stationary source categories with potential emissions of 100 tons per year (tpy) or more of any regulated attainment pollutant, (b) any other stationary source with potential emissions of 250 tpy or more of any regulated attainment pollutant, or (c) any physical change that would occur at a stationary source that would constitute a major stationary source by itself.
In addition, once a new stationary source has been determined to be a “major” source, it is subject to PSD review for each regulated attainment pollutant that the source would have the potential to emit in “significant” amounts, which in some cases is lower than the “major” thresholds. 40 C.F.R. 52.21(b)(50)(iv) includes pollutants “subject to regulation” as defined in 40 C.F.R. 52.21(b)(49) as regulated pollutants. For this project, Greenhouse Gas (GHG) emissions become a regulated pollutant if the project’s total GHG emissions on a CO2e basis equal or exceed 75,000 tpy.
1.5 Jungjuk Port and Port to Mine Access Road Donlin intends to construct a port along the Kuskokwim River near Jungjuk Creek/Angyaruaq to support DGP. The Department determined on July 16, 2014 that the mine and port sites are separate stationary sources for air quality permitting purposes. The port emissions are therefore not included, nor authorized, in Construction Permit AQ0934CPT01. Donlin will need to submit a separate air quality permit application, if warranted, to seek Department approval to construct and operate the port site. Donlin also intends to construct a 28-mile-long access road between the Jungjuk port and mine site to transport the cargo and supplies needed for DGP. The port to mine access road is not part of the DGP major stationary source, and therefore, the emissions are not included in Construction Permit AQ0934CPT01. Donlin will not need an air quality control permit to construct or operate the port to mine access road. However, they will need to control the fugitive dust emissions, as required under 18 AAC 50.045(d).
2. EMISSIONS SUMMARY AND PERMIT APPLICABILITY 2.1. Emissions Summary and Permit Applicability
Donlin is proposing to make physical changes that will classify the stationary source as a PSD “major stationary source” under 40 C.F.R. 52.21(b)(1)(i)(c). Potential emissions from the proposed project are significant for seven different PSD pollutants: NOx, CO, PM, PM-10, PM-2.5, VOC, and GHG.

Donlin Gold LLC – Donlin Gold Project Final – June 30, 2017 Construction Permit AQ0934CPT01
Page 8 of 88
Table 1 lists total facility potential to emit1 (PTE) relative to the PSD major source thresholds under 40 C.F.R. 52.21(b)(1)(i)(b) and the significant emissions rates under 40 C.F.R. 52.21(b)(23)(i) and 40 C.F.R. 52.21(b)(49)(iii) for PSD regulated pollutants. Fugitive emissions are not included in determining major stationary source status, per 40 C.F.R. 52.21(b)(1)(iii). However, fugitive emissions are included when comparing the project emissions to the significant emission rates.
1 PTE for the DGP were determined based on the maximum emission rates for the life of the mine.

Donlin Gold LLC – Donlin Gold Project Final – June 30, 2017 Construction Permit AQ0934CPT01
Page 9 of 88
Table 1: Major Source and PSD Review Applicability Description CO NOx PM-2.5 PM-10 PM SO2 VOC CO2e1 PTE for AQ0934CPT01 excluding fugitive emissions
1,255.8 1,230.2 598.9 599.5 610.6 25.6 1,167.6 1,731,120
Major Source Threshold 250 250 250 250 250 250 250 N/A Major Source Triggered? Yes Yes Yes Yes Yes No Yes No PTE for AQ0934CPT01 including fugitive emissions
3,177.0 1,281.8 809.1 1,9633 5,255.6 25.7 1,167.6 1,764,266
PSD Significant Emissions Rates 100 40 102 15 25 40 403 75,000
PSD Review Triggered? Yes Yes Yes Yes Yes No Yes Yes Table Notes: 1GHGs are subject to regulation because the stationary source is major for a non-GHG pollutant and the CO2e is at least 75,000 tpy. 2PSD review for PM-2.5 can also be triggered by NOx and SO2 precursor emissions, as specified under 40 C.F.R. 52.21(b)(23)(i).
3VOC acts as a surrogate for ozone (O3). In addition to the VOC emissions trigger, PSD review for O3 can also be triggered by NOx emissions, as specified under 40 C.F.R. 52.21(b)(23)(i).
CO, NOx, PM-2.5, PM-10, PM, and VOC emissions are all over the 250 ton per year major source threshold found in 40 C.F.R. 52.21(b)(1)(i)(b), therefore the source is subject to PSD review for each regulated NSR pollutant where the PTE is at least the significant emission rate. As shown in

Donlin Gold LLC – Donlin Gold Project Final – June 30, 2017 Construction Permit AQ0934CPT01
Page 10 of 88
Table 1 SO2 is the only NSR pollutant not subject to PSD review.
Table 2 shows a summary of the project’s PTE for CO, NOx, PM-2.5, PM-10, PM, VOC, and SO2 for determining assessable emissions. Fugitive emissions are included in Table 2. Detailed emissions calculations are included in Appendix A.
Table 2: Emissions from Stationary EUs at DGP, Tons per Year Description CO NOx PM-2.5 PM-10 PM SO2 VOC
PTE for AQ0934CPT01 3,177.0 1,281.8 809.1 1,9633 5,255.6 25.7 1,164.6
Assessable Emissions 3,177 1,282 N/A1 N/A1 5,256 26 1,165
10,906 Table Notes:
1 Camp Units not included in assessable emissions because they will be operated for a limited time as described in Section 2.2
Total assessable emissions for the source are 10,908 tpy.
Donlin’s application shows that the source’s PTE hazardous air pollutants (HAPs) are 23.0 tpy with the highest one at 9.7 tpy.
2.2. Department Findings Based on the review of the application, the Department finds that:
1. The DGP is classified as a major stationary source under 40 C.F.R. 52.21(b)(1)(i)(c) because the change to the stationary source by itself has the potential to emit at least 250 tpy of a regulated air pollutant.
2. The DGP has potential NOx, CO, PM, PM-10, PM-2.5, VOC, and GHG emissions that are PSD significant, per 40 C.F.R. 52.21(b)(23)(i) and 40 C.F.R. 52.21(b)(49)(iii). The GHGs are subject to regulation per 40 C.F.R. 52.21(b)(49)(iv)(a). Therefore, the project requires a PSD permit under 18 AAC 50.306(a) for these pollutants.
3. The Department included three mobile sources (water truck, grader, and dozer) in the emission unit inventory table of AQ0934CPT01. The tail pipe emissions of these mobile sources are not regulated under AQ0934CPT01, however these mobile sources are sources of fugitive dust and those emissions are included for permit applicability and assessable emissions.
4. Because Donlin is requesting ORLs the project is also classified under 18 AAC 50.508(5). This project is additionally classified under 18 AAC 50.502(b)(3) for the construction, operation, or relocation of a stationary source containing a rock crusher with a rated capacity of at least five tons per hour.
5. The project does not trigger a minor permit under 18 AAC 50.502(c)(3) or 18 AAC50.502(c)(4) for SO2.

Donlin Gold LLC – Donlin Gold Project Final – June 30, 2017 Construction Permit AQ0934CPT01
Page 11 of 88
6. Donlin requested a limit to use only ULSD as fuel for any diesel fuel burning equipment to avoid PSD review for SO2. The Department has included conditions to comply with the requested SO2 limit. The Department included both an operational limit and a tpy limit consistent with EPA policy on limiting PTE.
7. Donlin requested an emission limit for formaldehyde on EU IDs 1 through 12 to avoid classification as a HAPs major stationary source. The Department included both an operational limit and a tpy limit consistent with EPA policy on limiting PTE. The operational limit includes conditions for installation, operation, and maintenance of an oxidation catalyst to comply with the requested emission limit. The Department also included an initial source test requirement while firing natural gas. Unrestricted HAPs emissions from these units is not a concern while firing ULSD. Source testing is required on three of the units to account for emission rate variability among the twelve units.
8. Donlin proposed purchasing a camp waste incinerator (EU ID 27) that meets the control and emission standards required by 40 C.F.R. 60 Subpart CCCC.
9. For compliance with the BACT emission limits the Department required initial source testing for larger units with add-on controls. BACT limits for EU IDs 1 through 12 require source testing on three units, instead of one, as representation for all of the units to limit emission rate variability between the twelve units. Smaller units that are not likely to exceed the BACT limits are required to either submit to the Department a manufacturer’s guarantee that the units will meet the BACT limits or source test the units to show they meet the BACT requirements.
10. The Department must rescind AQ0934ORL01 issued under 18 AAC 50.225 upon issuance of Construction Permit AQ0934CPT01 since AQ0934ORL01 will no longer allow Donlin to avoid all permitting obligations under AS 46.14.130. The title page of Construction Permit AQ0934CTP01 notes that the permit rescinds AQ0934ORL01.
11. Donlin needs to continue operating the existing EUs authorized under AQ0934ORL01 prior to commencing construction of the mine. Therefore, the Department incorporated the existing EU inventory and operational limits described in AQ0934ORL01 into Construction Permit AQ0934CPT01. However, Donlin will need to decommission/remove the existing EUs shortly after the new EUs of equivalent purpose become fully operational since they did not include the existing EUs in their ambient demonstration. The ambient air section of Construction Permit AQ0934CPT01 includes the authorization to continue operating the existing EUs during this interim period, as well as the requirement to decommission/remove the existing EUs once the replacement units become operational. The Department is taking this approach because AQ0934ORL01 ensures compliance with the Alaska Ambient Air Quality Standards (AAAQS) while allowing Donlin to avoid a minor permit.
3. PSD PERMIT REQUIREMENTS PSD applicants must comply with the requirements of 40 C.F.R. 52.21, except as noted in 18 AAC 50.306.
40 C.F.R. 52.21(j)(1) requires that the major stationary source meet the applicable local

Donlin Gold LLC – Donlin Gold Project Final – June 30, 2017 Construction Permit AQ0934CPT01
Page 12 of 88
standards, state requirements established in the Alaska State Implementation Plan (SIP), and federal standards of performance in 40 C.F.R. 60 and 61. The source must meet each applicable state and federal emissions standard described in Sections 3.1 and 3.2 of this TAR, the standards and associated monitoring requirements will be carried forward into the Title V operating permit for the source. 40 C.F.R. 52.21(j)(2) requires a major stationary source to apply Best Available Control Technology (BACT) for each regulated New Source Review pollutant that has the potential to emit greater than the significant amounts listed in 40 C.F.R. 52.21(b)(23)(i). Appendix B presents details of the BACT analysis for NOx, CO, VOC, PM, PM-10, PM-2.5, and GHGs. 40 C.F.R. 52.21(k) through (o) requires that the source contain the requirements under each section as applicable:
40 C.F.R. 52.21(k) - Source Impact Analysis: This includes a review of the allowable emissions increase concerning the AAAQS and increments; 40 C.F.R. 52.21(l) – Air Quality Models: Use of air quality models that are consistent with Appendix W of 40 C.F.R. 51;2 40 C.F.R. 52.21(m) – Air Quality Analysis: Measured ambient air quality data, unless exempted under 40 C.F.R. 52.21(i)(5);
40 C.F.R. 52.21(n) - Source Information: Include all information about the source including a description of the nature, design capacity, location, schedule for modification and layout;
40 C.F.R. 52.21(o) – Additional Impact Analyses: The source must review air quality impacts on the project area, such as visibility; and
40 C.F.R. 52.21(p) – Sources Impacting Federal Class I Areas: Review air quality impacts on the Federal Class I area.
The requirements under 40 C.F.R. 52.21(k) through (p) are addressed in the modeling report in Appendix D of this TAR.
Donlin is required under 40 C.F.R. 52.21(r)(2) to commence construction of the stationary source within 18 months of permit issuance unless granted an extension in writing from the Department. Donlin would need to show that the extension is justified, in order for the Department to approve any request for an extension.
3.1. State Emission Standards 40 C.F.R. 52.21(j)(1) requires the stationary source to meet each applicable limitation under the Alaska SIP. The stationary source will be subject to Title V permitting and the Title V permit, when issued, will require on-going MR&R with the state emission standards. The Department
2 The Department used the 2005 version of Appendix W for the modeling review since that is the version currently
adopted by reference in 18 AAC 50.040(f). EPA promulgated an update to Appendix W on January 17, 2017, but that update does not become effective until May 22, 2017. Permitting authorities also have a one-year transition period (which ends January 17, 2018) to incorporate the update into their New Source Review programs. The Department’s use and reference to the 2005 version of Appendix W for this permitting action is therefore required under State rule and allowed under Federal rule.

Donlin Gold LLC – Donlin Gold Project Final – June 30, 2017 Construction Permit AQ0934CPT01
Page 13 of 88
generally requires an initial compliance demonstration for state emission standards in a Title I permit if warranted. Ongoing MR&R for EU IDs EG-1 through SG-2 was not included in the state emission standards as these are relatively small units that currently operate without ongoing MR&R for the state emission standards, and these units will be operating for a limited amount of time, as previously described in Section 2.2.
3.1.1. 18 AAC 50.055(a)(1): Industrial Process and Fuel-Burning VE Standards Section 3 of the permit contains conditions that require initial compliance using 40 C.F.R. 60, Appendix A, Reference Method 9 observation to ensure the applicable diesel-fired equipment and crushers at the facility comply with the standard. Small natural gas-fired equipment was not included as it is unlikely that these units will exceed the VE standards.
3.1.2. 18 AAC 50.055(b)(1): Industrial Process and Fuel-Burning PM Standards Industrial process equipment and fuel-burning equipment at the stationary source must comply with 18 AAC 50.055(b)(1), the state PM standards of 0.05 grains per dry standard cubic foot of exhaust. Initial compliance demonstrations were not included for PM as the PM emitting units are all subject to BACT limits and must demonstrate compliance with either a source test or submitting a manufacturer’s guarantee. Compliance with the BACT limit will ensure compliance with the state PM standard.
3.1.3. 18 AAC 50.055(c): Sulfur Compound Emissions Standards Industrial process equipment and fuel-burning equipment at the stationary source must comply with 18 AAC 50.055(c), the state sulfur compounds emissions standard. Sulfur compound emissions, expressed as SO2, from an industrial process or from fuel-burning equipment may not exceed 500 parts per million by volume (ppmv) averaged over a period of three hours. This permit does not include SO2 initial compliance demonstrations because these units will be subject to the ORL requiring the use of ULSD. The use of ULSD fuel will ensure compliance with the SO2 state emission standard.
3.1.4. 18 AAC 50.050: Incinerator Emission Standards Incinerators at the stationary source must comply with 18 AAC 50.050, the state incinerator emission standards which includes a VE standard and a PM standard. The Department combined the VE standards for incinerators and for industrial process and fuel-burning equipment as the requirements are the same. EU IDs 27 and 28 are not subject to the incinerator PM standards because they have a rated capacity under 1,000 pounds per hour. They are included under the industrial process and fuel-burning standard requirements in the permit.
3.2. Standard Permit Conditions As required under 18 AAC 50.345 and 18 AAC 50.346, the Department must include the standard permit conditions (b) through (o). Section 9 of the permit lists these standard permit conditions.
4. PERMIT ADMINISTRATION The stationary source has the potential to emit more than 100 tpy of one or more pollutants.

Donlin Gold LLC – Donlin Gold Project Final – June 30, 2017 Construction Permit AQ0934CPT01
Page 14 of 88
Therefore, a timely Title V application for the stationary source is due no later than 12 months after the stationary source commences operation. The Department will rescind AQ0934ORL01 upon issuance of AQ0934CPT01.

Donlin Gold LLC – Donlin Gold Project Final – June 30, 2017 Construction Permit AQ0934CPT01
Page 15 of 88
APPENDIX A: EMISSIONS CALCULATIONS Table A-1 presents details of the EUs, their characteristics, and emissions. The Department obtained the emissions from Appendix B of the October 16, 2015 permit application.
Table A-1: Detailed Permanent EU Inventory and Potential to Emit (tpy)
ID
Hours per year1
Rating
CO NOx PM-2.5 PM-10
EF Units PM-2.5 PM-10 PM SO2 VOC
EF Units PTE EF Units PTE EF PTE EF PTE EF PTE EF Units PTE EF Units PTE
12 8,760 16,786 kWe 0.18 g/kWe 29.2 0.53 g/kWe 85.9 g/kWe 0.29 47.0 0.29 47.0 0.29 47.0 0.0059 g/kWe 1.0 0.58 g/kWe 94.0
22 8,760 16,786 kWe 0.18 g/kWe 29.2 0.53 g/kWe 85.9 g/kWe 0.29 47.0 0.29 47.0 0.29 47.0 0.0059 g/kWe 1.0 0.58 g/kWe 94.0
32 8,760 16,786 kWe 0.18 g/kWe 29.2 0.53 g/kWe 85.9 g/kWe 0.29 47.0 0.29 47.0 0.29 47.0 0.0059 g/kWe 1.0 0.58 g/kWe 94.0
42 8,760 16,786 kWe 0.18 g/kWe 29.2 0.53 g/kWe 85.9 g/kWe 0.29 47.0 0.29 47.0 0.29 47.0 0.0059 g/kWe 1.0 0.58 g/kWe 94.0
52 8,760 16,786 kWe 0.18 g/kWe 29.2 0.53 g/kWe 85.9 g/kWe 0.29 47.0 0.29 47.0 0.29 47.0 0.0059 g/kWe 1.0 0.58 g/kWe 94.0
62 8,760 16,786 kWe 0.18 g/kWe 29.2 0.53 g/kWe 85.9 g/kWe 0.29 47.0 0.29 47.0 0.29 47.0 0.0059 g/kWe 1.0 0.58 g/kWe 94.0
72 8,760 16,786 kWe 0.18 g/kWe 29.2 0.53 g/kWe 85.9 g/kWe 0.29 47.0 0.29 47.0 0.29 47.0 0.0059 g/kWe 1.0 0.58 g/kWe 94.0
82 8,760 16,786 kWe 0.18 g/kWe 29.2 0.53 g/kWe 85.9 g/kWe 0.29 47.0 0.29 47.0 0.29 47.0 0.0059 g/kWe 1.0 0.58 g/kWe 94.0
92 8,760 16,786 kWe 0.18 g/kWe 29.2 0.53 g/kWe 85.9 g/kWe 0.29 47.0 0.29 47.0 0.29 47.0 0.0059 g/kWe 1.0 0.58 g/kWe 94.0
102 8,760 16,786 kWe 0.18 g/kWe 29.2 0.53 g/kWe 85.9 g/kWe 0.29 47.0 0.29 47.0 0.29 47.0 0.0059 g/kWe 1.0 0.58 g/kWe 94.0
112 8,760 16,786 kWe 0.18 g/kWe 29.2 0.53 g/kWe 85.9 g/kWe 0.29 47.0 0.29 47.0 0.29 47.0 0.0059 g/kWe 1.0 0.58 g/kWe 94.0
122 8,760 16,786 kWe 0.18 g/kWe 29.2 0.53 g/kWe 85.9 g/kWe 0.29 47.0 0.29 47.0 0.29 47.0 0.0059 g/kWe 1.0 0.58 g/kWe 94.0
133 8,760 200 kWe 4.38 g/kWe 8.5 0.5 g/kWe 1.0 g/kWe 0.03 0.06 0.03 0.1 0.03 0.1 0.0066 g/kWe 0.01 0.24 g/kWe 0.5
143 8,760 200 kWe 4.38 g/kWe 8.5 0.5 g/kWe 1.0 g/kWe 0.03 0.06 0.03 0.1 0.03 0.1 0.0066 g/kWe 0.01 0.24 g/kWe 0.5
154 8,760 29.29 MMBtu/hr 84 lb/
MMscf 10.6 0.02 lb/gal 19.7 lb/gal5 7.6 0.96 0.001 0.99 0.003 3.25 0.0016 lb/ MMBtu 0.2 5.5 lb/
MMscf 0.7
164 8,760 29.29 MMBtu/hr 84 lb/
MMscf 10.6 0.02 lb/gal 19.7 lb/gal5 7.6 0.96 0.001 0.99 0.003 3.25 0.0016 lb/ MMBtu 0.2 5.5 lb/
MMscf 0.7
174 8,760 20.66 MMBtu/hr 84 lb/
MMscf 7.5 0.02 lb/gal 13.9 lb/gal5 7.6 0.67 0.001 0.7 0.003 2.29 0.0016 lb/ MMBtu 0.1 5.5 lb/
MMscf 0.5
184 8,760 16 MMBtu/hr 84 lb/ MMscf 5.8 0.02 lb/gal 10.8 lb/gal5 7.6 0.52 0.001 0.54 0.003 1.78 0.0016 lb/
MMBtu 0.1 5.5 lb/ MMscf 0.4

Donlin Gold LLC – Donlin Gold Project Final – June 30, 2017 Construction Permit AQ0934CPT01
Page 16 of 88
ID
Hours per year1
Rating
CO NOx PM-2.5 PM-10
EF Units PM-2.5 PM-10 PM SO2 VOC
EF Units PTE EF Units PTE EF PTE EF PTE EF PTE EF Units PTE EF Units PTE
194 8,760 16.5 MMBtu/hr 84 lb/ MMscf 6.0 0.02 lb/gal 11.1 lb/gal5 7.6 0.54 0.001 0.56 0.003 1.83 0.0016 lb/
MMBtu 0.1 5.5 lb/ MMscf 0.4
204 8,760 16.5 MMBtu/hr 84 lb/ MMscf 6.0 0.02 lb/gal 11.1 lb/gal5 7.6 0.54 0.001 0.56 0.003 1. 0.0016 lb/
MMBtu 0.1 5.5 lb/ MMscf 0.4
216 8,760 2 MMBtu/hr 84 lb/ MMscf 0.7 0.02 lb/gal 0.9 lb/
MMscf 7.6 0.1 7.6 0.1 7.6 0.1 0.6 lb/ MMscf 0.01 5.5 lb/
MMscf 0.1
227 8,760 2 MMBtu/hr 0.005 lb/gal 0.3 0.02 lb/gal 1.4 lb/gal 2.5 E-04 0.02 0.001 0.1 0.003 0.2 0.0016 lb/
MMBtu 0.01 3.4 E-04 lb/gal 0.02
236,8 8,760 24.15 MMBtu/hr 40 lb/
MMscf 4.2 94 lb/ MMscf 9.8 lb/
MMscf 7.6 0.8 7.6 0.8 7.6 0.8 0.6 lb/ MMscf 0.06 5.5 lb/
MMscf 0.57
246,9 8,760 95 MMBtu/hr 84 lb/ MMscf 34.3 100 lb/
MMscf 40.8 lb/ MMscf 7.6 3.1 7.6 3.1 7.6 3.1 0.6 lb/
MMscf 0.24 5.5 lb/ MMscf 2.24
256,10 8,760 17.5 MMBtu/hr 84 lb/ MMscf 6.3 100 lb/
MMscf 7.5 lb/ MMscf 7.6 0.6 7.6 0.6 7.6 0.6 0.6 lb/
MMscf 0.05 5.5 lb/ MMscf 0.41
267 8,760 17.2 MMBtu/hr 0.005 lb/gal 2.9 0.02 lb/gal 11.6 lb/gal 2.50E-04 0.1 0.001 0.6 0.0033 1.9 0.0016 lb/
MMBtu 0.12 3.4 E-04 lb/gal 0.20
2711 8,760 990 lb/hr 0.005461 g/MJ 0.03 0.127 g/MJ 0.7 g/MJ 0.11 4.79 0.11 4.79 0.11 4.79 0.0013 g/MJ 0.01 7.04 E-07 g/MJ 4.03E-
06
2812 8 0.058 kWe 0.023666 g/MJ 0.01 0.156976 g/MJ 0.1 g/MJ 2.35E-02 0.01 2.35E-
02 0.01 2.35E-02 0.01 0.0271 g/MJ 0.01 1.78
E-11 g/MJ 6.74E-12
2913 500 600 kWe 4.38 g/kWe 1.5 8 g/kWe 2.7 g/kWe 0.25 0.1 0.25 0.1 0.25 0.1 0.0066 g/kWe 0.002 8 g/kWe 2.65
3013 500 600 kWe 4.38 g/kWe 1.5 8 g/kWe 2.7 g/kWe 0.25 0.1 0.25 0.1 0.25 0.1 0.0066 g/kWe 0.002 8 g/kWe 2.65
3113 500 1,500 kWe 4.38 g/kWe 3.6 8 g/kWe 6.6 g/kWe 0.25 0.2 0.25 0.2 0.25 0.2 0.0066 g/kWe 0.005 8 g/kWe 6.61
3213 500 1,500 kWe 4.38 g/kWe 3.6 8 g/kWe 6.6 g/kWe 0.25 0.2 0.25 0.2 0.25 0.2 0.0066 g/kWe 0.005 8 g/kWe 6.61
3313 500 1,500 kWe 4.38 g/kWe 3.6 8 g/kWe 6.6 g/kWe 0.25 0.2 0.25 0.2 0.25 0.2 0.0066 g/kWe 0.005 8 g/kWe 6.61
3413 500 1,500 kWe 4.38 g/kWe 3.6 8 g/kWe 6.6 g/kWe 0.25 0.2 0.25 0.2 0.25 0.2 0.0066 g/kWe 0.005 8 g/kWe 6.61
3514 500 252 hp 3.3 g/hp-hr 0.5 3.7 g/hp-hr 0.5 g/hp-hr 0.19 0.03 0.19 0.03 0.19 0.03 0.0049 g/hp-hr 0.001 3.7 g/hp-hr 0.51
3614 500 252 hp 3.3 g/hp-hr 0.5 3.7 g/hp-hr 0.5 g/hp-hr 0.19 0.03 0.19 0.03 0.19 0.03 0.0049 g/hp-hr 0.001 3.7 g/hp-hr 0.51
3714 500 252 hp 3.3 g/hp-hr 0.5 3.7 g/hp-hr 0.5 g/hp-hr 0.19 0.03 0.19 0.03 0.19 0.03 0.0049 g/hp-hr 0.001 3.7 g/hp-hr 0.51
7715 8,760 210 ton/hr 88 lb/hr 385.5 -- -- -- g/hr 100 1.0 100 1.0 100 1.0 507/ 14416 g/hr 6.29 19 g/hr 0.18
8115 8,760 210 ton/hr 88 lb/hr 385.5 -- -- -- g/hr 100 1.0 100 1.0 100 1.0 507/ 14416 g/hr 6.29 19 g/hr 0.18

Donlin Gold LLC – Donlin Gold Project Final – June 30, 2017 Construction Permit AQ0934CPT01
Page 17 of 88
ID
Hours per year1
Rating
CO NOx PM-2.5 PM-10
EF Units PM-2.5 PM-10 PM SO2 VOC
EF Units PTE EF Units PTE EF PTE EF PTE EF PTE EF Units PTE EF Units PTE
8517 8,760 -- -- -- -- -- -- -- g/hr 181 1.8 181 1.8 181 1.8 -- -- -- -- -- --
8617 8,760 -- -- -- -- -- -- -- g/hr 181 1.8 181 1.8 181 1.8 -- -- -- -- -- --
8717 8,760 -- -- -- -- -- -- -- g/hr 181 1.8 181 1.8 181 1.8 -- -- -- -- -- --
8818 8,760 1.65 ton/hr 0.0437 gr/SCF 3.9 0.0009 gr/SCF 0.1 gr/SCF 2.18 E-02 1.9 2.18 E-
02 1.9 2.18 E-02 1.9 -- -- -- 0.022 gr/SCF 1.92
91-9419 8,760 211 gpm -- -- -- -- -- -- gr/SCF 5.2 E-03 0.8 5.2 E-
03 0.8 5.2 E-03 0.8 -- -- -- -- -- --
9720 8,760 -- -- -- -- -- -- -- gr/SCF 1.75E-02 0.1 1.75E-
02 0.1 1.75E-02 0.1 -- -- -- -- -- --
10021 8,760 -- -- -- -- -- -- -- gr/SCF 5.03E-03 4.2 5.03E-
03 4.2 5.03E-03 4.2 -- -- -- -- -- --
103-10422 8,760 3,575 lb/day -- -- -- -- -- -- lb/hr 0.45 2.0 0.45 2.0 0.45 2.0 -- -- -- -- -- --
10623 8,760 3,575 lb/day -- -- -- -- -- -- lb/hr 0.94 4.1 0.94 4.1 0.94 4.1 -- -- -- -- -- -- 108-10922 8,760 3,575 lb/day -- -- -- -- -- -- lb/hr 0.45 2.0 0.45 2.0 0.45 2.0 -- -- -- -- -- --
11124 8,760 1,500 SCFM -- -- -- -- -- -- lb/hr 0.26 1.13 0.26 1.13 0.26 1.13 -- -- -- -- -- --
12625 7,500,000 2,500,000 gal -- -- -- -- -- -- -- -- -- -- -- -- -- -- -- -- -- -- 0.10
12725 7,500,000 2,500,000 gal -- -- -- -- -- -- -- -- -- -- -- -- -- -- -- -- -- -- 0.10
12825 7,500,000 2,500,000 gal -- -- -- -- -- -- -- -- -- -- -- -- -- -- -- -- -- -- 0.10
12925 7,500,000 2,500,000 gal -- -- -- -- -- -- -- -- -- -- -- -- -- -- -- -- -- -- 0.10
13025 7,500,000 2,500,000 gal -- -- -- -- -- -- -- -- -- -- -- -- -- -- -- -- -- -- 0.10
13125 7,500,000 2,500,000 gal -- -- -- -- -- -- -- -- -- -- -- -- -- -- -- -- -- -- 0.10
13225 7,500,000 2,500,000 gal -- -- -- -- -- -- -- -- -- -- -- -- -- -- -- -- -- -- 0.10
13325 7,500,000 2,500,000 gal -- -- -- -- -- -- -- -- -- -- -- -- -- -- -- -- -- -- 0.10
13425 7,500,000 2,500,000 gal -- -- -- -- -- -- -- -- -- -- -- -- -- -- -- -- -- -- 0.10
13525 7,500,000 2,500,000 gal -- -- -- -- -- -- -- -- -- -- -- -- -- -- -- -- -- -- 0.10
13625 7,500,000 2,500,000 gal -- -- -- -- -- -- -- -- -- -- -- -- -- -- -- -- -- -- 0.10

Donlin Gold LLC – Donlin Gold Project Final – June 30, 2017 Construction Permit AQ0934CPT01
Page 18 of 88
ID
Hours per year1
Rating
CO NOx PM-2.5 PM-10
EF Units PM-2.5 PM-10 PM SO2 VOC
EF Units PTE EF Units PTE EF PTE EF PTE EF PTE EF Units PTE EF Units PTE
13725 7,500,000 2,500,000 gal -- -- -- -- -- -- -- -- -- -- -- -- -- -- -- -- -- -- 0.10
13825 7,500,000 2,500,000 gal -- -- -- -- -- -- -- -- -- -- -- -- -- -- -- -- -- -- 0.10
13925 7,500,000 2,500,000 gal -- -- -- -- -- -- -- -- -- -- -- -- -- -- -- -- -- -- 0.10
14025 7,500,000 2,500,000 gal -- -- -- -- -- -- -- -- -- -- -- -- -- -- -- -- -- -- 0.10
14125 19,035,000 25,000 gal -- -- -- -- -- -- -- -- -- -- -- -- -- -- -- -- -- -- 0.02
14225 19,035,000 25,000 gal -- -- -- -- -- -- -- -- -- -- -- -- -- -- -- -- -- -- 0.02
14325 793,101 10,000 gal -- -- -- -- -- -- -- -- -- -- -- -- -- -- -- -- -- -- 2.36E-03
14425 6,776 270 gal -- -- -- -- -- -- -- -- -- -- -- -- -- -- -- -- -- -- 4.50E-05
14525 6,776 270 gal -- -- -- -- -- -- -- -- -- -- -- -- -- -- -- -- -- -- 4.50E-05
14625 3,942,411 5,000 gal -- -- -- -- -- -- -- -- -- -- -- -- -- -- -- -- -- -- 4.02E-03
14725 1,390,621 5,000 gal -- -- -- -- -- -- -- -- -- -- -- -- -- -- -- -- -- -- 1.98E-03
14825 1,076,771 5,000 gal -- -- -- -- -- -- -- -- -- -- -- -- -- -- -- -- -- -- 1.56E-03
14925 134,596 500 gal -- -- -- -- -- -- -- -- -- -- -- -- -- -- -- -- -- -- 1.95E-04
15025 3,899,388 33,000 gal -- -- -- -- -- -- -- -- -- -- -- -- -- -- -- -- -- -- 0.01
15125 3,899,388 33,000 gal -- -- -- -- -- -- -- -- -- -- -- -- -- -- -- -- -- -- 0.01
15225 218,800 25,000 gal -- -- -- -- -- -- -- -- -- -- -- -- -- -- -- -- -- -- 1.76E-03
15325 6,776 270 gal -- -- -- -- -- -- -- -- -- -- -- -- -- -- -- -- -- -- 4.50E-05
15425 55,000 9,900 gal -- -- -- -- -- -- -- -- -- -- -- -- -- -- -- -- -- -- 0.08
15525 55,000 9,900 gal -- -- -- -- -- -- -- -- -- -- -- -- -- -- -- -- -- -- 0.08
15625 10,000 5,000 gal -- -- -- -- -- -- -- -- -- -- -- -- -- -- -- -- -- -- 0.09
15725 252,695 9,900 gal -- -- -- -- -- -- -- -- -- -- -- -- -- -- -- -- -- -- 1.50E-03

Donlin Gold LLC – Donlin Gold Project Final – June 30, 2017 Construction Permit AQ0934CPT01
Page 19 of 88
ID
Hours per year1
Rating
CO NOx PM-2.5 PM-10
EF Units PM-2.5 PM-10 PM SO2 VOC
EF Units PTE EF Units PTE EF PTE EF PTE EF PTE EF Units PTE EF Units PTE
Subtotal: 1,255.8 1,230.2 598.9 599.5 610.6 25.6 1,167.6
FUGITIVE EMISSIONS
3826 8,760 44,676,000 ton/yr -- -- -- -- -- -- lb/ton
3.40E-05 0.8
2.30 E-04 5.1
4.80 E-04 10.7 -- -- -- -- -- --
3927 8,760 25,015 ACFM -- -- -- -- -- -- lb/hr 2.14 9.4 2.14 9.4 2.14 9.4 -- -- -- -- -- --
41 8,760 44,676,000 ton/yr -- -- -- -- -- -- -- -- -- -- -- -- -- -- -- -- -- -- --
42 8,760 44,676,000 ton/yr -- -- -- -- -- -- -- -- -- -- -- -- -- -- -- -- -- -- --
43 8,760 44,676,000 ton/yr -- -- -- -- -- -- -- -- -- -- -- -- -- -- -- -- -- -- --
4426 8,760 44,676,000 ton/yr -- -- -- -- -- -- lb/ton
3.40E-05 0.8
2.30 E-04 5.1
4.80 E-04 10.7 -- -- -- -- -- --
4526 8,760 5,100 ton/yr -- -- -- -- -- -- lb/ton 3.40E
-05 0.8 2.30 E-04 5.1
4.80 E-04 10.7 -- -- -- -- -- --
4628 8,760 5,591 ACFM -- -- -- -- -- -- lb/hr 0.48 2.1 0.48 2.1 0.48 2.1 -- -- -- -- -- -- 4828 8,760 5,591 ACFM -- -- -- -- -- -- lb/hr 0.48 2.1 0.48 2.1 0.48 2.1 -- -- -- -- -- -- 5028 8,760 5,591 ACFM -- -- -- -- -- -- lb/hr 0.48 2.1 0.48 2.1 0.48 2.1 -- -- -- -- -- -- 5228 8,760 5,591 ACFM -- -- -- -- -- -- lb/hr 0.48 2.1 0.48 2.1 0.48 2.1 -- -- -- -- -- --
5429 8,760 3,303 ton/hr -- -- -- -- -- -- lb/ton 3.40E
-05 0.5 2.30 E-04 3.3
4.80 E-04 6.9 -- -- -- -- -- --
55-5630 8,760 30,017 ACFM -- -- -- -- -- -- lb/hr 2.57 11.3 2.57 11.3 2.57 11.3 -- -- -- -- -- --
5831 8,760 660 ton/hr -- -- -- -- -- -- lb/ton 3.40E
-05 0.1 2.30 E-04 0.7
4.80 E-04 1.4 -- -- -- -- -- --
5932 8,760 1,500 ACFM -- -- -- -- -- -- lb/hr 0.26 1.1 0.26 1.1 0.26 1.1 -- -- -- -- -- -- 6132 8,760 1,500 ACFM -- -- -- -- -- -- lb/hr 0.26 1.1 0.26 1.1 0.26 1.1 -- -- -- -- -- -- 6332 8,760 628 ACFM -- -- -- -- -- -- lb/hr 0.11 0.5 0.12 0.5 0.12 0.5 -- -- -- -- -- -- 6533 8,760 840 ACFM -- -- -- -- -- -- lb/hr 0.14 0.6 0.14 0.6 0.14 0.6 -- -- -- -- -- -- 6733 8,760 1,324 ACFM -- -- -- -- -- -- lb/hr 0.23 1.0 0.23 1.0 0.23 1.0 -- -- -- -- -- -- 6933 8,760 3,002 ACFM -- -- -- -- -- -- lb/hr 0.51 2.3 0.51 2.3 0.51 2.3 -- -- -- -- -- --

Donlin Gold LLC – Donlin Gold Project Final – June 30, 2017 Construction Permit AQ0934CPT01
Page 20 of 88
ID
Hours per year1
Rating
CO NOx PM-2.5 PM-10
EF Units PM-2.5 PM-10 PM SO2 VOC
EF Units PTE EF Units PTE EF PTE EF PTE EF PTE EF Units PTE EF Units PTE
7133 8,760 3,002 ACFM -- -- -- -- -- -- lb/hr 0.51 2.3 0.51 2.25 0.51 2.3 -- -- -- -- -- --
7333 8,760 2,000 ACFM -- -- -- -- -- -- lb/hr 0.34 1.5 0.34 1.50 0.34 1.5 -- -- -- -- -- --
7533 8,760 3,002 ACFM -- -- -- -- -- -- lb/hr 0.51 2.3 0.51 2.25 0.51 2.25 -- -- -- -- -- --
11334 -- 141,512 holes/yr -- -- -- -- -- -- lb/hole 0.04 2.8 0.68 47.8 1.3 92.0 -- -- -- -- -- --
11435 -- 620 blasts/yr 6,196.65 lb/blast 1920.96 166.48 lb/blast 51.61 lb/blast 17.46 5.41 302.62 93.81 581.97 180.41 0.55 lb/blast 0.2 -- -- --
11536 8,760 13,059,932 ton/yr -- -- -- -- -- -- lb/ton
2.27E-04 1.5
1.50 E-03 9.8
3.16 E-03 20.7 -- -- -- -- -- --
11636 -- 5,876,969 ton/yr -- -- -- -- -- -- lb/ton 2.27E
-04 0.7 1.50 E-03 4.4
3.16 E-03 9.3 -- -- -- -- -- --
11736 -- 0 ton/day -- -- -- -- -- -- -- -- -- -- -- -- -- -- -- -- -- -- --
11836 8,760 7,948,468 ton/yr -- -- -- -- -- -- lb/ton 2.27E
-04 0.9 1.50 E-03 5.95
3.16 E-03 12.6 -- -- -- -- -- --
11936 8,760 152,286,568 ton/yr -- -- -- -- -- -- lb/ton
2.27E-04 17.3
1.50 E-03 114
3.16 E-03 240.9 -- -- -- -- -- --
12036 8,760 155,123,914 ton/yr -- -- -- -- -- -- lb/ton
2.27E-04 17.4
1.50 E-03 115
3.16 E-03 243.2 -- -- -- -- -- --
121 13,986 -- -- -- -- -- -- lb/VMT37 0.22 1.8 2.19 17.8 9.00 73.3 -- -- -- -- -- -- 122 75,495 -- -- -- -- -- -- lb/hr38 0.9 34.1 1.54 58.1 8.60 324.5 -- -- -- -- -- -- 123 45,653 -- -- -- -- -- -- lb/VMT39 0.02 1.3 0.28 18.9 0.62 42.7 -- -- -- -- -- --
15840 101,367 6.7 km -- -- -- -- -- -- lb/VMT41 0.06 0.3 0.62 3.2 2.57 13.1 -- -- -- -- -- -- 15942 60,173 10.1 km -- -- -- -- -- -- lb/VMT43 0.06 0.19 0.60 1.9 2.47 7.5 -- -- -- -- -- -- 16044 4,847,140 -- -- -- -- -- -- lb/VMT45 0.33 79.6 3.28 795.6 13.50 3,271.0 -- -- -- -- -- -- 16146 -- -- -- -- -- -- 2.4 15.8 31.6 -- -- -- -- -- --
Fugitives Subtotal: 1,1,921.2 51.7 210.2 1,363.8 4,645 0.2 0.0
Total Emissions: 3,177.0 1,281.8 809.1 1,963.3 5,255.6 25.7 1,167.6
Table Notes: Mining activity rates are based on the highest CO, NOx, and PM-2.5 emissions year (LOM 16), and vary per year. 1For EU IDs 124-155 the values listed under “Hours per year” are annual throughput in gallons. For EU IDs 121-123 and 158-160 the values listed under “Hours per year” are annual vehicle miles travelled.

Donlin Gold LLC – Donlin Gold Project Final – June 30, 2017 Construction Permit AQ0934CPT01
Page 21 of 88
2Emission factors provided by Wärtsilä. Assumed only diesel operation to determine worst case PTE, and applied SCR and oxidation catalyst controls as required by BACT. PM, PM-10, and PM-2.5 emissions include filterable and condensable emissions.
3Emission factors from 40 C.F.R. 60.4204(b), 60.4201(a), and 1039.101, Table 1. A factor of 1.25 was applied per 40 C.F.R. 60.4204(d), 60.4212(b), and 1039.101(e)(2) and (3). SO2 emissions based on 15 ppm per ORL to use only ULSD for diesel fuel.
4CO, PM-2.5, and VOC emissions based on natural gas firing as worst case emissions for PTE. Emission factors taken from AP-42, Table 1.4-1. Assumed 1,020 Btu/scf for natural gas based on footnote to AP-42, Table 1.4-1 and 1.4-2. NOx, PM-10, and PM emissions based on diesel firing as worst case emissions for PTE. Emission factors taken from AP-42, Table 1.3-1 for NOx and PM and Table 1.3-6 for PM-10. SO2 emissions based on 15 ppm per ORL to use only ULSD for diesel fuel.
5Emission factor units for PM-2.5 are lb/MMscf 6Emission factors taken from AP-42, Table 1.4-1 for CO and NOx, and Table 1.4-2 for PM-2.5, PM-10, PM, VOC, and SO2. 7Emission factors taken from AP-42, Table 1.3-1 for CO and NOx, Table 1.3-6 for PM-2.5 and PM-10, Tables 1.3-1 and 1.3-2 for PM, and Table 1.3-3 for VOC. SO2 emissions based on 15 ppm per ORL to use only ULSD for diesel fuel.
8Covers 138 units. 9Covers 19 units 10Covers 7 units 11Emission factors taken from 40 C.F.R. 60 Subpart CCCC, Table 8. Assumed 9,570 dscf/MMBtu at 0% O2, 0.26 Nm3/MJ at 0% O2, 4,500 Btu/lb waste. 12Emission factors taken from 40 C.F.R. 60 Subpart LLLL, Table 2. Assumed 9,570 dscf/MMBtu at 0% O2, 0.26 Nm3/MJ at 0% O2, 7,700 Btu/lb dry sludge. 13Emission factors for CO, NOx, PM-2.5, PM-10, PM, and VOC taken from 40 C.F.R. 60.4205(b), 60.4202(a)(2), and 89.112, Table 1. A factor of 1.25 was applied per 40 C.F.R. 60.4205(e) and 60.4212(c). SO2 emissions based on 15 ppm per ORL to use only ULSD for diesel fuel.
14Emission factors for CO, NOx, PM-2.5, PM-10, PM, and VOC taken from 40 C.F.R. 60.4205(c), Table 4. A factor of 1.25 was applied per 40 C.F.R. 4205(e) and 60.4212(d). SO2 emissions based on 15 ppm per ORL to use only ULSD for diesel fuel.
15CO emission factor from email from T. Krumins, Hatch. PM-2.5, PM-10, PM, Sulfur, and VOC emission factors from Hatch, Hg Emissions Control Summary. 16507 g/hr is the SO2 emission factor and 144 g/hr is the H2S emission factor. Both were used in determining the sulfur emissions from EU IDs 77 and 81. 17PM-2.5, PM-10, and PM emission factors from Hatch, Hg Emissions Controls Summary. 18Emission factors based on Barrick Goldstrike 2006-2011 source tests data for CO, 2006-2007 source test data for NOx, 2006-2012 source test data for PM-2.5, PM-10, and PM, and 2006-2011 source test data for VOC.
19PM-2.5, PM-10, and PM emission factors based on Barrick Goldstrike 2008-2012 source test data. 20PM-2.5, PM-10, and PM emission factors based on Barrick Goldstirke 2008-2012 source test data. 21PM-2.5, PM-10, and PM emission factors based on Barrick Goldstrike 2004-2012 source test data. 22Emission factors based on Barrick Goldstrike 2011 source test data. 23Emission factors based on Barrick Goldstrike 2008-2012 source test data. 24Emission factors based on vendor guarantee for dust collector (EU ID 112). 25VOC emissions provided by TANKS. 26Emission factors taken from AP-42, Section 13.2.4, Equation 1 where U = 1.3 mph and M= 1.8%. 27Emission factors based on vendor guarantee of 0.01 gr/ACF for dust collector (EU ID 40). 28Emission factors based on vendor guarantee of 0.01 gr/ACF for dust collectors (EU IDs 47, 49, 51, and 53). 29Emission factors taken from AP-42, Section 13.2.4, Equation 1 where U = 1.3 mph, and M = 1.8% 30Emission factors based on vendor guarantee of 0.01 gr/ACF for dust collector (EU ID 57). 31Emission factors taken from 13.2.4, Equation 1 where U = 1.3 mph and M = 1.8%. 32Emission factors based on vendor guarantee of 0.02 gr/ACF for dust collectors (EU IDs 60, 62, and 64). 33Emission factors based on vendor guarantee of 0.02 gr/ACF for dust collectors (EU IDs 66, 68, 70, 72, 74, and 76).

Donlin Gold LLC – Donlin Gold Project Final – June 30, 2017 Construction Permit AQ0934CPT01
Page 22 of 88
34Emission factors taken from AP-42, Table 11.9-4. 35Emission factors taken from AP-42, Table 13.3-1 for CO, CSIRO for NOx, AP-42, Table 11.9-1 for PM-2.5, PM-10, and PM, and based on 15 ppm S in FO and maximum of 10% FO in ANFO.
36Emission factors taken from AP-42, Section 13.2.4, Equation 1 where U = 7.947 mph, M = 2.5%, and k taken from AP-42, Section 13.2.4. 37Emission factors taken from AP-42, Table 13.2.2-1, Equations 1a and 2, where s = 3.8%, W = 183 tons, P = 129, k = 0.15 (PM-2.5); 1.5 (PM-10); and 4.9 (PM), a = 0.9 (PM-2.5 and PM-10); 0.7 (PM), and b = 0.45. Assumes 90% emissions control.
38Emission factors taken from AP-42, Table 11.9-1, where M = 2.5% and s = 3.8%. 39Emission factors taken from AP-42, Table 11-1, where S = 3 mph. 40Emissions include travel from bus, light vehicle, water truck, and grader. 41Emisison factor listed is for bus/light vehicle/water truck and taken from AP-42, Table 13.2.2-1, Equations 1a and 2, where s = 3.8%, W = 10.3 tons, P = 129, k = 0.15 (PM-2.5); 1.5 (PM-10); and 4.9 (PM), a = 0.9 (PM-2.5 and PM-10); 0.7 (PM), and b = 0.45. Assumes 90% emissions control. Emission factors for the grader taken from AP-42, Table 11-1, where S = 3 mph.
42Emissions include travel from bus, light vehicle, water truck, and grader. 43Emisison factor listed is for bus/light vehicle/water truck and taken from AP-42, Table 13.2.2-1, Equations 1a and 2, where s = 3.8%, W = 11.2 tons, P = 129, k = 0.15 (PM-2.5); 1.5 (PM-10); and 4.9 (PM), a = 0.9 (PM-2.5 and PM-10); 0.7 (PM), and b = 0.45. Assumes 90% emissions control. Emission factors for the grader taken from AP-42, Table 11-1, where S = 3 mph.
44Emissions for the Haul Road includes Ore Hauling and Waste Hauling. 45Emission factors taken from AP-42, Table 13.2.2-1, Equations 1a and 2, where s = 3.8%, W = 449.4 tons, P = 129, k = 0.15 (PM-2.5); 1.5 (PM-10); and 4.9 (PM), a = 0.9 (PM-2.5 and PM-10); 0.7 (PM), and b = 0.45. Assumes 90% emissions control
46See Emissions Calculations in Table A-2.

Donlin Gold LLC – Donlin Gold Project Final – June 30, 2017 Construction Permit AQ0934CPT01
Page 23 of 88
Table A-2 presents details of the EUs, their characteristics, and emissions. The Department obtained the emissions from Appendix B of the October 16, 2015 permit application. This table only includes wind erosion emissions at the stationary source.
Table A-2: Detailed Wind Erosion and Tons Emitted per Year
Description Operation Units PM-2.5 PM-10 PM
Emission Factor Units PTE Emission Factor Units PTE Emission Factor Units PTE Wind Erosion – Tailings1 798 acre 0.3 1.9 3.9 Wind Erosion - Inside Pit1 130.5 acre 0.006255 ton/acre-yr 0.08 0.0417 ton/acre-yr 0.5 0.0834 ton/acre-yr 1.1 Wind Erosion - Outside Pit1 84.2 acre 0.006255 ton/acre-yr 0.05 0.0417 ton/acre-yr 0.4 0.0834 ton/acre-yr 0.7 Wind Erosion - Camp to Mine1 15 acre 0.006255 ton/acre-yr 0.01 0.0417 ton/acre-yr 0.06 0.0834 ton/acre-yr 0.1 Wind Erosion - Airport to Camp1 22.4 acre 0.006255 ton/acre-yr 0.01 0.0417 ton/acre-yr 0.09 0.0834 ton/acre-yr 0.2 Wind Erosion - Waste Rock1 1.7 11.6 23.2 Wind Erosion - Short Term Stockpile1 0.02 0.2 0.3 Wind Erosion - Long Term Stockpile West1 0.03 0.2 0.4 Wind Erosion - Long Term Stockpile East1 0.05 0.3 0.7 Wind Erosion - Overburden 0.02 0.1 0.2 Total Emissions 2.4 15.4 30.8 Table Notes: 1Emission factors taken from AP-42, Section 13.2-5. Roads include 90% efficiency from water and chemical spray, tailings emissions does not.

Donlin Gold LLC – Donlin Gold Project Final – June 30, 2017 Construction Permit AQ0934CPT01
Page 24 of 88
Table A-3 presents details of the EUs and their GHG emissions. The Department obtained the emissions from Appendix B of the October 16, 2015 permit application.
Table A-3: Detailed GHG Emitted per Year
EU IDs Operation Fuel1 Emission
Factor Units
CO2 CH4 N2O CO2-e2 Emission Factor3
PTE (tpy)
Emission Factor3
PTE (tpy)
Emission Factor3 PTE (tpy) PTE (tpy)
1-12 15,081,772 MMBtu/yr Diesel kg/MMBtu 73.96 1,299,570 0.003 49.87 0.0006 9.98 1,233,790 13-14 32,893 MMBtu/yr Diesel kg/MMBtu 73.96 2,682 0.003 0.11 0.0006 0.02 2,691 15-16 513,172 MMBtu/yr Diesel kg/MMBtu 73.96 41,837 0.003 1.7 0.0006 0.34 41,981
17 181,013MMBtu/yr Diesel kg/MMBtu 73.96 14,757 0.003 0.6 0.0006 0.12 14,808 18 140,160 MMBtu/yr Diesel kg/MMBtu 73.96 11,427 0.003 0.46 0.0006 0.09 11,466
19-20 298,080 MMBtu/yr Diesel kg/MMBtu 73.96 23,568 0.003 0.98 0.0006 0.19 23,649 21 17,520 MMBtu/yr Natural Gas kg/MMBtu 53.06 1,025 0.001 0.02 0.0001 0.002 1,026 22 17,520 MMBtu/yr Diesel kg/MMBtu 73.96 1,428 0.003 0.06 0.0006 0.01 1,433 23 211,544 MMBtu/yr Natural Gas kg/MMBtu 53.06 12,374 0.001 0.23 0.0001 0.02 12,386 24 832,200 MMBtu/yr Natural Gas kg/MMBtu 53.06 48,674 0.001 0.92 0.0001 0.09 48,725 25 153,300 MMBtu/yr Natural Gas kg/MMBtu 53.06 8,966 0.001 0.17 0.0001 0.02 8,976 26 150,672 MMBtu/yr Diesel kg/MMBtu 73.96 12,284 0.003 0.5 0.0006 0.1 12,326
29-30 5,632 MMBtu/yr Diesel kg/MMBtu 73.96 459 0.003 0.19 0.0006 0.004 461
31-34 28,481 MMBtu/yr Diesel kg/MMBtu 73.96 2,322 0.003 0.09 0.0006 0.02 2,330
35-37 2,646 MMBtu/yr Diesel kg/MMBtu 73.96 216 0.003 0.01 0.0006 0.002 216 27-28 5,253 MMBtu/yr Municipal Waste kg/MMBtu 90.7 3,934 0.032 1.39 0.0042 0.18 4,023
77 and 81 8,760 hr/yr N/A ton/hr 2.15 37,659 -- -- -- -- 37,659 124 8,760 hr/yr N/A ton/hr 9.57 83,816 -- -- -- -- 83,816 125 8,760 hr/yr N/A ton/hr 21.6 189,359 -- -- -- -- 189,359
Subtotal 1,726,358 57.3 11.19 1,731,120 FUGITIVE EMISSIONS
114 103,236 MMBtu/yr4 Diesel kg/MMBtu 73.96 11,739 0.003 0.48 0.0006 0.18 11,779 Fugitives Subtotal 11,739 0.48 0.18 11,779 Total Emissions 1,738,097 57.8 11.4 1,742,900
Table Notes: 1Fuel type for dual-fuel EUs was chosen to determine the worst case GHG PTE. 2CO2-e is determined by combining CO2, CH4, and N2O emissions using factors of 25 for CH4 and 298 for N2O. Factors taken from 40 C.F.R. 98, Table A-1. 3Emission factors based on fuel type taken from 40 C.F.R. 98, Tables C-1 and C-2. 4Based on 793,101 gal/yr and heating value of 130,167 Btu/gal

Page 25 of 88
APPENDIX B: BEST AVAILABLE CONTROL TECHNOLOGY 1.0 Introduction The Donlin Gold Project (DGP) triggered Prevention of Significant Deterioration (PSD) requirements for carbon monoxide (CO), oxides of nitrogen (NOx), particulate matter (PM), particulate matter with an aerodynamic diameter less than or equal to a nominal 10 micrometers (PM-10), particulate matter with an aerodynamic diameter less than or equal to a nominal 2.5 micrometers (PM-2.5), volatile organic compounds (VOC), and greenhouse gases (GHG). This appendix reviews Donlin Gold, LLC.’s (Donlin’s) Best Available Control Technology (BACT) analysis for CO, NOx, PM, PM-10, PM-2.5 (the Department will refer to PM, PM-10, and PM-2.5 as particulates in this BACT analysis), VOC, and GHG for its technical accuracy and adherence to accepted engineering cost estimation practices. 2.0 BACT Evaluation A BACT analysis is an evaluation of all available control options for equipment emitting the triggered pollutants and a process for selecting the best option based on feasibility, economics, energy, and other impacts. 40 C.F.R. 52.21(b)(12) defines BACT as a site-specific determination on a case-by-case basis. The Department’s goal is to identify BACT for the permanent emission units (EUs) at the Donlin Gold Project (DGP) that emit CO, NOx, particulates, VOC, and GHG, establish emission limits which represent BACT, and assess the level of monitoring, recordkeeping, and reporting requirements (MR&Rs) necessary to ensure Donlin applies BACT for the EUs. The Department based the BACT review on the five-step top-down approach set forth in Federal Register Volume 61, Number 142, July 23, 1996 (Environmental Protection Agency). Table 2-1 presents the EUs subject to BACT review.
Table 2-1: EUs Subject to BACT Review EU ID Description of EU 1 – 12 Main Power Plant 13 – 14 Small Diesel Engines 15 – 26 Boilers and Heaters 27 – 28 Camp Waste and Sewage Sludge Incinerators 29 – 37 Black Start and Emergency Diesel Engines
38, 39, 41 – 46, 48, 50, 52, 54 – 56, & 58 Ore Crushing and Transfers 59, 61, 63, 65, 67, 69, 71, 73, & 75 Mill Reagents Handling
77 & 81 Autoclaves 85 – 87 Pressure Oxidation Hot Cure
88 Carbon Regeneration Kiln 91 – 94 Electrowinning Cells
97 Mercury Retort 100 Induction Smelting Furnace
103, 104, 106, 108, and 109 Laboratories 111 Reagent Handling for Water Treatment
113 – 114 Drilling and Blasting 115 – 120 Material Loading and Unloading 124 – 125 Acidulation and Neutralization Tanks 126 – 157 Fuel Tanks
Donlin Gold, LLC. – Donlin Gold Project Final – June 30, 2017 Construction Permit AQ0934CPT01
Page 26 of 88
EU ID Description of EU 158, 159, & 160 Unpaved Roads
161 Wind Erosion Five-Step BACT Determinations The following sections explain the steps used to determine BACT for CO, NOx, Particulates, VOC, and GHG for the applicable equipment. Step 1 Identify All Potentially Available Control Options The Department identifies all available control options for the EUs and the pollutant under consideration. This includes technologies used throughout the world or emission reductions through the application of available control techniques, changes in process design, and/or operational limitations. To assist in identifying available controls, the Department reviews available controls listed on the Reasonably Available Control Technology (RACT), BACT, and Lowest Achievable Emission Rate (LAER) Clearinghouse (RBLC). The RBLC is an EPA database where permitting agencies nationwide post imposed BACT for PSD sources. It is usually the first stop for BACT research. In addition to the RBLC search, the Department used several search engines to look for emerging and tried technologies used to control NOx, CO, Particulates, VOC, and GHG emissions from equipment similar to those listed in Table B-1. Step 2 Eliminate Technically Infeasible Control Options: The Department evaluates the technical feasibility of each control option based on source specific factors in relation to each EU subject to BACT. Based on sound documentation and demonstration, the Department eliminates control options deemed technically infeasible due to physical, chemical, and engineering difficulties. Step 3 Rank Remaining Control Technologies by Control Effectiveness The Department ranks the remaining control options in order of control effectiveness with the most effective at the top. Step 4 Evaluate the Most Effective Controls and Document the Results as Necessary The Department reviews the detailed information in the permit application about the control efficiency, emission rate, emission reduction, cost, environmental, and energy impacts for each option to decide the final level of control. The applicant must present an objective evaluation of both the beneficial and adverse energy, environmental, and economic impacts. An applicant proposing to use the most effective option does not need to provide the detailed information for the less effective options. If cost is not an issue, a cost analysis is not required. Cost effectiveness for a control option is defined as the total net annualized cost of control divided by the tons of pollutant removed per year. Annualized cost includes annualized equipment purchase, erection, electrical, piping, insulation, painting, site preparation, buildings, supervision, transportation, operation, maintenance, replacement parts, overhead, raw materials, utilities, engineering, start-up costs, financing costs, and other contingencies related to the control option.

Donlin Gold, LLC. – Donlin Gold Project Final – June 30, 2017 Construction Permit AQ0934CPT01
Page 27 of 88
Step 5 Select BACT The Department selects the most effective control option not eliminated in Step 4 as BACT for the pollutant and EU under review. The Department lists the final BACT requirements determined for each EU in this step. A project may achieve emission reductions through the application of available technologies, changes in process design, and/or operational limitations. The Department reviewed DGP’s BACT analysis and made BACT determinations for NOx, CO, Particulates, VOC, and GHG for various EUs based on the information submitted by Donlin in their application, information from vendors, suppliers, sub-contractors, RBLC, and a comprehensive internet search. 3.0 Main Power Plant Electric power for the mine will be generated from a dual-fuel fired (natural gas and ultra-low sulfur diesel [ULSD]) reciprocating-engine onsite power plant with a steam turbine utilizing waste heat recovered from the engines (combined cycle power plant). The combined cycle power plant will consist of 12 Wärtsilä Model 18V50DF engines, each rated at approximately 17 megawatts (MW), for a total of 205 MW (gross) from the engines and an additional 15 MW (gross) from the steam turbine. The total gross power output from the plant will be 220 MW. The power plant will emit CO, NOx, SO2, particulates, VOC, and GHG. The following sections provide the BACT review for each of these pollutants (except SO2) for each fuel type. 3.1 CO Possible CO emission control technologies for large engines were obtained from the RBLC. The RBLC was searched for all determinations in the last 10 years under the process codes 17.100 to 17.190, Large Internal Combustion Engines (>500 horsepower [hp]). The search results for gas-fired and oil-fired engines are summarized in Table 3-1 and Table 3-2, respectively. Table 3-1. CO Control for Large Gas-Fired Engines
Control Technology Number of Determinations Emission Limits (g/hp-hr) Oxidation Catalyst 13 0.08 - 1.0
NSPS JJJJ 2 2.8 - 4.4 Good Combustion Practices 15 1.5 - 5.2
No Control Specified 25 0.8 - 8.5 Table 3-2. CO Control for Large Oil-Fired Engines
Control Technology Number of Determinations Emission Limits (g/hp-hr) Oxidation Catalyst 1 2.6
NSPS IIII 14 0.2 - 2.6 Good Combustion Practices 36 0.0008 - 2.7
No Control Specified 36 0.13 - 23.2 Step 1 – Identification of CO Control Technologies for Large Engines From research, the Department identified the following technologies as available for CO control of engines rated at 500 hp or greater:
(a) Oxidation Catalyst
Donlin Gold, LLC. – Donlin Gold Project Final – June 30, 2017 Construction Permit AQ0934CPT01
Page 28 of 88
CO catalysts oxidize CO and hydrocarbon compounds to carbon dioxide and water vapor. The reaction is spontaneous and no reactants are required. CO catalysts can achieve up to 90% reduction in CO emissions.
(b) Good Combustion Practices (GCP) GCP typically include the following elements:
1. Sufficient residence time to complete combustion; 2. Providing and maintaining proper air/fuel ratio; 3. High temperatures and low oxygen levels in the primary combustion zone; 4. High enough overall excess oxygen levels to complete combustion and maximize
thermal efficiency; 5. Proper fuel gas supply system designed to minimize effects of contaminants or
fluctuations in pressure and flow on the fuel gas delivered.
Combustion efficiency is dependent on the gas residence time, the combustion temperature, and the amount of mixing in the combustion zone. GCP is accomplished primarily through combustion chamber design as it relates to residence time, combustion temperature, air-to-fuel mixing, and excess oxygen levels.
(c) Good Operating Practices (GOP) GOP typically include the following elements:
1. All operators and supervisors shall be properly trained to operate and ensure maintenance of a system in accordance with the guidelines and procedures established by the manufacturer.
2. Training shall include good operating practices as well as methods for minimizing excess emissions.
Step 2 – Elimination of Technically Infeasible CO Control Options for Large Engines All three control technologies listed above are technically feasible. Step 3 – Ranking of Remaining CO Control Options for Large Engines The following control technologies have been identified and ranked for control of CO from the large engines:
(a) Oxidation Catalyst (90% Control) (b) Good Combustion Practices (Less than 90% Control) (c) Good Operating Practices (Less than 90% Control)
Step 4 – Evaluate the Most Effective Controls An oxidation catalyst will reduce CO emissions from EU IDs 1 - 12 while having minimal energy and environmental impacts. This system requires no consumables and does not produce waste effluents or by-products aside from catalyst replacement and recycling as necessary. Engine efficiency will be minimally impacted by the oxidation catalyst.

Donlin Gold, LLC. – Donlin Gold Project Final – June 30, 2017 Construction Permit AQ0934CPT01
Page 29 of 88
RBLC Review A review of similar units in the RBLC indicates that an oxidation catalyst and good combustion practices are the principle CO control technologies installed on large engines. Applicant Proposal Donlin proposed to install an oxidation catalyst and maintain good combustion practices for each of EU IDs 1 - 12 as BACT for reducing CO emissions from natural gas and ULSD combustion. Catalytic oxidation and good combustion practices will reduce CO emissions to below the applicable CO emission limit in NSPS Subpart JJJJ for firing natural gas. The CO BACT emission rates will be 0.18 g/kW-hr when firing ULSD and 0.12 g/kW-hr when firing natural gas in EU IDs 1 - 12. 3.2 NOx Possible NOx emission control technologies for large engines were obtained from the RBLC. The RBLC was searched for all determinations in the last 10 years under the process codes 17.100 to 17.190, Large Internal Combustion Engines (>500 hp). The search results for gas-fired and oil-fired engines are summarized in Table 3-3 and Table 3-4, respectively. Table 3-3. NOx Control for Large Gas-Fired Engines
Control Technology Number of Determinations Emission Limits (g/hp-hr) Selective Catalytic Reduction 3 0.08 - 0.21
Other Add-On Control 3 0.07 - 3.0 NSPS JJJJ 2 0.5 - 2.2
Good Combustion Practices 22 0.4 - 2.6 No Control Specified 33 0.5 - 6.9
Table 3-4. NOx Control for Large Oil-Fired Engines
Control Technology Number of Determinations Emission Limits (g/hp-hr) Selective Catalytic Reduction 3 0.5 - 0.7
Other Add-On Control 1 1.0 NSPS IIII 12 3.0 - 6.9
Good Combustion Practices 29 3.0 - 13.5 No Control Specified 60 2.8 - 14.1
Step 1 – Identification of NOx Control Technologies for Large Engines From research, the Department identified the following technologies as available for NOx control of engines rated at 500 hp or greater:

Donlin Gold, LLC. – Donlin Gold Project Final – June 30, 2017 Construction Permit AQ0934CPT01
Page 30 of 88
(a) Selective Catalytic Reduction (SCR) SCR is a post-combustion gas treatment technique for reducing nitric oxide (NO) and nitrogen dioxide (NO2) in the turbine exhaust stream to molecular nitrogen (N2), water, and oxygen (O2). In the SCR process, aqueous or anhydrous ammonia (NH3) is injected into the flue gas upstream of a catalyst bed. The catalyst lowers the activation energy of the NOx decomposition reaction. NOx and NH3 combine at the catalyst surface forming an ammonium salt intermediate, which subsequently decomposes to produce elemental N2 and water. Depending on the overall NH3-to-NOx ratio, removal efficiencies are generally 80 to 90 percent.
(b) Lean-Burn Combustion Technology (Natural Gas) Natural gas and air are combined before being introduced into the cylinders. The low fuel/air ration (lean-burn) reduces NOx emissions due to a lower combustion temperature.
(c) Low NOx Combustion (ULSD) This process includes late fuel injection start, a high compression ratio, an optimized combustion chamber, an optimized fuel injection rate profile, early inlet valve closing, and high boost pressure to reduce peak combustion temperature for the control of NOx.
(d) Direct Water Injection (DWI) NOx emissions can be reduced through DWI by 40 percent if high quality water is injected at a rate of 50 to 60 percent of the fuel consumption.
(e) Good Combustion Practices See description in Section 3.1.
Step 2 – Elimination of Technically Infeasible NOx Control Options for Large Engines DWI is the only NOx control option that is technically infeasible because this technology has not yet been designed for the engine model of EU IDs 1-12. Step 3 – Ranking of Remaining NOx Control Options for Large Engines The following control technologies have been identified and ranked for control of NOx from the large engines:
(a) SCR (70% - 95% Control) (b) Good Combustion Practices (Less than 40% Control)
Step 4 – Evaluate the Most Effective Controls SCR is the most common and effective NOx control for engines of this size. Environmental impacts are that the SCR adds exhaust back pressure that decreases the engine’s efficiency and requiring additional fuel consumption; the SCR catalyst does need to be replaced and recycled as necessary, and the SCR will emit ammonia from the ammonia slip of the system. The ammonia slip is expected to be less than or equal to 9 parts per million.

Donlin Gold, LLC. – Donlin Gold Project Final – June 30, 2017 Construction Permit AQ0934CPT01
Page 31 of 88
RBLC Review A review of similar units in the RBLC indicates that SCR and good combustion practices are the principle NOx control technologies installed on large engines. Applicant Proposal Donlin proposed to install SCR and use good combustion practices for EU IDs 1 - 12 as BACT for reducing NOx emissions from combustion of natural gas and ULSD. Using SCR and good combustion practices will reduce NOx emissions to below the applicable NOx emission limit in NSPS Subpart JJJJ for firing natural gas. The NOx BACT emission rates will be 0.08 g/kW-hr when firing natural gas and 0.53 g/kW-hr when firing ULSD in EU IDs 1 - 12. 3.3 Particulates Possible particulate emission control technologies for large engines were obtained from the RBLC. The RBLC was searched for all determinations in the last 10 years under the process codes 17.100 to 17.190, Large Internal Combustion Engines (>500 hp). The search results for gas-fired and oil-fired engines are summarized in Table 3-5. Table 3-5. Particulate Control for Large Gas-Fired and Oil-Fired Engines
Control Technology Number of Determinations Emission Limits (g/hp-hr) Clean Fuel
128 Gas: 0.003 – 0.40 Oil: 0.015 – 1.9 Good Combustion Practices
No Control Specified Step 1 – Identification of Particulate Control Technologies for Large Engines From research, the Department identified the following technologies as available for particulates control of engines rated at 500 hp or greater:
(a) Add-On Controls Add-on controls would include control devices such as a dust collector, electrostatic precipitator, or wet scrubber.
(b) Clean Fuel Clean fuel for particulate matter control is fuel with a low ash content.
(c) Good Combustion Practices See description in Section 3.1.
Step 2 – Elimination of Technically Infeasible Particulate Control Options for Large Engines Add-on controls options were eliminated because they are ineffective in capturing small particulates from ULSD and natural gas combustion. Step 3 – Ranking of Remaining Particulate Control Options for Large Engines The following control technologies have been identified and ranked for control of particulates from the large engines:

Donlin Gold, LLC. – Donlin Gold Project Final – June 30, 2017 Construction Permit AQ0934CPT01
Page 32 of 88
(a) Clean Fuel (b) Good Combustion Practices
Step 4 – Evaluate the Most Effective Controls According to the RBLC clean fuel and good combustion practices are the applicable controls for particulate matter for EU IDs 1 - 12. Since these are not add-on controls, there are no additional environmental impacts RBLC Review A review of similar units in the RBLC indicates that good combustion practices are the principle particulate control technologies installed on large engines. Applicant Proposal Donlin proposed to use clean fuel and good combustion practices for EU IDs 1 - 12 as BACT for reducing particulate emissions from combustion of natural gas and ULSD. Natural gas is the cleanest fossil fuel and Donlin has proposed to use fuel oil No. 1 for ULSD as it has a negligible fuel ash content. Using these particulate control methods will reduce particulate emissions to below the applicable particulate emission limit in NSPS Subpart IIII for firing ULSD. Particulate BACT emission rates will be 0.13 g/kW-hr when firing natural gas and 0.15 g/kW-hr (0.29 g/kW-hr including condensable) when firing ULSD in EU IDs 1 - 12. 3.4 VOC Possible VOC emission control technologies for large engines were obtained from the RBLC. The RBLC was searched for all determinations in the last 10 years under the process codes 17.100 to 17.190, Large Internal Combustion Engines (>500 hp). The search results for gas-fired and oil-fired engines are summarized in Table 3-6 and Table 3-7, respectively. Table 3-6. VOC Control for Large Gas-Fired Engines
Control Technology Number of Determinations Emission Limits (g/hp-hr) Oxidation Catalyst 13 0.12 – 0.8
NSPS JJJJ 2 0.16 – 1.0 Good Combustion Practices 7 0.15 – 1.0
No Control Specified 19 0.15 – 5.8 Table 3-7. VOC Control for Large Oil-Fired Engines
Control Technology Number of Determinations Emission Limits (g/hp-hr) Oxidation Catalyst 1 No Data
NSPS IIII 6 0.6 – 4.8 Good Combustion Practices 27 0.03 – 4.8
No Control Specified 26 0.01 – 2.2* *Listed as 0.7 lb/MMBtu in the RBLC and converted to g/hp-hr assuming 7,000 Btu/hp-hr Step 1 – Identification of VOC Control Technologies for Large Engines From research, the Department identified the following technologies as available for VOC control of engines rated at 500 hp or greater:

Donlin Gold, LLC. – Donlin Gold Project Final – June 30, 2017 Construction Permit AQ0934CPT01
Page 33 of 88
(a) Oxidation Catalyst See description in Section 3.1.
(b) Good Combustion Practices See description in Section 3.1.
Step 2 – Elimination of Technically Infeasible VOC Control Options for Large Engines None of the control options are technically infeasible. Step 3 – Ranking of Remaining VOC Control Options for Large Engines The following control technologies have been identified and ranked for control of VOC from the large engines:
(a) Oxidation Catalyst (90% Control) (b) Good Combustion Practices (Less than 90% Control)
Step 4 – Evaluate the Most Effective VOC Controls An oxidation catalyst will reduce VOC emissions from EU IDs 1 - 12 while having minimal energy and environmental impacts. This system requires no consumables and does not produce waste effluents or by-products aside from catalyst replacement and recycling as necessary. Engine efficiency will be minimally impacted by the oxidation catalyst. RBLC Review A review of similar units in the RBLC indicates that an oxidation catalyst and good combustion practices are the principle VOC control technologies installed on large engines. Applicant Proposal Donlin proposed to install an oxidation catalyst and good combustion practices for EU IDs 1 - 12 as BACT for reducing particulate emissions from combustion of natural gas and ULSD. Using an oxidation catalyst and good combustion practices will reduce VOC emissions to below the applicable VOC emission limit in NSPS Subpart JJJJ for firing natural gas. VOC BACT emission rates will be 0.09 g/kW-hr when firing natural gas and 0.21 g/kW-hr when firing ULSD in EU IDs 1 - 12. 3.5 GHG Possible GHG emission control technologies for large engines were obtained from the RBLC. The RBLC was searched for all determinations in the last 10 years under the process codes 17.100 to 17.190, Large Internal Combustion Engines (>500 hp). The search results for gas-fired and oil-fired engines are summarized in Table 3-8. Table 3-8. GHG Control for Large Gas-Fired and Oil-Fired Engines
Control Technology Gas-Fired Emission Limits (g/hp-hr)
Oil-Fired Emission Limits (g/hp-hr)
Good Combustion Practices 372 – 421 392 – 535 No Control Specified -- --

Donlin Gold, LLC. – Donlin Gold Project Final – June 30, 2017 Construction Permit AQ0934CPT01
Page 34 of 88
Step 1 – Identification of GHG Control Technologies for Large Engines From research, the Department identified the following technologies as available for GHG control of engines rated at 500 hp or greater:
(a) Carbon Capture and Sequestration (CCS) The EPA Guidance classifies CCS as “an add-on pollution control technology that is ‘available’ for facilities emitting CO2 in large amounts.” Donlin has included a description of CCS, and a review of the technology in their permit application. CCS is a broad term that includes a number of technologies that involves three general steps: 1) capturing the carbon dioxide directly at its source and compressing it, 2) transporting, and 3) storing it in non-atmospheric reservoirs. Capture, the most energy-intensive of all the processes, can be done either through pre-combustion methods or post-combustion methods. Pre-combustion requires the use of oxygen instead of air to combust the fuel. In general, pre-combustion reduces the energy required and the cost to remove CO2 emissions from the combustion process. The concentration of CO2 in the untreated gas stream is higher in pre-combustion capture, thereby requiring less and cheaper equipment. The other method is post-combustion, applied to conventional combustion techniques using air and carbon-containing fuels in order to isolate CO2 from the combustion exhaust gases. After capture, the CO2 is compressed to a near-liquid state, and transported via pipeline to a designated storage area. These reservoirs are deep enough for the pressure of the earth to keep it in a liquidized form where it will be sequestered for thousands of years. Depleted oil and gas reservoirs are the most practical places for storing CO2 emissions that would otherwise be emitted back into the atmosphere. Other options for storage include deep saline formations, un-mineable coal seams, and even offshore storage. The stored CO2 is expected to remain underground for as long as thousands, even millions of years.
(b) Good Combustion Practices See description in Section 3.1.
Step 2 – Elimination of Technically Infeasible GHG Control Options for Large Engines CCS is technically infeasible as there are no CCS systems commercially available for full-scale power plants in the United States. Step 3 – Ranking of Remaining GHG Control Options for Large Engines Donlin has accepted the only feasible control option. Therefore, ranking is not required. Step 4 – Evaluate the Most Effective Controls Good combustion practices will reduce GHG emissions from EU IDs 1 - 12 while having minimal energy and environmental impacts.

Donlin Gold, LLC. – Donlin Gold Project Final – June 30, 2017 Construction Permit AQ0934CPT01
Page 35 of 88
RBLC Review A review of similar units in the RBLC indicates that good combustion practices are the principle GHG control technologies installed on large engines. Applicant Proposal Donlin proposed to install new energy efficient Wärtsilä Model 18V50DF engines operated in combined cycle and good combustion practices for EU IDs 1 - 12 as BACT for reducing GHG emissions from combustion of natural gas and ULSD. Waste heat from the engines will be recovered to enhance power output efficiency. The heat rate of the combined cycle plant will be 6,953 Btu/kW-hr (gross) for natural gas firing and 7,366 Btu/kW-hr (gross) for ULSD firing. GHG BACT emission rates will be 869,621 tpy (or 305 g/hp-hr) when firing natural gas and 1,299,630 tpy (or 440 g/hp-hr) when firing ULSD in EU IDs 1 - 12. 4.0 Ore Crushing and Transfers The DGP ore crushing circuit includes ore gyratory crushing, coarse ore transfers, and recycle pebble crushing. Mined ore will be loaded through a dump pocket with a rock breaker (EU ID 38) to the gyratory crusher (EU ID 41). The gyratory crusher discharges through a surge pocket (EU ID 42) and apron feeder (EU IDs 43). Additional EUs associated with this system are the gyratory crusher circuit (EU ID 39) and gyratory crusher discharge conveyor (EU ID 44). Ore will then be moved by conveyor (EU ID 45) to the coarse ore stockpile. Four apron feeders (EU IDs 46, 48, 50, 52) will reclaim and transfer the coarse ore stockpile to the semi-autogenous grinding (SAG) mill feed conveyor (EU ID 54). The SAG mill is a wet process that does not produce particulate emissions and is not included in the BACT analysis for this reason. Material discharge from the SAG mill will be washed and screened, and the oversize material will be transferred to the pebble crushers (EU IDs 55 and 56). After crushing, the ore will be discharged to the pebble discharge conveyor (EU ID 58) which transfers material to the SAG mill feed conveyor. The ore crushers and conveyors will only emit particulates. The following section provides the BACT review for particulates. 4.1 Particulates Possible particulate emission control technologies for crushers and conveyors were obtained from the RBLC. The RBLC was searched for all determinations in the last 10 years under the process name description containing the keywords “crush” or “conveyor”, and under the process codes 80 to 90.999, Metallurgical Industry and Mineral Products. The search results for crushers and conveyors are summarized in Table 4-1 and Table 4-2, respectively. Table 4-1. Particulate Control for Crushers
Control Technology Number of Determinations Emission Limits (lb/ton) Dust Collector 22 0.001 - 0.13 Water Sprays 8 0.00025 - 0.00586
High Moisture Material 2 0.01076 - 0.13 Enclosure 0 No Data
No Control Specified 6 0.00353

Donlin Gold, LLC. – Donlin Gold Project Final – June 30, 2017 Construction Permit AQ0934CPT01
Page 36 of 88
Table 4-2. Particulate Control for Conveyors Control Technology Number of Determinations Emission Limits
Dust Collector 15 0.002 - 0.008 gr/dscf Enclosure 8 0.00005 - 0.00104 lb/ton
Water Sprays 3 0.001 - 0.01857 lb/ton Wet Scrubber 1 0.005 gr/dscf
No Control Specified 6 No Data Step 1 – Identification of Particulate Control Technologies for Crushers and Conveyors From research, the Department identified the following technologies as available for particulate control of crushers and conveyors:
(a) Dust Collectors Dust collectors or baghouses are comprised of an array of filter bags contained in housing. Air passes through the filter media from the “dirty” to the “clean” side of the bag. These devices undergo periodic bag cleaning based on the build-up of filtered material on the bag as measured by pressure drop across the device. The cleaning cycle is set to allow operation within a range of design pressure drop. Fabric filters are characterized by the type of cleaning cycle - mechanical-shaker, pulse-jet, and reverse-air. Fabric filter systems have control efficiencies of 95% to 99.9% (EPA-452/F-03-024, EPA-452/F-03-025, and EPA-452/F-03-026, Air Pollution Control Technology Fact Sheets for Fabric Filters), and are generally specified to meet a discharge concentration of filterable particulate (e.g., 0.01 grains per dry standard cubic feet).
(b) Water Sprays Water sprays are used to wet the material to minimize the amount of fugitive dust.
(c) High Moisture Material A higher moisture material will produce less particulate emissions when transported via conveyor or sent through a crusher.
(d) Enclosure Enclosure structures shelter material from wind entrainment and are used to control particulate emissions. Enclosures can either fully or partially enclose the source and control efficiency is dependent on the level of enclosure.
(e) Wet Scrubber Wet Scrubbers use a scrubbing solution to remove particulate matter from exhaust streams. The mechanism for particulate collection is impaction and interception by water droplets. Wet scrubbers are configured as counter-flow, cross-flow, or concurrent flow, but typically employ counter-flow where the scrubbing fluid flows in the opposite direction as the gas flow.
(f) Electrostatic Precipitator (ESP)

Donlin Gold, LLC. – Donlin Gold Project Final – June 30, 2017 Construction Permit AQ0934CPT01
Page 37 of 88
ESPs remove particulates from a gas stream by electrically charging particles with a discharge electrode in the gas path and then collecting the charged particles on the grounded.
Step 2 – Elimination of Technically Infeasible Particulate Control Options for Crushers and Conveyors Due to design of the conveyors it is infeasible to install dust collectors or ESPs for them. Step 3 – Ranking of Remaining Particulate Control Options for Crushers and Conveyors The following control technologies have been identified and ranked for control of particulates from the crushers and conveyors:
(a) Enclosure (>99% Control) (b) Wet Scrubber (50% - 99%) (c) High Moisture Material (less than 99% Control) (d) Water Sprays (up to 90% Control)
Step 4 – Evaluate the Most Effective Controls For the gyratory crusher, dump pocket, and conveyors where a dust collector is infeasible (EU IDs 38, 44, 45, 54, and 58) an enclosure is the most effective method of control for particulates. For the gyratory crusher circuit, crusher, surge pocket, and apron feeders (EU IDs 39, 41 – 43, 46, 48, 50, 52, 55, and 56) dust collectors are the most effective control method. RBLC Review A review of similar units in the RBLC indicates that dust collectors and enclosures are the principle particulate control technologies installed on crushers and conveyors. A cost analysis was not necessary as Donlin chose to use the most effective of the technically feasible control devices for the crushers and conveyors. Applicant Proposal Donlin proposed to use dust collectors for EU IDs 39, 41 - 43, 46, 48, 50, 52, 55, and 56 as BACT for reducing particulate emissions. Donlin proposed to use enclosures for EU IDs 38, 44, 45, 54, and 58 as BACT for reducing particulate emissions on the conveyors. The particulate BACT emission rates for the units with dust collectors will be 0.01 gr/dscf which is below the applicable NSPS Subpart LL limit. The particulate BACT emission rates for the units with enclosures will be 0.00048 lb/ton and will be able to achieve the required no more than 10 percent opacity requirement for fugitive emissions under NSPS Subpart LL. 5.0 Autoclaves The autoclave circuit includes two autoclaves (EU IDs 77 and 81) operating in parallel. The autoclaves will be used for the oxidation of gold-bearing sulfide minerals to metal sulfates using a combination of heat, acid, and oxygen sparging. The autoclaves will emit CO, particulates, VOC, SO2, H2S, and GHG. The following sections provide a BACT review for each of these pollutants (except SO2 and H2S).

Donlin Gold, LLC. – Donlin Gold Project Final – June 30, 2017 Construction Permit AQ0934CPT01
Page 38 of 88
The RBLC currently does not have determinations for autoclaves with the same function as the EUs at DGP. The only autoclave entry is for an autoclave used for pitch impregnation. 5.1 CO Possible CO emission control technologies for autoclaves were determined based on research for similar ore autoclaves. Nevada currently has three gold mines using similar units with a total of 9 EUs. Step 1 – Identification of CO Control Technologies for Autoclaves From research, the Department identified the following technologies as available for CO control of autoclaves:
(a) Thermal Oxidation The thermal oxidizer has a stabilized flame maintained by a combination of auxiliary fuel, waste gas compounds, and supplemental air added when necessary. This technology is typically applied for destruction of organic vapors, nevertheless it is also considered as a technology for controlling CO emissions. Upon passing through the flame, the gas containing CO is heated from its inlet temperature to its ignition temperature (the temperature at which the combustion reaction rate (and consequently the energy production rate) exceeds the rate of heat losses, thereby raising the temperature of the gases to some higher value). Thus, any CO/air mixture will ignite if its temperature is raised to a sufficiently high level. The CO-containing mixture ignites at some temperature between the preheat temperature and the reaction temperature. The ignition occurs at some point during the heating of a waste stream. The mixture continues to react as it flows through the combustion chamber. Most thermal units are designed to provide no more than 1 second of residence time to the waste gas with typical temperatures of 1,200 °F to 2,000 °F. Once the unit is designed and built, the residence time is not easily changed, so that the required reaction temperature becomes a function of the particular gaseous species and the level of control. Regenerative thermal oxidizers consist of direct contact heat exchangers constructed of a ceramic material that can tolerate the high temperatures needed to achieve ignition of the waste stream. The inlet gas first passes through a hot ceramic bed thereby heating the stream (and cooling the bed) to its ignition temperature. The hot gases then react (releasing energy) in the combustion chamber and while passing through another ceramic bed, thereby heating it to the combustion chamber outlet temperature. The process flows are then switched, feeding the inlet stream to the hot bed. This cyclic process affords high energy recovery (up to 95%). The higher capital costs associated with these high-performance heat exchangers and combustion chambers may be offset by the auxiliary fuel savings to make such a system economical.

Donlin Gold, LLC. – Donlin Gold Project Final – June 30, 2017 Construction Permit AQ0934CPT01
Page 39 of 88
(b) Catalytic Oxidation Catalytic oxidation is also a widely used control technology to control pollutants where the waste gas is passed through a flame area and then through a catalyst bed for complete combustion of the waste in the gas. This technology is typically applied for destruction of organic vapors; nevertheless it is considered a technology for controlling CO emissions. A catalyst is an element or compound that speeds up a reaction at lower temperatures (compared to thermal oxidation) without the catalyst undergoing change itself. Catalytic oxidizers operate at 650°F to 1000°F and require approximately 1.5 to 2.0 ft3 of catalyst per 1000 standard ft3 gas flow. Emissions from some emission units may contain significant amount of particulates. These particulates can poison the catalyst resulting in the failure of catalytic oxidation. For some fuels, such as coal and residual oil, contaminants would likely be present in such concentrations so as to foul catalysts quickly thereby making such systems infeasible due to the need to constantly replace catalyst materials. In addition, the use of oxidation catalysts on units with high sulfur fuels can also result in the creation of sulfuric acid mist through the conversion of SO2 to SO3 and subsequent combination with moisture in the exhaust gas.
(c) Good Operating Practices See description in Section 3.1.
Step 2 – Elimination of Technically Infeasible CO Control Options for Autoclaves All control technologies listed above are technically feasible. However, thermal and catalytic oxidation controls are not commercially installed on ore autoclaves and are not considered a viable option of CO control. Step 3 – Ranking of Remaining CO Control Options for Autoclaves Donlin has accepted the only feasible control option. Therefore, ranking is not required. Step 4 – Evaluate the Most Effective Controls Good operating practices is the best CO control technology for EU IDs 77 and 81. Applicant Proposal Donlin proposed to use good operating practices for controlling CO emissions from the autoclaves. The CO BACT emission rate will be 88.0 lb/hr for EU IDs 77 and 81. 5.2 Particulates Possible particulate emission control technologies for autoclaves were determined based on research for similar ore autoclaves. Nevada currently has three gold mines using similar units with a total of 9 EUs. The search results for ore autoclaves is summarized in Table 5-1.

Donlin Gold, LLC. – Donlin Gold Project Final – June 30, 2017 Construction Permit AQ0934CPT01
Page 40 of 88
Table 5-1. Particulate Control for Autoclaves
Control Technology Number of Determinations Emission Limits (lb/hr)
Venturi Scrubber 5 2.28 or 8.4 Primary and Secondary Venturi Scrubber 3 10.50 (3 EU combined limit)
Wet Scrubber 1 No Data Step 1 – Identification of Particulate Control Technologies for Autoclaves From research, the Department identified the following technologies as available for particulate control of ore autoclaves:
(a) Venturi Scrubber Venturi scrubbers are a variety of wet scrubbers that removes air pollutants, primarily particulates, by inertial and diffusional interception.
(b) Wet Scrubber See description in Section 4.1.
(c) Dust Collector See description in Section 4.1.
(d) ESP See description in Section 4.1.
Step 2 – Elimination of Technically Infeasible Particulate Control Options for Autoclaves The feasibility of using a dust collector or ESP for controlling particulates from an autoclave is unknown as they are not currently in use. It is unlikely that they would be more effective than a venturi scrubber. Step 3 – Ranking of Remaining Particulate Control Options for Autoclaves The following control technologies have been identified and ranked for control of particulates from the autoclaves.
(a) Venturi Scrubber (70%-99% Control) (b) Wet Scrubber (50%-99% Control)
Step 4 – Evaluate the Most Effective Controls A venturi scrubber for each of the autoclaves would be the most effective particulate control. Applicant Proposal Donlin proposed to use a venturi scrubber on each autoclave stack to reduce particulate emissions from EU IDs 77 and 81. The particulate BACT emission rates will be 0.22 lb/hr for EU IDs 77 and 81. 5.3 VOC
Donlin Gold, LLC. – Donlin Gold Project Final – June 30, 2017 Construction Permit AQ0934CPT01
Page 41 of 88
Possible VOC emission control technologies for autoclaves were determined based on research for similar ore autoclaves. Nevada currently has three gold mines using similar units with a total of 9 EUs. Step 1 – Identification of VOC Control Technologies for Autoclaves From research, the Department identified the following technologies as available for VOC control of autoclaves:
(a) Thermal Oxidation See description in Section 5.1.
(b) Catalytic Oxidation See description in Section 5.1.
(c) Good Operating Practices See description in Section 3.1.
(d) Activated Carbon Adsorbers
Adsorption is a surface phenomenon in which VOCs are selectively adsorbed on the surface of activated carbon. Physical adsorption is the result of the intermolecular forces of attraction between molecules of the solid and of the substance adsorbed. For example, when the intermolecular attractive forces between a solid and gas are greater than those existing between the molecules of the gas itself, the gas will condense on the surface of the solid. Activated carbon is effective in adsorbing organic compounds from a humid gas stream because it does not show a higher affinity for the polar water molecules, due to the neutral carbon atoms with no electrical gradients between molecules.
Step 2 – Elimination of Technically Infeasible VOC Control Options for Autoclaves All control technologies listed above are technically feasible. However, thermal and catalytic oxidation controls are not commercially installed on ore autoclaves and are not considered a viable option of VOC control. Step 3 – Ranking of Remaining VOC Control Options for Autoclaves Donlin has accepted the only feasible control option. Therefore, ranking is not required. Step 4 – Evaluate the Most Effective Controls Carbon adsorption is the best VOC control technology for EU IDs 77 and 81. Applicant Proposal Donlin proposed to use carbon adsorption for controlling VOC emissions from the autoclaves. The VOC BACT emission rate will be 0.04 lb/hr for each EU IDs 77 and 81. 5.4 GHG Possible GHG emission control technologies for autoclaves were determined based on research for similar ore autoclaves. Nevada currently has three gold mines using similar units with a total of 9 EUs.

Donlin Gold, LLC. – Donlin Gold Project Final – June 30, 2017 Construction Permit AQ0934CPT01
Page 42 of 88
Step 1 – Identification of GHG Control Technologies for Autoclaves From research, the Department identified the following technologies as available for GHG control of autoclaves:
(a) CCS See description in Section 3.5.
(b) Good Operating Practices See description in Section 3.1.
Step 2 – Elimination of Technically Infeasible GHG Control Options for Autoclaves CCS is technically infeasible as there are no CCS systems commercially available. Step 3 – Ranking of Remaining GHG Control Options for Autoclaves Donlin has accepted the only feasible control option. Therefore, ranking is not required. Step 4 – Evaluate the Most Effective Controls Good operating practices will reduce GHG emissions from EU IDs 77 and 81 while having minimal energy and environmental impacts. Applicant Proposal Donlin proposed to use good operating practices for controlling GHG emissions from the autoclaves. The GHG BACT emission limit will be 37,659 tons per year of CO2 combined for EU IDs 77 and 81. 6.0 Boilers and Heaters The DGP will have three boilers (EU IDs 15 - 17) that will be fueled by both natural gas and ULSD, three heaters (EU IDs 18 - 20) that will be fueled by both natural gas and ULSD, and 19 air handler heaters (EU ID 24) that will be fueled by natural gas. ULSD will be used for EU IDs 15 - 20 when natural gas is unavailable. EU IDs 15 and 16 are classified as process heaters and are exempt from NSPS Subpart Dc. EU IDs 17 - 20 and 24 are subject to requirements under NSPS Subpart Dc, but are not subject to any NSPS emissions limits. DGP will also have two SO2 burners, one operating off of natural gas (EU ID 21) and one off of ULSD (EU ID 22), 138 building heaters (EU ID 23), seven 2.5 MMBtu/hr air handler heaters (EU ID 25), and 20 portable heaters (EU ID 26). The boilers and heaters will emit CO, NOx, SO2, particulates, VOC, and GHG. The following sections provide a BACT review for each of these pollutants (except SO2) for each fuel type.

Donlin Gold, LLC. – Donlin Gold Project Final – June 30, 2017 Construction Permit AQ0934CPT01
Page 43 of 88
6.1 CO Possible CO emission control technologies for boilers and heaters were obtained from the RBLC. The RBLC was searched for all determinations in the last 10 years under the process code 13, Commercial/Institutional-Sized Boilers/Furnaces (<100 MMBtu/hr), subcategories 13.31 Gaseous Fuel and Gaseous Fuel Mixtures and 13.22, Distillate Fuel Oil. The search results for boilers and heaters are summarized in Table 6-1 and Table 6-2, respectively. Table 6-1. CO Control for Gas-Fired Boilers and Heaters
Control Technology Number of Determinations Emission Limits (lb/MMBtu)
Oxidation Catalyst 1 0.016 Good Combustion Practices 79 0.0073 - 0.84
No Control Specified 51 0.0084 - 0.15 Table 6-2. CO Control for Oil-Fired Boilers and Heaters
Control Technology Number of Determinations Emission Limits (g/hp-hr) Oxidation Catalyst 0 N/A
Good Combustion Practices 5 0.036 - 0.084 No Control Specified 2 0.036 - 0.077
Step 1 – Identification of CO Control Technologies for Boilers and Heaters From research, the Department identified the following technologies as available for CO control of boilers and heaters with a rating of less than 100 MMBtu/hr:
(a) Oxidation Catalyst See description in Section 3.1.
(b) Good Combustion Practices See description in Section 3.1
Step 2 – Elimination of Technically Infeasible CO Control Options for Boilers and Heaters Both control technologies listed above are technically feasible. Step 3 – Ranking of Remaining CO Control Options for Boilers and Heaters The following control technologies have been identified and ranked for control of CO from the boilers and heaters:
(a) Oxidation Catalyst (90% Control) (b) Good Combustion Practices (Less than 90% Control)
Step 4 – Evaluate the Most Effective Controls An oxidation catalyst would provide the best control for a boiler rated at less than 100 MMBtu/hr. However, the only BACT determination in the RBLC is for a larger 60 MMBtu/hr non-dual fuel boiler which is not a similar unit to EU IDs 15 - 26.

Donlin Gold, LLC. – Donlin Gold Project Final – June 30, 2017 Construction Permit AQ0934CPT01
Page 44 of 88
RBLC Review A review of similar units in the RBLC indicates that good combustion practices are the principle CO control technologies installed on boilers and heaters. Applicant Proposal Donlin provided an economic analysis of the installation of catalytic oxidation on the boilers and heaters to demonstrate that the use of catalytic oxidation is not economically feasible on these units. Potential annual CO emissions from the boilers and heaters are between 1.8 and 10.6 tpy per unit. The Department refined the analysis based on these potential emissions. The results are as follows:
Control Alternative
Captured Emissions
(tpy)
Emission Reduction
(tpy)
Capital Cost ($)
Operating Costs
($/year)
Total Annualized
Costs ($/year)
Cost Effectiveness
($/ton)
Catalytic Oxidation 1.8 1.6 $85,000 $51,000 $59,024 $36,890
Catalytic Oxidation 10.6 9.5 $227,000 $136,000 $157,429 $16,571
Capital Recovery Factor = 0.0944 (7% for a 20 year life cycle) The economic analysis indicates the level of CO reduction does not justify the use of catalytic oxidation on the boilers and heaters. Based on the excessive cost per ton of CO removed per year, installing catalytic oxidation on the boilers and heaters is not considered a feasible option for reducing CO emissions. Donlin proposed to use good combustion practices as BACT control for CO emissions from EU IDs 15 - 26. The resulting CO BACT emission rate for the boilers and heaters is 0.0824 lb/MMBtu when firing natural gas and 0.0384 lb/MMBtu when firing ULSD in EU IDs 15 - 26. 6.2 NOx Possible NOx emission control technologies for the boilers and heaters were obtained from the RBLC. The RBLC was searched for all determinations in the last 10 years under the process code 13, Commercial/Institutional-Size Boilers/Furnaces (<100 MMBtu/hr), subcategories 13.31 Gaseous Fuel & Gaseous Fuel Mixtures and 13.22, Distillate Fuel Oil. The search results for boilers and heaters are summarized in Table 6-3 and Table 6-4, respectively. Table 6-3. NOx Control for Gas-Fired Boilers and Heaters
Control Technology Number of Determinations Emission Limits (lb/MMBtu)
Selective Catalytic Reduction 2 0.009 - 0.015 Low-NOx Burner 101 0.009 - 0.37
Good Combustion Practices 12 0.041 - 0.24 No Control Specified 38 0.0035 - 0.14

Donlin Gold, LLC. – Donlin Gold Project Final – June 30, 2017 Construction Permit AQ0934CPT01
Page 45 of 88
Table 6-4. NOx Control for Oil-Fired Boilers and Heaters Control Technology Number of Determinations Emission Limits (g/hp-hr)
Selective Catalytic Reduction 0 N/A Low-NOx Burner 8 0.023 - 0.14
Good Combustion Practices 1 No Data No Control Specified 2 0.070 - 0.12
Step 1 – Identification of NOx Control Technologies for Boilers and Heaters From research, the Department identified the following technologies as available for NOx control of boilers and heaters rated at 100 MMBtu/hr or less:
(a) Selective Catalytic Reduction (SCR) See description in Section 3.2.
(b) Low-NOx Burners (LNB) Using LNBs can reduce formation of NOx through careful control of the fuel-air mixture during combustion. Control techniques used in LNBs includes staged air, and staged fuel, as well as other methods that effectively lower the flame temperature. Experience suggests that significant reduction in NOx emissions can be realized using LNBs. The U.S. EPA reports that LNBs have achieved reduction up to 80%, but actual reduction depends on the type of fuel and varies considerably from one installation to another. Typical reductions range from 40% - 60% but under certain conditions, higher reductions are possible.
(c) Good Combustion Practices See description in Section 3.1.
Step 2 – Elimination of Technically Infeasible NOx Control Options for Boilers and Heaters Low-NOx burners for dual-fuel fired boilers that meet the project specifications are not available for EU IDs 15 - 18. Low-NOx burners are also not available for EU ID 24. Step 3 – Ranking of Remaining NOx Control Options for Boilers and Heaters The following control technologies have been identified and ranked for control of NOx from the boilers and heaters:
(a) SCR (70% - 90% Control) (b) Low-NOx Burner (60% Control) (c) Good Combustion Practices (Less than 40% Control)
Step 4 – Evaluate the Most Effective Controls For EU IDs 19 and 20, low-NOx burner technology is the most effective NOx control for the dual-fuel fired boilers. For EU IDs 15 - 18 and 24 where low-NOx burners are not available, good combustion practices are the most effective controls. EU IDs 21 - 23, 25, and 26 are small emission units, adding Low-NOx burners or SCR would not be cost effective. For EU IDs 21 - 23, 25, and 26, good combustion practices are the most effective controls.

Donlin Gold, LLC. – Donlin Gold Project Final – June 30, 2017 Construction Permit AQ0934CPT01
Page 46 of 88
RBLC Review A review of similar units in the RBLC indicates that Low-NOx burners and good combustion practices are the principle NOx control technologies installed on boilers and heaters rated at 100 MMBtu/hr or less. Applicant Proposal Donlin proposed to use good combustion practices for EU IDs 15 - 18 and 21 - 26 as BACT for reducing NOx emissions from combustion of natural gas and ULSD. The NOx BACT emission rates will be 0.098 lb/MMBtu when firing natural gas and 0.154 lb/MMBtu when firing ULSD in EU IDs 15 - 18 and 21 - 26. Donlin proposed to install low-NOx burners and use good combustion practices for EU IDs 19 and 20 as BACT for reducing NOx emissions from combustion of natural gas and ULSD. The NOx BACT emission rates will be 0.049 lb/MMBtu when firing natural gas and 0.154 lb/MMBtu when firing ULSD in EU IDs 19 and 20. 6.3 Particulates Possible particulate emission control technologies for the boilers and heaters were obtained from the RBLC. The RBLC was searched for all determinations in the last 10 years under the process code 13, Commercial/Institutional-Size Boilers/Furnaces (<100 MMBtu/hr), subcategories 13.31 Gaseous Fuel & Gaseous Fuel Mixtures and 13.22, Distillate Fuel Oil. The search results for boilers and heaters are summarized in Table 6-5 and Table 6-6, respectively. Table 6-5. Particulate Control for Gas-Fired Boilers and Heaters
Control Technology Number of Determinations Emission Limits (lb/MMBtu)
Good Combustion Practices 61 0.0009 - 0.018 Clean Fuel 0 N/A
Wet Scrubber 0 N/A No Control Specified 95 0.001 - 0.15
Table 6-6. Particulate Control for Oil-Fired Boilers and Heaters
Control Technology Number of Determinations Emission Limits (lb/MMBtu)
Good Combustion Practices 7 0.0003 - 0.02 Clean Fuel 2 0.015 - 0.024
Wet Scrubber 1 0.017 No Control Specified 5 0.0015 - 0.030
Step 1 – Identification of Particulate Control Technologies for Boilers and Heaters From research, the Department identified the following technologies as available for particulate control of boilers and heaters rated at 100 MMBtu/hr or less:
(a) Good Combustion Practices

Donlin Gold, LLC. – Donlin Gold Project Final – June 30, 2017 Construction Permit AQ0934CPT01
Page 47 of 88
See description in Section 3.1.
(b) Clean Fuel See description in Section 3.3.
(c) Wet Scrubber See description in Section 4.1.
(d) ESP See description in Section 4.1.
Step 2 – Elimination of Technically Infeasible Particulate Control Options for Boilers and Heaters The wet scrubber and ESP were eliminated because they are ineffective in capturing small particulates from ULSD and natural gas combustion. Step 3 – Ranking of Remaining Particulate Control Options for Boilers and Heaters Donlin has accepted the only feasible control options. Therefore, ranking is not required. Step 4 – Evaluate the Most Effective Controls Use of clean fuel and good combustion practices are the most effective controls for particulates from natural gas and ULSD fired boilers and heaters rated at 100 MMBtu/hr or less. RBLC Review A review of similar units in the RBLC indicates that use of clean fuels and good combustion practices are the principle control methods for particulates from boilers firing natural gas or ULSD rated at 100 MMBtu/hr or less. Applicant Proposal Donlin proposed to use clean fuel and good combustion practices for EU IDs 15 - 26 as BACT for reducing particulate emissions from combustion of natural gas and ULSD. The resulting particulate BACT emission rates will be 0.0075 lb/MMBtu when firing natural gas and 0.0254 lb/MMBtu when firing ULSD in EU IDs 15 - 26. 6.4 VOC Possible VOC emission control technologies for the boilers and heaters were obtained from the RBLC. The RBLC was searched for all determinations in the last 10 years under the process code 13, Commercial/Institutional-Size Boilers/Furnaces (<100 MMBtu/hr), subcategories 13.31 Gaseous Fuel & Gaseous Fuel Mixtures and 13.22, Distillate Fuel Oil. The search results for boilers and heaters are summarized in Table 6-7 and Table 6-8, respectively.

Donlin Gold, LLC. – Donlin Gold Project Final – June 30, 2017 Construction Permit AQ0934CPT01
Page 48 of 88
Table 6-7. VOC Control for Gas-Fired Boilers and Heaters Control Technology Number of Determinations Emission Limits
(lb/MMBtu) Oxidation Catalyst 1 0.002
Good Combustion Practices 57 0.0014 - 0.166 No Control Specified 49 0.0015 - 0.034
Table 6-8. VOC Control for Oil-Fired Boilers and Heaters
Control Technology Number of Determinations Emission Limits (lb/MMBtu)
Oxidation Catalyst 0 N/A Good Combustion Practices 4 0.003 - 0.009
No Control Specified 2 0.0015 - 0.0041 Step 1 – Identification of VOC Control Technologies for Boilers and Heaters From research, the Department identified the following technologies as available for VOC control of boilers and heaters rated at 100 MMBtu/hr or less:
(a) Oxidation Catalyst See description in Section 3.1.
(b) Good Combustion Practices See description in Section 3.1.
Step 2 – Elimination of Technically Infeasible VOC Control Options for Boilers and Heaters Both control technologies are technically feasible for VOC control. Step 3 – Ranking of Remaining VOC Control Options for Boilers and Heaters The following control technologies have been identified and ranked for control of VOC from the boilers and heaters:
(a) Oxidation Catalyst (90% Control) (b) Good Combustion Practices (Less than 90% Control)
Step 4 – Evaluate the Most Effective Controls An oxidation catalyst would provide the best VOC control for boilers and heaters rated at less than 100 MMBtu/hr. However, the only BACT determination in the RBLC is for a liquefied natural gas vaporization heater which is not a similar unit to any of EU IDs 15 - 26. Clean fuel and good combustion practices is the most effective controls for these units. RBLC Review A review of similar units in the RBLC indicates that good combustion practices is the principle control method for VOC from boilers and heaters rated at 100 MMBtu/hr or less.

Donlin Gold, LLC. – Donlin Gold Project Final – June 30, 2017 Construction Permit AQ0934CPT01
Page 49 of 88
Applicant Proposal Donlin proposed to use good combustion practices for EU IDs 15 - 26 as BACT for reducing VOC emissions from combustion of natural gas and ULSD. The BACT VOC emission rates will be 0.0054 lb/MMBtu when firing natural gas and 0.00154 lb/MMBtu when firing ULSD in EU IDs 15 - 26. 6.5 GHG Possible GHG emission control technologies for the boilers and heaters were obtained from the RBLC. The RBLC was searched for all determinations in the last 10 years under the process code 13, Commercial/Institutional-Size Boilers/Furnaces (<100 MMBtu/hr), subcategories 13.31 Gaseous Fuel & Gaseous Fuel Mixtures and 13.22, Distillate Fuel Oil. The search identified good combustion practices or no controls as BACT for GHG emission from gas- and oil-fired boilers and heaters. Step 1 – Identification of GHG Control Technologies for Boilers and Heaters From research, the Department identified the following technologies as available for VOC control of boilers and heaters rated at 100 MMBtu/hr or less:
(a) CCS See description in Section 3.5.
(b) Good Combustion Practices See description in Section 3.1.
Step 2 – Elimination of Technically Infeasible Particulate Control Options for Boilers and Heaters CCS is technically infeasible as there are no CCS systems commercially available in the United States. Step 3 – Ranking of Remaining GHG Control Options for Boilers and Heaters Donlin has accepted the only feasible control option. Therefore, ranking is not required. Step 4 – Evaluate the Most Effective Controls Good combustion practices will reduce GHG emissions from EU IDs 15 - 26 while having minimal energy and environmental impacts. RBLC Review A review of similar units in the RBLC indicates that good combustion practices is the principle control method for GHG from boilers and heaters rated at 100 MMBtu/hr or less. Applicant Proposal Donlin proposed to use good combustion practices for EU IDs 15 - 26 as BACT for reducing GHG emissions from combustion of natural gas and ULSD. The BACT GHG emission limit will be 176,347 tons per year of CO2 emissions combined for EU IDs 15 - 26.

Donlin Gold, LLC. – Donlin Gold Project Final – June 30, 2017 Construction Permit AQ0934CPT01
Page 50 of 88
7.0 Black Start and Emergency Diesel Engines Donlin will have several emergency engines on site that include two black start generators (EU IDs 29 and 30), four camp site emergency engines (EU IDs 31 - 34), and three fire pump engines (EU IDs 35 - 37). EU IDs 29 - 37 are all considered limited use engines. The black start and emergency engines will emit CO, NOx, SO2, particulates, VOC, and GHG. The following sections provide a BACT review for each of these pollutants (except SO2). 7.1 CO Possible CO emission control technologies for limited use engines were obtained from the RBLC. The RBLC was searched for all determinations in the last 10 years under the process code 17, Large Internal Combustion Engines (>500 hp) and were filtered to include diesel-fired engines listed as limited use, emergency, fire pump, and backup engines. The search results for the black start and emergency diesel engines are summarized in Table 7-1. Table 7-1. CO Control for Black Start and Emergency Diesel Engines
Control Technology Number of Determinations Emission Limits (g/kW-hr) Good Combustion Practices 175 2.69 - 4.96
NSPS IIII 58 3.48 No Control Specified 260 0.67 - 5
Step 1 – Identification of CO Control Technologies for Black Start and Emergency Diesel Engines From research, the Department identified the following technologies as available for CO control of limited use engines rated at 500 hp or greater:
(a) Oxidation Catalyst See description in Section 3.1.
(b) Good Combustion Practices See description in Section 3.1
Step 2 – Elimination of Technically Infeasible CO Control Options for Black Start and Emergency Diesel Engines Both control technologies listed above are technically feasible. Step 3 – Ranking of Remaining CO Control Options for Black Start and Emergency Diesel Engines The following control technologies have been identified and ranked for control of CO from the emergency engines:
(a) Oxidation Catalyst (90% Control) (b) Good Combustion Practices (Less than 90% Control)

Donlin Gold, LLC. – Donlin Gold Project Final – June 30, 2017 Construction Permit AQ0934CPT01
Page 51 of 88
Step 4 – Evaluate the Most Effective Controls Catalytic oxidation will reduce CO emissions from EU IDs 29 - 37 while having minimal energy and environmental impacts. This system requires no consumables and does not produce waste effluents or by-products aside from catalyst replacement and recycling as necessary. Engine efficiency will be minimally impacted by the oxidation catalyst. RBLC Review A review of similar units in the RBLC indicates add-on control technology is not practical for limited use engines. Based on the small potential to emit associated with these units (less than 7 tpy), catalytic oxidation is not a cost effective control technology for the limited use engines. Applicant Proposal Donlin proposed to use good combustion practices and install engines certified to meet NSPS Subpart IIII as BACT for CO. For EU IDs 29 - 34 the BACT CO emission rate will be 4.38 g/kW-hr. For EU IDs 35 - 37 the BACT CO emission rate will be 3.30 g/kW-hr. 7.2 NOx and VOC Possible NOx and VOC emission control technologies for limited use engines were obtained from the RBLC. The RBLC was searched for all determinations in the last 10 years under the process code 17, Large Internal Combustion Engines (>500 hp) and were filtered to include diesel-fired engines listed as limited use, emergency, fire pump, and backup engines. The search results for the black start and emergency diesel engines are summarized in Table 7-2. Table 7-2. NOx and VOC Control for Black Start and Emergency Diesel Engines
Control Technology Number of Determinations Emission Limits (g/kW-hr) Good Combustion Practices 175 3.83 - 12.73
NSPS IIII 58 4.02 - 10.46 No Control Specified 260 3.48 - 7.51
Step 1 – Identification of NOx and VOC Control Technologies for Black Start and Emergency Diesel Engines From research, the Department identified the following technologies as available for NOx and VOC control of limited use engines rated at 500 hp or greater:
(a) Selective Catalytic Reduction (SCR) See description in Section 3.2
(b) Good Combustion Practices
See description in Section 3.1. Step 2 – Elimination of Technically Infeasible NOx and VOC Control Options for Black Start and Emergency Diesel Engines SCR will reduce NOx and VOC emissions from EU IDs 29 - 37 while having minimal energy and environmental impacts. Engine efficiency will be minimally impacted by SCR.

Donlin Gold, LLC. – Donlin Gold Project Final – June 30, 2017 Construction Permit AQ0934CPT01
Page 52 of 88
Step 3 – Ranking of Remaining NOx and VOC Control Options for Black Start and Emergency Diesel Engines The following control technologies have been identified and ranked for control of NOx from the engines:
(a) SCR (70% - 95% Control) (b) Good Combustion Practices (Less than 40% Control)
Step 4 – Evaluate the Most Effective Controls A review of similar units in the RBLC indicates add-on control technology is not practical for limited use engines. Based on the small potential to emit associated with these units (less than 7 tpy), SCR is not a cost effective control technology for the limited use engines. RBLC Review A review of similar units in the RBLC indicates that good combustion practices is the principle NOx and VOC control technology for limited use diesel engines. Applicant Proposal Donlin proposed to use good combustion practices and install engines certified to meet NSPS Subpart IIII as BACT for NOx + VOC. For EU IDs 29 - 34 the BACT NOx + VOC emission rate will be 8.00 g/kW-hr. For EU IDs 35 - 37 the BACT NOx + VOC emission rate will be 3.70 g/kW-hr. 7.3 Particulates Possible particulate emission control technologies for limited use engines were obtained from the RBLC. The RBLC was searched for all determinations in the last 10 years under the process code 17, Large Internal Combustion Engines (>500 hp) and were filtered to include diesel-fired engines listed as limited use, emergency, fire pump, and backup engines. The search results for the black start and emergency diesel engines are summarized in Table 7-3. Table 7-3. Particulate Control for Black Start and Emergency Diesel Engines
Control Technology Number of Determinations Emission Limits (g/kW-hr) Good Combustion Practices 175 0.20 - 0.53
NSPS IIII 58 0.20 - 0.54 No Control Specified 260 0.027 - 0.40
Step 1 – Identification of Particulate Control Technologies for Black Start and Emergency Diesel Engines From research, the Department identified the following technologies as available for particulate control of limited use engines rated at 500 hp or greater:
(a) Good Combustion Practices See description in Section 3.1.
Step 2 – Elimination of Technically Infeasible Particulate Control Options for Black Start and Emergency Diesel Engines

Donlin Gold, LLC. – Donlin Gold Project Final – June 30, 2017 Construction Permit AQ0934CPT01
Page 53 of 88
Good combustion practices is a technically feasible particulate control method. Step 3 – Ranking of Remaining Particulate Control Options for Black Start and Emergency Diesel Engines Donlin has accepted the only feasible control option. Therefore, ranking is not required. Step 4 – Evaluate the Most Effective Controls Good combustion practices will reduce particulate emissions from EU IDs 29 - 37 while having minimal environmental impacts. RBLC Review A review of similar units in the RBLC indicates that good combustion practices are the principle particulate control technologies installed on limited use diesel engines. Applicant Proposal Donlin proposed to clean fuel, good combustion practices, and install engines certified to meet NSPS Subpart IIII as BACT for PM. For EU IDs 29 - 34 the particulate emission rate will be 0.25 g/kW-hr. For EU IDs 35 - 37 the BACT particulate emission rate will be 0.19 g/kW-hr. 7.4 GHG Possible GHG emission control technologies for limited use engines were obtained from the RBLC. The RBLC was searched for all determinations in the last 10 years under the process code 17, Large Internal Combustion Engines (>500 hp), and were filtered to include diesel-fired engines listed as limited use, emergency, fire pump, and backup engines. The search results for the black start and emergency diesel engines are summarized in Table 7-4. Table 7-4. GHG Control for Black Start and Emergency Diesel Engines
Control Technology Number of Determinations Emission Limits (tpy) Good Combustion Practices 15 0.29 - 3083
NSPS IIII 1 15.6 No Control Specified 9 19 - 892
Step 1 – Identification of GHG Control Technologies for Black Start and Emergency Diesel Engines From research, the Department identified the following technologies as available for GHG control of engines rated at 500 hp or less:
(a) CCS See description in Section 3.5.
(b) Good Combustion Practices See description in Section 3.1.
Step 2 – Elimination of Technically Infeasible GHG Control Options for Black Start and Emergency Diesel Engines

Donlin Gold, LLC. – Donlin Gold Project Final – June 30, 2017 Construction Permit AQ0934CPT01
Page 54 of 88
CCS is technically infeasible as there are no CCS systems commercially available in the United States. Step 3 – Ranking of Remaining GHG Control Options for Black Start and Emergency Diesel Engines Donlin has accepted the only feasible control option. Therefore, ranking is not required. Step 4 – Evaluate the Most Effective Controls Good combustion practices will reduce GHG emissions from EU IDs 29 - 37 while having minimal energy and environmental impacts. RBLC Review A review of similar units in the RBLC indicates that good combustion practices is the principle control method for GHG from black start and emergency diesel engines. Applicant Proposal Donlin proposed to use good combustion practices for EU IDs 29 - 37 as BACT for reducing GHG emissions from black start and emergency diesel engines. The BACT GHG emission limit will be 3,000 tons per year of CO2 emissions combined for EU IDs 29 - 37. 8.0 Small Diesel Engines Electric power for the airport will be generated from two reciprocating-engines (EU IDs 13 and 14). Each engine will be rated at 200 kWe. The airport generators will emit CO, NOx, SO2, particulates, VOC, and GHG. The following sections provide a BACT review for each of these pollutants (except SO2) for each fuel type. 8.1 CO Possible CO emission control technologies for small diesel engines were obtained from the RBLC. The RBLC was searched for all determinations in the last 10 years under the process code 17.21, Small Internal Combustion Engines (<500 hp), subcategory Fuel Oil. The search results for small diesel engines are summarized in Table 8-1. Table 8-1. CO Control for Small Diesel Engines
Control Technology Number of Determinations Emission Limits (g/kW-hr) Good Combustion Practices 134 2.69 - 4.96
NSPS IIII 17 3.48 No Control Specified 152 0.67 - 5
Step 1 – Identification of CO Control Technologies for Small Diesel Engines From research, the Department identified the following technologies as available for CO control of engines rated at 500 hp or less:
(a) Oxidation Catalyst See description in Section 3.1.
(b) Good Combustion Practices

Donlin Gold, LLC. – Donlin Gold Project Final – June 30, 2017 Construction Permit AQ0934CPT01
Page 55 of 88
See description in Section 3.1
Step 2 – Elimination of Technically Infeasible CO Control Options for Small Diesel Engines Both control technologies listed above are technically feasible. Step 3 – Ranking of Remaining CO Control Options for Small Diesel Engines The following control technologies have been identified and ranked for control of CO from the small engines:
(a) Oxidation Catalyst (90% Control) (b) Good Combustion Practices (Less than 90% Control)
Step 4 – Evaluate the Most Effective Controls Catalytic oxidation will reduce CO emissions from EU IDs 13 and 14 while having minimal energy and environmental impacts. This system requires no consumables and does not produce waste effluents or by-products aside from catalyst replacement and recycling as necessary. Engine efficiency will be minimally impacted by the oxidation catalyst. RBLC Review A review of similar units in the RBLC indicates add-on control technology is not practical for small engines. Based on the small potential to emit associated with these units (less than 9 tpy), catalytic oxidation is not a cost effective control technology for the limited use engines. Applicant Proposal Donlin proposed to use clean fuel, good combustion practices, and install engines certified to meet NSPS Subpart IIII as BACT for CO. For EU IDs 13 and 14 the BACT CO emission rate will be 4.38 g/kW-hr. 8.2 NOx Possible NOx emission control technologies for small diesel engines were obtained from the RBLC. The RBLC was searched for all determinations in the last 10 years under the process code 17.21, Small Internal Combustion Engines (<500 hp), subcategory Fuel Oil. The search results for small diesel engines are summarized in Table 8-2. Table 8-2. NOx Control for Small Diesel Engines
Control Technology Number of Determinations Emission Limits (g/kW-hr) Good Combustion Practices 134 3.83 - 12.73
NSPS IIII 17 4.02 - 10.46 No Control Specified 152 3.48 - 7.51
Step 1 – Identification of NOx Control Technologies for Small Diesel Engines From research, the Department identified the following technologies as available for NOx control of engines rated at 500 hp or less:

Donlin Gold, LLC. – Donlin Gold Project Final – June 30, 2017 Construction Permit AQ0934CPT01
Page 56 of 88
(a) Selective Catalytic Reduction (SCR) See description in Section 3.2
(b) Good Combustion Practices
See description in Section 3.1.
Step 2 – Elimination of Technically Infeasible NOx Control Options for Small Diesel Engines SCR will reduce NOx and VOC emissions from EU IDs 13 and 14 while having minimal energy and environmental impacts. Engine efficiency will be minimally impacted by SCR. Step 3 – Ranking of Remaining NOx Control Options for Small Diesel Engines The following control technologies have been identified and ranked for control of NOx from the small diesel engines:
(a) SCR (70% - 95% Control) (b) Good Combustion Practices (Less than 40% Control)
Step 4 – Evaluate the Most Effective Controls A review of similar units in the RBLC indicates add-on control technology is not practical for limited use engines. Based on the small potential to emit associated with these units (less than 1 tpy), SCR is not a cost effective control technology for the limited use engines. RBLC Review A review of similar units in the RBLC indicates that good combustion practices is the principle NOx control technology for small diesel engines. Applicant Proposal Donlin proposed to use good combustion practices and install engines certified to meet NSPS Subpart IIII as BACT for NOx. For EU IDs 13 and 14 the BACT NOx emission rate will be 0.50 g/kW-hr. 8.3 Particulates Possible particulate emission control technologies for small diesel engines were obtained from the RBLC. The RBLC was searched for all determinations in the last 10 years under the process code 17.21, Small Internal Combustion Engines (<500 hp), subcategory Fuel Oil. The search results for small diesel engines are summarized in Table 8-3. Table 8-3. Particulate Control for Small Diesel Engines
Control Technology Number of Determinations Emission Limits (g/kW-hr) Good Combustion Practices 134 0.20 - 0.53
NSPS IIII 17 0.20 - 0.54 No Control Specified 152 0.027 - 0.40
Step 1 – Identification of Particulate Control Technologies for Small Diesel Engines

Donlin Gold, LLC. – Donlin Gold Project Final – June 30, 2017 Construction Permit AQ0934CPT01
Page 57 of 88
From research, the Department identified the following technologies as available for particulate control of engines rated at 500 hp or less:
(a) Good Combustion Practices See description in Section 3.1.
Step 2 – Elimination of Technically Infeasible Particulate Control Options for Small Diesel Engines Good combustion practices is a technically feasible particulate emission control method for EU IDs 13 and 14. Step 3 – Ranking of Remaining Particulate Control Options for Small Diesel Engines Donlin has accepted the only feasible control option. Therefore, ranking is not required. Step 4 – Evaluate the Most Effective Controls Good combustion practices will reduce particulate emissions from EU IDs 13 and 14 while having minimal environmental impacts. RBLC Review A review of similar units in the RBLC indicates that good combustion practices is the principle particulate control technology for small diesel engines. Applicant Proposal Donlin proposed to use clean fuel, good combustion practices, and install engines certified to meet NSPS Subpart IIII as BACT for particulates. For EU IDs 13 and 14 the BACT particulate emission rate will be 0.03 g/kW-hr. 8.4 VOC Possible VOC emission control technologies for small diesel engines were obtained from the RBLC. The RBLC was searched for all determinations in the last 10 years under the process code 17.21, Small Internal Combustion Engines (<500 hp), subcategory Fuel Oil. The search results for small diesel engines are summarized in Table 8-4. Table 8-4. VOC Control for Small Diesel Engines
Control Technology Number of Determinations Emission Limits (g/kW-hr) Good Combustion Practices 134 0.19 - 4.02
NSPS IIII 17 4.02 No Control Specified 152 0.0034 - 4.02
Step 1 – Identification of VOC Control Technologies for Small Diesel Engines From research, the Department identified the following technologies as available for VOC control of engines rated at 500 hp or less:
(a) Good Combustion Practices See description in Section 3.1.

Donlin Gold, LLC. – Donlin Gold Project Final – June 30, 2017 Construction Permit AQ0934CPT01
Page 58 of 88
Step 2 – Elimination of Technically Infeasible VOC Control Options for Small Diesel Engines Good combustion practices is a technically feasible VOC emission control method for EU IDs 13 and 14. Step 3 – Ranking of Remaining VOC Control Options for Small Diesel Engines Donlin has accepted the only feasible control option. Therefore, ranking is not required. Step 4 – Evaluate the Most Effective Controls Good combustion practices will reduce VOC emissions from EU IDs 13 and 14 while having minimal environmental impacts. RBLC Review A review of similar units in the RBLC indicates that good combustion practices is the principle VOC control technology for small diesel engines. Applicant Proposal Donlin proposed to use good combustion practices and install engines certified to meet NSPS Subpart IIII as BACT for VOC. For EU IDs 13 and 14 the BACT VOC emission rate will be 0.24 g/kW-hr. 8.5 GHG Possible GHG emission control technologies for small diesel engines were obtained from the RBLC. The RBLC was searched for all determinations in the last 10 years under the process code 17.21, Small Internal Combustion Engines (<500 hp), subcategory Fuel Oil. The search results for small diesel engines are summarized in Table 8-5. Table 8-5. GHG Control for Small Diesel Engines
Control Technology Number of Determinations Emission Limits (tpy) Good Combustion Practices 15 0.29 - 3083
NSPS IIII 1 15.6 No Control Specified 9 19 - 892
Step 1 – Identification of GHG Control Technologies for Small Diesel Engines From research, the Department identified the following technologies as available for GHG control of engines rated at 500 hp or less:
(c) CCS See description in Section 3.5.
(d) Good Combustion Practices See description in Section 3.1.
Step 2 – Elimination of Technically Infeasible GHG Control Options for Small Diesel Engines

Donlin Gold, LLC. – Donlin Gold Project Final – June 30, 2017 Construction Permit AQ0934CPT01
Page 59 of 88
CCS is technically infeasible as there are no CCS systems commercially available in the United States. Step 3 – Ranking of Remaining GHG Control Options for Small Diesel Engines Donlin has accepted the only feasible control option. Therefore, ranking is not required. Step 4 – Evaluate the Most Effective Controls Good combustion practices will reduce GHG emissions from EU IDs 13 and 14 while having minimal energy and environmental impacts. RBLC Review A review of similar units in the RBLC indicates that good combustion practices is the principle control method for GHG emissions from small diesel engines. Applicant Proposal Donlin proposed to use good combustion practices for EU IDs 13 and 14 as BACT for reducing GHG emissions from small diesel engines. The BACT GHG emission limit will be 2,700 tons per year of CO2 emissions combined for EU IDs 13 and 14. 9.0 Carbon Regeneration Kiln The carbon regeneration kiln (EU ID 88) heats (with electricity) used activated carbon to reactivate the carbon for reuse in the process. The carbon regeneration kiln has a design process rate of 1.65 tons per hour of carbon. The power plant will emit CO, NOx, particulates, and VOC. The following sections provide a BACT review for each of these pollutants. The RBLC currently does not have determinations for carbon regeneration kilns. Table 9-1 below lists existing gold mining operations in Alaska with minor or Title V permits with carbon regeneration emission sources. Table 9-1. Existing Sources with a Carbon Regeneration Kiln
Facility Control Technology for Carbon Regeneration Kiln Fort Knox Mine No emission controls are listed in their Title V permit
Pogo Mine Wet scrubber for particulate emissions control 9.1 CO Possible CO emission control technologies for carbon regeneration kilns were determined based on research for similar units. Alaska currently has two mines using similar units. Step 1 – Identification of CO Control Technologies for the Carbon Regeneration Kiln From research, the Department identified the following technologies as available for CO control of carbon regeneration kilns:
(a) Oxidation Catalyst See description in Section 3.1.
(b) Good Combustion Practices

Donlin Gold, LLC. – Donlin Gold Project Final – June 30, 2017 Construction Permit AQ0934CPT01
Page 60 of 88
See description in Section 3.1
Step 2 – Elimination of Technically Infeasible CO Control Options for the Carbon Regeneration Kiln Both control technologies listed above are technically feasible. Step 3 – Ranking of Remaining CO Control Options for the Carbon Regeneration Kiln The following control technologies have been identified and ranked for control of CO from the emergency engines:
(a) Oxidation Catalyst (90% Control) (b) Good Combustion Practices (Less than 90% Control)
Step 4 – Evaluate the Most Effective Controls Catalytic oxidation will reduce CO emissions from EU ID 88 while having minimal energy and environmental impacts. This system requires no consumables and does not produce waste effluents or by-products aside from catalyst replacement and recycling as necessary. Facility Review A review of similar sources in Alaska indicates add-on control technology is not practical for carbon regeneration kilns. Based on the small potential to emit associated with these units (less than 4 tpy), catalytic oxidation is not a cost effective control technology for the carbon regeneration kiln. Applicant Proposal Donlin proposed to use good operating practices as CO BACT. The CO BACT emission rate will be 0.88 lb/hr for EU ID 88.
9.2 NOx Possible NOx emission control technologies for carbon regeneration kilns were determined based on research for similar units. Alaska currently has two mines using similar units. Step 1 – Identification of NOx Control Technologies for the Carbon Regeneration Kiln From research, the Department identified the following technologies as available for NOx control of carbon regeneration kilns:
(a) Selective Catalytic Reduction (SCR) See description in Section 3.2
(b) Good Combustion Practices
See description in Section 3.1.
Step 2 – Elimination of Technically Infeasible NOx Control Options for the Carbon Regeneration Kiln SCR will reduce NOx emissions from EU ID 88 while having minimal energy and environmental impacts. Engine efficiency will be minimally impacted by SCR.

Donlin Gold, LLC. – Donlin Gold Project Final – June 30, 2017 Construction Permit AQ0934CPT01
Page 61 of 88
Step 3 – Ranking of Remaining NOx Control Options for the Carbon Regeneration Kiln The following control technologies have been identified and ranked for control of NOx from the carbon regeneration kilns:
(a) SCR (70% - 95% Control) (b) Good Combustion Practices (Less than 40% Control)
Step 4 – Evaluate the Most Effective Controls A review of similar units in the RBLC indicates add-on control technology is not practical for carbon regeneration kilns. Based on the small potential to emit associated with this unit (0.08 tpy), SCR is not a cost effective control technology for carbon regeneration kilns. Applicant Proposal Donlin proposed to use good operating practices as NOx BACT. The resulting NOx BACT emission rate is 0.02 lb/hr for EU ID 88. 9.3 Particulates Possible particulate emissions control technologies for carbon regeneration kilns were determined based on research for similar units. Alaska currently has two mines using similar units. Step 1 – Identification of Particulate Control Technologies for the Carbon Regeneration Kiln From research, the Department identified the following technologies as available for particulate control of carbon regeneration kilns:
(a) Good Operating Practices See description in Section 3.1.
(b) Wet Scrubber See description in Section 4.1
(c) Wet Off-Gas Cooler Wet Off-Gas Coolers, similar to wet scrubbers, use a solution to remove particulate matter from exhaust streams. The mechanism for particulate collection is impaction and interception by water droplets. The wet off-gas cooler will control particulate emissions and is necessary to reduce the exhaust gas temperature prior to entering the carbon bed for mercury control.
Step 2 – Elimination of Technically Infeasible Particulate Control Options for the Carbon Regeneration Kiln All listed control methods for EU ID 88 are technically feasible. Step 3 – Ranking of Remaining Particulate Control Options for the Carbon Regeneration Kiln

Donlin Gold, LLC. – Donlin Gold Project Final – June 30, 2017 Construction Permit AQ0934CPT01
Page 62 of 88
The following control technologies have been identified and ranked for control of particulates from the carbon regeneration kiln:
(a) Wet Scrubber (50% - 90% Control) (b) Wet Off-Gas Cooler (50% Control) (c) Good Operating Practices (Less than 40% Control)
Step 4 – Evaluate the Most Effective Controls The most effective control for particulates is to use a wet scrubber. However, due to the small amount of uncontrolled particulate emissions, a wet scrubber would not be cost effective. A wet off-gas cooler will provide particulate control while reducing the exhaust gas temperature as required before entering the carbon bed. This control method will have minimal impacts on the environment. Applicant Proposal Donlin proposed to use a wet off-gas cooler as particulate BACT. The particulate BACT emission rate will be 0.44 lb/hr for EU ID 88. 9.4 VOC Possible VOC emission control technologies for carbon regeneration kilns were determined based on research for similar units. Alaska currently has two mines using similar units. Step 1 – Identification of VOC Control Technologies for the Carbon Regeneration Kiln From research, the Department identified the following technologies as available for VOC control of carbon regeneration kilns:
(a) Thermal Oxidation See description in Section 5.1
(b) Catalytic Oxidation See description in Section 5.1
(c) Good Operating Practices
See description in Section 3.1.
Step 2 – Elimination of Technically Infeasible VOC Control Options for the Carbon Regeneration Kiln All control technologies listed above are technically feasible. However, thermal and catalytic oxidation controls are not commercially installed carbon regeneration kilns and are not considered a viable option of VOC control. Step 3 – Ranking of Remaining VOC Control Options for the Carbon Regeneration Kiln Donlin has accepted the only feasible control option. Therefore, ranking is not required. Step 4 – Evaluate the Most Effective Controls

Donlin Gold, LLC. – Donlin Gold Project Final – June 30, 2017 Construction Permit AQ0934CPT01
Page 63 of 88
The most effective control for VOC is to use good operating practices. This control method will have minimal impacts on the environment. Applicant Proposal Donlin proposed to use good operating practices as VOC BACT. The VOC BACT emission rate will be 0.44 lb/hr for EU ID 88. 10.0 Induction Smelting Furnace An induction smelting furnace (EU ID 100) will be operated at DGP for gold refining. The induction smelting furnace will emit particulates. The following sections provide a particulate BACT review. 10.1 Particulates Possible particulate emission control technologies for the induction smelting furnace were obtained from the RBLC. The RBLC was searched for all determinations in the last 10 years under the process name containing “furnace” and the primary fuel as electricity under process codes 80, Metallurgical Industry, and 90, Mineral Products. The search results are summarized in Table 10-1. Table 10-1. Particulate Control for the Induction Smelting Furnace
Control Technology Number of Determinations Emission Limits (gr/dscf) Dust Collector 36 0.0003 - 0.0052
Enclosure 2 No Data No Control Specified 3 No Data
Step 1 – Identification of Particulate Control Technologies for the Induction Smelting Furnace From research, the Department identified the following technologies as available for particulate control of an induction smelting furnace:
(a) Dust Collector See description in Section 4.1.
(b) ESP See description in Section 4.1.
(c) Wet Scrubber See description in Section 4.1.
(d) Enclosure See description in Section 4.1.
Step 2 – Elimination of Technically Infeasible Particulate Control Options for the Induction Smelting Furnace A dust collector, ESP, wet scrubber, and enclosure are technically feasible particulate control options.

Donlin Gold, LLC. – Donlin Gold Project Final – June 30, 2017 Construction Permit AQ0934CPT01
Page 64 of 88
Step 3 – Ranking of Remaining Particulate Control Options for the Induction Smelting Furnace The following control technologies have been identified and ranked for control of NOx from the induction smelting furnace:
(a) Dust Collector (>99% Control) (b) Enclosure (>99% Control) (c) ESP (>90% Control) (d) Wet Scrubber (50% - 90% Control)
Step 4 – Evaluate the Most Effective Controls A dust collector will reduce particulate emissions from EU ID 100 while having minimal environmental impacts. RBLC Review A review of similar units in the RBLC indicates that dust collectors are the principle particulate control technologies installed on induction smelting furnaces. Applicant Proposal Donlin proposed to install a dust collector for EU ID 100 as BACT for reducing particulate emissions. The particulate BACT emission rate will be 0.005 gr/scf for EU ID 100. 11.0 Pressure Oxidation Hot Cure The oxidized ore concentrate slurry from the autoclaves will enter three POX hot cure tanks (85 - 87). The POX hot cure tanks will emit particulates. The following section provides a BACT review for particulates. 11.1 Particulates The RBLC was searched, but there were no determinations for ore hot curing found. Step 1 – Identification of Particulate Control Technologies for Pressure Oxidation Hot Cure From research, the Department identified the following technologies as available for particulate control of ore hot curing:
(a) Dust Collector See description in Section 4.1.
(b) ESP See description in Section 4.1.
(c) Wet Scrubber See description in Section 4.1.
(d) Good Operating Practices

Donlin Gold, LLC. – Donlin Gold Project Final – June 30, 2017 Construction Permit AQ0934CPT01
Page 65 of 88
See description in Section 3.1.
Step 2 – Elimination of Technically Infeasible Particulate Control Options for Pressure Oxidation Hot Cure Dust collectors are technically infeasible because of the high moisture content of the hot cure exhaust. Step 3 – Ranking of Remaining Particulate Control Options for Pressure Oxidation Hot Cure The following control technologies have been identified and ranked for control of particulates from the hot cure:
(a) ESP (>90% Control) (b) Wet Scrubber (50% - 90% Control) (c) Good Operating Practices (Less than 40% Control)
Step 4 – Evaluate the Most Effective Controls Uncontrolled particulate emissions from EU IDs 85 - 87 will be 1.75 tons per year. Installing an ESP or wet scrubber would not be cost effective because of the low uncontrolled emissions. Therefore, the most effective controls is good operating practices. Applicant Proposal Donlin proposed to use good operating practices for EU IDs 85 - 87 as BACT for reducing particulate emissions. The particulate BACT emission rate will be 0.40 lb/hr for EU IDs 85 - 87. 12.0 Electrowinning Cells The electrowinning cells (EU IDs 91 - 94) are where precious metals are precipitated out of a precious metal bearing solution through electrolysis. The electrowinning cells will emit particulates. The following section provides a BACT review for particulates. 12.1 Particulates The RBLC was searched for any process name containing “electrowinning” and no determinations were found. Step 1 – Identification of Particulate Control Technologies for Electrowinning Cells From research, the Department identified the following technologies as available for particulate control of electrowinning cells:
(a) Dust Collector See description in Section 4.1.
(b) ESP See description in Section 4.1.
(c) Wet Scrubber See description in Section 4.1.

Donlin Gold, LLC. – Donlin Gold Project Final – June 30, 2017 Construction Permit AQ0934CPT01
Page 66 of 88
(d) Good Operating Practices
See description in Section 3.1.
Step 2 – Elimination of Technically Infeasible Particulate Control Options for Electrowinning Cells A dust collector would be technically infeasible for particulate control because of the high moisture content of the exhaust from EU IDs 91 - 94. Step 3 – Ranking of Remaining Particulate Control Options for Electrowinning Cells The following control technologies have been identified and ranked for control of particulates from the electrowinning cells:
(a) ESP (>90% Control) (b) Wet Scrubber (50% - 90% Control) (c) Good Operating Practices (<40% Control)
Step 4 – Evaluate the Most Effective Controls Uncontrolled particulate emissions from EU IDs 91 - 94 will be 0.82 tons per year. Installing an ESP or wet scrubber would not be cost effective because of the low uncontrolled emissions. Therefore, the most effective control is good operating practices. Applicant Proposal Donlin proposed to use good operating practices for EU IDs 91 - 94 as BACT for reducing particulate emissions. The particulate BACT emission rate will be 0.19 lb/hr for EU IDs 91 - 94. 13.0 Mercury Retort The mercury retort (EU ID 97) is where the precious metal bearing sludge recovered from EU IDs 91 - 94 will be heated to recover mercury before being smelted in EU ID 100. The retort will emit particulates. The following section provides a particulate BACT review for particulates. 13.1 Particulates The RBLC was searched for any process name containing “retort” and no determinations were found. Step 1 – Identification of Particulate Control Technologies for the Mercury Retort From research, the Department identified the following technologies as available for particulate control of retort:
(a) Dust Collector See description in Section 4.1.
(b) ESP See description in Section 4.1.
(c) Wet Scrubber

Donlin Gold, LLC. – Donlin Gold Project Final – June 30, 2017 Construction Permit AQ0934CPT01
Page 67 of 88
See description in Section 4.1.
(d) Good Operating Practices See description in Section 3.1.
Step 2 – Elimination of Technically Infeasible Particulate Control Options for the Mercury Retort None of the particulate control technologies listed above are technically infeasible. Step 3 – Ranking of Remaining Particulate Control Options for the Mercury Retort The following control technologies have been identified and ranked for control of particulates from the retort:
(a) Dust Collector (>99% Control) (b) ESP (>90% Control) (c) Wet Scrubber (50% - 90% Control) (d) Good Operating Practices (<40% Control)
Step 4 – Evaluate the Most Effective Controls Uncontrolled particulate emissions from EU ID 97 will be 0.13 tons per year. Installing a dust collector, ESP, or wet scrubber would not be cost effective because of the low uncontrolled emissions. Therefore, the most effective control is good operating practices. Applicant Proposal Donlin proposed to use good operating practices for EU ID 97 as BACT for reducing particulate emissions. The particulate BACT emission rate will be 0.03 lb/hr for EU ID 97. 14.0 Laboratories Three laboratory facilities will be included at DGP, the sample receiving and preparation laboratory (EU IDs 103 and 104), the assay laboratory (EU ID 106), and the metallurgical laboratory (EU IDs 108 and 109). EU IDs 104, 106, and 109 will emit particulates. The following section provides a BACT review for particulates. 14.1 Particulates The particulate emissions created by the laboratory processes will be collected by fume hoods. Research was done to determine the appropriate particulate control devices for the fume hood exhaust. Step 1 – Identification of Particulate Control Technologies for Laboratories From research, the Department identified the following technologies as available for particulate control of fume hoods:
(a) Dust Collector See description in Section 4.1.
(b) ESP

Donlin Gold, LLC. – Donlin Gold Project Final – June 30, 2017 Construction Permit AQ0934CPT01
Page 68 of 88
See description in Section 4.1.
(c) Wet Scrubber See description in Section 4.1.
Step 2 – Elimination of Technically Infeasible Particulate Control Options for Laboratories All of the controls technologies listed above are technically feasible. Step 3 – Ranking of Remaining Particulate Control Options for Laboratories The following control technologies have been identified and ranked for control of particulates from the laboratories:
(a) Dust Collector (>99% Control) (b) ESP (>90% Control) (c) Wet Scrubber (50% - 90% Control)
Step 4 – Evaluate the Most Effective Controls The most effective control technology is a dust collector. The dust collector will have a minimal impact on the environment. Applicant Proposal Donlin proposed to install dust collectors for EU IDs 104, 106, and 109 as BACT for reducing particulate emissions. The particulate BACT emission rate will be 0.009 gr/scf for EU ID 104, 0.004 gr/scf for EU ID 106, and 0.009 gr/scf for EU ID 109. 15.0 Reagent Handling for Water Treatment DGP will include a water conditioning circuit (EU ID 111) with the water treatment plant. The transfer of the water conditioning reagents will generate particulate emissions. The following section provides a BACT review for particulates. 15.1 Particulates Possible particulate emission control technologies for reagent transfers were obtained from the RBLC. The RBLC was searched for all determinations in the last 10 years under the process codes 90.019, Lime/Limestone Handling/Kiln/Storage/Manufacturing. Determinations for crushers, silos, fuel tanks, and fuel-fired sources were removed for this analysis. The search results are summarized in Table 15-1. Table 15-1. Particulate Control for Reagent Handling for Water Treatment
Control Technology Number of Determinations Emission Limits (gr/dscf) Dust Collector 25 0.002 to 0.022
Enclosure 7 No Data Water Spray 2 No Data
No Control Specified 24 0.005 Step 1 – Identification of Particulate Control Technologies for Reagent Handling for Water Treatment

Donlin Gold, LLC. – Donlin Gold Project Final – June 30, 2017 Construction Permit AQ0934CPT01
Page 69 of 88
From research, the Department identified the following technologies as available for particulate emission control of reagent handling:
(a) Dust Collector See description in Section 4.1.
(b) Enclosure See description in Section 4.1.
(c) Water Spray See description in Section 4.1.
(d) ESP See description in Section 4.1.
(e) Wet Scrubber See description in Section 4.1.
Step 2 – Elimination of Technically Infeasible Particulate Control Options for Reagent Handling for Water Treatment All of the controls listed above are technically feasible. Step 3 – Ranking of Remaining Particulate Control Options for Reagent Handling for Water Treatment The following control technologies have been identified and ranked for control of particulate emissions from reagent handling:
(a) Dust Collector (>99% Control) (b) Enclosure (>99% Control) (c) ESP (>90% Control) (d) Wet Scrubber (50% - 90% Control) (e) Water Sprays (up to 90% Control)
Step 4 – Evaluate the Most Effective Controls The most effective particulate emissions control for the reagent handling for the water treatment plant is a dust collector. A dust collector will have minimal impact on the environment. RBLC Review A review of similar units in the RBLC indicates that dust collectors, enclosures, and water sprays are the principle particulate control technologies used to control particulate emissions for reagent transfers. Applicant Proposal Donlin proposed to install a dust collector for EU ID 111 as BACT for particulate emissions. The particulate BACT emissions rate will be 0.02 gr/scf for EU ID 111.

Donlin Gold, LLC. – Donlin Gold Project Final – June 30, 2017 Construction Permit AQ0934CPT01
Page 70 of 88
16.0 Mill Reagents Handling The mill reagents handling will include lime handling and slaking (EU IDs 59, 61, and 63), flocculant handling and mixing (EU ID 65), caustic soda handling and mixing (EU ID 67), copper sulfate handling and mixing (EU ID 69), xanthate (PAX) handling and mixing (EU ID 71), and soda ash handling and mixing (EU IDs 73 and 75). The mill reagents handling will emit particulates. The following section provides a BACT review for particulates. 16.1 Particulates Possible particulate emission control technologies for reagent transfers were obtained from the RBLC. The RBLC was searched for all determinations in the last 10 years under the process codes 90.019, Lime/Limestone Handling/Kiln/Storage/Manufacturing. Determinations for crushers, silos, fuel tanks, and fuel-fired sources were removed for this analysis. The search results are summarized in Table 16-1. Table 16-1. Particulate Control for Reagent Handling for Mill Reagents Handling
Control Technology Number of Determinations Emission Limits (gr/dscf) Dust Collector 25 0.002 to 0.022
Enclosure 7 No Data Water Spray 2 No Data
No Control Specified 24 0.005 Step 1 – Identification of Particulate Control Technologies for Mill Reagents Handling From research, the Department identified the following technologies as available for particulate emissions control of mill reagents handling:
(a) Dust Collector See description in Section 4.1.
(b) Enclosure See description in Section 4.1.
(c) Water Spray See description in Section 4.1.
(d) ESP See description in Section 4.1.
(e) Wet Scrubber See description in Section 4.1.
Step 2 – Elimination of Technically Infeasible Particulate Control Options for Mill Reagent Handling

Donlin Gold, LLC. – Donlin Gold Project Final – June 30, 2017 Construction Permit AQ0934CPT01
Page 71 of 88
All of the controls listed above are technically feasible for EU IDs 59, 61, 63, 65, 67, 69, 71, 73, and 75. For EU ID 63 a dust collector is not considered technically feasible due to the moisture from slaking. Step 3 – Ranking of Remaining Particulate Control Options for Mill Reagent Handling The following control technologies have been identified and ranked for control of particulate from the mill reagent handling:
(a) Dust Collector (>99% Control) (b) Enclosure (>99% Control) (c) ESP (>90% Control) (d) Wet Scrubber (50% - 90% Control) (e) Water Sprays (up to 90% Control)
For EU ID 63 the following control technologies have been identified and ranked for control of particulates:
(a) Enclosure (>99% Control) (b) ESP (>90% Control) (c) Wet Scrubber (50% - 90% Control) (d) Water Sprays (up to 90% Control)
Step 4 – Evaluate the Most Effective Controls The most effective particulate emissions control for the mill reagent handling is a dust collector. For EU ID 63 the most effective control technology for particulate emissions is a wet scrubber. A dust collector and a wet scrubber will have a minimal impact on the environment. RBLC Review A review of similar units in the RBLC indicates that dust collectors, enclosures, and water sprays are the principle particulate control technologies used to control particulate emissions for reagent transfers. Applicant Proposal Donlin proposed to install a dust collector for EU IDs 59, 61, 65, 67, 69, 71, 73, and 75 as BACT for particulate emissions. Donlin proposed a wet scrubber for EU ID 63 as BACT for particulate emissions. The particulate BACT emissions rate will be 0.02 gr/scf for EU IDs 59, 61, 63, 65, 67, 69, 71, 73, and 75. 17.0 Fuel Tanks DGP will have a total of 21 fuel tanks that are significant3 under Title V (EU IDs 126 - 142, 150 - 152, and 156). The fuel tanks will emit VOCs. The following section provides the BACT review for VOC. 3 Insignificant Emission Units include operation, loading, and unloading of volatile liquid storage with 10,000-
gallon capacity or less, with lids or other closure and storing liquid with a vapor pressure not greater than 80 mm of mercury at 21ºC. [18 AAC 50.326(g)(3)]

Donlin Gold, LLC. – Donlin Gold Project Final – June 30, 2017 Construction Permit AQ0934CPT01
Page 72 of 88
17.1 VOC Possible VOC emission control technologies for fuel tanks were obtained from the RBLC. The RBLC was searched for all determinations in the last 10 years under the process codes 42.005 Petroleum Liquid Storage in Fixed Roof Tanks and 42.006 Petroleum Liquid Storage in Floating Roof Tanks. The search results are summarized in Table 17-1. Table 17-1. VOC Control for Fuel Tanks
Control Technology Number of Determinations Emission Limits (tpy) Floating Roof 30 0.88 - 18.57
Submerged Fill 7 0.8 - 72.5 Fixed Roof 5 0.8 - 72.5
Capture and Recover/Control 4 3.95 - 7.33 NSPS 3 114.1
Leak Detection and Repair 1 28.3 No Control Specified 15 0.05 - 81.57
Step 1 – Identification of VOC Control Technologies for Fuel Tanks From research, the Department identified the following technologies as available for VOC control of fuel tanks:
(a) Floating Roof A roof that floats on the surface of the store liquid that will rise and fall with the liquid level in the level in the tank creating no vapor space except for when tanks have low liquid levels.
(b) Submerged Fill The tank is filled through an opening underneath the liquid surface level.
(c) Fixed Roof A cone or dome shaped roof that is permanently affixed to a liquid storage tank.
(d) Capture and Recover/Control A vapor recovery unit draws hydrocarbon vapors out of the storage tank under low-pressure and then separates out any liquid collected to be recycled to the storage tank.
(e) Leak Detection and Repair
A system of detecting tank leaks for repairs. This can range from a visual inspection to a computerized system with in-tank probes.
Step 2 – Elimination of Technically Infeasible VOC Control Options for Fuel Tanks None of the controls listed above are technically infeasible. Step 3 – Ranking of Remaining VOC Control Options for Fuel Tanks The following control technologies have been identified and ranked for control of VOC from the tanks:

Donlin Gold, LLC. – Donlin Gold Project Final – June 30, 2017 Construction Permit AQ0934CPT01
Page 73 of 88
(a) Floating Roof (b) Submerged Fill (c) Fixed Roof (d) Capture and Recover/Control (e) Leak Detection and Repair
Step 4 – Evaluate the Most Effective Controls A floating roof is the most effective control. The 32 fuel tanks at DGP have a combined PTE of 1.9 tons per year of uncontrolled VOC emissions making add-on control not cost effective. Submerged fill has the best VOC emissions control without requiring an add-on control. RBLC Review A review of similar units in the RBLC indicates that submerged fill can be used as VOC control for fuel tanks. Applicant Proposal Donlin proposed to use submerged fill for EU IDs 126 - 142, 150 - 152, and 156 as BACT for reducing particulate emissions from fuel tanks. The VOC BACT emission limit will be 1.7 tpy EU IDs 126 - 142, 150 - 152, and 156. 18.0 Incinerators DGP will have two incinerators, the camp waste incinerator (EU ID 27) and the sewage sludge incinerator (EU ID 28). The incinerators will emit CO, NOx, SO2, particulates, lead, and GHG.4 The following sections provide a BACT review for each of these pollutants (except SO2, and lead). 18.1 CO Possible CO emission control technologies for the incinerators were obtained from the RBLC. The RBLC was searched for all determinations in the last 10 years under the process codes 24.4 and 24.5, Waste Disposal, subcategories Municipal Waste Combustion and Wastewater Treatment Sludge Incineration. The search results are summarized in Table 18-1. Table 18-1. CO Control for Incinerators
Control Technology Number of Determinations Emission Limits (ppmvd at 7% O2)
Good Combustion Practices 2 80 - 100 No Control Specified 1 100
Step 1 – Identification of CO Control Technologies for Incinerators From research, the Department identified the following technologies as available for CO control of incinerators:
(a) Good Combustion Practices See description in Section 3.1.
4 Incinerators emit trace amounts of organics, which are hazardous air pollutants regulated under NSPS per Section
129 of the Clean Air Act.

Donlin Gold, LLC. – Donlin Gold Project Final – June 30, 2017 Construction Permit AQ0934CPT01
Page 74 of 88
Step 2 – Elimination of Technically Infeasible CO Control Options for Incinerators The control technology listed above is technically feasible. Step 3 – Ranking of Remaining CO Control Options for Incinerators Donlin has accepted the only feasible control option. Therefore, ranking is not required. Step 4 – Evaluate the Most Effective Controls Good combustion practices are the most effective CO controls for incinerators. RBLC Review A review of similar units in the RBLC indicates that good combustion practices is the principle CO control technology for incinerators. Applicant Proposal Donlin proposed to install incinerators that will comply with NSPS Subpart CCCC (EU ID 27) and NSPS Subpart LLLL (EU ID 28). The CO BACT emission limits will be 13 ppmvd at 7% O2 for EU ID 27 and 52 ppmvd at 7% O2 for EU ID 28. 18.2 NOx Possible NOx emission control technologies for the incinerators were obtained from the RBLC. The RBLC was searched for all determinations in the last 10 years under the process codes 24.4 and 24.5, Waste Disposal, subcategories Municipal Waste Combustion and Wastewater Treatment Sludge Incineration. The search results are summarized in Table 18-2. Table 18-2. NOx Control for Incinerators
Control Technology Number of Determinations
Emission Limits (ppmvd at 7% O2)
Selective Catalytic Reduction 1 50 Selective Non-Catalytic Reduction 2 90 to 150
Low-NOx burner and flue gas recirculation
1 250
No Control Specified 2 102* * Listed as 2.71 lb/ton in the RBLC and converted to ppmvd assuming 8,760 hours of operation per year, 7,700
Btu/lb dry sludge, and 9,570 scf/MMBtu. Step 1 – Identification of NOx Control Technologies for Incinerators From research, the Department identified the following technologies as available for NOx control of incinerators:
(a) SCR See description in Section 3.2.

Donlin Gold, LLC. – Donlin Gold Project Final – June 30, 2017 Construction Permit AQ0934CPT01
Page 75 of 88
(b) Selective Non-Catalytic Reduction (SNCR) SNCR involves the non-catalytic decomposition of NOx in the flue gas to N2 and water using reducing agents such as urea or NH3. The process utilizes a gas phase homogeneous reaction between NOx and the reducing agent within a specific temperature window. The reducing agent must be injected into the flue gas at a location in the unit that provides the optimum reaction temperature and residence time. The NH3 process (trade name-Thermal DeNOx) requires a reaction temperature window of 1,600°F to 2,200°F. In the urea process (trade name–NOxOUT), the optimum temperature ranges between 1,600 °F and 2,100 °F.
(c) Low-NOx Burner and Flue Gas Recirculation Using LNBs can reduce formation of NOx through careful control of the fuel-air mixture during combustion. Control techniques used in LNBs includes staged air, and staged fuel, as well as other methods that effectively lower the flame temperature. Experience suggests that significant reduction in NOx emissions can be realized using LNBs. The U.S. EPA reports that LNBs have achieved reduction up to 80%, but actual reduction depends on the type of fuel and varies considerably from one installation to another. Typical reductions range from 40% - 60% but under certain conditions, higher reductions are possible. Flue gas recirculation lowers the peak combustion temperature and drops the percentage of oxygen in the combustion air/flue gas mixture, delaying the formation of NOx caused by high flame temperatures.
(d) Good Combustion Practices See description in Section 3.1.
Step 2 – Elimination of Technically Infeasible NOx Control Options for Incinerators All control options listed above are technically feasible. Step 3 – Ranking of Remaining NOx Control Options for Incinerators The following control technologies have been identified and ranked for control of NOx from the incinerators:
(a) SCR (70% - 90% Control) (b) Low-NOx Burner (60% Control) (c) SNCR (30% - 50% Control) (d) Good Combustion Practices (<40% Control)
Step 4 – Evaluate the Most Effective Controls Due to the low amount of maximum NOx emissions from EU IDs 27 and 28, 0.7 tpy and 0.06 tpy, respectively, any add-on control would not be cost effective. RBLC Review A review of similar units in the RBLC indicates that good combustion practices are used as NOx control for incinerators.
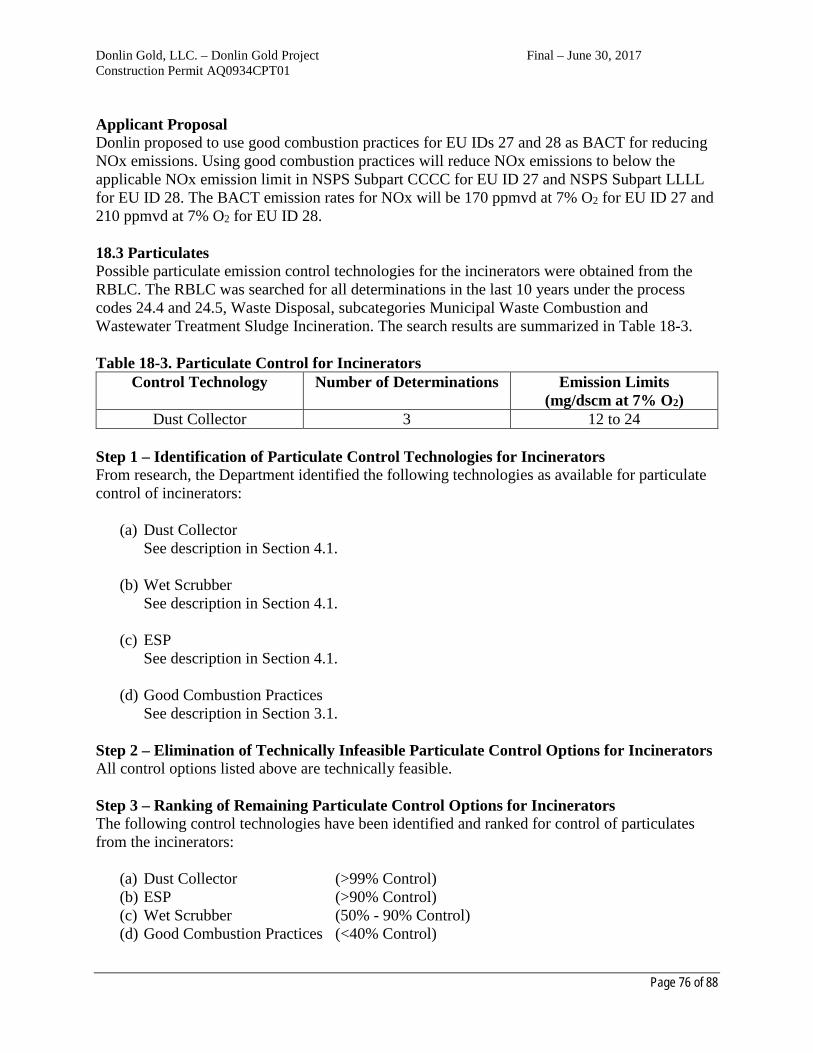
Donlin Gold, LLC. – Donlin Gold Project Final – June 30, 2017 Construction Permit AQ0934CPT01
Page 76 of 88
Applicant Proposal Donlin proposed to use good combustion practices for EU IDs 27 and 28 as BACT for reducing NOx emissions. Using good combustion practices will reduce NOx emissions to below the applicable NOx emission limit in NSPS Subpart CCCC for EU ID 27 and NSPS Subpart LLLL for EU ID 28. The BACT emission rates for NOx will be 170 ppmvd at 7% O2 for EU ID 27 and 210 ppmvd at 7% O2 for EU ID 28. 18.3 Particulates Possible particulate emission control technologies for the incinerators were obtained from the RBLC. The RBLC was searched for all determinations in the last 10 years under the process codes 24.4 and 24.5, Waste Disposal, subcategories Municipal Waste Combustion and Wastewater Treatment Sludge Incineration. The search results are summarized in Table 18-3. Table 18-3. Particulate Control for Incinerators
Control Technology Number of Determinations Emission Limits (mg/dscm at 7% O2)
Dust Collector 3 12 to 24 Step 1 – Identification of Particulate Control Technologies for Incinerators From research, the Department identified the following technologies as available for particulate control of incinerators:
(a) Dust Collector See description in Section 4.1.
(b) Wet Scrubber See description in Section 4.1.
(c) ESP See description in Section 4.1.
(d) Good Combustion Practices See description in Section 3.1.
Step 2 – Elimination of Technically Infeasible Particulate Control Options for Incinerators All control options listed above are technically feasible. Step 3 – Ranking of Remaining Particulate Control Options for Incinerators The following control technologies have been identified and ranked for control of particulates from the incinerators:
(a) Dust Collector (>99% Control) (b) ESP (>90% Control) (c) Wet Scrubber (50% - 90% Control) (d) Good Combustion Practices (<40% Control)

Donlin Gold, LLC. – Donlin Gold Project Final – June 30, 2017 Construction Permit AQ0934CPT01
Page 77 of 88
Step 4 – Evaluate the Most Effective Controls Add-on controls options were eliminated because at the maximum emissions rate allowed by NSPS Subpart CCCC for EU ID 27 and NSPS Subpart LLLL for EU ID 28, the PTE for each incinerator is below 1 ton per year. Good combustion practices will reduce particulate emissions while having minimal environmental impacts. RBLC Review A review of similar units in the RBLC indicates that good combustion practices are used as particulate control for incinerators. Applicant Proposal Donlin proposed to use good combustion practices for EU IDs 27 and 28 as BACT for reducing particulate emissions to comply with NSPS Subpart CCCC (EU ID 27) and NSPS Subpart LLLL (EU ID 28). Particulate BACT emission rates will be 270 mg/dscm at 7% O2 for EU ID 27 and 60 mg/dscm at 7% O2 for EU ID 28. 18.4 GHG Possible GHG emission control technologies for the incinerators were obtained from the RBLC. The RBLC was searched for all determinations in the last 10 years under the process codes 24.4 and 24.5, Waste Disposal, subcategories Municipal Waste Combustion and Wastewater Treatment Sludge Incineration. No results were found for GHG emissions. Step 1 – Identification of GHG Control Technologies for Incinerators From research, the Department identified the following technologies as available for GHG control of incinerators:
(a) CCS See description in Section 3.5.
(b) Good Combustion Practices See description in Section 3.1.
Step 2 – Elimination of Technically Infeasible GHG Control Options for Incinerators CCS is technically infeasible as there are no CCS systems commercially available in the United States. Step 3 – Ranking of Remaining GHG Control Options for Incinerators Donlin has accepted the only feasible control option. Therefore, ranking is not required. Step 4 – Evaluate the Most Effective Controls Good combustion practices are the most effective GHG controls for incinerators. RBLC Review A review of similar units in the RBLC indicates that good combustion practices is the principle GHG control technology for incinerators.

Donlin Gold, LLC. – Donlin Gold Project Final – June 30, 2017 Construction Permit AQ0934CPT01
Page 78 of 88
Applicant Proposal Donlin proposed to install incinerators that will comply with NSPS Subpart CCCC (EU ID 27) and NSPS Subpart LLLL (EU ID 28). The GHG BACT emission limit will be 3,934 tons per year of CO2 emissions combined for EU IDs 27 and 28. 19.0 Acidulation and Neutralization Tanks DGP will have GHG emissions from the acidulation tanks (EU ID 124) and the neutralization tanks (EU ID 125). The following sections provide the GHG BACT review. 19.1 GHG Possible GHG emission control technologies for the acidulation and naturalization tanks were determined based on research for similar tanks. Step 1 – Identification of GHG Control Technologies for Acidulation and Neutralization Tanks From research, the Department identified the following technologies as available for GHG control of the acidulation and neutralization tanks:
(a) CCS See description in Section 3.5.
(b) Good Operating Practices See description in Section 3.1.
Step 2 – Elimination of Technically Infeasible GHG Control Options for Acidulation and Neutralization Tanks CCS is technically infeasible as there are no CCS systems commercially available in the United States. Step 3 – Ranking of Remaining GHG Control Options for Acidulation and Neutralization Tanks Donlin has accepted the only feasible control option. Therefore, ranking is not required. Step 4 – Evaluate the Most Effective Controls Good operating practices are the most effective GHG controls for the acidulation and neutralization tanks. RBLC Review A review of similar units in the RBLC indicates that good operating practices is the principle GHG control technology for acidulation and neutralization tanks. Applicant Proposal Donlin proposed to use good operating practices. The GHG BACT emission limit will be 273,175 tons per year of CO2 emissions combined for EU IDs 124 and 125.

Donlin Gold, LLC. – Donlin Gold Project Final – June 30, 2017 Construction Permit AQ0934CPT01
Page 79 of 88
20.0 Fugitive Dust from Unpaved Roads DGP will have fugitive emissions from unpaved roads (EU IDs 158 - 160) while hauling ore and waste, road graders, maintenance vehicles, and other haul road travel. The unpaved roads will emit particulates. The following sections provide the particulate BACT review. 20.1 Particulates Possible particulate emission control technologies for fugitives from unpaved roads were obtained from the RBLC. The RBLC was searched for all determinations in the last 10 years under the process code 99.150, Unpaved Roads. The search results are summarized in Table 20-1. Table 20-1. Particulate Control for Fugitive Dust from Unpaved Roads
Control Technology Number of Determinations Control Efficiency (%) Chemical and Water 13 90
Water 12 50 - 95.5 Chemical 11 75 - 98
Speed Reduction 3 90 Crushed Stone 1 No Data
No Control Specified 3 No Data Step 1 – Identification of Particulate Control Technologies for Fugitive Dust from Unpaved Roads From research, the Department identified the following technologies as available for particulate control of fugitive dust from unpaved roads:
(a) Chemical and Water A spray consisting of a mixture of water and chemical suppressants are used to wet the material to minimize the amount of fugitive dust.
(b) Water See description in Section 4.1.
(c) Chemical A spray of chemical suppressants are used to wet the material to minimize the amount of fugitive dust.
(d) Speed Reduction Limiting vehicle speed on unpaved roads to decrease the amount of fugitive dust.
(e) Crushed Stone Applying a layer of crushed stone on top of an unpaved road to decrease fugitive dust from vehicles driving on the road.
Step 2 – Elimination of Technically Infeasible Particulate Control Options for Fugitive Dust from Unpaved Roads All control options listed above are technically feasible.

Donlin Gold, LLC. – Donlin Gold Project Final – June 30, 2017 Construction Permit AQ0934CPT01
Page 80 of 88
Step 3 – Ranking of Remaining Particulate Control Options for Fugitive Dust from Unpaved Roads The following control technologies have been identified and ranked for control of particulates from unpaved roads:
(a) Chemical and Water 90% control (b) Water 50 - 95.5% control (c) Chemical 75 - 98% control (d) Speed Reduction 90% control (e) Crushed Stone No data for % control
Step 4 – Evaluate the Most Effective Controls The most effective control method for fugitive dust from haul roads is the use of a chemical suppressant and water. Environmental impacts from this control method is the effect of the chemicals on the surrounding vegetation. RBLC Review A review of similar units in the RBLC indicates that the use of chemical suppressant and water are the principle particulate control methods used for fugitive emissions from unpaved roads. Applicant Proposal Donlin proposed to apply both water and a chemical suppressant with the expectation to achieve 90 percent or greater control efficiency. The PM BACT limit for unpaved roads will be 3,500 tons per year for EU IDs 158 - 160. 21.0 Fugitive Dust from Material Loading and Unloading DGP will have fugitive emissions from material loading and unloading (EU IDs 115 - 120). The material loading and unloading will emit particulates. The following sections provide the particulate BACT review. 21.1 Particulates Possible particulate emission control technologies for fugitive emissions from material loading and unloading were obtained from the RBLC. The RBLC was searched for all determinations in the last 10 years under the process code 19.190, Other Fugitive Dust Sources and filtered to only include material transfer emission sources. The search results are summarized in Table 20-1. Table 21-1. Particulate Control for Fugitive Dust from Material Loading and Unloading
Control Technology Number of Determinations Control Efficiency (%) Enclosure 65 50 - 95 Baghouse 41 98.8 - 99.7
Water Spray 7 90 - 98.3 Moisture Content 5 90 - 99
No Control Specified 12 No Data

Donlin Gold, LLC. – Donlin Gold Project Final – June 30, 2017 Construction Permit AQ0934CPT01
Page 81 of 88
Step 1 – Identification of Particulate Control Technologies for Fugitive Dust from Material Loading and Unloading From research, the Department identified the following technologies as available for particulates control of material loading and unloading:
(a) Enclosure See description in Section 4.1.
(b) Dust Collector See description in Section 4.1.
(c) Water Spray See description in Section 4.1.
(d) Moisture Content See description in Section 4.1.
Step 2 – Elimination of Technically Infeasible Particulate Control Options for Fugitive Dust from Material Loading and Unloading Add-on controls such as a baghouse or enclosure are not technically feasible because the loading and unloading operations at DGP are mobile. Step 3 – Ranking of Remaining Particulate Control Options for Fugitive Dust from Material Loading and Unloading The following control technologies have been identified and ranked for control of particulates from the fugitive dust from unpaved roads:
(a) Water Spray (up to 90% control) (b) Moisture Content (<90% control)
Step 4 – Evaluate the Most Effective Controls The most effective control method for fugitive dust from material loading and unloading is the use of a water spray. Environmental impact from this control method is minimal. RBLC Review A review of similar units in the RBLC indicates that the use of a water spray is a principle particulate control methods used for fugitive emissions from material loading and unloading. Applicant Proposal Donlin proposed to avoid activities during adverse winds and water work areas, as outlined in the fugitive dust plan. The PM BACT limit from material loading and unloading will be 530 tons per year for EU IDs 115 - 120. 22.0 Fugitive Dust from Wind Erosion Exposed and active mining areas can be a source of fugitive emissions due to wind erosion.

Donlin Gold, LLC. – Donlin Gold Project Final – June 30, 2017 Construction Permit AQ0934CPT01
Page 82 of 88
The wind erosion will emit particulates. The following sections provide the particulate BACT review. 22.1 Particulates Possible particulate emission control technologies for fugitives from wind erosion were obtained from the RBLC. The RBLC was searched for all determinations in the last 10 years under the process code 99.190, Other Fugitive Dust Sources and filtered to only include wind erosion emission sources. The search results are summarized in Table 22-1. Table 22-1. Particulate Control for Fugitive Dust from Wind Erosion
Control Technology Number of Determinations Control Efficiency (%) Water Spray 24 50 - 90
Chemical 2 85 Enclosure 7 50
Moisture Content 2 90 Wind Block 1 No Data
No Control Specified 3 No Data Step 1 – Identification of Particulate Control Technologies for Fugitive Dust from Wind Erosion From research, the Department identified the following technologies as available for control of fugitive dust from wind erosion:
(a) Water Spray Water sprays are used to wet the material to minimize the amount of fugitive dust.
(b) Chemical A spray of chemical suppressants are used to wet the material to minimize the amount of fugitive dust.
(c) Enclosure See description in Section 4.1.
(d) Moisture Content See description in Section 4.1.
(e) Wind Block A wind block is used to slow wind by deflecting it. They can range from a row of trees to a fabric fence, to an artificial shelter.
Step 2 – Elimination of Technically Infeasible Particulate Control Options for Fugitive Dust from Wind Erosion Add-on controls such as an enclosure or wind block are not technically feasible because of the large exposed areas that may be exposed to wind erosion.

Donlin Gold, LLC. – Donlin Gold Project Final – June 30, 2017 Construction Permit AQ0934CPT01
Page 83 of 88
Step 3 – Ranking of Remaining Particulate Control Options for Fugitive Dust from Wind Erosion The following control technologies have been identified and ranked for control of particulates from unpaved roads:
(a) Water Spray (up to 90% control) (b) Moisture Content (90% control) (c) Chemical (85% control)
Step 4 – Evaluate the Most Effective Controls The most effective control method for fugitive dust from wind erosion is the use of a chemical suppressant. Environmental impacts from this control method are the effects of the chemical suppressant on the surrounding vegetation. RBLC Review A review of similar units in the RBLC indicates that the use of a water spray is a principle particulate control methods used for fugitive emissions from wind erosion. Applicant Proposal Donlin proposed to use phased surface disturbance, dozer maintenance of waste facility surfaces, and chemical application. Donlin will also cover the coarse ore stockpile to reduce particulate emissions, and the haul road wind erosion emissions will be controlled with the fugitives from unpaved roads discussed in Section 20.1. The estimated total fugitive dust emission from wind erosion is 25 tons per year from EU ID 161. 23.0 Drilling and Blasting DGP will have fugitive emissions from drilling (EU ID 113) and blasting (EU ID 114). The drilling will emit particulates, and the blasting will emit CO, NOx, particulates, and GHG. The following sections provide the CO, NOx, and particulate BACT reviews. 23.1 CO Possible CO emission control technologies from blasting were obtained from the RBLC. The RBLC was searched for all determinations in the last 10 years under the process code 99.190, Other Fugitive Dust Sources and filtered to only include blasting activities. Only one determination was found in the RBLC with no control specified. RBLC Review A review of similar units in the RBLC indicates that there is no CO emission control available for blasting. Applicant Proposal Donlin proposed to use best practical methods as BACT for CO emissions from blasting. Total emissions from blasting for CO will be approximately 1,921 tons per year for EU IDs 113 and 114.

Donlin Gold, LLC. – Donlin Gold Project Final – June 30, 2017 Construction Permit AQ0934CPT01
Page 84 of 88
23.2 NOx Possible NOx emission control technologies from blasting were obtained from the RBLC. The RBLC was searched for all determinations in the last 10 years under the process code 99.190, Other Fugitive Dust Sources and filtered to only include blasting activities. Only one determination was found in the RBLC with no control specified. RBLC Review A review of similar units in the RBLC indicates that there is no NOx emission control available for blasting. Applicant Proposal Donlin proposed to use best practical methods as BACT for NOx emissions from blasting. Total emissions from blasting for NOx will be approximately 52 tons per year. 23.3 Particulates Possible particulate emission control technologies from drilling blasting were obtained from the RBLC. The RBLC was searched for all determinations in the last 10 years under the process code 99.190, Other Fugitive Dust Sources and filtered to only include drilling or blasting activities. Only one determination was found in the RBLC with no control specified. RBLC Review A review of similar units in the RBLC indicates that there is no particulate emission control available for drilling and blasting. Applicant Proposal Donlin proposed to avoid activities during adverse winds, and using blast-hole-stemming and wet and/or shrouded drilling when practical as set out in their fugitive dust plan as BACT for particulate emissions from drilling and blasting. Total potential particulate emissions from EU IDs 113 and 114 are approximated to be 273 tons per year.

Donlin Gold LLC – Donlin Gold Project Final – June 30, 2017 Construction Permit AQ0934CPT01
Page 85 of 88
APPENDIX C: BACT SUMMARY Table C-1. CO BACT Limits
EU ID Description BACT Limit BACT Control 1 - 12 17 MW Wartsilla engines (ULSD) 0.18 g/kW-hr Oxidation Catalyst with Good Combustion Practices 1 - 12 17 MW Wartsilla engines (Natural Gas) 0.12 g/kW-hr Oxidation Catalyst with Good Combustion Practices
13 & 14 200 kW Airport Generators 4.38 g/kW-hr Good Combustion Practices; Clean Fuels; 40 CFR 60 Subpart IIII 15 - 26 Boilers and Heaters (ULSD) 0.0384 lb/MMBtu Good Combustion Practices 15 - 26 Boilers and Heaters (Natural Gas) 0.0824 lb/MMBtu Good Combustion Practices
27 Camp Waste Incinerator 13 ppmvd at 7% O2 Good Combustion Practices; 40 CFR 60 Subpart CCCC, Table 8 28 Sewage Sludge Incinerator 52 ppmvd at 7% O2 Good Combustion Practices; 40 CFR 60 Subpart LLLL, Table 2
29 - 34 Emergency Engines > 560 kW 4.38 g/kW-hr Good Combustion Practices; Clean Fuels; 40 CFR 60 Subpart IIII 35 - 37 Fire Pump Engines 130 < kW < 225 3.30 g/kW-hr Good Combustion Practices; Clean Fuels; 40 CFR 60 Subpart IIII 77 & 81 Autoclaves 88 lb/hr Good Operating Practices
88 Carbon Regeneration Kiln 0.88 lb/hr Good Operating Practices 113 & 114 Drilling and Blasting 1,921 tpy Good Combustion Practices
Table C-2. NOx BACT Limits
EU ID Description BACT Limit BACT Control 1 – 12 17 MW Wartsilla engines (ULSD) 0.53 g/kW-hr Selective Catalytic Reduction; Good Combustion Practices 1 – 12 17 MW Wartsilla engines (Natural Gas) 0.08 g/kW-hr Selective Catalytic Reduction; Good Combustion Practices
13 & 14 200 kW Airport Generators 0.5 g/kW-hr Good Combustion Practices; Clean Fuels; 40 CFR 60 Subpart IIII 15 - 18 & 21 - 26 Boilers and Heaters (ULSD) 0.154 lb/MMBtu Good Combustion Practices 15 - 18 & 21 - 26 Boilers and Heaters (Natural Gas) 0.098 lb/MMBtu Good Combustion Practices
19 & 20 Power Plant Auxiliary Heaters (ULSD) 0.154 lb/MMBtu Low-NOx Burners 19 & 20 Power Plant Auxiliary Heaters (Natural Gas) 0.049 lb/MMBtu Low-NOx Burners
27 Camp Waste Incinerator 170 ppmvd at 7% O2 Good Combustion Practices; 40 CFR 60 Subpart CCCC, Table 8 28 Sewage Sludge Incinerator 210 ppmvd at 7% O2 Good Combustion Practices; 40 CFR 60 Subpart LLLL, Table 2
29 – 34 Emergency Engines > 560 kW 8.0 g/kW-hr 1 Good Combustion Practices; Clean Fuels; 40 CFR 60 Subpart IIII 35 – 37
T bl N Fire Pump Engines 130 < kW < 225 3.7 g/kW-hr 1 Good Combustion Practices; Clean Fuels; 40 CFR 60 Subpart IIII
88 Carbon Regeneration Kiln 0.02 lb/hr Good Operating Practices
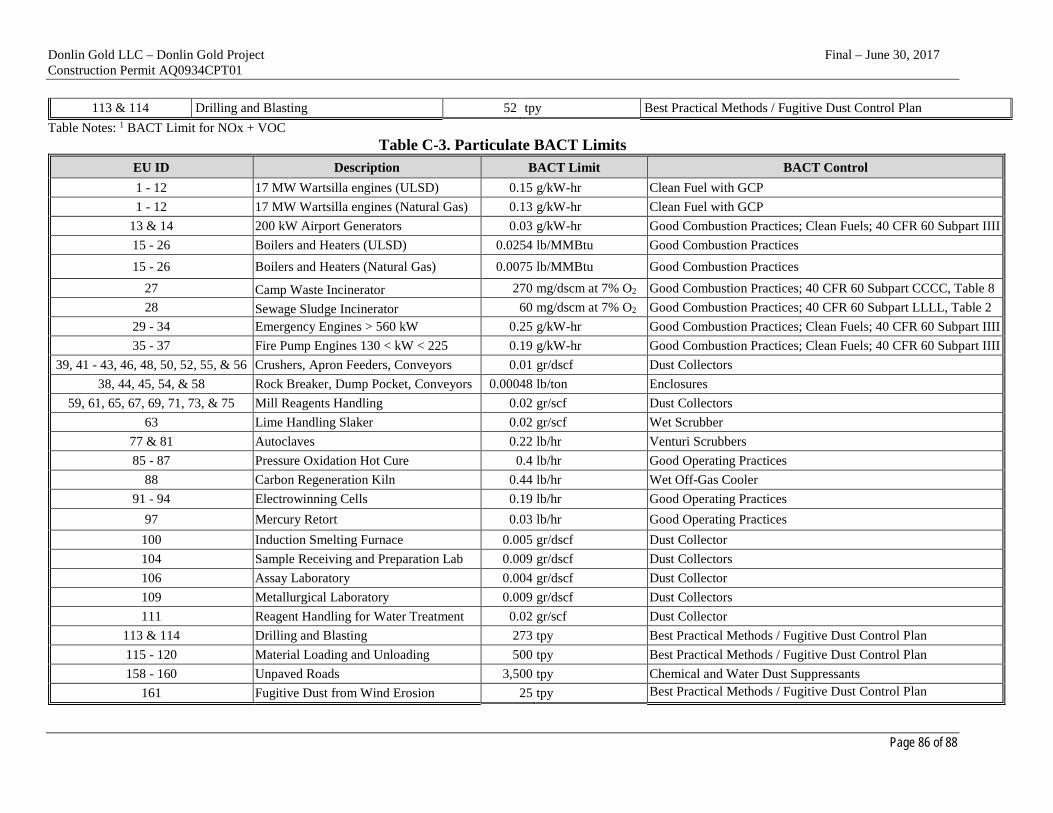
Donlin Gold LLC – Donlin Gold Project Final – June 30, 2017 Construction Permit AQ0934CPT01
Page 86 of 88
113 & 114 Drilling and Blasting 52 tpy Best Practical Methods / Fugitive Dust Control Plan Table Notes: 1 BACT Limit for NOx + VOC
Table C-3. Particulate BACT Limits EU ID Description BACT Limit BACT Control 1 - 12 17 MW Wartsilla engines (ULSD) 0.15 g/kW-hr Clean Fuel with GCP 1 - 12 17 MW Wartsilla engines (Natural Gas) 0.13 g/kW-hr Clean Fuel with GCP
13 & 14 200 kW Airport Generators 0.03 g/kW-hr Good Combustion Practices; Clean Fuels; 40 CFR 60 Subpart IIII 15 - 26 Boilers and Heaters (ULSD) 0.0254 lb/MMBtu Good Combustion Practices 15 - 26 Boilers and Heaters (Natural Gas) 0.0075 lb/MMBtu Good Combustion Practices
27 Camp Waste Incinerator 270 mg/dscm at 7% O2 Good Combustion Practices; 40 CFR 60 Subpart CCCC, Table 8 28 Sewage Sludge Incinerator 60 mg/dscm at 7% O2 Good Combustion Practices; 40 CFR 60 Subpart LLLL, Table 2
29 - 34 Emergency Engines > 560 kW 0.25 g/kW-hr Good Combustion Practices; Clean Fuels; 40 CFR 60 Subpart IIII 35 - 37 Fire Pump Engines 130 < kW < 225 0.19 g/kW-hr Good Combustion Practices; Clean Fuels; 40 CFR 60 Subpart IIII
39, 41 - 43, 46, 48, 50, 52, 55, & 56 Crushers, Apron Feeders, Conveyors 0.01 gr/dscf Dust Collectors 38, 44, 45, 54, & 58 Rock Breaker, Dump Pocket, Conveyors 0.00048 lb/ton Enclosures
59, 61, 65, 67, 69, 71, 73, & 75 Mill Reagents Handling 0.02 gr/scf Dust Collectors 63 Lime Handling Slaker 0.02 gr/scf Wet Scrubber
77 & 81 Autoclaves 0.22 lb/hr Venturi Scrubbers 85 - 87 Pressure Oxidation Hot Cure 0.4 lb/hr Good Operating Practices
88 Carbon Regeneration Kiln 0.44 lb/hr Wet Off-Gas Cooler 91 - 94 Electrowinning Cells 0.19 lb/hr Good Operating Practices
97 Mercury Retort 0.03 lb/hr Good Operating Practices 100 Induction Smelting Furnace 0.005 gr/dscf Dust Collector 104 Sample Receiving and Preparation Lab 0.009 gr/dscf Dust Collectors 106 Assay Laboratory 0.004 gr/dscf Dust Collector 109 Metallurgical Laboratory 0.009 gr/dscf Dust Collectors 111 Reagent Handling for Water Treatment 0.02 gr/scf Dust Collector
113 & 114 Drilling and Blasting 273 tpy Best Practical Methods / Fugitive Dust Control Plan 115 - 120 Material Loading and Unloading 500 tpy Best Practical Methods / Fugitive Dust Control Plan 158 - 160 Unpaved Roads 3,500 tpy Chemical and Water Dust Suppressants
161 Fugitive Dust from Wind Erosion 25 tpy Best Practical Methods / Fugitive Dust Control Plan

Donlin Gold LLC – Donlin Gold Project Final – June 30, 2017 Construction Permit AQ0934CPT01
Page 87 of 88
Table C-4. VOC BACT Limits EU ID Description BACT Limit BACT Control 1 – 12 17 MW Wartsilla engines (ULSD) 0.21 g/kW-hr Oxidation Catalyst; Good Combustion Practices 1 – 12 17 MW Wartsilla engines (Natural Gas) 0.09 g/kW-hr Oxidation Catalyst; Good Combustion Practices
13 & 14 200 kW Airport Generators 0.24 g/kW-hr Good Combustion Practices; Clean Fuels; 40 CFR 60 S b IIII 15 - 26 Boilers and Heaters (ULSD) 0.00154 lb/MMBtu Good Combustion Practices
15 - 26 Boilers and Heaters (Natural Gas) 0.0054 lb/MMBtu Good Combustion Practices 77 & 81 Autoclaves 0.04 lb/hr Carbon Adsorber
88 Carbon Regeneration Kiln 0.44 lb/hr Good Operating Practices
126 – 142, 150 – 152, & 156 Fuel Tanks 1.7 tpy Submerged Fill
Table C-5. GHG BACT Limits
EU ID Description BACT Limit BACT Control 1 - 12 17 MW Wartsilla engines (ULSD) 440 g/hp-hr Good Combustion Practices 1 - 12 17 MW Wartsilla engines (Natural Gas) 305 g/hp-hr Good Combustion Practices
13 - 14 200 kW Airport Generators 2,700 tpy Good Combustion Practices 15 - 26 Boilers and Heaters (ULSD and Natural Gas) 176,347 tpy Good Combustion Practices 27 & 28 Camp Waste and Sewage Sludge Incinerators 3.934 tpy Good Combustion Practices 29 - 37 Emergency and Black Start Generators 3,000 tpy Good Combustion Practices 77 & 81 Autoclaves 37,659 tpy Good Operating Practices
113 & 114 Drilling and Blasting 8,600 tpy Good Combustion Practices 124 & 125 Acidulation and Neutralization Tanks 273,175 tpy Good Operating Practices

Donlin Gold LLC – Donlin Gold Project Final – June 30, 2017 Construction Permit AQ0934CPT01
Page 88 of 88
APPENDIX D: MODELING REPORT

Alaska Department of Environmental Conservation
Air Permit Program
Review of
Donlin Gold LLC’s Ambient Demonstration
for the
Donlin Gold Project
Construction Permit AQ0934CPT01
Prepared by: Alan Schuler April 4, 2017
G:\AQ\PERMITS\AIRFACS\Donlin\Construct\AQ0934CPT01\Prelim\AQ0934CPT01 Modeling Review.docx

Review of Donlin’s Ambient Demonstration April 4, 2017 For the Donlin Gold Project
Page i
Table of Contents
1. INTRODUCTION ................................................................................................................. 1
2. REPORT OUTLINE ............................................................................................................. 1
3. BACKGROUND ................................................................................................................... 1
3.1. Project Location and Area Classification .................................................................... 2 3.2. Project Classification ................................................................................................... 2 3.3. Ambient Demonstration Requirements ....................................................................... 2 3.4. Modeling Protocol Submittal ....................................................................................... 3 3.5. Application Submittal and Amendments ..................................................................... 3 3.6. Establishes a PM-2.5 Minor Source Baseline Date ..................................................... 4
4. PRE-CONSTRUCTION MONITORING DATA ................................................................ 4
5. SOURCE IMPACT ANALYSIS .......................................................................................... 7
5.1. Approach ...................................................................................................................... 7 5.2. Model Selection ........................................................................................................... 7 5.3. Meteorological Data .................................................................................................... 8 5.4. Coordinate System ..................................................................................................... 11 5.5. Terrain ........................................................................................................................ 11 5.6. EU Inventory ............................................................................................................. 11 5.7. Emission Rates ........................................................................................................... 13 5.8. Point Source Parameters ............................................................................................ 17 5.9. Open Pit Parameters .................................................................................................. 20 5.10. Volume Source Parameters ........................................................................................ 21 5.11. Area Source Parameters ............................................................................................. 21 5.12. Pollutant Specific Considerations .............................................................................. 22 5.13. Downwash ................................................................................................................. 26 5.14. Ambient Air Boundary .............................................................................................. 26 5.15. Worker Housing ......................................................................................................... 27 5.16. Receptor Grid ............................................................................................................. 27 5.17. Off-Site Impacts ......................................................................................................... 28 5.18. Design Concentrations ............................................................................................... 29 5.19. Results and Discussion .............................................................................................. 30
6. OZONE IMPACTS ............................................................................................................. 31
7. ADDITIONAL IMPACT ANALYSES .............................................................................. 32
7.1. Visibility Impacts ....................................................................................................... 32

Review of Donlin’s Ambient Demonstration April 4, 2017 For the Donlin Gold Project
Page ii
7.2. Soil and Vegetation Impacts ...................................................................................... 33 7.3. Associated Growth Analysis ...................................................................................... 33
8. CONCLUSION ................................................................................................................... 34

Review of Donlin’s Ambient Demonstration April 4, 2017 For the Donlin Gold Project
Page 1 of 35
1. INTRODUCTION This report summarizes the Alaska Department of Environmental Conservation’s (Department’s) findings regarding the ambient analysis submitted by Donlin Gold LLC (Donlin) for the Donlin Gold Project (DGP). Donlin submitted this analysis in support of their October 2015 Prevention of Significant Deterioration (PSD) permit application (AQ0934CPT01). DGP triggers PSD review for oxides of nitrogen (NOx), carbon monoxide (CO), total particulate matter (PM), particulate matter with an aerodynamic diameter of 10 microns or less (PM-10), particulate matter with an aerodynamic diameter of 2.5 microns or less (PM-2.5), volatile organic compounds (VOC), and greenhouse gases (GHG). Donlin provided the source impact analysis required under 40 CFR 52.21(k), the pre-construction monitoring analysis required under 40 CFR 52.21(m)(1), and the additional impact analysis required under 40 CFR 52.21(o). They demonstrated that operating the DGP emissions units (EUs) within the restrictions listed in this report will not cause or contribute to a violation of the following Alaska Ambient Air Quality Standards (AAAQS) listed in 18 AAC 50.010: 1-hour nitrogen dioxide (NO2), annual NO2, 1-hour CO, 8-hour CO, 24-hour PM-10; 24-hour PM-2.5, annual PM-2.5, and 8-hour ozone (O3). Donlin also demonstrated that the DGP impacts will not cause or contribute to a violation of the following Class II maximum allowable increases (increments) listed in 18 AAC 50.020: annual NO2, 24-hour PM-10, annual PM-10, 24-hour PM-2.5, and annual PM-2.5.1 2. REPORT OUTLINE The Department’s findings regarding Donlin’s approach for meeting the pre-construction monitoring requirement in 40 CFR 52.21(m) is described in Section 4 of this report (Pre-Construction Monitoring Data). The Department’s findings regarding the additional impact analysis under 40 CFR 52.21(o) is described in Section 7 (Additional Impact Analysis). Donlin used a variety of means to address the ambient demonstration requirement in 40 CFR 52.21(k). They used computer analysis (modeling) to predict the NO2, CO, PM-10, and direct PM-2.5 air quality impacts; ambient data to represent the existing secondary PM-2.5 impacts; and a qualitative approach to address the ambient O3 and project-related secondary PM-2.5 impacts. The Department’s findings regarding Donlin’s NO2, CO, PM-10 and PM-2.5 assessments are in Section 5 of this report (Source Impact Analysis). The Department’s findings regarding Donlin’s qualitative O3 analysis is in Section 6 (Ozone Impact). 3. BACKGROUND The proposed project will occur at an existing stationary source (the Donlin Creek Project), which Donlin is operating under Owner Requested Limit (ORL) AQ0934ORL01. The ORL allowed Donlin to operate standby camp generators without triggering the minor permit requirement in 18 AAC 50.502(c)(1) for NOx. The Department will rescind AQ0934ORL01 upon issuance of Construction Permit AQ0934CPT01. 1 There are no ambient demonstration requirements for GHG emissions since there are no GHG AAAQS or
increments.

Review of Donlin’s Ambient Demonstration April 4, 2017 For the Donlin Gold Project
Page 2 of 35
Donlin is proposing to construct and operate an open-pit gold mine, tailings and waste rock facilities, a process plant with a nominal production rate of 59,000 short tons (ton) of ore per day, a 220 megawatt (MW) power plant, and various ancillary sources. Additional information regarding DGP, the triggered permit classifications, and the ambient demonstration requirements for those classifications are provided below.
3.1. Project Location and Area Classification The stationary source is located within the Kuskokwim Mountain region of western Alaska, approximately 280 miles west of Anchorage and 10 miles north of the Crooked Creek community. The area is unclassified in regards to compliance with the AAAQS. For purposes of increment compliance, the stationary source is located within a Class II area of the South Central Alaska Intrastate Air Quality Control Region. DGP is approximately 196 miles (315 kilometers) from the nearest Class I area, Denali National Park (Denali).
3.2. Project Classification As previously discussed, Donlin’s permit application triggered PSD review for NOx, CO, total PM, PM-10, PM-2.5, VOC, and GHG. The proposal also triggers the minor permit requirements under: 18 AAC 50.502(b)(3), since there will be a rock crusher with a rated capacity of at least five tons per hour; and under 18 AAC 50.508(5), since Donlin is requesting ORLs to avoid PSD review for sulfur dioxide (SO2) and major source classification for hazardous air pollutants. Per 18 AAC 50.502(a)(1), the minor permit provisions will be issued as part of the PSD permit.
3.3. Ambient Demonstration Requirements The State of Alaska’s PSD requirements are described in 18 AAC 50.306. PSD applicants must essentially comply with the federal PSD requirements in 40 CFR 52.21. Except as noted in 40 CFR 52.21(i), the ambient requirements include:
A Source Impact Analysis, i.e., an ambient demonstration for the PSD-triggered pollutants with an associated ambient air quality standard or increment, per 40 CFR 52.21(k);
An Air Quality Analysis, i.e., pre-construction monitoring data, for the PSD-triggered pollutants with an associated ambient air quality standard or increment, per 40 CFR 52.21(m);
An Additional Impact Analysis per 40 CFR 52.21(o); and A Class I Impact Analysis, for stationary sources that may affect a Class I area, per
40 CFR 52.21(p).
DGP is located too far from Denali to warrant a Class I Impact Analysis. The Department nevertheless provided the National Park Service (NPS) a courtesy copy of a preliminary modeling protocol on November 27, 2013. The Department further stated that it was the Department’s understanding that the NPS would not be requesting a Class I assessment

Review of Donlin’s Ambient Demonstration April 4, 2017 For the Donlin Gold Project
Page 3 of 35
under 40 CFR 52.21(p). The NPS provided tacit approval of the Department’s understanding by not replying to the November 27, 2013 email.2
Applicants subject to the 18 AAC 50.502(b) minor permit requirements are not required to submit an ambient demonstration unless specifically requested by the Department under 18 AAC 50.540(c)(2)(D). The Department did not invoke this option since the application also triggered the PSD modeling requirements for a wide variety of pollutants. There are no ambient air demonstration requirements associated with the 18 AAC 50.508(5) minor permit classification.
Rescinding an ORL triggers the ambient demonstration requirements for the permit classification that the ORL avoided, per 18 AAC 50.225(h). In this case, however, the minor permit for NOx that would have been triggered is superseded by the project’s PSD classification for NOx. Therefore, the PSD application and NO2 modeling analysis satisfies the ambient NO2 demonstration requirement triggered under 18 AAC 50.225(h).
3.4. Modeling Protocol Submittal Donlin submitted a modeling protocol on July 10, 2015. They submitted a response to Department comments on August 17, 2015, a revised receptor grid on August 25, 2015, and updates to various fugitive source parameters on September 10, 2015. They also submitted additional information on August 27, 2015 and September 2, 2015 regarding their request to use the U.S. Environmental Protection Agency’s (EPA’s) proposed algorithm for adjusting the surface friction velocity (ADJ_u*) parameter within the AERMOD Modeling System.3 Air Sciences Inc. (Air Sciences) prepared the protocol, and the subsequent permit application and ambient demonstration, on Donlin’s behalf. The Department approved the modeling protocol, with comment, on September 28, 2015.
3.5. Application Submittal and Amendments Donlin submitted their permit application on October 15, 2015, and a public access control plan (PACB) for restricting public access on October 19, 2015. They provided supplemental information in response to Department questions on January 19, 2016, and an updated PACB (to incorporate the clarifications discussed in their January 19th response) on February 11, 2016. Donlin amended the camp incinerator rating, the maximum annual quantity of blasting agent, and maximum blast area, on November 14, 2016.
Donlin provided an updated NO2, CO, PM-10 and PM-2.5 modeling analysis on March 3, 2017 in response to a February 7, 2017 Department request to use a new version of the AERMOD Modeling System.4 Donlin incorporated the November 2016 revisions and revised PM emission factors for their primary power plant generator sets (EUs 1 – 12); see Section 5.7.2. Donlin also compared the cumulative annual PM-2.5 impacts to the
2 Email from Alan Schuler (Department) to John Notar (NPS); Donlin PSD Modeling Protocol; November 27,
2013. 3 The ADJ_u* algorithm changed from an alternative modeling technique to a regulatory option in EPA’s
January 17, 2017 revision to the Guideline on Air Quality Models. See Section 5.3.1.1 of this report for additional details regarding the ADJ_u* algorithm.
4 Email from Alan Schuler (Department) to Mike Rieser (Donlin); Donlin Will Need to Update Their Ambient Analysis; February 7, 2017. See Section 5.2 of this report for additional details.

Review of Donlin’s Ambient Demonstration April 4, 2017 For the Donlin Gold Project
Page 4 of 35
Department’s updated annual PM-2.5 AAAQS.5 The Department’s comments and findings in Section 5 of this report (Source Impact Analysis) regards Donlin’s March 2017 modeling submittal, unless otherwise noted.
Donlin provided an updated version of their PACB on March 6, 2017. Donlin stated, “The revised draft incorporates changes resulting from revision to the Public Easement Plan, which was submitted to the Alaska Department of Natural Resources on October 19, 2016.” They corrected an editorial mistake in the PACB on April 4, 2017.
3.6. Establishes a PM-2.5 Minor Source Baseline Date Donlin’s PSD application establishes the PM-2.5 “minor source baseline date” for the South Central Alaska Intrastate Air Quality Control Region. The PM-2.5 minor source baseline date for the region is therefore October 15, 2015, the date the Department received Donlin’s application. Subsequent increases in minor source PM-2.5 emissions within the region will therefore be increment consuming.6
4. PRE-CONSTRUCTION MONITORING DATA 40 CFR 52.21(m)(1) requires PSD applicants to submit ambient air monitoring data describing the air quality in the vicinity of the project, unless the existing concentration or the project impact is less than the applicable Significant Monitoring Concentration (SMC) provided in 40 CFR 52.21(i)(5).7 The requirement only pertains to those pollutants that are subject to PSD review and have a National Ambient Air Quality Standard (NAAQS).8 If monitoring is required, the data are to be collected prior to construction. Hence, these data are referred as “pre-construction monitoring” data. Ambient “background” data may also be needed to supplement the estimated ambient impact from the proposed project. Donlin’s approach for meeting the pre-construction data requirement is discussed below. Their approach for meeting the “background” data needs is described in Section 5.17 (Off-Site Impacts) of this report. Pre-construction monitoring data must be collected at a location and in a manner that is consistent with the EPA’s Ambient Monitoring Guidelines for Prevention of Significant Deterioration (EPA-450/4-87-007), which the Department adopted by reference in 18 AAC 50.035(a)(5). In summary, the data must be collected at the location(s) of existing and proposed maximum impacts, the data must be current, and the data must meet PSD quality 5 The annual PM-2.5 and 8-hour O3 AAAQS changed after Donlin submitted their October 2015 permit application.
The annual PM-2.5 AAAQS was 15 micrograms per cubic meter (µg/m3), but changed to 12 µg/m3 on March 2, 2016. The 8-hour O3 AAAQS was 0.075 parts per million (ppm) but changed to 0.070 ppm on August 20, 2016.
6 The Department’s minor source baseline dates for PSD increments are established in accordance with 40 CFR 52.21(b)(14)(ii), which the Department has adopted by reference in 18 AAC 50.040(h). A narrative of the PSD increment concept and associated baseline dates may be found in the October 20, 2010 Federal Register notice for the PM-2.5 increment program (Pages 64864 – 64907 of Federal Register Volume 75, No. 202).
7 The District of Columbia Circuit Court of Appeals vacated the PM-2.5 SMC on January 22, 2013. Therefore, projects that trigger PSD review for PM-2.5 must include pre-construction monitoring data, regardless of the project impacts.
8 EPA has the authority under 40 CFR 52.21(m)(1)(ii) to require pre-construction monitoring for PSD-triggered pollutants that do not have a NAAQS (when they have shown a need for the data), but they have not made this determination for those pollutants.

Review of Donlin’s Ambient Demonstration April 4, 2017 For the Donlin Gold Project
Page 5 of 35
assurance requirements. The current quality assurance requirements are described in 18 AAC 50.215(a). Donlin fulfilled the pre-construction monitoring requirement by collecting 12 or more months of PSD-quality ambient data for all PSD-triggered pollutants with a NAAQS. With one minor exception, they collected all of the pollutant data at their “New Air Station” (NAS) monitoring site, which was located approximately 1,000 feet (0.3 miles) southeast of their exploration camp site (see Figure 1 – next page). The first two months of their PM-10 monitoring effort is the exception. Donlin collected the first two months of their July 2006 – June 2007 PM-10 data at their “Camp” meteorological station. They then relocated the PM-10 monitor to the NAS site due to expansion of the exploration camp. The Department conducted a site visit in September 2006 and determined that the relocation did not warrant a restart of the 2006 - 2007 monitoring period. The start and total duration of the monitoring effort varied by pollutant. Donlin submitted various Quality Assurance Project Plans for Department review and approval, in order to ensure that they had an acceptable approach for obtaining ambient data. They also submitted the subsequent data sets for Department review and approval. The resulting periods with PSD-quality data are listed by pollutant in Table 1. The AAAQS and maximum concentrations (as measured according to the form of the given AAAQS) are also provided. The Department is reporting the gaseous pollutants on a mass basis (µg/m3) which is the convention used in modeling, rather than a volumetric basis (e.g., ppm) which is the convention typically used in monitoring reports (including Donlin’s). Particulates are only measured and reported on a mass basis and are therefore, presented on a mass basis. Table 1 shows that the local air quality currently complies with the AAAQS for each PSD-triggered pollutant.
Table 1. Pre-Construction Monitoring Summary
Air Pollutant
Avg. Period
Monitoring Period(s)
Max. Conc.
(µg/m3) AAAQS (µg/m3)
% of AAAQS
NO2 1-hour Nov. 2006 – Nov. 2007;
Jan. – Dec. 2008; Dec. 2010 – Nov. 2011; April 2012 – April 2013
21 188 11
Annual 1.9 100 2
CO 1-hour Nov. 2006 – Nov. 2007; Jan. – Dec. 2008
687 40,000 28-hour 458 10,000 5
O3 8-hour Dec. 2010 – Nov. 2011; April 2012 – April 2013 100 140 71
PM-10 24-hour July 2006 – June 2007; July 2007 – June 2008 14 150 9
PM-2.5 24-hour
Jan. – Dec. 2008 6.8 35 19
Annual 2.3 12 19
Table Note: Some of the values in Table 1 are slightly different from the values presented by Donlin in Table 2-5 of Appendix D of their permit application. The differences are due to variation in rounding practices when converting values from a volumetric basis to a mass basis. None of the differences are substantive, nor do they alter the conclusion that the measured concentrations currently demonstrate compliance with the AAAQS.

Review of Donlin’s Ambient Demonstration April 4, 2017 For the Donlin Gold Project
Page 6 of 35
Review of Donlin’s Ambient Demonstration April 4, 2017 For the Donlin Gold Project
Page 7 of 35
5. SOURCE IMPACT ANALYSIS Donlin conducted a modeling analysis to estimate their NO2, CO, PM-10 and direct PM-2.5 impacts. The various aspects of their analysis are discussed below.
5.1. Approach Donlin provided three sets of computer runs for each pollutant and averaging period in their October 2015 permit application. The primary run consisted of the full receptor grid (see Section 5.16) and a “merged” plume scenario for the primary power plant engine exhaust (see Section 5.8.2). Once Donlin found the area of maximum impact, they then conducted a “hot spot” analysis of that area using a higher density of receptors. Donlin also provided a “single” plume (stack) sensitivity analysis for the primary power plant engines, and the full receptor grid. The three sets of runs always provided consistent results, with only marginal variation in the maximum impacts. Donlin therefore only reran the merged plume and hot spot analysis for the March 2017 addendum.
5.2. Model Selection There are a number of air dispersion models available to applicants and regulators. EPA lists these models in their Guideline on Air Quality Models (Guideline), which the Department has adopted by reference in 18 AAC 50.040(f).9 Donlin used EPA’s AERMOD Modeling System (AERMOD) for their ambient analysis. AERMOD is an appropriate modeling system for this permit application.
The AERMOD Modeling System consists of three major components: AERMAP, used to process terrain data and develop elevations for the receptor grid and EUs; AERMET, used to process the meteorological data; and the AERMOD dispersion model, used to estimate the ambient concentrations. Donlin used the version of each component that was current when they submitted their October 2015 application: AERMAP version 11103; AERMET version 15181; and AERMOD version 15181.
EPA updated AERMOD and AERMET on December 20, 2016. They gave a version number of 16216 to both components. On January 17, 2017, EPA released a revised version of the AERMOD update to correct several issues with the model code and compilation. EPA designated the revision as AERMOD version 16216R.
The Department does not generally require applicants to update a modeling submittal if there is a subsequent revision to the model code. However, EPA Region 10 (R10) notified the Region 10 states on January 4, 2017 that the ADJ_u* algorithm in AERMET 15181 contained an error that could lead to understated impacts. EPA reiterated the concern during a February 7, 2017 teleconference with the National Association of Clean Air Agencies’
9 The Department used the 2005 version of the Guideline for the modeling review since that is the version currently
adopted by reference in 18 AAC 50.040(f). EPA promulgated an update to on January 17, 2017, but that update does not become effective until May 22, 2017. Permitting authorities also have a one-year transition period (which ends January 17, 2018) to incorporate the update into their New Source Review programs. The Department’s use and reference to the 2005 version of the Guideline for this permitting action is therefore required under State rule and allowed under Federal rule.

Review of Donlin’s Ambient Demonstration April 4, 2017 For the Donlin Gold Project
Page 8 of 35
emissions & modeling committee.10 The Department therefore asked Donlin on February 7, 2017 to update their AERMOD analysis to ensure that the proposed project will not cause or contribute to a violation of the triggered AAAQS or increments. Donlin submitted the revised analysis, which they conducted with AERMET 16216 and AERMOD 16216R, on March 3, 2017.
5.3. Meteorological Data AERMOD requires hourly meteorological data to estimate plume dispersion. A minimum of one-year of site-specific data, or five years of representative National Weather Service (NWS) data should be used per Section 8.3 of the Guideline. When modeling with site-specific data, the Guideline states that up to five years should be used, when available, to account for year-to-year variation in meteorological conditions.
Donlin collected surface meteorological data at three locations within the general project area (see Figure 1 of this report). They selected their American Ridge meteorological data for modeling purposes since that data represents the plume transport conditions of the proposed process plant and power plant emissions. Donlin used five years (July 1, 2005 to June 30, 2010) of meteorological data for the modeling analysis. Their decision to use five years of American Ridge data meets the siting and data period requirements in Section 8.3 of the Guideline.
Donlin supplemented their surface data with upper air data from the nearest NWS upper air station, which is in McGrath, Alaska. Their approach of using upper air data from the nearest station is both standard practice and reasonable.
Donlin further supplemented the American Ridge surface data with concurrent NWS cloud cover data from Sleetmute, Alaska. They substituted missing Sleetmute cloud cover data with NWS cloud cover data from Aniak, Alaska. The Department approved this approach during the pre-application phase of this PSD project. Donlin submitted a regional cloud cover analysis on October 23, 2013.11 The Department supplemented Donlin’s analysis with its own review of regional cloud cover data, and determined on October 30, 2013 that the Sleetmute cloud cover data is representative of the expected cloud cover data at the project site.12 Donlin later asked during a January 16, 2015 teleconference if they could substitute Aniak or McGrath data for missing Sleetmute data, based on the findings of their October 2013 submittal. The Department replied on February 3, 2015 that Aniak data could be
10 EPA later documented their concern regarding AERMET 15181 in a March 8, 2017 memorandum, Clarification
on the AERMOD Modeling System for Use in SO2 Implementation Efforts and Other Regulatory Actions. EPA stated, “… the EPA discovered that the ADJ_U* beta option in AERMET version 15181 had a formulation bug that caused the ADJ_U* correction to be overstated and the resulting AERMOD concentrations to have an under prediction bias. The EPA corrected this formulation bug in AERMET version 16216 such that the model code now appropriately reflects the relevant scientific formulation…”
11 Donlin provided the cloud cover analysis in an October 23, 2013 email from Nick Enos (Donlin) to Alan Schuler (Department); RE: ADEC Answer to Donlin Cloud Cover Question. They included an October 10, 2013 technical memorandum from Air Sciences, Relevance of Ceiling Height and Cloud Cover in AERMET/AERMOD, as an attachment.
12 The Department informed Donlin of its decision to accept Sleetmute cloud cover data in an October 30, 2013 email from Alan Schuler (Department) to Nick Enos (Donlin); Donlin May Use Sleetmute Cloud Cover Data.

Review of Donlin’s Ambient Demonstration April 4, 2017 For the Donlin Gold Project
Page 9 of 35
substituted for missing Sleetmute data, but cloud cover data from McGrath (or Holy Cross) could not be used.13
Additional details regarding the American Ridge meteorological data and how Donlin processed the meteorological data are provided below.
5.3.1. Quality Assurance Review Site-specific meteorological data must meet the PSD quality assurance requirements outlined in EPA’s Meteorological Monitoring Guidance for Regulatory Modeling Applications, per 18 AAC 50.215(a)(3). Donlin submitted their American Ridge meteorological data for Department approval after each 12-month data collection period. The Department used various term contractors to review the data on its behalf, although the final decision regarding data acceptability remained with the Department. All of the site-specific meteorological parameters used by Donlin in their modeling analysis are PSD-quality.
5.3.2. Meteorological Data Processing Donlin correctly processed the meteorological data with AERMET. However, the following topics warrant additional discussion.
5.3.1.1 Low Wind Speed Adjustments
Donlin used the ADJ_u* option in AERMET to adjust the surface friction velocity. EPA developed this option to correct AERMOD’s tendency to overpredict impacts under stable, low wind conditions.
The ADJ_u* algorithm was considered an alternative modeling technique under both EPA and Department rule when Donlin first proposed its use – as well as when Donlin submitted their permit application in October 2015.14 EPA has subsequently adopted the ADJ_u* algorithm as a regulatory option in its January 2017 revision to the Guideline. However, the Department must continue to treat the ADJ_u* algorithm as a non-Guideline technique under 18 AAC 50.215(c) since the Department has not yet added the January 2017 version of the Guideline to 18 AAC 50.
18 AAC 50.215(c)(1) requires applicants to demonstrate in a manner consistent with Section 3.2.2 of the Guideline that the alternative approach is more appropriate than the preferred air quality model. Donlin submitted the required information in an August 25, 2015 letter, Additional Information Regarding DGLLC’s ADJ_U* Approval Request. They also provided supplemental information to address comments from R10 in a September 2, 2015 letter, Responses to EPA R10 Comments on DGLLC’s ADJ_U* Approval Request.
13 Email from James Renovatio (Department) to Mike Rieser (Donlin); FW: Cloud cover for Donlin; February 3,
2015. 14 EPA proposed adopting the ADJ_u* algorithm as a regulatory modeling option as part of a July 29, 2015 proposal
to revise the Guideline. EPA also proposed a second modeling option, known as “LOWWIND3,” that could be used with or without the ADJ_u* option, to further mitigate the low wind speed problem in AERMOD. Donlin did not request permission to use this option, nor did they use the LOWWIND3 option in their ambient demonstration.

Review of Donlin’s Ambient Demonstration April 4, 2017 For the Donlin Gold Project
Page 10 of 35
R10 stated in an August 25, 2015 email that the ADJ_u* option should not be used with the following calculated meteorological parameters: standard deviation of horizontal wind direction (sigma-theta); or standard deviation of vertical wind speed (sigma-w).15 Donlin therefore excluded those meteorological parameters from their AERMOD analysis.
18 AAC 50.215(c)(2) requires approval from the R10 Administrator and the Commissioner of a non-Guideline modeling technique. The Commissioner delegated the responsibility for approving non-Guideline modeling methods to the Air Permits Program Manager on June 3, 2008.16 The R10 Administrator delegated responsibility to their air quality modeler. The Air Permit Program Manager approved Donlin’s request to use the ADJ_u* algorithm on September 15, 2015. R10 approved Donlin’s request on October 20, 2015.17, 18 EPA’s Model Clearinghouse (MCH) concurred with R10’s approval on February 10, 2016.19
In addition to complying with the Department’s modeling requirements in 18 AAC 50.215(c), PSD applicants must also comply with the PSD modeling requirements in 40 CFR 52.21(l), per 18 AAC 50.306(b) and 18 AAC 50.040(h)(10). 40 CFR 52.21(l)(2) says the use of a non-Guideline modeling technique, “must be subject to notice and opportunity for public comment.” The Department therefore included a notice regarding Donlin’s use of the ADJ_u* option in the public notice of its preliminary permit decision.
5.3.1.2 Surface Characteristics
AERMET requires the area surrounding the meteorological tower to be characterized with regard to the following three surface characteristics: noon-time albedo, Bowen ratio, and surface roughness length. EPA has provided additional guidance regarding the selection and processing of the values used to represent these surface characteristics in their AERMOD Implementation Guide. They also developed a computer program, AERSURFACE, to determine the applicable surface characteristics from the U.S. Geological Survey (USGS) 1992 National Land Cover Data (NLCD) archives.
The 1992 NLCD database is not available for all of Alaska, including the project area. Therefore, Donlin was unable to use the AERSURFACE program to derive the local surface parameters. They instead used a tool developed by Air Sciences that
15 Email from Herman Wong (R10) to Alan Schuler (Department) and Clint Bowman (Washington Department of
Ecology); R10 – MCH Interactions on Donlin and BP; August 25, 2015. 16 Memorandum from Larry Hartig (Commissioner) to John Kuterbach (Air Permits Program Manager); Delegation
of Authority for use of Non-Guideline Air Quality Models; June 3, 2008. 17 Memorandum from Herman Wong (R10) to Alan Schuler (Department); Surface Friction Velocity (u*) Non-
Default/Beta Option in AERMET Version 15181; Alternative Refined Model Demonstration; October 20, 2015. 18 R10 notified the Department on October 23, 2015 that there was a typographical error in their approval. They sent
corrected pages and said, “In Section B.3, second paragraph, second sentence, ‘UCALST’ is replaced by ‘MPPBL’”. (Email from Herman Wong (R10) to Alan Schuler (Department); Correction; October 23, 2015.)
19 Memorandum from George Bridgers (EPA) to Janis Hastings (EPA), Model Clearinghouse Review of the Use of the ADJ_U* Beta Option in the AERMET Meteorological Processor (Version 15181) for the Donlin Mine Compliance Demonstration; February 10, 2016.

Review of Donlin’s Ambient Demonstration April 4, 2017 For the Donlin Gold Project
Page 11 of 35
calculates the surface parameters from the 2001 NLCD archives. The tool calculates the surface parameters in the same manner as described in EPA’s AERSURFACE User’s Guide. Air Sciences also used winter-time Bowen ratios that reflect continuous snow cover, rather than the AERSURFACE values – which are based on the assumption that snow melt occurs during the day. Using values that reflect continuous snow cover during the winter is appropriate for Alaska.
Donlin provided the surface parameters derived from Air Sciences’ surface parameter tool in their July 2015 modeling protocol. They appropriately chose to select the surface parameters by month, rather than using quarterly or annual values. Their approach allowed them to adjust the surface characteristics by season. They also varied the Bowen ratios by meteorological year. The Department approved the surface parameters when it approved Donlin’s modeling protocol. The approved values are reiterated in Tables 3-5 and 3-6 of Appendix D of Donlin’s permit application.
5.4. Coordinate System Air quality models need to know the relative location of the EUs, structures (if applicable), and receptors, in order to properly estimate ambient pollutant concentrations. Therefore, applicants must use a consistent coordinate system in their analysis. Donlin used the Universal Transverse Mercator (UTM) system. This is the most commonly used approach in AERMOD assessments. Donlin’s use of the UTM approach is reasonable and appropriate.
5.5. Terrain Terrain features can influence plume dispersion and the resulting ambient concentration. Digitized terrain elevation data is therefore generally included in an AERMOD analysis. AERMOD’s terrain preprocess, AERMAP, utilizes the terrain data to obtain the base elevations for the modeled EUs, buildings, and receptors; and to calculate a “hill height scale” for each receptor.
Donlin used National Elevation Dataset (NED) files for their terrain dataset. NED is the current terrain elevation dataset provided by the USGS. Donlin’ use of NED data is therefore reasonable and appropriate.
5.6. EU Inventory Donlin included all of the proposed NOx-emitting EUs in their NO2 AAAQS/increment demonstrations; all of the proposed CO-emitting EUs in their CO AAAQS demonstrations; and all of the proposed PM-emitting EUs in their PM-10 and PM-2.5 AAAQS/increment demonstrations. Donlin did not include the existing EUs authorized under AQ0934ORL01 since they intend to remove these units as part of the DGP development. Additional details regarding the modeled EU inventory are discussed below.
5.6.1. General Discussion Donlin intends to operate a wide variety of equipment. They classified the proposed EUs under the following categories: Mining Activities;

Review of Donlin’s Ambient Demonstration April 4, 2017 For the Donlin Gold Project
Page 12 of 35
Process and Refining; Power Generation; Boilers and Heaters; Incinerators; Emergency Equipment; Access Roads; Mobile Machinery Tailpipes; and Liquid Storage Tanks
Donlin provided the full EU inventory in Appendix B of their permit application. They also illustrated the general location of the EUs in Figure 3-5 of Appendix D of their permit application. The combustion-related sources will be fueled with either natural gas (NG) or ultra-low sulfur diesel (ULSD). Some EUs will be dual-fuel capable, where they can operate on either fuel.
Donlin used the OPENPIT option in AERMOD to characterize the drilling, material extraction, loading and unloading, dozing and machinery emissions within the pit. They designated the remaining EUs as either point, volume, or area sources. The modeled emission rates and various aspects of the applicable source characterizations are discussed in Sections 5.7 through 5.11 of this report.
5.6.2. Secondary Emissions PSD applicants must include “secondary emissions” in their ambient demonstration, per 40 CFR 52.21(k)(1). EPA defines the term in 40 CFR 52.21(b)(18) as, “emissions which would occur as a result of the construction or operation of a major stationary source… but do not come from the major stationary source…”
Construction emissions are the only secondary emissions associated with DGP. Donlin provided an estimate of their construction emissions in Section 2.2.2 of their permit application. The construction emissions are substantially smaller than the maximum DGP emissions for each PSD-triggered pollutant with an air quality standard or increment. Donlin therefore did not provide a separate modeling analysis for the construction activities since the DGP emissions provide the worst-case scenario.
5.6.3. EU Inventory for the Increment Demonstrations As previously discussed in the Background section of this report, DGP will be located within a Class II area of the South Central Alaska Intrastate Air Quality Control Region. The major source baseline date for the annual NO2 increment is February 8, 1988. The major source baseline date for the 24-hour and annual PM-10 increment is January 6, 1975. The major source baseline date for the 24-hour and annual PM-2.5 increment is October 20, 2010. Therefore, all of the DGP EUs will be increment consuming for these pollutants/averaging periods. There are no Class II increments for the other PSD-triggered pollutants and averaging periods, i.e. GHG, 1-hour NO2, 8-hour O3, 1-hour CO, and 8-hour CO. Donlin included all of their EUs in their increment demonstrations.

Review of Donlin’s Ambient Demonstration April 4, 2017 For the Donlin Gold Project
Page 13 of 35
5.7. Emission Rates The modeled emission rates are consistent with the emissions information provided throughout Donlin’s October 2015 permit application, as modified by their January 2016 supplemental information and March 2017 addendum. The emissions are generally related to the overall throughput of the mine, which is limited by the rated capacity of the gyratory crusher (GC) and the semi-autogenous grinding (SAG) mill. Donlin assumed the GC will have a maximum capacity of 5,100 tons per hour (ton/hr) and the SAG mill will have a maximum capacity of 3,303 ton/hr. The Department is therefore imposing these assumptions as general ambient air conditions.
The Department is likewise limiting the total capacity of the primary power plant generator sets (EU 1 – 12) due to their substantive emissions. According to the application, Donlin is planning to use Wärtsilä generator sets with a rated capacity of 17,076 kilowatts (kW), per unit. The total capacity for all twelve primary power plant generator sets is therefore 204,912 kW or 205 MW. The Department rounded this value up to 210 MW so that the permit would not need to be reopened due to small, subsequent changes in rated capacity. The rounded value represents a two-percent increase from the proposed rated capacity, which is well within the margin of compliance for the modeled pollutants and averaging periods (see the modeling results in Section 5.19 of this report). Therefore, a two-percent increase in the rated capacity would not threaten the AAAQS or increments.
The modeled emission rates are consistent with the Best Available Control Technology (BACT) emission rates. The Department is therefore imposing compliance with the BACT emission rates (for the modeled pollutants) as ambient air conditions. Additional details regarding the modeled emission rates, along with several additional ambient air conditions related to the modeled emission rates, are provided below.
5.7.1. Use of Worst-Case Variables The emission rates for dual-fired EUs typically vary by fuel. Donlin provided the emission rates for both fuels (NG and ULSD) in Appendix B of their permit application. They then selected the highest of the two emission rates for modeling purposes. For example, Donlin assumed the Wärtsilä generator sets are continuously operating on ULSD in their modeling analysis since the ULSD-related emissions for each of the modeled pollutants are greater than the NG-related emissions. Donlin made this assumption to provide a worst-case scenario, even though they intend to primarily operate the Wärtsilä generator sets on NG.
The annual emissions from the mining and mobile source activities will change over time as the mine matures. Donlin estimates that the maximum annual emissions occur during life of mine (LOM) year 16 for CO, NOx, and PM-2.5; and in LOM year 20 for PM-10. They therefore used LOM year 16 for developing the annual NOx and annual PM-2.5 emissions from mining and mobile source activities; and LOM year 20 for developing the annual PM-10 emissions. They generally used these same LOM years for developing the worst-case 1-hour, 8-hour and 24-hour (aka “short-term”) emission rates. The exceptions and additional factors used to develop the modeled annual and short-term emission rates are discussed below.

Review of Donlin’s Ambient Demonstration April 4, 2017 For the Donlin Gold Project
Page 14 of 35
5.7.2. Wärtsilä PM Emissions Donlin appropriately used a PM emission rate of 0.29 grams per kilowatt hour (g/kW-hr) for the Wärtsilä generator sets (EUs 1 – 12) in the March 2017 modeling analysis, rather than the 0.15 g/kW-hr value used in their October 2015 submittal. The Department had previously questioned the use of the 0.15 g/kW-hr value since the vendor information provided by Donlin indicated that the value only reflected the filterable PM emissions when operating on ULSD. The Department therefore asked Donlin to provide the filterable plus condensable PM emission rates.
Donlin stated in their January 19, 2016 response that the 0.15 g/kW-hr PM emission guarantee “provides a reasonable worst-case emission rate for both filterable and condensable particulates.” However, they also said that they did not mind using a 0.29 g/kW-hr “standard particulate (filterable plus condensable) guarantee” provided by Wärtsilä for permitting purposes.
5.7.3. Blasting Emissions EPA’s Compilation of Air Pollutant Emission Factors (AP-42) contains an equation for deriving the PM emission factor for blasting. The horizontal area of the blast is the sole variable. Donlin assumed that 80,320 square feet (ft2) would be blasted at a time in their October 2015 application and modeling analysis, but stated in their November 2014 amendment that the maximum blast area during the life of the mine could be 120,000 ft2. Donlin used the PM emissions associated with the 120,000 ft2 upper bound in their March 2017 revised modeling analysis.20 The Department is therefore imposing the 120,000 ft2 per blast assumption as an ambient condition to protect the PM-10 and PM-2.5 AAAQS and increments.
The NO2 and CO emissions from blasting are dependent on the quantity of blasting agent. Donlin assumed that they would use 43,018 metric tons per year (t/yr) of blasting agent in the October 2015 permit application and modeling analysis. However, they stated in their November 2016 amendment (and the subsequent March 2017 addendum) that the maximum annual consumption during the life of the mine could be as high as 60,000 t/yr. Donlin used the emissions associated with the 60,000 t/yr assumption in their March 2017 NO2 and CO modeling analysis.21
The emissions from mining activities will be partially dependent on the amount of rock moved per year, which is semi-related to the amount of blasting. The Department is therefore imposing the 60,000 t/yr estimate as an additional general ambient air condition to protect the modeled AAAQS and increments.22
20 The Department notes that other mining activities may be reduced during periods of blasting, especially large
blasts, for safety or operational purposes. Donlin’s approach of using the maximum blast area is therefore, likely conservative.
21 Donlin did not specify in which LOM year the 60,000 t/y upper bound would likely occur. Since other mining activity emissions may be lower during the high blasting years, Donlin’s approach of using the maximum NO2 and CO blasting emissions without reducing the other NO2 and CO emissions likely makes the NO2 and CO analysis conservative.
22 The other general operating restrictions are discussed in Section 5.7 of this report.

Review of Donlin’s Ambient Demonstration April 4, 2017 For the Donlin Gold Project
Page 15 of 35
5.7.4. Assumptions re Annual Operations Donlin assumed the mine continuously operates on a year-round basis. They likewise generally assumed that the process, power plant and ancillary sources operate on a continuous basis. They only deviated from this continuous assumption with respect to the two black start generators (EUs 29 - 30), the four emergency generators (EUs 31 - 34) and the three fire pumps (EUs 35 - 37), where they assumed that each of these EUs only operate 500 hours per year (hr/yr). The Department is imposing the 500 hr/yr assumption as ambient limits to protect the annual AAAQS and increments.
5.7.5. Wind-Blown Emissions Donlin included the fugitive wind-blown emissions that may occur from exposed surfaces in their PM-10 and PM-2.5 modeling analyses. The exposed surfaces that could be subject to wind erosion include the haul roads, the access roads, the Tailings Beach, the Waste Rock Facility, the Short-term Stockpile, the Long-term Stockpile West, the Long-term Stockpile East, and the Overburden Stockpile South. Wind is also a factor in determining the quantity of particulate emissions generated during the loading and unloading of aggregates.
Wind erosion occurs when the wind speed over a freshly exposed surface exceeds the threshold friction velocity for the given material. The emissions are associated with intermittent wind gusts, but the emissions are conservatively assumed to occur for the entire hour for modeling purposes.
Donlin used the procedure in Section 13.2.5 (Industrial Wind Erosion) of AP-42 to estimate the particulate emissions from wind erosion. The procedure requires “fastest-mile” (2-minute average) wind speed data, which Donlin obtained by multiplying their hourly American Ridge wind speed data by 1.24. Donlin justified the 1.24 hour-to-fastest mile scaling factor in an April 9, 2015 email, RE: Fastest Mile Wind Speed.23 In summary, Donlin obtained the factor from Figure 2.6 of NASA Technical Paper 1359, Engineering Handbook on the Atmospheric Environmental Guidelines for Use in Wind Turbine Generator Development (December 1978).24 The 1.24 factor is the ratio of the extreme fastest mile wind speed to the maximum hourly mean velocity, when the hourly mean velocity is 44 miles per hour (the fastest hourly wind speed measured over a five-year period at American Ridge). Since the ratio slightly decreases with decreasing hourly average wind speeds, using the maximum hourly average wind speed provides an upper bound value for all hourly average wind speeds measured at American Ridge.
Donlin used the “overburden” classification in Table 13.2.5-2 of AP-42, and the associated 1.02 meter per second (m/s) threshold friction velocity to represent the material handled at all exposed stock piles (including the Tailings Beach and waste rock facility), as well as the road surfaces. They correctly noted in their January 19, 2016 submittal that the “overburden” classification provides a more conservative estimate of the wind-blown emissions from road surfaces than what would have occurred if they
23 Email from Mike Rieser (Donlin) to Alan Schuler (Department); RE: Fastest Mile Wind Speed; April 9, 2015. 24 NASA Technical Paper 1359 was authored by Walter Frost, B.H. Long, and R.E. Turner.

Review of Donlin’s Ambient Demonstration April 4, 2017 For the Donlin Gold Project
Page 16 of 35
had used the “roadbed material” classification. The use of the “overburden” classification for the stock piles is reasonable and appropriate.
Donlin used the procedure in Section 13.2.4 of AP-42 (Aggregated Handling and Storage Piles) to estimate the quantity of dust emissions generated from loading and unloading operations. This procedure requires the use of a mean wind speed, rather than the fastest-mile wind speed. Donlin used the hourly wind-speeds from their American Ridge data for this calculation.
Donlin did not take credit in their PM modeling assessments for any type of dust control at the Tailings Beach. However, they reduced the fugitive dust emissions from all unpaved roadways by 90-percent, based on the control methods (aka “best practical methods” or BPMs) described in their October 2015 Fugitive Dust Control Plan (Appendix E of their permit application). The Department is therefore requiring Donlin to comply with the BPMs described in their Fugitive Dust Control Plan in order to protect the PM AAAQS/increments.
5.7.6. Other Assumptions re Short-term Emissions The modeled emission rates for the short-term AAAQS and increments should generally reflect the maximum emissions allowed during the given averaging period. However, applicants may use the annual NOx emission rate for intermittently operated EUs when modeling the 1-hour probabilistic NO2 AAAQS.25
Donlin used the annual NOx emissions when modeling the 1-hour NO2 impacts from the black start generators (EUs 29 - 30), emergency generators (EUs 31 - 34) and fire pumps (EUs 35 - 37), since these are intermittently operated EUs. They used the maximum hourly emission rates for these EUs when modeling the other short-term AAAQS and increments. They likewise used the maximum hourly emission rates for all other combustion-related EUs. The Department is imposing the 500 hr/yr assumption for the intermittently operated EUs as an ambient limit to protect the 1-hour NO2 AAAQS.
Donlin stated in their October 2015 application that there could be up to five blasts per day. However, for modeling purposes, they assumed that all five blasts would occur within the averaging period of the given AAAQS or increment. For example, Donlin conservatively assumed all five blasts would occur within an hour when modeling the 1-hour CO and 1-hour NO2 impacts. They likewise assumed all five blasts would occur within an 8-hour period when modeling the 8-hour CO impacts, and that all five blasts would occur within a 24-hour period when modeling the 24-hour PM-10 and 24-hour PM-2.5 impacts. The Department is not imposing the five blast per day assumption as an ambient air condition since the frequency seems reasonable, if not conservative, and since the previously discussed limits on the area per blast and quantity of blasting agent, should be adequate for protecting the AAAQS and increments.
25 EPA Memorandum from Tyler Fox to Regional Air Division Directors, Additional Clarification Regarding
Application of Appendix W Modeling Guidance for the 1-hour NO2 National Ambient Air Quality Standard; March 1, 2011.

Review of Donlin’s Ambient Demonstration April 4, 2017 For the Donlin Gold Project
Page 17 of 35
Donlin assumed the process-related EUs are continuously handling 5,100 ton/hr of material, which is the maximum throughput of the GC. They likewise assumed the refining-related EUs are continuously handling 3,303 ton/hr of material, which is the maximum throughput of the SAG mill.
Donlin created an hourly emissions file for the fugitive emissions from the pit, the Tailings Beach, and the Waste Rock Facility. This approach allowed them to calculate and use hour-specific wind-blown emission rates for these activities. They used the annual emission rates from the worst-case LOM years to estimate the short-term emission rates for the remaining mining and mobile source activities. This is a reasonable approach.26
5.8. Point Source Parameters In addition to the previously discussed emission rates, applicants must provide the stack height, diameter, location, base elevation, exhaust plume exit velocity, and exhaust temperature for each EU characterized as a point source. The Department generally found the exhaust parameters used by Donlin to be consistent with the vendor information or expectations for similarly sized EUs. The stack dimensions are likewise generally reasonable. For those EUs located within a building, Donlin generally used stack heights that are slightly larger than the host structure. The stack heights for all other EUs are relatively short, and on par with the heights commonly found or expected for those types of EUs. The exceptions, or items that otherwise warrant additional discussion, are discussed below.
5.8.1. General Discussion re Horizontal/Capped Stacks Capped stacks or horizontal releases generally lead to higher impacts in the immediate near-field than the impacts from uncapped, vertical releases. EPA has therefore developed an option in AERMOD that revises the release parameters as described in the AERMOD User’s Guide,27 for any stack identified as horizontal (POINTHOR) or capped (POINTCAP). The POINTHOR/POINTCAP options were considered an alternative modeling technique under both EPA and Department rule when Donlin submitted their permit application in October 2015. EPA has subsequently adopted the POINTHOR and POINTCAP approach as regulatory options in its January 2017 revision to the Guideline. However, the Department must continue to treat these options as alternative modeling techniques under 18 AAC 50.215(c) since the Department has not yet added the January 2017 version of the Guideline to 18 AAC 50.
Donlin assumed that the Wärtsilä generator sets have vertical, uncapped releases, and that all other point source releases are capped. They used the POINTCAP option to designate and characterize the capped stacks. The Department is including a permit
26 Donlin noted in their January 19, 2016 submittal that they did not use an hourly emissions file for modeling the
wind-blown emissions from roads since it would increase the length of each hourly emissions file to over four million lines of code. They correctly noted that such a large file would make the modeling analysis unmanageable. They also stated that an hourly refinement was unnecessary since the wind-blown emissions from roads is less than one percent of the total road-related emissions. Their assessment and solution is reasonable.
27 User’s Guide for the AMS/EPA Regulatory Model (AERMOD); EPA-454/B-16-011; December, 2016.

Review of Donlin’s Ambient Demonstration April 4, 2017 For the Donlin Gold Project
Page 18 of 35
condition that requires Donlin to construct vertical, uncapped releases on the Wärtsilä generator sets (EU 1 - 12) in order to protect the modeled AAAQS and increments.
R10 granted the Department general permission to use the POINTHOR/POINTCAP options in October 2007.28 The Department therefore did not seek case-specific permission from R10 for Donlin’s use of the POINTCAP option for the DGP modeling analysis. However, the MCH stated in their February 10, 2016 memorandum regarding Donlin’s use of the ADJ_u* algorithm that they also agreed with Donlin’s use of the non-default capped stack option. They even recommended the use of the POINTCAP and POINTHOR approach “as the best available options for all capped and horizontal stacks subject or not subject to downwash, consistent with our proposed revisions to [the Guideline].” The Department has likewise routinely encouraged applicants to use the POINTCAP and POINTHOR approach since these options instruct AERMOD to automatically alter the actual exit velocity and stack diameter in the same manner as described in the AERMOD User’s Guide. The applicant would otherwise need to enter the artificially small exit velocity provided in the AERMOD User’s Guide, and when warranted, calculate and enter an artificially large stack diameter. The Department included a notice regarding Donlin’s use of the capped stack option in the public notice for the preliminary decision.
5.8.2. Additional Discussion re Wärtsilä Exhaust Stacks Donlin stated the twelve Wärtsilä generator sets (EU 1 - 12) would be housed in two identical engine halls, each containing six generator sets. They further stated:
Each engine hall will consists of six stacks (one per engine) with identical release characteristics, clustered together in a configuration of two banks of three engines each. The six stacks in each cluster will be arranged tightly together, approximately one diameter apart.
Identical plumes from stacks located this closely together would promptly merge upon release. Donlin therefore characterized each stack cluster as a single exhaust plume in their “merged” plume scenario. They used the actual release height, exhaust temperature, and exit velocity of a single stack for each merged plume, but an artificially large stack diameter so that the resulting volumetric exhaust flow would equal the total volumetric exhaust flow from all six stacks. The Department approved this approach on March 16, 2015,29 and reiterated its approval when it accepted Donlin’s modeling protocol.
Donlin also provided a “single” plume sensitivity analysis in their October 2015 submittal to show that the AAAQS and increments would still be protected even if they operated a single generator set in each hall. Under this scenario, the total emissions from the Wärtsilä engines would only be a sixth of the total emissions in the merged plume scenario, but the exhaust plumes would also be less buoyant. The two scenarios
28 Email from Herman Wong (R10) to Alan Schuler (Department); RE: Capped/Horizontal Stack Issue; October 2,
2007. 29 Email from Alan Schuler (Department) to Mike Rieser (Donlin); ADEC Okays Donlin’s Merged Plume Proposal;
March 16, 2015.

Review of Donlin’s Ambient Demonstration April 4, 2017 For the Donlin Gold Project
Page 19 of 35
always provided identical or nearly identical results. The impact from the single stack scenario never exceeded the impact from the merged plume scenario by more than 0.02 µg/m3, which is inconsequential. By modeling both operational extremes, Donlin demonstrated that they can operate any combination of engines within each hall without violating the AAAQS or increments.
Donlin assumed the Wärtsilä engine stacks are 49 meter (m) tall. This assumption allows the emissions release to be above the tallest nearby structure,30 but it is nevertheless relatively tall for reciprocating engines. The Department is therefore imposing the 49 m assumption as a permit condition to protect the modeled AAAQS and increments. The 49 m assumption complies with the good engineering practice stack height requirements in 18 AAC 50.045(e) – (f).
Donlin plans to recover waste heat from the Wärtsilä exhaust stacks to power a steam turbine (i.e., they will have a combined cycle power plant). Donlin used the post heat recovery exhaust temperature and exhaust flow rate, as provided by the vendor, for the modeling analysis.
5.8.3. Additional Discussion re Dust Collector Stacks Donlin appropriately assumed the dust collector systems that are located in unheated structures (e.g., the dust collector for the gyratory crusher) exhaust at ambient temperature. However, they also assumed that most of the dust collectors and the wet scrubber located in heated buildings exhaust at ambient temperature rather than room temperature. They stated in their January 19, 2016 response that this was a “worst-case assumption” since “the higher stack release temperature will result in increased pollutant dispersion and lower impacts.” The Department ran a sensitivity analysis to check the accuracy of their assumption. The Department remodeled the worst-case scenario (the 24-hour PM-10 increment analysis) and meteorological data year (2005), but used the average room temperature provided by Donlin (21.5oC) as the exhaust temperature for the systems in question.31 The high second-high (h2h) 24-hour PM-10 impact increased from 23.28146 µg/m3 to 23.28804 µg/m3 (a 0.00658 µg/m3 increase). This is an inconsequential increase. Donlin’s general approach of using ambient temperature for the dust collectors and wet scrubbers in heated buildings is therefore adequate for purposes of demonstrating compliance with the PM-10 and PM-2.5 AAAQS and increments.
30 The modeling files provided by Donlin indicate that the Mill is the tallest structure near the Wärtsilä engine
stacks. The modeling files also indicate that the tallest part of the Mill is 34.6 m high. The resulting stack-height to building-height ratio is 1.4.
31 The Department used the average room temperature, rather than Donlin’s ambient temperature assumption, for the following exhaust stacks: Water Treatment Plant Conditioning dust collector (Model ID 54DCL710), Lime Slaker wet scrubber stack (Model ID 15SBW550), Caustic Soda Handling, Copper sulfate Handling, Xanthate Handling, Soda Ash Handling, and Soda Ash Mixing, Lime Hopper, Lime Silo, and Flucculants Handling dust collector stacks (Model IDs 15DCL100, 15DCL105, 15DCL110, 15DCL520, 15DCL115, 15FIL535, 15DCL700 and 15DCLXFL, respectively).

Review of Donlin’s Ambient Demonstration April 4, 2017 For the Donlin Gold Project
Page 20 of 35
5.9. Open Pit Parameters AERMOD has an open pit option for characterizing PM or gaseous emissions that occur below grade. Examples of where this option could be used include open pit mines and gravel quarries. Irregularly-shaped pit areas must be characterized by a rectangle of equal area when using the open pit option. Applicants who use this option must therefore provide AERMOD with the length of each side, the pit volume, and the average release height of the emissions activities within the pit, in addition to the pit location and base elevation. If warranted, the user may also provide an orientation angle of the pit in degrees from the North. If PM emissions are modeled, the applicant must also provide the same particle size information as needed to account for particle deposition.
Donlin used the OPENPIT option to characterize the PM and gaseous emissions from the drilling, material extraction, loading and unloading, dozing and machinery emissions that occur within the open pit. This is a reasonable option for characterizing these below grade emission activities. Donlin appropriately used the same particle size information as used to account for particle deposition (see Section 5.12.3 of this report).
Pit sizes change during the life of the mine. Donlin used the average pit volume and average base elevation between LOM years 16 and 20, since LOM year 16 has the worst-case CO, NOx and PM-2.5 emissions and LOM year 20 has the worst-case PM-10 emissions. This is a reasonable approach for modeling a constantly changing activity. Additional details regarding Donlin’s derivation of these values may be found in the September 30, 2015 Technical Memorandum written by Air Sciences, Model Updates – Donlin Fugitive Source Parameters. Donlin provided the technical memorandum on October 1, 2015 as an update to a September 10, 2015 technical memorandum that they submitted during the protocol review phase (see following paragraph).32 The Department accepted the updated information on October 1, 2015.33
For the release height, Donlin used the weighted release height of the various activities characterized by the open pit algorithm (i.e., the drilling, truck loading/unloading, equipment tailpipes, and dozing activities). The resulting release height for LOM year 16 is 4.99 m and for LOM year 20 is 5.27 m.34 Donlin used the 4.99 m release height for the NO2,
CO and PM-2.5 runs and the 5.27 m release height for their PM-10 runs. These are reasonable values. Additional details regarding Donlin’s derivation of the release height may be found in the September 10, 2015 Technical Memorandum written by Air Sciences, Donlin Fugitive Source Parameters;35 and the August 17, 2015 letter from Donlin, Response to ADEC Comments on the Modeling Protocol from Donlin Gold LLC.
32 Email from Mike Rieser (Donlin) to Alan Schuler (Department); Model Updates; October 1, 2015. 33 Email from Alan Schuler (Department) to Mike Rieser (Donlin); RE: Model Updates; October 1, 2015. 34 Table 3-14 of Appendix D of the permit application contains a typographical error. The release height for LOM
year 20 is 5.27 m, not 4.85 m. 35 Donlin provided the Donlin Fugitive Source Parameters Technical Memorandum as an attachment to a
September 10, 2015 email from Mike Rieser (Donlin) to Alan Schuler (Department); RE: Quick Questions re Donlin’s u* Sensitivity Analysis.

Review of Donlin’s Ambient Demonstration April 4, 2017 For the Donlin Gold Project
Page 21 of 35
5.10. Volume Source Parameters The volume source option is frequently used to characterize fugitive emissions that have initial lateral and vertical spread near the point of release. Examples include the fugitive dust associated with construction activities or dirt roads, and wind-blown dust from storage piles. Applicants who characterize an EU or emissions activity as a volume source must provide AERMOD with the initial lateral and vertical dimensions of the volume, the release height of the emissions (volume center), and the source location and base elevation, in addition to the previously discussed emissions rate.
Donlin used the volume source option to characterize the fugitive emissions from blasting, the haul roads, the waste rock storage facility, the short-term ore storage site, the long-term ore storage site, the long-term ore storage site (east), the tailings dam, and the overburden stockpile. Using the volume source option for these types of emissions activities is appropriate.
Donlin used the approach recommended by the Haul Road Workgroup of EPA/State/Local Modelers to develop the initial dimensions of each haul road segment.36 Additional details regarding Donlin’s derivation of the haul road parameters may be found in their August 17, 2015 letter, Response to ADEC Comments on the Modeling Protocol from Donlin Gold LLC. Donlin also used the Haul Road Workgroup guidance to develop the initial dimensions for the stockpile plumes since a significant fraction of the stockpile emissions is associated with loading and unloading operations. Donlin used appropriate parameters for each volume source.
5.11. Area Source Parameters The area source option is frequently used to characterize ground or low level releases with no thermal or momentum plume rise. It can be used in lieu of the volume source approach to characterize the fugitive dust emissions from dirt roads. It’s frequently used as an alternative approach to the volume source approach for characterizing haul roads, especially when characterizing long road segments or scenarios where receptors are within the area source footprint. Applicants who characterize an EU or emissions activity as an area source must provide AERMOD with the length and width of the area, the release height of the emissions, and the location and base elevation, in addition to the previously discussed emissions rate. If warranted, the user may also provide an orientation angle of the rectangle in degrees from the North, and the initial vertical dimension of the area source plume.
Donlin used the area source option to characterize the access road and the tailings storage facility. Using the area source option for the access road is appropriate given the long road segments. Using the area source option for the tailings storage facility is also appropriate for the following reason provided by Air Sciences in their September 10, 2015 technical memorandum, Donlin Fugitive Source Parameters:
For the tailings storage facility (TAILS), a completely saturated tailings material (slurry) will be transferred through a pipeline (i.e., no truck dumping activity or
36 Memorandum from Randy Robinson, EPA Region 5 and Mick Daye, EPA Region 7 to Tyler Fox, Haul Road
Workgroup Final Report; December 6, 2011.

Review of Donlin’s Ambient Demonstration April 4, 2017 For the Donlin Gold Project
Page 22 of 35
material stockpiling; insignificant vertical dispersion), and the only emissions expected at this source are due to wind erosion of the exposed dry surfaces. Therefore, in the absence of any mechanical activity and vertical dispersion, a surface-based (zero release height) AREA source characterization was used.
Donlin used the approach recommended by the Haul Road Workgroup of EPA/State/Local Modelers to develop the release height and initial vertical dimension for the access road. Additional details regarding Donlin’s derivation of the access road parameters may be found in their August 17, 2015 letter, Response to ADEC Comments on the Modeling Protocol from Donlin Gold LLC.
5.12. Pollutant Specific Considerations The following pollutants warrant additional discussion.
5.12.1. Ambient NO2 Modeling The NOx emissions from combustion sources are partly nitric oxide (NO) and partly NO2. After the combustion gas exits the stack, additional NO2 can be created due to atmospheric reactions. Section 5.2.4 of the 2005 version of the Guideline37 describes a tiered approach for estimating annual average NO2 impacts, ranging from the simplest but very conservative assumption that 100 percent of the NO is converted to NO2, to other more complex methods. The 2005 version of the Guideline is silent with respect to 1-hour NO2 modeling techniques since it predates EPA’s January 2010 promulgation of the 1-hour NO2 NAAQS.
Donlin used the Ozone Limiting Method (OLM) to estimate their ambient NO2 concentrations. OLM is an allowed option under the 2005 version of the Guideline for estimating annual average NO2 impacts, but it was still considered an alternative modeling technique for purposes of estimating 1-hour NO2 impacts when Donlin submitted their permit application in October 2015. The 2017 version of the Guideline allows OLM for both annual and 1-hour NO2 modeling. However, the Department must continue to treat OLM as alternative modeling technique for 1-hour NO2 modeling since the Department has not yet added the January 2017 version of the Guideline to 18 AAC 50. Donlin appropriately relied on the EPA guidance that was available at the time as to how OLM could be used in a 1-hour NO2 analysis for conducting their 1-hour NO2 analysis.38
5.12.1.1 Technical Justification
OLM has been a commonly requested 1-hour NO2 modeling technique, even though it requires case-specific approval. The Department and R10 have relied on the OLM studies posted on EPA’s Support Center for Regulatory Atmospheric Modeling web-
37 EPA revised the topical outline of the Guideline in their 2017 update. The allowed NO2 modeling techniques are
discussed in Section 4.2.3.4 of the 2017 version of the Guideline. 38 Memorandum from Tyler Fox (EPA) to Regional Air Division Directors (EPA), Additional Clarification
Regarding Application of Appendix W Modeling Guidance for the 1-hour NO2 National Ambient Air Quality Standard; March 1, 2011.

Review of Donlin’s Ambient Demonstration April 4, 2017 For the Donlin Gold Project
Page 23 of 35
site as the technical basis for allowing applicants to use this technique,39 along with EPA’s March 1, 2011 1-hour NO2 modeling guidance. EPA’s adoption of OLM as an allowed 1-hour NO2 modeling technique in the January 2017 version of the Guideline further shows that OLM is a technically acceptable modeling technique.
5.12.1.2 EPA and Department Approval
R10 granted Donlin permission to use OLM for estimating 1-hour NO2 impacts on November 25, 2013.40 The Air Permit Program Manager granted permission on February 2, 2015.
5.12.1.3 Public Comment
The Department included a notice regarding Donlin’s use of OLM for estimating their 1-hour NO2 impacts in the public notice for the preliminary permit decision, as required under 40 CFR 52.21(l)(2).
5.12.1.4 In-Stack NO2-to-NOx Ratio
The assumed NO2-to-NOx in-stack ratio (ISR) is a variable that must be set for each NOx-emitting EU when modeling the NO2 impacts with OLM. Source-specific data should be used to define this ratio when available. When source-specific data is not available, an ISR of 0.5 may be used without justification for the purposes of modeling the one-hour NO2 impacts. According to EPA’s March 1, 2011 1-hour NO2 modeling guidance, this value represents a reasonable upper bound based on the available in-stack data. EPA has not provided a similar “default” ratio for the purposes of modeling the annual average NO2 impacts.
Donlin conducted a literature search and a review of available stack test data to select the ISRs for their NOx-emitting EUs. They provided the resulting ISRs in Table 3-21 of their July 2015 modeling protocol and again in Table 3-17 of Appendix D of their permit application. The Department approved the selected ISRs in its September 28, 2015 approval of Donlin’s modeling protocol. The approved ISRs are reiterated in Table 2 of this report.
Table 2. NO2-to-NOx ISRs Used by Donlin
EU Source Category ISR Blasting 0.036 Diesel Engines 0.11 Diesel Engines w/Catalyzed Particulate Filters 0.22
Diesel Boilers 0.05 Natural Gas Boilers 0.10 Diesel Machinery 0.11
39 See PVMRM and OLM Sensitivity Analysis at http://www3.epa.gov/ttn/scram/dispersion_prefrec.htm. 40 The Department asked R10 to approve Donlin’s request to use OLM on November 25, 2013, based on Donlin’s
proposal to use OLM in an initial (November 2013) version of the PSD Modeling Protocol.

Review of Donlin’s Ambient Demonstration April 4, 2017 For the Donlin Gold Project
Page 24 of 35
5.12.1.5 Ozone Data
OLM requires ambient ozone data in order to determine how much of the NO is converted to NO2. Donlin used a temporally-varying ozone data set that they derived from their two-years of pre-construction O3 data. They developed a generic monthly-hour-of day O3 profile that they used with all five years of meteorological data. They developed the profile by taking the multi-year average of the maximum O3 concentration for the given hour of day (i.e., hour 1 – 24) within each month (i.e., January through December). The resulting O3 profile is shown in Table 3-16 of Appendix D of their permit application.
Donlin used an acceptable approach for deriving a generic O3 data set for NO2 modeling purposes. Their approach also allowed the data set to reflect the substantive seasonal variation that occurs within Alaska.
5.12.1.6 AERMOD Settings
Donlin used the “OLMGROUP ALL” setting within AERMOD in their NO2 modeling analysis. This setting is consistent with EPA’s March 1, 2011 1-hour NO2 modeling guidance.
5.12.2. PM-2.5 PM-2.5 is either directly emitted from a source or formed through chemical reactions in the atmosphere (secondary formation) from other pollutants (NOx and SO2).41 AERMOD is an acceptable model for performing near-field analysis of the direct emissions, but EPA has not developed a near-field model that includes the necessary chemistry algorithms for estimating secondary impacts. EPA has instead issued guidance as to how secondary formation could be accounted for under the 2005 version of the Guideline.42 EPA described a two-by-two matrix where the direct emissions and precursor emissions are either above or below the PSD significant emission rate (SER) for those pollutants.
In Donlin’s case, the direct PM-2.5 emissions and the NOx precursor emissions exceed the respective SER. In this situation, EPA recommends the use of air quality modeling to assess the direct impacts and states that one of the following options could be used for assessing the secondary impacts: a qualitative approach, a hybrid qualitative and quantitative approach that utilizes existing technical work, or a full quantitative photochemical grid modeling analysis. Of the three options for assessing secondary impacts, EPA stated that “only a few situations would require explicit photochemical grid modeling” – i.e., the photochemical modeling approach would rarely be warranted.
Donlin used the qualitative approach for assessing their secondary PM-2.5 impacts. This is an appropriate approach for stationary sources located in rural Alaska, or other areas with limited area-wide precursor emissions. EPA also noted in their PM-2.5 modeling guidance that the maximum direct impacts and the maximum secondary impacts from a stationary source “…are not likely well-correlated in time or space” –
41 The NOx and SO2 emissions are also referred as “precursor emissions” in a PM-2.5 assessment. 42 Guidance for PM2.5 Permit Modeling (EPA-454/B-14-001); May 2014.

Review of Donlin’s Ambient Demonstration April 4, 2017 For the Donlin Gold Project
Page 25 of 35
i.e., they will likely occur in different locations and at different times. This difference occurs because secondary PM-2.5 formation is a complex photochemical reaction that requires a mix of precursor pollutants in sufficient quantities for significant formation to occur. As such, it is highly unlikely that there is sufficient time for the reaction to substantively occur within the immediate near-field, where the maximum direct impacts typically occur. The formation of secondary particulates within the immediate near-field, which is where Donlin’s maximum direct PM-2.5 impacts occurs, is therefore likely to be inconsequential.
EPA stated that representative ambient monitoring data could be used to address the secondary formation that occurs from off-site sources in the ambient standard demonstration. The pre-construction PM-2.5 data that Donlin used to represent the background concentration in their PM-2.5 AAAQS analysis (see Section 5.17 of this report) meets this objective.
Donlin correctly noted in their qualitative analysis (Section 3.13.2 of Appendix D of their permit application) that the measured 24-hour and annual PM-2.5 concentrations are well below the respective AAAQS and that there is therefore no indication that secondary PM-2.5 formation from existing sources are causing or contributing to violations of the PM-2.5 AAAQS. They also provided additional arguments that appropriately demonstrate that the PM-2.5 AAAQS will not be threatened by secondary PM-2.5 formation.
Donlin used the time and space argument for their PM-2.5 increment demonstrations, as well as the PM-2.5 AAAQS demonstrations. Donlin further noted that their PM-2.5 modeling analyses showed a wide-margin of compliance with the 24-hour and annual PM-2.5 increments (see Section 5.19 of this report), and that the minimal impacts from secondary formation at the maximum impact locations could easily be accommodated without violating the Class II increments. Donlin did not include the effects of secondary PM-2.5 formation from area-wide sources in their PM-2.5 increment demonstrations since the regional sources are not increment consuming (see Section 3.6 of this report).
5.12.3. Particle Deposition Deposition refers to the natural settling of particles that occurs as a PM plume travels downwind. AERMOD has two algorithms for simulating this occurrence: Method 1 and Method 2. The Method 1 approach may be applied under the regulatory default option of AERMOD, i.e. the use of Method 1 is allowed in a regulatory modeling analysis. The Method 2 approach is considered a non-Guideline method and, therefore, requires case-specific approval from the Department and EPA under the alternative modeling procedures of the Guideline. Donlin used the Method 1 deposition option within AERMOD to improve the accuracy of their estimated PM-10 and PM-2.5 concentrations.
The Method 1 algorithm requires data that reflects the particle size distribution for each activity with PM emissions. The user essentially categorizes the emissions by particle size and then provides AERMOD the mass-mean aerodynamic particle diameter, mass

Review of Donlin’s Ambient Demonstration April 4, 2017 For the Donlin Gold Project
Page 26 of 35
fraction, and particle density for each category. Donlin categorized the open pit particulate emissions as shown in Table 3-20 of Appendix D of their permit application and the remaining PM emissions as shown in Table 3-21. They summarized the basis for these categories and parameters in Table 3-19. Donlin used a reasonable approach and values to incorporate the effects of particle deposition.
5.13. Downwash Downwash refers to the situation where local structures influence the plume from an exhaust stack. Downwash can occur when a stack height is less than a height derived by a procedure called “Good Engineering Practice” (GEP), which is defined in 18 AAC 50.990(42).
EPA developed the “Building Profile Input Program - PRIME” (BPIPPRM) program to determine which stacks could be influenced by nearby structures and to generate the cross-sectional profiles needed by AERMOD to determine the resulting downwash. Donlin used the current version of BPIPPRM, version 04274, to determine the building profiles needed by AERMOD.
Donlin included all of their modeled point sources in their downwash analysis. BPIPPRM indicated that the exhaust stacks are within the GEP stack height requirements. The Department also used a proprietary 3-D visualization program to review Donlin’s characterization of the exhaust stacks and structures. None of the building dimensions, locations, and stack heights stood out as being unusual or questionable.
5.14. Ambient Air Boundary The AAAQS and increments only apply in ambient air locations, which has been defined by EPA as, “that portion of the atmosphere, external to buildings, to which the general public has access.” 43 Applicants may therefore exclude areas that they own or lease from their ambient demonstration if public access is “precluded by a fence or other physical barrier.” 44 They conversely need to model that portion of their property/lease that has no such restriction, or where there is an easement or public right-of-way. Natural features, such as dense vegetation or topographical features, can provide adequate barriers to public access, although the adequacy of the given features must be evaluated on a case-specific basis.
Donlin identified a “Core Operating Area” (COA) to indicate the area where public access will be excluded. They used the COA boundary as the ambient air boundary. The COA is identified in numerous figures throughout the permit application, including Figure 3-5 of Appendix D and Figure 3 of their March 2017 PACB.
Donlin stated their lease agreements grant them the legal authority to preclude access within the COA. They also provided letters from both The Kuskokwim Corporation (TKC), and the
43 The term “ambient air” is defined in 40 CFR 50.1. The Alaska Legislature has also adopted the definition by
reference in AS 46.14.90(2). 44 EPA has written a number of guidance documents regarding ambient air issues which may be found in their
Modeling Clearinghouse Information Storage and Retrieval System (MCHISRS) or EPA Region 7’s “Title V, NSR/PSD Policy and Guidance Database” (see http://cfpub.epa.gov/oarweb/MCHISRS/ and http://www.epa.gov/region07/air/search.htm). The documents routinely use the phrase “fence or other physical barrier” when discussing an acceptable means for precluding public access at onshore locations. The phrase originated in a December 19, 1980 letter from EPA Administrator Douglas Costle to Senator Jennings Randolph.

Review of Donlin’s Ambient Demonstration April 4, 2017 For the Donlin Gold Project
Page 27 of 35
Calista Corporation (Calista), that confirms that Donlin has the authority to preclude public access within the portion of the COA that is owned by the given corporation. They further provided an abbreviated copy of the lease agreement with Lyman Resources in Alaska, Inc. (Lyman) in their January 19, 2016 submittal to confirm that Donlin has exclusive access and use of the surface lands leased to Donlin by Lyman.
Donlin noted that there are currently 13 publicly recognized access easements or rights-of-way within the COA that they are trying to reroute. They clarified in their January 19, 2016 submittal that they petitioned the Alaska Department of Natural Sources, the Alaska Department of Transportation and Public Facilities, and the U.S. Bureau of Land Management on August 6, 2015 to extinguish the easements within the COA. According to Donlin, the rerouting effort will likely not be finalized until the third quarter of 2018. This timeline is longer than the timeline likely needed to issue a final permit decision. The Department is therefore including a permit condition that prohibits operation until all easements or rights-of-way within the COA have been either extinguished or rerouted to areas outside the COA.
Donlin will use the methods described in their PACB to restrict public access within the COA. The methods vary by location, but could include fencing/gate, natural barriers, and surveillance by mine security. Donlin will annually inform the TKC and Calista shareholders on the access restrictions, as well as place warning signs at strategic locations. The Department included the PACB as an attachment to the permit and included a condition that requires Donlin to restrict public access within the COA as described in the PACB.
5.15. Worker Housing Donlin intends to house their workers on site due to DGP’s remote location. Worker housing areas must be treated as ambient air except under the conditions described in the Department’s Ambient Air Quality Issues at Worker Housing policy.45 The conditions are:
1) the worker housing area is located within a secure or remote site; 2) the worker housing area is for official business/worker use only; and 3) the operator has a written policy stating that the on-site workers are on 24-hour call.
Donlin did not treat the worker housing area (Employee Camp Complex) as ambient air for the reasons explained in Section 3.4.2 of Appendix D of their permit application. The Department agrees that their housing plan meets the conditions listed in its worker housing policy for taking this approach. The location is clearly remote, which meets the first condition; casual or family visits will not be permitted, which meets the second condition; and Donlin stated that “any person staying at the living quarters will be on 24-hour call,” which meets the third condition.
5.16. Receptor Grid Donlin used a 100 m grid spacing along the north and northeastern portion of the ambient air boundary, and a 50 m grid spacing along the rest of the ambient air boundary. They also placed additional receptors beyond the 50 m grid, as follows:
45 Policy and Procedure No. 04.02.108; October 8, 2004.

Review of Donlin’s Ambient Demonstration April 4, 2017 For the Donlin Gold Project
Page 28 of 35
every 100 m within the first 500 m of the 50 m grid; and every 500 m within the next kilometer (km) or more of the 100 m grid.
After running their modeling analysis with the above grid, Donlin confirmed the maximum impacts by conducting a fine grid “hot spot” analysis for each pollutant and averaging period. The fine grid consisted of receptors placed every 25 m within the general area of maximum impact for the given pollutant. The hot spot analyses lead to either identical or nearly identical results. The similarity not only confirms the original values, but also demonstrates that the original receptor grid had sufficient resolution for determining the maximum impacts.
5.17. Off-Site Impacts The impact from neighboring (off-site) sources must be accounted for in a cumulative impact assessment. In accordance with Section 8.2.3 of the Guideline, “…all sources expected to cause a significant concentration gradient in the vicinity of the [applicant’s source] should be explicitly modeled.” The impact from other sources can be accounted for through ambient monitoring data.
The off-site inventory and background concentration must be evaluated together in order to ensure that the impact from all non-project sources are adequately accounted for in the cumulative impact assessment. The data used to represent the background concentration in a cumulative AAAQS analysis must represent the impact from all un-modeled sources, including natural, area and long-range transport. Once the background concentration is determined, it is added to the modeled concentration to estimate the total ambient concentration.
DGP is located in a remote part of Alaska. There are no nearby stationary sources that would cause a significant concentration gradient within the project area. For example, the nearest stationary source with an air quality control operating permit (the Bethel Power Plant) is roughly 250 km from DGP. This is well beyond the 50 km range of AERMOD. Donlin therefore used their pre-construction monitoring data to represent the impact from all off-site sources (natural and anthropogenic) in their cumulative AAAQS analysis. This approach is both reasonable and consistent with Section 8.2 of the Guideline.
There are various ways to add a background concentration to the modeled concentration in an AERMOD analysis. The long-standing practice is to manually add the two numbers. However, the most recent versions of AERMOD include an option where the background concentration can be automatically added to the modeled concentration. This option also allows applicants to include temporarily-varying background concentrations in their ambient demonstrations.
Donlin used the manual approach in their CO, PM-10 and PM-2.5 AAAQS demonstrations, but the more refined temporarily-varying option for their 1-hour and annual NO2 AAAQS demonstrations. They appropriately did not include background concentrations in their cumulative increment assessments since there are no increment consuming sources within the project area.

Review of Donlin’s Ambient Demonstration April 4, 2017 For the Donlin Gold Project
Page 29 of 35
Donlin derived their temporally-varying NO2 background concentrations from their four-years of pre-construction NO2 data. They used the same approach as used to develop their temporally-varying O3 profile; i.e., they took the multi-year average of the maximum NO2 concentration for the given hour of day within each month. The resulting NO2 concentrations are shown in Table 3-18 of Appendix D of their permit application. Donlin’s use of the multi-year average of the maximum hour of day values within the month is consistent with EPA’s March 1, 2011 1-hour NO2 modeling guidance.
For the CO, PM-10 and PM-2.5 AAAQS demonstrations, Donlin added the maximum measured concentration (as measured according to the form of the given AAAQS) to the modeled design concentration (see the following discussion).
5.18. Design Concentrations EPA allows applicants to use modeled concentrations that are consistent with the form of the given standard or increment. Donlin generally used the modeled concentrations that are consistent with this approach, although they used a slightly more conservative approach in their 24-hour PM-10 AAAQS and their annual PM-2.5 AAAQS demonstrations. For the 24-hour PM-10 AAAQS demonstration, Donlin used the h2h concentration from the worst-case meteorological year, rather than the high-sixth-high concentration over the entire five year meteorological period. For the annual PM-2.5 AAAQS demonstration, Donlin used the highest concentration from the worst-case meteorological year, rather than the multi-year average of the highest concentrations. The design concentrations used by Donlin are summarized in Table 3.
Table 3. Donlin’s Approach for Determining The Modeled Design Concentrations
Pollutant Avg.
Period AAAQS Class II
Increment
NO2 1-hr h8h --Annual HY HY
PM-10 24-hr h2h h2h Annual -- HY
PM-2.5 24-hr h8h h2h Annual HY HY
CO 1-hr h2h --8-hr h2h --
Table Notes: h2h = high, second-high. h8h = high, eighth-high. For purposes of 1-hour NO2, the “h8h” is the five-
year average of the high, eighth-high of the daily maximum 1-hr NO2 concentrations. For purposes of 24-hour PM-2.5, the “h8h” is the five-year average of the high, eighth-high of the 24-hour PM-2.5 concentrations.
HY = highest annual average from any year. -- = there is no AAAQS/increment (as applicable) for this
pollutant/averaging period.

Review of Donlin’s Ambient Demonstration April 4, 2017 For the Donlin Gold Project
Page 30 of 35
5.19. Results and Discussion The maximum NO2, CO, PM-10 and PM-2.5 impacts from Donlin’s AAAQS demonstration are presented in Table 4, along with the background concentrations, total impacts, and AAAQS. The total impact is less than the AAAQS for each pollutant and averaging period. Therefore, Donlin has demonstrated compliance with the NO2, CO, PM-10 and PM-2.5 AAAQS.
Table 4. Maximum Impacts Compared to the AAAQS
Pollutant Avg.
Period
Max. Conc.
(g/m3)
Bkgd. Conc.
(g/m3)
Total Impact (g/m3)
AAAQS (g/m3)
NO2 1-hour 112 [a] 112 188 Annual 12 [a] 12 100
PM-2.5 24-hour 2.8 6.8 9.6 35 Annual 0.7 2.3 3.0 12
PM-10 24-hour 23 14 37 150
CO 1-hour 9,956 687 10,643 40,000 8-hour 2,353 458 2,811 10,000
Table Notes: [a] Donlin included the NO2 background concentration as part of the AERMOD run.
The impacts from Donlin’s NO2, PM-10 and PM-2.5 Class II increment demonstrations are presented in Table 5, along with the respective Class II increment. In each case, the maximum impact is less than the applicable Class II increment. Therefore, Donlin has demonstrated compliance with the NO2, PM-10, and PM-2.5 Class II increments.
Table 5. Maximum Impacts Compared
to the Class II Increments
Pollutant Avg.
Period
Max. Modeled
Conc. (g/m3)
Class II Increment
(g/m3) NO2 Annual 5.1 25
PM-2.5 24-hr 6.0 9Annual 0.7 4
PM-10 24-hr 23.3 30
Annual 2.5 17

Review of Donlin’s Ambient Demonstration April 4, 2017 For the Donlin Gold Project
Page 31 of 35
6. OZONE IMPACTS As discussed in the Background section, VOC is a triggered PSD-pollutant for this project. There is no VOC AAAQS, but VOC and NOx emissions can form O3, which does have an AAAQS. Donlin was therefore required to demonstrate compliance with the O3 AAAQS, per 40 CFR 52.21(k). O3 is not usually emitted directly into the air. It is instead created in the atmosphere through chemical reactions involving sunlight and NOx/VOC emissions. It is inherently a regional pollutant, the result of chemical reactions between emissions from many NOx and VOC sources over a period of hours or days, and over a large area. The 2005 version of the Guideline does not list a recommended model for assessing the O3 impact from an individual stationary source. Qualitative approaches are instead generally used to meet the 40 CFR 52.21(k) ambient demonstration requirement. DGP is located in an area that is designated as unclassifiable for all criteria pollutants, including O3. Donlin further noted that there are no O3 non-attainment areas in Alaska, even for areas with much larger NOx and VOC emissions. Therefore, it is unlikely that the NOx and VOC emissions from DGP would cause or contribute to a violation of the O3 AAAQS. Donlin provided a comparison of the DGP emissions to the much larger NOx and VOC emissions from Anchorage to help illustrate their point. They then noted that while the Anchorage emissions are 4 to 10 times higher than the DGP emissions, the ambient concentration still complies with the O3 AAAQS. Donlin’s O3 demonstration is reasonable and acceptable. The emissions and concentrations that Donlin compared are reiterated below in Table 6, with minor editorial revisions. The monitored values reflect the multi-year average of the fourth-high daily maximum 8-hour concentrations measured at the indicated location. The concentrations measured at both locations comply with recently revised 8-hour O3 AAAQS. Additional details regarding Donlin’s comparison may be found in Section 3.13.3 of Appendix D of their permit application.
Table 6. DGP and Anchorage Area O3 Comparison
Source
O3 Precursor Emissions (tpy)Monitored
8-hr O3 Conc. (ppm)
8-hr O3 AAAQS (ppm) NOx VOC Total
DGP 3,241 1,279 4,520 0.051 0.070 Anchorage Area 13,535 13,059 26,594 0.045
Review of Donlin’s Ambient Demonstration April 4, 2017 For the Donlin Gold Project
Page 32 of 35
7. ADDITIONAL IMPACT ANALYSES PSD applicants must assess the impact from the proposed project and associated growth on visibility, soils, and vegetation per 40 CFR 52.21(o). Donlin provided the additional impact analysis in Section 3.13.4 of Appendix D of their October 2015 permit application. The Department’s findings regarding their additional impact analysis are reported below.
7.1. Visibility Impacts PSD applicants must assess whether the emissions from their stationary source, including associated growth, will impair visibility. Visibility impairment means any humanly perceptible change in visibility, such as visual range, contrast, or coloration, from that which would have existed under natural conditions. Visibility impacts can occur as visible plumes, i.e., “plume blight,” or in a general, area-wide reduction in visibility, also known as “regional haze”. Alaska does not have standards for plume blight. For Class I areas, the Federal Land Manager (FLM) provides the desired thresholds. There are no established thresholds for Class II areas. The typical tool for assessing plume blight is EPA’s VISCREEN model.
The maximum range of VISCREEN is 50 km. When Class I areas lie beyond that range, as in the case at hand, the Department recommends that the applicant use the 50 km maximum range as the source to observer distance. This approach provides the upper bound of the potential plume blight impacts at more distance locations. In Donlin’s case, using the 50 km source to observer distance provides extremely conservative results since Denali is actually 315 km away. When running VISCREEN in an upper bound analysis, the 50 km range would also be used as the “nearest” source to boundary distance per page 24 of EPA’s Workbook for Plume Visual Impact Screening and Analysis (Revised).46
Since there are no Class II visibility thresholds, VISCREEN compares the visibility impacts to the Class I thresholds. VISCREEN provides results for impacts located inside a Class I area and for impacts located outside a Class I area. The latter is used in situations where there is an “integral vista.” In situations where there are no integral vistas, applicants only need to use the results for impacts located inside a Class I area. Alaska only has two integral vistas, both of which are associated with the Denali Class I area. Since the integral vistas are well beyond the 50 km range of VISCREEN, the Department informed Donlin that they only needed to report the “inside” results.
Donlin used the current version of VISCREEN (version 13190) to estimate their worst-case plume blight. They appropriately assumed an ozone concentration of 40 parts per billion (ppb) and a “background visual range” of 250 km. They also appropriately excluded the fugitive and mobile emissions from the plume blight analysis since those emissions do not consist of coherent plumes. They therefore just used the annual NOx and PM emissions from their point sources.
Donlin initially used the default “Level 1” approach of assuming a constant 1.0 m/s wind speed and extremely stable atmospheric conditions (“F” stability class). This approach showed potential plume blight at 50 km. The Department notes that while Donlin
46 Workbook for Plume Visual Impact Screening and Analysis (Revised), (EPA-454/R-92-023); October 1992.

Review of Donlin’s Ambient Demonstration April 4, 2017 For the Donlin Gold Project
Page 33 of 35
appropriately followed standard practice in their Level 1 analysis, the results are extremely conservative and unlikely to occur since the wind would need to hold steady for the entire 87.5 hours that it would take for a plume to travel from Donlin to Denali at 1.0 m/s.
Donlin next conducted a “Level 2” analysis, which relies on more realistic plume travel times and uses site-specific meteorological conditions. EPA’s Workbook for Plume Visual Impact Screening and Analysis (Revised), states: “For the Level-2 screening analysis, we assume it is unlikely that steady-state plume conditions will persists for more than 12 hours.” The wind speed would therefore need to be 8 m/s or more in order for the plume to travel the full 315 km within 12 hours. Donlin then filtered their five years of American Ridge meteorological data and found that a stability class of “D” was the worst-case stability associated with an 8 m/s wind speed. They then reran VISCREEN with these parameters (8 m/s winds and “D” stability) to show that the plume would comply with the Class I thresholds.
7.2. Soil and Vegetation Impacts The ambient demonstration provided by applicants is typically adequate for showing that their air emissions will not cause adverse soil or vegetation impacts. EPA has established what they refer as “secondary” NAAQS in order to protect public welfare. The term “welfare” is defined in Section 302(h) of the Clean Air Act to include “effects on soils, water, crops, vegetation ...” The AAAQS and primary NAAQS are identical for each of the modeled pollutants. However, the annual PM-2.5 secondary NAAQS (15 µg/m3) is less stringent than the annual PM-2.5 primary NAAQS/AAAQS (12 µg/m3). Therefore, a modeling analysis that demonstrates compliance with the AAAQS also demonstrates compliance with the secondary NAAQS.
Donlin demonstrated that they can comply with the AAAQS. Therefore, their March 2017 ambient analysis demonstrates that they will not have adverse soil or vegetation impacts. The maximum cumulative impacts for the PSD-triggered pollutants with secondary NAAQS are reiterated in Table 7.
Table 7. Maximum Total Impacts Compared To The Secondary NAAQS
Pollutant Avg.
Period
Total Impact (g/m3)
Secondary NAAQS (g/m3)
NO2 Annual 12 100
PM-2.5 24-hour 9.6 35Annual 3.0 15
PM-10 24-hour 37 150
7.3. Associated Growth Analysis 40 CFR 52.21(o)(2) requires PSD applicants to provide an analysis of the air quality impact projected for the area as a result of general commercial, residential, industrial and other growth associated with the source or modification. Donlin does not expect significant

Review of Donlin’s Ambient Demonstration April 4, 2017 For the Donlin Gold Project
Page 34 of 35
changes in these categories due to DGP, which means there would be no associated impact on air quality. The Department accepts Donlin’s assessment.
8. CONCLUSION The Department reviewed Donlin’s permit application and concluded the following:
1. Donlin’s ambient demonstration satisfies the Source Impact Analysis requirements of 40 CFR 52.21(k). Donlin demonstrated that the NOx, PM-10, PM-2.5, CO, and VOC emissions associated with operating the stationary source, within the restrictions listed in this report, will not cause or contribute to a violation of the NO2, PM-10, PM-2.5, CO and O3 AAAQS. They also demonstrated that the emissions will not cause or contribute to a violation of the NO2, PM-10, and PM-2.5 Class II increments.
2. Donlin appropriately used the models and methods required under 40 CFR 52.21(l) Air Quality Models.
3. Donlin conducted their modeling analysis in a manner consistent with the Guideline, as required under 18 AAC 50.215(b)(1).
4. Donlin’s pre-construction data satisfies the Preapplication Analysis requirements of 40 CFR 52.21(m)(1).
5. Donlin adequately addressed the Additional Impact Analysis provisions in 40 CFR 52.21(o).
The Department developed conditions in Construction Permit AQ0934CPT01 to ensure that Donlin complies with the modeled AAAQS and Class II increments. These conditions are summarized as follows:
To protect the NO2, PM-10, PM-2.5, and CO AAAQS, and the NO2, PM-10 and PM-2.5 Class II increments, Donlin will need to:
o Prohibit construction and operation until all easements or rights-of-way within the COA have either been extinguished or relocated to areas outside the COA.
o Restrict public access within the COA as described in their March 2017 PACB; o Limit the gyratory crusher (EU 41) throughput to 5,100 ton/hr; o Limit the SAG Mill Feed Conveyor (EU 54) throughput to 3,303 ton/hr; o Limit the total rated capacity of the primary power plant generator sets (EUs 1 –
12) to 210 MW; o Use no more than 60,000 metric tons per year of blasting agent; o Comply with the NOx, PM-10, PM-2.5 and CO BACT emission limits, as
applicable for each EU; and
Review of Donlin’s Ambient Demonstration April 4, 2017 For the Donlin Gold Project
Page 35 of 35
o Construct and maintain the exhaust stack for each primary power plant generator set (EUs 1 - 12) so that it has: an uncapped, vertical release;47 and a release height that is 49 m or more above grade.
To protect the 1-hour NO2 AAAQS, the annual NO2 AAAQS, the annual NO2 Class II increment, the annual PM-10 Class II increment, the annual PM-2.5 AAAQS, and the annual PM-2.5 increment, Donlin shall limit the operation of the black start generators (EUs 29 - 30), the emergency generators (EUs 31 - 34), and the fire pumps (EUs 35 - 37), to no more than 500 hrs/yr per unit.
To protect the 24-hour PM-10 AAAQS, the 24-hour PM-10 Class II increment, the annual PM-10 Class II increment, the 24-hour PM-2.5 AAAQS, the 24-hour PM-2.5 Class II increment, the annual PM-2.5 AAAQS, and the annual PM-2.5 Class II increment, Donlin shall:
o Limit the area that they blast to 120,000 ft2 per blast; and o Comply with the BPMs described in their October 2015 Fugitive Dust Control
Plan.48
47 The stacks may alternatively have flapper valve rain covers, or other similar designs, that do not hinder the
vertical momentum of the exhaust plume. 48 Construction Permit AQ0934CPT01 references the various BPMs in either the BACT section of the permit
(Section 5), or the ambient air section of the permit (Section 4). However, the distinction is irrelevant for ambient air purposes since Donlin must comply with the BACT requirements in order to protect the AAAQS/increments. Therefore, they must essentially comply with all of the BPMs in order to protect the PM AAAQS/increments.