alaska population digestlive.laborstats.alaska.gov/pop/estimates/pub/popdigest.pdf · alaska...
TRANSCRIPT


Alaska Population Digest • 2009 Estimates 1
Alaska Population Digest2009 Estimates
State of AlaskaSean Parnell, Governor
Department of Labor and Workforce DevelopmentCommissioner Click Bishop
Brynn Keith, ChiefResearch and Analysis
Elisabeth MercerDemographer
Eric Sandberg Research Analyst
Published August 2010
This publication was prepared by the Department of Labor & Workforce Development,Research and Analysis Section, at a cost of $3.77 per copy.
For more information, [email protected]
Cover photo courtesy of Elisabeth Mercer

Alaska Population Digest • 2009 Estimates2
PrefaceAlaska Population DigestAlaska Population Digest provides an executive over-view of the ever-changing people of the State of Alaska. The digest serves as a companion to the Alaska Popu-lation Overview, a comprehensive portrait of Alaska’s population. The Research and Analysis Section will print the digest as a complement to certain editions of the Alaska Population Overview.
With Census 2010 taking place, the Demographics Unit will not produce 2010 population estimates. The next publication will compare Census 2010 data to previous decennial census findings. The planned population publications schedule through 2013 is:
• Alaska Population Overview Census 2010: Summer 2011 (hardcopy and online)• Alaska Population Overview 2011 Estimates: Summer 2012 (hardcopy and online)• Alaska Population Digest 2012 Estimates: Summer 2013 (hardcopy and online)
This 2009 edition of Alaska Population Digest consists of four chapters, which include current estimates for the state, its boroughs/census areas and places. The population concepts and definitions used here are the same as those used by the United States Bureau of the Census at the time of the 2000 Census.
Populations presented here are for the resident population of Alaska. All July 1 population estimates represent an annual average population for each year rather than the population on July 1. Seasonal populations in parts of Alaska may be higher than the annual average permanent resident population.
For further information regarding topics covered in this edition, including historical estimates as well as information and data from the April 1, 2000, U.S. Cen-sus of Population and Housing, refer to the electronic (PDF) publication of Alaska Population Overview 2009 Estimates located at: http://laborstats.alaska.gov Select Population Estimates & Projections from the choices at the left.
Accuracy
While estimates in this publication are published in unrounded form for ease of use in other computations, the reader should not assume that estimates are ac-curate to the last digit. In general, the state estimate is assumed to be accurate to the nearest thousand and borough/census area estimates to the nearest hundred.
Acknowledgments
Many thanks goes to Jeff Hadland, Economist, for his meticulous review and helpful suggestions. Special acknowledgment is given to the Vital Statistics section of the Division of Public Health and the Department of Health and Social Services and the Alaska Depart-ment of Revenue for their aid in providing information essential to the production of these estimates. Special thanks also goes to the Department of Health and Social Services for the financial support in the produc-tion of these estimates. Recognition goes to the per-sonnel departments of the U.S. Army, U.S. Air Force, and U.S. Coast Guard in Alaska for the statistics they provide each year on the military population of Alaska.
Comments or suggestions regarding the content or for-mat of this publication are welcome. Many of the most requested statistics found here may also be found on the Research and Analysis Web site at: http://laborstats.alaska.gov - Select Population Estimates & Projections from the choices at the left. Requests for demographic estimates and projections information may also be addressed to Demographics Unit, Research and Analysis Section, Alaska Depart-ment of Labor, P.O. Box 115501, Juneau, Alaska, 99811-5501. Telephone: (907) 465-4500; FAX: (907) 465-4506; email: [email protected]
Alaska Population Digest • 2009 Estimates 3
Page
Chapter 1: Alaska State Population 5Figure 1.1 Alaska Total Population, 1946-2009 6Figure 1.2 Components of Population Change for Alaska, 1947-2009 6Figure 1.4 Migration to and from Alaska by U.S. Region 2009 7Figure 1.5 Alaska Population by Age, Race (Alone) and Sex, 2009 7Figure 1.6 Alaska Population by Age and Sex, 2000, 2009 7Figure 1.7 Alaska and U.S. Population by Age and Sex, 2009 (Percent Distribution) 8Figure 1.8 Alaska Population by Age Group, Selected Years, 1980 to 2009 8Figure 1.9 Males per 100 Females by Age, Alaska and the U.S., July 1, 2009 9Figure 1.10 Alaska Households by Type, 2009 9Figure 1.11 Family Households by Type, Alaska, 2009 9Table 1.1 Annual Components of Population Change for Alaska, 1945-2009 10Table 1.2 Migration to and from Alaska, 1980-2009 11Table 1.3 Migration Rates to and from Alaska by Region and Selected States, 1980-2008 12Table 1.4 Native American and Total Population of Alaska, Selected Years, 1910-2009 13Table 1.8 Alaska Total Population by Age and Sex, July 1, 2009 14Table 1.9 Alaska Population by Age, Race Alone and Sex, July 1, 2009 15Table 1.10 Alaska Population by Age, Race Alone or in Combination, Ethnicity and Sex, July 1, 2009 17Table 1.11 Alaska Population by Age, Race Alone and Sex, July 1, 2008 19Table 1.12 Alaska Population by Age, Race Alone or in Combination, Ethnicity and Sex, July 1, 2008 21Table 1.29 Alaska Population and Distribution by Selected Age Groups, 1950-2009 23Table 1.30 Alaska Households by Type, 1990, 2000, 2005-2008 24
Chapter 2: Alaska Boroughs/Census Areas 25Figure 2.1 Population by Labor Market Region, 1960, 1970, 1980, 1990, 2000, 2009 27Figure 2.2 Average Annual Growth Rate, Five Most Populous Alaska Boroughs, 1960 to 2009 27Figure 2.3 Average Annual Rate of Natural Increase by Borough/Census Area, 2000-2009 28Figure 2.4 Average Annual Gross Migration Rate by Borough/Census Area, 2000-2009 28Figure 2.5 Average Annual Net Migration Rate by Borough/Census Area, 2000-2009 29Figure 2.6 Proportion Native American (Alone) by Borough/Census Area, 2000-2009 29Table 2.1 Population by Alaska Region and Borough/Census Area, 2000-2009 30Table 2.2 Household Population by Alaska Borough/Census Area, 2000, 2009 32Table 2.3* Characteristics of Alaska Regions, Boroughs/Census Areas, and Components of Change, 2008-2009 33Table 2.4 Alaska Region and Borough/Census Area Population by Race and Ethnicity, July 1, 2009 35Table 2.5 Alaska Region and Borough/Census Area Population by Race and Ethnicity, July 1, 2008 36Table 2.7 Alaska Region and Borough/Census Area Population by Age and Sex, 2000, 2009 39Table 2.8 Personal Income by Alaska Region and Borough/Census Area, 1990, 1995, 2000, 2008 46Table 2.9 Per Capita Income by Alaska Region and Borough/Census Area 1990, 1995, 2000, 2008 47
Chapter 3: Special Populations and Areas 48Table 3.1 Military Population in Alaska, 2000, 2009 49Table 3.2 Military and Dependant Population in Alaska, 2000, 2009 50Table 3.3 Population Estimates for Alaska Native Regional Corporation Areas, by Race, 2000, 2009 50Table 3.5 Population Estimates for Alaska School Districts and Level of Education, 1990, 2000, 2005, 2009 51Table 3.6 Population of Areas of Canada Bordering Alaska, 1996, 2001, 2006, 2009 52
Table of ContentsAlaska Population Digest
*Abbreviated table in comparison to the original found in the Alaska Population Overview 2009 Estimates.

Alaska Population Digest • 2009 Estimates4
Table of ContentsAlaska Population Digest
Chapter 4: Alaska Places 53Figure 4.1 Alaska’s Population by Size of Place, 2009 53Table 4.1 Population by Size of Place, 1990, 2000, 2009 54Table 4.2 The 32 Alaska Cities and Places With More Than 2,500 People, 2000, 2006-2009 54Table 4.3* Alaska Places by Borough/Census Area 2000-2009 55Table 4.4 Alphabetical Listing of Alaska Places 2000, 2006-2009 65
Appendix A: New Borough/Census Area Maps 72
Excluded historical figures and tables that can be found in the Alaska Population Overview 2009 Estimates:
Chapter 1: Alaska State PopulationFigure 1.3 Migration to/from Alaska by U.S. Region 1990-2000Table 1.5 Population by Race and Ethnicity, Alaska and the U.S., 1990, 2000 Table 1.6 Population for American Indian, Alaska Native and Tribal Group, Alaska and U.S., 1990, 2000Table 1.7 Population for Asian and Pacific Islander, Alaska and U.S., 1990, 2000Table 1.13 Alaska Population by Age, Race Alone and Sex, July 1, 2007Table 1.14 Alaska Population by Age, Race Alone or in Combination, Ethnicity and Sex, July 1, 2007Table 1.15 Alaska Population by Age, Race Alone and Sex, July 1, 2006Table 1.16 Alaska Population by Age, Race Alone or in Combination, Ethnicity and Sex, July 1, 2006Table 1.17 Alaska Population by Age, Race Alone and Sex, July 1, 2005Table 1.18 Alaska Population by Age, Race Alone or in Combination, Ethnicity and Sex, July 1, 2005Table 1.19 Alaska Population by Age, Race Alone and Sex, July 1, 2004Table 1.20 Alaska Population by Age, Race Alone or in Combination, Ethnicity and Sex, July 1, 2004Table 1.21 Alaska Population by Age, Race Alone and Sex, July 1, 2003Table 1.22 Alaska Population by Age, Race Alone or in Combination, Ethnicity and Sex, July 1, 2003Table 1.23 Alaska Population by Age, Race Alone and Sex, July 1, 2002Table 1.24 Alaska Population by Age, Race Alone or in Combination, Ethnicity and Sex, July 1, 2002Table 1.25 Alaska Population by Age, Race Alone and Sex, July 1, 2001Table 1.26 Alaska Population by Age, Race Alone or in Combination, Ethnicity and Sex, July 1, 2001Table 1.27 Alaska Population by Age, Race Alone and Sex, July 1, 2000Table 1.28 Alaska Population by Age, Race Alone or in Combination, Ethnicity and Sex, July 1, 2000
Chapter 2: Alaska Boroughs and Census AreasTable 2.6 Alaska Region and Borough/Census Area Population by Race and Ethnicity, April 1, 2000
Chapter 3: Special Populations and AreasFigure 3.1 Alaska Military and Civilian Population by Age and Sex, 2000Table 3.4 Population by House and Senate District 2000, 2008; Registered Voters by Party and General
Election Results, 2008
*Abbreviated table in comparison to the original found in the Alaska Population Overview 2009 Estimates.

Alaska Population Digest • 2009 Estimates 5
IntroductionThis chapter discusses population trends for Alaska. It contains a section on the components of population change, which includes birth, death and migration flows. There are discussions of the age, male/female and race composition as well.
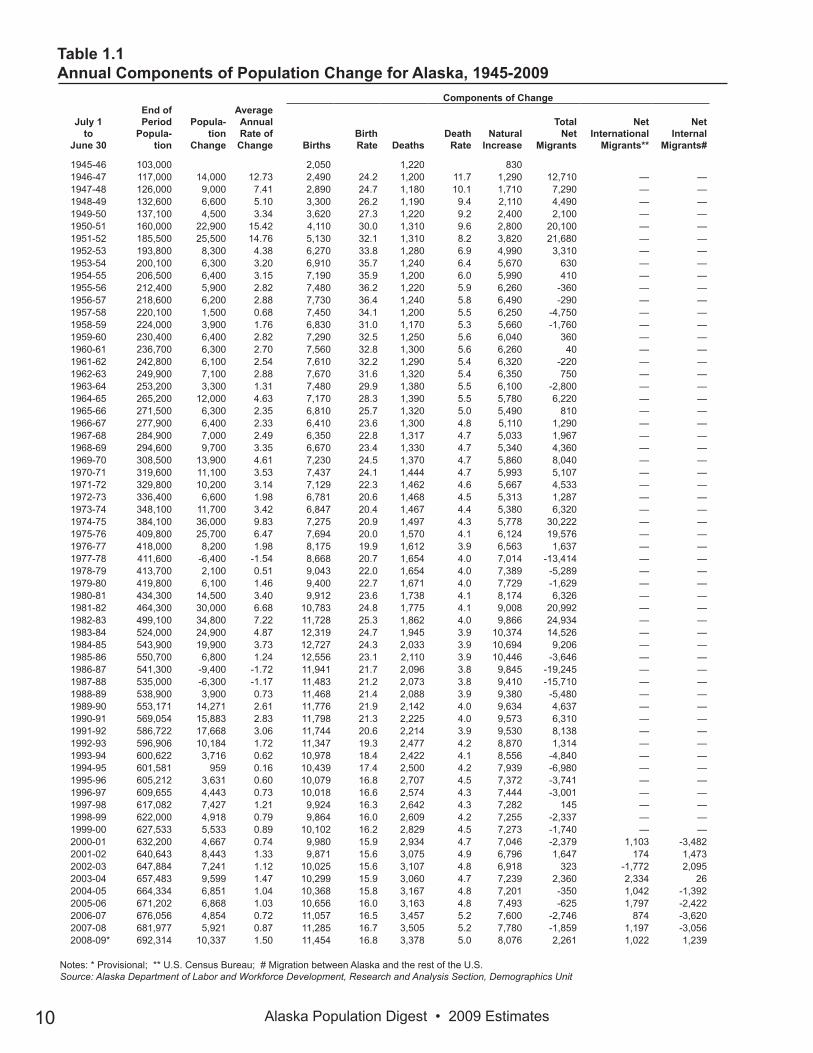
State Population Estimate (Figure 1.1; Tables 1.1, 1.4)•The provisional July 1, 2009, Alaska resident popu-lation was estimated to be 692,314, or 0.23% of the population of the U.S. •Between 2008 and 2009, Alaska saw a steady increase in overall population (1.5%).
Natural Increase (Figure 1.2; Table 1.1)•Alaska experienced a growth rate of 1.2% as a result of natural increase in 2009. •In 2008-2009, Alaska added 11,454 young persons to its population by births, equivalent to about 1.7% of the population. •Alaska’s fertility was about 2.4 children per family.•The highest birth rates and rates of natural increase are currently found among Asians, Native Americans and Hispanics.•There were 3,378 deaths in Alaska in 2008-2009, equivalent to 0.5% of the population. Alaska’s death rate was 4.9 per 1,000 population.
Migration (Figures 1.2, 1.4; Tables 1.1-1.3)•Gross migration decreased to 13.3% for 2008-2009.•Roughly 47,200 people migrated into Alaska and 45,000 migrated out, for a net migration gain of 2,261 persons. •In 2006-2008, the most recent period for which Inter-nal Revenue Service data are available, 43.6% of gross migration was between Alaska and the West, of which 25.3% was with the Pacific states and 18.3% to or from the Mountain states.
Age Composition (Figures 1.5-1.8; Tables 1.1, 1.8-1.12, 1.29)In 2009:•8.4% of the population was made up of young children under the age of five;•14.0% of the population was made up of 5-13 year olds;•6.3% of the population was made up of 14-17 year olds;•9.9% of the population was made up of 18-24 year olds;•13.3% of the population was made up of 25-34 year olds;•13.6% of the population was made up of 35-44 year olds; •15.4% of the population was made up of 45-54 year olds;•11.4% of the population was made up of 55-64 year olds; and•12.9% of the population was made up of the older than 65 age group.
Median Age (Tables 1.8-1.12)•The median age for Alaska was 33.5 years in 2009. •By race, the median ages of Alaskans are: White Alone 36.4, Native American Alone 26.6, African-American Alone 29.3, Asian Alone 36.7, Hawaiian and Pacific Islanders Alone 23.8 and Two or More Races 16.3. •The median age of Hispanics was 26.0.
Dependency (Tables 1.8-1.12)•In 2009, every 100 Alaskans of working age sup-ported 45.4 children under 18 years of age (unchanged from 2008) and 11.9 persons over 65 (up from 11.4 in 2008), for a total dependency of 57.2.•The dependency burden for White Alaskans is far less than that for Alaska Natives. Every 100 Alaska Native persons of working age must support 69.3 additional persons compared to 51.8 for Whites.
Male/Female Composition (Figure 1.9; Tables 1.8-1.12)•In July of 2009, an estimated 339,093 persons, 49% of Alaska’s population, were female.•There were 104.2 males for every 100 females in Alaska. •By race, there were 105.8 White, 103.5 Native Ameri-can, 103.4 African-American, 87.7 Asian and 102.1 Pacific Islander males for every 100 females. •The highest ratio of males to females was in the age group 55-59 at 114.5 males per 100 females. The age group 60-64 was close behind with a ratio of 113.4 males per 100 females.
Living Arrangements (Figures 1.10, 1.11; Table 1.30)•In 2009, there were 21,498 persons living in group quarters in Alaska. •An estimated 252,526 households existed in Alaska in 2009. Of these, 169,926, or 67.3%, were family households and 82,600, or 32.7%, were non-family households. •Alaska had 86,363 households with children. Nearly 70% of children were in two parent families. A single-female householder was present in 17,298, or 20.0%, of the households with children, and a single-male householder was present in 9,251, or 10.7%, of the households with children. •Of an estimated 82,600 non-family households in Alaska, 62,485 (24.7% of all households) contained persons living alone, and an additional 20,115 (8.0% of all households) contained two or more unrelated individuals.
Chapter 1Alaska State Population

Alaska Population Digest • 2009 Estimates6
Figure 1.1Alaska Total Population, 1946-2009
Source: Alaska Department of Labor and Workforce Development, Research and Analysis Section, Demographics Unit
1946 1950 1955 1960 1965 1970 1975 1980 1985 1990 1995 2000 2005 2009
Year
100,000
200,000
300,000
400,000
500,000
600,000
700,000
800,000
Figure 1.2Components of Population Change for Alaska, 1947-2009
Source: Alaska Department of Labor and Workforce Development, Research and Analysis Section, Demographics Unit
1947 1950 1955 1960 1965 1970 1975 1980 1985 1990 1995 2000 2005 2009
Year
0
10,000
20,000
30,000
40,000
-10,000
-20,000
Natural Increase Net Migration
Korean War
Pipeline Construction Oil Boom
Oil BustPipelineCompleted
Base closures
Vietnam1989-91Recovery
End of WWII
Figure 1.3, Migration to/from Alaska by U.S. Region 1990-2000, was omitted. It can be found in the Alaska Population Overview 2009 Estimates.

Alaska Population Digest • 2009 Estimates 7
Figure 1.4Migration to and from Alaska by US Region, 2006-2008
Source: Alaska Department of Labor and Workforce Development, Research and Analysis Section, Demographics Unit
West South Central 12.1%
Pacific 25.3%
Mountain 18.3%
East South Central 4.5%South Atlantic 16.3%
Midwest 13.5%
Northeast 5.9%
Foreign 4.1%West 43.6%
South 32.9%
Source: Alaska Department of Labor and Workforce Development, Research and Analysis Section, Demographics Unit
Figure 1.5Alaska Population by Age, Race (Alone) and Sex, 2009
95+908580757065605550454035302520151050
01,0
002,0
003,0
004,0
005,0
006,0
007,0
00
Male Female
1,0002,000
3,0004,000
5,0006,000
7,000
WhiteNativeAsianBlackPacific2+ Races
Age
Figure 1.6Alaska Population by Age and Sex, 2000, 2009
Source: Alaska Department of Labor and Workforce Development, Research and Analysis Section, Demographics Unit
95+908580757065605550454035302520151050
Age
1,000
2,000
3,000
4,000
5,000
6,000
7,000 0 1,000
2,0003,000
4,0005,000
6,0007,000
Male Female
2000 Census2009 Estimate

Alaska Population Digest • 2009 Estimates8
Figure 1.7Alaska and U.S. Population by Age and Sex, 2009 (Percent Distribution)
Source: Alaska Department of Labor and Workforce Development, Research and Analysis Section, Demographics Unit
85+80757065605550454035302520151050
0.2%
0.4%
0.6%
0.8%
1.0% 0 0.2%
0.4%0.6%
0.8%1.0%
Male Female
Age
United StatesAlaska
Figure 1.8Alaska Population by Age Group, Selected Years, 1980-2009
Source: Alaska Department of Labor and Workforce Development, Research and Analysis Section, Demographics Unit
0-4 5-13 14-17 18-24 25-34 35-44 45-54 55-64 65+
Age Group
0
25,000
50,000
75,000
100,000
125,000
1980 1985 1990 1995 2000 2005 2009

Alaska Population Digest • 2009 Estimates 9
Figure 1.10Alaska Households by Type, 2009
Figure 1.11Family Household Type, Alaska, 2009
Source: Alaska Department of Labor and Workforce Development, Research and Analysis Section, Demographics Unit
Source: Alaska Department of Labor and Workforce Development, Research and Analysis Section, Demographics Unit
49.1%
6.3%
11.9%
8.0%
24.7%
Married Couple Families
Nonfamily Household 2 or more Persons
Householder Living AloneFemale
Householder Family
MaleHouseholder
Family
Family Households
Nonfamily Households
69.3%
10.7%
20.0%
2 Parent Families
One Parent- Mother
One Parent- Father
Figure 1.9Males Per 100 Females by Age, Alaska and the U.S., July 1, 2009
Sources: U.S. Census Bureau and Alaska Department of Labor and Workforce Development, Research and Analysis Section, Demographics Unit
!
!
!!!!!!!!!!!!!!!!
!!!!!!!
!!!!!!!!!!!
!!!!!!!!!!!!!!!!!!!!!
!!!!!!!!
!!!!!!
!!!!!!
!!!!!!
!!!
0 5 10 15 20 25 30 35 40 45 50 55 60 65 70 75 80 85+Age
0
20
40
60
80
100
120Males per 100 Females
U.S.Alaska!
Alaska Population Digest • 2009 Estimates10
Table 1.1Annual Components of Population Change for Alaska, 1945-2009
Components of Change
July 1to
June 30
End ofPeriod
Popula-tion
Popula-tion
Change
AverageAnnual Rate of Change Births
BirthRate Deaths
DeathRate
NaturalIncrease
TotalNet
Migrants
NetInternational
Migrants**
NetInternal
Migrants#
1945-46 103,000 2,050 1,220 830 1946-47 117,000 14,000 12.73 2,490 24.2 1,200 11.7 1,290 12,710 — —1947-48 126,000 9,000 7.41 2,890 24.7 1,180 10.1 1,710 7,290 — —1948-49 132,600 6,600 5.10 3,300 26.2 1,190 9.4 2,110 4,490 — —1949-50 137,100 4,500 3.34 3,620 27.3 1,220 9.2 2,400 2,100 — —1950-51 160,000 22,900 15.42 4,110 30.0 1,310 9.6 2,800 20,100 — —1951-52 185,500 25,500 14.76 5,130 32.1 1,310 8.2 3,820 21,680 — —1952-53 193,800 8,300 4.38 6,270 33.8 1,280 6.9 4,990 3,310 — —1953-54 200,100 6,300 3.20 6,910 35.7 1,240 6.4 5,670 630 — —1954-55 206,500 6,400 3.15 7,190 35.9 1,200 6.0 5,990 410 — —1955-56 212,400 5,900 2.82 7,480 36.2 1,220 5.9 6,260 -360 — —1956-57 218,600 6,200 2.88 7,730 36.4 1,240 5.8 6,490 -290 — —1957-58 220,100 1,500 0.68 7,450 34.1 1,200 5.5 6,250 -4,750 — —1958-59 224,000 3,900 1.76 6,830 31.0 1,170 5.3 5,660 -1,760 — —1959-60 230,400 6,400 2.82 7,290 32.5 1,250 5.6 6,040 360 — —1960-61 236,700 6,300 2.70 7,560 32.8 1,300 5.6 6,260 40 — —1961-62 242,800 6,100 2.54 7,610 32.2 1,290 5.4 6,320 -220 — —1962-63 249,900 7,100 2.88 7,670 31.6 1,320 5.4 6,350 750 — —1963-64 253,200 3,300 1.31 7,480 29.9 1,380 5.5 6,100 -2,800 — —1964-65 265,200 12,000 4.63 7,170 28.3 1,390 5.5 5,780 6,220 — —1965-66 271,500 6,300 2.35 6,810 25.7 1,320 5.0 5,490 810 — —1966-67 277,900 6,400 2.33 6,410 23.6 1,300 4.8 5,110 1,290 — —1967-68 284,900 7,000 2.49 6,350 22.8 1,317 4.7 5,033 1,967 — —1968-69 294,600 9,700 3.35 6,670 23.4 1,330 4.7 5,340 4,360 — —1969-70 308,500 13,900 4.61 7,230 24.5 1,370 4.7 5,860 8,040 — —1970-71 319,600 11,100 3.53 7,437 24.1 1,444 4.7 5,993 5,107 — —1971-72 329,800 10,200 3.14 7,129 22.3 1,462 4.6 5,667 4,533 — —1972-73 336,400 6,600 1.98 6,781 20.6 1,468 4.5 5,313 1,287 — —1973-74 348,100 11,700 3.42 6,847 20.4 1,467 4.4 5,380 6,320 — —1974-75 384,100 36,000 9.83 7,275 20.9 1,497 4.3 5,778 30,222 — —1975-76 409,800 25,700 6.47 7,694 20.0 1,570 4.1 6,124 19,576 — —1976-77 418,000 8,200 1.98 8,175 19.9 1,612 3.9 6,563 1,637 — —1977-78 411,600 -6,400 -1.54 8,668 20.7 1,654 4.0 7,014 -13,414 — —1978-79 413,700 2,100 0.51 9,043 22.0 1,654 4.0 7,389 -5,289 — —1979-80 419,800 6,100 1.46 9,400 22.7 1,671 4.0 7,729 -1,629 — —1980-81 434,300 14,500 3.40 9,912 23.6 1,738 4.1 8,174 6,326 — —1981-82 464,300 30,000 6.68 10,783 24.8 1,775 4.1 9,008 20,992 — —1982-83 499,100 34,800 7.22 11,728 25.3 1,862 4.0 9,866 24,934 — —1983-84 524,000 24,900 4.87 12,319 24.7 1,945 3.9 10,374 14,526 — —1984-85 543,900 19,900 3.73 12,727 24.3 2,033 3.9 10,694 9,206 — —1985-86 550,700 6,800 1.24 12,556 23.1 2,110 3.9 10,446 -3,646 — —1986-87 541,300 -9,400 -1.72 11,941 21.7 2,096 3.8 9,845 -19,245 — —1987-88 535,000 -6,300 -1.17 11,483 21.2 2,073 3.8 9,410 -15,710 — —1988-89 538,900 3,900 0.73 11,468 21.4 2,088 3.9 9,380 -5,480 — —1989-90 553,171 14,271 2.61 11,776 21.9 2,142 4.0 9,634 4,637 — —1990-91 569,054 15,883 2.83 11,798 21.3 2,225 4.0 9,573 6,310 — —1991-92 586,722 17,668 3.06 11,744 20.6 2,214 3.9 9,530 8,138 — —1992-93 596,906 10,184 1.72 11,347 19.3 2,477 4.2 8,870 1,314 — —1993-94 600,622 3,716 0.62 10,978 18.4 2,422 4.1 8,556 -4,840 — —1994-95 601,581 959 0.16 10,439 17.4 2,500 4.2 7,939 -6,980 — —1995-96 605,212 3,631 0.60 10,079 16.8 2,707 4.5 7,372 -3,741 — —1996-97 609,655 4,443 0.73 10,018 16.6 2,574 4.3 7,444 -3,001 — —1997-98 617,082 7,427 1.21 9,924 16.3 2,642 4.3 7,282 145 — —1998-99 622,000 4,918 0.79 9,864 16.0 2,609 4.2 7,255 -2,337 — —1999-00 627,533 5,533 0.89 10,102 16.2 2,829 4.5 7,273 -1,740 — —2000-01 632,200 4,667 0.74 9,980 15.9 2,934 4.7 7,046 -2,379 1,103 -3,4822001-02 640,643 8,443 1.33 9,871 15.6 3,075 4.9 6,796 1,647 174 1,4732002-03 647,884 7,241 1.12 10,025 15.6 3,107 4.8 6,918 323 -1,772 2,0952003-04 657,483 9,599 1.47 10,299 15.9 3,060 4.7 7,239 2,360 2,334 262004-05 664,334 6,851 1.04 10,368 15.8 3,167 4.8 7,201 -350 1,042 -1,3922005-06 671,202 6,868 1.03 10,656 16.0 3,163 4.8 7,493 -625 1,797 -2,4222006-07 676,056 4,854 0.72 11,057 16.5 3,457 5.2 7,600 -2,746 874 -3,6202007-08 681,977 5,921 0.87 11,285 16.7 3,505 5.2 7,780 -1,859 1,197 -3,0562008-09* 692,314 10,337 1.50 11,454 16.8 3,378 5.0 8,076 2,261 1,022 1,239
Notes: * Provisional; ** U.S. Census Bureau; # Migration between Alaska and the rest of the U.S.Source: Alaska Department of Labor and Workforce Development, Research and Analysis Section, Demographics Unit

Alaska Population Digest • 2009 Estimates 11
Table 1.2Migration to and from Alaska, 1980-2009
Migration Rate (% of Population)
July 1to June 30
NetMigrants
InMigrants
OutMigrants
GrossMigrants
NetMigrants
InMigrants
OutMigrants
GrossMigrants
1980-81 6,326 47,210 40,884 88,094 1.5 11.0 9.6 20.61981-82 20,992 60,035 39,043 99,078 4.8 13.8 9.0 22.81982-83 24,934 64,682 39,748 104,430 5.4 13.9 8.6 22.51983-84 14,526 57,992 43,466 101,458 2.9 11.6 8.7 20.31984-85 9,206 54,986 45,780 100,766 1.8 10.5 8.7 19.21985-86 -3,646 53,451 57,097 110,548 -0.7 9.8 10.5 20.31986-87 -19,245 38,085 57,330 95,415 -3.5 6.9 10.4 17.31987-88 -15,710 34,393 50,103 84,496 -2.9 6.4 9.3 15.61988-89 -5,480 41,185 46,665 87,850 -1.0 7.7 8.7 16.41989-90 4,637 42,777 38,140 80,917 0.9 7.9 7.1 15.01990-91 6,310 44,890 38,580 83,470 1.1 8.1 7.0 15.11991-92 8,138 51,432 43,294 94,726 1.4 9.0 7.6 16.61992-93 1,314 47,171 45,857 93,028 0.2 8.0 7.8 15.91993-94 -4,840 42,329 47,169 89,498 -0.8 7.1 7.9 15.01994-95 -6,980 38,999 45,979 84,978 -1.2 6.5 7.7 14.11995-96 -3,741 40,282 44,023 84,305 -0.6 6.7 7.3 14.01996-97 -3,001 41,476 44,477 85,953 -0.5 6.9 7.3 14.21997-98 145 40,974 40,829 81,803 0.0 6.7 6.7 13.41998-99 -2,337 39,885 42,222 82,107 -0.4 6.5 6.8 13.31999-00 -1,740 38,336 40,076 78,412 -0.3 6.2 6.4 12.62000-01 -2,379 35,843 38,222 74,065 -0.4 5.7 6.1 11.82001-02 1,647 38,488 36,841 75,329 0.3 6.1 5.8 11.92002-03 323 41,111 40,788 81,899 0.1 6.4 6.4 12.82003-04 2,360 41,479 39,119 80,598 0.4 6.4 6.0 12.42004-05 -350 41,302 41,652 82,954 -0.1 6.3 6.3 12.62005-06 -625 41,022 41,647 82,669 -0.1 6.2 6.3 12.42006-07 -2,746 42,940 45,686 88,626 -0.4 6.4 6.8 13.22007-08 -1,859 46,570 48,429 94,999 -0.3 6.9 7.2 14.1
2008-09* 2,261 47,246 44,985 92,231 0.3 6.9 6.6 13.5
* Provisional
Source: Alaska Department Of Labor & Workforce Development, Research & Analysis Section, Demographics Unit.

Alaska Population Digest • 2009 Estimates12
Tabl
e 1.
3M
igra
tion
Rat
es to
and
from
Ala
ska
by R
egio
n an
d Se
lect
ed S
tate
s, 1
980-
2008
Aver
age
Ann
ual I
n-M
igra
tion
(per
cent
)Av
erag
e A
nnua
l Out
-Mig
ratio
n (p
erce
nt)
Aver
age
Ann
ual G
ross
Mig
ratio
n (p
erce
nt)
2006
-200
820
01-2
005
1996
-200
019
91-1
995
1991
-200
019
81-1
990
2006
-200
820
01-2
005
1996
-200
019
91-1
995
1991
-200
019
81-1
990
2006
-200
820
01-2
005
1996
-200
019
91-1
995
1991
-200
019
81-1
990
Nor
thea
st6.
3%6.
0%6.
3%6.
6%6.
5%6.
5%5.
4%5.
6%5.
6%5.
4%5.
5%6.
7%5.
8%5.
8%5.
9%6.
0%6.
0%6.
6%
New
Eng
land
2.3%
2.0%
2.2%
2.6%
2.5%
2.5%
2.0%
2.0%
2.1%
1.9%
2.0%
2.8%
2.2%
2.0%
2.2%
2.2%
2.2%
2.6%
M
iddl
e A
tlant
ic4.
0%3.
9%4.
0%4.
0%4.
0%4.
0%3.
4%3.
5%3.
5%3.
5%3.
5%3.
9%3.
7%3.
7%3.
8%3.
8%3.
8%4.
0%
New
Yor
k1.
9%2.
0%2.
0%2.
0%2.
0%1.
9%1.
6%1.
8%1.
8%1.
8%1.
8%1.
8%1.
7%1.
9%1.
9%1.
9%1.
9%1.
9%
Mid
wes
t14
.7%
13.7
%12
.6%
13.2
%12
.9%
15.1
%12
.4%
12.2
%13
.2%
13.4
%13
.3%
12.7
%13
.5%
12.9
%12
.9%
13.3
%13
.1%
13.9
%
Eas
t Nor
th C
entra
l7.
7%6.
7%6.
1%6.
5%6.
3%7.
7%5.
7%5.
8%6.
3%6.
5%6.
4%6.
5%6.
7%6.
2%6.
2%6.
5%6.
4%7.
1%
Mic
higa
n2.
1%1.
8%1.
6%1.
9%1.
7%2.
2%1.
3%1.
4%1.
7%1.
6%1.
7%1.
7%1.
7%1.
6%1.
6%1.
8%1.
7%2.
0%
Wes
t Nor
th C
entra
l7.
0%7.
0%6.
5%6.
7%6.
6%7.
4%6.
7%6.
4%6.
9%6.
9%6.
9%6.
2%6.
9%6.
7%6.
7%6.
8%6.
8%6.
8%
Min
neso
ta1.
7%1.
8%1.
5%1.
6%1.
5%2.
2%1.
4%1.
4%1.
6%1.
5%1.
6%1.
4%1.
6%1.
6%1.
5%1.
6%1.
5%1.
9%
Sout
h33
.1%
31.7
%31
.4%
30.4
%30
.8%
27.8
%32
.7%
31.9
%31
.1%
31.2
%31
.2%
27.6
%32
.9%
31.8
%31
.2%
30.8
%31
.0%
27.4
%
Sou
th A
tlant
ic16
.4%
15.3
%15
.4%
14.8
%15
.1%
12.4
%16
.2%
16.2
%15
.4%
14.7
%15
.0%
13.2
%16
.3%
15.8
%15
.4%
14.8
%15
.0%
12.7
%
Flor
ida
4.4%
4.1%
3.9%
4.1%
4.0%
3.3%
4.6%
4.7%
4.0%
3.6%
3.8%
3.8%
4.5%
4.4%
4.0%
3.9%
3.9%
3.5%
G
eorg
ia2.
8%3.
0%3.
0%2.
8%2.
9%2.
2%2.
9%2.
9%2.
8%2.
8%2.
8%2.
1%2.
9%3.
0%2.
9%2.
8%2.
8%2.
2%
Nor
th C
arol
ina
3.3%
3.1%
3.4%
2.9%
3.1%
2.1%
2.9%
2.9%
3.1%
2.6%
2.8%
1.8%
3.1%
3.0%
3.2%
2.7%
3.0%
2.0%
Vi
rgin
ia2.
7%2.
2%2.
4%2.
4%2.
4%2.
1%2.
8%2.
7%2.
7%2.
8%2.
7%2.
3%2.
7%2.
5%2.
6%2.
6%2.
6%2.
3%
Eas
t Sou
th C
entra
l4.
7%4.
7%4.
8%4.
4%4.
6%4.
3%4.
3%4.
3%4.
7%5.
1%4.
9%4.
2%4.
5%4.
5%4.
8%4.
7%4.
7%4.
2%
Wes
t Sou
th C
entra
l12
.0%
11.7
%11
.1%
11.2
%11
.2%
11.1
%12
.2%
11.4
%11
.1%
11.4
%11
.2%
10.2
%12
.1%
11.6
%11
.1%
11.3
%11
.2%
10.5
%
Okl
ahom
a2.
1%1.
9%1.
9%1.
9%1.
9%1.
8%2.
0%1.
7%2.
0%1.
8%1.
9%1.
6%1.
2%1.
8%1.
9%1.
9%1.
9%1.
7%
Texa
s7.
9%7.
5%6.
9%6.
8%6.
9%6.
7%7.
9%7.
4%6.
9%7.
2%7.
0%6.
3%7.
9%7.
5%6.
9%7.
0%6.
9%6.
4%
Wes
t41
.0%
43.7
%44
.9%
45.3
%45
.1%
47.9
%46
.1%
47.0
%47
.0%
46.9
%47
.0%
50.6
%43
.6%
45.4
%46
.0%
46.1
%46
.1%
49.6
%
Mou
ntai
n16
.7%
18.0
%17
.0%
15.2
%16
.0%
15.7
%19
.7%
19.5
%17
.9%
16.7
%17
.2%
14.7
%18
.3%
18.8
%17
.5%
15.9
%16
.7%
15.3
%
Ariz
ona
3.2%
3.4%
3.0%
3.1%
3.1%
2.8%
4.3%
4.4%
3.9%
3.4%
3.7%
3.2%
3.8%
3.9%
3.5%
3.3%
3.4%
3.0%
C
olor
ado
3.1%
3.7%
3.5%
3.2%
3.4%
3.5%
3.4%
3.5%
3.6%
3.6%
3.6%
3.2%
3.2%
3.6%
3.5%
3.4%
3.5%
3.3%
Id
aho
2.3%
2.5%
2.3%
1.9%
2.0%
2.6%
3.0%
2.7%
2.5%
2.4%
2.4%
2.0%
2.6%
2.6%
2.4%
2.1%
2.3%
2.4%
M
onta
na2.
1%2.
2%2.
3%2.
0%2.
1%2.
4%2.
0%2.
0%1.
8%1.
9%1.
8%1.
6%2.
1%2.
1%2.
0%1.
9%2.
0%2.
0%
Nev
ada
1.9%
1.8%
1.6%
1.3%
1.4%
1.1%
2.5%
2.7%
2.2%
1.6%
1.9%
1.3%
2.2%
2.2%
1.9%
1.5%
1.7%
1.2%
N
ew M
exic
o1.
4%1.
5%1.
9%1.
5%1.
6%0.
9%1.
7%1.
8%1.
7%1.
5%1.
6%1.
3%1.
6%1.
7%1.
8%1.
5%1.
6%1.
3%
Pac
ific
24.3
%25
.7%
27.9
%30
.1%
29.1
%32
.2%
26.3
%27
.5%
29.1
%30
.2%
29.7
%35
.9%
25.3
%26
.6%
28.6
%30
.2%
29.4
%34
.4%
C
alifo
rnia
8.6%
9.1%
10.1
%12
.1%
11.2
%10
.8%
7.6%
8.3%
8.4%
9.0%
8.7%
12.7
%8.
1%8.
7%9.
2%10
.5%
9.9%
11.8
%
Ore
gon
4.3%
4.8%
5.0%
5.6%
5.3%
6.9%
5.3%
5.4%
6.1%
6.0%
6.1%
6.4%
4.8%
5.1%
5.6%
5.8%
5.7%
6.8%
W
ashi
ngto
n9.
0%10
.1%
11.2
%11
.1%
11.2
%13
.2%
11.5
%11
.9%
13.4
%13
.7%
13.5
%15
.2%
10.3
%11
.1%
12.3
%12
.4%
12.4
%14
.4%
Fore
ign
4.9%
4.9%
4.9%
4.5%
4.7%
2.7%
3.4%
3.3%
3.0%
3.1%
3.0%
2.4%
4.1%
4.1%
3.9%
3.8%
3.8%
2.5%
Aver
age
Ann
ual
100.
0%10
0.0%
100.
0%10
0.0%
100.
0%10
0.0%
100.
0%10
0.0%
100.
0%10
0.0%
100.
0%10
0.0%
100.
0%10
0.0%
100.
0%10
0.0%
100.
0%10
0.0%
Estim
ated
Mig
ratio
n43
,260
39,6
4840
,184
44,9
6446
,158
50,2
8145
,346
39,5
7842
,325
44,1
7643
,251
46,6
0888
,606
79,2
2682
,509
89,1
4085
,825
96,8
89
Sou
rce:
IRS
Sta
te to
Sta
te M
igra
tion
Flow
s an
d A
lask
a D
epar
tmen
t of L
abor
and
Wor
kfor
ce D
evel
opm
ent,
Dem
ogra
phic
s U
nit.

Alaska Population Digest • 2009 Estimates 13
Table 1.4Native American and Total Population of Alaska, Selected Years, 1910-2009
Year
American Indian or
Alaska Native Alone Percent
Native American
Population Percent
American Indian or
Alaska Native Alone or in
Combination PercentTotal
PopulationTotal
Responses
1910 - - 25,331 39.4 - - 64,356 -1920 - - 26,558 48.3 - - 55,036 -1929 - - 29,983 50.6 - - 59,278 -1939 - - 32,458 44.8 - - 72,524 -1950 - - 33,863 26.3 - - 128,643 -1960 - - 42,522 18.8 - - 226,167 -1970 - - 50,605 16.7 - - 302,583 -1980 - - 64,103 16.0 - - 401,851 -1990 - - 86,252 15.7 - - 550,043 -1991 - - 89,286 15.7 - - 569,054 -1992 - - 91,933 15.7 - - 586,722 -1993 - - 94,176 15.8 - - 596,906 -1994 - - 96,182 16.0 - - 600,622 -1995 - - 98,058 16.3 - - 601,581 -1996 - - 99,678 16.5 - - 605,212 -1997 - - 101,751 16.7 - - 609,655 -1998 - - 103,361 16.7 - - 617,082 -1999 - - 104,745 16.8 - - 622,000 -2000 98,836 15.7 109,831 * 17.5 120,825 18.3 627,533 661,8622001 99,483 15.7 110,694 * 17.5 121,814 18.1 632,200 673,5222002 100,932 15.8 112,421 * 17.5 123,805 18.2 640,643 680,1842003 102,275 15.8 113,563 * 17.5 124,753 18.2 647,884 686,5452004 103,125 15.7 114,670 * 17.4 126,132 18.1 657,483 698,7102005 105,419 15.9 117,403 * 17.7 129,289 18.3 664,334 708,0482006 106,873 15.9 119,219 * 17.8 131,464 18.3 671,202 717,6042007 108,878 16.1 121,648 * 18.0 134,323 18.5 676,056 725,1442008 110,202 16.2 123,134 * 18.1 135,964 18.6 681,977 731,6012009 111,873 16.2 125,200 * 18.1 138,429 18.6 692,314 745,343
* Bridge Estimate Note: Estimates for 1990 and later have a reference date of July 1.Sources: U.S. Census Bureau and Alaska Department of Labor and Workforce Development, Research and Analysis Section, Demographics Unit
Table 1.5, Population by Race and Ethnicity, Alaska and the U.S., 1990, 2000;Table 1.6, Population for American Indian, Alaska Native and Tribal Group, Alaska
and U.S., 1990, 2000; and Table 1.7, Population for Asian and Pacific Islander, Alaska and U.S., 1990, 2000, were omitted. They can be found in the
Alaska Population Overview 2009 Estimates.

Alaska Population Digest • 2009 Estimates14
Table 1.8Alaska Total Population by Age and Sex, July 1, 2009Universe: MARS with Imputation Adjustment
Sources: U.S. Census Bureau and Alaska Department of Labor and Workforce Development, Research and Analysis Section, Demographics Unit
Age Total Male Female Age Total Male Female Age Total Male Female
Under 1 11,653 6,102 5,551 35 9,087 4,504 4,583 70 2,911 1,455 1,456 1 11,818 6,195 5,623 36 9,276 4,721 4,555 71 2,772 1,416 1,356 2 11,752 6,011 5,741 37 9,243 4,769 4,474 72 2,451 1,226 1,225 3 11,446 6,010 5,436 38 9,708 4,888 4,820 73 2,215 1,088 1,127 4 11,232 5,828 5,404 39 9,946 5,119 4,827 74 2,176 1,065 1,111
0-4 57,901 30,146 27,755 35-39 47,260 24,001 23,259 70-74 12,525 6,250 6,275
5 11,299 5,895 5,404 40 9,545 4,853 4,692 75 1,925 935 990 6 11,189 5,876 5,313 41 9,024 4,518 4,506 76 1,801 824 977 7 11,116 5,756 5,360 42 9,055 4,555 4,500 77 1,577 735 842 8 11,181 5,827 5,354 43 9,358 4,780 4,578 78 1,550 694 856 9 10,888 5,660 5,228 44 10,071 5,088 4,983 79 1,571 736 835
5-9 55,673 29,014 26,659 40-44 47,053 23,794 23,259 75-79 8,424 3,924 4,500
10 10,673 5,496 5,177 45 10,435 5,440 4,995 80 1,439 644 795 11 10,596 5,388 5,208 46 10,648 5,394 5,254 81 1,212 568 644 12 10,325 5,278 5,047 47 10,725 5,364 5,361 82 1,132 476 656 13 10,757 5,433 5,324 48 10,905 5,545 5,360 83 998 401 597 14 10,640 5,391 5,249 49 11,077 5,785 5,292 84 964 375 589
10-14 52,991 26,986 26,005 45-49 53,790 27,528 26,262 80-84 5,745 2,464 3,281
15 10,946 5,543 5,403 50 10,391 5,304 5,087 85 832 342 490 16 11,083 5,676 5,407 51 10,924 5,591 5,333 86 751 321 430 17 11,179 5,803 5,376 52 10,840 5,492 5,348 87 653 283 370 18 11,067 5,705 5,362 53 10,465 5,366 5,099 88 535 221 314 19 10,666 5,397 5,269 54 10,513 5,333 5,180 89 509 191 318
15-19 54,941 28,124 26,817 50-54 53,133 27,086 26,047 85-89 3,280 1,358 1,922
20 9,715 4,876 4,839 55 10,057 5,158 4,899 90 362 151 211 21 9,402 4,686 4,716 56 9,764 5,045 4,719 91 302 131 171 22 9,010 4,504 4,506 57 9,194 4,683 4,511 92 223 72 151 23 9,070 4,535 4,535 58 8,442 4,390 4,052 93 193 57 136 24 9,291 4,559 4,732 59 8,348 4,457 3,891 94 172 59 113
20-24 46,488 23,160 23,328 55-59 45,805 23,733 22,072 90-94 1,252 470 782
25 8,920 4,380 4,540 60 7,802 4,077 3,725 95+ 477 166 311 26 9,606 4,798 4,808 61 7,158 3,804 3,354 27 8,978 4,563 4,415 62 7,349 3,866 3,483 Total 692,314 353,224 339,09028 8,638 4,431 4,207 63 5,466 2,850 2,616 29 9,182 4,765 4,417 64 5,062 2,601 2,461 16+ 514,803 261,535 253,268
18+ 492,541 250,056 242,48525-29 45,324 22,937 22,387 60-64 32,837 17,198 15,639 65+ 52,260 25,274 26,986
30 9,214 4,795 4,419 65 4,799 2,472 2,327 Median 33.5 33.4 33.7 31 9,458 4,896 4,562 66 4,708 2,468 2,240 32 9,478 4,873 4,605 67 4,087 2,093 1,994 Males Per 100 Females 104 33 9,144 4,704 4,440 68 3,642 1,873 1,769 Youth Dependency (<18/18-64 45 34 9,564 4,975 4,589 69 3,321 1,736 1,585 Aged Dependency (65+/18-64 12
30-34 46,858 24,243 22,615 65-69 20,557 10,642 9,915

Alaska Population Digest • 2009 Estimates 15
Table 1.9Alaska Population by Age, Race Alone and Sex, July 1, 2009Universe: MARS with Imputation Adjustment
Total Population White Alone Native American Alone
Age Total Male Female Total Male Female Total Male Female
0-4 57,899 30,146 27,753 34,150 17,879 16,271 12,108 6,230 5,878 5-9 55,674 29,014 26,660 36,060 18,979 17,081 10,315 5,405 4,910 10-14 52,991 26,986 26,005 34,942 17,843 17,099 9,642 5,138 4,504 15-19 54,941 28,124 26,817 35,923 18,410 17,513 10,820 5,655 5,165 20-24 46,487 23,158 23,329 28,259 13,540 14,719 10,079 5,277 4,802 25-29 45,324 22,937 22,387 29,611 14,682 14,929 8,292 4,315 3,977 30-34 46,859 24,244 22,615 34,876 18,267 16,609 6,406 3,146 3,260 35-39 47,260 24,001 23,259 35,808 18,245 17,563 6,588 3,336 3,252 40-44 47,053 23,794 23,259 34,916 17,569 17,347 7,252 3,751 3,501 45-49 53,789 27,527 26,262 40,784 21,171 19,613 7,460 3,702 3,758 50-54 53,133 27,086 26,047 41,257 21,474 19,783 6,528 3,257 3,271 55-59 45,804 23,732 22,072 35,920 19,036 16,884 5,244 2,575 2,669 60-64 32,837 17,198 15,639 25,740 13,976 11,764 3,738 1,741 1,997 65-69 20,556 10,641 9,915 16,066 8,567 7,499 2,623 1,277 1,346 70-74 12,525 6,250 6,275 9,337 4,769 4,568 1,871 885 986 75-79 8,423 3,923 4,500 6,070 2,931 3,139 1,416 604 812 80-84 5,746 2,465 3,281 4,234 1,894 2,340 827 342 485 85-89 3,280 1,358 1,922 2,461 1,047 1,414 405 175 230 90-94 1,251 470 781 924 350 574 144 61 83 95+ 482 167 315 292 112 180 115 37 78
Total 692,314 353,221 339,093 487,630 250,741 236,889 111,873 56,909 54,964
Selected ages:Under 1 11,653 6,102 5,551 6,453 3,368 3,085 2,580 1,355 1,225 1-2 23,570 12,206 11,364 13,838 7,171 6,667 4,877 2,515 2,362 5 11,300 5,895 5,405 7,149 3,769 3,380 2,204 1,154 1,050 6 11,189 5,876 5,313 7,152 3,801 3,351 2,131 1,102 1,029 10-11 21,269 10,884 10,385 13,974 7,195 6,779 3,921 2,095 1,826 12-13 21,082 10,711 10,371 13,901 7,069 6,832 3,816 2,042 1,774 15 10,946 5,543 5,403 7,305 3,738 3,567 1,976 1,009 967 16 11,083 5,676 5,407 7,328 3,771 3,557 2,102 1,103 999 17 11,179 5,803 5,376 7,321 3,824 3,497 2,231 1,162 1,069 18 11,067 5,705 5,362 7,226 3,737 3,489 2,252 1,178 1,074 19 10,666 5,397 5,269 6,743 3,340 3,403 2,259 1,203 1,056 20 9,715 4,876 4,839 5,846 2,862 2,984 2,197 1,117 1,080 21 9,402 4,685 4,717 5,695 2,769 2,926 2,087 1,073 1,014 22 9,009 4,503 4,506 5,401 2,573 2,828 1,975 1,032 943 60-61 14,960 7,881 7,079 11,739 6,385 5,354 1,698 818 880
16+ 514,804 261,532 253,272 375,173 192,302 182,871 77,832 39,127 38,705 18+ 492,542 250,053 242,489 360,524 184,707 175,817 73,499 36,862 36,637 65+ 52,263 25,274 26,989 39,384 19,670 19,714 7,401 3,381 4,020
Median Age: 33.5 33.4 33.7 36.4 36.6 36.2 26.6 25.8 27.6 Males /100 Females: 104.2 105.8 103.5 Youth Dependency: 45.4 39.6 58.1 (<18/18-64)Aged Dependency: 11.9 12.3 11.2 (65+/18-64)
Sources: U.S. Census Bureau and Alaska Department of Labor and Workforce Development, Research and Analysis Section, Demographics Unit

Alaska Population Digest • 2009 Estimates16
Table 1.9 (continued)Alaska Population by Age, Race Alone and Sex, July 1, 2009Universe: MARS with Imputation Adjustment
African American Alone Asian AloneHawaiian & Pacific
Islander Alone Two or More Races
Age Total Male Female Total Male Female Total Male Female Total Male Female
0-4 1,862 906 956 2,380 1,262 1,118 537 282 255 6,862 3,587 3,275 5-9 1,906 891 1,015 2,114 997 1,117 370 182 188 4,909 2,560 2,349 10-14 2,069 832 1,237 2,159 976 1,183 369 185 184 3,810 2,012 1,798 15-19 1,867 843 1,024 2,161 1,106 1,055 425 225 200 3,745 1,885 1,860 20-24 2,631 1,500 1,131 1,979 1,002 977 373 187 186 3,166 1,652 1,514 25-29 3,336 2,018 1,318 1,764 842 922 312 146 166 2,009 934 1,075 30-34 2,549 1,427 1,122 1,589 792 797 262 140 122 1,177 472 705 35-39 1,841 957 884 1,732 883 849 226 112 114 1,065 468 597 40-44 1,576 905 671 2,076 1,028 1,048 240 124 116 993 417 576 45-49 1,566 860 706 2,374 1,107 1,267 248 125 123 1,357 562 795 50-54 1,560 645 915 2,270 961 1,309 191 86 105 1,327 663 664 55-59 1,441 687 754 2,014 826 1,188 151 79 72 1,034 529 505 60-64 879 391 488 1,685 713 972 118 56 62 677 321 356 65-69 408 177 231 1,044 453 591 63 37 26 352 130 222 70-74 278 141 137 751 324 427 28 16 12 260 115 145 75-79 173 86 87 533 211 322 35 16 19 196 75 121 80-84 147 54 93 404 128 276 22 10 12 112 37 75 85-89 115 32 83 235 83 152 6 2 4 58 19 39 90-94 69 17 52 92 30 62 1 - 1 21 12 9 95+ 30 5 25 32 10 22 1 - 1 12 3 9
Total 26,303 13,374 12,929 29,388 13,734 15,654 3,978 2,010 1,968 33,142 16,453 16,689
Selected ages:Under 1 390 190 200 531 289 242 122 61 61 1,577 839 738 1-2 806 398 408 961 510 451 228 128 100 2,860 1,484 1,376 5 334 164 170 421 197 224 82 42 40 1,110 569 541 6 339 171 168 447 214 233 83 47 36 1,037 541 496 10-11 853 341 512 831 373 458 142 66 76 1,548 814 734 12-13 817 332 485 888 406 482 151 75 76 1,509 787 722 15 358 154 204 434 206 228 85 47 38 788 389 399 16 367 151 216 455 241 214 77 37 40 754 373 381 17 365 162 203 422 228 194 87 46 41 753 381 372 18 372 172 200 427 213 214 87 49 38 703 356 347 19 405 204 201 423 218 205 89 46 43 747 386 361 20 440 237 203 411 220 191 87 44 43 734 396 338 21 460 261 199 419 213 206 80 38 42 661 331 330 22 543 316 227 402 216 186 65 27 38 623 339 284 60-61 423 202 221 726 301 425 56 19 37 318 156 162
16+ 20,108 10,591 9,517 22,301 10,293 12,008 2,617 1,314 1,303 16,773 7,905 8,868 18+ 19,376 10,278 9,098 21,424 9,824 11,600 2,453 1,231 1,222 15,266 7,151 8,115 65+ 1,220 512 708 3,091 1,239 1,852 156 81 75 1,011 391 620
Median Age: 29.3 29.3 29.2 36.7 34.3 38.9 23.8 23.5 24.1 16.3 15.2 17.4 Males /100 Females: 103.4 87.7 102.1 98.6 Youth Dependency: 38.2 43.4 66.4 125.4 (<18/18-64)Aged Dependency: 6.7 16.9 6.8 7.1 (65+/18-64)
Sources: U.S. Census Bureau and Alaska Department of Labor and Workforce Development, Research and Analysis Section, Demographics Unit

Alaska Population Digest • 2009 Estimates 17
Table 1.10Alaska Population by Age, Race Alone or in Combination, Ethnicity and Sex, July 1, 2009 Universe: MARS with Imputation Adjustment
Total Responses White Alone or in CombinationNative American Alone
or in Combination
Age Total Male Female Total Male Female Total Male Female
0-4 67,316 35,062 32,254 41,053 21,544 19,509 16,573 8,537 8,036 5-9 64,229 33,486 30,743 42,336 22,340 19,996 13,801 7,242 6,559 10-14 59,984 30,350 29,634 39,923 20,408 19,515 12,471 6,634 5,837 15-19 60,580 30,970 29,610 40,147 20,546 19,601 13,645 7,121 6,524 20-24 50,989 25,392 25,597 31,130 14,901 16,229 12,770 6,692 6,078 25-29 49,002 24,790 24,212 31,984 15,792 16,192 10,141 5,281 4,860 30-34 49,851 25,861 23,990 36,869 19,267 17,602 7,601 3,741 3,860 35-39 49,616 25,214 24,402 37,393 18,991 18,402 7,746 3,927 3,819 40-44 49,228 24,876 24,352 36,318 18,192 18,126 8,408 4,310 4,098 45-49 55,720 28,495 27,225 42,181 21,812 20,369 8,744 4,300 4,444 50-54 54,642 27,824 26,818 42,427 22,058 20,369 7,675 3,829 3,846 55-59 46,960 24,304 22,656 36,818 19,489 17,329 6,140 3,038 3,102 60-64 33,676 17,664 16,012 26,348 14,300 12,048 4,372 2,067 2,305 65-69 21,135 10,964 10,171 16,439 8,748 7,691 3,014 1,468 1,546 70-74 12,789 6,387 6,402 9,560 4,877 4,683 2,089 990 1,099 75-79 8,659 4,035 4,624 6,249 3,009 3,240 1,595 680 915 80-84 5,897 2,537 3,360 4,342 1,939 2,403 930 382 548 85-89 3,334 1,384 1,950 2,505 1,064 1,441 444 191 253 90-94 1,266 473 793 940 355 585 155 65 90 95+ 470 164 306 292 112 180 115 37 78
Total 745,343 380,232 365,111 525,254 269,744 255,510 138,429 70,532 67,897
Selected ages:Under 1 13,566 7,096 6,470 7,829 4,096 3,733 3,555 1,869 1,686 1-2 27,427 14,227 13,200 16,675 8,662 8,013 6,687 3,452 3,235 5 13,075 6,833 6,242 8,477 4,480 3,997 2,984 1,564 1,420 6 12,962 6,817 6,145 8,442 4,497 3,945 2,875 1,488 1,387 10-11 24,156 12,251 11,905 16,066 8,269 7,797 5,034 2,675 2,359 12-13 23,804 12,133 11,671 15,816 8,093 7,723 4,954 2,668 2,286 15 12,065 6,069 5,996 8,208 4,183 4,025 2,503 1,265 1,238 16 12,267 6,258 6,009 8,206 4,208 3,998 2,640 1,381 1,259 17 12,171 6,310 5,861 8,094 4,220 3,874 2,763 1,429 1,334 18 12,290 6,332 5,958 8,091 4,186 3,905 2,865 1,492 1,373 19 11,787 6,001 5,786 7,548 3,749 3,799 2,874 1,554 1,320 20 10,618 5,272 5,346 6,480 3,152 3,328 2,774 1,399 1,375 21 10,345 5,214 5,131 6,302 3,084 3,218 2,651 1,384 1,267 22 9,897 4,943 4,954 5,941 2,828 3,113 2,492 1,296 1,196 60-61 15,354 8,109 7,245 12,007 6,532 5,475 2,007 988 1,019
16+ 541,749 275,265 266,484 393,734 201,269 192,465 93,081 46,854 46,227 18+ 517,311 262,697 254,614 377,434 192,841 184,593 87,678 44,044 43,634 65+ 53,550 25,944 27,606 40,327 20,104 20,223 8,342 3,813 4,529
Median Age: 32.1 31.9 32.2 34.9 35.0 34.8 25.0 24.2 25.8 Males /100 Females: 104.1 105.6 103.9 Youth Dependency: 49.2 43.8 64.0 (<18/18-64)Aged Dependency: 11.5 12.0 10.5 (65+/18-64)
Sources: U.S. Census Bureau and Alaska Department of Labor and Workforce Development, Research and Analysis Section, Demographics Unit

Alaska Population Digest • 2009 Estimates18
African American Alone or in Combination
Asian Alone or in Combination
Hawaiian & Pacific IslanderAlone or in Combination Hispanic Origin or Latino
Age Total Male Female Total Male Female Total Male Female Total Male Female
0-4 4,088 2,022 2,066 4,085 2,171 1,914 1,517 788 729 4,051 2,160 1,891 5-9 3,578 1,738 1,840 3,597 1,690 1,907 917 476 441 3,873 1,912 1,961 10-14 3,241 1,282 1,959 3,656 1,687 1,969 693 339 354 3,067 1,497 1,570 15-19 2,629 1,187 1,442 3,448 1,744 1,704 711 372 339 2,584 1,281 1,303 20-24 3,511 1,988 1,523 2,943 1,488 1,455 635 323 312 2,964 1,591 1,373 25-29 3,975 2,334 1,641 2,399 1,137 1,262 503 246 257 3,191 1,718 1,473 30-34 2,888 1,596 1,292 2,093 1,043 1,050 400 214 186 2,442 1,170 1,272 35-39 2,013 1,037 976 2,133 1,087 1,046 331 172 159 2,532 1,280 1,252 40-44 1,690 963 727 2,443 1,215 1,228 369 196 173 2,571 1,342 1,229 45-49 1,683 914 769 2,738 1,280 1,458 374 189 185 2,212 1,148 1,064 50-54 1,684 699 985 2,547 1,091 1,456 309 147 162 1,733 923 810 55-59 1,549 734 815 2,217 922 1,295 236 121 115 1,290 656 634 60-64 952 428 524 1,822 783 1,039 182 86 96 754 304 450 65-69 440 187 253 1,122 493 629 120 68 52 448 148 300 70-74 294 147 147 799 348 451 47 25 22 343 125 218 75-79 189 92 97 573 230 343 53 24 29 186 89 97 80-84 161 59 102 431 138 293 33 19 14 86 46 40 85-89 127 33 94 250 93 157 8 3 5 41 16 25 90-94 72 18 54 98 35 63 1 - 1 22 7 15 95+ 30 5 25 32 10 22 1 - 1 10 3 7
Total 34,794 17,463 17,331 39,426 18,685 20,741 7,440 3,808 3,632 34,400 17,416 16,984
Selected ages:Under 1 891 441 450 924 504 420 367 186 181 783 406 377 1-2 1,785 896 889 1,655 880 775 625 337 288 1,547 831 716 5 685 342 343 706 331 375 223 116 107 901 443 458 6 679 348 331 744 357 387 222 127 95 832 415 417 10-11 1,364 534 830 1,417 645 772 275 128 147 1,292 596 696 12-13 1,254 515 739 1,493 716 777 287 141 146 1,192 605 587 15 519 224 295 684 314 370 151 83 68 556 277 279 16 539 219 320 756 393 363 126 57 69 540 293 247 17 518 229 289 655 363 292 141 69 72 514 248 266 18 503 235 268 687 336 351 144 83 61 495 250 245 19 550 280 270 666 338 328 149 80 69 479 213 266 20 604 322 282 616 324 292 144 75 69 514 238 276 21 619 355 264 630 314 316 143 77 66 539 281 258 22 747 445 302 607 332 275 110 42 68 608 343 265 60-61 462 225 237 785 329 456 93 35 58 341 141 200
16+ 23,368 12,197 11,171 27,404 12,823 14,581 4,162 2,122 2,040 22,853 11,570 11,283 18+ 22,311 11,749 10,562 25,993 12,067 13,926 3,895 1,996 1,899 21,799 11,029 10,770 65+ 1,313 541 772 3,305 1,347 1,958 263 139 124 1,136 434 702
Median Age: 25.4 26.1 24.5 29.1 27.4 30.7 19.2 19.1 19.3 26.0 25.7 26.3Males /100 Females: 100.8 90.1 104.9 102.5Youth Dependency: 59.4 59.2 97.6 61.0(<18/18-64)Aged Dependency: 6.3 14.6 7.2 5.5(65+/18-64)
Note: Persons of Hispanic Origin may be of any race.Sources: U.S. Census Bureau and Alaska Department of Labor and Workforce Development, Research and Analysis Section, Demographics Unit
Table 1.10 (continued)Alaska Population by Age, Race Alone or in Combination, Ethnicity and Sex, July 1, 2009 Universe: MARS with Imputation Adjustment

Alaska Population Digest • 2009 Estimates 19
Table 1.11Alaska Population by Age, Race Alone and Sex, July 1, 2008Universe: MARS with Imputation Adjustment
Total Population White Alone Native American Alone
Age Total Male Female Total Male Female Total Male Female
0-4 56,379 29,215 27,164 33,494 17,452 16,042 11,781 6,049 5,732 5-9 54,361 28,282 26,079 35,195 18,461 16,734 10,083 5,292 4,791 10-14 52,835 26,813 26,022 34,650 17,642 17,008 9,724 5,125 4,599 15-19 55,158 28,309 26,849 35,713 18,347 17,366 11,135 5,789 5,346 20-24 45,668 22,768 22,900 27,950 13,396 14,554 9,816 5,182 4,634 25-29 44,143 22,642 21,501 29,131 14,767 14,364 7,850 4,061 3,789 30-34 45,969 23,600 22,369 34,404 17,889 16,515 6,280 3,077 3,203 35-39 47,597 24,305 23,292 36,014 18,447 17,567 6,604 3,355 3,249 40-44 48,206 24,542 23,664 35,575 18,094 17,481 7,494 3,863 3,631 45-49 54,107 27,553 26,554 41,157 21,315 19,842 7,328 3,585 3,743 50-54 53,370 27,271 26,099 41,711 21,694 20,017 6,377 3,210 3,167 55-59 44,137 23,026 21,111 34,620 18,513 16,107 5,073 2,470 2,603 60-64 30,452 15,973 14,479 23,862 12,951 10,911 3,537 1,656 1,881 65-69 19,099 9,904 9,195 14,943 7,983 6,960 2,449 1,197 1,252 70-74 11,966 5,968 5,998 8,798 4,522 4,276 1,892 874 1,018 75-79 8,359 3,871 4,488 6,056 2,894 3,162 1,365 592 773 80-84 5,488 2,330 3,158 4,111 1,812 2,299 754 313 441 85-89 3,057 1,263 1,794 2,271 973 1,298 399 159 240 90-94 1,210 443 767 904 339 565 157 58 99 95+ 416 123 293 255 74 181 104 35 69
Total 681,977 348,201 333,776 480,814 247,565 233,249 110,202 55,942 54,260
Selected ages:Under 1 11,449 5,954 5,495 6,470 3,322 3,148 2,434 1,262 1,172 1-2 22,747 11,755 10,992 13,408 7,010 6,398 4,806 2,447 2,359 5 11,030 5,811 5,219 6,974 3,721 3,253 2,142 1,105 1,037 6 10,972 5,653 5,319 7,123 3,734 3,389 2,048 1,023 1,025 10-11 20,652 10,564 10,088 13,372 6,869 6,503 3,906 2,090 1,816 12-13 21,244 10,725 10,519 14,023 7,069 6,954 3,829 2,023 1,806 15 11,081 5,658 5,423 7,271 3,739 3,532 2,120 1,106 1,014 16 11,343 5,865 5,478 7,428 3,873 3,555 2,251 1,166 1,085 17 11,471 5,933 5,538 7,581 3,952 3,629 2,273 1,186 1,087 18 11,229 5,748 5,481 7,275 3,686 3,589 2,276 1,208 1,068 19 10,034 5,105 4,929 6,158 3,097 3,061 2,215 1,123 1,092 20 9,592 4,803 4,789 5,898 2,903 2,995 2,104 1,077 1,027 21 9,205 4,596 4,609 5,614 2,682 2,932 1,996 1,040 956 22 9,098 4,606 4,492 5,538 2,693 2,845 1,970 1,065 905 60-61 14,755 7,834 6,921 11,772 6,459 5,313 1,558 730 828
16+ 507,321 258,233 249,088 370,204 190,271 179,933 76,494 38,370 38,124 18+ 484,507 246,435 238,072 355,195 182,446 172,749 71,970 36,018 35,952 65+ 49,595 23,902 25,693 37,338 18,597 18,741 7,120 3,228 3,892
Median Age: 33.5 33.4 33.7 36.4 36.6 36.2 26.4 25.5 27.5 Males /100 Females: 104.3 106.1 103.1 Youth Dependency: 45.4 39.5 59.0 (<18/18-64)Aged Dependency: 11.4 11.7 11.0 (65+/18-64)
Sources: U.S. Census Bureau and Alaska Department of Labor and Workforce Development, Research and Analysis Section, Demographics Unit

Alaska Population Digest • 2009 Estimates20
Table 1.11 (continued)Alaska Population by Age, Race Alone and Sex, July 1, 2008Universe: MARS with Imputation Adjustment
African American Alone Asian AloneHawaiian & Pacific
Islander Alone Two or More Races
Age Total Male Female Total Male Female Total Male Female Total Male Female
0-4 1,775 872 903 2,247 1,165 1,082 499 266 233 6,583 3,411 3,172 5-9 1,963 902 1,061 2,036 969 1,067 359 172 187 4,725 2,486 2,239 10-14 2,041 853 1,188 2,135 973 1,162 380 200 180 3,905 2,020 1,885 15-19 1,924 891 1,033 2,132 1,110 1,022 432 222 210 3,822 1,950 1,872 20-24 2,517 1,431 1,086 1,929 968 961 365 188 177 3,091 1,603 1,488 25-29 3,315 2,013 1,302 1,729 841 888 305 137 168 1,813 823 990 30-34 2,251 1,228 1,023 1,580 776 804 246 130 116 1,208 500 708 35-39 1,840 959 881 1,780 900 880 245 125 120 1,114 519 595 40-44 1,640 955 685 2,151 1,052 1,099 232 117 115 1,114 461 653 45-49 1,560 843 717 2,421 1,107 1,314 254 129 125 1,387 574 813 50-54 1,554 653 901 2,254 963 1,291 178 78 100 1,296 673 623 55-59 1,362 676 686 1,944 791 1,153 149 75 74 989 501 488 60-64 774 336 438 1,536 667 869 110 59 51 633 304 329 65-69 355 146 209 978 428 550 46 26 20 328 124 204 70-74 279 151 128 710 289 421 33 18 15 254 114 140 75-79 167 82 85 534 211 323 35 14 21 202 78 124 80-84 148 53 95 361 113 248 16 9 7 98 30 68 85-89 99 31 68 231 78 153 5 1 4 52 21 31 90-94 60 15 45 67 22 45 1 - 1 21 9 12 95+ 25 3 22 22 8 14 - - - 10 3 7
Total 25,649 13,093 12,556 28,777 13,431 15,346 3,890 1,966 1,924 32,645 16,204 16,441
Selected ages:Under 1 403 212 191 497 279 218 117 71 46 1,528 808 720 1-2 722 343 379 903 459 444 203 104 99 2,705 1,392 1,313 5 329 171 158 434 211 223 82 47 35 1,069 556 513 6 375 180 195 373 177 196 78 38 40 975 501 474 10-11 852 362 490 843 380 463 145 74 71 1,534 789 745 12-13 819 331 488 864 391 473 150 79 71 1,559 832 727 15 384 158 226 450 236 214 77 36 41 779 383 396 16 379 166 213 419 224 195 87 45 42 779 391 388 17 375 169 206 425 210 215 88 49 39 729 367 362 18 390 191 199 423 217 206 91 47 44 774 399 375 19 396 207 189 415 223 192 89 45 44 761 410 351 20 392 217 175 425 219 206 82 39 43 691 348 343 21 468 267 201 409 223 186 67 28 39 651 356 295 22 512 283 229 383 187 196 73 43 30 622 335 287 60-61 364 157 207 707 309 398 47 21 26 307 158 149
16+ 19,486 10,308 9,178 21,909 10,088 11,821 2,575 1,292 1,283 16,653 7,904 8,749 18+ 18,732 9,973 8,759 21,065 9,654 11,411 2,400 1,198 1,202 15,145 7,146 7,999 65+ 1,133 481 652 2,903 1,149 1,754 136 68 68 965 379 586
Median Age: 28.9 28.9 28.9 36.74 34.44 38.92 23.74 23.35 24.17 16.42 15.48 17.39 Males /100 Females: 104.3 87.52 102.18 98.56 Youth Dependency: 39.3 42.46 65.81 123.41 (<18/18-64)Aged Dependency: 6.4 15.98 6.01 6.81 (65+/18-64)
Sources: U.S. Census Bureau and Alaska Department of Labor and Workforce Development, Research and Analysis Section, Demographics Unit

Alaska Population Digest • 2009 Estimates 21
Table 1.12Alaska Population by Age, Race Alone or in Combination, Ethnicity and Sex, July 1, 2008 Universe: MARS with Imputation Adjustment
Total Responses White Alone or in CombinationNative American Alone
or in Combination
Age Total Male Female Total Male Female Total Male Female
0-4 65,172 33,814 31,358 40,079 20,933 19,146 16,068 8,259 7,809 5-9 62,279 32,347 29,932 41,100 21,595 19,505 13,340 6,998 6,342 10-14 59,311 29,958 29,353 39,376 20,062 19,314 12,556 6,607 5,949 15-19 60,608 31,047 29,561 39,810 20,420 19,390 14,035 7,288 6,747 20-24 49,970 24,930 25,040 30,730 14,723 16,007 12,459 6,594 5,865 25-29 47,398 24,323 23,075 31,264 15,785 15,479 9,464 4,905 4,559 30-34 48,691 25,029 23,662 36,289 18,815 17,474 7,444 3,642 3,802 35-39 49,766 25,415 24,351 37,529 19,170 18,359 7,727 3,928 3,799 40-44 50,346 25,623 24,723 36,995 18,733 18,262 8,700 4,445 4,255 45-49 55,925 28,498 27,427 42,497 21,943 20,554 8,581 4,173 4,408 50-54 54,811 27,943 26,868 42,843 22,254 20,589 7,492 3,774 3,718 55-59 45,288 23,641 21,647 35,487 18,966 16,521 5,960 2,938 3,022 60-64 31,203 16,352 14,851 24,422 13,233 11,189 4,124 1,942 2,182 65-69 19,614 10,204 9,410 15,292 8,162 7,130 2,793 1,372 1,421 70-74 12,236 6,097 6,139 9,019 4,626 4,393 2,109 972 1,137 75-79 8,573 3,971 4,602 6,230 2,968 3,262 1,540 667 873 80-84 5,647 2,399 3,248 4,218 1,855 2,363 853 348 505 85-89 3,111 1,286 1,825 2,313 990 1,323 438 173 265 90-94 1,222 445 777 918 342 576 168 62 106 95+ 430 129 301 260 76 184 113 39 74
Total 731,601 373,451 358,150 516,671 265,651 251,020 135,964 69,126 66,838
Selected ages:Under 1 13,223 6,892 6,331 7,814 4,022 3,792 3,343 1,735 1,608 1-2 26,339 13,618 12,721 16,082 8,428 7,654 6,565 3,346 3,219 5 12,722 6,722 6,000 8,232 4,403 3,829 2,889 1,492 1,397 6 12,675 6,526 6,149 8,369 4,398 3,971 2,753 1,377 1,376 10-11 23,420 11,969 11,451 15,312 7,891 7,421 5,042 2,698 2,344 12-13 23,859 11,951 11,908 15,912 8,026 7,886 4,995 2,640 2,355 15 12,243 6,226 6,017 8,142 4,172 3,970 2,663 1,385 1,278 16 12,330 6,368 5,962 8,212 4,274 3,938 2,788 1,434 1,354 17 12,715 6,572 6,143 8,487 4,426 4,061 2,892 1,502 1,390 18 12,385 6,376 6,009 8,144 4,137 4,007 2,895 1,560 1,335 19 10,935 5,505 5,430 6,825 3,411 3,414 2,797 1,407 1,390 20 10,511 5,318 5,193 6,527 3,233 3,294 2,672 1,389 1,283 21 10,069 5,017 5,052 6,175 2,948 3,227 2,520 1,307 1,213 22 9,922 4,982 4,940 6,065 2,935 3,130 2,513 1,351 1,162 60-61 15,119 8,004 7,115 12,049 6,598 5,451 1,837 869 968
16+ 532,596 271,106 261,490 387,974 198,889 189,085 91,337 45,877 45,460 18+ 507,551 258,166 249,385 371,275 190,189 181,086 85,657 42,941 42,716 65+ 50,833 24,531 26,302 38,250 19,019 19,231 8,014 3,633 4,381
Median Age: 32.1 32.0 32.3 35.0 35.1 34.8 24.8 24.1 25.7 Males /100 Females: 104.3 105.8 103.4 Youth Dependency: 49.1 43.7 64.8 (<18/18-64)Aged Dependency: 11.1 11.5 10.3 (65+/18-64)
Sources: U.S. Census Bureau and Alaska Department of Labor and Workforce Development, Research and Analysis Section, Demographics Unit

Alaska Population Digest • 2009 Estimates22
African American Alone or in Combination
Asian Alone or in Combination
Hawaiian & Pacific IslanderAlone or in Combination Hispanic Origin or Latino
Age Total Male Female Total Male Female Total Male Female Total Male Female
0-4 3,818 1,906 1,912 3,828 1,990 1,838 1,379 726 653 4,120 2,177 1,943 5-9 3,514 1,672 1,842 3,488 1,656 1,832 837 426 411 3,655 1,796 1,859 10-14 3,137 1,297 1,840 3,548 1,636 1,912 694 356 338 2,995 1,486 1,509 15-19 2,680 1,237 1,443 3,370 1,738 1,632 713 364 349 2,557 1,243 1,314 20-24 3,306 1,854 1,452 2,844 1,432 1,412 631 327 304 2,929 1,601 1,328 25-29 3,872 2,290 1,582 2,321 1,119 1,202 477 224 253 3,085 1,667 1,418 30-34 2,536 1,369 1,167 2,052 1,005 1,047 370 198 172 2,300 1,085 1,215 35-39 1,995 1,035 960 2,159 1,094 1,065 356 188 168 2,540 1,304 1,236 40-44 1,758 1,013 745 2,530 1,241 1,289 363 191 172 2,548 1,337 1,211 45-49 1,682 903 779 2,775 1,277 1,498 390 202 188 2,081 1,078 1,003 50-54 1,673 703 970 2,519 1,086 1,433 284 126 158 1,672 893 779 55-59 1,470 731 739 2,135 883 1,252 236 123 113 1,221 607 614 60-64 836 363 473 1,658 732 926 163 82 81 670 266 404 65-69 382 153 229 1,048 463 585 99 54 45 424 141 283 70-74 294 157 137 759 313 446 55 29 26 321 120 201 75-79 181 88 93 571 228 343 51 20 31 179 92 87 80-84 164 57 107 387 122 265 25 17 8 63 35 28 85-89 109 33 76 246 89 157 5 1 4 46 18 28 90-94 63 16 47 72 25 47 1 - 1 18 4 14 95+ 30 4 26 27 10 17 - - - 12 4 8
Total 33,500 16,881 16,619 38,337 18,139 20,198 7,129 3,654 3,475 33,436 16,954 16,482
Selected ages:Under 1 903 482 421 859 483 376 304 170 134 760 412 348 1-2 1,567 756 811 1,543 786 757 582 302 280 1,587 833 754 5 660 348 312 722 352 370 219 127 92 833 418 415 6 734 358 376 616 293 323 203 100 103 826 415 411 10-11 1,359 573 786 1,430 660 770 277 147 130 1,240 596 644 12-13 1,242 491 751 1,444 668 776 266 126 140 1,185 605 580 15 564 229 335 748 385 363 126 55 71 562 305 257 16 538 235 303 650 357 293 142 68 74 534 259 275 17 506 230 276 684 331 353 146 83 63 506 255 251 18 529 262 267 666 336 330 151 81 70 473 208 265 19 543 281 262 622 329 293 148 77 71 482 216 266 20 527 295 232 638 322 316 147 79 68 486 245 241 21 644 376 268 618 343 275 112 43 69 550 305 245 22 664 351 313 556 271 285 124 74 50 605 334 271 60-61 397 172 225 762 335 427 74 30 44 305 122 183
16+ 22,467 11,777 10,690 26,725 12,472 14,253 4,093 2,091 2,002 22,104 11,190 10,914 18+ 21,423 11,312 10,111 25,391 11,784 13,607 3,805 1,940 1,865 21,064 10,676 10,388 65+ 1,223 508 715 3,110 1,250 1,860 236 121 115 1,063 414 649
Median Age: 25.4 26.0 24.5 29.5 27.7 31.3 19.6 19.4 19.8 25.7 25.5 25.9Males /100 Females: 101.6 89.8 105.1 102.9Youth Dependency: 59.8 58.1 93.1 61.9(<18/18-64)Aged Dependency: 6.1 14.0 6.6 5.3(65+/18-64)
Note: Persons of Hispanic Origin may be of any race.Sources: U.S. Census Bureau and Alaska Department of Labor and Workforce Development, Research and Analysis Section, Demographics Unit
Table 1.12 (continued)Alaska Population by Age, Race Alone or in Combination, Ethnicity and Sex, July 1, 2008 Universe: MARS with Imputation Adjustment
Tables 1.13-1.28, which cover Alaska’s Population by Age, Race, Ethnicity and Age, July 1, 2000-2007, were omitted. They can be found in the
Alaska Population Overview 2009 Estimates.

Alaska Population Digest • 2009 Estimates 23
Table 1.29Alaska Population and Distribution by Selected Age Groups, 1950-2009
Age Groups
Year 0-4 5-13 14-17 18-24 25-34 35-44 45-54 55-64 65+
1950 15,579 17,056 5,835 23,597 26,447 18,517 10,656 6,214 4,7421960 34,193 43,216 11,487 32,129 39,672 31,981 18,957 9,146 5,3861965 33,376 54,374 17,390 39,107 44,811 35,257 23,116 11,587 6,1811970 32,075 64,743 23,041 45,517 49,299 38,021 26,939 13,860 6,8871975 38,655 68,780 28,595 57,415 77,010 50,287 33,336 18,912 10,1111980 38,949 62,363 29,433 59,773 90,808 54,022 34,243 20,713 11,5471985 59,980 77,809 31,698 69,206 127,974 86,068 43,569 28,043 16,9531990* 55,859 87,602 30,356 56,189 113,233 104,039 53,985 29,422 22,4391991* 56,719 91,103 31,273 54,987 112,796 110,335 57,675 30,381 23,7851992* 57,959 94,765 33,216 54,354 112,298 114,379 63,051 31,476 25,2241993* 58,200 97,255 34,714 52,298 110,169 117,413 67,759 32,293 26,8051994* 56,874 98,784 36,496 49,612 106,429 119,029 72,199 33,174 28,0251995* 54,514 99,639 37,951 47,656 101,782 119,821 76,501 34,438 29,2791996* 52,568 99,966 38,795 48,377 97,426 120,566 81,217 36,047 30,2501997* 51,970 100,902 40,304 49,474 92,587 120,167 85,182 38,035 31,0341998* 51,876 101,208 41,116 51,242 88,444 120,318 89,613 40,977 32,2881999* 51,111 100,645 41,889 53,140 84,518 119,123 94,496 43,437 33,6412000 48,592 98,421 43,531 57,521 88,916 113,402 95,827 45,277 36,0132001 49,508 98,380 43,707 58,305 87,851 111,189 98,561 47,587 37,112 2002 50,477 97,461 44,335 59,935 87,918 108,929 101,212 51,778 38,598 2003 51,460 96,746 44,549 61,395 88,311 106,081 103,660 55,551 40,131 2004 52,730 95,994 45,482 63,180 88,756 104,747 105,339 59,636 41,619 2005 53,514 95,393 46,152 64,237 88,477 102,792 106,815 63,651 43,303 2006 54,215 95,531 46,319 65,862 88,155 100,742 108,067 67,246 45,065 2007 55,171 95,629 45,942 66,523 88,568 98,114 108,080 70,975 47,054 2008 56,380 96,257 44,834 66,932 90,111 95,803 107,479 74,589 49,592 2009 57,901 98,024 43,848 68,221 92,182 94,313 106,923 78,642 52,260
* No adjustment has been made for error of closure between 1990’s series and the 2000 Census.
Percent Distribution
1950 12.1 13.3 4.5 18.3 20.6 14.4 8.3 4.8 3.71960 15.1 19.1 5.1 14.2 17.5 14.1 8.4 4.0 2.41965 12.6 20.5 6.6 14.7 16.9 13.3 8.7 4.4 2.31970 10.7 21.6 7.7 15.2 16.4 12.7 9.0 4.6 2.31975 10.1 18.0 7.5 15.0 20.1 13.1 8.7 4.9 2.61980 9.7 15.5 7.3 14.9 22.6 13.4 8.5 5.2 2.91985 11.1 14.4 5.9 12.8 23.6 15.9 8.0 5.2 3.11990 10.1 15.8 5.5 10.2 20.5 18.8 9.8 5.3 4.11991 10.0 16.0 5.5 9.7 19.8 19.4 10.1 5.3 4.21992 9.9 16.2 5.7 9.3 19.1 19.5 10.7 5.4 4.31993 9.8 16.3 5.8 8.8 18.5 19.7 11.4 5.4 4.51994 9.5 16.4 6.1 8.3 17.7 19.8 12.0 5.5 4.71995 9.1 16.6 6.3 7.9 16.9 19.9 12.7 5.7 4.91996 8.7 16.5 6.4 8.0 16.1 19.9 13.4 6.0 5.01997 8.5 16.6 6.6 8.1 15.2 19.7 14.0 6.2 5.11998 8.4 16.4 6.7 8.3 14.3 19.5 14.5 6.6 5.21999 8.2 16.2 6.7 8.5 13.6 19.2 15.2 7.0 5.42000 7.7 15.7 6.9 9.2 14.2 18.1 15.3 7.2 5.72001 7.8 15.6 6.9 9.2 13.9 17.6 15.6 7.5 5.92002 7.9 15.2 6.9 9.4 13.7 17.0 15.8 8.1 6.02003 7.9 14.9 6.9 9.5 13.6 16.4 16.0 8.6 6.22004 8.0 14.6 6.9 9.6 13.5 15.9 16.0 9.1 6.32005 8.1 14.4 6.9 9.7 13.3 15.5 16.1 9.6 6.52006 8.1 14.2 6.9 9.8 13.1 15.0 16.1 10.0 6.72007 8.2 14.1 6.8 9.8 13.1 14.5 16.0 10.5 7.02008 8.3 14.1 6.6 9.8 13.2 14.0 15.8 10.9 7.32009 8.4 14.2 6.3 9.9 13.3 13.6 15.4 11.4 7.5
Source: Alaska Department of Labor & Workforce Development, Research and Analysis Section, Demographics Unit; and the U.S. Census Bureau

Alaska Population Digest • 2009 Estimates24
Table 1.30Alaska Households by Type and Age Group, 1990, 2000, 2008-2009
2009Households
2008Households
2000Households
1990Households
Total % Total % Total % Total %
Total Households by Age Group 252,526 100.0 247,928 100.0 221,600 100.0 188,915 100.0
15-24 10,761 4.3 11,046 4.5 13,206 6.0 13,696 7.2 25-34 41,508 16.4 40,673 16.4 41,925 18.9 53,584 28.4 35-44 48,385 19.2 49,418 19.9 61,277 27.7 57,783 30.6 45-54 63,135 25.0 63,398 25.6 55,315 25.0 31,760 16.8 55-64 54,302 21.5 50,859 20.5 27,241 12.3 17,935 9.5 65-74 21,286 8.4 19,983 8.1 14,431 6.5 10,084 5.3 75+ 13,149 5.2 12,551 5.1 8,205 3.7 4,073 2.2
Family Households by Age Group 169,926 67.3 167,221 67.4 152,337 68.7 132,837 70.3
15-24 3,942 1.6 4,088 1.6 7,156 3.2 7,890 4.2 25-34 26,305 10.4 25,967 10.5 29,308 13.2 37,293 19.7 35-44 30,189 12.0 31,415 12.7 45,746 20.6 43,275 22.9 45-54 43,640 17.3 44,330 17.9 39,010 17.6 23,682 12.5 55-64 43,877 17.4 39,948 16.1 18,193 8.2 12,645 6.7 65-74 14,210 5.6 13,604 5.5 8,911 4.0 6,038 3.2 75+ 7,763 3.1 7,869 3.2 4,013 1.8 2,014 1.1
Married Couple Families 123,998 49.1 122,648 49.5 116,318 52.5 106,079 56.2 With Related Children --- --- 63,245 28.5 64,720 34.3
Other Families 45,928 18.2 44,573 18.0 36,019 16.3 26,758 14.2
Male Householder 15,958 6.3 15,435 6.2 12,082 5.5 8,529 4.5 With Related Children --- --- 7,996 3.6 5,749 3.0
Female Householder 29,970 11.9 29,138 11.8 23,937 10.8 18,229 9.6 With Related Children --- --- 17,243 7.8 14,625 7.7
All Family Groups with children under 181
86,363 0.5 86,666 0.5 88,484 0.6 85,094 0.6
Two parent 59,814 69.3 60,034 69.3 63,245 71.5 64,720 76.1 One Parent maintained by Father 9,251 10.7 9,371 10.8 7,996 9.0 5,749 6.8 Mother 17,298 20.0 17,261 19.9 17,243 19.5 14,625 17.2
Nonfamily Households by Age Group 82,600 32.7 80,707 32.6 69,263 31.3 56,078 29.7
15-24 6,819 2.7 6,958 2.8 6,050 2.7 5,806 3.1 25-34 15,203 6.0 14,706 5.9 12,617 5.7 16,291 8.6 35-44 18,196 7.2 18,003 7.3 15,531 7.0 14,508 7.7 45-54 19,495 7.7 19,068 7.7 16,305 7.4 8,078 4.3 55-64 10,425 4.1 10,911 4.4 9,048 4.1 5,290 2.8 65-74 7,076 2.8 6,379 2.6 5,520 2.5 4,046 2.1 75+ 5,386 2.1 4,682 1.9 4,192 1.9 2,059 1.1
Householder Living Alone (100%) 62,485 24.7 61,012 24.6 52,060 23.5 41,826 22.1 Two or more persons 20,115 8.0 19,695 7.9 17,203 7.8 14,252 7.5
1 Family concepts changed in 2007 to better reflect unmarried partners with children.Source: Alaska Department of Labor and Workforce Development, Research and Development, Demographics Unit and U.S. Census of Population and Housing, 1990,2000.
Alaska Population Digest • 2009 Estimates 25
IntroductionThis chapter presents estimates of population by race, age and male/female for all boroughs and census areas. There is a broad analysis of geographic varia-tion for population trends, households, components of change and population composition.
Population Trends (Figures 2.1, 2.2; Tables 2.1, 2.3, 2.7)•In 2009, 79.9% of Alaska’s population was found in the following five boroughs: Municipality of Anchorage (290,588), Fairbanks North Star Borough (93,779), Matanuska-Susitna Borough (84,314), Kenai Penin-sula Borough (53,578) and Juneau City and Borough (30,661). •The 2000-2009 period experienced an average an-nual increase in growth of 1.1% annually in the state’s population. •The majority of the state’s growth occurred in the Anchorage/Matanuska-Susitna region, with the Matanuska-Susitna Borough experiencing the fastest average annual rate of growth at 3.8%. •The largest percentage losses since 2000 were in the Bristol Bay Borough (-2.8%), Yakutat City and Borough (-2.7%), Hoonah-Angoon Census Area (-2.5%) and Aleutians West Census Area (-2.0%). •Skagway Municipality, Juneau City and Borough and Kodiak Island Borough all essentially had no growth since 2000.
Group Quarters (Table 2.2)•In 2009, an estimated 21,498 persons, or 3.1% of Alaska’s, population lived in group quarters housing, from 19,349 persons, or 3.1%, in 2000. •Approximately 58% of Alaska’s group quarters population lived in the Municipality of Anchorage and Fairbanks North Star Borough. •The Aleutians East Borough still had the greatest proportion of their population living in group quarters housing (54.5%) followed by the Aleutians West Census Area (39.9%). The overall statewide average was 5.1% in 2009.
Housing Units and Households (Table 2.2)•The number of occupied households in Alaska in 2009 was estimated at 252,526, an increase of 30,926, or 14.0%, since 2000. •The number of persons per household on a statewide basis declined slightly from 2.74 in 2000 to 2.66 in 2009.•Wade Hampton Census Area had an average of 4.68 persons per household, followed by Northwest Arctic Borough (3.93), Bethel Census Area (3.86) and North Slope Borough (3.58).•The smallest households were found in Denali Bor-ough (1.91), followed by Aleutians West Census Area (2.03), Skagway-Hoonah-Angoon Census Area (2.07) and Haines Borough (2.12).
Population Density (Table 2.3)•In 2009, Alaska averaged 1.21 persons per square mile compared to 86.79 persons per square mile na-tionally. •The highest population density in Alaska was found in the Municipality of Anchorage with 171.24 persons per square mile.•The lowest density of people was found in Alaska’s in-terior with the Yukon-Koyukuk Census Area averaging less than 0.04 person per square mile. Fifteen boroughs and census areas had population densities that aver-aged less than 1.0 person per square mile. Components of Change (Figures 2.3-2.5; Tables 2.1, 2.3) •The largest growth from 2000 to 2009 occurred in the Municipality of Anchorage (30,305), Matanuska-Susitna Borough (24,992) and Fairbanks North Star Borough (10,939). •Except for the Matanuska-Susitna Borough, every area with a positive population change saw their natural increase (positive) exceed their net migration (generally negative).
Births and Deaths (Figure 2.3, Tables 2.1, 2.3)•In 2008-2009, the birth rate for Alaska was 16.8 births per 1,000 people, above the national average of 13.9 births per 1,000. •The Wade Hampton Census Area produced the high-est birth rate with 32.7 births per 1,000 population. •The Aleutians East Borough and the Aleutians West Census Area, where 65-67% of the population was male, many of whom work in fishing or fish processing, had relatively low birth rates of 5.1 and 8.0 respectively per 1,000 population.•Alaska’s death rate was 4.9 per 1,000 population in 2008-2009. •The state’s lowest mortality rate was 1.1 per 1,000 people in the Denali Borough. •The state’s highest mortality rate was in Hoonah-Angoon (10.7). •Below-average mortality rates were reported for four of Alaska’s five largest urban areas: Fairbanks North Star Borough (3.9), Juneau City and Borough (4.4), Mu-nicipality of Anchorage (4.5) and Matanuska-Susitna Borough (4.6). The Kenai Peninsula Borough (7.1) was slightly above the statewide average. In the 2008-2009 period, 2,564, or 76%, of all deaths in the state were reported in these five boroughs.
Migration Trends (Figures 2.4, 2.5; Tables 2.1, 2.3)•In the 2000-2009 period, Matanuska-Susitna Bor-ough (18,571), Municipality of Anchorage (1,203), Ke-nai Peninsula Borough (831) and Southeast Fairbanks Census Area (471) had net growth through migration. •Every other borough and census area lost population to migration on average.
Chapter 2Alaska Boroughs and Census Areas

Alaska Population Digest • 2009 Estimates26
•The greatest losses due to migration occurred in Juneau City and Borough (-2,399), Bethel Census Area (-2,159), Ketchikan Gateway Borough (-1,936) and North Slope Borough (-1,824).
Race Composition (Figure 2.6; Tables 2.4, 2.5)•As of July 1, 2009, Alaska consisted of: 16.2% Alaska Native, 70.4% White, 4.2% Asian, 3.8% African Ameri-can, 0.6% Hawaiian and Pacific Islander and 4.8% Multi-Race. Persons of Hispanic ethnicity represented 5.0% of the overall state population.•Three boroughs (Lake and Peninsula, North Slope and Northwest Arctic) and five census areas (Bethel, Dilling-ham, Nome, Wade Hampton and Yukon-Koyukuk) were at least 65% Native American in 2009. •Ten boroughs (Denali, Fairbanks North Star, Haines, Juneau, Sitka, Kodiak Island, Kenai Peninsula, Ket-chikan Gateway, Matanuska-Susitna and the Munici-pality of Anchorage) and five census areas (Southeast Fairbanks, Skagway-Hoonah-Angoon, Aleutians West, Wrangell-Petersburg and Valdez-Cordova) were more than 65% non-Native in 2009. •The Municipality of Anchorage had the largest number of Native Americans Alone and Alone or in Combination (between 27,487-38,258 respectively) of any borough or census area in 2009.•The largest numerical increases between 2000 and 2009 in the number of Natives occurred in the Munici-pality of Anchorage (8,220-11,144) and Matanuska-Susitna Borough (3,061-4,499).•In 2009, 46,134-48,650 (41.2-35.1%) Native Ameri-cans lived in areas of the state where Natives made up more than half of the population. •The proportion of Native Americans living in boroughs with less than ten percent Native American population grew to about 42% in 2009. •The largest shift in the distribution of the Native American population between 1990 to 2009 has occurred in the Municipality of Anchorage and the Matanuska-Susitna Borough. •Proportionally, every other area of the state remained constant or had decreases in their share of Natives since 1990, in spite of higher fertility. The areas which showed the greatest loss in share were the Yukon-Koyukuk Census Area and North Slope Borough.
Age and Male/Female (Table 2.7) •The male/female ratio relates to the number of males per 100 females. In 2009, statewide there were 104.2 males for every 100 females. •The boroughs/census areas with the highest male/female ratios and the chief economic cause for each ratio are as follows: Aleutians East Borough (202.6—fishing), Aleutians West Census Area (185.4—fishing and seafood processing), Denali Borough (131.2—mili-tary and mining), Bristol Bay Borough (120.8— fish-ing and seafood processing), Prince of Wales-Outer Ketchikan Census Area (120.1—fishing and logging), Hoonah-Angoon Census Area (116.9- fishing), Yukon-Koyukuk Census Area (114.8—rural interior), Val-dez Cordova Census Area (112.2), Wrangell Borough (111.5 – fishing) and Southeast Fairbanks (111.4—military).
•The boroughs/census areas with the lowest aver-age male/female ratios are as follows: Municipality of Anchorage (100.3), Sitka Borough (100.7), Juneau City and Borough (101.2), Ketchikan-Gateway Borough (101.4), Lake and Peninsula Borough (104.4), Kenai Peninsula Borough (104.8) and Matanuska-Susitna Borough (104.9).
Median Age (Table 2.7)•The median age of Alaska’s population in 2009 was 33.5 years, somewhat less than the national median age of 36.8.•The areas of Alaska with the oldest population in 2009 were found in the Southeast region of the state.•The youngest median ages were found in the North-ern and Southwest regions of the state. •The largest increases in median age between 2000 and 2009 occurred in the Southeast. •The largest decreases in median age between 2000 and 2009 occurred in the Southwestern and Northern regions of the state.
Elders (Table 2.7) •The percentage of persons 65 years and older was 7.5% in 2009. •The Southeast region of the state had the greatest proportion of elders.•The Aleutians West Census Area, with its transient population, had the lowest proportion of persons 65 years and older, 2.8% of the total population. •Eighty-five percent of elder Alaskans 65 years of age or older lived within the following areas: Municipality of Anchorage (20,625 elder Alaskans), Matanuska-Susit-na Borough (6,424), Fairbanks North Star Borough (5,778), Kenai Peninsula Borough (5,823), Juneau City and Borough (2,579), Ketchikan Gateway Borough (1,366), Bethel Census Area (1,014) and Sitka Borough (965).
Income in Alaska (Tables 2.8, 2.9)•Total personal income for Alaska in 2008, the most recent year of available data, was estimated at $30.2 billion, an increase of $17.7 billion since 1990. •Personal income is heavily distributed to four of the “railbelt” boroughs, Kenai Peninsula, Anchorage, Mata-nuska-Susitna and Fairbanks North Star. Personal income from these four boroughs makes up 76.9% of the state total. •The Southeast region had the largest decline in its share of state total personal income, which fell 2.6%. •Per capita income in Alaska in 2008 was $44,318, an increase of $21,590 since 1990. However, if per capita income is considered in real (adjusted for inflation) instead of nominal (no adjustment) terms, Alaskan per capita income increased $4,176 in the 18 years up to 2008. •Due to Alaska’s faster than average growth from 2000 to 2008 in per capita income—5.0% average annual growth in Alaska compared to 3.6% for the U.S.—Alaska rose to 9th place nationally.

Alaska Population Digest • 2009 Estimates 27
Figure 2.1Population by Labor Market Region, 1960, 1970, 1980, 1990, 2000, 2009
Source: Alaska Department of Labor and Workforce Development, Research and Analysis Section, Demographics Unit
1960 1970 1980 1990 2000 20090
100,000
200,000
300,000
400,000
NorthernSouthwestGulf CoastSoutheastInteriorAnchorage/Mat-su
Figure 2.2Average Annual Growth Rate, Five Most Populous Alaska Boroughs, 1960 to 2009
Source: Alaska Department of Labor and Workforce Development, Research and Analysis Section, Demographics Unit
Municipality of Anchorage
FairbanksBorough
JuneauBorough
KenaiBorough
Mat-SuBorough
0%
1%
2%
3%
4%
5%
6%
7%
8%
9%
10%
1960-1970 1970-1980 1980-1990 1990-2000 2000-2009

Alaska Population Digest • 2009 Estimates28
Figure 2.4Average Annual Gross Migration Rate by Borough/Census Area, 2000-2008
Sources: IRS County to County Migration Flows and Alaska Department of Labor and Workforce Development, Research and Analysis Section, Demographics Unit
Yukon-Koyukuk
North Slope
Bethel
Nome
Valdez-Cordova
Northwest Arctic
Denali
Dillingham
Kenai Peninsula
Matanuska-Susitna
Yakutat
Wade Hampton
Lake and Peninsula
Southeast Fairbanks
Sitka
Aleutians East
Prince of Wales-Outer Ketchikan
Juneau
Wrangell-Petersburg
Skagway-Hoonah-Angoon
Haines
Fairbanks North Star
Kodiak Island
Anchorage
Ketchikan Gateway
Bristol Bay
Aleutians West
Less than 13%
13% - 18%
18% - 22%
Greater than 22%
Average AnnualGross Migration Rate
Figure 2.3Average Annual Rate of Natural Increase by Borough/Census Area, 2000-2009
Source: Alaska Department of Labor and Workforce Development, Research and Analysis Section, Demographics Unit
Yukon-Koyukuk
North Slope
Bethel
Nome
Valdez-Cordova
Northwest Arctic
Denali
Dillingham
Kenai Peninsula
Matanuska-Susitna
Yakutat
Wade Hampton
Lake and Peninsula
Southeast Fairbanks
Sitka
Aleutians East
Prince of Wales-Outer Ketchikan
Juneau
Wrangell-Petersburg
Skagway-Hoonah-Angoon
Haines
Fairbanks North Star
Kodiak Island
Anchorage
Ketchikan Gateway
Bristol Bay
Aleutians West
Average AnnualRate of Natural Increase
0.0% to 0.5%
0.5% to 1.0%
1.0% to 1.5%
1.5% to 2.0%

Alaska Population Digest • 2009 Estimates 29
Source: Alaska Department of Labor and Workforce Development, Research and Analysis Section, Demographics Unit
Figure 2.6Proportion Native American (Alone) by Borough/Census Area, 2009
Source: Alaska Department of Labor and Workforce Development, Research and Analysis Section, Demographics Unit
Yukon-Koyukuk
North Slope
Bethel
Nome
Valdez-Cordova
Northwest Arctic
Denali
Dillingham
Kenai Peninsula
Matanuska-Susitna
Yakutat
Wade Hampton
Lake and Peninsula
Southeast Fairbanks
Sitka
Aleutians East
Prince of Wales-Outer Ketchikan
Juneau
Wrangell-Petersburg
Skagway-Hoonah-Angoon
Haines
Fairbanks North Star
Kodiak Island
Anchorage
Ketchikan Gateway
Bristol Bay
Aleutians West
Proportion Native
6% to 10%
10% to 25%
25% to 75%
75% to 100%
Figure 2.5Average Annual Net Migration Rate by Borough/Census Area, 2000-2009
Source: Alaska Department of Labor and Workforce Development, Research and Analysis Section, Demographics Unit
Yukon-Koyukuk
North Slope
Bethel
Nome
Valdez-Cordova
Northwest Arctic
Denali
Dillingham
Kenai Peninsula
Matanuska-Susitna
Yakutat
Wade Hampton
Lake and Peninsula
Southeast Fairbanks
Sitka
Aleutians East
Prince of Wales-Outer Ketchikan
Juneau
Wrangell-Petersburg
Skagway-Hoonah-Angoon
Haines
Fairbanks North Star
Kodiak Island
Anchorage
Ketchikan Gateway
Bristol Bay
Aleutians West
Average AnnualNet Migration Rate
Less than -2.0%
-2.0% to 0.0%
0.0% to 2.0%
Greater than 2.0%

Alaska Population Digest • 2009 Estimates30
Table 2.1Population by Alaska Region and Borough/Census Area, 1990, 2000-2009
April 1 April 1Estimate Estimate Estimate Estimate Estimate Estimate Estimate Estimate Estimate Census Census
Area Name 2009 2008 2007 2006 2005 2004 2003 2002 2001 2000 1990
Alaska 692,314 681,977 676,056 671,202 664,334 657,483 647,884 640,643 632,200 626,931 550,043
Anchorage / Mat-Su Region 374,902 366,341 362,836 360,650 352,533 348,346 340,613 332,220 326,646 319,605 266,021 Anchorage, Municipality of 290,588 283,912 282,968 283,348 278,407 277,880 273,069 267,860 264,886 260,283 226,338 Matanuska-Susitna Borough 84,314 82,429 79,868 77,302 74,126 70,466 67,544 64,360 61,760 59,322 39,683
Gulf Coast Region 76,686 76,408 75,488 74,698 74,987 74,791 75,473 74,400 73,694 73,799 64,063 Kenai Peninsula Borough 53,578 52,959 52,230 51,467 51,269 51,239 51,454 50,682 50,082 49,691 40,802 Kodiak Island Borough 13,860 13,954 13,664 13,457 13,693 13,573 13,817 13,643 13,565 13,913 13,309 Valdez-Cordova Census Area 9,248 9,495 9,594 9,774 10,025 9,979 10,202 10,075 10,047 10,195 9,952
Interior Region 108,463 107,400 106,027 102,188 102,096 99,744 96,314 98,952 97,570 97,417 92,111 Denali Borough 1,838 1,806 1,766 1,797 1,824 1,850 1,917 1,887 1,902 1,893 1764 Fairbanks North Star Borough 93,779 92,762 91,525 87,797 87,739 85,474 82,173 84,765 83,276 82,840 77,720 Southeast Fairbanks C.A. 7,243 7,159 6,992 6,749 6,474 6,144 5,923 5,945 5,907 6,174 5,913 Yukon Koyukuk Census Area 5,603 5,673 5,744 5,845 6,059 6,276 6,301 6,355 6,485 6,510 6,714
Northern Region 23,664 23,597 23,588 23,691 23,696 23,900 23,863 23,814 23,624 23,789 20,380 Nome Census Area 9,500 9,493 9,485 9,545 9,468 9,432 9,354 9,343 9,265 9,196 8,288 North Slope Borough 6,798 6,703 6,726 6,811 6,899 7,133 7,225 7,239 7,231 7,385 5,979 Northwest Arctic Borough 7,366 7,401 7,377 7,335 7,329 7,335 7,284 7,232 7,128 7,208 6,113
Southeast Region 69,338 69,163 69,115 70,433 70,923 70,934 71,810 71,939 71,774 73,082 68,989 Haines Borough 2,286 2,322 2,264 2,252 2,225 2,271 2,335 2,373 2,383 2,392 2,117 Juneau City and Borough 30,661 30,405 30,198 30,822 31,238 31,130 31,300 31,003 30,458 30,711 26,751 Ketchikan Gateway Borough /2 12,984 12,980 13,116 13,206 13,136 13,085 13,527 13,677 13,747 14,059 13,828 Prince of Wales- 5,392 5,358 5,310 5,481 5,513 5,570 5,592 5,682 5,816 6,157 6,278 Outer Ketchikan C.A. /2/3 Sitka City and Borough 8,627 8,641 8,621 8,992 8,948 8,826 8,892 8,794 8,727 8,835 8,588 Skagway-Hoonah-Angoon C.A. 2,908 2,908 2,976 3,008 3,050 3,106 3,150 3,229 3,358 3,436 3,680 Hoonah-Angoon Census Area 2,043 2,062 2,133 2,153 2,216 2,233 2,307 2,385 2,520 2,574 2,988 Skagway Municipality 865 846 843 855 834 873 843 844 838 862 692 Wrangell-Petersburg C.A. 5,852 5,957 6,010 6,036 6,169 6,270 6,324 6,462 6,589 6,684 7,042 Petersburg Census Area 3,794 3,848 --- --- --- --- --- --- --- 4,260 --- Wrangell City and Borough /1 2,058 2,109 --- --- --- --- --- --- --- 2451 --- Yakutat City and Borough 628 592 620 636 644 676 690 719 696 808 705
Southwest Region 39,261 39,068 39,002 39,542 40,099 39,768 39,811 39,318 38,892 39,239 38,479 Aleutians East Borough 2,778 2,698 2,792 2,591 2,657 2,655 2,714 2,723 2,548 2,697 2,464 Aleutians West Census Area 4,549 4,436 4,499 4,916 5,245 5,242 5,328 5,071 5,253 5,465 9,478 Bethel Census Area 16,997 16,924 16,790 17,049 17,099 16,883 16,751 16,514 16,107 16,046 13,656 Bristol Bay Borough 967 1,027 1,032 1,058 1,176 1,101 1,103 1,163 1,173 1,258 1,410 Dillingham Census Area 4,729 4,767 4,779 4,806 4,793 4,852 4,904 4,918 4,889 4,922 4,012 Lake and Peninsula Borough 1,547 1,552 1,534 1,559 1,621 1,611 1,627 1,639 1,732 1,823 1,668 Wade Hampton Census Area 7,694 7,664 7,576 7,563 7,508 7,424 7,384 7,290 7,190 7,028 5,791
/1 2000 population reflects the incorporated area, which is greater than the 2000 Census Area Population./2 No adjustment has been made to 2000 population shown here for Wrangell City and Borough Incorporation (25 Persons) or Ketchikan Gateway Borough Annexations (8 Persons) from Outer Ketchikan./3 Prince of Wales-Outer Ketchikan Census Area Renamed Prince of Wales-Metlakatla Census Area 2008.Source: Alaska Department of Labor and Workforce Development, Research and Analysis, Demographics Unit.

Alaska Population Digest • 2009 Estimates 31
Table 2.1 (continued)Population by Alaska Region and Borough/Census Area, 1990, 2000-2009
ChangeAverage Annual
Rate of Change (%)
NaturalIncrease
Births-Deaths)
NetMigration
(In-Out)
NaturalIncrease
Births-Deaths)
NetMigration
(In-Out)2008- 2000- 1990- 2008- 2000- 1990- 2008- 2008- 4/1/00- 4/1/00-
Area Name 2009 2009 2000 2009 2009 2000 2009 2009 06/30/09 06/30/09
Alaska 10,337 65,383 76,888 1.5 1.1 1.3 8,076 2,261 67,916 -2,533
Anchorage Mat-Su Region 8,561 55,297 53,584 2.3 1.7 1.8 4,345 4,216 35,523 19,774 Anchorage, Municipality of 6,676 30,305 33,945 2.3 1.2 1.4 3,492 3,184 29,102 1,203 Matanuska-Susitna Borough 1,885 24,992 19,639 2.3 3.8 4.0 853 1,032 6,421 18,571
Gulf Coast Region 278 2,887 9,736 0.4 0.4 1.4 593 -315 5,246 -2,359 Kenai Peninsula Borough 619 3,887 8,889 1.2 0.8 2.0 340 279 3,056 831 Kodiak Island Borough -94 -53 604 -0.7 0.0 0.4 171 -265 1,489 -1,542 Valdez-Cordova Census Area -247 -947 243 -2.6 -1.1 0.2 82 -329 701 -1,648
Interior Region 1,063 11,046 5,306 1.0 1.2 0.6 1,523 -460 12,717 -1,671 Denali Borough 32 -55 129 1.8 -0.3 0.7 24 8 151 -206 Fairbanks North Star Borough 1,017 10,939 5,120 1.1 1.3 0.6 1,356 -339 11,591 -652 Southeast Fairbanks Census Area 84 1,069 261 1.2 1.7 0.4 70 14 598 471 Yukon Koyukuk Census Area -70 -907 -204 -1.2 -1.6 -0.3 73 -143 377 -1,284
Northern Region 67 -125 3,409 0.3 -0.1 1.5 478 -411 3,981 -4,106 Nome Census Area 7 304 908 0.1 0.4 1.0 186 -179 1,467 -1,163 North Slope Borough 95 -587 1,406 1.4 -0.9 2.1 141 -46 1,237 -1,824 Northwest Arctic Borough -35 158 1,095 -0.5 0.2 1.6 151 -186 1,277 -1,119
Southeast Region 175 -3,744 4,093 0.3 -0.6 0.6 470 -295 4,560 -8,304 Haines Borough -36 -106 275 -1.6 -0.5 1.2 2 -38 36 -142 Juneau City and Borough 256 -50 3,960 0.8 0.0 1.4 282 -26 2,349 -2,399 Ketchikan Gateway Borough /2 4 -1,075 231 0.0 -0.9 0.2 84 -80 861 -1,936 Prince of Wales- Outer Ketchikan C.A. /2/3
34 -765 -121 0.6 -1.4 -0.2 27 7 367 -1,132
Sitka City and Borough -14 -208 247 -0.2 -0.3 0.3 52 -66 606 -814 Skagway-Hoonah-Angoon C.A. 0 -528 -244 0.0 -1.8 -0.7 7 -7 133 -661 Hoonah-Angoon Census Area -19 -531 -832 -0.9 -2.5 -1.5 4 -23 --- --- Skagway Municipality 19 3 154 2.2 0.0 2.2 3 16 --- --- Wrangell-Petersburg Census Area -105 -832 -358 -1.8 -1.4 -0.5 8 -113 172 -1,004 Petersburg Census Area -54 -466 --- -1.4 -1.3 --- -4 -50 --- --- Wrangell City and Borough /1 -51 -393 --- -2.4 -1.9 --- 12 -63 --- --- Yakutat City and Borough 36 -180 103 5.9 -2.7 1.4 8 28 36 -216
Southwest Region 193 22 760 0.5 0.0 0.2 667 -474 5,889 -5,867 Aleutians East Borough 80 81 233 2.9 0.3 0.9 10 70 112 -31 Aleutians West Census Area 113 -916 -4,013 2.5 -2.0 -5.4 26 87 243 -1,159 Bethel Census Area 73 951 2,390 0.4 0.6 1.6 342 -269 3,110 -2,159 Bristol Bay Borough -60 -291 -152 -6.0 -2.8 -1.1 -2 -58 59 -350 Dillingham Census Area -38 -193 910 -0.8 -0.4 2.0 75 -113 597 -790 Lake and Peninsula Borough -5 -276 155 -0.3 -1.8 0.9 15 -20 106 -382 Wade Hampton Census Area 30 666 1,237 0.4 1.0 1.9 201 -171 1,662 -996
/1 2000 population reflects the incorporated area, which is greater than the 2000 Census Area Population./2 No adjustment has been made to 2000 population shown here for Wrangell City and Borough Incorporation (25 Persons) or Ketchi-kan Gateway Borough Annexations (8 Persons) from Outer Ketchikan./3 Prince of Wales-Outer Ketchikan Census Area Renamed Prince of Wales-Hyder Census Area 2008.Source: Alaska Department of Labor and Workforce Development, Research and Analysis and US Census 2000, 1990.

Alaska Population Digest • 2009 Estimates32
July 1, 2009 April 1, 2000
Total Popula-
tion
Total Group
Quarters Popula-
tion
Total House-
holdPopula-
tion
Total Esti-
matedHouse-
holds
Persons Per
House-hold
Total Popula-
tion
Total Group
Quarters Popula-
tion
Total House-
holdPopula-
tion
Total Esti-
matedHouse-
holds
Persons Per
House-hold
Alaska 692,314 21,498 670,816 252,526 2.66 626,932 19,349 607,583 221,600 2.74
Aleutians East Borough 2,778 1,515 1,263 506 2.50 2,697 1,283 1,414 526 2.69Aleutians West Census Area 4,549 1,814 2,735 1,345 2.03 5,465 2,267 3,198 1,270 2.52Anchorage, Municipality of 290,588 7,081 283,507 108,052 2.62 260,283 7,014 253,269 94,822 2.67Bethel Census Area 16,997 314 16,683 4,327 3.86 16,006 241 15,765 4,226 3.73Bristol Bay Borough 967 0 967 447 2.16 1,258 0 1,258 490 2.57Denali Borough 1,838 27 1,811 947 1.91 1,893 104 1,789 785 2.28Dillingham Census Area 4,729 29 4,700 1,512 3.11 4,922 33 4,889 1,529 3.20Fairbanks North Star Borough 93,779 5,489 88,290 34,310 2.57 82,840 3,080 79,760 29,777 2.68Haines Borough 2,286 5 2,281 1,076 2.12 2,392 5 2,387 991 2.41Juneau, City and Borough of 30,661 674 29,987 12,226 2.45 30,711 678 30,033 11,543 2.60Kenai Peninsula Borough 53,578 1,485 52,093 21,357 2.44 49,691 1,328 48,363 18,438 2.62Ketchikan Gateway Borough 12,984 227 12,757 5,322 2.40 14,070 230 13,840 5,399 2.56Kodiak Island Borough 13,860 325 13,535 4,470 3.03 13,913 338 13,575 4,424 3.07Lake & Peninsula Borough 1,547 0 1,547 513 3.02 1,823 0 1,823 588 3.10Matanuska-Susitna Borough 84,314 1,133 83,181 29,989 2.77 59,322 985 58,337 20,556 2.84Nome Census Area 9,500 273 9,227 2,643 3.49 9,196 223 8,973 2,693 3.33North Slope Borough 6,798 48 6,750 1,885 3.58 7,385 103 7,282 2,109 3.45Northwest Arctic Borough 7,366 308 7,058 1,795 3.93 7,208 319 6,889 1,780 3.87Prince of Wales-Outer Ketchikan C.A. 5,392 27 5,365 1,830 2.93 6,146 76 6,070 2,262 2.68Sitka, City and Borough of 8,627 201 8,426 3,541 2.38 8,835 271 8,564 3,278 2.61Skagway-Hoonah-Angoon C.A. 2908 6 2,902 1,402 2.07 3,436 20 3,416 1,369 2.50Southeast Fairbanks Census Area 7,243 209 7,034 2,480 2.84 6,174 299 5,875 2,098 2.80Valdez-Cordova Census Area 9,248 153 9,095 3,913 2.32 10,195 182 10,013 3,884 2.58Wade Hampton Census Area 7,694 9 7,685 1,641 4.68 7,028 10 7,018 1,602 4.38Wrangell-Petersburg Census Area 5852 58 5,794 2,470 2.35 6,684 70 6,614 2,587 2.56Yakutat, City and Borough of 628 20 608 271 2.24 808 122 686 265 2.59Yukon Koyukuk Census Area 5,603 68 5,535 2,256 2.45 6,551 68 6,483 2,309 2.81
Source: Alaska Department of Labor and Workforce Development, Research and Analysis, Demographics Unit.
Table 2.2Household Population by Alaska Borough/Census Area, 2000, 2009
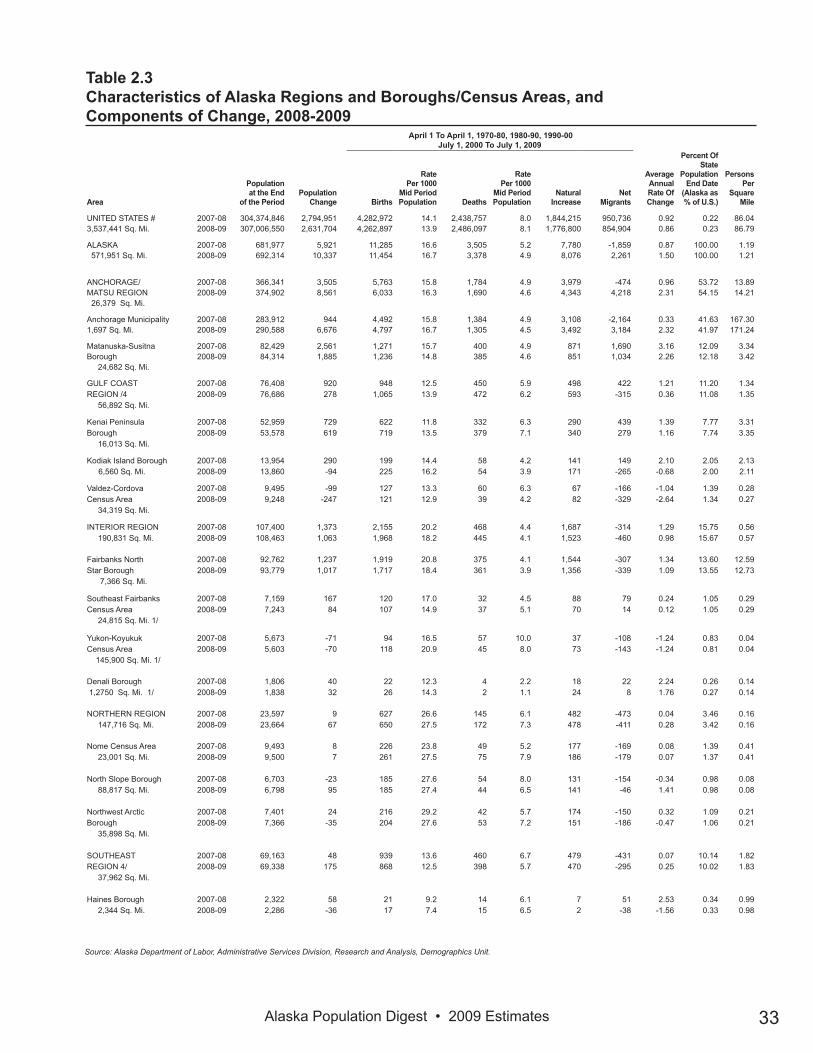
Alaska Population Digest • 2009 Estimates 33
Table 2.3Characteristics of Alaska Regions and Boroughs/Census Areas, and Components of Change, 2008-2009
April 1 To April 1, 1970-80, 1980-90, 1990-00July 1, 2000 To July 1, 2009
Area
Populationat the End
of the PeriodPopulation
Change Births
RatePer 1000
Mid PeriodPopulation Deaths
RatePer 1000
Mid PeriodPopulation
NaturalIncrease
NetMigrants
AverageAnnualRate OfChange
Percent OfState
PopulationEnd Date
(Alaska as % of U.S.)
PersonsPer
SquareMile
UNITED STATES # 2007-08 304,374,846 2,794,951 4,282,972 14.1 2,438,757 8.0 1,844,215 950,736 0.92 0.22 86.043,537,441 Sq. Mi. 2008-09 307,006,550 2,631,704 4,262,897 13.9 2,486,097 8.1 1,776,800 854,904 0.86 0.23 86.79
ALASKA 2007-08 681,977 5,921 11,285 16.6 3,505 5.2 7,780 -1,859 0.87 100.00 1.19 571,951 Sq. Mi. 2008-09 692,314 10,337 11,454 16.7 3,378 4.9 8,076 2,261 1.50 100.00 1.21
ANCHORAGE/ 2007-08 366,341 3,505 5,763 15.8 1,784 4.9 3,979 -474 0.96 53.72 13.89MATSU REGION 2008-09 374,902 8,561 6,033 16.3 1,690 4.6 4,343 4,218 2.31 54.15 14.21 26,379 Sq. Mi.
Anchorage Municipality 2007-08 283,912 944 4,492 15.8 1,384 4.9 3,108 -2,164 0.33 41.63 167.301,697 Sq. Mi. 2008-09 290,588 6,676 4,797 16.7 1,305 4.5 3,492 3,184 2.32 41.97 171.24
Matanuska-Susitna 2007-08 82,429 2,561 1,271 15.7 400 4.9 871 1,690 3.16 12.09 3.34Borough 2008-09 84,314 1,885 1,236 14.8 385 4.6 851 1,034 2.26 12.18 3.42 24,682 Sq. Mi.
GULF COAST 2007-08 76,408 920 948 12.5 450 5.9 498 422 1.21 11.20 1.34REGION /4 2008-09 76,686 278 1,065 13.9 472 6.2 593 -315 0.36 11.08 1.35 56,892 Sq. Mi.
Kenai Peninsula 2007-08 52,959 729 622 11.8 332 6.3 290 439 1.39 7.77 3.31Borough 2008-09 53,578 619 719 13.5 379 7.1 340 279 1.16 7.74 3.35 16,013 Sq. Mi.
Kodiak Island Borough 2007-08 13,954 290 199 14.4 58 4.2 141 149 2.10 2.05 2.13 6,560 Sq. Mi. 2008-09 13,860 -94 225 16.2 54 3.9 171 -265 -0.68 2.00 2.11
Valdez-Cordova 2007-08 9,495 -99 127 13.3 60 6.3 67 -166 -1.04 1.39 0.28Census Area 2008-09 9,248 -247 121 12.9 39 4.2 82 -329 -2.64 1.34 0.27 34,319 Sq. Mi.
INTERIOR REGION 2007-08 107,400 1,373 2,155 20.2 468 4.4 1,687 -314 1.29 15.75 0.56 190,831 Sq. Mi. 2008-09 108,463 1,063 1,968 18.2 445 4.1 1,523 -460 0.98 15.67 0.57
Fairbanks North 2007-08 92,762 1,237 1,919 20.8 375 4.1 1,544 -307 1.34 13.60 12.59Star Borough 2008-09 93,779 1,017 1,717 18.4 361 3.9 1,356 -339 1.09 13.55 12.73 7,366 Sq. Mi.
Southeast Fairbanks 2007-08 7,159 167 120 17.0 32 4.5 88 79 0.24 1.05 0.29Census Area 2008-09 7,243 84 107 14.9 37 5.1 70 14 0.12 1.05 0.29 24,815 Sq. Mi. 1/
Yukon-Koyukuk 2007-08 5,673 -71 94 16.5 57 10.0 37 -108 -1.24 0.83 0.04Census Area 2008-09 5,603 -70 118 20.9 45 8.0 73 -143 -1.24 0.81 0.04 145,900 Sq. Mi. 1/
Denali Borough 2007-08 1,806 40 22 12.3 4 2.2 18 22 2.24 0.26 0.14 1,2750 Sq. Mi. 1/ 2008-09 1,838 32 26 14.3 2 1.1 24 8 1.76 0.27 0.14
NORTHERN REGION 2007-08 23,597 9 627 26.6 145 6.1 482 -473 0.04 3.46 0.16 147,716 Sq. Mi. 2008-09 23,664 67 650 27.5 172 7.3 478 -411 0.28 3.42 0.16
Nome Census Area 2007-08 9,493 8 226 23.8 49 5.2 177 -169 0.08 1.39 0.41 23,001 Sq. Mi. 2008-09 9,500 7 261 27.5 75 7.9 186 -179 0.07 1.37 0.41
North Slope Borough 2007-08 6,703 -23 185 27.6 54 8.0 131 -154 -0.34 0.98 0.08 88,817 Sq. Mi. 2008-09 6,798 95 185 27.4 44 6.5 141 -46 1.41 0.98 0.08
Northwest Arctic 2007-08 7,401 24 216 29.2 42 5.7 174 -150 0.32 1.09 0.21Borough 2008-09 7,366 -35 204 27.6 53 7.2 151 -186 -0.47 1.06 0.21 35,898 Sq. Mi.
SOUTHEAST 2007-08 69,163 48 939 13.6 460 6.7 479 -431 0.07 10.14 1.82REGION 4/ 2008-09 69,338 175 868 12.5 398 5.7 470 -295 0.25 10.02 1.83 37,962 Sq. Mi.
Haines Borough 2007-08 2,322 58 21 9.2 14 6.1 7 51 2.53 0.34 0.99 2,344 Sq. Mi. 2008-09 2,286 -36 17 7.4 15 6.5 2 -38 -1.56 0.33 0.98
Source: Alaska Department of Labor, Administrative Services Division, Research and Analysis, Demographics Unit.

Alaska Population Digest • 2009 Estimates34
Table 2.3 (continued)Characteristics of Alaska Regions and Boroughs/Census Areas, and Components of Change, 2008-2009
April 1 To April 1, 1970-80, 1980-90, 1990-00July 1, 2000 To July 1, 2009
Area
Populationat the End
of the PeriodPopulation
Change Births
RatePer 1000
Mid PeriodPopulation Deaths
RatePer 1000
Mid PeriodPopulation
NaturalIncrease
NetMigrants
AverageAnnualRate OfChange
Percent OfState
PopulationEnd Date
(Alaska as % of U.S.)
PersonsPer
SquareMile
SOUTHEAST 2007-08 69,163 48 939 13.6 460 6.7 479 -431 0.07 10.14 1.82REGION 4/ 2008-09 69,338 175 868 12.5 398 5.7 470 -295 0.25 10.02 1.83 37,962 Sq. Mi.
Haines Borough 2007-08 2,322 58 21 9.2 14 6.1 7 51 2.53 0.34 0.99 2,344 Sq. Mi. 2008-09 2,286 -36 17 7.4 15 6.5 2 -38 -1.56 0.33 0.98
Juneau City and Borough 2007-08 30,405 207 379 12.5 176 5.8 203 4 0.68 4.46 11.19 2,717 Sq. Mi. 3/ 2008-09 30,661 256 416 13.6 134 4.4 282 -26 0.84 4.43 11.28
Ketchikan Gateway 2007-08 12,980 -136 198 15.2 94 7.2 104 -240 -1.04 1.90 ---Borough /7 2008-09 12,984 4 181 13.9 97 7.5 84 -80 0.03 1.88 ---4,898.9 Sq., Mi in 2008
Prince of Wales- 2007-08 5,358 48 91 17.1 36 6.7 55 -7 0.90 0.79 ---Hyder Census Area /7/8 2008-09 5,392 34 53 9.9 26 4.8 27 7 0.63 0.78 ---approx. 3,812 Sq. Mi.
Sitka City and Borough 2007-08 8,641 20 135 15.6 71 8.2 64 -44 0.23 1.27 3.01 2,874 Sq. Mi. 2008-09 8,627 -14 102 11.8 50 5.8 52 -66 -0.16 1.25 3.00
Hoonah-Angoon 2007-08 2,062 -71 27 12.9 13 6.2 14 -85 -3.38 0.30 0.28Census Area 2008-09 2,043 -19 26 12.7 22 10.7 4 -23 -0.93 0.30 0.27 approx. 7447 Sq. Mi. 5/
Skagway Municipality 2007-08 2,062 -71 27 12.9 13 6.2 14 -85 -3.38 0.30 0.28 455 Sq. Mi. 5/ 2008-09 2,043 -19 26 12.7 22 10.7 4 -23 -0.93 0.30 0.27
Yakutat Borough 2007-08 592 -28 7 11.6 4 6.6 3 -31 -4.62 0.09 0.08 7,651 Sq. Mi. 2008-09 628 36 10 16.4 2 3.3 8 28 5.90 0.09 0.08
Petersburg Census 2007-08 3,848 --- 43 11.2 32 8.3 11 --- --- 0.56 ---Area /6 2008-09 3,794 -54 36 9.4 40 10.5 -4 -50 -1.41 0.55 --- approx 3,208 Sq. Mi.
Wrangell City and 2007-08 2,109 --- 23 10.9 17 8.1 6 --- --- 0.31 ---Borough /6 2008-09 2,058 -51 20 9.6 8 3.8 12 -63 -2.45 0.30 --- approx. 2,542 Sq. Mi.
SOUTHWEST REGION 2007-08 39,068 66 853 21.9 198 5.1 655 -589 0.17 5.73 0.35 112,174 Sq. Mi. 2008-09 39,261 193 868 22.2 201 5.1 667 -474 0.49 5.67 0.35
Aleutians East Borough 2007-08 2,698 -94 23 8.4 8 2.9 15 -109 -3.42 0.40 0.39 6,988 Sq. Mi. 2008-09 2,778 80 14 5.1 4 1.5 10 70 2.92 0.40 0.40
Aleutians West 2007-08 4,436 -63 41 9.2 18 4.0 23 -86 -1.41 0.65 1.01Census Area 2008-09 4,549 113 36 8.0 10 2.2 26 87 2.52 0.66 1.03 4,397 Sq. Mi.
Bethel Census Area 2007-08 16,924 134 443 26.3 83 4.9 360 -226 0.79 2.48 0.42 40,633 Sq. Mi. 2008-09 16,997 73 430 25.4 88 5.2 342 -269 0.43 2.46 0.42
Bristol Bay Borough 2007-08 1,027 -5 6 5.8 4 3.9 2 -7 -0.05 0.15 2.03 505 Sq. Mi. 2008-09 967 -60 7 7.0 9 9.0 -2 -58 -0.60 0.14 1.91
Dillingham Census 2007-08 4,767 -12 104 21.8 22 4.6 82 -94 -0.25 0.70 0.26Area 2008-09 4,729 -38 103 21.7 28 5.9 75 -113 -0.80 0.68 0.25 18,675 Sq. Mi.
Lake and Peninsula 2007-08 1,552 18 22 14.3 11 7.1 11 7 1.17 0.23 0.07Borough 2008-09 1,547 -5 27 17.4 12 7.7 15 -20 -0.32 0.22 0.07 23,782 Sq. Mi.
Wade Hampton 2007-08 7,664 88 214 28.1 52 6.8 162 -74 1.15 1.12 0.45Census Area 2008-09 7,694 30 251 32.7 50 6.5 201 -171 0.39 1.11 0.45 17,194 Sq. Mi.
Source: Alaska Department of Labor, Administrative Services Division, Research and Analysis, Demographics Unit.# U.S. Bureau of the Census.1/ Denali Borough was formed out of part of Yukon -Koyukuk and Southeast Fairbanks census areas in 1990.2/ Yakutat Borough was formed out of Skagway -Yakutat-Angoon census area in 1992.3/ Juneau annexed 140 square miles of Skagway-Hoonah-Angoon census area in 1995.4/ Yakutat Borough annexed 2,878 sq. mi. from Valdez-Cordova census area in 1997.5/ Skagway Municipality formed out of Skagway-Hoonah-Angoon in 2007.6/ Wrangell city and borough formed out of Wrangell-Petersburg Census Area including Meyers Chuck in 2008.7/ Ketchikan annexed all of Outer Ketchikan census subarea with the exception of Meyers Chuck and Hyder in 2008.8/ Hyder was included in Prince of Wales census subarea in 2008.

Alaska Population Digest • 2009 Estimates 35
Tabl
e 2.
4A
lask
a R
egio
n an
d B
orou
gh/C
ensu
s A
rea
Popu
latio
n by
Rac
e an
d Et
hnic
ity, J
uly
1, 2
009
One
Rac
e A
lone
Ethn
icity
One
Rac
e A
lone
or i
n C
ombi
natio
n
Are
aTo
tal
Whi
teNa
tive
Amer
ican
Afr
ican
Am
eric
anA
sian
Pa
cific
Isla
nder
Two
or
mor
eR
aces
His
pani
cTo
tal
Res
pons
esW
hite
Nat
ive
Am
eric
anA
frica
nA
mer
ican
Asi
an
Paci
fic Is
land
er
Ala
ska
692,
314
487,
631
111,
873
26,3
0229
,388
3,97
833
,142
34,4
0074
5,34
352
5,25
413
8,42
934
,794
39,4
267,
440
Anch
orag
e/M
at-S
u R
egio
n37
4,90
228
2,49
033
,838
18,7
3318
,313
3,00
718
,521
22,3
1240
4,15
130
2,16
547
,876
24,4
4624
,455
5,20
9
Anch
orag
e M
unici
pality
290,
588
211,
616
27,4
8717
,117
16,8
252,
744
14,7
9919
,177
314,
027
228,
052
38,2
5821
,799
21,4
824,
436
M
atan
uska
-Sus
itna
Boro
ugh
84,3
1470
,874
6,35
11,
616
1,48
826
33,
722
3,13
590
,124
74,1
139,
618
2,64
72,
973
773
Gul
f Coa
st R
egio
n76
,686
61,2
058,
058
723
3,43
626
43,
000
2,87
081
,772
65,1
5210
,468
1,17
74,
338
637
Ke
nai P
enin
sula
Bor
ough
53,5
7845
,644
4,63
150
874
913
01,
916
1,55
356
,937
48,2
126,
230
872
1,27
035
3
Kodi
ak Is
land
Bor
ough
13,8
608,
570
2,08
214
72,
340
108
613
990
14,8
489,
340
2,49
618
52,
614
213
Va
ldez
-Cor
dova
Cen
sus A
rea
9,24
86,
991
1,34
568
347
2647
132
79,
987
7,60
01,
742
120
454
71
Inte
rior R
egio
n10
8,46
381
,997
13,0
605,
789
2,27
633
65,
005
5,00
011
6,58
188
,064
16,9
637,
291
3,53
273
1
Fairb
anks
Nor
th S
tar B
orou
gh93
,779
73,0
608,
415
5,48
52,
114
298
4,40
74,
577
100,
885
78,3
3511
,814
6,83
63,
269
631
So
uthe
ast F
airb
anks
Cen
sus A
rea
7,24
35,
732
887
233
7724
290
274
7,72
76,
148
1,09
628
412
574
D
enal
i Bor
ough
1,83
81,
557
122
3437
781
531,
970
1,65
221
639
5211
Yu
kon-
Koyu
kuk
Cen
sus A
rea
5,60
31,
648
3,63
637
487
227
965,
999
1,92
93,
837
132
8615
Nor
ther
n R
egio
n23
,664
4,43
117
,466
161
534
691,
003
441
25,3
825,
688
18,5
0931
670
716
2
Nom
e C
ensu
s Are
a9,
500
1,95
47,
042
5889
934
814
410
,141
2,41
37,
449
104
134
41
Nor
th S
lope
Bor
ough
6,79
81,
333
4,58
366
366
5139
919
77,
420
1,78
84,
963
116
462
91
Nor
thw
est A
rctic
Bor
ough
7,36
61,
144
5,84
137
799
256
100
7,82
11,
487
6,09
796
111
30
Sout
heas
t Reg
ion
69,3
3849
,596
12,2
3547
22,
585
204
4,24
62,
386
75,8
1454
,587
16,0
1893
13,
804
474
H
aine
s Bo
roug
h2,
286
1,84
928
315
303
106
492,
448
1,98
438
127
479
Ju
neau
City
and
Bor
ough
30,6
6122
,886
4,01
328
61,
438
114
1,92
41,
226
33,6
2825
,040
5,75
252
52,
068
243
Ke
tchi
kan
Gat
eway
Bor
ough
12,9
849,
561
2,09
484
572
2464
939
414
,013
10,4
172,
656
144
721
75
Prin
ce o
f Wal
es-O
uter
Ket
chika
n C
. A.
5,39
22,
851
2,11
513
423
368
115
5,92
23,
273
2,46
635
128
20
Sitk
a C
ity a
nd B
orou
gh8,
627
5,89
21,
704
4535
741
588
344
9,49
26,
571
2,23
511
949
869
Sk
agw
ay-H
oona
h-An
goon
C.A
.2,
908
1,81
989
99
295
147
102
3,13
11,
996
1,00
429
9111
Ya
kuta
t City
and
Bor
ough
628
326
240
39
446
770
437
628
26
2911
W
rang
ell-P
eter
sbur
g C
ensu
s Are
a5,
852
4,41
288
717
108
1041
814
96,
476
4,93
01,
242
4622
236
Sout
hwes
t Reg
ion
39,2
617,
912
27,2
1642
42,
244
981,
367
1,39
141
,643
9,59
828
,595
633
2,59
022
7
Aleu
tians
Eas
t Bor
ough
2,77
898
099
853
667
971
381
2,91
31,
079
1,03
959
720
16
Aleu
tians
Wes
t Cen
sus A
rea
4,54
92,
107
774
204
1,30
633
125
579
4,80
42,
263
827
239
1,42
055
Be
thel
Cen
sus A
rea
16,9
972,
290
13,8
3294
175
1858
820
318
,010
2,97
514
,562
185
236
52
Brist
ol B
ay B
orou
gh96
750
441
213
105
2313
1,01
153
442
514
2711
D
illing
ham
Cen
sus A
rea
4,72
91,
101
3,27
431
4516
262
130
5,14
01,
405
3,53
048
9859
La
ke a
nd P
enin
sula
Bor
ough
1,54
737
91,
035
1015
1197
321,
686
507
1,10
632
2714
W
ade
Ham
pton
Cen
sus A
rea
7,69
455
16,
891
1926
620
153
8,07
983
57,
106
5662
20
Sou
rce:
Ala
ska
Dep
artm
ent o
f Lab
or, A
dmin
istra
tive
Ser
vice
s D
ivis
ion,
Res
earc
h an
d A
naly
sis,
Dem
ogra
phic
s U
nit.

Alaska Population Digest • 2009 Estimates36
Tabl
e 2.
5A
lask
a R
egio
n an
d B
orou
gh/C
ensu
s A
rea
Popu
latio
n by
Rac
e an
d Et
hnic
ity, J
uly
1, 2
008
One
Rac
e A
lone
Ethn
icity
One
Rac
e A
lone
or i
n C
ombi
natio
n
Are
aTo
tal
Whi
teNa
tive
Amer
ican
Afr
ican
Am
eric
anA
sian
Pa
cific
Isla
nder
Two
or
mor
eR
aces
His
pani
cTo
tal
Res
pons
esW
hite
Nat
ive
Am
eric
anA
frica
nA
mer
ican
Asi
an
Paci
fic Is
land
er
Ala
ska
681,
977
480,
814
110,
203
25,6
4928
,776
3,89
032
,645
33,4
3673
1,60
151
7,93
313
8,47
029
,667
38,3
927,
139
Anch
orag
e/M
at-S
u R
egio
n36
6,34
127
6,61
032
,657
18,2
4117
,815
2,92
318
,095
21,5
8439
3,51
929
6,52
247
,505
20,8
1423
,713
4,96
5
Anch
orag
e M
unici
pality
283,
912
207,
248
26,4
9916
,672
16,3
712,
669
14,4
5318
,543
305,
722
224,
104
37,9
5518
,577
20,8
504,
236
M
atan
uska
-Sus
itna
Boro
ugh
82,4
2969
,362
6,15
81,
569
1,44
425
43,
642
3,04
187
,797
72,4
189,
550
2,23
72,
863
729
Gul
f Coa
st R
egio
n76
,408
60,9
697,
992
714
3,46
926
62,
998
2,83
381
,192
64,6
4010
,596
1,01
04,
322
624
Ke
nai P
enin
sula
Bor
ough
52,9
5945
,176
4,52
849
773
412
91,
895
1,51
956
,080
47,5
406,
225
741
1,23
334
1
Kodi
ak Is
land
Bor
ough
13,9
548,
610
2,08
914
82,
380
109
618
981
14,8
959,
338
2,55
516
22,
631
209
Va
ldez
-Cor
dova
Cen
sus A
rea
9,49
57,
183
1,37
569
355
2848
533
310
,217
7,76
21,
816
107
458
74
Inte
rior R
egio
n10
7,40
081
,269
12,9
495,
658
2,25
933
04,
935
4,87
411
5,02
787
,452
17,1
346,
245
3,48
970
7
Fairb
anks
Nor
th S
tar B
orou
gh92
,762
72,4
228,
259
5,34
92,
101
291
4,34
04,
452
99,4
3677
,844
11,9
205,
827
3,23
960
6
Sout
heas
t Fai
rban
ks C
ensu
s Are
a7,
159
5,66
087
723
673
2528
827
47,
610
6,06
01,
109
250
116
75
Den
ali B
orou
gh1,
806
1,52
712
135
367
8051
1,92
91,
615
219
3549
11
Yuko
n-Ko
yuku
k C
ensu
s Are
a5,
673
1,66
03,
692
3849
722
797
6052
1933
3886
133
8515
Nor
ther
n R
egio
n23
,597
4,44
417
,391
162
528
711,
001
441
25,2
185,
587
18,5
1127
468
416
2
Nom
e C
ensu
s Are
a9,
493
1,97
67,
004
5992
1035
214
510
,098
2,38
97,
439
9013
644
N
orth
Slo
pe B
orou
gh6,
703
1,30
04,
542
6435
452
391
192
7,29
01,
714
4,95
497
436
89
Nor
thw
est A
rctic
Bor
ough
7,40
11,
168
5,84
539
829
258
104
7,83
01,
484
6,11
887
112
29
Sout
heas
t Reg
ion
69,1
6349
,570
12,1
0646
52,
575
203
4,24
42,
364
75,3
5254
,218
16,1
2879
53,
751
460
H
aine
s Bo
roug
h2,
322
1,88
927
715
303
108
482,
477
2,01
738
123
479
Ju
neau
City
and
Bor
ough
30,4
0522
,746
3,92
127
91,
432
113
1,91
41,
205
33,2
2924
,773
5,73
944
52,
038
234
Ke
tchi
kan
Gat
eway
Bor
ough
12,9
809,
576
2,08
084
566
2465
039
413
,959
10,3
672,
689
125
704
74
Prin
ce o
f Wal
es-O
uter
Ket
chika
n C
. A.
5,35
82,
848
2,08
312
423
370
114
5,86
33,
232
2,46
026
126
19
Sitk
a C
ity a
nd B
orou
gh8,
641
5,92
01,
694
4535
441
587
341
9,47
36,
554
2,26
210
348
767
Sk
agw
ay-H
oona
h-An
goon
C.A
.2,
908
1,78
892
89
305
148
103
3,12
01,
940
1,05
125
9311
Ya
kuta
t City
and
Bor
ough
592
310
223
39
443
766
235
326
45
2911
W
rang
ell-P
eter
sbur
g C
ensu
s Are
a5,
957
4,49
390
018
112
1042
415
26,
569
4,98
21,
282
4322
735
Sout
hwes
t Reg
ion
39,0
687,
952
27,1
0840
92,
130
971,
372
1,34
041
,293
9,51
428
,596
529
2,43
322
1
Aleu
tians
Eas
t Bor
ough
2,69
895
597
452
638
970
360
2,82
01,
043
1,03
250
679
16
Aleu
tians
Wes
t Cen
sus A
rea
4,43
62,
082
792
189
1,21
931
123
550
4,66
82,
239
868
193
1,31
751
Be
thel
Cen
sus A
rea
16,9
242,
311
13,7
3494
177
2058
820
317
,869
2,93
414
,491
158
230
56
Brist
ol B
ay B
orou
gh1,
027
545
429
1311
524
141,
069
570
447
1229
11
Dilli
ngha
m C
ensu
s Are
a4,
767
1,13
13,
278
3244
1526
713
15,
163
1,41
73,
558
4293
53
Lake
and
Pen
insu
la B
orou
gh1,
552
376
1,04
210
1610
9830
1,68
549
51,
123
2728
12
Wad
e H
ampt
on C
ensu
s Are
a7,
664
552
6,85
919
257
202
528,
019
816
7,07
747
5722
Sou
rce:
Ala
ska
Dep
artm
ent o
f Lab
or, A
dmin
istra
tive
Ser
vice
s D
ivis
ion,
Res
earc
h an
d A
naly
sis,
Dem
ogra
phic
s U
nit.

Alaska Population Digest • 2009 Estimates 37
Table 2.7Alaska Region and Borough/Census Area Population by Age and Sex, 2000, 2009
STATE OF ALASKA ANCHORAGE/ MATANUSKA-SUSITNA REGIONJuly 1, 2009 April 1, 2000 July 1, 2009 April 1, 2000
Age Total Male Female Total Male Female Age Total Male Female Total Male Female
0-4 57,901 30,146 27,755 48,525 24,887 23,638 0-4 30,762 15,785 14,977 24,180 12,323 11,8575-9 55,673 29,014 26,659 53,822 27,515 26,307 5-9 29,916 15,345 14,571 27,069 13,774 13,29510-14 52,991 26,986 26,005 56,061 28,803 27,258 10-14 28,446 14,279 14,167 27,535 14,168 13,36715-19 54,941 28,124 26,817 49,709 26,163 23,546 15-19 29,516 14,864 14,652 24,979 12,994 11,98520-24 46,488 23,160 23,328 39,892 21,192 18,700 20-24 25,734 12,711 13,023 20,510 10,675 9,83525-29 45,324 22,937 22,387 42,987 22,186 20,801 25-29 25,504 12,735 12,769 22,834 11,624 11,21030-34 46,858 24,243 22,615 46,486 24,121 22,365 30-34 25,964 13,244 12,720 24,206 12,294 11,91235-39 47,260 24,001 23,259 55,723 28,555 27,168 35-39 26,640 13,299 13,341 29,260 14,642 14,61840-44 47,053 23,794 23,259 58,326 29,799 28,527 40-44 25,987 12,949 13,038 30,471 15,260 15,21145-49 53,790 27,528 26,262 53,515 27,950 25,565 45-49 29,480 14,823 14,657 27,344 13,990 13,35450-54 53,133 27,086 26,047 41,437 22,311 19,126 50-54 28,573 14,424 14,149 20,943 10,990 9,95355-59 45,805 23,733 22,072 27,423 14,698 12,725 55-59 24,147 12,060 12,087 13,890 7,306 6,58460-64 32,837 17,198 15,639 17,327 9,208 8,119 60-64 17,184 8,619 8,565 8,642 4,444 4,19865-69 20,557 10,642 9,915 12,626 6,371 6,255 65-69 10,566 5,347 5,219 6,342 3,102 3,24070-74 12,525 6,250 6,275 9,881 4,862 5,019 70-74 6,482 3,205 3,277 4,904 2,333 2,57175-79 8,424 3,924 4,500 6,863 3,066 3,797 75-79 4,420 2,204 2,216 3,439 1,478 1,96180-84 5,745 2,464 3,281 3,695 1,522 2,173 80-84 2,999 1,445 1,554 1,796 721 1,07585-90 3,280 1,358 1,922 1,779 644 1,135 85-90 1,705 863 842 858 277 58190+ 1,729 636 1,093 855 259 596 90+ 877 461 416 403 104 299
16+ 514,803 261,535 253,268 457,473 237,225 220,248 16+ 279,773 140,213 139,560 235,280 119,407 115,87318+ 492,541 250,056 242,485 436,215 226,111 210,104 18+ 267,891 134,128 133,763 224,624 113,842 110,78265+ 52,260 25,274 26,986 35,699 16,724 18,975 65+ 27,049 13,525 13,524 17,742 8,015 9,727Median 33.5 33.4 33.7 32.4 32.3 32.5 Median 33.4 33.3 33.5 32.6 32.3 32.9
Total 692,314 353,224 339,090 626,932 324,112 302,820 Total 374,902 188,662 186,240 319,605 162,499 157,106
ANCHORAGE MUNICIPALITY MATANUSKA-SUSITNA BOROUGHJuly 1, 2009 April 1, 2000 July 1, 2009 April 1, 2000
Age Total Male Female Total Male Female Age Total Male Female Total Male Female
0-4 24,126 12,247 11,879 20,033 10,180 9,853 0-4 6,636 3,538 3,098 4,147 2,143 2,0045-9 23,051 11,691 11,360 21,867 11,154 10,713 5-9 6,865 3,654 3,211 5,202 2,620 2,58210-14 21,578 10,679 10,899 21,501 11,014 10,487 10-14 6,868 3,600 3,268 6,034 3,154 2,88015-19 22,458 11,219 11,239 19,662 10,121 9,541 15-19 7,058 3,645 3,413 5,317 2,873 2,44420-24 20,726 10,234 10,492 17,694 9,179 8,515 20-24 5,008 2,477 2,531 2,816 1,496 1,32025-29 20,656 10,309 10,347 19,748 10,100 9,648 25-29 4,848 2,426 2,422 3,086 1,524 1,56230-34 20,599 10,474 10,125 20,365 10,376 9,989 30-34 5,365 2,770 2,595 3,841 1,918 1,92335-39 20,901 10,470 10,431 23,972 12,023 11,949 35-39 5,739 2,829 2,910 5,288 2,619 2,66940-44 20,024 9,929 10,095 24,238 11,994 12,244 40-44 5,963 3,020 2,943 6,233 3,266 2,96745-49 22,577 11,343 11,234 21,685 11,033 10,652 45-49 6,903 3,480 3,423 5,659 2,957 2,70250-54 21,671 10,871 10,800 17,118 8,897 8,221 50-54 6,902 3,553 3,349 3,825 2,093 1,73255-59 18,312 8,991 9,321 11,240 5,822 5,418 55-59 5,835 3,069 2,766 2,650 1,484 1,16660-64 13,284 6,538 6,746 6,918 3,507 3,411 60-64 3,900 2,081 1,819 1,724 937 78765-69 7,950 3,936 4,014 4,982 2,398 2,584 65-69 2,616 1,411 1,205 1,360 704 65670-74 4,962 2,466 2,496 3,913 1,802 2,111 70-74 1,520 739 781 991 531 46075-79 3,328 1,711 1,617 2,805 1,168 1,637 75-79 1,092 493 599 634 310 32480-84 2,308 1,183 1,125 1,479 580 899 80-84 691 262 429 317 141 17685-90 1,378 769 609 719 228 491 85-90 327 94 233 139 49 9090+ 699 431 268 344 92 252 90+ 178 30 148 59 12 47
16+ 217,346 108,602 108,744 192,642 97,187 95,455 16+ 62,427 31,611 30,816 42,638 22,220 20,41818+ 208,521 104,141 104,380 184,412 92,953 91,459 18+ 59,370 29,987 29,383 40,212 20,889 19,32365+ 20,625 10,496 10,129 14,242 6,268 7,974 65+ 6,424 3,029 3,395 3,500 1,747 1,753Median 33.1 33.0 33.1 32.4 31.9 32.8 Median 34.5 34.1 35.1 34.0 34.3 33.8
Total 290,588 145,491 145,097 260,283 131,668 128,615 Total 84,314 43,171 41,143 59,322 30,831 28,491
Note: No adjustments have been made here for Census Bureau corrections to the 2000 Census.Sources: U.S. Census Bureau and Alaska Department of Labor and Workforce Development, Research and Analysis Section, Demographics Unit
Table 2.6, Alaska Region, Borough and Census Area Population by Race and Ethnicity, April 1, 2000, was omitted. It can be found in the
Alaska Population Overview 2009 Estimates.

Alaska Population Digest • 2009 Estimates38
Table 2.7 (continued)Alaska Region and Borough/Census Area Population by Age and Sex, 2000, 2009
INTERIOR REGION FAIRBANKS NORTH STAR BOROUGHJuly 1, 2009 April 1, 2000 July 1, 2009 April 1, 2000
Age Total Male Female Total Male Female Age Total Male Female Total Male Female
0-4 10,032 5,315 4,717 7,824 3,999 3,825 0-4 8,862 4,697 4,165 6,722 3,414 3,3085-9 9,107 4,789 4,318 8,258 4,191 4,067 5-9 7,919 4,178 3,741 7,006 3,550 3,45610-14 8,043 4,163 3,880 8,717 4,456 4,261 10-14 6,887 3,556 3,331 7,189 3,673 3,51615-19 8,074 4,223 3,851 7,982 4,324 3,658 15-19 6,835 3,577 3,258 6,685 3,619 3,06620-24 8,297 4,223 4,074 8,174 4,548 3,626 20-24 7,402 3,757 3,645 7,416 4,095 3,32125-29 8,380 4,404 3,976 7,853 4,208 3,645 25-29 7,577 3,964 3,613 7,063 3,792 3,27130-34 8,180 4,212 3,968 7,334 3,842 3,492 30-34 7,331 3,736 3,595 6,466 3,384 3,08235-39 7,619 3,971 3,648 8,233 4,191 4,042 35-39 6,738 3,509 3,229 7,062 3,592 3,47040-44 6,831 3,422 3,409 8,335 4,203 4,132 40-44 5,928 2,936 2,992 6,990 3,484 3,50645-49 7,684 3,886 3,798 7,738 4,063 3,675 45-49 6,548 3,277 3,271 6,433 3,354 3,07950-54 7,654 3,912 3,742 5,990 3,302 2,688 50-54 6,445 3,263 3,182 4,968 2,728 2,24055-59 6,688 3,609 3,079 3,846 2,111 1,735 55-59 5,565 2,979 2,586 3,096 1,674 1,42260-64 4,747 2,608 2,139 2,418 1,320 1,098 60-64 3,964 2,172 1,792 1,899 1,029 87065-69 2,906 1,563 1,343 1,700 876 824 65-69 2,338 1,213 1,125 1,356 690 66670-74 1,652 840 812 1,320 674 646 70-74 1,311 662 649 1,043 529 51475-79 1,146 482 664 870 398 472 75-79 934 387 547 736 323 41380-84 805 318 487 519 222 297 80-84 664 256 408 433 181 25285-90 386 113 273 234 104 130 85-90 333 90 243 190 86 10490+ 232 55 177 113 34 79 90+ 198 46 152 87 20 67
16+ 79,793 41,087 38,706 70,954 37,519 33,435 16+ 68,894 35,197 33,697 60,520 31,836 28,68418+ 76,783 39,498 37,285 67,771 35,817 31,954 18+ 66,415 33,902 32,513 57,921 30,452 27,46965+ 7,127 3,371 3,756 4,756 2,308 2,448 65+ 5,778 2,654 3,124 3,845 1,829 2,016Median 31.4 31.1 31.7 29.9 29.8 30.2 Median 31.0 30.5 31.4 29.5 29.2 29.8
Total 108,463 56,108 52,355 97,458 51,066 46,392 Total 93,779 48,255 45,524 82,840 43,217 39,623
SOUTHEAST FAIRBANKS CENSUS AREA DENALI BOROUGHJuly 1, 2009 April 1, 2000 July 1, 2009 April 1, 2000
Age Total Male Female Total Male Female Age Total Male Female Total Male Female
0-4 638 337 301 476 255 221 0-4 108 57 51 98 50 485-9 631 330 301 559 272 287 5-9 112 61 51 109 62 4710-14 599 314 285 611 294 317 10-14 110 51 59 151 84 6715-19 633 317 316 552 305 247 15-19 116 67 49 127 66 6120-24 443 230 213 297 164 133 20-24 87 55 32 92 56 3625-29 405 216 189 328 160 168 25-29 94 51 43 131 74 5730-34 384 206 178 358 173 185 30-34 138 83 55 140 88 5235-39 425 220 205 478 236 242 35-39 166 92 74 181 101 8040-44 442 231 211 553 284 269 40-44 147 86 61 244 140 10445-49 517 273 244 541 284 257 45-49 181 104 77 232 133 9950-54 559 290 269 444 240 204 50-54 168 94 74 159 100 5955-59 509 290 219 340 190 150 55-59 190 107 83 107 68 3960-64 388 219 169 262 146 116 60-64 94 55 39 64 40 2465-69 287 170 117 150 82 68 65-69 77 49 28 29 20 970-74 188 95 93 118 59 59 70-74 28 14 14 12 7 575-79 91 44 47 53 31 22 75-79 14 10 4 6 4 280-84 67 24 43 35 13 22 80-84 3 3 0 3 3 085-90 22 10 12 13 4 9 85-90 3 3 0 3 0 390+ 15 0 15 6 2 4 90+ 2 1 1 5 5 0
16+ 5,224 2,765 2,459 4,393 2,294 2,099 16+ 1,485 861 624 1,508 893 61518+ 4,966 2,624 2,342 4,150 2,161 1,989 18+ 1,428 827 601 1,443 859 58465+ 670 343 327 375 191 184 65+ 127 80 47 58 39 19Median 33.5 34.0 33.0 33.7 34.2 33.2 Median 39.6 40.3 38.9 37.6 38.7 36.6
Total 7,243 3,816 3,427 6,174 3,194 2,980 Total 1,838 1,043 795 1,893 1,101 792
Note: No adjustments have been made here for Census Bureau corrections to the 2000 Census.Sources: U.S. Census Bureau and Alaska Department of Labor and Workforce Development, Research and Analysis Section, Demographics Unit

Alaska Population Digest • 2009 Estimates 39
Table 2.7 (continued)Alaska Region and Borough/Census Area Population by Age and Sex, 2000, 2009
YUKON-KOYUKUK CENSUS AREA GULF COAST REGIONJuly 1, 2009 April 1, 2000 July 1, 2009 April 1, 2000
Age Total Male Female Total Male Female Age Total Male Female Total Male Female
0-4 424 224 200 528 280 248 0-4 5,255 2,744 2,511 5,245 2,647 2,5985-9 445 220 225 584 307 277 5-9 5,521 2,971 2,550 6,075 3,129 2,94610-14 447 242 205 766 405 361 10-14 5,817 2,998 2,819 6,983 3,573 3,41015-19 490 262 228 618 334 284 15-19 6,069 3,183 2,886 5,958 3,167 2,79120-24 365 181 184 369 233 136 20-24 4,279 2,162 2,117 3,426 1,907 1,51925-29 304 173 131 331 182 149 25-29 3,895 1,976 1,919 4,024 2,075 1,94930-34 327 187 140 370 197 173 30-34 4,478 2,312 2,166 4,855 2,501 2,35435-39 290 150 140 512 262 250 35-39 4,840 2,443 2,397 6,425 3,351 3,07440-44 314 169 145 548 295 253 40-44 5,119 2,559 2,560 7,290 3,804 3,48645-49 438 232 206 532 292 240 45-49 6,270 3,243 3,027 7,170 3,798 3,37250-54 482 265 217 419 234 185 50-54 6,852 3,486 3,366 5,438 2,977 2,46155-59 424 233 191 303 179 124 55-59 6,246 3,389 2,857 3,667 2,020 1,64760-64 301 162 139 193 105 88 60-64 4,512 2,440 2,072 2,307 1,252 1,05565-69 204 131 73 165 84 81 65-69 3,140 1,681 1,459 1,788 944 84470-74 125 69 56 147 79 68 70-74 1,789 905 884 1,415 721 69475-79 107 41 66 75 40 35 75-79 1,144 542 602 963 463 50080-84 71 35 36 48 25 23 80-84 768 281 487 466 193 27385-90 28 10 18 28 14 14 85-90 469 161 308 200 85 11590+ 17 8 9 15 7 8 90+ 223 38 185 104 36 68
16+ 4,190 2,264 1,926 4,533 2,496 2,037 16+ 58,869 30,193 28,676 54,119 28,598 25,52118+ 3,974 2,145 1,829 4,257 2,345 1,912 18+ 56,272 28,828 27,444 51,407 27,167 24,24065+ 552 294 258 478 249 229 65+ 7,533 3,608 3,925 4,936 2,442 2,494Median 35.0 35.3 34.7 31.1 30.9 31.3 Median 38.1 37.9 38.4 35.3 35.5 35.0
Total 5,603 2,994 2,609 6,551 3,554 2,997 Total 76,686 39,514 37,172 73,799 38,643 35,156
KENAI PENINSULA BOROUGH KODIAK ISLAND BOROUGHJuly 1, 2009 April 1, 2000 July 1, 2009 April 1, 2000
Age Total Male Female Total Male Female Age Total Male Female Total Male Female
0-4 3,512 1,866 1,646 3,288 1,665 1,623 0-4 1,197 602 595 1,245 631 6145-9 3,676 1,957 1,719 4,024 2,084 1,940 5-9 1,200 662 538 1,269 628 64110-14 3,825 1,971 1,854 4,698 2,372 2,326 10-14 1,277 663 614 1,314 682 63215-19 4,227 2,203 2,024 4,140 2,219 1,921 15-19 1,103 590 513 1,027 534 49320-24 3,018 1,498 1,520 2,132 1,179 953 20-24 752 398 354 817 445 37225-29 2,707 1,381 1,326 2,627 1,368 1,259 25-29 771 382 389 897 478 41930-34 2,981 1,552 1,429 3,021 1,526 1,495 30-34 1,011 510 501 1,165 629 53635-39 3,204 1,611 1,593 4,140 2,139 2,001 35-39 1,090 560 530 1,390 734 65640-44 3,454 1,718 1,736 4,934 2,547 2,387 40-44 996 502 494 1,272 707 56545-49 4,346 2,203 2,143 5,008 2,619 2,389 45-49 1,069 577 492 1,134 612 52250-54 4,868 2,429 2,439 3,731 2,036 1,695 50-54 1,033 554 479 850 467 38355-59 4,622 2,479 2,143 2,632 1,432 1,200 55-59 833 458 375 529 282 24760-64 3,315 1,783 1,532 1,667 902 765 60-64 634 328 306 331 177 15465-69 2,406 1,281 1,125 1,310 676 634 65-69 388 205 183 272 151 12170-74 1,359 682 677 1,051 531 520 70-74 226 112 114 177 91 8675-79 914 430 484 736 351 385 75-79 126 53 73 110 59 5180-84 608 224 384 341 130 211 80-84 78 26 52 70 36 3485-90 365 122 243 131 50 81 85-90 48 21 27 33 16 1790+ 171 22 149 80 27 53 90+ 28 10 18 11 3 8
16+ 41,730 21,205 20,525 36,722 19,237 17,485 16+ 9,959 5,172 4,787 9,848 5,307 4,54118+ 39,907 20,258 19,649 34,832 18,239 16,593 18+ 9,502 4,927 4,575 9,399 5,076 4,32365+ 5,823 2,761 3,062 3,649 1,765 1,884 65+ 894 427 467 673 356 317Median 39.4 39.0 39.9 36.3 36.3 36.3 Median 33.1 33.0 33.2 31.6 32.2 30.9
Total 53,578 27,412 26,166 49,691 25,853 23,838 Total 13,860 7,213 6,647 13,913 7,362 6,551
Note: No adjustments have been made here for Census Bureau corrections to the 2000 Census.Sources: U.S. Census Bureau and Alaska Department of Labor and Workforce Development, Research and Analysis Section, Demographics Unit
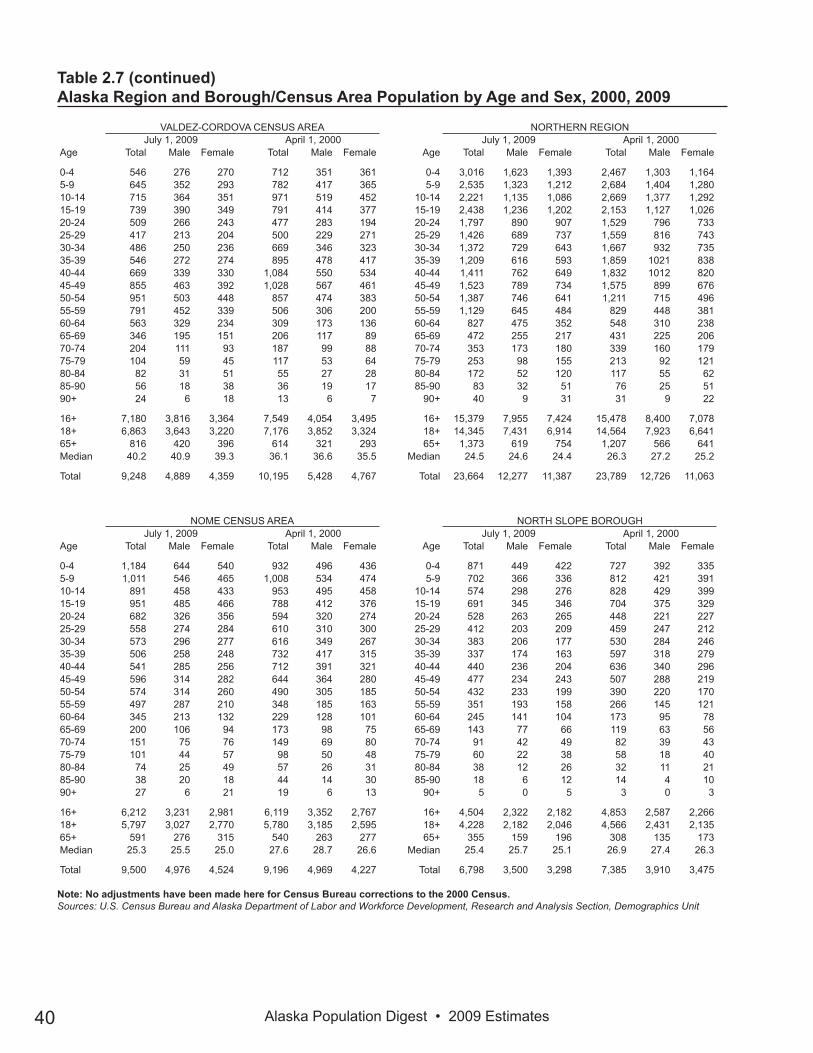
Alaska Population Digest • 2009 Estimates40
Table 2.7 (continued)Alaska Region and Borough/Census Area Population by Age and Sex, 2000, 2009
VALDEZ-CORDOVA CENSUS AREA NORTHERN REGIONJuly 1, 2009 April 1, 2000 July 1, 2009 April 1, 2000
Age Total Male Female Total Male Female Age Total Male Female Total Male Female
0-4 546 276 270 712 351 361 0-4 3,016 1,623 1,393 2,467 1,303 1,1645-9 645 352 293 782 417 365 5-9 2,535 1,323 1,212 2,684 1,404 1,28010-14 715 364 351 971 519 452 10-14 2,221 1,135 1,086 2,669 1,377 1,29215-19 739 390 349 791 414 377 15-19 2,438 1,236 1,202 2,153 1,127 1,02620-24 509 266 243 477 283 194 20-24 1,797 890 907 1,529 796 73325-29 417 213 204 500 229 271 25-29 1,426 689 737 1,559 816 74330-34 486 250 236 669 346 323 30-34 1,372 729 643 1,667 932 73535-39 546 272 274 895 478 417 35-39 1,209 616 593 1,859 1021 83840-44 669 339 330 1,084 550 534 40-44 1,411 762 649 1,832 1012 82045-49 855 463 392 1,028 567 461 45-49 1,523 789 734 1,575 899 67650-54 951 503 448 857 474 383 50-54 1,387 746 641 1,211 715 49655-59 791 452 339 506 306 200 55-59 1,129 645 484 829 448 38160-64 563 329 234 309 173 136 60-64 827 475 352 548 310 23865-69 346 195 151 206 117 89 65-69 472 255 217 431 225 20670-74 204 111 93 187 99 88 70-74 353 173 180 339 160 17975-79 104 59 45 117 53 64 75-79 253 98 155 213 92 12180-84 82 31 51 55 27 28 80-84 172 52 120 117 55 6285-90 56 18 38 36 19 17 85-90 83 32 51 76 25 5190+ 24 6 18 13 6 7 90+ 40 9 31 31 9 22
16+ 7,180 3,816 3,364 7,549 4,054 3,495 16+ 15,379 7,955 7,424 15,478 8,400 7,07818+ 6,863 3,643 3,220 7,176 3,852 3,324 18+ 14,345 7,431 6,914 14,564 7,923 6,64165+ 816 420 396 614 321 293 65+ 1,373 619 754 1,207 566 641Median 40.2 40.9 39.3 36.1 36.6 35.5 Median 24.5 24.6 24.4 26.3 27.2 25.2
Total 9,248 4,889 4,359 10,195 5,428 4,767 Total 23,664 12,277 11,387 23,789 12,726 11,063
NOME CENSUS AREA NORTH SLOPE BOROUGHJuly 1, 2009 April 1, 2000 July 1, 2009 April 1, 2000
Age Total Male Female Total Male Female Age Total Male Female Total Male Female
0-4 1,184 644 540 932 496 436 0-4 871 449 422 727 392 3355-9 1,011 546 465 1,008 534 474 5-9 702 366 336 812 421 39110-14 891 458 433 953 495 458 10-14 574 298 276 828 429 39915-19 951 485 466 788 412 376 15-19 691 345 346 704 375 32920-24 682 326 356 594 320 274 20-24 528 263 265 448 221 22725-29 558 274 284 610 310 300 25-29 412 203 209 459 247 21230-34 573 296 277 616 349 267 30-34 383 206 177 530 284 24635-39 506 258 248 732 417 315 35-39 337 174 163 597 318 27940-44 541 285 256 712 391 321 40-44 440 236 204 636 340 29645-49 596 314 282 644 364 280 45-49 477 234 243 507 288 21950-54 574 314 260 490 305 185 50-54 432 233 199 390 220 17055-59 497 287 210 348 185 163 55-59 351 193 158 266 145 12160-64 345 213 132 229 128 101 60-64 245 141 104 173 95 7865-69 200 106 94 173 98 75 65-69 143 77 66 119 63 5670-74 151 75 76 149 69 80 70-74 91 42 49 82 39 4375-79 101 44 57 98 50 48 75-79 60 22 38 58 18 4080-84 74 25 49 57 26 31 80-84 38 12 26 32 11 2185-90 38 20 18 44 14 30 85-90 18 6 12 14 4 1090+ 27 6 21 19 6 13 90+ 5 0 5 3 0 3
16+ 6,212 3,231 2,981 6,119 3,352 2,767 16+ 4,504 2,322 2,182 4,853 2,587 2,26618+ 5,797 3,027 2,770 5,780 3,185 2,595 18+ 4,228 2,182 2,046 4,566 2,431 2,13565+ 591 276 315 540 263 277 65+ 355 159 196 308 135 173Median 25.3 25.5 25.0 27.6 28.7 26.6 Median 25.4 25.7 25.1 26.9 27.4 26.3
Total 9,500 4,976 4,524 9,196 4,969 4,227 Total 6,798 3,500 3,298 7,385 3,910 3,475
Note: No adjustments have been made here for Census Bureau corrections to the 2000 Census.Sources: U.S. Census Bureau and Alaska Department of Labor and Workforce Development, Research and Analysis Section, Demographics Unit

Alaska Population Digest • 2009 Estimates 41
Table 2.7 (continued)Alaska Region, Borough and Census Area Population by Age and Sex, 2000, 2009
NORTHWEST ARCTIC BOROUGH SOUTHEAST REGIONJuly 1, 2009 April 1, 2000 July 1, 2009 April 1, 2000
Age Total Male Female Total Male Female Age Total Male Female Total Male Female
0-4 961 530 431 808 415 393 0-4 4,696 2,490 2,206 4,775 2,474 2,3015-9 822 411 411 864 449 415 5-9 4,677 2,483 2,194 5,676 2,892 2,78410-14 756 379 377 888 453 435 10-14 4,721 2,453 2,268 6,232 3,145 3,08715-19 796 406 390 661 340 321 15-19 5,167 2,709 2,458 5,548 2,932 2,61620-24 587 301 286 487 255 232 20-24 3,611 1,731 1,880 3,812 1,948 1,86425-29 456 212 244 490 259 231 25-29 3,709 1,839 1,870 4,220 2,091 2,12930-34 416 227 189 521 299 222 30-34 4,214 2,163 2,051 5,248 2,697 2,55135-39 366 184 182 530 286 244 35-39 4,495 2,226 2,269 6,380 3,252 3,12840-44 430 241 189 484 281 203 40-44 4,983 2,537 2,446 7,103 3,602 3,50145-49 450 241 209 424 247 177 45-49 5,886 3,072 2,814 6,932 3,619 3,31350-54 381 199 182 331 190 141 50-54 6,195 3,126 3,069 5,705 3,045 2,66055-59 281 165 116 215 118 97 55-59 5,712 3,012 2,700 3,711 1,982 1,72960-64 237 121 116 146 87 59 60-64 4,290 2,324 1,966 2,490 1,380 1,11065-69 129 72 57 139 64 75 65-69 2,622 1,366 1,256 1,675 878 79770-74 111 56 55 108 52 56 70-74 1,732 867 865 1,419 707 71275-79 92 32 60 57 24 33 75-79 1,066 437 629 1,054 460 59480-84 60 15 45 28 18 10 80-84 775 286 489 610 249 36185-90 27 6 21 18 7 11 85-90 507 144 363 324 118 20690+ 8 3 5 9 3 6 90+ 280 50 230 168 57 111
16+ 4,663 2,402 2,261 4,506 2,461 2,045 16+ 54,285 27,390 26,895 55,134 28,349 26,78518+ 4,320 2,222 2,098 4,218 2,307 1,911 18+ 52,122 26,268 25,854 52,654 27,073 25,58165+ 427 184 243 359 168 191 65+ 6,982 3,150 3,832 5,250 2,469 2,781Median 23.0 22.9 23.0 23.9 25.2 22.5 Median 39.3 39.0 39.6 35.8 35.9 35.7
Total 7,366 3,801 3,565 7,208 3,847 3,361 Total 69,338 35,315 34,023 73,082 37,528 35,554
HAINES BOROUGH JUNEAU CITY AND BOROUGHJuly 1, 2009 April 1, 2000 July 1, 2009 April 1, 2000
Age Total Male Female Total Male Female Age Total Male Female Total Male Female
0-4 110 54 56 128 64 64 0-4 2,124 1,106 1,018 2,003 1,021 9825-9 117 59 58 157 78 79 5-9 2,121 1,145 976 2,339 1,180 1,15910-14 141 77 64 201 100 101 10-14 2,062 1,070 992 2,541 1,298 1,24315-19 137 71 66 167 89 78 15-19 2,345 1,215 1,130 2,321 1,213 1,10820-24 78 34 44 87 43 44 20-24 1,730 823 907 1,686 826 86025-29 92 42 50 96 43 53 25-29 1,788 877 911 1,929 960 96930-34 130 73 57 145 73 72 30-34 1,896 969 927 2,357 1,213 1,14435-39 135 70 65 185 87 98 35-39 2,074 1,031 1,043 2,788 1,382 1,40640-44 144 76 68 248 127 121 40-44 2,290 1,157 1,133 2,993 1,484 1,50945-49 210 110 100 253 139 114 45-49 2,647 1,350 1,297 3,041 1,530 1,51150-54 234 123 111 238 124 114 50-54 2,715 1,349 1,366 2,473 1,302 1,17155-59 228 118 110 146 69 77 55-59 2,482 1,262 1,220 1,456 745 71160-64 205 114 91 91 44 47 60-64 1,808 960 848 916 490 42665-69 116 58 58 87 45 42 65-69 992 497 495 580 293 28770-74 71 37 34 61 39 22 70-74 637 296 341 504 230 27475-79 65 26 39 50 25 25 75-79 373 143 230 367 148 21980-84 37 21 16 28 12 16 80-84 293 102 191 248 93 15585-90 29 11 18 20 10 10 85-90 181 48 133 115 43 7290+ 7 0 7 4 0 4 90+ 103 19 84 54 18 36
16+ 1,889 966 923 1,867 946 921 16+ 23,905 11,871 12,034 23,285 11,691 11,59418+ 1,822 934 888 1,779 903 876 18+ 22,967 11,363 11,604 22,294 11,159 11,13565+ 325 153 172 250 131 119 65+ 2,579 1,105 1,474 1,868 825 1,043Median 46.4 46.4 46.4 40.7 41.4 40.1 Median 38.0 37.4 38.6 35.3 35.1 35.6
Total 2,286 1,174 1,112 2,392 1,211 1,181 Total 30,661 15,419 15,242 30,711 15,469 15,242
Note: No adjustments have been made here for Census Bureau corrections to the 2000 Census.Sources: U.S. Census Bureau and Alaska Department of Labor and Workforce Development, Research and Analysis Section, Demographics Unit

Alaska Population Digest • 2009 Estimates42
Table 2.7 (continued)Alaska Region and Borough/Census Area Population by Age and Sex, 2000, 2009
KETCHIKAN GATEWAY BOROUGH PRINCE OF WALES- OUTER KETCHIKAN CENSUS AREAJuly 1, 2009 April 1, 2000 July 1, 2009 April 1, 2000
Age Total Male Female Total Male Female Age Total Male Female Total Male Female
0-4 915 482 433 964 490 474 0-4 384 210 174 452 237 2155-9 912 496 416 1,145 588 557 5-9 378 208 170 505 269 23610-14 909 442 467 1,178 596 582 10-14 420 234 186 567 285 28215-19 963 505 458 1,045 536 509 15-19 423 244 179 524 284 24020-24 660 315 345 692 349 343 20-24 271 136 135 310 176 13425-29 711 348 363 779 376 403 25-29 262 139 123 338 172 16630-34 777 390 387 1,005 500 505 30-34 286 156 130 388 199 18935-39 814 389 425 1,279 686 593 35-39 319 158 161 525 271 25440-44 935 462 473 1,352 680 672 40-44 362 191 171 589 325 26445-49 1,135 616 519 1,214 625 589 45-49 468 255 213 580 334 24650-54 1,112 556 556 1,085 574 511 50-54 477 245 232 433 252 18155-59 1,017 532 485 746 398 348 55-59 451 258 193 339 199 14060-64 758 393 365 483 282 201 60-64 339 210 129 216 131 8565-69 516 262 254 332 162 170 65-69 249 141 108 142 91 5170-74 321 163 158 308 152 156 70-74 144 88 56 99 57 4275-79 201 78 123 225 93 132 75-79 82 39 43 68 35 3380-84 158 62 96 137 63 74 80-84 42 21 21 21 7 1485-90 106 31 75 65 21 44 85-90 28 9 19 13 7 690+ 64 14 50 42 20 22 90+ 7 0 7 5 3 2
16+ 10,086 5,031 5,055 10,569 5,403 5,166 16+ 4,115 2,236 1,879 4,459 2,473 1,98618+ 9,690 4,836 4,854 10,111 5,185 4,926 18+ 3,929 2,132 1,797 4,214 2,347 1,86765+ 1,366 610 756 1,109 511 598 65+ 552 298 254 348 200 148Median 39.0 38.7 39.2 36.0 36.3 35.7 Median 39.3 39.6 39.0 34.7 36.0 33.2
Total 12,984 6,536 6,448 14,076 7,191 6,885 Total 5,392 2,942 2,450 6,114 3,334 2,780
SITKA CITY AND BOROUGH HOONAH-ANGOON CENSUS AREAJuly 1, 2009 April 1, 2000 July 1, 2009 April 1, 2000
Age Total Male Female Total Male Female Age Total Male Female Total Male Female
0-4 613 352 261 565 318 247 0-4 129 70 59 138 70 685-9 591 303 288 669 326 343 5-9 115 46 69 204 118 8610-14 558 293 265 730 348 382 10-14 121 63 58 240 114 12615-19 608 317 291 689 377 312 15-19 147 88 59 229 121 10820-24 401 165 236 573 308 265 20-24 88 49 39 132 67 6525-29 438 216 222 533 262 271 25-29 96 48 48 112 62 5030-34 595 300 295 626 318 308 30-34 121 61 60 139 89 5035-39 596 299 297 729 376 353 35-39 91 52 39 226 114 11240-44 629 327 302 844 419 425 40-44 126 64 62 238 134 10445-49 683 354 329 774 395 379 45-49 184 97 87 246 125 12150-54 777 386 391 592 310 282 50-54 187 111 76 226 130 9655-59 655 350 305 415 228 187 55-59 218 111 107 147 86 6160-64 518 274 244 352 182 170 60-64 155 101 54 118 69 4965-69 306 158 148 261 127 134 65-69 107 60 47 67 48 1970-74 262 115 147 194 103 91 70-74 77 43 34 44 22 2275-79 150 59 91 144 64 80 75-79 39 23 16 35 19 1680-84 122 35 87 67 24 43 80-84 14 7 7 17 5 1285-90 81 19 62 49 13 36 85-90 15 6 9 9 3 690+ 44 6 38 29 7 22 90+ 13 1 12 7 2 5
16+ 6,784 3,346 3,438 6,733 3,443 3,290 16+ 1,653 907 746 1,945 1,070 87518+ 6,538 3,227 3,311 6,436 3,293 3,143 18+ 1,588 867 721 1,831 1,013 81865+ 965 392 573 744 338 406 65+ 265 140 125 179 99 80Median 39.3 38.6 39.9 35.2 34.9 35.5 Median 44.7 45.5 43.2 37.1 37.5 36.6
Total 8,627 4,328 4,299 8,835 4,505 4,330 Total 2,043 1,101 942 2,574 1,398 1,176
Note: No adjustments have been made here for Census Bureau corrections to the 2000 Census.Sources: U.S. Census Bureau and Alaska Department of Labor and Workforce Development, Research and Analysis Section, Demographics Unit

Alaska Population Digest • 2009 Estimates 43
Table 2.7 (continued)Alaska Region and Borough/Census Area Population by Age and Sex, 2000, 2009
SKAGWAY MUNICIPALITY YAKUTAT CENSUS AREAJuly 1, 2009 April 1, 2000 July 1, 2009 April 1, 2000
Age Total Male Female Total Male Female Age Total Male Female Total Male Female
0-4 48 23 25 40 18 22 0-4 37 16 21 39 18 215-9 34 14 20 65 29 36 5-9 42 21 21 79 46 3310-14 36 18 18 44 24 20 10-14 45 22 23 66 32 3415-19 48 20 28 34 18 16 15-19 60 29 31 60 37 2320-24 22 12 10 39 22 17 20-24 32 15 17 26 14 1225-29 55 27 28 72 34 38 25-29 30 19 11 35 17 1830-34 83 40 43 76 42 34 30-34 35 20 15 59 31 2835-39 81 41 40 74 41 33 35-39 49 22 27 80 49 3140-44 72 40 32 76 42 34 40-44 51 30 21 89 59 3045-49 59 34 25 98 61 37 45-49 44 26 18 94 62 3250-54 81 43 38 79 40 39 50-54 49 29 20 69 41 2855-59 88 52 36 59 24 35 55-59 59 34 25 40 31 960-64 72 39 33 33 20 13 60-64 37 19 18 29 18 1165-69 36 18 18 23 13 10 65-69 23 17 6 18 10 870-74 21 13 8 22 10 12 70-74 16 7 9 14 8 675-79 12 4 8 15 6 9 75-79 10 1 9 10 5 580-84 10 5 5 7 5 2 80-84 7 1 6 0 0 085-90 7 2 5 3 1 2 85-90 2 0 2 1 1 090+ 0 0 0 3 0 3 90+ 0 0 0 0 0 0
16+ 736 384 352 704 375 329 16+ 490 260 230 606 369 23718+ 709 373 336 685 363 322 18+ 463 252 211 581 359 22265+ 86 42 44 73 35 38 65+ 58 26 32 43 24 19Median 41.8 43.4 39.8 39.1 39.6 38.5 Median 38.4 40.0 37.0 37.2 39.6 33.9
Total 865 445 420 862 450 412 Total 628 328 300 808 479 329
PETERSBURG CENSUS AREA WRANGELL CITY AND BOROUGHJuly 1, 2009 April 1, 2000 July 1, 2009 April 1, 2000
Age Total Male Female Total Male Female Age Total Male Female Total Male Female
0-4 224 117 107 297 157 140 0-4 112 60 52 149 81 685-9 253 132 121 332 164 168 5-9 114 59 55 181 94 8710-14 289 155 134 425 217 208 10-14 140 79 61 241 131 11015-19 279 139 140 309 169 140 15-19 157 81 76 171 90 8120-24 216 114 102 183 96 87 20-24 113 68 45 84 47 3725-29 155 76 79 224 118 106 25-29 82 47 35 99 46 5330-34 212 112 100 318 171 147 30-34 79 42 37 135 61 7435-39 227 108 119 318 162 156 35-39 109 56 53 177 84 9340-44 258 137 121 427 208 219 40-44 116 53 63 249 126 12345-49 285 144 141 395 219 176 45-49 171 86 85 237 129 10850-54 352 168 184 330 178 152 50-54 211 116 95 180 93 8755-59 341 195 146 218 124 94 55-59 173 100 73 142 76 6660-64 259 138 121 130 72 58 60-64 139 76 63 122 72 5065-69 167 99 68 83 44 39 65-69 110 56 54 81 44 3770-74 94 55 39 98 48 50 70-74 89 50 39 75 38 3775-79 70 30 40 91 43 48 75-79 64 34 30 49 22 2780-84 59 20 39 44 20 24 80-84 33 12 21 41 20 2185-90 36 10 26 23 12 11 85-90 22 8 14 26 7 1990+ 18 8 10 15 5 10 90+ 24 2 22 9 2 7
16+ 2,974 1,518 1,456 3,128 1,641 1,487 16+ 1,653 871 782 1,838 939 89918+ 2,835 1,456 1,379 2,973 1,557 1,416 18+ 1,581 828 753 1,750 894 85665+ 444 222 222 354 172 182 65+ 342 162 180 281 133 148Median 40.8 40.9 40.7 35.7 35.7 35.7 Median 45.2 44.9 45.6 39.6 39.9 39.4
Total 3,794 1,957 1,837 4,260 2,227 2,033 Total 2,058 1,085 973 2,448 1,263 1,185
Note: No adjustments have been made here for Census Bureau corrections to the 2000 Census.Sources: U.S. Census Bureau and Alaska Department of Labor and Workforce Development, Research and Analysis Section, Demographics Unit

Alaska Population Digest • 2009 Estimates44
Table 2.7 (continued)Alaska Region and Borough/Census Area Population by Age and Sex, 2000, 2009
SOUTHWEST REGION ALEUTIANS EAST BOROUGHJuly 1, 2009 April 1, 2000 July 1, 2009 April 1, 2000
Age Total Male Female Total Male Female Age Total Male Female Total Male Female
0-4 4,140 2,189 1,951 4,034 2,141 1,893 0-4 91 51 40 116 60 565-9 3,917 2,103 1,814 4,060 2,125 1,935 5-9 97 54 43 117 61 5610-14 3,743 1,958 1,785 3,925 2,084 1,841 10-14 94 46 48 131 68 6315-19 3,677 1,909 1,768 3,089 1,619 1,470 15-19 116 73 43 156 95 6120-24 2,770 1,443 1,327 2,441 1,318 1,123 20-24 209 149 60 208 136 7225-29 2,410 1,294 1,116 2,497 1,372 1,125 25-29 301 212 89 190 125 6530-34 2,650 1,583 1,067 3,176 1,855 1,321 30-34 363 284 79 280 198 8235-39 2,457 1,446 1,011 3,566 2,098 1,468 35-39 331 254 77 367 269 9840-44 2,722 1,565 1,157 3,295 1,918 1,377 40-44 340 222 118 303 210 9345-49 2,947 1,715 1,232 2,756 1,581 1,175 45-49 358 225 133 285 178 10750-54 2,472 1,392 1,080 2,150 1,282 868 50-54 179 112 67 252 164 8855-59 1,883 1,018 865 1,480 831 649 55-59 127 75 52 141 88 5360-64 1,277 732 545 922 502 420 60-64 86 54 32 80 51 2965-69 851 430 421 690 346 344 65-69 38 22 16 36 24 1270-74 517 260 257 484 267 217 70-74 24 13 11 15 11 475-79 395 161 234 324 175 149 75-79 12 8 4 12 8 480-84 226 82 144 187 82 105 80-84 8 4 4 8 4 485-90 130 45 85 87 35 52 85-90 4 2 2 0 0 090+ 77 23 54 36 19 17 90+ 0 0 0 0 0 0
16+ 26,704 14,697 12,007 26,508 14,952 11,556 16+ 2,478 1,696 782 2,312 1,551 76118+ 25,128 13,903 11,225 25,195 14,289 10,906 18+ 2,433 1,671 762 2,243 1,514 72965+ 2,196 1,001 1,195 1,808 924 884 65+ 86 49 37 71 47 24Median 27.9 29.1 26.4 29.1 30.4 27.3 Median 36.8 36.2 38.7 37.0 37.5 36.1
Total 39,261 21,348 17,913 39,199 21,650 17,549 Total 2,778 1,860 918 2,697 1,750 947
ALEUTIANS WEST CENSUS AREA BETHEL CENSUS AREAJuly 1, 2009 April 1, 2000 July 1, 2009 April 1, 2000
Age Total Male Female Total Male Female Age Total Male Female Total Male Female
0-4 190 102 88 257 129 128 0-4 2,099 1,091 1,008 1,915 1,041 8745-9 188 110 78 248 137 111 5-9 1,992 1,079 913 1,888 988 90010-14 198 90 108 266 139 127 10-14 1,824 957 867 1,717 926 79115-19 203 119 84 260 139 121 15-19 1,718 860 858 1,345 691 65420-24 242 153 89 336 209 127 20-24 1,185 572 613 1,065 550 51525-29 317 206 111 451 307 144 25-29 1,006 485 521 1,019 523 49630-34 558 416 142 751 529 222 30-34 958 484 474 1,137 609 52835-39 519 376 143 726 496 230 35-39 893 443 450 1,307 698 60940-44 545 367 178 674 467 207 40-44 978 531 447 1,157 617 54045-49 530 358 172 562 370 192 45-49 1,075 601 474 967 534 43350-54 429 292 137 460 312 148 50-54 954 486 468 732 419 31355-59 291 173 118 203 132 71 55-59 769 406 363 599 320 27960-64 210 130 80 146 87 59 60-64 532 292 240 327 165 16265-69 69 38 31 58 28 30 65-69 400 198 202 302 141 16170-74 27 14 13 37 20 17 70-74 217 111 106 215 122 9375-79 16 7 9 17 10 7 75-79 189 66 123 144 77 6780-84 12 4 8 6 0 6 80-84 107 43 64 106 47 5985-90 4 0 4 6 2 4 85-90 57 20 37 46 20 2690+ 1 0 1 1 0 1 90+ 44 13 31 18 12 6
16+ 3,925 2,620 1,305 4,630 3,071 1,559 16+ 10,738 5,427 5,311 10,207 5,392 4,81518+ 3,856 2,589 1,267 4,526 3,028 1,498 18+ 9,998 5,060 4,938 9,629 5,104 4,52565+ 129 63 66 125 60 65 65+ 1,014 451 563 831 419 412Median 38.6 38.7 38.4 36.1 36.7 34.9 Median 23.7 23.3 23.9 25.4 25.5 25.2
Total 4,549 2,955 1,594 5,465 3,513 1,952 Total 16,997 8,738 8,259 16,006 8,500 7,506
Note: No adjustments have been made here for Census Bureau corrections to the 2000 Census.Sources: U.S. Census Bureau and Alaska Department of Labor and Workforce Development, Research and Analysis Section, Demographics Unit
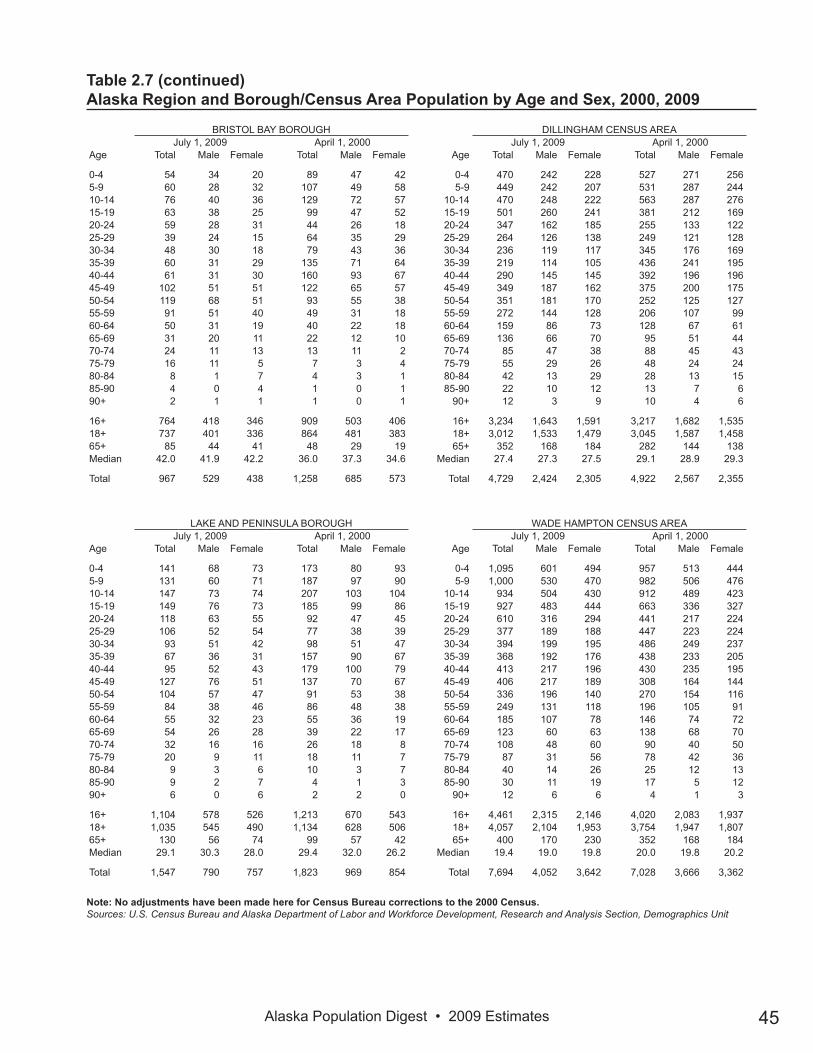
Alaska Population Digest • 2009 Estimates 45
Table 2.7 (continued)Alaska Region and Borough/Census Area Population by Age and Sex, 2000, 2009
BRISTOL BAY BOROUGH DILLINGHAM CENSUS AREAJuly 1, 2009 April 1, 2000 July 1, 2009 April 1, 2000
Age Total Male Female Total Male Female Age Total Male Female Total Male Female
0-4 54 34 20 89 47 42 0-4 470 242 228 527 271 2565-9 60 28 32 107 49 58 5-9 449 242 207 531 287 24410-14 76 40 36 129 72 57 10-14 470 248 222 563 287 27615-19 63 38 25 99 47 52 15-19 501 260 241 381 212 16920-24 59 28 31 44 26 18 20-24 347 162 185 255 133 12225-29 39 24 15 64 35 29 25-29 264 126 138 249 121 12830-34 48 30 18 79 43 36 30-34 236 119 117 345 176 16935-39 60 31 29 135 71 64 35-39 219 114 105 436 241 19540-44 61 31 30 160 93 67 40-44 290 145 145 392 196 19645-49 102 51 51 122 65 57 45-49 349 187 162 375 200 17550-54 119 68 51 93 55 38 50-54 351 181 170 252 125 12755-59 91 51 40 49 31 18 55-59 272 144 128 206 107 9960-64 50 31 19 40 22 18 60-64 159 86 73 128 67 6165-69 31 20 11 22 12 10 65-69 136 66 70 95 51 4470-74 24 11 13 13 11 2 70-74 85 47 38 88 45 4375-79 16 11 5 7 3 4 75-79 55 29 26 48 24 2480-84 8 1 7 4 3 1 80-84 42 13 29 28 13 1585-90 4 0 4 1 0 1 85-90 22 10 12 13 7 690+ 2 1 1 1 0 1 90+ 12 3 9 10 4 6
16+ 764 418 346 909 503 406 16+ 3,234 1,643 1,591 3,217 1,682 1,53518+ 737 401 336 864 481 383 18+ 3,012 1,533 1,479 3,045 1,587 1,45865+ 85 44 41 48 29 19 65+ 352 168 184 282 144 138Median 42.0 41.9 42.2 36.0 37.3 34.6 Median 27.4 27.3 27.5 29.1 28.9 29.3
Total 967 529 438 1,258 685 573 Total 4,729 2,424 2,305 4,922 2,567 2,355
LAKE AND PENINSULA BOROUGH WADE HAMPTON CENSUS AREAJuly 1, 2009 April 1, 2000 July 1, 2009 April 1, 2000
Age Total Male Female Total Male Female Age Total Male Female Total Male Female
0-4 141 68 73 173 80 93 0-4 1,095 601 494 957 513 4445-9 131 60 71 187 97 90 5-9 1,000 530 470 982 506 47610-14 147 73 74 207 103 104 10-14 934 504 430 912 489 42315-19 149 76 73 185 99 86 15-19 927 483 444 663 336 32720-24 118 63 55 92 47 45 20-24 610 316 294 441 217 22425-29 106 52 54 77 38 39 25-29 377 189 188 447 223 22430-34 93 51 42 98 51 47 30-34 394 199 195 486 249 23735-39 67 36 31 157 90 67 35-39 368 192 176 438 233 20540-44 95 52 43 179 100 79 40-44 413 217 196 430 235 19545-49 127 76 51 137 70 67 45-49 406 217 189 308 164 14450-54 104 57 47 91 53 38 50-54 336 196 140 270 154 11655-59 84 38 46 86 48 38 55-59 249 131 118 196 105 9160-64 55 32 23 55 36 19 60-64 185 107 78 146 74 7265-69 54 26 28 39 22 17 65-69 123 60 63 138 68 7070-74 32 16 16 26 18 8 70-74 108 48 60 90 40 5075-79 20 9 11 18 11 7 75-79 87 31 56 78 42 3680-84 9 3 6 10 3 7 80-84 40 14 26 25 12 1385-90 9 2 7 4 1 3 85-90 30 11 19 17 5 1290+ 6 0 6 2 2 0 90+ 12 6 6 4 1 3
16+ 1,104 578 526 1,213 670 543 16+ 4,461 2,315 2,146 4,020 2,083 1,93718+ 1,035 545 490 1,134 628 506 18+ 4,057 2,104 1,953 3,754 1,947 1,80765+ 130 56 74 99 57 42 65+ 400 170 230 352 168 184Median 29.1 30.3 28.0 29.4 32.0 26.2 Median 19.4 19.0 19.8 20.0 19.8 20.2
Total 1,547 790 757 1,823 969 854 Total 7,694 4,052 3,642 7,028 3,666 3,362
Note: No adjustments have been made here for Census Bureau corrections to the 2000 Census.Sources: U.S. Census Bureau and Alaska Department of Labor and Workforce Development, Research and Analysis Section, Demographics Unit

Alaska Population Digest • 2009 Estimates46
Table 2.8 Personal Income by Alaska Region and Borough/Census Area, 1990, 1995, 2000, 2008
Income (thousands of dollars) Percent of State 1990-2008
Area Name 2008 2000 1995 1990 2008 2000 1990Change in
Income
Avg. Ann. Pct. Rate
of Change
Alaska 30,223,608 19,157,931 15,580,461 12,501,188 100.00 100.00 100.00 17,722,420 7.46
Anchorage/Mat-Su Region 17,267,201 10,552,007 8,360,022 6,596,345 57.13 55.08 53.66 10,670,856 8.51
Anchorage Municipality 13,968,983 8,961,292 7,228,409 5,826,156 46.22 46.78 46.39 8,142,827 7.36 Matanuska-Susitna Borough 3,298,218 1,590,715 1,131,613 770,189 10.91 8.30 7.26 2,528,029 17.28
Gulf Coast Region 3,119,760 2,133,917 1,726,196 1,402,485 10.32 11.14 11.08 1,717,275 6.44
Kenai Peninsula Borough 2,145,309 1,433,132 1,131,063 877,895 7.10 7.48 7.26 1,267,414 7.60 Kodiak Island Borough 548,099 381,665 325,577 287,223 1.81 1.99 2.09 260,876 4.78 Valdez-Cordova Census Area 426,352 319,120 269,556 237,367 1.41 1.67 1.73 188,985 4.19
Interior Region 4,403,927 2,697,706 2,189,713 1,753,157 14.57 14.08 14.05 2,650,770 7.96
Fairbanks North Star Borough 3,832,653 2,352,634 1,898,043 1,533,457 12.68 12.28 12.18 2,299,196 7.89 Southeast Fairbanks Census Area 296,383 144,331 126,707 97,989 0.98 0.75 0.81 198,394 10.66 Yukon-Koyukuk Census Area /1 274,891 200,741 164,963 121,711 0.91 1.05 1.06 153,180 6.62 -Denali Borough /2 96,752 71,401 48,459 (N) 0.32 0.37 (N) (N) (N) -Yukon-Koyukuk Census Area /3 178,139 129,340 116,504 121,711 0.59 0.68 0.75 56,428 2.44
Northern Region 991,176 582,101 496,757 370,322 3.28 3.04 3.19 620,854 8.82
Nome Census Area 310,128 199,606 171,249 127,796 1.03 1.04 1.10 182,332 7.51 North Slope Borough 448,316 218,927 201,674 147,122 1.48 1.14 1.29 301,194 10.77 Northwest Arctic Borough 232,732 163,568 123,834 95,404 0.77 0.85 0.79 137,328 7.58
Southeast Region 3,243,587 2,382,892 2,083,575 1,638,153 10.73 12.44 13.37 1,605,434 5.2
Haines Borough 123,068 79,635 63,932 55,318 0.41 0.42 0.41 67,750 6.4 Juneau City and Borough 1,501,057 1,096,894 936,706 717,579 4.97 5.73 6.01 783,478 5.7 Ketchikan Gateway Borough 680,241 493,887 466,403 389,926 2.25 2.58 2.99 290,315 3.9 Prince of Wales-Outer Ketch. C.A. 157,844 132,471 124,372 115,709 0.52 0.69 0.80 42,135 1.9 Sitka City and Borough 364,748 262,481 221,107 193,420 1.21 1.37 1.42 171,328 4.7 Skagway-Yakutat-Angoon C.A. /4 168,500 127,594 105,403 (N) 0.56 0.67 0.68 (N) (N) -Skagway-Hoonah-Angoon C.A. /5 (N) 104,492 84,881 (N) (N) 0.55 (N) (N) (N) -Hoonah-Angoon C.A. 83,061 (N) (N) (N) 0.27 (N) (N) (N) (N) -Skagway Municipality 56,730 (N) (N) (N) 0.19 (N) (N) (N) (N) -Yakutat City and Borough /6 28,709 23,102 20,522 (N) 0.09 0.12 (N) (N) (N) Wrangell-Petersburg Census Area 248,129 189,930 165,652 166,201 0.82 0.99 1.06 81,928 2.6
Southwest Region 1,197,957 809,308 724,198 648,020 3.96 4.22 4.65 549,937 4.5
Aleutians East Borough 87,625 59,100 53,057 45,699 0.29 0.31 0.34 41,926 4.8 Aleutians West Census Area 166,328 115,814 161,724 202,539 0.55 0.60 1.04 (36,211) -0.9 Bethel Census Area 499,407 318,840 261,795 193,642 1.65 1.66 1.68 305,765 8.3 Bristol Bay Borough 51,270 42,593 43,158 45,905 0.17 0.22 0.28 5,365 0.6 Dillingham Census Area 184,117 132,487 101,120 99,673 0.61 0.69 0.65 84,444 4.5 Lake and Peninsula Borough 54,777 40,102 30,944 (N) 0.18 0.21 (N) (N) (N) Wade Hampton Census Area 154,433 100,372 72,400 60,562 0.51 0.52 0.46 93,871 8.2
Notes:(N) indicates that income figures were not available for these places in this year. Percentages will generally not add to 100, since some areas are included twice.Income data source: U.S. Department of Commerce, Bureau of Economic Analysis. The income data in this table do not match data in Table 2.7 in the 1998 and earlier Population Overviews because the BEA has changed its income definitions. One example of this is that government pensions have been included in personal income to match the handling of private pensions. All income data are in current dollars; that is, the amounts have not been adjusted for inflation./1 Denali Borough was included in the Yukon-Koyukuk Census Area until 1991. For continuity, this line shows the old definition, including Denali Borough./2 Denali Borough was incorporated December 7, 1990./3 This line shows the new definition of the Yukon-Koyukuk Census Area, excluding the Denali Borough./4 Yakutat was included in this Census Area until 1992. For continuity, this line shows the old definition, including Yakutat./5 This line shows the new definition of the Skagway-Hoonah-Angoon Census Area, excluding Yakutat./6 Yakutat Borough was incorporated September 22, 1992./7 Lake and Peninsula Borough was incorporated April 24, 1989. Income data are not available for 1990 for this area.Sources: U.S. Census Bureau and Alaska Department of Labor and Workforce Development, Research and Analysis Section, Demographics Unit

Alaska Population Digest • 2009 Estimates 47
Table 2.8 Personal Income by Alaska Region and Borough/Census Area, 1990, 1995, 2000, 2008
Table 2.9Per Capita Income by Alaska Region and Borough/Census Area, 1990, 1995, 2000, 2008
Per Capita Income 2000-2008 1990-2008
Area Name 2008 2000 1995 1990 Change
Avg. Ann. Pct. Rate
of Change Change
Avg. Ann. Pct. Rate
of Change
Alaska 44,318 30,558 25,899 22,728 13,759 5.00 21,590 5.00
Anchorage/Mat-Su Region 47,134 33,016 27,716 24,796 14,118 4.75 22,338 4.74
Anchorage Municipality 49,202 34,429 28,601 25,741 14,773 4.77 23,461 4.80 Matanuska-Susitna Borough 40,013 26,815 23,139 19,409 13,198 5.47 20,604 5.59
Gulf Coast Region 40,830 28,915 24,255 21,892 8,488 3.26 18,938 4.55
Kenai Peninsula Borough 40,509 28,841 24,639 21,516 11,668 4.50 18,993 4.65 Kodiak Island Borough 39,279 27,432 21,929 21,581 11,847 4.80 17,698 4.32 Valdez-Cordova Census Area 44,903 31,302 25,879 23,851 13,601 4.83 21,052 4.65
Interior Region 41,005 27,692 22,766 19,033 13,313 5.34 21,972 6.08
Fairbanks North Star Borough 41,317 28,400 23,274 19,731 12,917 5.05 21,587 5.76 Southeast Fairbanks Census Area 41,400 23,377 19,779 16,572 18,023 8.57 24,828 7.89 Yukon-Koyukuk Census Area /1 36,755 23,889 20,054 14,356 12,866 5.98 22,399 8.21 -Denali Borough /2 53,573 37,718 26,394 (N) 15,854 4.67 (N) (N) -Yukon-Koyukuk Census Area /3 31,401 19,868 18,232 18,128 11,533 6.45 13,273 3.85
Northern Region 42,004 24,469 22,173 18,171 17,535 7.96 23,833 6.90
Nome Census Area 32,669 21,706 19,257 15,419 10,963 5.61 17,250 5.89 North Slope Borough 66,883 29,645 29,144 24,606 37,238 13.96 42,276 9.04 Northwest Arctic Borough 31,446 22,693 18,788 15,607 8,753 4.29 15,839 5.34
Southeast Region 46,898 32,606 28,518 23,745 14,292 4.87 23,153 5.13
Haines Borough 53,001 33,292 28,040 26,130 19,709 6.58 26,870 5.41 Juneau City and Borough 49,369 35,717 32,638 26,824 13,652 4.25 22,544 4.42 Ketchikan Gateway Borough 52,407 35,130 31,591 28,198 17,277 5.46 24,209 4.52 Prince of Wales-Outer Ketch. C.A. 29,459 21,516 18,469 18,431 7,944 4.10 11,029 3.15 Sitka City and Borough 42,211 29,709 24,933 22,522 12,502 4.68 19,689 4.60 Skagway-Yakutat-Angoon C.A. /4 48,143 30,065 23,335 (N) 18,078 6.68 (N) (N) -Skagway-Hoonah-Angoon C.A. /5 (N) 30,411 22,653 (N) (N) (N) (N) (N) -Hoonah-Angoon C.A. 40,282 (N) (N) (N) (N) (N) (N) (N) -Skagway Municipality 67,057 (N) (N) (N) (N) (N) (N) (N) -Yakutat City and Borough /6 48,495 28,592 26,652 (N) 19,903 7.73 (N) (N) Wrangell-Petersburg Census Area 41,653 28,416 23,014 23,601 13,238 5.18 18,052 4.03
Southwest Region 30,663 20,625 19,505 16,841 10,038 5.41 13,823 4.32
Aleutians East Borough 32,478 21,913 23,750 18,547 10,565 5.36 13,931 3.95 Aleutians West Census Area 37,495 21,192 28,619 21,369 16,303 8.55 16,126 3.97 Bethel Census Area 29,509 19,870 17,204 14,180 9,638 5.39 15,329 5.69 Bristol Bay Borough 49,922 33,858 36,298 32,557 16,064 5.27 17,365 2.81 Dillingham Census Area 38,623 26,917 23,039 24,844 11,706 4.83 13,780 2.92 Lake and Peninsula Borough /7 35,294 21,998 17,040 (N) 13,297 6.72 (N) (N) Wade Hampton Census Area 20,150 14,282 10,917 10,458 5,869 4.57 9,692 4.88
Notes:Per capita estimates are produced by dividing BEA Total Personal Income data by the Alaska Department of Labor estimated population for the year. These estimates may differ slightly from the BEA estimates, which rely on the Census Bureau population estimates.(N) indicates that income figures were not available for these places in this year. Percentages will generally not add to 100, since some areas are included twice.Income data source: U.S. Department of Commerce, Bureau of Economic Analysis. The income data in this table do not match data in Table 2.7 in the 1998 and earlier Population Overviews because the BEA has changed its income definitions. One example of this is that government pensions have been included in personal income to match the handling of private pensions. These revisions have increased personal income in Alaska by 5% to 7%.All income data are in current dollars; the amounts have not been adjusted for inflation./1 Denali Borough was included in the Yukon-Koyukuk Census Area until 1991. For continuity, this line shows the old definition, including Denali Borough./2 Denali Borough was incorporated December 7, 1990./3 This line shows the new definition of the Yukon-Koyukuk Census Area, excluding the Denali Borough./4 Yakutat was included in this Census Area until 1992. For continuity, this line shows the old definition, including Yakutat./5 This line shows the new definition of the Skagway-Hoonah-Angoon Census Area, excluding Yakutat./6 Yakutat Borough was incorporated September 22, 1992./7 Lake and Peninsula Borough was incorporated April 24, 1989. Income data are not available for 1990 for this area.Sources: U.S. Census Bureau and Alaska Department of Labor and Workforce Development, Research and Analysis Section, Demographics Unit

Alaska Population Digest • 2009 Estimates48
Introduction As with Alaska Population Overview, estimates are pre-sented here for different special populations or special geographic areas.
Armed Forces (Tables 3.1, 3.2)•In 2009, the number of active duty military person-nel was 24,449, representing 4.7% of the labor force. •Despite the decrease in military presence, the Armed Forces remain one of the largest employers, providing nearly as many jobs in Alaska as the top ten private sector employers in 2009 combined (24,625). •The number of military stationed in the state exceeds the number employed by other large public sector employers, including the State of Alaska (18,139), fed-eral government (17,065) and the University of Alaska (7,218). •The number of full time military plus their depen-dents stationed in Alaska in 2009 totaled 58,346, a 37% increase since 2000.•The Army represented the largest military presence in the state, with 54% of the active duty members and dependents. •The Municipality of Anchorage and the Fairbanks North Star Borough were home to 90% of all military and dependents assigned in Alaska.•Military and their families accounted for almost 23% of the residents in Fairbanks North Star Borough.
Alaska Native Regional Corporation Estimates(Table 3.3)•The Alaska Native Regional Corporations with the largest Native populations in 2009 were: Cook Inlet (37,357), Calista (20,723), Doyon (12,999) and Seal-aska (11,102). •Two of the 12 ANRC’s had Native American popula-tions comprising at least three quarters of their total population, Calista (84%) and NANA (79%). •From 2000 to 2009, the population of Native Ameri-cans increased the most in the following ANRC’s: Cook Inlet (12,062), Doyon (1,766), Calista (1,033), and Ber-ing Straits (113). •The largest decreases in Native American populations were in Bristol Bay (-650), Arctic Slope (-487), Aleut (-386) and Sealaska (-290).
School Districts (Table 3.5)•The American Community Survey (ACS) indicates that in 2008, Alaska placed second in the ranking of states for high school graduates for those over the age of 25 at 91.6%.
•The ACS also indicated that in 2008, Alaska ranked 23rd in the proportion of its population that had com-pleted college at 27.3%. •Of the 53 Alaska School Districts in 2009, the An-chorage School District had the largest population, with 290,588 people, or 42% of the state’s population. •The Pelican School District had the fewest people, with only 122 people, or 0.02% of the state’s total population, lived there. •For the most recent one-year period, 2008-2009, 26 of Alaska’s 53 school districts (49%) were estimated to have lost population while the total state population increased by 1.5%.•The largest decreases in population were in the following districts: Chugach (-7.8%), Hoonah City (-6.2%), Bristol Bay Borough (-5.8%), Kake City (-4.2%), Valdez City (-4.2%), Yukon/Koyukuk (-3.3%), Dillingham City (-3.0%), Galena City (-2.9%), Aleutians Region (-2.8%) and Nome City (-2.7%). •School districts showing the largest percentage population growth were: Pelican City (8.9%), Yakutat (6.1%), Alaska Gateway (3.9%), Saint Mary’s (3.4%), Unalaska City (3.2%), Aleutians East (3.0%), Kashu-namiut (2.7%), Chatham (2.6%), Anchorage (2.4%) and Southeast Island (2.3%).
Population of Areas Neighboring Alaska (Table 3.6)•The areas of British Columbia (59,460) and the Yu-kon (34,175) adjacent to Southeast contain 93,635 persons compared to the 69,338 population of South-east Alaska.
Chapter 3Special Populations and Areas
Figure 3.1, Alaska Military and Civilian Popula-tion by Age and Sex, 2000, was omitted. It can
be found in the Alaska Population Overview 2009 Estimates.

Alaska Population Digest • 2009 Estimates 49
Table 3.1Military Population in Alaska, 2000, 2009
July 1, 2009 July 1, 2000
Area NameNumber
of Military
Percent ofArea
PopulationNumber
of Military
Percent ofArea
Population
ALASKA 24,449 3.5 17,574 2.8
Aleutians East Borough 0 0.0 0 0.0 Aleutians West Census Area 66 1.5 40 0.7 Anchorage Municipality 12,688 4.4 8,630 3.3 Bethel Census Area 0 0.0 0 0.0 Bristol Bay Borough 0 0.0 0 0.0 Denali Borough 93 5.1 132 7.0 Dillingham Census Area 0 0.0 0 0.0 Fairbanks North Star Borough 9,434 10.1 6,861 8.3 Haines Borough 0 0.0 0 0.0 Juneau City and Borough 265 0.9 192 0.6 Kenai Peninsula Borough 76 0.1 97 0.2 Ketchikan Gateway Borough 253 1.9 222 1.6 Kodiak Island Borough 975 7.0 913 6.6 Lake and Peninsula Borough 0 0.0 0 0.0 Matanuska-Susitna Borough 0 0.0 0 0.0 Nome Census Area 27 0.3 23 0.3 North Slope Borough 0 0.0 0 0.0 Northwest Arctic Borough 0 0.0 0 0.0 Prince Of Wales-Outer Ketchikan C.A. 0 0.0 0 0.0 Sitka City and Borough 199 2.3 183 2.1 Skagway-Hoonah-Angoon Census Area 0 0.0 0 0.0 Southeast Fairbanks Census Area 202 2.8 166 2.7 Valdez-Cordova Census Area 144 1.6 95 0.9 Wade Hampton Census Area 0 0.0 0 0.0 Wrangell-Petersburg Census Area 27 0.5 20 0.3 Yakutat Borough 0 0.0 0 0.0 Yukon-Koyukuk Census Area 0 0.0 0 0.0
Note: Area populations are based on the military location where assigned and not the place of residence. C.A.=Census AreaSource: Alaska Department of Labor & Workforce Development, Research and Analysis Section, Demo-graphics Unit

Alaska Population Digest • 2009 Estimates50
Table 3.3Population Estimates for Alaska Native Regional Corporation Areas, By Race, 2000, 2009
July 1, 2009 April 1, 2000
Area NameTotal 2009
One RaceAloneNative
American
Alone or inCombination
NativeAmerican Total
One RaceAloneNative
American
Alone or inCombination
NativeAmerican
ALASKA 692,314 111,873 138,429 626,931 98,740 117,950
Alaska Native Regional Corporations 690,929 110,740 137,287 625,489 97,560 119,241
AHTNA 3,761 725 835 3,690 712 890Aleut 7,327 1,772 1,866 8,162 2,158 2,274Arctic Slope 6,798 4,583 4,963 7,385 5,070 5,453Bering Straits 9,500 7,042 7,449 9,196 6,929 7,274Bristol Bay 7,123 4,715 5,054 7,891 5,365 5,749Calista 24,691 20,723 21,668 23,074 19,690 20,353Chugach 11,560 1,800 2,363 12,087 1,707 2,165Cook Inlet 422,851 37,357 52,720 364,220 25,295 35,972Doyon 108,141 12,999 16,963 97,151 11,233 14,128Koniag 13,860 2,082 2,496 13,913 2,048 2,452NANA 7,366 5,841 6,097 7,208 5,961 6,181Sealaska 67,951 11,102 14,813 71,512 11,392 15,059
American Indian Reservations - Annette Island Reserve 1,385 1,133 1,142 1,442 1,180 1,291
Source: Alaska Department of Labor & Workforce Development, Research and Analysis Section, Demographics unit.
Table 3.2Military and Dependent Population in Alaska, 2000, 2009
July 1, 2009 July 1, 2000
Area Name
Number of Military and dependents
Percent ofArea
Population
Number of Military and dependents
Percent ofArea
Population
ALASKA 58,346 8.4 42,592 6.8
Aleutians East Borough 0 0.0 0 0.0 Aleutians West Census Area 66 1.5 43 0.8 Anchorage Municipality 31,076 10.7 20,884 8.0 Bethel Census Area 0 0.0 0 0.0 Bristol Bay Borough 0 0.0 0 0.0 Denali Borough 338 18.4 133 7.0 Dillingham Census Area 0 0.0 0 0.0 Fairbanks North Star Borough 21,447 22.9 15,964 19.3 Haines Borough 0 0.0 0 0.0 Juneau City and Borough 750 2.4 605 2.0 Kenai Peninsula Borough 179 0.3 216 0.4 Ketchikan Gateway Borough 548 4.2 506 3.6 Kodiak Island Borough 2,499 18.0 3,081 22.1 Lake and Peninsula Borough 0 0.0 0 0.0 Matanuska-Susitna Borough 0 0.0 0 0.0 Nome Census Area 27 0.3 23 0.3 North Slope Borough 0 0.0 0 0.0 Northwest Arctic Borough 0 0.0 0 0.0 Prince Of Wales-Outer Ketchikan C.A. 0 0.0 0 0.0 Sitka City and Borough 474 5.5 473 5.4 Skagway-Hoonah-Angoon Census Area 0 0.0 0 0.0 Southeast Fairbanks Census Area 521 7.2 377 6.1 Valdez-Cordova Census Area 354 3.8 245 2.4 Wade Hampton Census Area 0 0.0 0 0.0 Wrangell-Petersburg Census Area 67 1.1 42 0.6 Yakutat Borough 0 0.0 0 0.0 Yukon-Koyukuk Census Area 0 0.0 0 0.0
Note: Area populations are based on the military location where assigned and not the place of residence. C.A.=Census AreaSource: Alaska Department of Labor & Workforce Development, Research and Analysis Section, Demographics Unit
Table 3.4, Population by House and Senate District, 2000, 2008; Registered Voters by Party and General Election Results, 2008, was omitted. It can be found in the
Alaska Population Overview 2009 Estimates.

Alaska Population Digest • 2009 Estimates 51
Table 3.5Population Estimates for Alaska School Districts and Level of Education, 1990, 2000, 2005, 2009
School DistrictsJuly 1,
2009Percentof State
July 1,2005
April 12000
April 11990
Change2000-2008
Change1990-2000
Percent Persons 25+ H.S.
Grads2000
Percent Persons
25+ College
Grads 2000
ALASKA 692,314 664,334 626,931 550,043 65,383 76,888 88.3% 24.7%
Alaska Gateway Schools 2,545 0.37% 2,483 2,486 1,998 59 488 81.6% 15.0% Aleutian Region School District 1/ 317 0.05% 325 498 5,488 -181 -4,990 84.5% 8.8% Aleutians East Borough Schools 2,778 0.40% 2,657 2,697 2,464 81 233 74.7% 4.9% Anchorage School District 290,588 41.97% 278,407 260,283 226,338 30,305 33,945 90.3% 28.9% Annette Island Schools 1,385 0.20% 1,398 1,447 1,469 -62 -22 80.8% 10.5% Bering Strait Schools 5,917 0.85% 5,837 5,691 4,788 226 903 70.3% 10.1% Bristol Bay Borough Schools 967 0.14% 1,176 1,258 1,410 -291 -152 88.9% 21.1% Chatham Schools 1,022 0.15% 1,080 1,209 1,362 -187 -153 84.0% 24.9% Chugach Schools 428 0.06% 476 474 839 -46 -365 89.1% 16.2% Copper River Schools 3,072 0.44% 3,349 3,071 2,632 1 439 85.8% 21.4% Cordova City Schools 2,126 0.31% 2,292 2,454 2,282 -328 172 88.6% 21.4% Craig City Schools 1,400 0.20% 1,415 1,397 1,260 3 137 87.3% 17.5% Delta/Greely Schools 4,845 0.70% 4,145 3,848 4,029 997 -181 90.1% 20.2% Denali Borough School District 1,838 0.27% 1,824 1,893 1,764 -55 129 91.7% 22.7% Dillingham City Schools 2,264 0.33% 2,371 2,466 2,017 -202 449 83.5% 21.9% Fairbanks North Star Borough Schools 93,779 13.55% 87,739 82,840 77,720 10,939 5,120 91.8% 27.0% Galena City School District 564 0.08% 654 675 833 -111 -158 81.3% 28.6% Haines Borough School District 2,358 0.34% 2,330 2,531 2,246 -173 285 88.0% 23.2% Hoonah City Schools 826 0.12% 914 1,060 1,088 -234 -28 80.5% 15.3% Hydaburg City Schools 340 0.05% 370 382 384 -42 -2 76.8% 12.5% Iditarod Area Schools 1,052 0.15% 1,174 1,325 1,524 -273 -199 80.5% 15.2% Juneau City and Borough Schools 30,661 4.43% 31,238 30,711 26,751 -50 3,960 93.2% 36.0% Kake City Schools 497 0.07% 598 710 700 -213 10 85.0% 10.8% Kashunamiut School District 945 0.14% 916 765 598 180 167 74.9% 10.5% Kenai Peninsula Borough Schools 53,578 7.74% 51,269 49,691 40,802 3,887 8,889 88.5% 20.3% Ketchikan Gateway Borough Schools 12,984 1.88% 13,136 14,059 13,828 -1,075 231 89.6% 20.2% Klawock City Schools 782 0.11% 778 854 722 -72 132 80.8% 8.5% Kodiak Island Borough Schools 13,860 2.00% 13,693 13,913 13,309 -53 604 85.4% 18.7% Kuspuk Schools 1,372 0.20% 1,489 1,573 1,487 -201 86 69.5% 13.8% Lake and Peninsula Schools 1,547 0.22% 1,621 1,823 1,668 -276 155 72.2% 12.4% Lower Kuskokwim Schools 14,141 2.04% 14,088 13,102 11,003 1,039 2,099 71.7% 13.5% Lower Yukon School District 6,196 0.89% 6,030 5,763 4,752 433 1,011 64.5% 8.2% Matanuska-Susitna Borough Schools 84,314 12.18% 74,126 59,322 39,683 24,992 19,639 88.1% 18.3% Nenana City Schools 392 0.06% 384 440 393 -48 47 74.6% 13.8% Nome City Schools 3,583 0.52% 3,631 3,505 3,500 78 5 80.6% 20.7% North Slope Borough School District 6,798 0.98% 6,899 7,385 5,979 -587 1,406 77.4% 17.0% Northwest Arctic Borough Schools 7,366 1.06% 7,329 7,208 6,113 158 1,095 72.0% 12.7% Pelican City Schools 122 0.02% 114 163 222 -41 -59 87.1% 21.6% Petersburg City Schools 2,997 0.43% 3,193 3,247 3,230 -250 17 88.0% 18.1% Pribilof Island School District 570 0.08% 621 684 901 -114 -217 77.4% 11.3% Saint Mary’s School District 553 0.08% 562 500 441 53 59 74.1% 15.2% Sitka School District 8,627 1.25% 8,948 8,835 8,588 -208 247 90.6% 29.5% Skagway City and Borough Schools 865 0.12% 834 862 692 3 170 90.1% 25.0% Southeast Island Schools 1,786 0.26% 1,948 2,499 3,164 -713 -665 87.3% 18.3% Southwest Region Schools 2,465 0.36% 2,422 2,456 1,995 9 461 68.5% 9.8% Tanana City Schools 251 0.04% 282 308 345 -57 -37 77.5% 8.4% Unalaska City School District 3,662 0.53% 4,299 4,283 3,089 -621 1,194 78.1% 11.2% Valdez City Schools 3,475 0.50% 3,754 4,036 4,068 -561 -32 90.8% 21.9% Wrangell City and Borough Schools 2,058 0.30% 1,985 2,308 2,479 -250 -171 82.2% 13.7% Yakutat School District 628 0.09% 644 808 705 -180 103 84.3% 17.6% Yukon Flats Schools 1,403 0.20% 1,423 1,597 1,556 -194 41 66.4% 13.4% Yukon/Koyukuk Schools 1,963 0.28% 2,173 2,214 2,122 -251 92 73.9% 10.7% Yupiit School District 1,462 0.21% 1,491 1,322 1,124 140 198 64.7% 7.9%
CANADA British Columbia School District #88 --- --- --- 99
Source: Alaska Department of Labor and Workforce Development, Research and Analysis Section, Demographics Unit. 1/ Aleutians and Adak Region Schools for 1990.

Alaska Population Digest • 2009 Estimates52
Table 3.6Population of Areas of Canada Bordering Alaska, 1996, 2001, 2006, 2009
2001-2009 1996-20062009
Estimate Population
2006 Census
Population
2001 Census
Population
1996 Census
PopulationPopulation
Change
Avg. Ann. Rate of
Change%Population
Change
Avg. Ann. Rate of
Change%
Canada 33,739,859 31,612,896 30,007,094 28,846,761 3,732,765 1.7 1,160,333 0.4
British Columbia 4,455,207 4,113,487 3,907,738 3,724,500 547,469 1.9 183,238 0.5 Kitimat-Stikine District 39,380 37,999 40,876 43,618 -1,496 -0.5 -2,742 -0.6 Hazelton 304 293 345 347 -41 -1.8 -2 -0.1 Kitimat 9,226 8,987 10,285 11,136 -1,059 -1.6 -851 -0.8 New Hazelton 604 627 750 822 -146 -3.1 -72 -0.9 Stewart 444 496 661 858 -217 -5.6 -197 -2.6 Terrace 11,675 11,320 12,109 12,779 -434 -0.5 -670 -0.5 Skeena-Queen Charlotte Dist. 19,438 19,664 21,693 24,795 -2,255 -1.6 -3,102 -1.3 Masset 929 940 926 1,293 3 0.0 -367 -3.3 Port Clements 453 440 516 558 -63 -1.9 -42 -0.8 Port Edward 570 577 659 700 -89 -2.1 -41 -0.6 Prince Rupert 12,846 12,815 14,643 16,714 -1,797 -1.9 -2,071 -1.3 Stikine District/Uninc. Areas 642 1,109 1,316 1,391 -674 -9.8 -75 -0.6
Yukon Territory 34,175 30,372 28,674 30,766 5,501 2.5 -2,092 -0.7 Beaver Creek 105 112 88 131 17 2.5 -43 -3.9 Burwash Landing 105 73 68 58 37 6.1 10 1.6 Carcross 445 331 152 277 293 14.0 -125 -5.8 Carmacks 483 425 431 466 52 1.6 -35 -0.8 Dawson 1,904 1,327 1,251 1,287 653 5.9 -36 -0.3 Destruction Bay 47 55 43 34 4 1.3 9 2.3 Faro 399 341 313 1,261 86 3.5 -948 -12.0 Haines Junction 828 589 531 574 297 6.2 -43 -0.8 Ibex Valley --- 376 315 322 --- --- -7 -0.2 Keno Hill --- 15 20 24 --- --- -4 -1.8 Mayo 461 248 366 324 95 3.3 42 1.2 Mt. Lorne --- 370 379 399 --- --- -20 -0.5 Old Crow 249 370 299 278 -50 -2.6 21 0.7 Pelly Crossing 318 296 328 238 -10 -0.4 90 3.2 Ross River 375 313 337 352 38 1.5 -15 -0.4 Tagish 228 222 206 69 22 1.4 137 10.0 Teslin 472 141 123 309 349 16.8 -186 -8.6 Upper Liard --- 178 159 111 --- --- 48 3.6 Watson Lake 1,567 846 912 993 655 7.5 -81 -0.9 Whitehorse 25,660 20,461 19,058 21,065 6,602 4.2 -2,007 -1.0 Whitehorse, Unorganized --- 1,653 1,637 --- --- --- --- --- Yukon, Unorganized --- 1,286 1,221 1,954 --- --- --- ---
--- Not AvailableSource: British Columbia Stats & Yukon Bureau of Statistics

Alaska Population Digest • 2009 Estimates 53
IntroductionThis chapter contains population estimates for places. Places include incorporated cities or areas that are legally formed under the laws of the state, Census Designated Places (CDPs) and Alaska Native Village Statistical Areas (ANVSA).
Urban is Redefined (Figure 4.1, Tables 4.1, 4.2)•In 2009, 75% of the population lived in places with populations of at least 2,500, only slightly below the national average. •There were 32 places in Alaska with populations above 2,500. •The Municipality of Anchorage—the state’s largest city—was home to 42% of the overall population. An-chorage has 56% of the population of places of 2,500 or more. •The remaining 44% of the population living in places of 2,500 or more lived in places ranging in size from 2,609 to 32,506 people. •Alaska’s population living in places of less than 2,500 people made up 25% of the total population, with 16.8% of the total population in some 330 small places, and 8.2% living outside any CDP. •The total population of the Railbelt (Kenai Peninsula Borough, the Municipality of Anchorage, Matanuska-Susitna Borough, Denali Borough, the area around Nenana on the Parks Highway, and Fairbanks North Star Borough) in 2009 was approximately 524,897, or 75.8% of the State’s population.
Incorporated Cities (Tables 4.2-4.4)•As of July 1, 2009, there were 149 incorporated cit-ies in Alaska. Of these, 19 have populations 2,500 or more, and would have been considered urban by the old Census Bureau definition. •Another eight cities had populations between 1,000 and 2,500: Dillingham (2,264), North Pole (2,200), Cordova (2,126), Wrangell (1,892), Houston (1,664), Craig (1,400), Hooper Bay (1,158) and Delta Junction (1,128).
Census Designated Places (Tables 4.2-4.4)•A total of 198 unincorporated communities qualified as CDPs in 2009. •Thirteen CDPs population sizes’ would meet the Cen-sus Bureau’s former definition of urban places. These were Knik-Fairview (13,824), College (12,552), Lakes (8,388), Kalifornsky (7,495), Tanaina (7,407), Meadow Lakes (7,319), Sterling (5,348), Nikiski (4,465), Gate-way (4,068), Fishhook (3,337), Big Lake (3,331), Butte (3,255) and Eielson AFB (2,896). Sixteen other CDPs
had populations between 1,000 and 2,500, includ-ing Deltana (2,355), Willow (2,218), Ridgeway (2,050), Ester (2,034) and Bear Creek (2,009).
Unorganized Territory•It was estimated that 19,824 people, or 2.9% of the state’s population, lived in “unorganized” territory in 2009. •The number of people who lived in unorganized ter-ritory outside of all CDPs or ANVSAs, and beyond the purview of any government other than the State of Alaska, totaled 1,673 or 0.24% of the state’s overall population. All but a few hundred of these people live outside communities but along a road system which allows them access to a community. •Only a very small number of persons live as isolated individuals or individual families on islands or in remote rural Alaska with access to a community only available by bush plane or small boat.
Chapter 4Alaska Places
Figure 4.1Alaska’s Population by Size of Place, 2009
Source: Alaska Department of Labor and Workforce Development, Research and Analysis Section, Demographics Unit
50,000+
10,000-49,999
5,000-9,999
2,500-4,999 1,000-2,499
Under 1,000
Outside Places
42.0%
13.0%
13.0%
7.1% 6.1%
10.5%
8.3%
Population 2,500 or over 75.0%%
Population under 2,500 25.0%

Alaska Population Digest • 2009 Estimates54
Table 4.2The 32 Alaska Cities and Places With More Than 2,500 People, 2000, 2006-2009
Sources: U.S. Census Bureau and Alaska Department of Labor and Workforce Development, Research and Analysis Section, Demographics Unit
Area Name
Vintage 2009 Estimates
Census 2000
Change 2000-09
Average Annual %
Rate of Change 2000-09
Place Rank 2009
Place Rank 2000
Estimate 2009
Estimate 2008
Estimate 2007
Estimate 2006
Anchorage, Municipality of 290,588 283,912 282,968 283,348 260,283 30,305 1.19 1 1 Fairbanks city 32,506 31,450 31,801 30,189 30,224 2,282 0.79 2 3 Juneau City and Borough 30,661 30,405 30,198 30,822 30,711 -50 -0.02 3 2 Knik-Fairview CDP 13,824 13,103 12,304 11,385 7,049 6,775 7.02 4 7 College CDP 12,552 12,616 12,180 12,136 11,402 1,150 1.04 5 4 Sitka City and Borough 8,627 8,641 8,621 8,992 8,835 -208 -0.26 6 5 Lakes CDP 8,388 8,308 8,103 7,975 6,706 1,682 2.41 7 9 Ketchikan city 7,503 7,502 7,644 7,641 7,922 -419 -0.59 8 6 Kalifornsky CDP 7,495 7,394 7,151 6,995 5,846 1,649 2.67 9 11 Tanaina CDP 7,407 7,254 7,127 7,016 4,993 2,414 4.21 10 15 Meadow Lakes CDP 7,319 7,179 6,841 6,535 4,819 2,500 4.45 11 16 Wasilla city 7,245 6,932 6,927 6,486 5,469 1,776 3.02 12 13 Kenai city 7,115 7,068 6,913 6,797 6,942 173 0.27 13 8 Kodiak city 6,626 6,541 5,796 5,670 6,334 292 0.49 14 10 Bethel city * 5,803 5,649 5,634 5,810 5,471 332 0.64 15 12 Homer city 5,551 5,385 5,454 5,442 3,946 1,605 3.65 16 23 Palmer city 5,532 5,395 5,417 5,444 4,533 999 2.15 17 19 Sterling CDP 5,348 5,179 5,132 5,059 4,705 643 1.38 18 17 Nikiski CDP 4,465 4,413 4,333 4,212 4,327 138 0.34 19 20 Barrow city * 4,119 4,051 4,036 4,069 4,581 -462 -1.15 20 18 Gateway CDP 4,068 4,121 4,007 3,862 2,952 1,116 3.44 21 28 Soldotna city 4,021 3,926 3,898 3,762 3,759 262 0.73 22 24 Unalaska city * 3,662 3,549 3,652 4,028 4,283 -621 -1.69 23 21 Valdez city 3,475 3,628 3,580 3,675 4,036 -561 -1.61 24 22 Nome city 3,468 3,565 3,481 3,541 3,505 -37 -0.11 25 25 Fishhook CDP 3,337 3,308 3,087 2,947 2,030 1,307 5.27 26 35 Big Lake CDP 3,331 3,198 3,147 3,083 2,635 696 2.52 27 30 Butte CDP 3,255 3,225 3,198 3,203 2,561 694 2.58 28 31 Kotzebue city * 3,154 3,124 3,121 3,105 3,082 72 0.25 29 27 Petersburg city 2,973 3,010 3,042 3,125 3,224 -251 -0.88 30 26 Eielson AFB CDP 2,896 3,187 4,252 4,380 5,400 -2,504 -6.53 31 14 Seward city 2,609 2,561 2,649 2,593 2,830 -221 -0.88 32 29
Table 4.1Population by Size of Place, 1990, 2000, 2009
Sources: U.S. Census Bureau and Alaska Department of Labor and Workforce Development, Research and Analysis Section, Demographics Unit
July 1, 2009 April 1, 2000 April 1, 1990 Popula-tion
Change 2000-2009
Change in % of
Total 2000-2009
Popula-tion
Change 1990-2000
Change in % of
Total 1990-2000
Number of
Places Estimate% of Total
Number of
Places Estimate% of Total
Number of
PlacesEsti-mate
% of Total
Alaska 362 692,314 100.0 362 626,931 100.0 328 550,043 100.0 65,383 0.0 76,888 0.0
Places of 2,500+ 32 518,923 75.0 31 463,365 73.9 24 382,646 69.6 55,558 1.1 80,719 4.3
50,000+ 1 290,588 42.0 1 260,283 41.5 1 226,338 41.1 30,305 0.5 33,945 0.410,000-49,999 4 89,543 12.9 3 72,337 11.5 3 68,843 12.5 17,206 1.4 3,494 -1.05,000-9,999 13 89,959 13.0 10 65,974 10.5 5 34,794 6.3 23,985 2.5 31,180 4.22,500-4,999 14 48,833 7.1 17 64,771 10.3 15 52,671 9.6 -15,938 -3.2 12,100 0.8
Places less than 2,500
330 116,209 16.8 322 117,524 18.7 304 95,222 17.3 -1,315 -1.9 22,302 1.4
1,000-2,499 26 42,405 6.1 26 41,618 6.6 14 24,625 4.5 787 -0.5 16,993 2.2500-999 53 35,574 5.1 53 36,306 5.8 43 28,417 5.2 -732 -0.7 7,889 0.6250-499 55 20,114 2.9 58 21,018 3.4 66 23,355 4.2 -904 -0.5 -2,337 -0.9100-249 72 11,981 1.7 89 14,044 2.2 83 13,498 2.5 -2,063 -0.5 546 -0.2Under 100 124 5,152 0.7 96 4,538 0.7 98 5,327 1.0 614 0.0 -789 -0.2
Outside Places 57,182 8.3 46,042 7.3 72,175 13.1 11,140 0.9 -26,133 -5.8Note: In the 1990 Census, places with more than 2,500 people were designated as urban.

Alaska Population Digest • 2009 Estimates 55
Table 4.3Alaska Places by Borough/Census Area, 2000-2009
Sources: U.S. Census Bureau and Alaska Department of Labor and Workforce Development, Research and Analysis Section, Demographics Unit
Area Name
July 1 2009
Estimate
July 1 2008
Estimate
July 1 2007
Estimate
July 1 2006
Estimate
July 1 2005
Estimate
July 1 2004
Estimate
July 1 2003
Estimate
July 1 2002
Estimate
July 1 2001
Estimate
April1 2000
Census
Alaska /1 692,314 681,977 676,056 671,202 664,334 657,483 647,884 640,643 632,200 626,931
Aleutians East Borough 2,778 2,698 2,792 2,591 2,657 2,655 2,714 2,723 2,548 2,697
Akutan city * 846 796 859 745 773 789 807 748 708 713 Belkofski * 0 0 0 0 0 0 0 0 0 0 Cold Bay city 84 89 72 87 89 89 95 117 75 88 False Pass city * 41 39 45 54 63 63 69 79 69 64 King Cove city * 744 750 754 745 724 725 728 787 694 792 Nelson Lagoon CDP * 60 65 69 68 66 78 64 70 79 83 Sand Point city * 1,001 958 992 891 940 911 950 919 921 952 Remainder of Aleutians East Borough 2 1 1 1 2 0 1 3 2 5
Aleutians West Census Area 4,549 4,436 4,499 4,916 5,245 5,242 5,328 5,071 5,253 5,465
Adak city 165 178 137 146 167 70 74 166 153 316 Atka city * 71 73 74 73 90 93 94 102 92 92 Attu Station CDP 15 15 15 20 16 18 27 25 25 20 Nikolski CDP * 33 27 33 31 31 36 41 34 32 39 Saint George city * 111 112 114 120 129 138 148 147 146 152 Saint Paul city * 459 449 446 470 492 496 539 533 527 532 Unalaska city * 3,662 3,549 3,652 4,028 4,299 4,363 4,370 4,035 4,248 4,283 Remainder of Aleutians West census area 33 33 28 28 21 28 35 29 30 31
Anchorage, Municipality of 290,588 283,912 282,968 283,348 278,407 277,880 273,069 267,860 264,886 260,283
Anchorage, Municipality of 290,588 283,912 282,968 283,348 278,407 277,880 273,069 267,860 264,886 260,283 Eklutna * 384 377 370 381 389 376 418 438 415 394
Bethel Census Area /1 /2 16,997 16,924 16,790 17,049 17,099 16,883 16,751 16,514 16,107 16,046
Aniak census subarea /1 /2 1,394 1,410 1,415 1,486 1,520 1,552 1,540 1,563 1,592 1,622
Aniak city * 485 491 505 515 527 534 541 540 564 572 Chuathbaluk city * 98 87 90 99 95 105 102 98 108 119 Crooked Creek CDP * 131 132 128 119 145 147 145 146 134 137 Georgetown * 3 3 3 3 3 3 3 3 3 3 Lime Village CDP * /1 /2 19 15 25 26 28 34 43 41 49 46 Lower Kalskag city * 251 255 251 267 252 263 267 263 256 267 Napaimute * 0 0 0 0 0 0 0 0 0 0 Red Devil CDP * 44 48 34 29 36 35 41 32 31 48 Sleetmute CDP * 71 70 75 86 92 79 72 93 97 100 Stony River CDP * 48 51 42 53 43 55 49 57 55 61 Upper Kalskag city * 223 235 243 270 276 265 231 246 252 230 Remainder of Aniak census subarea 21 23 19 19 23 32 46 44 43 39/1Census corrections to date have been included in state, census area and place populations./2 Most of Lime Village (41 persons) was erroneously reported in the balance of Koyukuk-Middle Yukon in 2000.
Lower Kuskokwim census subarea 15,603 15,514 15,375 15,563 15,579 15,331 15,211 14,951 14,515 14,424
Akiachak CDP * 645 657 626 634 645 619 633 625 597 585 Akiak city * 346 341 350 365 379 369 346 345 301 309 Atmautluak CDP * 296 306 305 296 304 286 280 291 302 294 Bethel city * 5,803 5,649 5,634 5,810 5,963 5,872 5,885 5,740 5,463 5,471 Chefornak city * 475 470 448 460 458 440 433 420 397 394 Eek city * 282 271 284 287 292 292 290 290 271 280 Goodnews Bay city * 237 225 234 244 238 237 245 234 228 230 Kasigluk CDP * 567 576 543 540 535 530 528 528 542 543 Kipnuk CDP * 671 694 662 667 688 662 649 646 621 644 Kongiganak CDP * 465 444 434 416 426 413 404 372 372 359 Kwethluk city * 723 738 719 696 696 698 709 695 691 713 Kwigillingok CDP * 365 352 360 377 361 363 343 338 358 338

Alaska Population Digest • 2009 Estimates56
Mekoryuk city * 174 195 207 220 192 199 204 204 214 210 Napakiak city * 337 348 377 374 374 361 379 352 370 353 Napaskiak city * 428 424 425 452 426 440 424 419 419 390 Newtok CDP * 355 357 352 336 315 309 330 326 321 321 Nightmute city * 264 248 243 238 234 233 229 224 213 208 Nunapitchuk city * 539 539 542 547 516 529 497 512 489 466 Oscarville CDP * 109 116 97 83 62 57 62 62 67 61 Platinum city * 57 47 35 38 38 39 40 38 44 41 Quinhagak city (Kwinhagak *) 680 659 641 650 643 615 578 573 544 555 Toksook Bay city * 596 603 608 601 596 563 571 549 547 532 Tuluksak CDP * 471 499 485 489 467 472 461 463 438 428 Tuntutuliak CDP * 384 416 420 407 399 400 380 378 376 370 Tununak CDP * 330 332 340 332 328 329 307 323 326 325 Remainder of Lower Kuskokwim census 4 8 4 4 4 4 4 4 4 4
subarea
Bristol Bay Borough 967 1,027 1,032 1,058 1,176 1,101 1,103 1,163 1,173 1,258
King Salmon CDP 383 410 424 400 518 396 385 397 388 442 Naknek CDP * 516 549 542 583 582 613 612 642 657 678 South Naknek CDP * 68 68 66 75 76 89 102 120 124 137 Remainder of Bristol Bay Borough 0 0 0 0 0 3 4 4 4 1
Denali Borough 1,838 1,806 1,766 1,797 1,824 1,850 1,917 1,887 1,902 1,893
Anderson city 275 256 263 278 280 342 377 366 377 367 Cantwell CDP 200 190 185 204 217 220 226 216 221 222 Cantwell * 200 190 185 204 217 220 226 216 221 222 Ferry CDP 36 38 30 35 36 38 35 33 32 29 Healy CDP 1,002 1,021 1,024 996 1,014 1,002 1,015 999 1,015 1,000 McKinley Park CDP 168 160 150 147 139 129 134 138 133 142 Remainder of Denali Borough 157 141 114 137 138 119 130 135 124 133
Dillingham Census Area 4,729 4,767 4,779 4,806 4,793 4,852 4,904 4,918 4,889 4,922
Aleknagik city * 229 250 232 241 238 233 239 220 221 221 Clark's Point city * 61 54 66 69 65 63 66 65 69 75 Dillingham city * 2,264 2,335 2,404 2,405 2,371 2,407 2,385 2,468 2,461 2,466 Ekuk * 0 0 0 0 0 0 0 5 2 2 Ekwok city * 109 121 108 116 118 127 128 116 119 130 Koliganek CDP (New Koliganek *) 182 174 192 165 168 188 199 188 177 182 Manokotak city * 438 429 430 424 438 407 405 407 412 399 New Stuyahok city * 519 491 446 468 462 472 491 483 489 471 Portage Creek CDP * 7 7 9 20 37 49 61 48 47 36 Togiak city * 820 801 786 783 779 803 820 809 787 809 Twin Hills CDP * 74 75 81 77 71 68 76 77 64 69 Remainder of Dillingham census area 26 30 25 38 46 35 34 32 41 62
Fairbanks North Star Borough 93,779 92,762 91,525 87,797 87,739 85,474 82,173 84,765 83,276 82,840
College CDP 12,552 12,616 12,180 12,136 12,215 12,161 12,057 11,938 12,054 11,402 Eielson AFB CDP 2,896 3,187 4,252 4,380 4,555 4,680 4,433 5,841 5,151 5,400 Ester CDP 2,034 1,967 2,034 1,937 1,858 1,817 1,804 1,825 1,704 1,680 Fairbanks city 32,506 31,450 31,801 30,189 31,115 30,109 28,929 29,778 29,521 30,224 Fox CDP 390 363 356 373 377 349 327 317 317 300 Harding-Birch Lakes CDP 287 291 244 243 241 243 218 206 196 216 Moose Creek CDP 729 817 655 593 646 595 573 618 551 542 North Pole city 2,200 2,207 1,977 1,648 1,601 1,530 1,602 1,601 1,469 1,570 Pleasant Valley CDP 765 760 670 703 696 715 687 721 657 623 Salcha CDP 985 949 999 954 951 920 867 924 905 854 Two Rivers CDP 663 656 624 627 629 600 602 540 536 482 Remainder of Fairbanks North Star 37,772 37,499 35,733 34,014 32,855 31,755 30,074 30,456 30,215 29,547
Borough
Table 4.3 (continued)Alaska Places by Borough/Census Area, 2000-2009
Area Name
July 1 2009
Estimate
July 1 2008
Estimate
July 1 2007
Estimate
July 1 2006
Estimate
July 1 2005
Estimate
July 1 2004
Estimate
July 1 2003
Estimate
July 1 2002
Estimate
July 1 2001
Estimate
April1 2000
Census
Sources: U.S. Census Bureau and Alaska Department of Labor and Workforce Development, Research and Analysis Section, Demographics Unit

Alaska Population Digest • 2009 Estimates 57
Haines Borough 2,286 2,322 2,264 2,252 2,225 2,271 2,335 2,373 2,383 2,392
Covenant Life CDP 89 101 94 96 83 84 83 75 82 102 Excursion Inlet CDP 11 13 13 9 10 10 12 10 15 10 Haines CDP /10 1,624 1,643 1,632 1,630 1,644 1,657 1,725 1,788 1,765 1,811 Chilkoot * 359 360 336 354 348 356 357 352 309 338 Lutak CDP 38 53 42 46 36 39 36 40 43 39 Mosquito Lake CDP 235 238 218 222 220 233 257 246 255 221 Mud Bay CDP 178 159 157 151 151 157 151 149 159 137 Remainder of Haines Borough 111 115 108 98 81 91 71 65 64 72/10 The city of Haines dissolved in October 2003 in favor of boroughwide government.Note: The time series for the Haines borough has been reestimated for 2000-2009 to correct for geocoding errors in Covenent Life and Mosquito Lake.
Juneau City and Borough 30,661 30,405 30,198 30,822 31,238 31,130 31,300 31,003 30,458 30,711
Juneau city and borough 30,661 30,405 30,198 30,822 31,238 31,130 31,300 31,003 30,458 30,711 Douglas * 4,890 4,904 4,799 4,895 5,110 4,911 5,034 4,961 4,833 5,297
Kenai Peninsula Borough 53,578 52,959 52,230 51,467 51,269 51,239 51,454 50,682 50,082 49,691
Kenai-Cook Inlet census subarea 48,039 47,397 46,664 45,949 45,767 45,764 45,854 45,040 44,425 44,101
Anchor Point CDP 1,772 1,808 1,785 1,794 1,756 1,831 1,809 1,780 1,809 1,845 Beluga CDP 24 25 19 21 21 26 27 25 24 32 Clam Gulch CDP 166 159 177 165 171 164 176 173 168 173 Cohoe CDP 1,332 1,350 1,276 1,275 1,284 1,322 1,209 1,211 1,175 1,168 Diamond Ridge CDP /3 860 809 778 705 744 769 823 872 1,835 1,802 Fox River CDP 604 658 631 638 628 614 582 576 594 616 Fritz Creek CDP 1,818 1,834 1,777 1,734 1,764 1,733 1,743 1,734 1,663 1,603 Funny River CDP 796 768 767 734 747 737 707 687 624 636 Halibut Cove CDP 27 23 20 24 23 26 27 28 29 35 Happy Valley CDP 561 527 507 494 483 528 505 521 505 489 Homer city /2 5,551 5,385 5,454 5,442 5,402 5,355 5,369 5,076 4,070 3,946 Kachemak city 430 450 460 463 460 471 478 433 426 431 Kalifornsky CDP 7,495 7,394 7,151 6,995 6,835 6,644 6,249 6,160 6,017 5,846 Kasilof CDP 536 504 577 533 510 474 560 501 451 471 Kenai city 7,115 7,068 6,913 6,797 6,779 6,845 7,130 7,077 6,888 6,942 Miller Landing CDP /3 0 0 0 0 0 0 0 0 70 74 Nanwalek CDP * 226 228 216 228 220 204 214 219 184 177 Nikiski CDP 4,465 4,413 4,333 4,212 4,196 4,293 4,352 4,362 4,363 4,327 Nikolaevsk CDP 315 295 304 297 306 309 315 335 345 345 Ninilchik CDP 824 836 769 772 788 787 774 762 760 772 Port Graham CDP * 137 136 137 136 129 153 165 174 178 171 Ridgeway CDP 2,050 2,007 1,981 1,972 2,063 2,060 2,020 1,969 1,962 1,932 Salamatof CDP * 855 893 882 932 912 920 923 915 912 954 Seldovia * 407 420 423 413 391 423 430 449 435 430 Seldovia city 241 254 261 249 240 265 279 288 287 286 Seldovia Village CDP 166 166 162 164 151 158 151 161 148 144 Soldotna city 4,021 3,926 3,898 3,762 3,800 3,778 4,001 3,851 3,792 3,759 Sterling CDP 5,348 5,179 5,132 5,059 4,988 4,924 4,879 4,781 4,756 4,705 Tyonek CDP * 166 154 179 199 199 185 192 181 161 193 Tyonek * 166 154 179 199 199 185 192 181 161 193 Balance of Kenai-Cook Inlet census subarea 138 148 118 153 168 189 195 188 229 227/3 Homer annexed part of Diamond Ridge and all of Miller Landing 3/20/02.
Seward-Hope census subarea 5,539 5,562 5,566 5,518 5,502 5,475 5,600 5,642 5,657 5,590
Bear Creek CDP 2,009 2,034 1,951 1,946 1,901 1,906 1,829 1,833 1,836 1,748 Cooper Landing CDP 344 357 356 356 343 345 351 370 389 369 Crown Point CDP 77 77 77 81 82 90 82 88 89 75 Hope CDP 151 149 145 143 141 166 161 152 145 137 Lowell Point CDP 76 94 85 81 96 76 89 108 96 92 Moose Pass CDP 189 185 199 203 218 220 219 217 206 206 Primrose CDP 65 77 75 82 84 91 87 92 99 93
Table 4.3 (continued)Alaska Places by Borough/Census Area, 2000-2009
Area Name
July 1 2009
Estimate
July 1 2008
Estimate
July 1 2007
Estimate
July 1 2006
Estimate
July 1 2005
Estimate
July 1 2004
Estimate
July 1 2003
Estimate
July 1 2002
Estimate
July 1 2001
Estimate
April1 2000
Census
Sources: U.S. Census Bureau and Alaska Department of Labor and Workforce Development, Research and Analysis Section, Demographics Unit

Alaska Population Digest • 2009 Estimates58
Seward city 2,609 2,561 2,649 2,593 2,598 2,544 2,744 2,755 2,758 2,830 Sunrise CDP 19 22 22 22 24 19 15 14 16 18 Balance of Seward-Hope census subarea 0 6 7 11 15 18 23 13 23 22
Alaska Native Villages that overlap multiple CDPs Kenaitze * 31,614 31,248 30,818 30,368 30,251 30,233 30,360 29,905 29,551 29,320 Ninilchik * 14,302 14,136 13,942 13,738 13,685 13,677 13,735 13,529 13,368 13,264
Ketchikan Gateway Borough /1 /4 /13 12,984 12,980 13,116 13,206 13,136 13,085 13,527 13,677 13,747 14,059
Ketchikan city /1 /5 7,503 7,502 7,644 7,641 7,687 7,713 7,979 8,374 8,458 7,922 Saxman city * 434 424 437 425 409 393 425 425 436 431 Remainder of Ketchikan Gateway Borough 5,047 5,054 5,035 5,140 5,040 4,979 5,123 4,878 4,853 5,706
/1 /4 /5 /13/1Census corrections to date have been included in state, census area and place populations./4 Eleven persons who belonged in Prince of Wales, were erroneously reported in the balance of Ketchikan Gateway Borough in 2000./5 Ketchikan city had two annexations in 2001.(1/1/01 and 1/29/01)/13 Ketchikan Gateway Borough annexed most of Outer Ketchikan census subarea in May 2008.
Kodiak Island Borough 13,860 13,954 13,664 13,457 13,693 13,573 13,817 13,643 13,565 13,913
Akhiok city * 51 48 36 41 42 57 51 49 57 80 Aleneva CDP 67 57 61 46 46 44 59 96 88 68 Chiniak CDP 48 44 44 41 52 50 49 56 53 50 Karluk CDP * 38 38 40 34 35 32 28 27 29 27 Kodiak city 6,626 6,541 5,796 5,670 6,139 6,210 6,109 6,100 6,073 6,334 Kodiak Station CDP 1,321 1,235 1,974 1,887 1,977 1,764 2,189 1,939 1,758 1,840 Larsen Bay city * 79 68 89 83 97 96 95 107 113 115 Old Harbor city * 193 185 201 179 200 198 211 226 236 237 Ouzinkie city * 170 168 166 172 189 187 172 189 204 225 Port Lions city * 200 191 193 196 220 240 233 227 246 256 Womens Bay CDP 740 792 747 759 704 689 681 684 683 690 Remainder of Kodiak Island Borough 4,327 4,587 4,317 4,349 3,992 4,006 3,940 3,943 4,025 3,991
Lake and Peninsula Borough 1,547 1,552 1,534 1,559 1,621 1,611 1,627 1,639 1,732 1,823
Chignik city * 62 59 80 83 95 92 91 77 76 79 Chignik Lagoon CDP * 73 71 67 71 86 82 92 88 104 103 Chignik Lake CDP * 105 104 125 122 117 113 113 115 140 145 Egegik city * 73 63 63 76 81 77 82 87 80 116 Igiugig CDP * 48 40 32 53 50 55 50 43 55 53 Iliamna CDP * 91 93 87 82 86 90 92 98 95 102 Ivanof Bay CDP * 0 0 0 0 2 5 3 3 13 22 Kokhanok CDP * 184 177 174 169 179 167 181 179 172 174 Levelock CDP * 88 70 70 61 54 58 71 83 107 122 Newhalen city * 162 171 185 168 180 184 171 166 156 160 Nondalton city * 186 199 194 196 204 206 216 206 210 221 Pedro Bay CDP * 48 44 38 54 62 46 45 46 50 50 Perryville CDP * 122 132 117 120 114 110 106 111 114 107 Pilot Point city * 66 72 60 66 73 76 70 75 86 100 Pope-Vannoy Landing CDP 5 5 5 6 6 9 10 5 5 8 Port Alsworth CDP 118 124 115 112 106 114 104 109 105 104 Port Heiden city * 83 90 86 79 89 90 85 108 118 119 Ugashik CDP * 15 15 13 17 15 12 12 12 12 11 Remainder of Lake and Peninsula Borough 18 23 23 24 22 25 33 28 34 27
Matanuska-Susitna Borough 84,314 82,429 79,868 77,302 74,126 70,466 67,544 64,360 61,760 59,322
Big Lake CDP 3,331 3,198 3,147 3,083 2,985 2,929 2,889 2,706 2,614 2,635 Buffalo Soapstone CDP 738 763 776 763 760 743 739 730 724 699 Butte CDP 3,255 3,225 3,198 3,203 3,115 2,976 2,921 2,785 2,737 2,561 Chase CDP 35 36 31 30 30 30 34 35 33 41 Chickaloon CDP 277 247 263 281 294 299 281 266 265 213
Table 4.3 (continued)Alaska Places by Borough/Census Area, 2000-2009
Area Name
July 1 2009
Estimate
July 1 2008
Estimate
July 1 2007
Estimate
July 1 2006
Estimate
July 1 2005
Estimate
July 1 2004
Estimate
July 1 2003
Estimate
July 1 2002
Estimate
July 1 2001
Estimate
April1 2000
Census
Sources: U.S. Census Bureau and Alaska Department of Labor and Workforce Development, Research and Analysis Section, Demographics Unit

Alaska Population Digest • 2009 Estimates 59
Farm Loop CDP 1,313 1,346 1,303 1,265 1,205 1,144 1,161 1,165 1,083 1,067 Fishhook CDP 3,337 3,308 3,087 2,947 2,798 2,644 2,350 2,243 2,191 2,030 Gateway CDP 4,068 4,121 4,007 3,862 3,687 3,564 3,299 3,216 3,120 2,952 Glacier View CDP 246 253 233 237 264 268 250 250 238 249 Houston city 1,664 1,728 1,582 1,541 1,442 1,374 1,352 1,264 1,161 1,202 Knik-Fairview CDP 13,824 13,103 12,304 11,385 10,280 9,260 8,561 8,001 7,639 7,049 Knik River CDP 631 666 679 677 646 606 676 636 623 582 Lake Louise CDP 100 88 93 86 91 99 111 91 101 88 Lakes CDP 8,388 8,308 8,103 7,975 7,764 7,480 7,043 6,927 6,814 6,706 Lazy Mountain CDP 1,446 1,455 1,428 1,371 1,270 1,261 1,229 1,192 1,205 1,158 Meadow Lakes CDP 7,319 7,179 6,841 6,535 6,386 5,951 5,577 5,309 5,040 4,819 Palmer city /9 5,532 5,395 5,417 5,444 5,308 5,221 5,261 4,837 4,581 4,533 Petersville CDP 6 9 12 21 16 15 14 19 25 27 Point MacKenzie CDP 273 271 265 236 240 216 201 200 210 111 Skwentna CDP 73 79 84 73 75 82 95 88 95 111 Susitna CDP 16 23 25 24 23 31 38 36 40 37 Sutton-Alpine CDP 1,407 1,294 1,315 1,280 1,257 1,164 1,162 1,142 1,111 1,080 Talkeetna CDP 894 857 833 834 859 846 855 867 796 772 Tanaina CDP 7,407 7,254 7,127 7,016 6,633 6,298 5,861 5,601 5,263 4,993 Trapper Creek CDP 444 405 418 415 439 439 425 404 405 423 Wasilla city /6 7,245 6,932 6,927 6,486 6,372 6,146 6,381 5,949 5,516 5,469 Willow CDP 2,218 2,136 2,046 1,964 1,898 1,863 1,814 1,719 1,667 1,658 Y CDP 1,057 1,088 1,082 1,102 1,126 1,077 1,038 993 996 956 Remainder of Matanuska-Susitna Borough 7,770 7,662 7,242 7,166 6,863 6,440 5,926 5,689 5,467 5,101
Alaska Native Villages that overlap multiple CDPs Chickaloon * 24,045 23,508 22,777 22,046 21,140 20,096 19,263 18,355 17,613 16,918 Knik * 45,437 44,422 43,041 41,659 39,947 37,975 36,400 34,684 33,283 31,969 Kanatak ** 14,571 14,245 13,803 13,359 12,810 12,178 11,673 11,123 10,673 10,252/6 Wasilla had a small annexation 5/3/2002/9 Palmer had an annexation 9/5/2003
Nome Census Area 9,500 9,493 9,485 9,545 9,468 9,432 9,354 9,343 9,265 9,196
Brevig Mission city * 358 350 328 325 328 319 313 308 285 276 Council * 8 7 7 9 8 5 3 4 4 0 Diomede city (Inalik *) 117 129 143 111 132 141 137 128 139 146 Elim city 288 280 309 294 303 319 342 340 317 313 Gambell city * 666 673 661 644 660 651 646 641 642 649 Golovin city * 154 161 167 154 150 161 156 149 155 144 Koyuk city * 358 333 346 370 349 349 340 329 326 297 Nome city 3,468 3,565 3,481 3,541 3,512 3,481 3,412 3,482 3,485 3,505 Mary's Igloo * 0 0 0 0 0 0 0 0 0 0 Port Clarence CDP 23 23 23 23 25 26 26 22 22 21 Saint Michael city * 446 433 444 446 427 411 413 390 377 368 Savoonga city * 721 721 711 712 697 713 703 686 655 643 Shaktoolik city * 231 223 213 214 224 210 223 218 209 230 Shishmaref city * 606 586 607 617 582 595 594 589 586 562 Solomon * 0 2 2 2 4 4 4 4 4 4 Stebbins city * 605 577 597 613 597 589 570 587 599 547 Teller city * 261 259 255 258 263 242 242 247 239 268 Unalakleet city * 725 722 723 728 713 730 739 727 737 747 Wales city * 148 139 135 139 151 152 158 159 158 152 White Mountain city * 202 191 214 224 224 213 214 210 203 203 Remainder of Nome census area 115 119 119 121 119 121 119 123 123 121
North Slope Borough 6,798 6,703 6,726 6,811 6,899 7,133 7,225 7,239 7,231 7,385
Alpine CDP 0 0 0 0 0 0 0 0 0 0 Anaktuvuk Pass city * 287 284 277 299 308 301 318 302 299 282 Atqasuk city * 201 219 222 237 227 219 228 231 234 228 Barrow city * 4,119 4,051 4,036 4,069 4,180 4,369 4,412 4,436 4,443 4,581 Kaktovik city * 286 274 286 288 276 285 296 306 279 293 Nuiqsut city * 402 383 402 417 411 432 416 443 426 433 Point Hope city * 705 688 703 737 722 729 723 710 714 757
Table 4.3 (continued)Alaska Places by Borough/Census Area, 2000-2009
Area Name
July 1 2009
Estimate
July 1 2008
Estimate
July 1 2007
Estimate
July 1 2006
Estimate
July 1 2005
Estimate
July 1 2004
Estimate
July 1 2003
Estimate
July 1 2002
Estimate
July 1 2001
Estimate
April1 2000
Census
Sources: U.S. Census Bureau and Alaska Department of Labor and Workforce Development, Research and Analysis Section, Demographics Unit

Alaska Population Digest • 2009 Estimates60
Point Lay CDP * 234 256 249 235 242 252 264 256 256 247 Prudhoe Bay CDP 3 4 3 2 2 3 4 7 5 5 Wainwright city * 551 534 538 517 520 533 552 536 562 546 Remainder of North Slope Borough 10 10 10 10 11 10 12 12 13 13
Northwest Arctic Borough 7,366 7,401 7,377 7,335 7,329 7,335 7,284 7,232 7,128 7,208
Ambler city * 261 258 277 277 283 276 291 295 283 309 Buckland city * 432 457 459 418 434 438 409 426 404 406 Deering city * 118 133 133 138 139 145 131 129 137 136 Kiana city * 374 383 390 399 381 396 408 400 404 388 Kivalina city * 410 406 397 392 385 390 388 383 385 377 Kobuk city * 122 109 119 135 131 126 125 106 95 109 Kotzebue city * 3,154 3,124 3,121 3,105 3,123 3,142 3,068 3,075 3,059 3,082 Noatak CDP * 486 512 488 470 474 450 468 455 438 428 Noorvik city * 628 641 634 636 628 612 648 676 643 634 Red Dog Mine CDP 35 34 33 33 32 32 32 32 32 32 Selawik city * 849 846 828 842 831 833 819 779 776 772 Shungnak city * 270 271 269 260 259 266 263 249 245 256 Remainder of Northwest Arctic Borough 227 227 229 230 229 229 234 227 227 279
Prince of Wales-Outer Ketchikan Census Area 5,392 5,358 5,310 5,481 5,513 5,570 5,592 5,682 5,816 6,157/1 /4 /13 /14
Prince of Wales-Hyder Census Area, 2008
Metlakatla Indian Community census subarea 1,385 1,370 1,332 1,375 1,398 1,373 1,395 1,422 1,416 1,447
Annette Island Reserve 1,385 1,370 1,332 1,375 1,398 1,373 1,395 1,422 1,416 1,447 Metlakatla CDP 1,330 1,316 1,279 1,321 1,343 1,305 1,327 1,352 1,345 1,375 Remainder of Metlakatla Indian Community csa. 55 54 53 54 55 68 68 70 71 72
Outer Ketchikan census subarea /13 /14 --- --- 94 113 122 110 110 120 130 129 Hyder Census Subarea, 2008 /16 87 94 --- --- --- --- --- --- --- ---
Hyder CDP 87 94 72 91 91 84 77 89 102 97 Meyers Chuck CDP /14 --- --- 20 16 23 18 25 20 19 21 Remainder of Outer Ketchikan census subarea --- --- 2 6 8 8 8 11 9 11
/13 /14
Prince of Wales census subarea /1 /4 3,920 3,894 3,884 3,993 3,993 4,087 4,087 4,140 4,270 4,581
Coffman Cove city 152 141 146 162 156 176 163 160 174 199 Craig * 1,400 1,413 1,355 1,408 1,415 1,473 1,494 1,548 1,591 1,725 Craig city 1,101 1,118 1,050 1,090 1,097 1,134 1,176 1,209 1,245 1,397 Edna Bay CDP 49 40 42 41 42 44 45 40 40 49 Hollis CDP 193 179 186 151 136 146 168 150 154 139 Hydaburg city * 340 341 352 351 370 349 369 364 352 382 Kasaan city * 56 54 62 58 61 61 57 57 46 39 Klawock city * 782 781 741 781 778 833 845 864 866 854 Naukati Bay CDP 118 123 130 131 117 107 109 112 129 135 Point Baker CDP 11 15 15 16 20 24 33 35 34 35 Port Protection CDP 72 66 58 60 58 47 57 53 65 63 Thorne Bay city 424 439 465 481 486 499 481 501 521 557 Whale Pass CDP 60 48 57 61 76 82 67 64 53 58 Remainder of Prince of Wales csa /4 263 254 275 292 278 246 199 192 245 346/1Census corrections to date have been included in state, census area and place populations./4 Eleven persons who belonged in Prince of Wales, were erroneously reported in the balance of Ketchikan Gateway Borough in 2000./13 Ketchikan Gateway Borough annexed most of Outer Ketchikan census subarea in May 2008./14 Wrangell City and Borough was formed in May 2008, dissolving the city of Wrangell, and annexing Meyers Chuck CDP and part of the Outer Ketchi-kan Census Subarea./16 Outer Ketchikan has been renamed Hyder Census Subarea.
Table 4.3 (continued)Alaska Places by Borough/Census Area, 2000-2009
Area Name
July 1 2009
Estimate
July 1 2008
Estimate
July 1 2007
Estimate
July 1 2006
Estimate
July 1 2005
Estimate
July 1 2004
Estimate
July 1 2003
Estimate
July 1 2002
Estimate
July 1 2001
Estimate
April1 2000
Census
Sources: U.S. Census Bureau and Alaska Department of Labor and Workforce Development, Research and Analysis Section, Demographics Unit

Alaska Population Digest • 2009 Estimates 61
Sitka City and Borough 8,627 8,641 8,621 8,992 8,948 8,826 8,892 8,794 8,727 8,835
Sitka City and Borough 8,627 8,641 8,621 8,992 8,948 8,826 8,892 8,794 8,727 8,835
Skagway-Hoonah-Angoon Census Area /12 2,908 2,908 2,976 3,008 3,050 3,106 3,150 3,229 3,358 3,436
Hoonah-Angoon Census Area /12 2,043 2,062 2,133 2,153 2,216 2,233 2,307 2,385 2,520 2,574
Hoonah-Angoon census subarea 1,971 1,990 2,041 2,045 2,111 2,113 2,191 2,277 2,396 2,435
Angoon city * 442 429 474 479 495 481 504 541 555 572 Cube Cove CDP 0 0 0 0 0 0 0 30 68 72 Elfin Cove CDP 25 22 21 25 29 26 32 32 28 32 Game Creek CDP 16 18 19 21 21 26 36 35 35 35 Gustavus city /11 451 446 439 439 458 449 435 420 416 429 Hobart Bay CDP 1 1 1 2 3 0 0 0 0 3 Hoonah city * 764 819 836 824 857 839 846 873 871 860 Pelican city 122 112 108 106 114 117 112 115 159 163 Tenakee Springs city 104 99 102 104 98 104 105 98 105 104 Whitestone Logging Camp CDP 9 11 9 0 3 0 60 75 109 116 Remainder of Skagway-Hoonah-Angoon csa 37 33 32 45 33 71 61 58 50 49
Klukwan census subarea 72 72 92 108 105 120 116 108 124 139 Klukwan CDP (Chilkat *) 72 72 92 108 105 120 116 108 124 139/11 Gustavus incorporated 3/16/2004
Skagway Municipality /12 865 846 843 855 834 873 843 844 838 862
Skagway city 865 846 843 855 834 873 843 844 838 862/12 Skagway Municipality incorporated as a Borough June 20,2007, dissolving Skagway city.
Southeast Fairbanks Census Area 7,243 7,159 6,992 6,749 6,474 6,144 5,923 5,945 5,907 6,174
Alcan Border CDP 26 11 17 12 11 19 15 10 11 21 Big Delta CDP 840 844 839 732 733 734 726 781 791 749 Chicken CDP 23 20 21 22 14 20 21 24 18 17 Delta Junction city 1,128 1,080 999 1,003 989 948 961 887 876 885 Deltana CDP 2,355 2,265 2,194 1,929 1,903 1,741 1,707 1,669 1,652 1,570 Dot Lake CDP 16 22 19 18 25 28 29 18 25 19 Dot Lake Village CDP (Dot Lake*) 37 42 58 34 32 32 39 34 31 38 Dry Creek CDP 87 89 99 96 101 102 109 123 132 128 Eagle city 146 139 126 111 136 115 125 152 142 129 Eagle * 61 64 73 72 73 74 66 72 71 77 Eagle Village CDP 54 57 65 63 65 65 59 64 63 68 Fort Greely CDP 413 539 425 754 376 271 5 11 23 461 Healy Lake CDP * 10 18 41 42 28 33 33 42 39 37 Northway CDP 88 82 81 75 87 84 105 93 96 95 Northway Junction CDP 60 59 64 58 78 76 69 73 81 72 Northway Village CDP (Northway *) 76 79 90 88 90 93 95 108 105 107 Tanacross CDP * 203 185 182 146 145 133 143 146 140 140 Tetlin ** 169 142 159 153 153 141 143 146 148 124 Tetlin CDP 97 113 113 103 130 119 121 124 129 117 Tok CDP 1,429 1,397 1,423 1,325 1,409 1,403 1,429 1,446 1,416 1,393 Remainder of Southeast Fairbanks csa 76 82 82 79 91 97 103 110 110 112
Valdez-Cordova Census Area 9,248 9,495 9,594 9,774 10,025 9,979 10,202 10,075 10,047 10,195
Chugach census subarea /7 6,029 6,247 6,237 6,420 6,522 6,495 6,647 6,695 6,635 6,964
Chenega CDP * 71 77 69 85 43 49 77 59 50 86 Cordova city 2,126 2,155 2,180 2,236 2,292 2,300 2,291 2,302 2,382 2,454 Eyak * 107 119 133 135 146 135 143 153 158 168 Tatitlek CDP * 83 102 110 117 102 107 105 103 96 107 Valdez city /5 3,475 3,628 3,580 3,675 3,754 3,719 3,897 3,952 3,825 4,036
Table 4.3 (continued)Alaska Places by Borough/Census Area, 2000-2009
Area Name
July 1 2009
Estimate
July 1 2008
Estimate
July 1 2007
Estimate
July 1 2006
Estimate
July 1 2005
Estimate
July 1 2004
Estimate
July 1 2003
Estimate
July 1 2002
Estimate
July 1 2001
Estimate
April1 2000
Census
Sources: U.S. Census Bureau and Alaska Department of Labor and Workforce Development, Research and Analysis Section, Demographics Unit
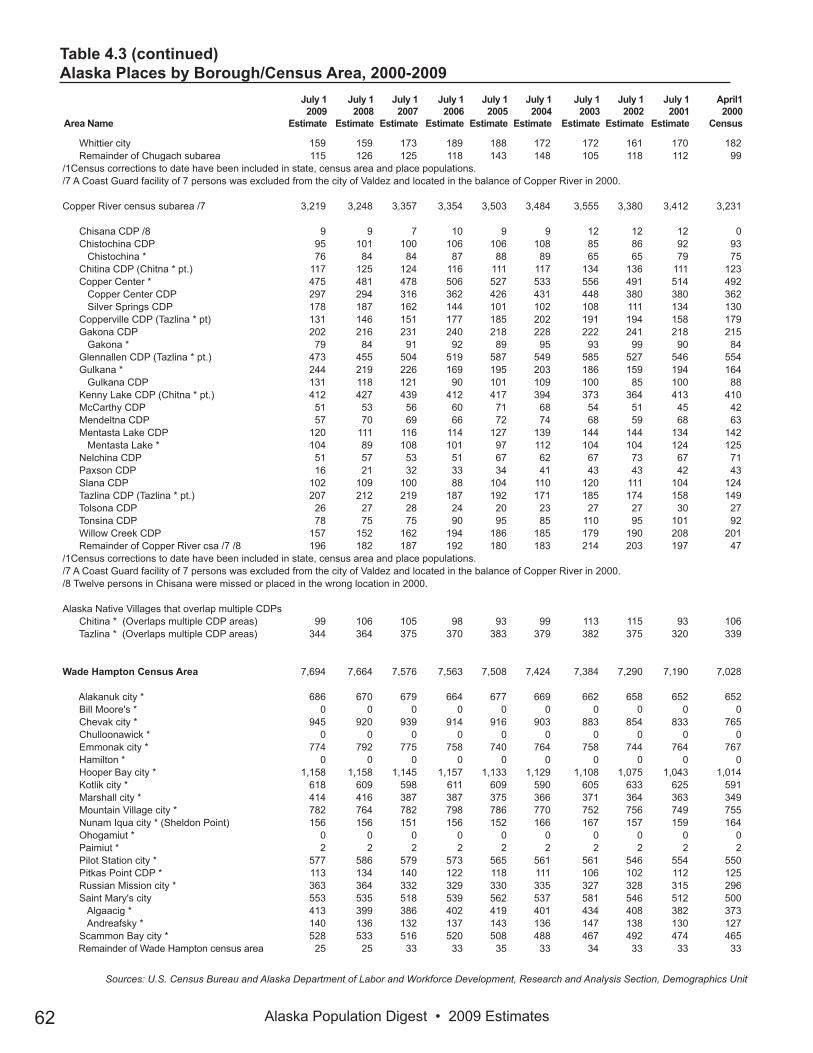
Alaska Population Digest • 2009 Estimates62
Whittier city 159 159 173 189 188 172 172 161 170 182 Remainder of Chugach subarea 115 126 125 118 143 148 105 118 112 99/1Census corrections to date have been included in state, census area and place populations./7 A Coast Guard facility of 7 persons was excluded from the city of Valdez and located in the balance of Copper River in 2000.
Copper River census subarea /7 3,219 3,248 3,357 3,354 3,503 3,484 3,555 3,380 3,412 3,231
Chisana CDP /8 9 9 7 10 9 9 12 12 12 0 Chistochina CDP 95 101 100 106 106 108 85 86 92 93 Chistochina * 76 84 84 87 88 89 65 65 79 75 Chitina CDP (Chitna * pt.) 117 125 124 116 111 117 134 136 111 123 Copper Center * 475 481 478 506 527 533 556 491 514 492 Copper Center CDP 297 294 316 362 426 431 448 380 380 362 Silver Springs CDP 178 187 162 144 101 102 108 111 134 130 Copperville CDP (Tazlina * pt) 131 146 151 177 185 202 191 194 158 179 Gakona CDP 202 216 231 240 218 228 222 241 218 215 Gakona * 79 84 91 92 89 95 93 99 90 84 Glennallen CDP (Tazlina * pt.) 473 455 504 519 587 549 585 527 546 554 Gulkana * 244 219 226 169 195 203 186 159 194 164 Gulkana CDP 131 118 121 90 101 109 100 85 100 88 Kenny Lake CDP (Chitna * pt.) 412 427 439 412 417 394 373 364 413 410 McCarthy CDP 51 53 56 60 71 68 54 51 45 42 Mendeltna CDP 57 70 69 66 72 74 68 59 68 63 Mentasta Lake CDP 120 111 116 114 127 139 144 144 134 142 Mentasta Lake * 104 89 108 101 97 112 104 104 124 125 Nelchina CDP 51 57 53 51 67 62 67 73 67 71 Paxson CDP 16 21 32 33 34 41 43 43 42 43 Slana CDP 102 109 100 88 104 110 120 111 104 124 Tazlina CDP (Tazlina * pt.) 207 212 219 187 192 171 185 174 158 149 Tolsona CDP 26 27 28 24 20 23 27 27 30 27 Tonsina CDP 78 75 75 90 95 85 110 95 101 92 Willow Creek CDP 157 152 162 194 186 185 179 190 208 201 Remainder of Copper River csa /7 /8 196 182 187 192 180 183 214 203 197 47/1Census corrections to date have been included in state, census area and place populations./7 A Coast Guard facility of 7 persons was excluded from the city of Valdez and located in the balance of Copper River in 2000./8 Twelve persons in Chisana were missed or placed in the wrong location in 2000.
Alaska Native Villages that overlap multiple CDPs Chitina * (Overlaps multiple CDP areas) 99 106 105 98 93 99 113 115 93 106 Tazlina * (Overlaps multiple CDP areas) 344 364 375 370 383 379 382 375 320 339
Wade Hampton Census Area 7,694 7,664 7,576 7,563 7,508 7,424 7,384 7,290 7,190 7,028
Alakanuk city * 686 670 679 664 677 669 662 658 652 652 Bill Moore's * 0 0 0 0 0 0 0 0 0 0 Chevak city * 945 920 939 914 916 903 883 854 833 765 Chulloonawick * 0 0 0 0 0 0 0 0 0 0 Emmonak city * 774 792 775 758 740 764 758 744 764 767 Hamilton * 0 0 0 0 0 0 0 0 0 0 Hooper Bay city * 1,158 1,158 1,145 1,157 1,133 1,129 1,108 1,075 1,043 1,014 Kotlik city * 618 609 598 611 609 590 605 633 625 591 Marshall city * 414 416 387 387 375 366 371 364 363 349 Mountain Village city * 782 764 782 798 786 770 752 756 749 755 Nunam Iqua city * (Sheldon Point) 156 156 151 156 152 166 167 157 159 164 Ohogamiut * 0 0 0 0 0 0 0 0 0 0 Paimiut * 2 2 2 2 2 2 2 2 2 2 Pilot Station city * 577 586 579 573 565 561 561 546 554 550 Pitkas Point CDP * 113 134 140 122 118 111 106 102 112 125 Russian Mission city * 363 364 332 329 330 335 327 328 315 296 Saint Mary's city 553 535 518 539 562 537 581 546 512 500 Algaacig * 413 399 386 402 419 401 434 408 382 373 Andreafsky * 140 136 132 137 143 136 147 138 130 127 Scammon Bay city * 528 533 516 520 508 488 467 492 474 465 Remainder of Wade Hampton census area 25 25 33 33 35 33 34 33 33 33
Table 4.3 (continued)Alaska Places by Borough/Census Area, 2000-2009
Area Name
July 1 2009
Estimate
July 1 2008
Estimate
July 1 2007
Estimate
July 1 2006
Estimate
July 1 2005
Estimate
July 1 2004
Estimate
July 1 2003
Estimate
July 1 2002
Estimate
July 1 2001
Estimate
April1 2000
Census
Sources: U.S. Census Bureau and Alaska Department of Labor and Workforce Development, Research and Analysis Section, Demographics Unit

Alaska Population Digest • 2009 Estimates 63
Wrangell-Petersburg Census Area /14 /15 5,852 5,957 6,010 6,036 6,169 6,270 6,324 6,462 6,589 6,684
Kake city * 497 519 534 536 598 659 680 698 694 710 Kupreanof city 24 27 26 31 37 38 30 23 23 23 Petersburg city 2,973 3,010 3,042 3,125 3,156 3,132 3,080 3,157 3,225 3,224 Port Alexander city 61 51 59 64 75 67 70 72 84 81 Thoms Place CDP 6 7 7 7 9 10 12 12 20 22 Wrangell city 1,892 1,939 1,940 1,909 1,976 2,022 2,122 2,180 2,223 2,308 Remainder of Wrangell-Petersburg census area 383 387 402 364 318 342 330 320 320 316
Petersburg Census Area /15 3,794 3,848 --- --- --- --- --- --- --- 4,260
Kake city * 497 519 --- --- --- --- --- --- --- 710 Kupreanof city 24 27 --- --- --- --- --- --- --- 23 Petersburg city 2,973 3,010 --- --- --- --- --- --- --- 3,224 Port Alexander city 61 51 --- --- --- --- --- --- --- 81 Remainder of Petersburg census area 239 241 --- --- --- --- --- --- --- 222/15 Petersburg Census Area comprises the balance of the old Wrangell-Petersburg Census Area after the formation of the Wrangell Borough.
Wrangell City and Borough /14 2,058 2,109 --- --- --- --- --- --- --- 2451
Meyers Chuck (CDP) 16 17 --- --- --- --- --- --- --- 21 Thoms Place (CDP) 6 7 --- --- --- --- --- --- --- 22 Wrangell (city) 1,892 1,939 --- --- --- --- --- --- --- 2,308 Remainder of Wrangell Borough 144 146 --- --- --- --- --- --- --- 100/14 Wrangell City and Borough was formed in May 2008, dissolving the city of Wrangell, and annexing Meyer Chuck CDP and part of the Outer Ketchikan Census Subarea.
Yakutat City and Borough 628 592 620 636 644 676 690 719 696 808
Yakutat CDP * 608 590 618 634 642 621 635 664 642 680 Remainder of Yakutat Borough 20 2 2 2 2 55 55 55 54 128
Yukon Koyukuk Census Area /1 5,603 5,673 5,744 5,845 6,059 6,276 6,301 6,355 6,485 6,510
Koyukuk-Middle Yukon census subarea /1 3,270 3,352 3,359 3,448 3,603 3,712 3,721 3,697 3,757 3,798
Allakaket * 137 131 128 127 127 125 131 125 135 133 New Allakaket CDP 37 35 35 35 34 34 36 34 36 36 Allakaket city 100 96 93 92 93 91 95 91 99 97 Alatna CDP * 22 29 31 36 32 33 36 36 36 35 Evansville * 32 36 46 43 51 50 53 52 68 71 Bettles city 19 22 28 25 30 30 32 31 41 43 Evansville CDP 13 14 18 18 21 20 21 21 27 28 Coldfoot CDP 13 12 11 13 11 10 15 11 14 13 Four Mile Road CDP 39 40 35 39 31 29 39 39 42 38 Galena city * 564 581 607 636 654 691 717 698 674 675 Hughes city * 79 80 77 68 69 72 64 68 75 78 Huslia city * 265 277 253 258 260 269 283 281 280 293 Kaltag city * 172 188 184 199 227 211 223 218 224 230 Koyukuk city * 105 87 89 88 97 109 108 99 95 101 Livengood CDP 24 23 21 25 28 29 21 30 32 29 Manley Hot Springs CDP * 81 78 73 79 74 73 70 72 73 72 Minto CDP * 191 190 180 186 203 207 227 224 225 258 Nenana city * 353 354 366 355 353 370 371 401 392 402 Nulato city * 240 274 274 290 310 319 333 338 354 336 Rampart CDP * 12 16 17 21 16 20 21 21 24 45 Ruby city * 149 160 167 174 185 190 165 190 187 188 Stevens Village CDP * 64 58 71 63 66 76 82 83 73 87 Tanana city * 251 251 257 260 282 303 282 272 302 308 Wiseman CDP 16 16 17 22 17 26 27 25 25 21 Remainder of Yukon-Koyukuk census subarea 461 471 455 466 510 500 453 414 427 385
/1 /2/1Census corrections to date have been included in state, census area and place populations./2 Most of Lime Village (41 persons) was erroneously reported in the balance of Koyukuk-Middle Yukon in 2000.
Table 4.3 (continued)Alaska Places by Borough/Census Area, 2000-2009
Area Name
July 1 2009
Estimate
July 1 2008
Estimate
July 1 2007
Estimate
July 1 2006
Estimate
July 1 2005
Estimate
July 1 2004
Estimate
July 1 2003
Estimate
July 1 2002
Estimate
July 1 2001
Estimate
April1 2000
Census
Sources: U.S. Census Bureau and Alaska Department of Labor and Workforce Development, Research and Analysis Section, Demographics Unit

Alaska Population Digest • 2009 Estimates64
McGrath-Holy Cross census subarea 1,030 1,022 1,069 1,094 1,143 1,194 1,245 1,282 1,325 1,276
Anvik city * 75 84 102 88 99 100 105 107 102 104 Flat CDP 0 0 0 0 0 0 0 0 1 4 Grayling city * 177 152 164 173 171 182 162 188 202 194 Holy Cross city * 187 194 199 204 206 206 203 225 227 227 Lake Minchumina CDP 17 17 17 20 19 19 23 24 21 32 McGrath city * 322 317 314 320 347 364 403 398 437 401 Nikolai city* 87 90 88 97 109 121 123 117 101 100 Shageluk city * 97 102 118 124 129 131 141 141 144 129 Takotna CDP * 53 46 47 49 41 45 61 53 55 50 Telida * 3 3 3 3 2 2 2 2 3 3 Remainder of McGrath-Holy Cross census subarea 12 17 17 16 20 24 22 27 32 32
Yukon Flats census subarea 1,303 1,299 1,316 1,303 1,313 1,370 1,335 1,376 1,403 1,436
Arctic Village CDP * 139 158 155 146 148 146 162 168 158 152 Beaver CDP * 58 65 65 72 64 67 63 75 80 84 Birch Creek CDP * 31 23 28 30 33 43 32 38 36 28 Central CDP 96 95 93 88 97 101 110 119 135 134 Chalkyitsik CDP * 60 72 72 65 79 84 82 85 80 83 Circle CDP * 99 94 102 95 90 98 93 82 95 100 Fort Yukon city * 585 585 588 595 570 593 559 569 565 595 Venetie CDP 185 177 181 187 184 188 193 194 194 202 Remainder of Yukon Flats census subarea 50 30 32 25 48 50 41 46 60 58
Table 4.3 (continued)Alaska Places by Borough/Census Area, 2000-2009
Area Name
July 1 2009
Estimate
July 1 2008
Estimate
July 1 2007
Estimate
July 1 2006
Estimate
July 1 2005
Estimate
July 1 2004
Estimate
July 1 2003
Estimate
July 1 2002
Estimate
July 1 2001
Estimate
April1 2000
Census
Sources: U.S. Census Bureau and Alaska Department of Labor and Workforce Development, Research and Analysis Section, Demographics Unit

Alaska Population Digest • 2009 Estimates 65
Sources: U.S. Census Bureau and Alaska Department of Labor and Workforce Development, Research and Analysis Section, Demographics Unit
Table 4.4Alphabetical Listing of Alaska Places, 2000, 2006-2009
Area Name
Vintage 2009 Estimates
Census 2000
Place Rank 2009
Place Rank 2000
City Rank 2009
City Rank 2000
Estimate 2009
Estimate 2008
Estimate 2007
Estimate 2006
Alaska 692,314 679,720 674,510 669,716 626,931
Aleutians East Borough 2,778 2,698 2,792 2,591 2,697 21 22Aleutians West Census Area 4,549 4,436 4,499 4,916 5,465 19 19Anchorage, Municipality of 290,588 283,912 282,968 283,348 260,283 1 1Bethel Census Area 16,997 16,924 16,790 17,049 16,046 6 6Bristol Bay Borough 967 1,027 1,032 1,058 1,258 27 26Denali Borough 1,838 1,806 1,766 1,797 1,893 25 24Dillingham Census Area 4,729 4,767 4,779 4,806 4,922 18 20Fairbanks North Star Borough 93,779 92,762 91,525 87,797 82,840 2 2Haines Borough 2,286 2,322 2,264 2,252 2,392 22 23Juneau City and Borough 30,661 30,405 30,198 30,822 30,711 5 5Kenai Peninsula Borough 53,578 52,959 52,230 51,467 49,691 4 4Ketchikan Gateway Borough 12,984 12,980 13,116 13,206 14,059 8 7Kodiak Island Borough 13,860 13,954 13,664 13,457 13,913 7 8Lake and Peninsula Borough 1,547 1,552 1,534 1,559 1,823 26 25Matanuska-Susitna Borough 84,314 82,429 79,868 77,302 59,322 3 3Nome Census Area 9,500 9,493 9,485 9,545 9,196 9 10North Slope Borough 6,798 6,703 6,726 6,811 7,385 15 12Northwest Arctic Borough 7,366 7,401 7,377 7,335 7,208 13 13Prince of Wales-Outer Ketchikan C.A. 5,392 5,358 5,310 5,481 6,157 17 18Sitka City and Borough 8,627 8,641 8,621 8,992 8,835 11 11Skagway-Hoonah-Angoon Census Area 2,908 2,908 2,976 3,008 3,436 21 Hoonah-Angoon Census Area 2,043 2,062 2,133 2,153 2,574 24 Skagway Municipality 865 846 843 855 862 28Southeast Fairbanks Census Area 7,243 7,159 6,992 6,749 6,174 14 17Valdez-Cordova Census Area 9,248 9,495 9,594 9,774 10,195 10 9Wade Hampton Census Area 7,694 7,664 7,576 7,563 7,028 12 14Wrangell-Petersburg Census Area --- --- 6,010 6,036 6,684 15 Petersburg Census Area 3,794 3,848 --- --- 4,260 20 Wrangell City and Borough 2,058 2,109 --- --- 2,451 23Yakutat City and Borough 628 592 620 636 808 29 27Yukon Koyukuk Census Area 5,603 5,673 5,744 5,845 6,510 16 16
Adak city 165 178 137 146 316 205 148 112 82 Akhiok city * 51 48 36 41 80 289 274 146 141 Akiachak CDP * 645 657 626 634 585 89 94 Akiak city * 346 341 350 365 309 144 150 80 84 Akutan city * 846 796 859 745 713 66 76 32 40 Alakanuk city * 686 670 679 664 652 84 84 43 44 Alatna CDP * 22 29 31 36 35 319 315 Alcan Border CDP 26 11 17 12 21 311 336 Aleknagik city * 229 250 232 241 221 175 179 100 107 Aleneva CDP 67 57 61 46 68 272 286 Allakaket city 137 131 128 127 97 217 257 121 137 Alpine CDP 0 0 0 0 0 349 355 Ambler city * 261 258 277 277 309 163 151 92 85 Anaktuvuk Pass city * 287 284 277 299 282 153 160 85 92 Anchor Point CDP 1,772 1,808 1,785 1,794 1,845 43 37 Anchorage, Municipality of 290,588 283,912 282,968 283,348 260,283 1 1 1 1 Anderson city 275 256 263 278 367 158 138 88 78 Angoon city * 442 429 474 479 572 122 97 65 51 Aniak city * 485 491 505 515 572 112 96 60 50 Annette Island Reserve 1,385 1,370 1,332 1,375 1,447 50 47 Anvik city * 75 84 102 88 104 261 248 137 133 Arctic Village CDP * 139 158 155 146 152 216 205 Atka city * 71 73 74 73 92 268 264 139 138 Atmautluak CDP * 296 306 305 296 294 151 156 Atqasuk city * 201 219 222 237 228 182 175 103 104
Note: Census corrections to date have been included in all estimates.CDP-Census Designated Place *Alaska Native Village Statistical Area **Tribal Designated Statistical Area
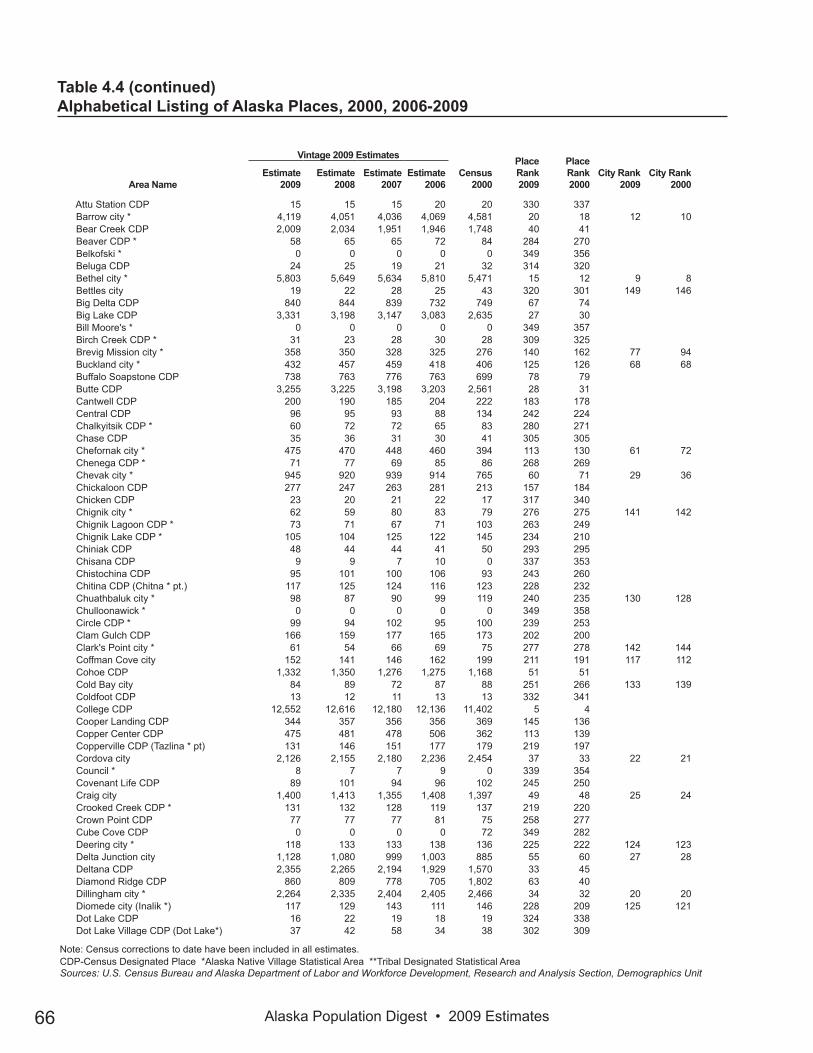
Alaska Population Digest • 2009 Estimates66
Table 4.4 (continued)Alphabetical Listing of Alaska Places, 2000, 2006-2009
Sources: U.S. Census Bureau and Alaska Department of Labor and Workforce Development, Research and Analysis Section, Demographics Unit
Attu Station CDP 15 15 15 20 20 330 337 Barrow city * 4,119 4,051 4,036 4,069 4,581 20 18 12 10 Bear Creek CDP 2,009 2,034 1,951 1,946 1,748 40 41 Beaver CDP * 58 65 65 72 84 284 270 Belkofski * 0 0 0 0 0 349 356 Beluga CDP 24 25 19 21 32 314 320 Bethel city * 5,803 5,649 5,634 5,810 5,471 15 12 9 8 Bettles city 19 22 28 25 43 320 301 149 146 Big Delta CDP 840 844 839 732 749 67 74 Big Lake CDP 3,331 3,198 3,147 3,083 2,635 27 30 Bill Moore's * 0 0 0 0 0 349 357 Birch Creek CDP * 31 23 28 30 28 309 325 Brevig Mission city * 358 350 328 325 276 140 162 77 94 Buckland city * 432 457 459 418 406 125 126 68 68 Buffalo Soapstone CDP 738 763 776 763 699 78 79 Butte CDP 3,255 3,225 3,198 3,203 2,561 28 31 Cantwell CDP 200 190 185 204 222 183 178 Central CDP 96 95 93 88 134 242 224 Chalkyitsik CDP * 60 72 72 65 83 280 271 Chase CDP 35 36 31 30 41 305 305 Chefornak city * 475 470 448 460 394 113 130 61 72 Chenega CDP * 71 77 69 85 86 268 269 Chevak city * 945 920 939 914 765 60 71 29 36 Chickaloon CDP 277 247 263 281 213 157 184 Chicken CDP 23 20 21 22 17 317 340 Chignik city * 62 59 80 83 79 276 275 141 142 Chignik Lagoon CDP * 73 71 67 71 103 263 249 Chignik Lake CDP * 105 104 125 122 145 234 210 Chiniak CDP 48 44 44 41 50 293 295 Chisana CDP 9 9 7 10 0 337 353 Chistochina CDP 95 101 100 106 93 243 260 Chitina CDP (Chitna * pt.) 117 125 124 116 123 228 232 Chuathbaluk city * 98 87 90 99 119 240 235 130 128 Chulloonawick * 0 0 0 0 0 349 358 Circle CDP * 99 94 102 95 100 239 253 Clam Gulch CDP 166 159 177 165 173 202 200 Clark's Point city * 61 54 66 69 75 277 278 142 144 Coffman Cove city 152 141 146 162 199 211 191 117 112 Cohoe CDP 1,332 1,350 1,276 1,275 1,168 51 51 Cold Bay city 84 89 72 87 88 251 266 133 139 Coldfoot CDP 13 12 11 13 13 332 341 College CDP 12,552 12,616 12,180 12,136 11,402 5 4 Cooper Landing CDP 344 357 356 356 369 145 136 Copper Center CDP 475 481 478 506 362 113 139 Copperville CDP (Tazlina * pt) 131 146 151 177 179 219 197 Cordova city 2,126 2,155 2,180 2,236 2,454 37 33 22 21 Council * 8 7 7 9 0 339 354 Covenant Life CDP 89 101 94 96 102 245 250 Craig city 1,400 1,413 1,355 1,408 1,397 49 48 25 24 Crooked Creek CDP * 131 132 128 119 137 219 220 Crown Point CDP 77 77 77 81 75 258 277 Cube Cove CDP 0 0 0 0 72 349 282 Deering city * 118 133 133 138 136 225 222 124 123 Delta Junction city 1,128 1,080 999 1,003 885 55 60 27 28 Deltana CDP 2,355 2,265 2,194 1,929 1,570 33 45 Diamond Ridge CDP 860 809 778 705 1,802 63 40 Dillingham city * 2,264 2,335 2,404 2,405 2,466 34 32 20 20 Diomede city (Inalik *) 117 129 143 111 146 228 209 125 121 Dot Lake CDP 16 22 19 18 19 324 338 Dot Lake Village CDP (Dot Lake*) 37 42 58 34 38 302 309
Note: Census corrections to date have been included in all estimates.CDP-Census Designated Place *Alaska Native Village Statistical Area **Tribal Designated Statistical Area
Area Name
Vintage 2009 Estimates
Census 2000
Place Rank 2009
Place Rank 2000
City Rank 2009
City Rank 2000
Estimate 2009
Estimate 2008
Estimate 2007
Estimate 2006
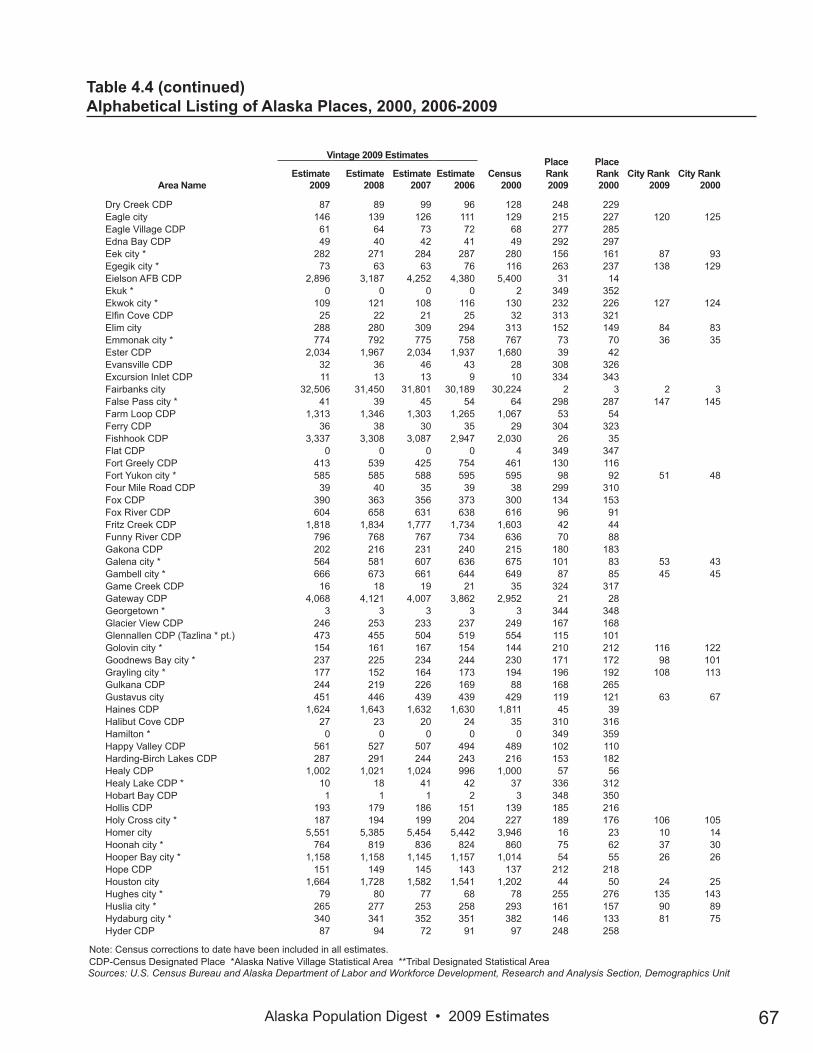
Alaska Population Digest • 2009 Estimates 67
Sources: U.S. Census Bureau and Alaska Department of Labor and Workforce Development, Research and Analysis Section, Demographics Unit
Table 4.4 (continued)Alphabetical Listing of Alaska Places, 2000, 2006-2009
Dry Creek CDP 87 89 99 96 128 248 229 Eagle city 146 139 126 111 129 215 227 120 125 Eagle Village CDP 61 64 73 72 68 277 285 Edna Bay CDP 49 40 42 41 49 292 297 Eek city * 282 271 284 287 280 156 161 87 93 Egegik city * 73 63 63 76 116 263 237 138 129 Eielson AFB CDP 2,896 3,187 4,252 4,380 5,400 31 14 Ekuk * 0 0 0 0 2 349 352 Ekwok city * 109 121 108 116 130 232 226 127 124 Elfin Cove CDP 25 22 21 25 32 313 321 Elim city 288 280 309 294 313 152 149 84 83 Emmonak city * 774 792 775 758 767 73 70 36 35 Ester CDP 2,034 1,967 2,034 1,937 1,680 39 42 Evansville CDP 32 36 46 43 28 308 326 Excursion Inlet CDP 11 13 13 9 10 334 343 Fairbanks city 32,506 31,450 31,801 30,189 30,224 2 3 2 3 False Pass city * 41 39 45 54 64 298 287 147 145 Farm Loop CDP 1,313 1,346 1,303 1,265 1,067 53 54 Ferry CDP 36 38 30 35 29 304 323 Fishhook CDP 3,337 3,308 3,087 2,947 2,030 26 35 Flat CDP 0 0 0 0 4 349 347 Fort Greely CDP 413 539 425 754 461 130 116 Fort Yukon city * 585 585 588 595 595 98 92 51 48 Four Mile Road CDP 39 40 35 39 38 299 310 Fox CDP 390 363 356 373 300 134 153 Fox River CDP 604 658 631 638 616 96 91 Fritz Creek CDP 1,818 1,834 1,777 1,734 1,603 42 44 Funny River CDP 796 768 767 734 636 70 88 Gakona CDP 202 216 231 240 215 180 183 Galena city * 564 581 607 636 675 101 83 53 43 Gambell city * 666 673 661 644 649 87 85 45 45 Game Creek CDP 16 18 19 21 35 324 317 Gateway CDP 4,068 4,121 4,007 3,862 2,952 21 28 Georgetown * 3 3 3 3 3 344 348 Glacier View CDP 246 253 233 237 249 167 168 Glennallen CDP (Tazlina * pt.) 473 455 504 519 554 115 101 Golovin city * 154 161 167 154 144 210 212 116 122 Goodnews Bay city * 237 225 234 244 230 171 172 98 101 Grayling city * 177 152 164 173 194 196 192 108 113 Gulkana CDP 244 219 226 169 88 168 265 Gustavus city 451 446 439 439 429 119 121 63 67 Haines CDP 1,624 1,643 1,632 1,630 1,811 45 39 Halibut Cove CDP 27 23 20 24 35 310 316 Hamilton * 0 0 0 0 0 349 359 Happy Valley CDP 561 527 507 494 489 102 110 Harding-Birch Lakes CDP 287 291 244 243 216 153 182 Healy CDP 1,002 1,021 1,024 996 1,000 57 56 Healy Lake CDP * 10 18 41 42 37 336 312 Hobart Bay CDP 1 1 1 2 3 348 350 Hollis CDP 193 179 186 151 139 185 216 Holy Cross city * 187 194 199 204 227 189 176 106 105 Homer city 5,551 5,385 5,454 5,442 3,946 16 23 10 14 Hoonah city * 764 819 836 824 860 75 62 37 30 Hooper Bay city * 1,158 1,158 1,145 1,157 1,014 54 55 26 26 Hope CDP 151 149 145 143 137 212 218 Houston city 1,664 1,728 1,582 1,541 1,202 44 50 24 25 Hughes city * 79 80 77 68 78 255 276 135 143 Huslia city * 265 277 253 258 293 161 157 90 89 Hydaburg city * 340 341 352 351 382 146 133 81 75 Hyder CDP 87 94 72 91 97 248 258
Note: Census corrections to date have been included in all estimates.CDP-Census Designated Place *Alaska Native Village Statistical Area **Tribal Designated Statistical Area
Area Name
Vintage 2009 Estimates
Census 2000
Place Rank 2009
Place Rank 2000
City Rank 2009
City Rank 2000
Estimate 2009
Estimate 2008
Estimate 2007
Estimate 2006

Alaska Population Digest • 2009 Estimates68
Table 4.4 (continued)Alphabetical Listing of Alaska Places, 2000, 2006-2009
Sources: U.S. Census Bureau and Alaska Department of Labor and Workforce Development, Research and Analysis Section, Demographics Unit
Igiugig CDP * 48 40 32 53 53 293 293 Iliamna CDP * 91 93 87 82 102 244 251 Ivanof Bay CDP * 0 0 0 0 22 349 332 Juneau city and borough 30,661 30,405 30,198 30,822 30,711 3 2 3 2 Kachemak city 430 450 460 463 431 126 119 69 65 Kake city * 497 519 534 536 710 110 78 59 42 Kaktovik city * 286 274 286 288 293 155 158 86 90 Kalifornsky CDP 7,495 7,394 7,151 6,995 5,846 9 11 Kaltag city * 172 188 184 199 230 198 174 110 103 Karluk CDP * 38 38 40 34 27 300 327 Kasaan city * 56 54 62 58 39 287 306 145 148 Kasigluk CDP * 567 576 543 540 543 100 105 Kasilof CDP 536 504 577 533 471 106 112 Kenai city 7,115 7,068 6,913 6,797 6,942 13 8 7 6 Kenny Lake CDP (Chitna * pt.) 412 427 439 412 410 131 125 Ketchikan city 7,503 7,502 7,644 7,641 7,922 8 6 5 5 Kiana city * 374 383 390 399 388 137 132 75 74 King Cove city * 744 750 754 745 792 76 66 38 33 King Salmon CDP 383 410 424 400 442 136 117 Kipnuk CDP * 671 694 662 667 644 86 86 Kivalina city * 410 406 397 392 377 132 134 73 76 Klawock city * 782 781 741 781 854 71 64 34 31 Klukwan CDP (Chilkat *) 72 72 92 108 139 266 217 Knik River CDP 631 666 679 677 582 90 95 Knik-Fairview CDP 13,824 13,103 12,304 11,385 7,049 4 7 Kobuk city * 122 109 119 135 109 221 242 122 131 Kodiak city 6,626 6,541 5,796 5,670 6,334 14 10 8 7 Kodiak Station CDP 1,321 1,235 1,974 1,887 1,840 52 38 Kokhanok CDP * 184 177 174 169 174 192 199 Koliganek CDP (New Koliganek *) 182 174 192 165 182 193 195 Kongiganak CDP * 465 444 434 416 359 117 140 Kotlik city * 618 609 598 611 591 92 93 47 49 Kotzebue city * 3,154 3,124 3,121 3,105 3,082 29 27 17 18 Koyuk city * 358 333 346 370 297 140 154 77 87 Koyukuk city * 105 87 89 88 101 234 252 128 134 Kupreanof city 24 27 26 31 23 314 330 148 149 Kwethluk city * 723 738 719 696 713 81 77 40 41 Kwigillingok CDP * 365 352 360 377 338 138 144 Lake Louise CDP 100 88 93 86 88 238 267 Lake Minchumina CDP 17 17 17 20 32 323 322 Lakes CDP 8,388 8,308 8,103 7,975 6,706 7 9 Larsen Bay city * 79 68 89 83 115 255 239 135 130 Lazy Mountain CDP 1,446 1,455 1,428 1,371 1,158 46 52 Levelock CDP * 88 70 70 61 122 246 233 Lime Village CDP * 19 15 25 26 46 320 299 Livengood CDP 24 23 21 25 29 314 324 Lowell Point CDP 76 94 85 81 92 259 262 Lower Kalskag city * 251 255 251 267 267 165 164 94 96 Lutak CDP 38 53 42 46 39 300 307 Manley Hot Springs CDP * 81 78 73 79 72 254 280 Manokotak city * 438 429 430 424 399 123 129 66 71 Marshall city * 414 416 387 387 349 129 142 72 80 Mary's Igloo * 0 0 0 0 0 349 360 McCarthy CDP 51 53 56 60 42 289 303 McGrath city * 322 317 314 320 401 149 128 83 70 McKinley Park CDP 168 160 150 147 142 201 213 Meadow Lakes CDP 7,319 7,179 6,841 6,535 4,819 11 16 Mekoryuk city * 174 195 207 220 210 197 185 109 109 Mendeltna CDP 57 70 69 66 63 285 288 Mentasta Lake CDP 120 111 116 114 142 224 214
Note: Census corrections to date have been included in all estimates.CDP-Census Designated Place *Alaska Native Village Statistical Area **Tribal Designated Statistical Area
Area Name
Vintage 2009 Estimates
Census 2000
Place Rank 2009
Place Rank 2000
City Rank 2009
City Rank 2000
Estimate 2009
Estimate 2008
Estimate 2007
Estimate 2006

Alaska Population Digest • 2009 Estimates 69
Sources: U.S. Census Bureau and Alaska Department of Labor and Workforce Development, Research and Analysis Section, Demographics Unit
Table 4.4 (continued)Alphabetical Listing of Alaska Places, 2000, 2006-2009
Meyers Chuck CDP --- --- 20 16 21 324 334 Miller Landing CDP 0 0 0 0 74 349 279 Minto CDP * 191 190 180 186 258 187 165 Moose Creek CDP 729 817 655 593 542 79 106 Moose Pass CDP 189 185 199 203 206 188 187 Mosquito Lake CDP 235 238 218 222 221 172 181 Mountain Village city * 782 764 782 798 755 71 73 34 38 Mud Bay CDP 178 159 157 151 137 194 219 Naknek CDP * 516 549 542 583 678 109 82 Nanwalek CDP * 226 228 216 228 177 176 198 Napaimute * 0 0 0 0 0 349 361 Napakiak city * 337 348 377 374 353 147 141 82 79 Napaskiak city * 428 424 425 452 390 127 131 70 73 Naukati Bay CDP 118 123 130 131 135 225 223 Nelchina CDP 51 57 53 51 71 289 283 Nelson Lagoon CDP * 60 65 69 68 83 280 272 Nenana city * 353 354 366 355 402 143 127 79 69 New Allakaket CDP 37 35 35 35 36 302 313 New Stuyahok city * 519 491 446 468 471 108 113 58 61 Newhalen city * 162 171 185 168 160 206 204 113 118 Newtok CDP * 355 357 352 336 321 142 147 Nightmute city * 264 248 243 238 208 162 186 91 110 Nikiski CDP 4,465 4,413 4,333 4,212 4,327 19 20 Nikolaevsk CDP 315 295 304 297 345 150 143 Nikolai city* 87 90 88 97 100 248 254 132 135 Nikolski CDP * 33 27 33 31 39 307 308 Ninilchik CDP 824 836 769 772 772 68 68 Noatak CDP * 486 512 488 470 428 111 122 Nome city 3,468 3,565 3,481 3,541 3,505 25 25 16 16 Nondalton city * 186 199 194 196 221 190 180 107 108 Noorvik city * 628 641 634 636 634 91 89 46 47 North Pole city 2,200 2,207 1,977 1,648 1,570 36 46 21 23 Northway CDP 88 82 81 75 95 246 259 Northway Junction CDP 60 59 64 58 72 280 281 Northway Village CDP (Northway *) 76 79 90 88 107 259 245 Nuiqsut city * 402 383 402 417 433 133 118 74 64 Nulato city * 240 274 274 290 336 170 145 97 81 Nunam Iqua city * (Sheldon Point) 156 156 151 156 164 209 202 115 116 Nunapitchuk city * 539 539 542 547 466 105 114 56 62 Ohogamiut * 0 0 0 0 0 349 362 Old Harbor city * 193 185 201 179 237 185 170 105 99 Oscarville CDP * 109 116 97 83 61 232 290 Ouzinkie city * 170 168 166 172 225 199 177 111 106 Paimiut * 2 2 2 2 2 347 351 Palmer city 5,532 5,395 5,417 5,444 4,533 17 19 11 11 Paxson CDP 16 21 32 33 43 324 302 Pedro Bay CDP * 48 44 38 54 50 293 296 Pelican city 122 112 108 106 163 221 203 122 117 Perryville CDP * 122 132 117 120 107 221 243 Petersburg city 2,973 3,010 3,042 3,125 3,224 30 26 18 17 Petersville CDP 6 9 12 21 27 341 329 Pilot Point city * 66 72 60 66 100 273 255 140 136 Pilot Station city * 577 586 579 573 550 99 102 52 55 Pitkas Point CDP * 113 134 140 122 125 230 230 Platinum city * 57 47 35 38 41 285 304 144 147 Pleasant Valley CDP 765 760 670 703 623 74 90 Point Baker CDP 11 15 15 16 35 334 318 Point Hope city * 705 688 703 737 757 83 72 42 37 Point Lay CDP * 234 256 249 235 247 173 169 Point MacKenzie CDP 273 271 265 236 111 159 240
Note: Census corrections to date have been included in all estimates.CDP-Census Designated Place *Alaska Native Village Statistical Area **Tribal Designated Statistical Area
Area Name
Vintage 2009 Estimates
Census 2000
Place Rank 2009
Place Rank 2000
City Rank 2009
City Rank 2000
Estimate 2009
Estimate 2008
Estimate 2007
Estimate 2006

Alaska Population Digest • 2009 Estimates70
Table 4.4 (continued)Alphabetical Listing of Alaska Places, 2000, 2006-2009
Sources: U.S. Census Bureau and Alaska Department of Labor and Workforce Development, Research and Analysis Section, Demographics Unit
Pope-Vannoy Landing CDP 5 5 5 6 8 343 344 Port Alexander city 61 51 59 64 81 277 273 142 140 Port Alsworth CDP 118 124 115 112 104 225 246 Port Clarence CDP 23 23 23 23 21 317 333 Port Graham CDP * 137 136 137 136 171 217 201 Port Heiden city * 83 90 86 79 119 252 234 134 127 Port Lions city * 200 191 193 196 256 183 167 104 98 Port Protection CDP 72 66 58 60 63 266 289 Portage Creek CDP * 7 7 9 20 36 340 314 Primrose CDP 65 77 75 82 93 274 261 Prudhoe Bay CDP 3 4 3 2 5 344 345 Quinhagak city (Kwinhagak *) 680 659 641 650 555 85 100 44 54 Rampart CDP * 12 16 17 21 45 333 300 Red Devil CDP * 44 48 34 29 48 297 298 Red Dog Mine CDP 35 34 33 33 32 305 319 Ridgeway CDP 2,050 2,007 1,981 1,972 1,932 38 36 Ruby city * 149 160 167 174 188 213 194 118 114 Russian Mission city * 363 364 332 329 296 139 155 76 88 Saint George city * 111 112 114 120 152 231 207 126 120 Saint Mary's city 553 535 518 539 500 103 109 54 60 Saint Michael city * 446 433 444 446 368 120 137 64 77 Saint Paul city * 459 449 446 470 532 118 108 62 59 Salamatof CDP * 855 893 882 932 954 64 58 Salcha CDP 985 949 999 954 854 59 63 Sand Point city * 1,001 958 992 891 952 58 59 28 27 Savoonga city * 721 721 711 712 643 82 87 41 46 Saxman city * 434 424 437 425 431 124 120 67 66 Scammon Bay city * 528 533 516 520 465 107 115 57 63 Selawik city * 849 846 828 842 772 65 69 31 34 Seldovia city 241 254 261 249 286 169 159 96 91 Seldovia Village CDP 166 166 162 164 144 202 211 Seward city 2,609 2,561 2,649 2,593 2,830 32 29 19 19 Shageluk city * 97 102 118 124 129 241 228 131 126 Shaktoolik city * 231 223 213 214 230 174 173 99 102 Shishmaref city * 606 586 607 617 562 94 98 48 52 Shungnak city * 270 271 269 260 256 160 166 89 97 Silver Springs CDP 178 187 162 144 130 194 225 Sitka City and Borough 8,627 8,641 8,621 8,992 8,835 6 5 4 4 Skagway Municipality 865 846 843 855 862 62 61 30 29 Skwentna CDP 73 79 84 73 111 263 241 Slana CDP 102 109 100 88 124 237 231 Sleetmute CDP * 71 70 75 86 100 268 256 Soldotna city 4,021 3,926 3,898 3,762 3,759 22 24 13 15 Solomon * 0 2 2 2 4 349 346 South Naknek CDP * 68 68 66 75 137 271 221 Stebbins city * 605 577 597 613 547 95 103 49 56 Sterling CDP 5,348 5,179 5,132 5,059 4,705 18 17 Stevens Village CDP * 64 58 71 63 87 275 268 Stony River CDP * 48 51 42 53 61 293 291 Sunrise CDP 19 22 22 22 18 320 339 Susitna CDP 16 23 25 24 37 324 311 Sutton-Alpine CDP 1,407 1,294 1,315 1,280 1,080 48 53 Takotna CDP * 53 46 47 49 50 288 294 Talkeetna CDP 894 857 833 834 772 61 67 Tanacross CDP * 203 185 182 146 140 179 215 Tanaina CDP 7,407 7,254 7,127 7,016 4,993 10 15 Tanana city * 251 251 257 260 308 165 152 94 86 Tatitlek CDP * 83 102 110 117 107 252 244 Tazlina CDP (Tazlina * pt.) 207 212 219 187 149 178 208 Telida * 3 3 3 3 3 344 349
Note: Census corrections to date have been included in all estimates.CDP-Census Designated Place *Alaska Native Village Statistical Area **Tribal Designated Statistical Area
Area Name
Vintage 2009 Estimates
Census 2000
Place Rank 2009
Place Rank 2000
City Rank 2009
City Rank 2000
Estimate 2009
Estimate 2008
Estimate 2007
Estimate 2006

Alaska Population Digest • 2009 Estimates 71
Table 4.4 (continued)Alphabetical Listing of Alaska Places, 2000, 2006-2009
Teller city * 261 259 255 258 268 163 163 92 95 Tenakee Springs city 104 99 102 104 104 236 247 129 132 Tetlin CDP 169 142 159 153 117 200 236 Thoms Place CDP 6 7 7 7 22 341 331 Thorne Bay city 424 439 465 481 557 128 99 71 53 Togiak city * 820 801 786 783 809 69 65 33 32 Tok CDP 1,429 1,397 1,423 1,325 1,393 47 49 Toksook Bay city * 596 603 608 601 532 97 107 50 58 Tolsona CDP 26 27 28 24 27 311 328 Tonsina CDP 78 75 75 90 92 257 263 Trapper Creek CDP 444 405 418 415 423 121 124 Tuluksak CDP * 471 499 485 489 428 116 123 Tuntutuliak CDP * 384 416 420 407 370 135 135 Tununak CDP * 330 332 340 332 325 148 146 Twin Hills CDP * 74 75 81 77 69 262 284 Two Rivers CDP 663 656 624 627 482 88 111 Tyonek CDP * 166 154 179 199 193 202 193 Ugashik CDP * 15 15 13 17 11 330 342 Unalakleet city * 725 722 723 728 747 80 75 39 39 Unalaska city * 3,662 3,549 3,652 4,028 4,283 23 21 14 12 Upper Kalskag city * 223 235 243 270 230 177 171 101 100 Valdez city 3,475 3,628 3,580 3,675 4,036 24 22 15 13 Venetie CDP 185 177 181 187 202 191 189 Wainwright city * 551 534 538 517 546 104 104 55 57 Wales city * 148 139 135 139 152 214 206 119 119 Wasilla city 7,245 6,932 6,927 6,486 5,469 12 13 6 9 Whale Pass CDP 60 48 57 61 58 280 292 White Mountain city * 202 191 214 224 203 180 188 102 111 Whitestone Logging Camp CDP 9 11 9 0 116 337 238 Whittier city 159 159 173 189 182 207 196 114 115 Willow CDP 2,218 2,136 2,046 1,964 1,658 35 43 Willow Creek CDP 157 152 162 194 201 208 190 Wiseman CDP 16 16 17 22 21 324 335 Womens Bay CDP 740 792 747 759 690 77 80 Wrangell (city) 1,892 1,939 1,940 1,909 2,448 41 34 23 22 Y CDP 1,057 1,088 1,082 1,102 956 56 57 Yakutat CDP * 608 590 618 634 680 93 81
Note: Census corrections to date have been included in all estimates.CDP-Census Designated Place *Alaska Native Village Statistical Area **Tribal Designated Statistical AreaSources: U.S. Census Bureau and Alaska Department of Labor and Workforce Development, Research and Analysis Section, Demographics Unit
Area Name
Vintage 2009 Estimates
Census 2000
Place Rank 2009
Place Rank 2000
City Rank 2009
City Rank 2000
Estimate 2009
Estimate 2008
Estimate 2007
Estimate 2006

Alaska Population Digest • 2009 Estimates72
Hoonah-Angoon Census Area
Hobart Bay
Angoon*
Gustavus
TenakeeSprings
Hoonah*Cube Cove
ElfinCove
Klukwan(Chilkat*)
Pelican
KlukwanCensusSubarea
Hoonah-AngoonCensusSubarea
GameCreek Whitestone
LoggingCamp
HainesBorough
Appendix ANew Borough/Census Area Maps

Alaska Population Digest • 2009 Estimates 73
Ketchikan Gateway Borough
Ketchikan
Saxman*

Alaska Population Digest • 2009 Estimates74
Petersburg Census Area
Port Alexander
Petersburg
Kake* Kupreanof
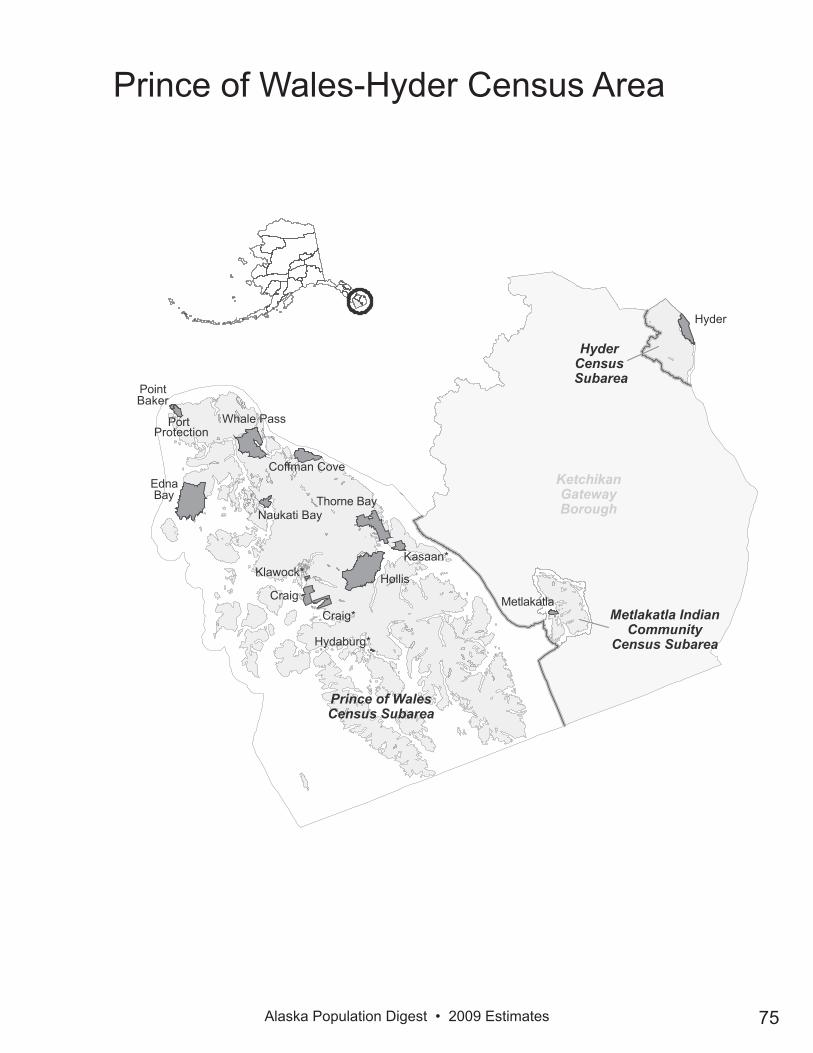
Alaska Population Digest • 2009 Estimates 75
Prince of Wales-Hyder Census Area
KetchikanGatewayBorough
Hyder
Metlakatla
HyderCensus
Subarea
Metlakatla IndianCommunity
Census Subarea
Hollis
Edna Bay
Whale Pass
Thorne Bay
Craig
Coffman Cove
Kasaan*
Naukati Bay
Port Protection
Klawock*
Hydaburg*
Prince of WalesCensus Subarea
PointBaker
Craig*

Alaska Population Digest • 2009 Estimates76
Skagway Municipality
Klon
dike H
wy

Alaska Population Digest • 2009 Estimates 77
Wrangell City and Borough
Wrangell
Thoms Place
Meyers Chuck