alaska sar facility radarsat geophysical processor system
TRANSCRIPT

1
JPL D-13448
Alaska SAR Facility
RADARSAT Geophysical Processor System
Product SpecificationVersion 2.0
R. KwokG. CunninghamD. Nguyen
March 9, 2000
National Aeronautics andSpace Administration
Jet Propulsion LaboratoryCalifornia Institute of TechnologyPasadena, California

2
DOCUMENT CHANGE CONTROL
DATE PAGE NO. STATUS REVISED BY
January, 1997 ALL Rev 1.0, Original G. CunninghamOctober 1, 1997 ALL Rev 1.1 L. Nguyen New section included: 1.2 File Name ConventionJanuary 29, 1998 ALL Rev 1.2 G. Cunningham Changes included: Converting all fractional areas from real*4 to integer*2 Converting freezing-degree-day ranges from real*4 to complex*8 Deleted entries for first-year ice fractional areas Converted all locations to kilometers Changed definitions of number of age and thickness categories Added a ridge flag Converted the 50km grid map locations from real*8 to real*4February 13, 1998 2,34,35 Rev 1.2 G. Cunningham Changed Eulerian Ice Motion Product: Increased image product identifier lengths Changed image corner values from lat/lon to x/y double precision Added npix/nrec for image B Defined algo_type as character*8May 12, 1998 8,9,10,11 Rev 1.3 G. Cunningham Changed 50km Gridded Products: Added cell size Made product start and end times consistent Removed entries for corners of grid cells Added ridge thickness fractional areas to 50km Ice Thickness ProductFeb 24, 1999 1 Rev 1.31 R. Kwok Updated product sizesMay 6, 1999 38 Rev 1.32 G. Cunningham Changed Ice Deformation Product description and frequency estimate.March 8, 2000 ALL Rev 2.00 G. Cunningham Removed 50km Gridded Ice Products Removed 3-day Interpolated Ice Age Histogram Product Combined Ice Age and Ice Thickness Histogram Products Converted Ice Age/Thickness and Backscatter Histogram Products to be monthly collections of all cell observations Changed all ice product frequencies to once per month Removed MYKEEP multiyear ice concentrations from the Ice Age/Thickness Product Changed the Product Code values to be more intuitive

3
1.0 INTRODUCTION . . . . . . . . . . . . . . . . . . . . . . . . . . . . . . . . . . . . . . . . . . . . . . . . . . . . . . . . . . . . . . . . . . . . . . . . . . . . . . . 4
1.1 NOTES ON THE DATA ............................................................................................................ 41.2 PRODUCT FILE NAMING CONVENTION ..................................................................................... 41.3 SUMMARY (FREQUENCY AND SIZE) ......................................................................................... 5
2.0 LAGRANGIAN ICE MOTION PRODUCT . . . . . . . . . . . . . . . . . . . . . . . . . . . . . . . . . . . . . . . . . . . . . . . . . 6
2.1 LAGRANGIAN ICE MOTION PRODUCT: METADATA RECORD CONTENTS ......................................... 72.2 LAGRANGIAN ICE MOTION PRODUCT: IMAGE DESCRIPTION DATA ................................................. 82.3 LAGRANGIAN ICE MOTION PRODUCT: GRIDPOINT/TRAJECTORY DESCRIPTION DATA ........................ 8
3.0 BACKSCATTER HISTOGRAM PRODUCT . . . . . . . . . . . . . . . . . . . . . . . . . . . . . . . . . . . . . . . . . . . . . . 10
3.1 BACKSCATTER HISTOGRAM PRODUCT: METADATA RECORD CONTENTS ....................................... 103.2 BACKSCATTER HISTOGRAM PRODUCT: BACKSCATTER RANGE RECORD ........................................ 113.3 BACKSCATTER HISTOGRAM PRODUCT: BACKSCATTER HISTOGRAM DATA ..................................... 12
4.0 ICE AGE/THICKNESS HISTOGRAM PRODUCT. . . . . . . . . . . . . . . . . . . . . . . . . . . . . . . . . . . . . . . 15
4.1 ICE AGE/THICKNESS HISTOGRAM PRODUCT: METADATA RECORD CONTENTS ............................... 154.2 ICE AGE/THICKNESS HISTOGRAM PRODUCT: INTERPOLATED THICKNESS RANGE RECORD ................ 164.3 ICE AGE/THICKNESS HISTOGRAM PRODUCT: HISTOGRAM DATA.................................................. 16
5.0 ICE DEFORMATION PRODUCT. . . . . . . . . . . . . . . . . . . . . . . . . . . . . . . . . . . . . . . . . . . . . . . . . . . . . . . . . . . 20
5.1 ICE DEFORMATION PRODUCT: METADATA RECORD CONTENTS .................................................. 205.2 ICE DEFORMATION PRODUCT: AREA CHANGE AND ICE MOTION DERIVATIVES DATA ...................... 21
6.0 AREA/OPEN WATER FRACTION PRODUCT . . . . . . . . . . . . . . . . . . . . . . . . . . . . . . . . . . . . . . . . . . 23
6.1 AREA/OPEN WATER FRACTION PRODUCT: METADATA RECORD CONTENTS .................................. 236.2 AREA/OPEN WATER FRACTION PRODUCT: AREA/OPEN WATER FRACTION DATA ........................... 24
7.0 EULERIAN ICE MOTION PRODUCT. . . . . . . . . . . . . . . . . . . . . . . . . . . . . . . . . . . . . . . . . . . . . . . . . . . . . 25
7.1 EULERIAN ICE MOTION PRODUCT: METADATA RECORD CONTENTS ............................................ 257.2 EULERIAN ICE MOTION PRODUCT: ICE MOTION VECTOR DATA ................................................... 26
8.0 MELT ONSET / FREEZE UP PRODUCT. . . . . . . . . . . . . . . . . . . . . . . . . . . . . . . . . . . . . . . . . . . . . . . . . 27
8.1 MELT ONSET / FREEZE UP PRODUCT: METADATA RECORD CONTENTS ........................................ 278.2 MELT ONSET / FREEZE UP PRODUCT: TRANSITION DATA .......................................................... 27
9.0 GRIDDED WIND/TEMPERATURE/PRESSURE FIELDS (50KM GRID) . . . . . . . . . . . 26
9.1 GRIDDED WIND/TEMPERATURE/PRESSURE FIELDS: METADATA RECORD CONTENTS ...................... 289.2 GRIDDED WIND/TEMPERATURE/PRESSURE FIELDS: DATA ......................................................... 28

4
1.0 Introduction
This document specifies the content and format of the products generated by the RadarsatGeophysical Processor System.
1.1 Notes on the Data
¥ All fractional areas, other than the Backscatter Histogram values, referred to in the productdescriptions are normalized to the initial area of that cell, so that fractional area values maybe greater than one in some cases.
¥ For space considerations, all fractional areas are given as 2-byte integers that must bemultiplied by 0.001 to retrieve the proper value.
¥ Cell areas, and other areas calculated from the cell area, may be negative in certain situations.¥ Data are defined as one of the following types: Cnn : character string of byte length nn I2 : 2-byte integer I4 : 4-byte integer R4 : 4-byte floating point R8 : 8-byte floating point CX8 : 8-byte complex number
1.2 Product File naming Convention
File Name: PnpppSYYDDDddd.TF
wherePn: Platform and number (ÒR1Ó, ÒE1Ó, ÒE2Ó)ppp: Product ID (1-999)S: Data stream ID (a-z, A-Z)YY: Start year of the productDDD: Start julian day of the productddd: Duration (in days) that the product spansT: Product type, according to the code described on the following tableF: File type (ÒPÓ for product, ÒMÓ for metadata)

5
1.3 Summary (Frequency and Size)
The following table summarizes the production frequency and size of each of the products.The asterisked entries have variable length sizes and are explained in the following notes.These records contain histograms where the number of entries are related to the cumulativenumber of observations of a particular quantity. Therefore, as a season progresses, thesizes of the products increase. The noted size estimates assume the existence of 45,000cells in the full histograms. The yearly size estimates assume nine months of observationfor the winter products. It is also assumed that there will optimally be 10 observations permonth for each cell.
Product Type Code Frequency Size (MB) Size(GB/yr)Lagrangian Ice Motion L 1/mth 15 0.675Backscatter Histogram B 1/mth 40 0.36Ice Age/Thickness Histogram T 1/mth * (note 1) 0.53Ice Deformation D 1/mth 32.2 0.29Area/Open Water Fraction (summer only) C 1/mth 21.6 0.08Eulerian Ice Motion E variable 0.2 N/AMelt Onset/Freeze Up F 2/yr 9 0.02Wind/Temp/Pressure Fields (50km grid) M 1/day 0.2 0.07
Total 2.0/yr
(note 1): 22.5MB + (8.1MB x Number of ice ages) + (0.9 x Number of ice thickness bins) +(12.6MB x Number of ridges).
6
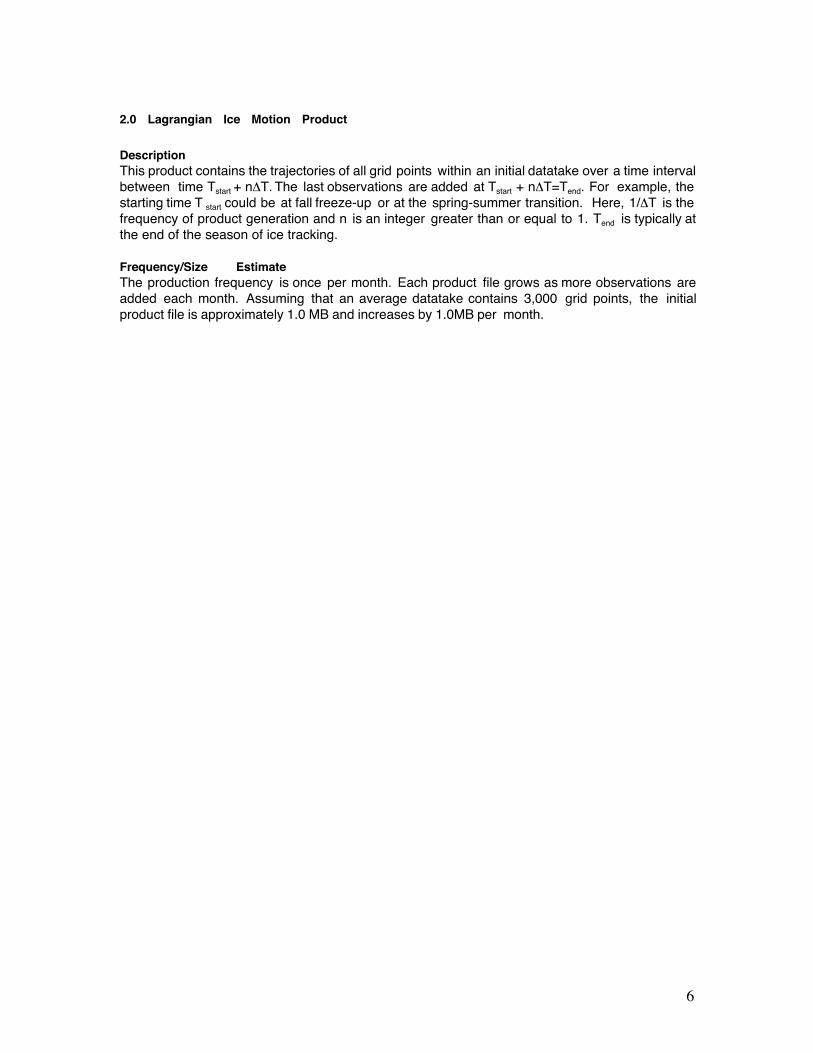
2.0 Lagrangian Ice Motion Product
DescriptionThis product contains the trajectories of all grid points within an initial datatake over a time intervalbetween time Tstart + nDT. The last observations are added at Tstart + nDT=Tend. For example, thestarting time T start could be at fall freeze-up or at the spring-summer transition. Here, 1/DT is thefrequency of product generation and n is an integer greater than or equal to 1. Tend is typically atthe end of the season of ice tracking.
Frequency/Size EstimateThe production frequency is once per month. Each product file grows as more observations areadded each month. Assuming that an average datatake contains 3,000 grid points, the initialproduct file is approximately 1.0 MB and increases by 1.0MB per month.

7
2.1 Lagrangian Ice Motion Product: Metadata Record Contents
Name/Description Type Units Min Max Miss ValuesPIDRGPS Product identifier
C24 N/A N/A N/A N/A N/A
PROD_DESCRIPTIONDescription of this product
C40 N/A N/A N/A N/A N/A
N_IMAGESNumber of images used in the creation ofthis product
I2 N/A 1 N/A N/A N/A
N_TRAJECTORIESNumber of trajectories
I4 N/A 1 N/A N/A N/A
PROD_TYPEProduct type
C8 N/A N/A N/A N/A ÒwinterÓÒsummerÓ
CREATE_YEARProduct creation year
I2 N/A 1995 N/A N/A N/A
CREATE_TIMEProduct creation time
R8 day 1.00 367.00 N/A N/A
PROD_START_YEARProduct start year
I2 N/A 1995 N/A N/A N/A
PROD_START_TIMEProduct start time
R8 day 1.00 367.00 N/A N/A
PROD_END_YEARProduct end year
I2 N/A 1995 N/A N/A N/A
PROD_END_TIMEProduct end time
R8 day 1.00 367.00 N/A N/A
SW_VERSIONSoftware version used to create this product
C12 N/A N/A N/A N/A N/A
N_W_LATNorth West Latitude of initial datatake
R4 Deg -90.00 90.00 N/A N/A
N_W_LONGNorth West Longitude of initial datatake
R4 Deg -180.00 180.00 N/A N/A
N_E_LATNorth East Latitude of initial datatake
R4 Deg -90.0 90.00 N/A N/A
N_E_LONGNorth East Longitude of initial datatake
R4 Deg -180.00 180.00 N/A N/A
S_W_LATSouth West Latitude of initial datatake
R4 Deg -90.0 90.00 N/A N/A
S_W_LONGSouth West Longitude of initial datatake
R4 Deg -180.00 180.00 N/A N/A
S_E_LATSouth East Latitude of initial datatake
R4 Deg -90.0 90.00 N/A N/A
S_E_LONGSouth East Longitude of initial datatake
R4 Deg -180.00 180.00 N/A N/A
8
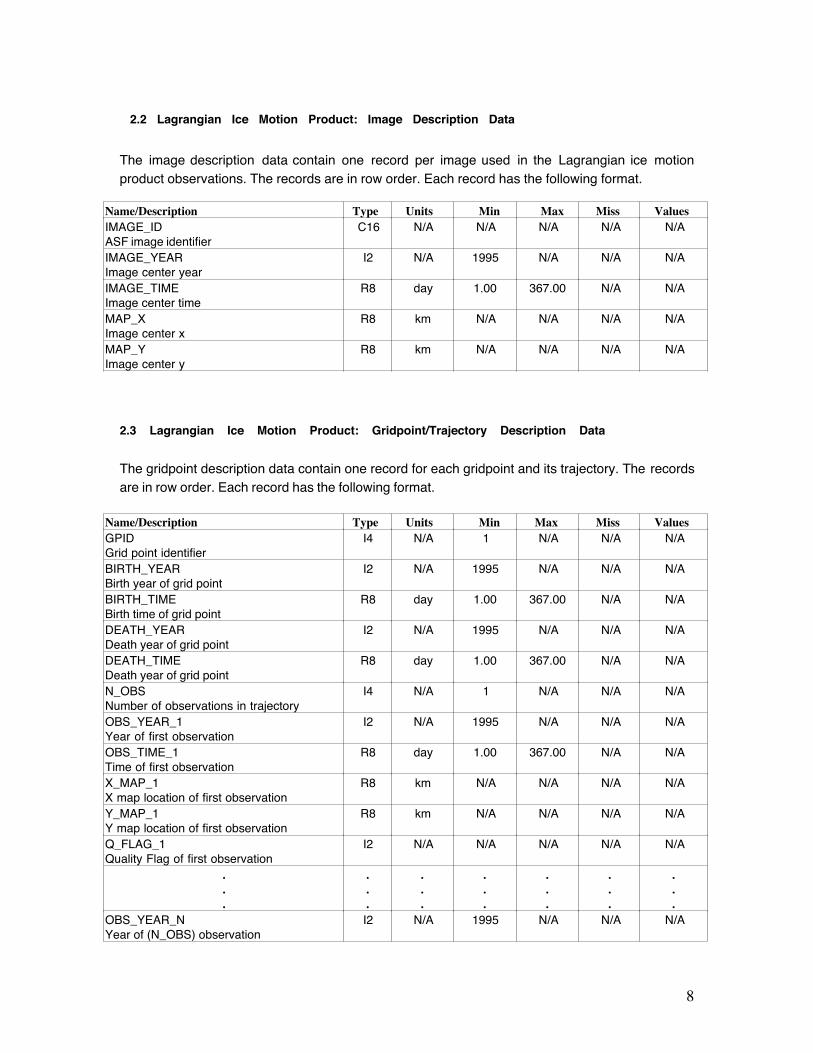
The image description data contain one record per image used in the Lagrangian ice motionproduct observations. The records are in row order. Each record has the following format.
Name/Description Type Units Min Max Miss ValuesIMAGE_IDASF image identifier
C16 N/A N/A N/A N/A N/A
IMAGE_YEARImage center year
I2 N/A 1995 N/A N/A N/A
IMAGE_TIMEImage center time
R8 day 1.00 367.00 N/A N/A
MAP_XImage center x
R8 km N/A N/A N/A N/A
MAP_YImage center y
R8 km N/A N/A N/A N/A
2.3 Lagrangian Ice Motion Product: Gridpoint/Trajectory Description Data
The gridpoint description data contain one record for each gridpoint and its trajectory. The recordsare in row order. Each record has the following format.
Name/Description Type Units Min Max Miss ValuesGPIDGrid point identifier
I4 N/A 1 N/A N/A N/A
BIRTH_YEARBirth year of grid point
I2 N/A 1995 N/A N/A N/A
BIRTH_TIMEBirth time of grid point
R8 day 1.00 367.00 N/A N/A
DEATH_YEARDeath year of grid point
I2 N/A 1995 N/A N/A N/A
DEATH_TIMEDeath year of grid point
R8 day 1.00 367.00 N/A N/A
N_OBSNumber of observations in trajectory
I4 N/A 1 N/A N/A N/A
OBS_YEAR_1Year of first observation
I2 N/A 1995 N/A N/A N/A
OBS_TIME_1Time of first observation
R8 day 1.00 367.00 N/A N/A
X_MAP_1X map location of first observation
R8 km N/A N/A N/A N/A
Y_MAP_1Y map location of first observation
R8 km N/A N/A N/A N/A
Q_FLAG_1Quality Flag of first observation
I2 N/A N/A N/A N/A N/A
.
.
.
.
.
.
.
.
.
.
.
.
.
.
.
.
.
.
.
.
.OBS_YEAR_NYear of (N_OBS) observation
I2 N/A 1995 N/A N/A N/A
2.2 Lagrangian Ice Motion Product: Image Description Data

9
OBS_TIME_NTime of (N_OBS) observation
R8 day 1.00 367.00 N/A N/A
X_MAP_NX map location of (N_OBS) observation
R8 km N/A N/A N/A N/A
Y_MAP_NY map location of (N_OBS) observation
R8 km N/A N/A N/A N/A
Q_FLAG_NQuality Flag of (N_OBS) observation
I2 N/A N/A N/A N/A N/A

10
3.0 Backscatter Histogram Product
DescriptionThis product contains the backscatter histograms of all the grid cells observed within a monthlytime period.
Frequency/Size EstimateThe product generation frequency is once per month. Each product file contains the backscatterhistograms of the grid cells within this product. The size of a product file is approximately 2.7MB.
3.1 Backscatter Histogram Product: Metadata Record Contents
Name/Description Type Units Min Max Miss ValuesPIDRGPS Product identifier
C24 N/A N/A N/A N/A N/A
PROD_DESCRIPTIONDescription of this product
C40 N/A N/A N/A N/A N/A
N_CELLSNumber of cells in the product
I4 N/A N/A N/A N/A N/A
CREATE_YEARProduct creation year
I2 N/A 1995 N/A N/A N/A
CREATE_TIMEProduct creation time
R8 day 1.00 367.00 N/A N/A
PROD_START_YEARProduct start year
I2 N/A 1995 N/A N/A N/A
PROD_START_TIMEProduct start time
R8 day 1.00 367.00 N/A N/A
PROD_END_YEARProduct end year
I2 N/A 1995 N/A N/A N/A
PROD_END_TIMEProduct end time
R8 day 1.00 367.00 N/A N/A
SW_VERSIONSoftware version used to create this product
C12 N/A N/A N/A N/A N/A
N_W_LATNorth West Latitude of initial datake
R4 Deg -90.00 90.00 N/A N/A
N_W_LONGNorth West Longitude of initial datake
R4 Deg -180.00 180.00 N/A N/A
N_E_LATNorth East Latitude of initial datake
R4 Deg -90.00 90.00 N/A N/A
N_E_LONGNorth East Longitude of initial datake
R4 Deg -180.00 180.00 N/A N/A
S_W_LATSouth West Latitude of initial datake
R4 Deg -90.00 90.00 N/A N/A
S_W_LONGSouth West Longitude of initial datake
R4 Deg -180.00 180.00 N/A N/A
S_E_LATSouth East Latitude of initial datake
R4 Deg -90.00 90.00 N/A N/A
S_E_LONGSouth East Longitude of initial datake
R4 Deg -180.00 180.00 N/A N/A

11
3.2 Backscatter Histogram Product: Backscatter Range Record
Name/Description Type Units Min Max Miss ValuesBSR_11st backscatter range
CX8 dB N/A N/A N/A N/A
BSR_22nd backscatter range
CX8 dB N/A N/A N/A N/A
BSR_33rd backscatter range
CX8 dB N/A N/A N/A N/A
BSR_44th backscatter range
CX8 dB N/A N/A N/A N/A
BSR_55th backscatter range
CX8 dB N/A N/A N/A N/A
BSR_66th backscatter range
CX8 dB N/A N/A N/A N/A
BSR_77th backscatter range
CX8 dB N/A N/A N/A N/A
BSR_88th backscatter range
CX8 dB N/A N/A N/A N/A
BSR_99th backscatter range
CX8 dB N/A N/A N/A N/A
BSR_1010th backscatter range
CX8 dB N/A N/A N/A N/A
BSR_1111th backscatter range
CX8 dB N/A N/A N/A N/A
BSR_1212th backscatter range
CX8 dB N/A N/A N/A N/A
BSR_1313th backscatter range
CX8 dB N/A N/A N/A N/A
BSR_1414th backscatter range
CX8 dB N/A N/A N/A N/A
BSR_1515th backscatter range
CX8 dB N/A N/A N/A N/A
BSR_1616th backscatter range
CX8 dB N/A N/A N/A N/A
BSR_1717th backscatter range
CX8 dB N/A N/A N/A N/A
BSR_1818th backscatter range
CX8 dB N/A N/A N/A N/A
BSR_1919th backscatter range
CX8 dB N/A N/A N/A N/A
BSR_2020th backscatter range
CX8 dB N/A N/A N/A N/A
BSR_2121st backscatter range
CX8 dB N/A N/A N/A N/A
BSR_2222nd backscatter range
CX8 dB N/A N/A N/A N/A
BSR_2323rd backscatter range
CX8 dB N/A N/A N/A N/A
BSR_2424th backscatter range
CX8 dB N/A N/A N/A N/A
BSR_2525th backscatter range
CX8 dB N/A N/A N/A N/A

12
3.3 Backscatter Histogram Product: Backscatter Histogram Data
The histogram data contain multiple records. Each record contains the monthly observations of abackscatter histogram for a grid cell. The records are in row order. Each record has the followingformat.
Name/Description Type Units Min Max MISS ValuesCELL_IDCell identifier
I4 N/A 1 N/A N/A N/A
BIRTH_YEARBirth Year of cell
I2 N/A 1995 N/A N/A N/A
BIRTH_TIMEBirth time of cell
R8 day 1.00 367.00 N/A N/A
I_AREAInitial cell area
R4 sq km 0 N/A N/A N/A
N_OBSNumber of observations of cell
I4 N/A 1 N/A N/A N/A
OBS_YEAR_1Year of first observation
I2 N/A 1995 N/A N/A N/A
OBS_TIME_1Time of first observation
R8 day 1.00 367.00 N/A N/A
X_MAP_1Map location of cell center - x
R8 km N/A N/A N/A N/A
Y_MAP_1Map location of cell center - y
R8 km N/A N/A N/A N/A
CELL_TEMP_1Temperature at cell center
R4 deg C -100.0 100.0 N/A N/A
C_AREA_1Current cell area
R4 sq km 0 N/A N/A N/A
MYFRAC_1Multiyear ice fraction
I2 N/A 0 N/A N/A N/A
OWFRAC_1Open water fraction
I2 N/A 0 N/A N/A N/A
FBSR_1_1Fractional area in 1st backscatter range
I2 N/A 0.0 1000 N/A N/A
FBSR_2_1Fractional area in 2nd backscatter range
I2 N/A 0.0 1000 N/A N/A
FBSR_3_1Fractional area in 3rd backscatter range
I2 N/A 0.0 1000 N/A N/A
FBSR_4_1Fractional area in 4th backscatter range
I2 N/A 0.0 1000 N/A N/A
FBSR_5_1Fractional area in 5th backscatter range
I2 N/A 0.0 1000 N/A N/A
FBSR_6_1Fractional area in 6th backscatter range
I2 N/A 0.0 1000 N/A N/A
FBSR_7_1Fractional area in 7th backscatter range
I2 N/A 0.0 1000 N/A N/A
FBSR_8_1Fractional area in 8th backscatter range
I2 N/A 0.0 1000 N/A N/A
FBSR_9_1Fractional area in 9th backscatter range
I2 N/A 0.0 1000 N/A N/A
FBSR_10_1Fractional area in 10th backscatter range
I2 N/A 0.0 1000 N/A N/A
FBSR_11_1Fractional area in 11th backscatter range
I2 N/A 0.0 1000 N/A N/A

13
FBSR_12_1Fractional area in 12th backscatterrange
I2 N/A 0.0 1000 N/A N/A
FBSR_13_1Fractional area in 13th backscatter range
I2 N/A 0.0 1000 N/A N/A
FBSR_14_1Fractional area in 14th backscatter range
I2 N/A 0.0 1000 N/A N/A
FBSR_15_1Fractional area in 15th backscatter range
I2 N/A 0.0 1000 N/A N/A
FBSR_16_1Fractional area in 16th backscatter range
I2 N/A 0.0 1000 N/A N/A
FBSR_17_1Fractional area in 17th backscatter range
I2 N/A 0.0 1000 N/A N/A
FBSR_18_1Fractional area in 18th backscatter range
I2 N/A 0.0 1000 N/A N/A
FBSR_19_1Fractional area in 19th backscatter range
I2 N/A 0.0 1000 N/A N/A
FBSR_20_1Fractional area in 20th backscatter range
I2 N/A 0.0 1000 N/A N/A
FBSR_21_1Fractional area in 21st backscatter range
I2 N/A 0.0 1000 N/A N/A
FBSR_22_1Fractional area in 22nd backscatter range
I2 N/A 0.0 1000 N/A N/A
FBSR_23_1Fractional area in 23rd backscatter range
I2 N/A 0.0 1000 N/A N/A
FBSR_24_1Fractional area in 24th backscatter range
I2 N/A 0.0 1000 N/A N/A
FBSR_25_1Fractional area in 25th backscatter range
I2 N/A 0.0 1000 N/A N/A
INC_ANG_1Incidence angle of first observation
R4 deg 0.0 90.0 N/A N/A
.
.
.
.
.
.
.
.
.
.
.
.
.
.
.
.
.
.
.
.
.OBS_YEAR_NYear of (N_OBS) observation
I2 N/A 1995 N/A N/A N/A
OBS_TIME_NTime of (N_OBS) observation
R8 day 1.00 367.00 N/A N/A
X_MAP_NMap location of cell center - x
R8 km N/A N/A N/A N/A
Y_MAP_NMap location of cell center - y
R8 km N/A N/A N/A N/A
CELL_TEMP_NTemperature at cell center
R4 deg C -100.0 100.0 N/A N/A
C_AREA_NCurrent cell area
R4 sq km 0 N/A N/A N/A
MYFRAC_NMultiyear ice fraction
I2 N/A 0 N/A N/A N/A
OWFRAC_NOpen water fraction
I2 N/A 0 N/A N/A N/A
FBSR_1_NFractional area in 1st backscatter range
I2 N/A 0.0 1000 N/A N/A
FBSR_2_NFractional area in 2nd backscatter range
I2 N/A 0.0 1000 N/A N/A

14
FBSR_3_NFractional area in 3rd backscatter range
I2 N/A 0.0 1000 N/A N/A
FBSR_4_NFractional area in 4th backscatter range
I2 N/A 0.0 1000 N/A N/A
FBSR_5_NFractional area in 5th backscatter range
I2 N/A 0.0 1000 N/A N/A
FBSR_6_NFractional area in 6th backscatter range
I2 N/A 0.0 1000 N/A N/A
FBSR_7_NFractional area in 7th backscatter range
I2 N/A 0.0 1000 N/A N/A
FBSR_8_NFractional area in 8th backscatter range
I2 N/A 0.0 1000 N/A N/A
FBSR_9_NFractional area in 9th backscatter range
I2 N/A 0.0 1000 N/A N/A
FBSR_10_NFractional area in 10th backscatter range
I2 N/A 0.0 1000 N/A N/A
FBSR_11_NFractional area in 11th backscatter range
I2 N/A 0.0 1000 N/A N/A
FBSR_12_NFractional area in 12th backscatterrange
I2 N/A 0.0 1000 N/A N/A
FBSR_13_NFractional area in 13th backscatter range
I2 N/A 0.0 1000 N/A N/A
FBSR_14_NFractional area in 14th backscatter range
I2 N/A 0.0 1000 N/A N/A
FBSR_15_NFractional area in 15th backscatter range
I2 N/A 0.0 1000 N/A N/A
FBSR_16_NFractional area in 16th backscatter range
I2 N/A 0.0 1000 N/A N/A
FBSR_17_NFractional area in 17th backscatter range
I2 N/A 0.0 1000 N/A N/A
FBSR_18_NFractional area in 18th backscatter range
I2 N/A 0.0 1000 N/A N/A
FBSR_19_NFractional area in 19th backscatter range
I2 N/A 0.0 1000 N/A N/A
FBSR_20_NFractional area in 20th backscatter range
I2 N/A 0.0 1000 N/A N/A
FBSR_21_NFractional area in 21st backscatter range
I2 N/A 0.0 1000 N/A N/A
FBSR_22_NFractional area in 22nd backscatter range
I2 N/A 0.0 1000 N/A N/A
FBSR_23_NFractional area in 23rd backscatter range
I2 N/A 0.0 1000 N/A N/A
FBSR_24_NFractional area in 24th backscatter range
I2 N/A 0.0 1000 N/A N/A
FBSR_25_NFractional area in 25th backscatter range
I2 N/A 0.0 1000 N/A N/A
INC_ANG_NIncidence angle of (N_OBS) observation
R4 deg 0.0 90.0 N/A N/A

15
4.0 Ice Age/Thickness Histogram Product
DescriptionThis product contains the ice age and ice thickness histograms of the grid cells covering the ArcticOcean observed during the prescribed month.
Frequency/Size EstimateThe product generation frequency is once per month. Each product file contains the ice age andice thickness histograms and ridging events of the grid cells within the product. This record is ofvariable length, depending on the number of ice age ranges, ice thickness bins, and ridgingevents that are sampled.
4.1 Ice Age/Thickness Histogram Product: Metadata Record Contents
Name/Description Type Units Min Max Miss ValuesPIDRGPS Product identifier
C24 N/A N/A N/A N/A N/A
PROD_DESCRIPTIONDescription of this product
C40 N/A N/A N/A N/A N/A
N_CELLSNumber of cells in the product
I4 N/A N/A N/A N/A N/A
CREATE_YEARProduct creation year
I2 N/A 1995 N/A N/A N/A
CREATE_TIMEProduct creation time
R8 day 1.00 367.00 N/A N/A
PROD_START_YEARProduct start year
I2 N/A 1995 N/A N/A N/A
PROD_START_TIMEProduct start time
R8 day 1.00 367.00 N/A N/A
PROD_END_YEARProduct end year
I2 N/A 1995 N/A N/A N/A
PROD_END_TIMEProduct end time
R8 day 1.00 367.00 N/A N/A
SW_VERSIONSoftware version used to create this product
C12 N/A N/A N/A N/A N/A
N_W_LATNorth West Latitude of initial datake
R4 Deg -90.00 90.00 N/A N/A
N_W_LONGNorth West Longitude of initial datake
R4 Deg -180.00 180.00 N/A N/A
N_E_LATNorth East Latitude of initial datake
R4 Deg -90.00 90.00 N/A N/A
N_E_LONGNorth East Longitude of initial datake
R4 Deg -180.00 180.00 N/A N/A
S_W_LATSouth West Latitude of initial datake
R4 Deg -90.00 90.00 N/A N/A
S_W_LONGSouth West Longitude of initial datake
R4 Deg -180.00 180.00 N/A N/A
S_E_LATSouth East Latitude of initial datake
R4 Deg -90.00 90.00 N/A N/A
S_E_LONGSouth East Longitude of initial datake
R4 Deg -180.00 180.00 N/A N/A

16
4.2 Ice Age/Thickness Histogram Product: Interpolated Thickness Range Record
The interpolated thickness range record describes the thickness interval of each thicknesscategory.
Name/Description Type Units Min Max Miss ValuesTHICK_STEPThe interval of each thickness category
R4 cm 0 N/A N/A N/A
4.3 Ice Age/Thickness Histogram Product: Histogram Data
The histogram data contain one record per cell observed. The data pertain to each observation ofthe cell within the time of the product. The records are in row order. Each record has the followingformat.
Name/Description Type Units Min Max Miss ValuesCELL_IDCell identifier
I4 N/A 1 N/A N/A N/A
BIRTH_YEARBirth Year of cell
I2 N/A 1995 N/A N/A N/A
BIRTH_TIMEBirth time of cell
R8 day 1.00 367.00 N/A N/A
I_AREAInitial cell area
R4 sq km 0 N/A N/A N/A
N_OBSNumber of observations of cell
I4 N/A 1 N/A N/A N/A
OBS_YEAR_1Year of first observation
I2 N/A 1995 N/A N/A N/A
OBS_TIME_1Time of first observation
R8 day 1.00 367.00 N/A N/A
X_MAP_1Map location of cell center - x
R8 km N/A N/A N/A N/A
Y_MAP_1Map location of cell center - y
R8 km N/A N/A N/A N/A
C_TEMP_1Temperature at cell center
R4 deg C -100.0 100.0 N/A N/A
FDD_1Accumulated freezing degree days sincecell creation
R4 deg C day 0 N/A N/A N/A
C_AREA_1Current cell area
R4 sq km 0 N/A N/A N/A
N_AGE_1Number of age categories up to andincluding the oldest observation
I2 N/A N/A N/A N/A N/A
AR_1_11st age range (youngest ice)
CX8 days N/A N/A N/A N/A
AGE_FAR_1_1Fractional area in 1st age range
I2 N/A 0 N/A N/A N/A
FDD_1_1Accumulated freezing degree days of 1st agerange
CX8 deg C day 0 N/A N/A N/A
.
.
.
.
.
.
.
.
.
.
.
.
.
.
.
.
.
.
.
.
.

17
AR_N_1(N_AGE_1) age range
CX8 days N/A N/A N/A N/A
AGE_FAR_N_1Fractional area in (N_AGE_1) age range
I2 N/A 0 N/A N/A N/A
FDD_N_1Accumulated freezing degree days of(N_AGE_1) age range
CX8 deg C day 0 N/A N/A N/A
N_THICK_1Number of thickness categories up to andincluding the thickest observation
I2 N/A N/A N/A N/A N/A
THICK_FAR_1_1Fractional area in 1st thickness range
I2 N/A 0 N/A N/A N/A
.
.
.
.
.
.
.
.
.
.
.
.
.
.
.
.
.
.
.
.
.THICK_FAR_N_1Fractional area in the (N_THICK) thicknessrange
I2 N/A 0 N/A N/A N/A
FAR_FYR_1Fractional area in ridged-FY category
I2 N/A 0 N/A N/A N/A
FAR_MY_1Fractional area in radiometric MY category
I2 N/A 0 N/A N/A N/A
N_RIDGE_1Number of ridging event records
I2 N/A 0 N/A N/A N/A
RIDGE_AR_1_1Age range of ridging event 1
CX8 days 0 N/A N/A N/A
RIDGE_TR_1_1Thickness range of ridging event 1
CX8 cm 0 N/A N/A N/A
RIDGE_FAR_1_1Fractional area of ridging event 1
I2 N/A 0 N/A N/A N/A
RIDGE_FDD_1_1Accumulated freezing degree days of ridgingevent 1
CX8 deg C day 0 N/A N/A N/A
RIDGE_FLAG_1_10 = old ridge, 1 = new ridge
I2 N/A 0 1 N/A N/A
.
.
.
.
.
.
.
.
.
.
.
.
.
.
.
.
.
.
.
.
.RIDGE_AR_N_1Age range of ridging event (N_RIDGE_1)
CX8 days 0 N/A N/A N/A
RIDGE_TR_N_1Thickness range of ridging event(N_RIDGE_1)
CX8 cm 0 N/A N/A N/A
RIDGE_FAR_N_1Fractional area of ridging event(N_RIDGE_1)
I2 N/A 0 N/A N/A N/A
RIDGE_FDD_N_1Accumulated freezing degree days of ridgingevent (N_RIDGE_1)
CX8 deg C day 0 N/A N/A N/A
RIDGE_FLAG_N_10 = old ridge, 1 = new ridge
I2 N/A 0 1 N/A N/A
.
.
.
.
.
.
.
.
.
.
.
.
.
.
.
.
.
.
.
.
.
.
.
.
.
.
.
.
.
.
.
.
.
.
.

18
OBS_YEAR_NYear of (N_OBS) observation
I2 N/A 1995 N/A N/A N/A
OBS_TIME_NTime of (N_OBS) observation
R8 day 1.00 367.00 N/A N/A
X_MAP_NMap location of cell center - x
R8 km N/A N/A N/A N/A
Y_MAP_NMap location of cell center - y
R8 km N/A N/A N/A N/A
C_TEMP_NTemperature at cell center
R4 deg C -100.0 100.0 N/A N/A
FDD_NAccumulated freezing degree days sincecell creation
R4 deg C day 0 N/A N/A N/A
C_AREA_NCurrent cell area
R4 sq km 0 N/A N/A N/A
N_AGE_NNumber of age categories up to andincluding the oldest observation
I2 N/A N/A N/A N/A N/A
AR_1_N1st age range (youngest ice)
CX8 days N/A N/A N/A N/A
AGE_FAR_1_NFractional area in 1st age range
I2 N/A 0 N/A N/A N/A
FDD_1_NAccumulated freezing degree days of 1st agerange
CX8 deg C day 0 N/A N/A N/A
.
.
.
.
.
.
.
.
.
.
.
.
.
.
.
.
.
.
.
.
.AR_N_N(N_AGE_N) age range
CX8 days N/A N/A N/A N/A
AGE_FAR_N_NFractional area in (N_AGE_N) age range
I2 N/A 0 N/A N/A N/A
FDD_N_NAccumulated freezing degree days of(N_AGE_N) age range
CX8 deg C day 0 N/A N/A N/A
N_THICK_NNumber of thickness categories up to andincluding the thickest observation
I2 N/A N/A N/A N/A N/A
THICK_FAR_1_NFractional area in 1st thickness range
I2 N/A 0 N/A N/A N/A
.
.
.
.
.
.
.
.
.
.
.
.
.
.
.
.
.
.
.
.
.THICK_FAR_N_NFractional area in the (N_THICK) thicknessrange
I2 N/A 0 N/A N/A N/A
FAR_FYR_NFractional area in ridged-FY category
I2 N/A 0 N/A N/A N/A
FAR_MY_NFractional area in radiometric MY category
I2 N/A 0 N/A N/A N/A
N_RIDGE_NNumber of ridging event records
I2 N/A 0 N/A N/A N/A
RIDGE_AR_1_NAge range of ridging event 1
CX8 days 0 N/A N/A N/A
RIDGE_TR_1_NThickness range of ridging event 1
CX8 cm 0 N/A N/A N/A

19
RIDGE_FAR_1_NFractional area of ridging event 1
I2 N/A 0 N/A N/A N/A
RIDGE_FDD_1_NAccumulated freezing degree days of ridgingevent 1
CX8 deg C day 0 N/A N/A N/A
RIDGE_FLAG_1_N0 = old ridge, 1 = new ridge
I2 N/A 0 1 N/A N/A
.
.
.
.
.
.
.
.
.
.
.
.
.
.
.
.
.
.
.
.
.RIDGE_AR_N_NAge range of ridging event (N_RIDGE_N)
CX8 days 0 N/A N/A N/A
RIDGE_TR_N_NThickness range of ridging event(N_RIDGE_N)
CX8 cm 0 N/A N/A N/A
RIDGE_FAR_N_NFractional area of ridging event(N_RIDGE_N)
I2 N/A 0 N/A N/A N/A
RIDGE_FDD_N_NAccumulated freezing degree days of ridgingevent (N_RIDGE_N)
CX8 deg C day 0 N/A N/A N/A
RIDGE_FLAG_N_N0 = old ridge, 1 = new ridge
I2 N/A 0 1 N/A N/A

20
5.0 Ice Deformation Product
DescriptionThis product contains the area changes and ice motion spatial derivatives of all the grid cells withinan initial datatake up to the product time.
Frequency/Size Estimate
The product generation frequency is once per month. Each product file contains information ofthe area changes and ice motion spatial derivatives of the grid cells within the product. Since theproduct contains all observations up to the product time, the size of each product will vary and willcontain approximately 11MB per observation of all 100,000 cells.
5.1 Ice Deformation Product: Metadata Record Contents
Name/Description Type Units Min Max Miss ValuesPIDRGPS Product identifier
C24 N/A N/A N/A N/A N/A
PROD_DESCRIPTIONDescription of this product
C40 N/A N/A N/A N/A N/A
N_CELLSNumber of cells in the product
I4 N/A N/A N/A N/A N/A
CREATE_YEARProduct creation year
I2 N/A 1995 N/A N/A N/A
CREATE_TIMEProduct creation time
R8 day 1.00 367.00 N/A N/A
PROD_START_YEARProduct start year
I2 N/A 1995 N/A N/A N/A
PROD_START_TIMEProduct start time
R8 day 1.00 367.00 N/A N/A
PROD_END_YEARProduct end year
I2 N/A 1995 N/A N/A N/A
PROD_END_TIMEProduct end time
R8 day 1.00 367.00 N/A N/A
SW_VERSIONSoftware version used to create this product
C12 N/A N/A N/A N/A N/A
N_W_LATNorth West Latitude of initial datatake
R4 Deg -90.00 90.00 N/A N/A
N_W_LONGNorth West Longitude of initial datatake
R4 Deg -180.00 180.00 N/A N/A
N_E_LATNorth East Latitude of initial datatake
R4 Deg -90.00 90.00 N/A N/A
N_E_LONGNorth East Longitude of initial datatake
R4 Deg -180.00 180.00 N/A N/A
S_W_LATSouth West Latitude of initial datatake
R4 Deg -90.00 90.00 N/A N/A
S_W_LONGSouth West Longitude of initial datatake
R4 Deg -180.00 180.00 N/A N/A
S_E_LATSouth East Latitude of initial datatake
R4 Deg -90.00 90.00 N/A N/A
S_E_LONGSouth East Longitude of initial datatake
R4 Deg -180.00 180.00 N/A N/A

21
5.2 Ice Deformation Product: Area Change and Ice Motion Derivatives Data
The area change and ice motion spatial derivatives data contain multiple records. Each cellcontains multiple observations of area change and ice motion spatial derivatives. The records arein row order. Each record has the following format.
Name/Description Type Units Min Max Miss ValuesCELL_IDCell identifier
I4 N/A 1 N/A N/A N/A
BIRTH_YEARBirth Year of cell
I2 N/A 1995 N/A N/A N/A
BIRTH_TIMEBirth time of cell
R8 day 1.00 367.00 N/A N/A
N_OBSNumber of observations of cell
I2 N/A 1 N/A N/A N/A
OBS_YEAR_1Year of observation 1
I2 N/A 1995 N/A N/A N/A
OBS_TIME_1Time of observation 1
R8 day 1.00 367.00 N/A N/A
X_MAP_1X map location of observation 1
R8 km N/A N/A N/A N/A
Y_MAP_1Y map location of observation 1
R8 km N/A N/A N/A N/A
X_DISP_1X displacement of between currentobservation and previous observation
R8 km N/A N/A N/A N/A
Y_DISP_1Y displacement betweem currentobservation and previous observation
R8 km N/A N/A N/A N/A
C_AREA_1Cell area of observation 1
R4 sq km N/A N/A N/A N/A
D_AREA_1Cell area difference between currentobservation and previous observation
R4 sq km N/A N/A N/A N/A
DTP_1Time difference between current observationand previous observation
R4 day N/A N/A N/A N/A
DUDX_1du/dx ice motion partial of observation 1
R4 N/A N/A N/A N/A N/A
DUDY_1du/dy ice motion partial of observation 1
R4 N/A N/A N/A N/A N/A
DVDX_1dv/dx ice motion partial of first observation
R4 N/A N/A N/A N/A N/A
DVDY_1dv/dy ice motion partial of observation 1
R4 N/A N/A N/A N/A N/A
.
.
.
.
.
.
.
.
.
.
.
.
.
.
.
.
.
.
.
.
.OBS_YEAR_NYear of observation of (N_OBS)
I2 N/A 1995 N/A N/A N/A
OBS_TIME_NTime of observation of (N_OBS)
R8 day 1.00 367.00 N/A N/A
X_MAP_NX map location of observation (N_OBS)
R8 km N/A N/A N/A N/A

22
Y_MAP_NY map location of observation (N_OBS)
R8 km N/A N/A N/A N/A
X_DISP_NX displacement between (N_OBS)observation and previous observation
R8 km N/A N/A N/A N/A
Y_DISP_NY displacement between (N_OBS)observation and previous observation
R8 km N/A N/A N/A N/A
C_AREA_NCell area of (N_OBS) observation
R4 sq km N/A N/A N/A N/A
D_AREA_NCell area difference between (N_OBS)observation and previous observation
R4 sq km N/A N/A N/A N/A
DTP_NTime difference between (N_OBS)observation and previous observation
R4 day N/A N/A N/A N/A
DUDX_Ndu/dx ice motion partial of (N_OBS)observation
R4 N/A N/A N/A N/A N/A
DUDY_Ndu/dy ice motion partial of (N_OBS)observation
R4 N/A N/A N/A N/A N/A
DVDX_Ndv/dx ice motion partial of (N_OBS)observation
R4 N/A N/A N/A N/A N/A
DVDY_Ndv/dy ice motion partial of (N_OBS)observation
R4 N/A N/A N/A N/A N/A

23
6.0 Area/Open Water Fraction Product
DescriptionThis product contains the area and estimated open water fraction of all the grid cells within an initialdatatake at time Ts.. . This product is produced only during the summer.
Frequency/Size EstimateThe product generation frequency is once per month. Each product file contains information ofthe area and open water fraction of the grid cells within this product, the size of each productbeing approximately 15MB.
6.1 Area/Open Water Fraction Product: Metadata Record Contents
Name/Description Type Units Min Max Miss ValuesPIDRGPS Product identifier
C24 N/A N/A N/A N/A N/A
PROD_DESCRIPTIONDescription of this product
C40 N/A N/A N/A N/A N/A
N_CELLSNumber of cells in the product
I4 N/A N/A N/A N/A N/A
CREATE_YEARProduct creation year
I2 N/A 1995 N/A N/A N/A
CREATE_TIMEProduct creation time
R8 day 1.00 367.00 N/A N/A
PROD_START_YEARProduct start year
I2 N/A 1995 N/A N/A N/A
PROD_START_TIMEProduct start time
R8 day 1.00 367.00 N/A N/A
PROD_END_YEARProduct end year
I2 N/A 1995 N/A N/A N/A
PROD_END_TIMEProduct end time
R8 day 1.00 367.00 N/A N/A
SW_VERSIONSoftware version used to create this product
C12 N/A N/A N/A N/A N/A
N_W_LATNorth West Latitude of initial datake
R4 Deg -90.00 90.00 N/A N/A
N_W_LONGNorth West Longitude of initial datake
R4 Deg -180.00 180.00 N/A N/A
N_E_LATNorth East Latitude of initial datake
R4 Deg -90.00 90.00 N/A N/A
N_E_LONGNorth East Longitude of initial datake
R4 Deg -180.00 180.00 N/A N/A
S_W_LATSouth West Latitude of initial datake
R4 Deg -90.00 90.00 N/A N/A
S_W_LONGSouth West Longitude of initial datake
R4 Deg -180.00 180.00 N/A N/A
S_E_LATSouth East Latitude of initial datake
R4 Deg -90.00 90.00 N/A N/A
S_E_LONGSouth East Longitude of initial datake
R4 Deg -180.00 180.00 N/A N/A

24
6.2 Area/Open Water Fraction Product: Area/Open Water Fraction Data
The area/open water fraction data contain multiple records. Each record contains the area/openwater fraction estimates for a cell. The records are in row order. Each record has the followingformat.
Name/Description Type Units Min Max Miss ValuesCELL_IDCell identifier
I4 N/A 1 N/A N/A N/A
OBS_YEARYear of observation
I2 N/A 1995 N/A N/A N/A
OBS_TIMETime of observation
R8 day 1.00 367.00 N/A N/A
BIRTH_YEARBirth Year of cell
I2 N/A 1995 N/A N/A N/A
BIRTH_TIMEBirth time of cell
R8 day 1.00 367.00 N/A N/A
X_MAPMap location of cell center - x
R8 km N/A N/A N/A N/A
Y_MAPMap location of cell center - y
R8 km N/A N/A N/A N/A
CELL_TEMPTemperature at cell center
R4 deg C -100.0 100.0 N/A N/A
MDDCumulative melting degree days
R4 deg C day 0 N/A N/A N/A
I_AREAInitial cell area
R4 sq km 0 N/A N/A N/A
C_AREACurrent cell area
R4 sq km 0 N/A N/A N/A
OW_FRACOpen water fraction
I2 N/A 0 N/A N/A N/A

25
7.0 Eulerian Ice Motion Product
DescriptionThis product contains the ice motion on a 5km grid computed from a pair of images.
Frequency/Size EstimateThis product is requested by the user. Each product file is approximately 0.02MB and 0.5MB insize for ERS-1 and RADARSAT, respectively.
7.1 Eulerian Ice Motion Product: Metadata Record Contents
Name/Description Type Units Min Max Miss ValuesPIDRGPS Product identifier
C24 N/A N/A N/A N/A N/A
PROD_DESCRIPTIONDescription of this product
C40 N/A N/A N/A N/A N/A
APIDImage A Product identifier
C20 N/A N/A N/A N/A N/A
BPIDImage B Product identifier
C20 N/A N/A N/A N/A N/A
ACENTYEARScene center year of Image A
I2 N/A 1995 N/A N/A N/A
ACENTTIMEScene center time of Image A
R8 day 1.00 367.00 N/A N/A
BCENTYEARScene center year of Image B
I2 N/A 1995 N/A N/A N/A
BCENTTIMEScene center time of Image B
R8 day 1.00 367.00 N/A N/A
A_TL_XUpper left x, Image A
R8 km N/A N/A N/A N/A
A_TL_YUpper left y, Image A
R8 km N/A N/A N/A N/A
A_TR_XUpper right x, Image A
R8 km N/A N/A N/A N/A
A_TR_YUpper right y, Image A
R8 km N/A N/A N/A N/A
A_BR_XLower right x, Image A
R8 km N/A N/A N/A N/A
A_BR_YLower right y, Image A
R8 km N/A N/A N/A N/A
A_BL_XLower left x, Image A
R8 km N/A N/A N/A N/A
A_BL_YLower left y, Image A
R8 km N/A N/A N/A N/A
B_TL_XUpper left x, Image B
R8 km N/A N/A N/A N/A
B_TL_YUpper left y, Image B
R8 km N/A N/A N/A N/A
B_TR_XUpper right x, Image B
R8 km N/A N/A N/A N/A
B_TR_YUpper right y, Image B
R8 km N/A N/A N/A N/A
B_BR_XLower right x, Image B
R8 km N/A N/A N/A N/A

26
B_BR_YLower right y, Image B
R8 km N/A N/A N/A N/A
B_BL_XLower left x, Image B
R8 km N/A N/A N/A N/A
B_BL_YLower left y, Image B
R8 km N/A N/A N/A N/A
PIXEL_SPPixel spacing
R4 m 0.0 100.0 N/A N/A
CREATE_YEARProduct creation year
I2 N/A 1995 N/A N/A N/A
CREATE_TIMEProduct creation time
R8 day 1.00 367.00 N/A N/A
GRID_W_OBSGrid elements with observations
I4 N/A N/A N/A N/A N/A
NPIX_ANumber of pixels across image A
I4 N/A N/A N/A N/A N/A
NREC_ANumber of records down image A
I4 N/A N/A N/A N/A N/A
NPIX_BNumber of pixels across image B
I4 N/A N/A N/A N/A N/A
NREC_BNumber of records down image B
I4 N/A N/A N/A N/A N/A
AVG_DISP_XAverage displacement in x
R4 km N/A N/A N/A N/A
AVG_DISP_YAverage displacement in y
R4 km N/A N/A N/A N/A
D_TIMETime separation between images
R8 day 0.00 366.000 N/A N/A
GRIDSPACEGrid element spacing
R4 km N/A N/A N/A N/A
SW_VERSIONSoftware version used to create this product
C12 N/A N/A N/A N/A N/A
ALGO_TYPEAlgorithm type
C8 N/A N/A N/A N/A N/A
7.2 Eulerian Ice Motion Product: Ice motion Vector data
Name/Description Type Units Min Max Miss ValuesA_GRID_XGrid point location - x, Image A
R8 km N/A N/A N/A N/A
A_GRID_YGrid point location - y, Image A
R8 km N/A N/A N/A N/A
B_GRID_XGrid point location - x, Image B
R8 km N/A N/A N/A N/A
B_GRID_YGrid point location - y, Image B
R8 km N/A N/A N/A N/A
DISP_XDisplacement in x
R4 km N/A N/A N/A N/A
DISP_YDisplacement in y
R4 km N/A N/A N/A N/A
ROT_ANGLERotation angle
R4 N/A -180.0 180.0 N/A N/A
Q_FLAGQuality Flag
BYTE N/A 1 6 N/A N/A

27
8.0 Melt Onset / Freeze Up Product
DescriptionThis product contains the melt onset or freeze up dates of all the grid cells covering the ArcticOcean.
Frequency/Size EstimateThe product generation frequency is twice per year, one during the spring-summer transition andthe other during the summer-fall transition. Each product file is approximately 9MB in size.
8.1 Melt Onset / Freeze Up Product: Metadata Record Contents
Name/Description Type Units Min Max Miss ValuesPIDRGPS Product identifier
C24 N/A N/A N/A N/A N/A
PROD_DESCRIPTIONDescription of this product
C40 N/A N/A N/A N/A N/A
N_CELLSNumber of cells in the product
I4 N/A 1 N/A N/A N/A
CREATE_YEARProduct creation year
I2 N/A 1995 N/A N/A N/A
CREATE_TIMEProduct creation time
R8 day 1.00 367.00 N/A N/A
PROD_START_YEARProduct start year
I2 N/A 1995 N/A N/A N/A
PROD_START_TIMEProduct start time
R8 day 1.00 367.00 N/A N/A
PROD_END_YEARProduct end year
I2 N/A 1995 N/A N/A N/A
PROD_END_TIMEProduct end time
R8 day 1.00 367.00 N/A N/A
SW_VERSIONSoftware version used to create this product
C12 N/A N/A N/A N/A N/A
8.2 Melt Onset / Freeze Up Product: Transition Data
The transition dates data contain multiple records. Each record contains the date of seasonaltransition for a cell. The records are in row order. Each record has the following format.
Name/Description Type Units Min Max Miss ValuesCELL_IDCell identifier
I4 N/A 0 N/A N/A N/A
TRANSITION_YEARYear of observation
I2 N/A 1995 N/A N/A N/A
TRANSITION_TIMETime of observation
R8 day 1.00 367.00 N/A N/A
X_MAPMap location of cell center - x
R8 km N/A N/A N/A N/A
Y_MAPMap location of cell center - y
R8 km N/A N/A N/A N/A

28
9.0 Gridded Wind/Temperature/Pressure Fields (50Km Grid)
DescriptionThis product contains the wind, temperature and pressure at all the grid points (50km gridspacing) covering the Arctic Ocean at time Ts.
Frequency/Size EstimateThe product generation is frequency is once per day. Each product file contains wind,temperature and pressure fields over the Arctic Ocean. Each product file is approximately 0.2MBin size.
9.1 Gridded Wind/Temperature/Pressure Fields: Metadata Record Contents
Name/Description Type Units Min Max Miss ValuesPIDRGPS Product identifier
C24 N/A N/A N/A N/A N/A
PROD_DESCRIPTIONDescription of this product
C40 N/A N/A N/A N/A N/A
N_GRIDNumber of grid points
I4 N/A 1 N/A N/A N/A
CREATE_YEARProduct creation year
I2 N/A 1995 N/A N/A N/A
CREATE_TIMEProduct creation time
R8 day 1.00 367.00 N/A N/A
MET_YEARYear of the analysis
I2 N/A 1995 N/A N/A N/A
MET_TIMETime of the analysis
R8 day 1.00 367.00 N/A N/A
SW_VERSIONSoftware version used to create this product
C12 N/A N/A N/A N/A N/A
9.2 Gridded Wind/Temperature/Pressure Fields: Data
The meteorological data contain multiple records. Each record contains wind vector, pressure andtemperature at each grid point. The records are in row order. Each record has the following format.
Name/Description Type Units Min Max Miss ValuesX_MAPMap location of grid point - x
R8 km N/A N/A N/A N/A
Y_MAPMap location of grid point - y
R8 km N/A N/A N/A N/A
X_WINDx component of wind velocity
R4 m/s N/A N/A N/A N/A
Y_WINDy component of wind velocity
R4 m/s N/A N/A N/A N/A
PRESSUREPressure
R4 mb N/A N/A N/A N/A
TEMPTemperature
R4 deg C N/A N/A N/A N/A