albania: millennium development goals 2010
DESCRIPTION
2010 - The report outlines progress and challenges to achieving the Millennium Development Goals in Albania.TRANSCRIPT
UN Albania
ALBANIA NATIONAL REPORTON PROGRESS TOWARD ACHIEVING THE
MILLENNIUM DEVELOPMENT
GOALS
SPECIAL EDITIONJuly 2010
E
M T
L REPORHIEVING TH
EPN
SPECIAL EDITIONJuly 2010
ALBANIA NATIONAON PROGRESS TOWARD AC
MILLENNIUDEVELOPME
GOALS

This report has been prepared by the Government of Albania with the support of the United Nations in Albania. ( i )

( ii )
SUMMARY
Context
� United Nations (UN) Global Summits and Conferences on global social, economic and environmental issues facing both developing and developed countries were synthesized in the Millennium Summit of September 2000, where 147 heads of state and of government and 191 nations, including Albania, adopted the Millennium Declaration.
� On July 2003, the Albanian Parliament passed a resolution in support of the Millennium Declaration “… encouraging all stakeholders to track progress in achieving the [Millennium Development Goals] MDGs on a regular basis through national monitoring and evaluation systems and the preparation of annual progress reports that encourage public debate and offer recommendations on ways to improve national … development policies.”
� With only five years to the 2015 target date, this 2010 special edition country report is Albania’s contribution to a UN global review of the MDGs. The results are to be presented at a High-Level Plenary Meeting of the General Assembly on MDGs in the autumn of 2010.
� At the national level, this report can help ensure that the promise of 2015 is kept by government by providing all stakeholders with a common, nationally owned framework for continued action towards the MDGs, which in turn feed directly into Albania’s National Strategy for Development and [European] Integration (NSDI).
� The government has reported on MDG progress since 2002. By 2004, the eighth goal on developing a global partnership for development was formally adapted to the Albania MDGs, and a special 9th goal to establish and strengthen good governance was included. MDG reporting is nationally owned and is fully integrated into the government’s annual NSDI reporting process.
� By 2008, it became evident that Albania’s strong economic growth since the early 2000’s would contribute to achieving many of its MDG targets well before 2015. Also, it was seen that the goals should be better aligned with both that of European Integration (EI) and the Paris Declaration on Harmonization. The set of MDG targets and indicators as they are now defined better complement the EU work on promoting social inclusion, including implementation of the Lisbon Strategy.
Progress
� Since 2002, Albania’s strong economic growth has been a major contributing factor to its positive tracking toward the achievement of a number of MDG targets in such areas as combating extreme poverty and gender inequalities, improving some aspects of health and expanding access to safe drinking water and sanitation.
� On the positive side, the proportion of the population in absolute poverty declined from over 25% in 2002 to 12.4% by 2008. Maternal mortality rate in 2008, at 10 per 100,000 was down by half from the 2001 level and is well on track to meeting the 2015 target. Considerable progress has been made in eliminating gender disparities (especially in education) and there is a moderate chance that the 2015 targets will be met.
� In some of the infrastructure areas, a greater proportion of the population (82.1%) had access to drinking water by 2009, though the 2015 target of 98% will not likely be reached. With a strong probability of continued domestic and external financing on sanitation, it is likely that the 2015 target of 90% of the population having access can be reached.

( iii )
� One of the most successful areas has been Albania’s investment in information and communication technology (ICT) as both an indicator of better governance (in terms of, for example, reduced corruption, and increased transparency of, and improved access to, some government services) and in building strong partnerships.
� Challenges remain in a number of other target areas. For example, whereas there has been a minor decline in unemployment since 2002 to a current level of 13.1%, it is unlikely that the targeted 9% level will be reached by 2015.
� Enrolment in basic education has also fallen, and considerable disparities remain between rural and urban areas, among regions and for disadvantaged groups such as the Roma. Of some concern is the under-five-year child mortality rate, which remains high with the 2015 target unlikely to be met, despite the fact that there has been a steady reduction in both child and infant mortality.
� Achieving governance improvement targets will be difficult without a major government effort and investment in capacity development, administrative reform and anti-corruption measures.
Challenges
� The Albanian economy was not as adversely affected by the 2008–2009 global financial crisis as were other economies in south-eastern Europe. Even though the crisis was primarily external in nature, it did nevertheless test the efficacy of the country’s macro-economic equilibrium, structural reforms, financial and banking systems and resiliency of the private sector.
� The main areas where impacts have been seen were in remittances, commodities, the export-sensitive footwear and apparel industry and migration. However, such impacts were moderate and short-lived, with no measurable effects on poverty or employment levels.
� The achievement of the MDGs in Albania by 2015 is dependent on the ability of the Albanian economy to maintain an adequate level of growth and sustainable levels of government investments in social and human development. This may require a re-examination of the growth models that have been used in the past.
� Government has committed to keeping national debt below 60% of GDP and to reducing the annual deficit to below 3%, within the limit established by the organic budget law and Maastricht threshold. Such actions will limit the fiscal policy space of government with possible tightening of expenditures. Investments in education and health remain among the top development priorities.
� One of the major challenges to ensuring longer-term sustainability of basic services delivery, achievement of the MDGs and other socio-economic and EI goals is development of the needed system-wide and sustainable capacities in the Albanian system of public administration, including systems for data collection and monitoring.
� In this context, government intends to balance sustainable achievement of the MDGs in the longer term, with the meeting of shorter-term time-bound targets.
� In terms of longer-term financial and economic challenges and meeting MDG targets in Albania, mitigating factors include prior experience in dealing with crises, the informal economy, rural and agrarian based economy, and family and community structures and networks.
� These all serve as safety nets in times of crisis and can help mitigate set-backs in achieving the MDGs, though the many other measures discussed in the main report will help achieve them.

( iv )
TABLE OF CONTENTS
Table of Contents
INTRODUCTION .............................................................................................................................. ............................ 1
ADAPTING THE MDGs IN ALBANIA ...................................................................................................................... 1
PAST PERFORMANCE .............................................................................................................................. .................. 3
THE FINANCIAL CRISIS AND FUTURE CHALLENGES ...................................................................................... 3
ANALYSIS OF INDIVIDUAL MILLENNIUM DEVELOPMENT GOALS ............................................................ 7
MDG 1. Eradicate extreme poverty and reduce the risk of social exclusion ........................................ 7
MDG 2. Achieve high quality basic universal education .......................................................................... 12
MDG 3. Promote gender equality and empower women........................................................................ 16
MDG 4. Reduce child mortality .......................................................................................................................... 21
MDG 5. Improve maternal health ..................................................................................................................... 21
MDG 6. Combat HIV/AIDS and tuberculosis ................................................................................................. 21
MDG 7. Ensure sustainable environmental development ....................................................................... 29
MDG 8. Develop a global partnership for development .......................................................................... 33
MDG 9. Improve governance for all citizens & especially for the most disadvantaged groups . 38
MDG PERFORMANCE—STATUS AT A GLANCE ............................................................................................. 41
Annexes 1. Albania MDGs—Table of Revised Targets and Indicators 2. Summary Table—Paris Declaration Indicators, Albania 3. Governance Indicators—WBI, Albania 4. List of Acronyms
( 1 )
INTRODUCTION
In July 2003, the Albanian Parliament passed a resolution in support of the Millennium Declaration: “… encouraging all stakeholders to track progress in achieving the [Millennium Development Goals] MDGs on a regular basis through national monitoring and evaluation systems and the preparation of annual progress reports that encourage public debate and offer recommendations on ways to improve national … development policies.”
With only five years to the target date of 2015, the United Nations is leading a global review of the MDGs. This 2010 special edition country report is Albania’s contribution to that review. The results are to be presented at a High-Level Plenary Meeting of the UN General Assembly on MDGs in the autumn of 2010. As such, it will be a defining moment to galvanize new political commitment globally and to spur collective action and the effort needed over the final few years. At the national level, this report can help ensure that the promised date of 2015 is kept by the government of Albania by providing national stakeholders with a common, nationally owned framework for continued action towards the MDGs, which in turn feed directly into Albania’s National Strategy for Development and [European] Integration (NSDI).
This report has been prepared through close collaboration between the Department of Strategy and Donor Coordination (DSDC) and line ministries of the government of Albania and the UN Country Team in Albania. A general methodology was developed by the UN in order to facilitate cross-country and regional comparative analyses and the sharing of experiences. In the development of this report, the government adapted this methodology to ensure participation of a wide range of stakeholders who provided data and reported on progress, helped to identify major successes and lessons learned, supported the analysis of trends and specific impacts of the financial crisis, and contributed to the identification of the major challenges and policy responses that would be needed. Government also synchronized the development of this report with the mid-term review of NSDI. The report will also be used as input to the updating of the Albania One UN Programme.
The next sub-section of the report provides a brief overview of the Albania MDG context in terms of how the MDGs have evolved over time, and the enablers and national challenges that lie ahead, particularly in light of the on-going global and regional financial crises. The main section presents a high-level assessment of each of the nine MDGs in terms of specific target and indicator trends, successes and lessons, main challenges unique to each goal, and some projections on the likelihood of achievement by 2015. The final section presents a snap-shot of MDG status. The annexes contain supporting data available for review up to June 2010.
ADAPTING THE MDGs IN ALBANIA
1. Establishing baselines. The first Albania MDG Report was prepared in 2002. That baseline report followed on from a situation analysis of activities and was prepared as follow-up to the Declarations and Conventions of the 1990s to which Albania was a party. At the time, only the first seven of the eight MDGs were addressed, since the eighth goal, on partnerships, was defined globally. Initial progress was made at nationalizing the MDGs during the drafting process of the National Strategy for Socio-Economic Development (NSSED) that harmonized the 2002–2004 development priorities with some of the long-term targets of the MDG indicators, especially for health and education.

( 2 )
Over the subsequent two years, national consensus-building working groups comprising development partners were formed to identify Albania-relevant MDG targets and indicators. At the local level, Albania was the first country to develop sub-national MDG targets and indicators to be used for regional strategy formulation and planning. This process, and the resulting 2005 progress report, served to expand awareness and understanding of the MDGs and also the need for national ownership by further integrating them into national social, economic and human development strategies. This change responded directly to the agreement reached by world leaders in 2004, at the UN General Assembly, that countries would incorporate MDGs in national plans rather than have a stand-alone process. Of significance, the eighth goal on developing a global partnership for development was formally adapted to the Albania MDGs, and a special ninth goal to establish and strengthen good governance was included.
2. Monitoring progress. The first comprehensive review of the MDGs was carried out in 2005. The analysis explored the prospects of meeting the goals by 2015, the ambitiousness of the targets, and an assessment of monitoring systems to track progress. Due to the scarcity of, and in some cases low quality, data only a general overview of progress could be given at that time. As discussed in more detail in the individual MDG sections of this report, government reported good progress on a number of indicators cutting across poverty reduction, education and some aspects of health delivery. In the case of governance, the 2005 review revealed that progress in Albania fell far below the average of south-eastern Europe. The review results were also factored into the government’s 2005 NSDI Progress Report.
3. Re-alignment of the MDGs. By 2008, it became evident that Albania’s strong economic growth since the early 2000s would contribute to achieving many of its MDG targets well before 2015, though some were seen as somewhat difficult to reach. Also, it was seen that the MDGs should be better aligned with both the European Integration goal and the Paris Declaration on Harmonization. Accordingly, government revised and realigned a number of MDG targets. Some were made more ambitious while others were made more realistic in terms of what could be achieved by 2015. As a result, in 2009, government increased the number of targets (from 19 to 22) and indicators (from 42 to 89), and adjusted some of the 2015 targets levels. The results of this consultative process were reported in the 2009 NSDI Progress Report. The complete list of revised MDG targets and indicators is contained in Annex 1.
4. Albania’s MDGs and the EU Agenda. The set of MDG targets and indicators, as they are now defined, better complement the EU’s work on promoting social inclusion, including implementation of the Lisbon Strategy. EU membership will no doubt lead to greater prosperity and security for Albania. However, government recognizes that the acquis communautaire process will need to be coupled with increased investments in social areas, in building systems for good governance and in capacity development to ensure continued improvement in the well-being of the Albanian people.
The implementation of the Stabilization and Association Agreement (SAA, signed in June 2006) and Albania’s formal application for candidacy that was made in 2009 will involve increased and significant obligations for the country in terms of trade, rule of law, human rights, democratic standards, regional co-operation and new legislation. The areas covered by the revised MDGs better complement the SAA process by strengthening its social and human dimensions and facilitating faster and more sustainable progress in improving the well-being of the population. Addressing the issues covered by the MDGs and integrating them with NSDI provide a real opportunity to ensure that Albania enters the EU as an equal member, with similar standards in social security, education, gender equality, health and environmental sustainability ready to play its part in contributing to the success of the union.

( 3 )
PAST PERFORMANCE
Since 2002, Albania’s strong economic growth has been a major contributing factor to its positive tracking toward achievement of a number of MDG targets in such areas as combating extreme poverty and gender inequalities, improving some aspects of health and expanding access to safe drinking water and sanitation. Other targets remain more elusive. On the positive side, the proportion of the population in absolute poverty declined from more than 25 per cent in 2002 to 12.4 per cent by 2008. The maternal mortality rate in 2008, at 10 per 100,000, was down by half from the 2001 rate, and is well on track to meeting the 2015 target. Considerable progress has been made in eliminating gender disparities (especially in education) and there is a moderate chance that the relevant 2015 targets will be met. The proportion of females holding post of minister or deputy minister increased to 14 per cent and 25 per cent, respectively, by 2008, with the 2015 target set at 30 per cent.
With regard to some aspects of infrastructure improvement, a greater proportion of the population (82.1%) had access to drinking water by 2009, though the 2015 target of 98 per cent will probably not be reached. With a strong likelihood of continued domestic and external financing for sanitation, it is probable that the 2015 target of 90 per cent of the population being connected to a sewage system can be reached. Meanwhile, one of the most successful areas has been Albania’s investment in information and communication technology (ICT) as both an indicator of better governance (in terms of, for example, reduced corruption, and increased transparency of and improved access to some government services) and in building strong partnerships. Over the past two years, the country has witnessed growth in the availability of e-services across most basic government services. Close to 80 per cent of basic e-government services at the central government level are currently offered, and mobile or cellular telephony penetration and Internet use are expected to reach their targets well ahead of 2015.
Considerable challenges remain in a number of other target areas. For example, whereas there has been a minor decline in unemployment since 2002, to the current level of 13.1 per cent, it is unlikely that the target level of nine per cent will be reached by 2015. Enrolment in basic education has fallen and considerable disparities remain between rural and urban areas, among regions and for disadvantaged groups such as Roma. Of some concern is the level of under-five child mortality, which remains high and with the 2015 target not likely to be met, despite the fact that there has been a steady reduction in both child (under five years old) and infant (up to one year old) mortality. Achieving the target of cost-effective and corruption-free governance will be difficult without a major government effort and investment in capacity development, administrative reform and anti-corruption measures.
THE FINANCIAL CRISIS AND FUTURE CHALLENGES
1. The global financial crisis. The Albanian economy was not as adversely affected by the 2008–2009 global financial and economic crisis as were other economies in Europe, including in the south-east. Even though the crisis was primarily external in nature, it did test the efficacy of the country’s macro-economic equilibrium, structural reforms, financial and banking systems and resiliency of the private sector. Withdrawal of deposits was the first sign of financial crisis contagion, beginning in late 2008 and extending into early 2009. The Law on Deposit Insurance was quickly revised by the authorities to increase the insured amount of deposits, and this proved

( 4 )
to be an important measure in restoring confidence in the financial system. Another major result of the crisis was a drop in GDP growth to an estimated two to three per cent in 2009 from the high level of about six per cent experienced between 2002 and 2008. Recent data show a return to positive territory in early 2010 though with less strong growth. The relatively positive performance over the past couple of years is seen as a function of the rapid crisis response of government in terms of providing some fiscal stimulus combined with prudent approaches to monetary policy.
As discussed in the next section on poverty reduction and employment (MDG 1), the main areas where impacts might have been seen were in remittances, commodities, the export-sensitive footwear and apparel industry, and migration. Remittances have been an important source of foreign financing and poverty reduction and by 2006 accounted for about thirteen per cent of GDP.1 There was a moderate decline in remittances since 2006, to about ten per cent of GDP by 2009, and some further declines due to the financial crisis. However, there has been minimal reported impact on poverty levels. With respect to the footwear and apparel industry, where employment is to a large extent based on low-paid and low-skilled female workers, a recent rapid assessment of the impact of the crisis showed only minor and short-term impacts.2
There is little information on migration patterns, but the deepening of the crisis and planned austerity measures in Greece could result in a return of particularly low-skilled Albanian construction and agricultural workers from that country.3 Despite the seemingly minimal impacts on these aspects of the Albanian economy, and indirectly on the MDGs, some research on past crises shows that there might be complex channels and significant lags in effects of the crisis.4
2. Future challenges. Achievement of the MDGs by 2015 is dependent on the ability of the Albanian economy to maintain an adequate level of growth and sustainable levels of government investments in social and human development. However, in view of the many financial and economic uncertainties in the global economic and regional environments—expected to continue for some time—, forecasting and managing Albania’s economic growth, its fiscal capacities or achievement of the MDGs are among the major challenges. Any range of planning assumptions can be applied in developing forecasts, but none can take fully into account the unpredictable external environment, which has been, and will continue to be, one of the prime determinants of Albania’s future development direction. It is, therefore, prudent to base forecasts of growth and MDG achievement on at least a couple of scenarios:
Strong growth. The government’s baseline scenario for average annual economic growth over the medium term (2010–2013) is 6.4 per cent5, which may be seen as a fairly rapid return to the strong growth rates experienced in the past. This anticipated level is well above the growth projections for other countries in the Western Balkans, and even for Europe as a whole.
�
�
1 Bank of Albania. 2 Institute of Contemporary Studies (ISB), Rapid assessment of the impact of the global economic crisis on the apparel and footwear industry in Albania, Tirana, Albania, April, 2010. 3 Independent sources suggest that up to 25% of the population and more than 35% of the Albanian labour force are migrants, with close to 2/3 of these working in Greece, primarily in construction, agriculture and services (Barjaba, 2004, Bank of Albania). 4 UNDP, The Human Development Impact of the Global Crisis in Central, Eastern and Southern Europe and the CIS, Bratislava, January, 2010. 5 Republic of Albania, Economic and Fiscal Program 2010–2012, January, 2010, page 8.

( 5 )
Slow growth. A somewhat more conservative forecast of average annual GDP growth in Albania over the same period is estimated by the IMF to be in the order of 3.3 per cent.6 The lower projections of growth are seen by the IMF to be at the limit of Albania’s potential, given both the uncertainties in the external environment and vulnerabilities in the internal environment, such as continuing high deficits and faltering confidence of households and enterprises, that could dampen consumption and investment.7
A second major challenge is keeping the national debt below 60 per cent of GDP, within the limit established by the organic budget law and Maastricht threshold. Government has also committed to reducing the annual deficit to below three per cent and controlling the current account and trade deficits. Such actions will limit the fiscal policy space of government with possible tightening of expenditures. Although the government has committed itself to maintaining current health and education expenditure levels, other areas may see reductions (e.g. budget freezes and reductions in some areas, such as forestry). Increasing demands may also be made on the government and the economy with an expected large entry of young people into the labour force over the next several years combined with returning migrants
Perhaps one of the major challenges in terms of ensuring longer-term sustainability of basic service delivery, and achievement of the MDGs and other socio-economic goals is developing the needed system-wide capacities in public administration. This issue cuts across all MDGs, as discussed in the next sections of this report. Government will apply strong political and executive leadership to ensure the implementation of broad-based public administration reforms, capacity development and anti-corruption measures.
Despite the challenges, there are several mitigating factors. Combined with prior experience in dealing with crises, the informal economy, the rural and agrarian based economy and family and community structures and networks all serve as safety nets in times of crisis. These can help mitigate setbacks in achieving the MDGs, though the many other measures discussed in the following sections will help achieve them.
6 IMF, Albania: 2010 Article IV Consultation–Preliminary Conclusions of the Mission, 10 March 2010, p. 5. 7 A third scenario might be considered, based on a double-dip global or regional recession. Such a scenario could have a major shock impact on Albania’s trade, investment and remittances flows.

( 7 )
ANALYSIS OF INDIVIDUAL MILLENNIUM DEVELOPMENT GOALS
MDG 1. Eradicate extreme poverty and reduce the risk of social exclusion
Current Targets Probability of Meeting 2015 Targets
High Medium Low ND*
1.1 Eradicate extreme poverty and reduce 3-fold absolute poverty between 2002 and 2015
1.2 Reduce unemployment rate toward EU employment rate, between 2002 and 2015
1.3 Improve income distribution in order that the Albanian distribution model gets closer to the EU model between 2008 and 2015
* ND, Indeterminate
Context. It was not until 1991 that poverty was officially recognized in Albania. Regarded as a multidimensional phenomenon, it is not limited to basic livelihood elements—food, clothing and housing—, important though these are, but also encompasses a lack of hope, exclusion from economic and social life, inability to support family and maintain social traditions, lack of adequate infrastructure, low security, low quality of health and limited education services.8 A Living Condition Survey (LCS) carried out in 1998 found that 29.6 per cent of Albanians were poor, while half of them lived in extreme poverty, with much higher rates prevalent in rural areas.9 By 2002, 25.4 per cent of the population was living below the absolute poverty line. The MDG target set at the time was to halve this rate by 2015, to 13 per cent, and over the same timeframe to reduce the share of the poorest quintile in national consumption, from 11.5 per cent to 6.3 per cent.
As highlighted in the introduction, the success of macro-economic policies over the past ten years has seen Albania witness a sustained period of GDP growth averaging about six per cent per annum, higher than most countries in the region. Such growth has contributed to a rapid decline in the rates of absolute and extreme poverty to the point where most of the initial targets had either been exceeded by 2008 or were expected to be reached well before the 2015 target date. Consequently, the government amended and set more ambitious MDG 2015 targets in 2008 to be measured by a more comprehensive set of indicators (see Annex 1). One of the more important changes was a greater emphasis on reducing the risks of social exclusion and to align the poverty reduction goal with the EU social inclusion policy.
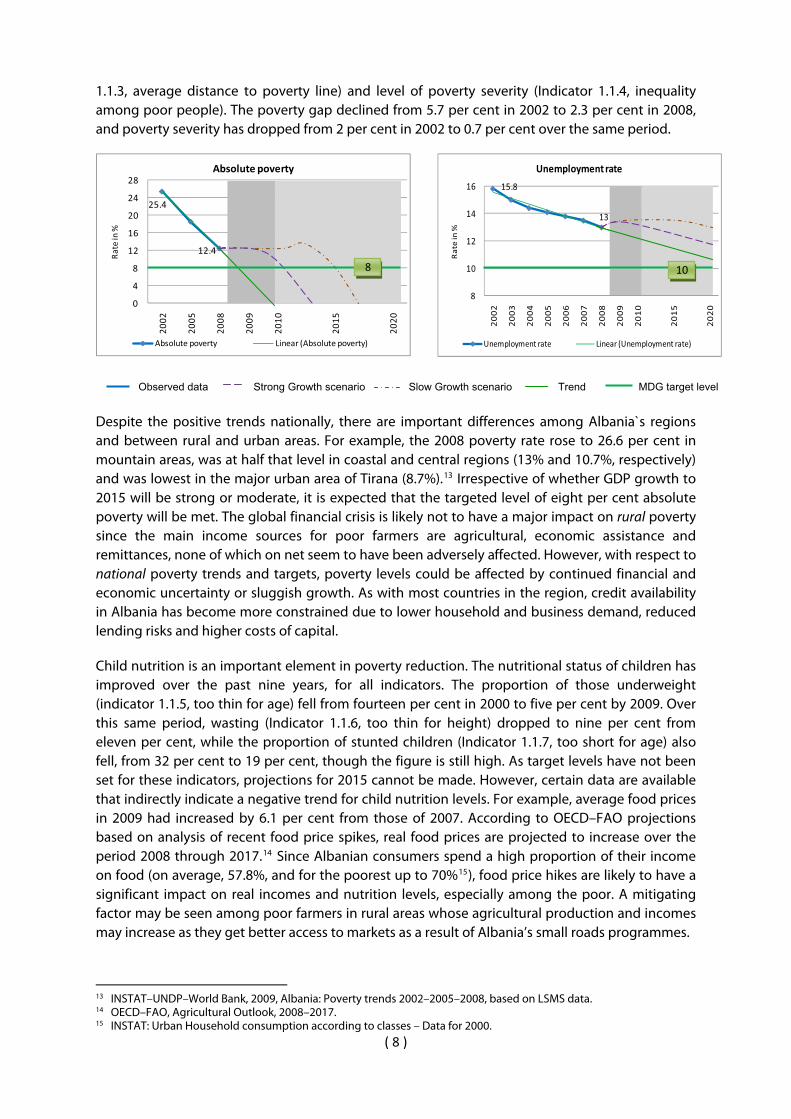
Analysis of Trends. With respect to Target 1.1, absolute poverty10 declined to 12.4 per cent by 2008, or less than half the 2002 level, and also well below the figure of 18.7 per cent recorded in 200511. In numeric terms, more than 200,000 people out of 575,000 poor people had been pulled out of poverty. Rates of extreme poverty12 followed a similar trend: down to 1.2 per cent by 2008 from 4.7 per cent in 2002, and 3.5 per cent in 2005. Achievement has been tracked in child nutrition as well (Indicators 1.1.4 to 1.1.7). Prevalence of underweight children under five years of age dropped to six per cent in 2009, down from fourteen per cent in 2000 and eight per cent in 2005. Trends also show a high likelihood of achieving the 2015 targeted poverty gap (Indicator
8 World Bank, A Qualitative Assessment of Poverty in 10 Areas of Albania, Washington, DC, June 2001. 9 INSTAT, Results of Household Living Condition Survey October 1998, Tirana, July 2001. 10 Absolute poverty is defined as proportion of population living below poverty line (consumption, 4,891 Albanian Leke per month, 2002 prices). 11 INSTAT–UNDP–World Bank, 2009, Albania: Poverty trends 2002–2005–2008, based on Living Standard Measurement Survey (LSMS) data. 12 Extreme poverty is defined as proportion of population not being able to meet basic food needs.
( 8 )
1.1.3, average distance to poverty line) and level of poverty severity (Indicator 1.1.4, inequality among poor people). The poverty gap declined from 5.7 per cent in 2002 to 2.3 per cent in 2008, and poverty severity has dropped from 2 per cent in 2002 to 0.7 per cent over the same period.
25.4
12.4
0
4
8
12
16
20
24
28
2002
2005
2008
2009
2010
2015
2020
Rat
e in
%
Absolute�poverty�
Absolute poverty Linear (Absolute poverty)
15.8
13
8
10
12
14
16
20
02
20
03
20
04
20
05
20
06
20
07
20
08
20
09
20
10
20
15
20
20
Rat
e in
%
Unemployment�rate
Unemployment rate Linear (Unemployment rate)
Observed data Strong Growth scenario Slow Growth scenario Trend MDG target level
8 10
Despite the positive trends nationally, there are important differences among Albania`s regions and between rural and urban areas. For example, the 2008 poverty rate rose to 26.6 per cent in mountain areas, was at half that level in coastal and central regions (13% and 10.7%, respectively) and was lowest in the major urban area of Tirana (8.7%).13 Irrespective of whether GDP growth to 2015 will be strong or moderate, it is expected that the targeted level of eight per cent absolute poverty will be met. The global financial crisis is likely not to have a major impact on rural poverty since the main income sources for poor farmers are agricultural, economic assistance and remittances, none of which on net seem to have been adversely affected. However, with respect to national poverty trends and targets, poverty levels could be affected by continued financial and economic uncertainty or sluggish growth. As with most countries in the region, credit availability in Albania has become more constrained due to lower household and business demand, reduced lending risks and higher costs of capital.
Child nutrition is an important element in poverty reduction. The nutritional status of children has improved over the past nine years, for all indicators. The proportion of those underweight (indicator 1.1.5, too thin for age) fell from fourteen per cent in 2000 to five per cent by 2009. Over this same period, wasting (Indicator 1.1.6, too thin for height) dropped to nine per cent from eleven per cent, while the proportion of stunted children (Indicator 1.1.7, too short for age) also fell, from 32 per cent to 19 per cent, though the figure is still high. As target levels have not been set for these indicators, projections for 2015 cannot be made. However, certain data are available that indirectly indicate a negative trend for child nutrition levels. For example, average food prices in 2009 had increased by 6.1 per cent from those of 2007. According to OECD–FAO projections based on analysis of recent food price spikes, real food prices are projected to increase over the period 2008 through 2017.14 Since Albanian consumers spend a high proportion of their income on food (on average, 57.8%, and for the poorest up to 70%15), food price hikes are likely to have a significant impact on real incomes and nutrition levels, especially among the poor. A mitigating factor may be seen among poor farmers in rural areas whose agricultural production and incomes may increase as they get better access to markets as a result of Albania’s small roads programmes.
13 INSTAT–UNDP–World Bank, 2009, Albania: Poverty trends 2002–2005–2008, based on LSMS data. 14 OECD–FAO, Agricultural Outlook, 2008–2017. 15 INSTAT: Urban Household consumption according to classes – Data for 2000.
( 9 )
With respect to Target 1.2, the trend in unemployment has not been as positive as that for Target 1.1., and it is unlikely that the targeted level of nine per cent unemployment will be reached by 2015. Even though there has been a downward trend16, the 2009 national unemployment rate of 13.1 per cent varies significantly across regions. In 2008, Kukës region had the highest unemployment rate (30.9%), followed by Shkodër (24.2%) and Lezhë (22.1%). This contrasts with Tirana which had the lowest unemployment level at 7.3 per cent.
The financial crisis has placed downward pressure on the construction sector, on some export oriented industries and on remittances, all of which are sensitive to regional economic conditions. In addition to the footwear and textile industry (see Box 1), unskilled labour in Albania tends to be concentrated in construction and it is expected that there will be some pressure on employment that could result in a lower rate of decline in the poverty rate (or possibly an increase, should economic conditions get worse than forecast).
With respect to Target 1.3, on improving income distribution, the government`s long-term vision is for an inclusive society according to the EU model. The strategy focuses on creating a formalized labour market, increasing labour market participation by women, tackling disadvantages in education and training, with particular emphasis on secondary school enrolment, modernizing social assistance, alleviating child poverty, improving access to services for vulnerable groups and tackling barriers to participation for Roma, people with disabilities and older people. A monitoring system, consistent with that of the EU, is designed to track progress toward the EU model. As no data are yet available to measure the indicators, analysis or projections cannot be made at the present.
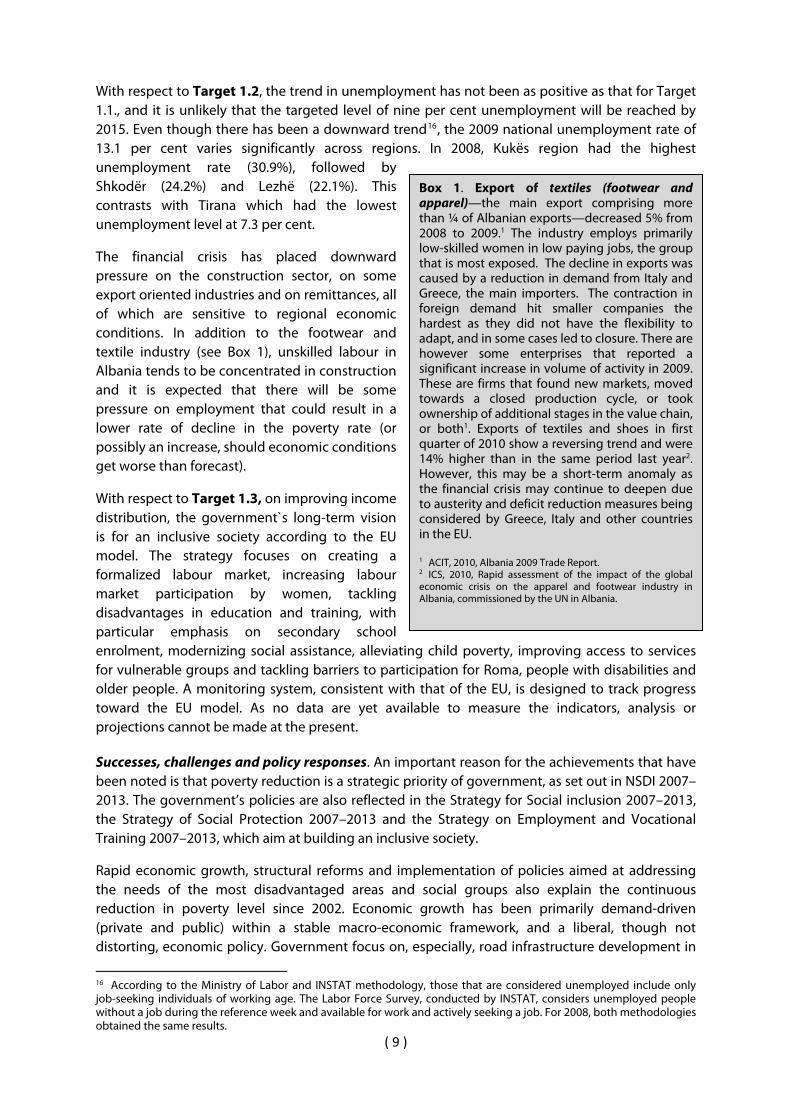
Box 1. Export of textiles (footwear and
apparel)—the main export comprising more than ¼ of Albanian exports—decreased 5% from 2008 to 2009.1 The industry employs primarily low-skilled women in low paying jobs, the group that is most exposed. The decline in exports was caused by a reduction in demand from Italy and Greece, the main importers. The contraction in foreign demand hit smaller companies the hardest as they did not have the flexibility to adapt, and in some cases led to closure. There are however some enterprises that reported a significant increase in volume of activity in 2009. These are firms that found new markets, moved towards a closed production cycle, or took ownership of additional stages in the value chain, or both1. Exports of textiles and shoes in first quarter of 2010 show a reversing trend and were 14% higher than in the same period last year2. However, this may be a short-term anomaly as the financial crisis may continue to deepen due to austerity and deficit reduction measures being considered by Greece, Italy and other countries in the EU. 1 ACIT, 2010, Albania 2009 Trade Report. 2 ICS, 2010, Rapid assessment of the impact of the global economic crisis on the apparel and footwear industry in Albania, commissioned by the UN in Albania.
Successes, challenges and policy responses. An important reason for the achievements that have been noted is that poverty reduction is a strategic priority of government, as set out in NSDI 2007–2013. The government’s policies are also reflected in the Strategy for Social inclusion 2007–2013, the Strategy of Social Protection 2007–2013 and the Strategy on Employment and Vocational Training 2007–2013, which aim at building an inclusive society.
Rapid economic growth, structural reforms and implementation of policies aimed at addressing the needs of the most disadvantaged areas and social groups also explain the continuous reduction in poverty level since 2002. Economic growth has been primarily demand-driven (private and public) within a stable macro-economic framework, and a liberal, though not distorting, economic policy. Government focus on, especially, road infrastructure development in
16 According to the Ministry of Labor and INSTAT methodology, those that are considered unemployed include only job-seeking individuals of working age. The Labor Force Survey, conducted by INSTAT, considers unemployed people without a job during the reference week and available for work and actively seeking a job. For 2008, both methodologies obtained the same results.
( 10 )
rural and mountainous areas and institutional building, combined with continuous wage, salary and pension increases, have had a positive effect on aggregate demand. Measures have been taken to ensure Roma community inclusion in employment and poverty alleviation programmes, facilitation of their participation in vocational training initiatives and support to other disadvantaged groups, including disabled people, and people with limited abilities.
One of the key challenges that lie ahead is maintaining regionally balanced economic growth and business formation as these are seen as the prime contributors to poverty reduction and increased employment. System-wide capacity constraints across government at both the central and local levels and at the human and institutional levels are seen as obstacles to development and to the sustainable delivery of results. Weak systems for monitoring, collecting data and undertaking surveys continue to impede policy analysis, planning, programming and government accountability.
In terms of major policy responses considered by government, the main emphasis is on developing a long-term and sustainable enabling environment for employment and social inclusion. The Bank of Albania and the government are exploring a new growth model that does not rely much on production and consumption but rather on strategic economic positioning in terms of what kinds of skills, trades and professions Albania will need in the years to come. Poverty reduction and employment generation in rural areas and among disadvantaged groups will continue to be a priority. This includes systems and procedures for better targeting of social and employment assistance and reduction of abuse. Increasing local government capacities and coordination between central and local government is crucial for the success of economic assistance reform.
Since poverty is found predominantly in rural and mountainous areas, the Mountainous Areas Development Agency and the Mountainous Areas Financing Fund are designed to support investment in farming and rural infrastructure, and extending small loans to poor farmers. Additionally, two EU supported strategies—Instrument for Pre-Accession in Rural Development (IPARD, already under preparation), and the Regional Crosscutting Strategies 2007–2013 (approved in 2007)—are expected to tackle poverty reduction as well.


( 12 )
MDG 2. Achieve high quality basic universal education
Current Targets Probability of Meeting 2015 Targets
High Medium Low ND
2.1 Ensure universal enrolment of basic education (1–9 years) by 2015 2.2 Improve education quality to approach OECD countries level 2.3 Increase spending for basic education to the level of new EU member states
Context. Education is a high priority sector under NSDI 2007–2013. Government has pledged to achieve “Education for All” by 2015, and has committed increased funding to attain specific goals. To attract and retain committed professionals to the field, teachers’ salaries have been doubled over the past five years. A National Strategy for Pre-University Education (2008–2013)17 identifies seven priority areas, including governance (reform and strengthen policymaking and management capacity), increased access to pre-university education at all levels, improved quality in education, increased funding and efficiency, strengthened institutional capacities and development of human resources, development of pre-school education and improved professional education.
Government decided in 2009 to make some adjustments to the 2015 education goal by introducing some new indicators and making others more ambitious, and at the same time align targets to the EU integration and social inclusion processes (see Annex 1). The corresponding target was adjusted to reflect the legal obligation of a minimum of nine years in basic education. Also, the target for the proportion of funding on education was increased to the average of new EU members. New indicators cover enrolment in pre-school education, gross enrolment ratios and certain external indicators of quality in basic education, including average grades in mathematics, reading and use of the Programme for International Student Assessment (PISA) system. Some of the indicators on quality cannot be tracked at the present time as targets have yet to be set or there is a lack of quality data, or both.
Analysis of trends. With respect to Target 2.1 on ensuring universal enrolment in education, the decline in basic education noted above is graphically illustrated in the chart below. As Albania entered a transition period, basic education was free of charge and access levels were very high as were participation rates. This was reflected by high literacy and enrolment rates across all education levels, including basic education. For example, the literacy rate for the 15–24 years old group in 2009 (Indicator 2.1.5) was high, at 98.1 per cent, though there were some very minor differences between females (98.6%) and males (97.6%) and between urban (99%) and rural areas (98%). Despite the high literacy rate, the average number of years of schooling is, at 11.2 years, below those of European and Balkan countries. The enrolment ratio in pre-school education (Indicator 2.1.1) has stagnated for the past six years, being somewhat higher for females (52.7%) than for males (49.2).
In some indicators, there remain significant disparities between rural and urban areas, and across regions, with rural remote areas and suburbs facing the greatest challenges. Furthermore, indicators in basic education show disparities and limited access on the part of disadvantaged social groups and minorities, including Roma, street children, disabled children and those who are in families in need. It is estimated that 12,000 disabled children have not finished basic education. Government support reaches less than ten per cent of this category and is provided in residential
17 MoES, 2008, National Strategy for Pre-University Education, 2008–2013.

( 13 )
care institutions.18 Of the approximately 5,000 Roma children aged 3–16 years, more than half (54%) have not yet completed a single school grade. Only 27 per cent of six-year-old Roma children are enrolled in first grade, and one in two children of basic education age has abandoned school.19
As graphically illustrated below, the overall trend suggests that the targets for universal enrolment in basic education will not be met by 2015. Under either the strong growth or slow growth scenario, significant investments and policy decisions would be required by government to reverse the trend.
94
88.4
84
86
88
90
92
94
96
98
100
2003
2004
2005
2006
2007
2008
2009
2010
2015
2020
%
Net�enrollment�ratio
3
3.8
33.23.43.63.8
44.24.44.64.8
5
2003
2004
2005
2006
2007
2008
2009
2010
2015
2020
% o
f GD
P
Government�budget�on�education
Observed data Strong Growth scenario Slow Growth scenario Trend MDG target level
96
5
With respect to the financial crisis, partial surveys show that the economic slowdown has had some effect on education indicators. A survey conducted in Durrës by UNICEF in 2009 revealed that the drop-out rate had increased by ten per cent, though this is seen as somewhat of an isolated case and not reflective of the national trend. An earlier survey conducted in Kukës in 200720 also revealed a high drop-out rate, though this too is not seen as reflective of the national trend.
With respect to Target 2.3 on increased spending on basic education, there has been reasonable improvement. Government expenditures on education increased to 3.8 per cent of GDP in 2009, up from three per cent in 2004. Nonetheless, the proportion of expenditures on education is low when compared to an average of five per cent of GDP spent by EU countries in 2005 (ranging from a low of 3.95% for Greece to a high of 8.28% for the Nordic countries). The trend as graphically illustrated above suggests, however, that Albania is on track to meeting the 2015 target of five per cent. The transmission channels of economic crisis shocks to education might yet be seen in cuts to public spending on education, which would add to the intensity of coping strategies, e.g. families taking children out of school and putting them to work. All this may result in reduced school enrolment and completion rates.21 Declining wages or lower parental income in general increases the marginal value of additional income that children can bring home if they work.
�
18 MoLSAEO, 2010, Progress Report–Social Inclusion Strategy, 2008–2009. 19 UNICEF and Save the Children, 2007, Educational situation of Roma children in Albania. 20 Regional Education Directorate of Kukës, UNICEF 2007–School drop-out in the Region of Kukës, causes, recommendations. 21 Partial surveys show that the global financial crisis and economic slowdown have already affected education indicators. A survey conducted in Durrës by UNICEF in 2009 reveals that drop-out rate has increased by 10%. This is the worst scenario, however, and does not indicate a national pattern.

( 14 )
Success factors, challenges and policy responses. The potential for greater progress in education performance is related to the considerable investments that have been made in the physical infrastructure (schools and school equipment) over the past decade to adjust to demographic movements. The recent doubling of teachers’ salaries has also resulted in attracting and retaining a more professional cadre. The government’s focus over the medium to longer term is on improving the quality of education and achieving education outcomes. Currently, the focus is on improving implementation of education strategies and action plans. As is the case with many other sectors, strategies and laws are in place, but the capacities and resources needed to implement them are deficient. Also, despite the increase in teacher salaries, much remains to be done in the area of teacher training and education, with training seen as a major determinant of improved educational quality.
With regard to the overall capacity of the education system, existing vertical coordination mechanisms between central and local authorities, as well as horizontal coordination at both levels, remain weak. Coordination is suboptimal due to poorly defined responsibilities and accountabilities. Information, data and systems for reporting and monitoring continue to be deficient, especially in addressing pockets of marginalization, low enrolment and drop-out patterns. Government is currently developing a set of indicators designed to detect such marginalization.
In light of the above-noted challenges, the longer-term goal of government is to develop a sustainable education system. In addition to the necessary financial and human resources, such a sustainable system is to be based on sound governance (improved policy making and management capacities), increased cost-effectiveness, with a focus on quality of outcome, and strengthened institutional capacities. A related policy priority is to continue to develop the teaching profession. Combined with major reforms in pre-school education, there will be a greater likelihood that the 2015 targets will also be met.
The government’s policy responses are not just limited to improved targets at the national or aggregate level. As implied in the preceding discussion, the redesign of the supply side of the education system will address the needs of rural, urban and suburban areas, each with their own distinctions. School concentration, setting up of school boards and free bussing are important measures aimed at better access. Other government programmes will focus on the demand and social dynamics of the system to increase enrolment ratios and outcomes. For example, special task forces may be set up consisting of experienced and well respected teachers, psychologists, parents and government representatives. These will work with parents of non-enrolled students, and find ways and means of economic support to poor families and other marginalized groups, such as the Roma.

( 16 )
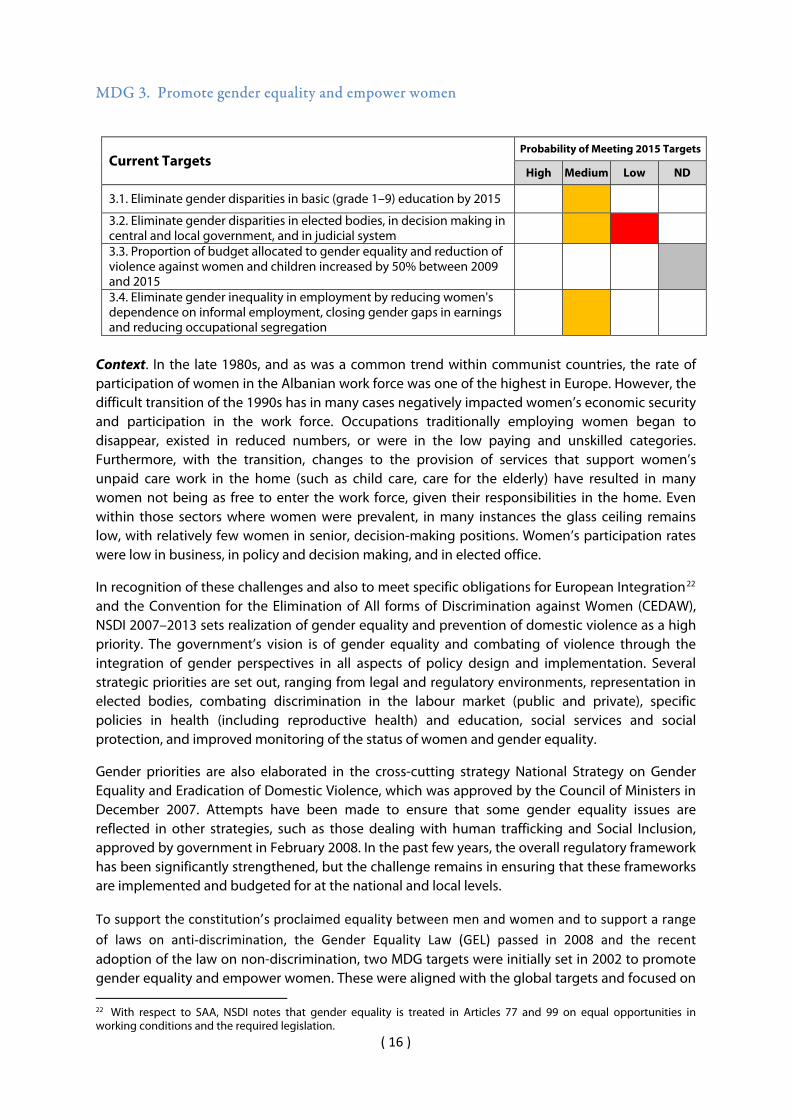
MDG 3. Promote gender equality and empower women
Current Targets Probability of Meeting 2015 Targets
High Medium Low ND
3.1. Eliminate gender disparities in basic (grade 1–9) education by 2015
3.2. Eliminate gender disparities in elected bodies, in decision making in central and local government, and in judicial system
3.3. Proportion of budget allocated to gender equality and reduction of violence against women and children increased by 50% between 2009 and 2015
3.4. Eliminate gender inequality in employment by reducing women's dependence on informal employment, closing gender gaps in earnings and reducing occupational segregation
Context. In the late 1980s, and as was a common trend within communist countries, the rate of participation of women in the Albanian work force was one of the highest in Europe. However, the difficult transition of the 1990s has in many cases negatively impacted women’s economic security and participation in the work force. Occupations traditionally employing women began to disappear, existed in reduced numbers, or were in the low paying and unskilled categories. Furthermore, with the transition, changes to the provision of services that support women’s unpaid care work in the home (such as child care, care for the elderly) have resulted in many women not being as free to enter the work force, given their responsibilities in the home. Even within those sectors where women were prevalent, in many instances the glass ceiling remains low, with relatively few women in senior, decision-making positions. Women’s participation rates were low in business, in policy and decision making, and in elected office.
In recognition of these challenges and also to meet specific obligations for European Integration22 and the Convention for the Elimination of All forms of Discrimination against Women (CEDAW), NSDI 2007–2013 sets realization of gender equality and prevention of domestic violence as a high priority. The government’s vision is of gender equality and combating of violence through the integration of gender perspectives in all aspects of policy design and implementation. Several strategic priorities are set out, ranging from legal and regulatory environments, representation in elected bodies, combating discrimination in the labour market (public and private), specific policies in health (including reproductive health) and education, social services and social protection, and improved monitoring of the status of women and gender equality.
Gender priorities are also elaborated in the cross-cutting strategy National Strategy on Gender Equality and Eradication of Domestic Violence, which was approved by the Council of Ministers in December 2007. Attempts have been made to ensure that some gender equality issues are reflected in other strategies, such as those dealing with human trafficking and Social Inclusion, approved by government in February 2008. In the past few years, the overall regulatory framework has been significantly strengthened, but the challenge remains in ensuring that these frameworks are implemented and budgeted for at the national and local levels.
To support the constitution’s proclaimed equality between men and women and to support a range of laws on anti-discrimination, the Gender Equality Law (GEL) passed in 2008 and the recent adoption of the law on non-discrimination, two MDG targets were initially set in 2002 to promote gender equality and empower women. These were aligned with the global targets and focused on 22 With respect to SAA, NSDI notes that gender equality is treated in Articles 77 and 99 on equal opportunities in working conditions and the required legislation.
( 17 )
elimination of gender disparities in primary and junior high education and of gender disparities in elected bodies and decision-making positions in central and local government. By 2005, it was felt that some of the targets were overly ambitious, such as the percentage of women in non-agricultural paid employment (in fact, targeted to be higher than the EU average). There were also no indicators to track progress on reducing violence against women.23
In 2009, government expanded the number of targets to four as listed above, increased the number of indicators from four to fourteen, and held fast to the ambitious 2015 targets.24 Targets and baselines have as yet to be set for anti-violence and a few other indicators (see Annex 1).
The following presents trends and projections for a few key selected targets.
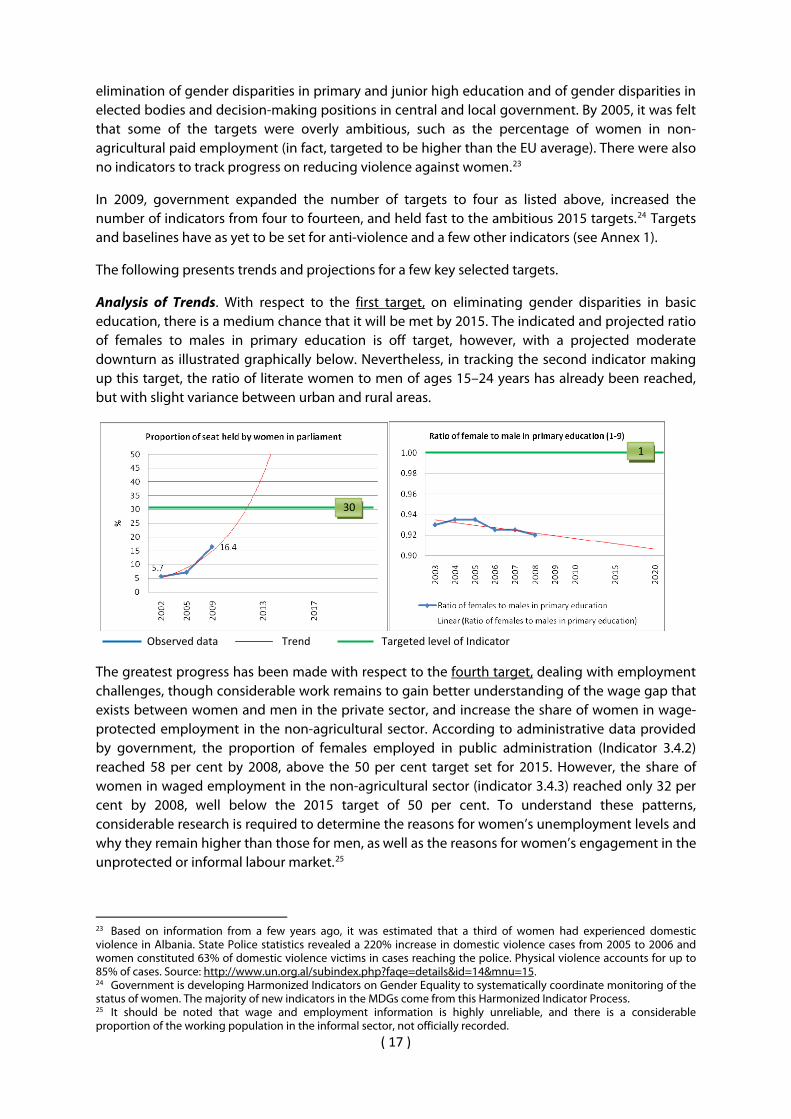
Analysis of Trends. With respect to the first target, on eliminating gender disparities in basic education, there is a medium chance that it will be met by 2015. The indicated and projected ratio of females to males in primary education is off target, however, with a projected moderate downturn as illustrated graphically below. Nevertheless, in tracking the second indicator making up this target, the ratio of literate women to men of ages 15–24 years has already been reached, but with slight variance between urban and rural areas.
Observed data Trend Targeted level of Indicator
30
1
The greatest progress has been made with respect to the fourth target, dealing with employment challenges, though considerable work remains to gain better understanding of the wage gap that exists between women and men in the private sector, and increase the share of women in wage-protected employment in the non-agricultural sector. According to administrative data provided by government, the proportion of females employed in public administration (Indicator 3.4.2) reached 58 per cent by 2008, above the 50 per cent target set for 2015. However, the share of women in waged employment in the non-agricultural sector (indicator 3.4.3) reached only 32 per cent by 2008, well below the 2015 target of 50 per cent. To understand these patterns, considerable research is required to determine the reasons for women’s unemployment levels and why they remain higher than those for men, as well as the reasons for women’s engagement in the unprotected or informal labour market.25
23 Based on information from a few years ago, it was estimated that a third of women had experienced domestic violence in Albania. State Police statistics revealed a 220% increase in domestic violence cases from 2005 to 2006 and women constituted 63% of domestic violence victims in cases reaching the police. Physical violence accounts for up to 85% of cases. Source: http://www.un.org.al/subindex.php?faqe=details&id=14&mnu=15. 24 Government is developing Harmonized Indicators on Gender Equality to systematically coordinate monitoring of the status of women. The majority of new indicators in the MDGs come from this Harmonized Indicator Process. 25 It should be noted that wage and employment information is highly unreliable, and there is a considerable proportion of the working population in the informal sector, not officially recorded.

( 18 )
With respect to the second target, on eliminating gender disparities in elected bodies and other components of public service, significant progress has been made over the past ten years. Progress is expected to continue, in part due to special temporary measures recently adopted pertaining to both appointed and elected positions.26 The 30 per cent quota in GEL reflects international standards to achieve a “critical mass” of women in decision making. At present, despite these advances in the legal frameworks, there is a low to medium probability that it will be achieved by 2015. The figure of 30 per cent could more realistically be met among elected positions as these are currently mandated by the Electoral Code, though this will be a challenge as the formulas in the Code for applying the quota at the national level are problematic. A greater challenge has been in appointed positions as these are not at present being monitored.27 Nevertheless, the proportion of females employed in the civil service at the highest levels of office (Indicator 3.2.4) is currently 43 per cent, not far from the target of 50 per cent.
The proportion of females holding the post of minister or deputy minister (indicator 3.2.2) had by 2008 increased to 14 per cent and 25 per cent, respectively, with the 2015 target set at 30 per cent. On the other hand, the proportion of parliamentary seats held by women is currently well below the target of 30 per cent, but shows a positive trend as illustrated graphically above. While the increase to 16.4 per cent is significant, it is well below the critical mass or what GEL (and even potentially the Electoral Code) had envisaged.
Successes, challenges and policy responses. As described above, the greatest success has been in setting up much of the needed policy, legal and regulatory frameworks, combined with action on some of the key education related targets as discussed under MDG 2. Awareness of the issues has been expanding throughout government and society. Government institutions and mechanisms for planning and reporting on gender equality and the fight against violence on women have been put in place over the past several years.28
While there are no data available, the global financial crisis may have an impact on the achievement of the gender goal in those targets dealing with domestic violence and employment. As noted earlier in this report, there was a concern that a fall-off in trade might adversely affect those industries that employ low-paid and low-skilled workers, especially women (footwear and textiles). These risks remain due to the continuing financial and economic uncertainties in the region, especially in terms of trade with Greece and Italy. Further, due to economic constraints and job losses in Greece in 2010, there may be a considerable return of low-skilled and low paid migrants to primarily the rural areas of Albania in the short and medium term. This could result in families coming under increased stress while still trying to access limited social protection and social services. These very same social services and social protection may feel the impact of the economic crisis due to possible reductions in the national budget.
A third major challenge is continued administrative capacity constraints across government (financial and human resources, skills, data and supporting systems). Insufficient budgets are
26 Namely, the law “on gender equality in society” adopted in 2008 includes a 30% in all appointed positions and within party lists in elections; and the newly adopted Electoral Code in 2008 also includes special temporary measures on local and national party lists, and within the bodies with administer elections. 27 Ministry of Labor, Social Affairs and Equal Opportunities (MOLSAEO) should be carrying out this monitoring, but they cannot change appointments once they have been made. 28 Ministry of Labour, Social Services and Equal Opportunities (MOLSAEO) is the responsible authority for gender equality issues in Albania and oversees the implementation of related legislation, such as the GEL. The Directorate of Equal Opportunity and Family Policies at MOLSAEO has been operational since 2006 and is responsible for policies and programmes pertaining to gender equality and domestic violence issues, including the protection of children’s rights. Other mechanisms include: the National Council for Gender Equality, the Equal Opportunity Commission as a specialised body within the National Council of Labour, the Inter-institutional Working Group of Labour. At the Parliamentary level, gender issues are discussed in the Parliamentary Commission of Health, Labour and Social Services.

( 19 )
allocated to gender and domestic violence issues, with external aid covering much of the work. The planning and reporting mechanisms remain insufficient or, in some cases, absent. Internal and external coordination mechanisms across the many levels of government remain weak—especially between the central and local levels dealing with implementation of legal frameworks—, particularly around the laws on Gender Equality and on eradication of Domestic Violence. Should the government experience budget shortfalls, this may also adversely impact the implementation of gender policies and laws. It is significant to note that a pilot project within the framework of the One UN Programme was recently initiated to provide training on gender budgeting to government officials at the central and local levels.
Future policy responses by government focus on better measuring and targeting women and men’s needs for social protection and employment assistance, on strengthening key coordination mechanisms and harmonized and improved monitoring on gender and on domestic violence, and on improved budgetary allocation to combat domestic violence and provide the needed services and monitoring under the above legal frameworks and National Strategy for Gender Equality and against Domestic Violence (NSGE-DV).
( 21 )
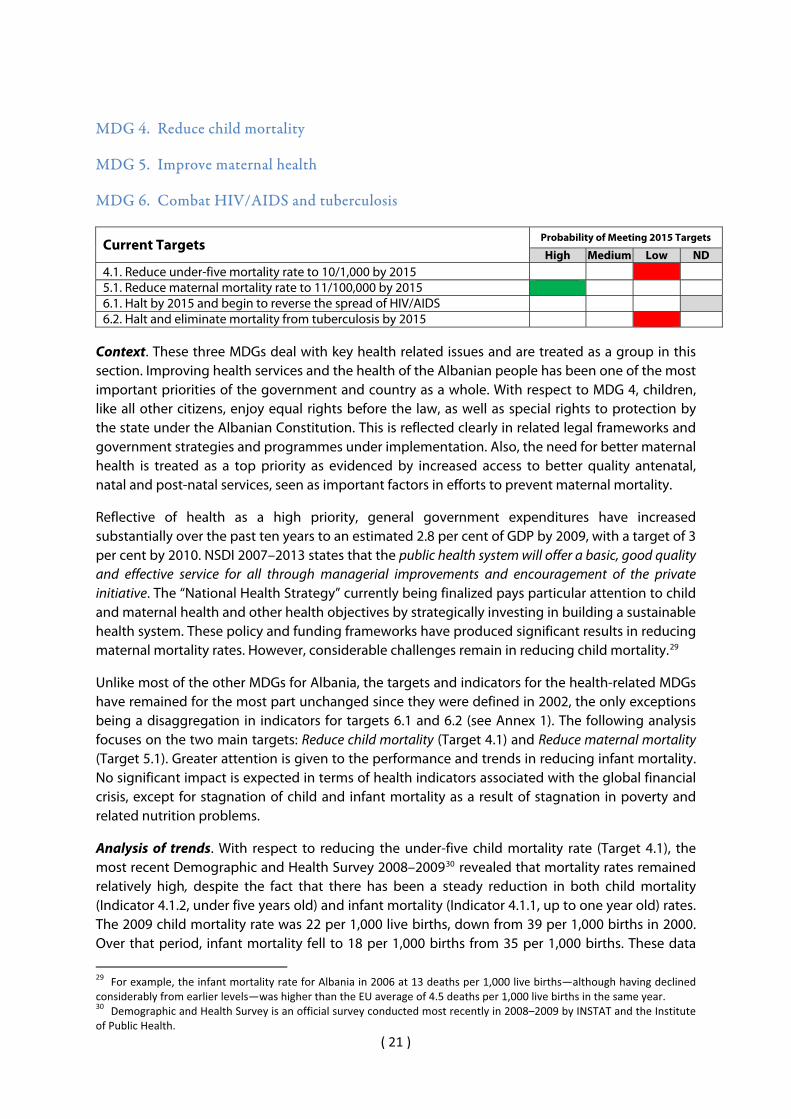
MDG 4. Reduce child mortality
MDG 5. Improve maternal health
MDG 6. Combat HIV/AIDS and tuberculosis
Current Targets Probability of Meeting 2015 Targets
High Medium Low ND
4.1. Reduce under-five mortality rate to 10/1,000 by 2015 5.1. Reduce maternal mortality rate to 11/100,000 by 2015 6.1. Halt by 2015 and begin to reverse the spread of HIV/AIDS 6.2. Halt and eliminate mortality from tuberculosis by 2015
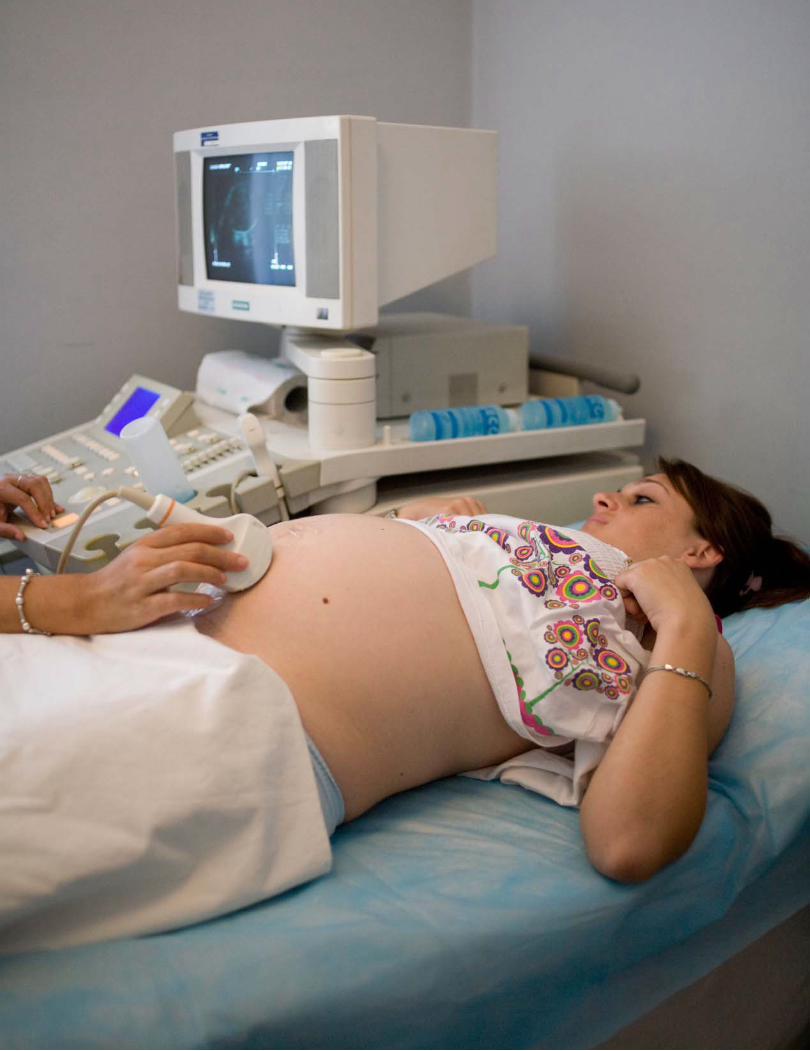
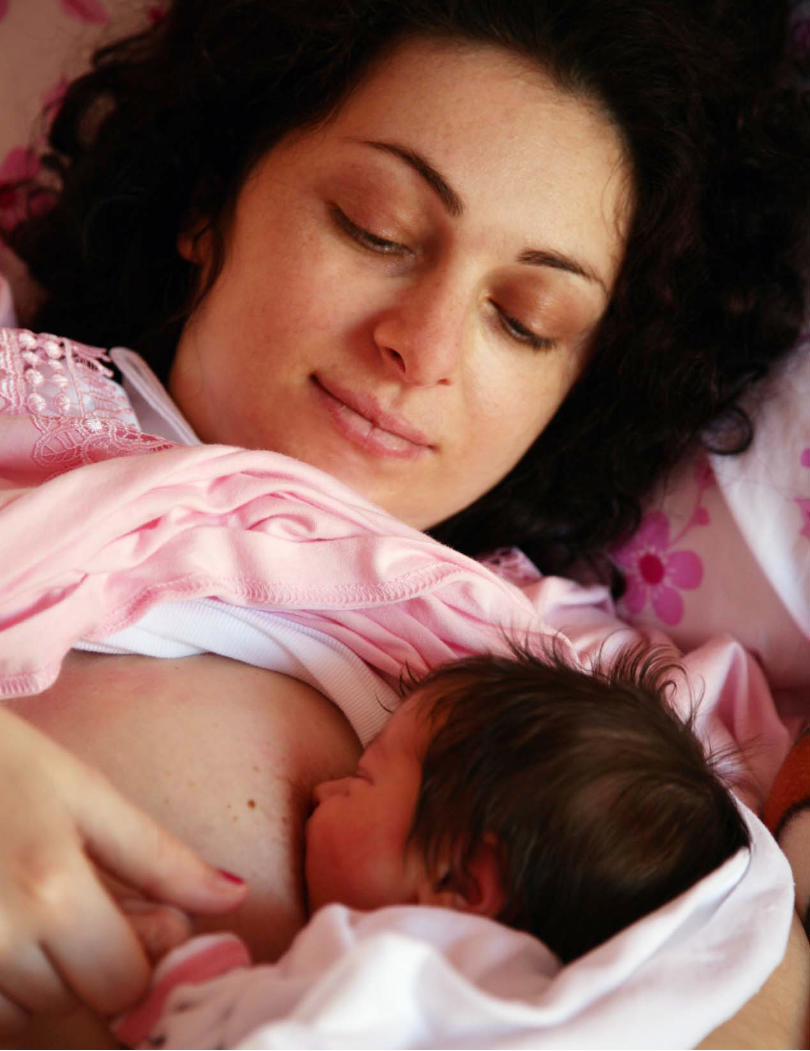
Context. These three MDGs deal with key health related issues and are treated as a group in this section. Improving health services and the health of the Albanian people has been one of the most important priorities of the government and country as a whole. With respect to MDG 4, children, like all other citizens, enjoy equal rights before the law, as well as special rights to protection by the state under the Albanian Constitution. This is reflected clearly in related legal frameworks and government strategies and programmes under implementation. Also, the need for better maternal health is treated as a top priority as evidenced by increased access to better quality antenatal, natal and post-natal services, seen as important factors in efforts to prevent maternal mortality.
Reflective of health as a high priority, general government expenditures have increased substantially over the past ten years to an estimated 2.8 per cent of GDP by 2009, with a target of 3 per cent by 2010. NSDI 2007–2013 states that the public health system will offer a basic, good quality and effective service for all through managerial improvements and encouragement of the private initiative. The “National Health Strategy” currently being finalized pays particular attention to child and maternal health and other health objectives by strategically investing in building a sustainable health system. These policy and funding frameworks have produced significant results in reducing maternal mortality rates. However, considerable challenges remain in reducing child mortality.29
Unlike most of the other MDGs for Albania, the targets and indicators for the health-related MDGs have remained for the most part unchanged since they were defined in 2002, the only exceptions being a disaggregation in indicators for targets 6.1 and 6.2 (see Annex 1). The following analysis focuses on the two main targets: Reduce child mortality (Target 4.1) and Reduce maternal mortality (Target 5.1). Greater attention is given to the performance and trends in reducing infant mortality. No significant impact is expected in terms of health indicators associated with the global financial crisis, except for stagnation of child and infant mortality as a result of stagnation in poverty and related nutrition problems.
Analysis of trends. With respect to reducing the under-five child mortality rate (Target 4.1), the most recent Demographic and Health Survey 2008–200930 revealed that mortality rates remained relatively high, despite the fact that there has been a steady reduction in both child mortality (Indicator 4.1.2, under five years old) and infant mortality (Indicator 4.1.1, up to one year old) rates. The 2009 child mortality rate was 22 per 1,000 live births, down from 39 per 1,000 births in 2000. Over that period, infant mortality fell to 18 per 1,000 births from 35 per 1,000 births. These data
29 For example, the infant mortality rate for Albania in 2006 at 13 deaths per 1,000 live births—although having declined considerably from earlier levels—was higher than the EU average of 4.5 deaths per 1,000 live births in the same year. 30 Demographic and Health Survey is an official survey conducted most recently in 2008–2009 by INSTAT and the Institute of Public Health.

( 22 )
show that most early childhood deaths take place in the first year of life. In fact almost two thirds of infant deaths (11 out of 18) take place in the first month of life.
The survey results reveal important disparities between rural and urban areas and across geographical areas. The mortality rates in rural areas were double those in urban areas for both under-fives and infants. The under-five mortality rate in rural areas was 28 per 1,000 births versus 13 per 1,000 in urban areas. The infant mortality rate was 24 per 1,000 in rural areas versus 12 per 1,000 in urban areas. Infants and children under five years of age in the mountainous regions were found to have had the highest mortality rates, of 38 and 42 per 1,000 births, respectively. Only a few cases of child mortality were recorded in Tirana. The rates of child mortality were found to correlate closely with the level of mother education (higher child mortality for lower education) and wealth (higher mortality for poorer families).
The decline in child mortality rates—sub-optimal as they may be—are due in part to the government’s child immunization programme. The level of fully immunized children in Albania has been very high, about 95 per cent, since 2002, a higher rate than in other countries of the same income level. It is significant to note that a high immunization rate is universal in mountainous areas and in Tirana, but somewhat lower in coastal and central areas (93%). Despite the levels of immunization, if present trends in child mortality continue, it is not likely that the 2015 target will be reached, as graphically illustrated in the chart below. In fact, even without any major negative effects caused by the global financial crisis in terms of a possible economic slowdown in Albania, the infant mortality rate by 2015 could still be 15 per cent, or well above the targeted level of ten per cent.
17.4
11.1
35
18
0
5
10
15
20
25
30
35
40
Rat
e pe
r 100
0 bi
rths
Infant mortality
2000
2001
2002
2003
2004
2005
2006
2007
2008
2009
2010
2015
2020
Ministry of Health Data
Demgraphic an Health Survey Data
Power (Demgraphic an Health Survey Data)
25.9
108
10121416182022242628
2002
2003
2004
2005
2006
2007
2008
2009
2010
2015
2020
Rat
e pe
r 100
000
live
birt
hs
Maternal mortality
1110
Observed data Strong Growth scenario Slow Growth scenario Trend MDG target level
Some research31 has detected certain patterns of economic shocks having an impact on health: economic shocks tend to result in improved health in rich countries, deterioration of health in low income countries, and an ambiguous effect on health for middle income countries.32 As Albania falls in the middle income country category, the impact of the current economic slowdown may be ambiguous or, more likely, indirect. For example, the channels for transmitting the impact of economic shocks on health indicators have been found to be in reduced real income and reduced public spending on health. Reduced private income may lead to cuts in spending on basic food and health care, caregiver employment and deterioration in the nutritional status of pregnant women. Child mortality may increase as a consequence. Whereas, generally speaking, reduced
31 Conceição, P., & Others, 2009, Economic Shocks and Human Development: A Review of Empirical Findings, UNDP. 32 The marginal effect on health of a dollar lost for the poor may affect spending on essential goods like more nutritious food or basic health services, while the loss for the rich will not affect this baseline spending, only perhaps less essential and potentially health harmful goods.
( 24 )
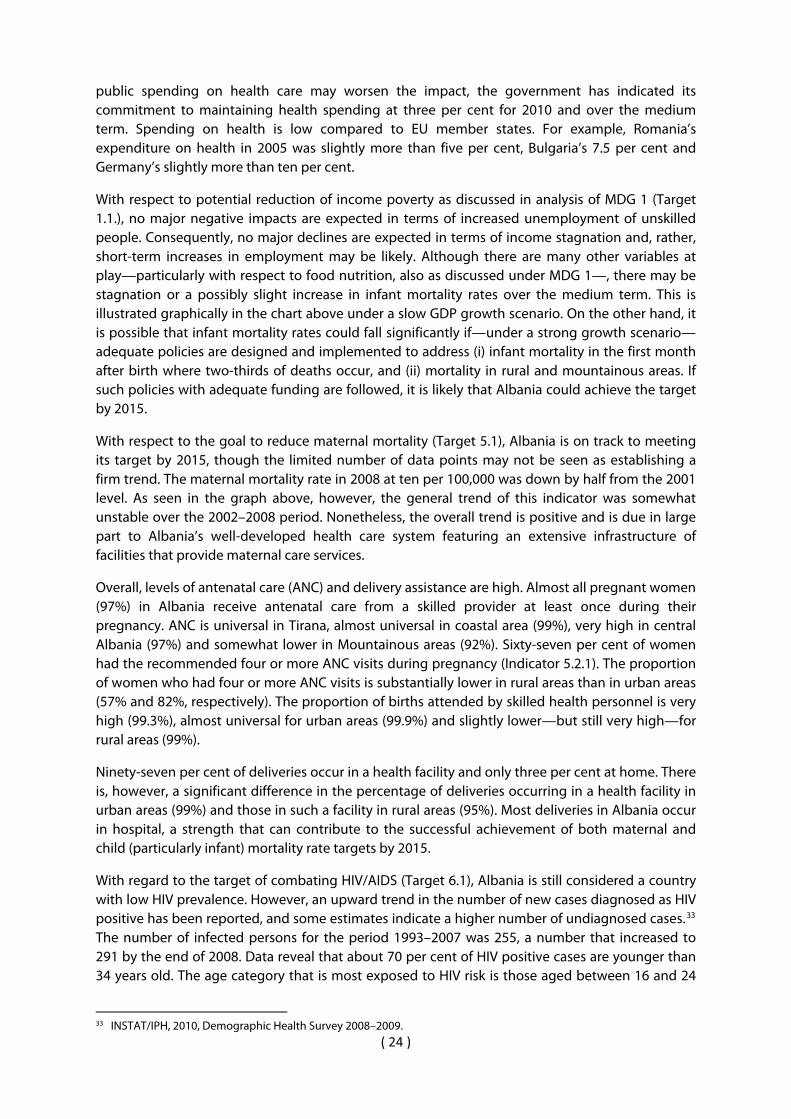
public spending on health care may worsen the impact, the government has indicated its commitment to maintaining health spending at three per cent for 2010 and over the medium term. Spending on health is low compared to EU member states. For example, Romania’s expenditure on health in 2005 was slightly more than five per cent, Bulgaria’s 7.5 per cent and Germany’s slightly more than ten per cent.
With respect to potential reduction of income poverty as discussed in analysis of MDG 1 (Target 1.1.), no major negative impacts are expected in terms of increased unemployment of unskilled people. Consequently, no major declines are expected in terms of income stagnation and, rather, short-term increases in employment may be likely. Although there are many other variables at play—particularly with respect to food nutrition, also as discussed under MDG 1—, there may be stagnation or a possibly slight increase in infant mortality rates over the medium term. This is illustrated graphically in the chart above under a slow GDP growth scenario. On the other hand, it is possible that infant mortality rates could fall significantly if—under a strong growth scenario—adequate policies are designed and implemented to address (i) infant mortality in the first month after birth where two-thirds of deaths occur, and (ii) mortality in rural and mountainous areas. If such policies with adequate funding are followed, it is likely that Albania could achieve the target by 2015.
With respect to the goal to reduce maternal mortality (Target 5.1), Albania is on track to meeting its target by 2015, though the limited number of data points may not be seen as establishing a firm trend. The maternal mortality rate in 2008 at ten per 100,000 was down by half from the 2001 level. As seen in the graph above, however, the general trend of this indicator was somewhat unstable over the 2002–2008 period. Nonetheless, the overall trend is positive and is due in large part to Albania’s well-developed health care system featuring an extensive infrastructure of facilities that provide maternal care services.
Overall, levels of antenatal care (ANC) and delivery assistance are high. Almost all pregnant women (97%) in Albania receive antenatal care from a skilled provider at least once during their pregnancy. ANC is universal in Tirana, almost universal in coastal area (99%), very high in central Albania (97%) and somewhat lower in Mountainous areas (92%). Sixty-seven per cent of women had the recommended four or more ANC visits during pregnancy (Indicator 5.2.1). The proportion of women who had four or more ANC visits is substantially lower in rural areas than in urban areas (57% and 82%, respectively). The proportion of births attended by skilled health personnel is very high (99.3%), almost universal for urban areas (99.9%) and slightly lower—but still very high—for rural areas (99%).
Ninety-seven per cent of deliveries occur in a health facility and only three per cent at home. There is, however, a significant difference in the percentage of deliveries occurring in a health facility in urban areas (99%) and those in such a facility in rural areas (95%). Most deliveries in Albania occur in hospital, a strength that can contribute to the successful achievement of both maternal and child (particularly infant) mortality rate targets by 2015.
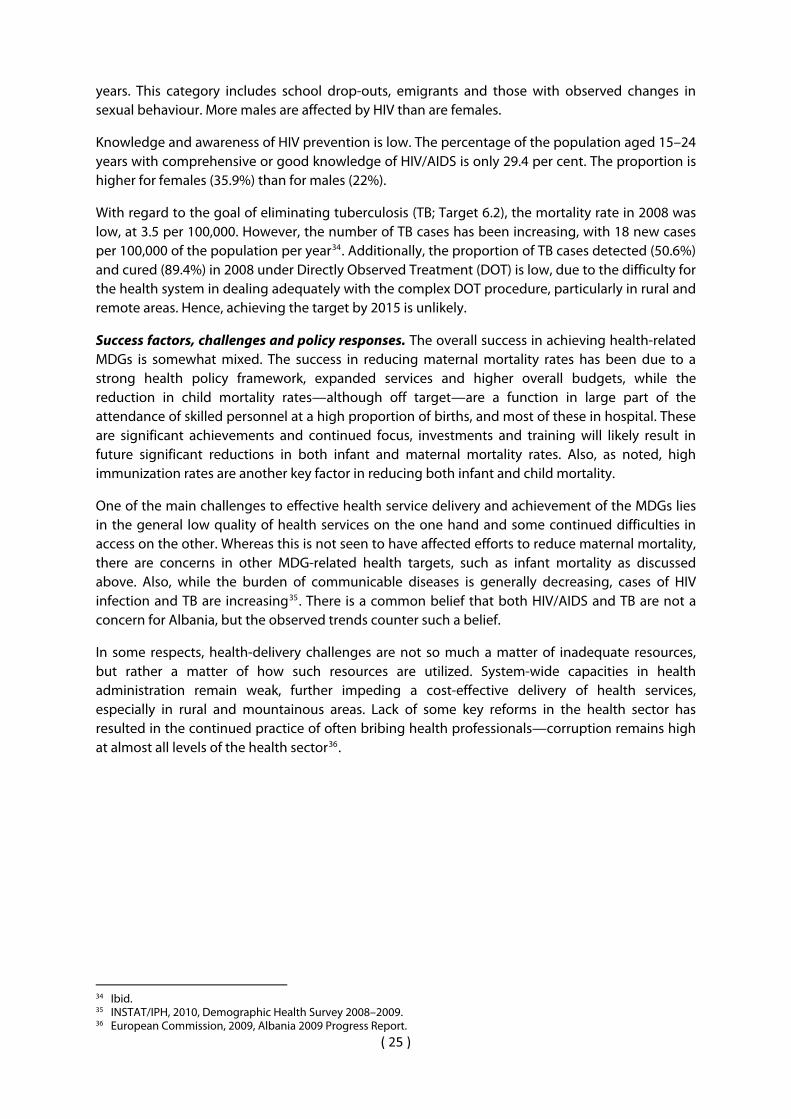
With regard to the target of combating HIV/AIDS (Target 6.1), Albania is still considered a country with low HIV prevalence. However, an upward trend in the number of new cases diagnosed as HIV positive has been reported, and some estimates indicate a higher number of undiagnosed cases.33 The number of infected persons for the period 1993–2007 was 255, a number that increased to 291 by the end of 2008. Data reveal that about 70 per cent of HIV positive cases are younger than 34 years old. The age category that is most exposed to HIV risk is those aged between 16 and 24
33 INSTAT/IPH, 2010, Demographic Health Survey 2008–2009.
( 25 )
years. This category includes school drop-outs, emigrants and those with observed changes in sexual behaviour. More males are affected by HIV than are females.
Knowledge and awareness of HIV prevention is low. The percentage of the population aged 15–24 years with comprehensive or good knowledge of HIV/AIDS is only 29.4 per cent. The proportion is higher for females (35.9%) than for males (22%).
With regard to the goal of eliminating tuberculosis (TB; Target 6.2), the mortality rate in 2008 was low, at 3.5 per 100,000. However, the number of TB cases has been increasing, with 18 new cases per 100,000 of the population per year34. Additionally, the proportion of TB cases detected (50.6%) and cured (89.4%) in 2008 under Directly Observed Treatment (DOT) is low, due to the difficulty for the health system in dealing adequately with the complex DOT procedure, particularly in rural and remote areas. Hence, achieving the target by 2015 is unlikely.
Success factors, challenges and policy responses. The overall success in achieving health-related MDGs is somewhat mixed. The success in reducing maternal mortality rates has been due to a strong health policy framework, expanded services and higher overall budgets, while the reduction in child mortality rates—although off target—are a function in large part of the attendance of skilled personnel at a high proportion of births, and most of these in hospital. These are significant achievements and continued focus, investments and training will likely result in future significant reductions in both infant and maternal mortality rates. Also, as noted, high immunization rates are another key factor in reducing both infant and child mortality.
One of the main challenges to effective health service delivery and achievement of the MDGs lies in the general low quality of health services on the one hand and some continued difficulties in access on the other. Whereas this is not seen to have affected efforts to reduce maternal mortality, there are concerns in other MDG-related health targets, such as infant mortality as discussed above. Also, while the burden of communicable diseases is generally decreasing, cases of HIV infection and TB are increasing35. There is a common belief that both HIV/AIDS and TB are not a concern for Albania, but the observed trends counter such a belief.
In some respects, health-delivery challenges are not so much a matter of inadequate resources, but rather a matter of how such resources are utilized. System-wide capacities in health administration remain weak, further impeding a cost-effective delivery of health services, especially in rural and mountainous areas. Lack of some key reforms in the health sector has resulted in the continued practice of often bribing health professionals—corruption remains high at almost all levels of the health sector36.
34 Ibid. 35 INSTAT/IPH, 2010, Demographic Health Survey 2008–2009. 36 European Commission, 2009, Albania 2009 Progress Report.
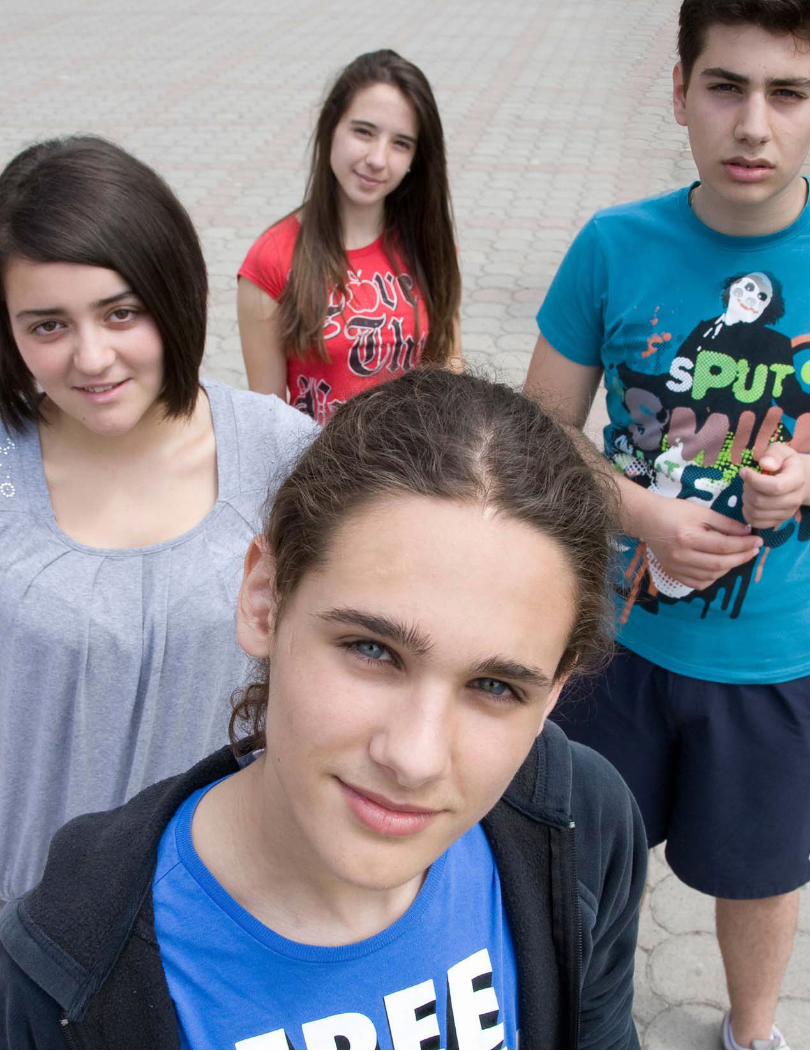

( 27 )
Government recognizes the need to upgrade the quality of services and to improve access to (free of charge) services. It is often the case that people are unable to access health services, which are by law provided free of charge, mainly due to complex procedures and lack of access to required information. Roma in particular face considerable difficulties in accessing health services.
On the funding front, and despite recent increases in budgets allocated to the health sector, overall financial resources remain very limited. Whereas the health sector is a stated government priority in the years to come, limited fiscal space available to government in terms of keeping deficit levels within targeted ranges may place constraints on budgets. This may motivate government to look at ways of improving health administration through further reforms and capacity building.
Government reforms are now focusing more on the whole health system to ensure the longer-term sustainability of cost effective and quality health delivery. The finalization and implementation of the health reform strategy will go a long way towards achieving the long-term targets, and will also help in achieving the medium-term MDGs. The longer-term reform objectives aim at modernizing the broader system through investments in human resources, reforming sector financing and improving health information systems. Major health sector governance priorities include planning for and measuring the performance of health institutions and professionals, incentive systems, better coordination, combating corruption and instituting more transparent and accountable systems of decision making.
The Ministry of Health (MoH) has also developed ambitious action plans37 aimed at meeting child maternal and child health targets. The major components of these plans include improvement of care during pregnancy and post-delivery, improvement of nutrition for both mother and child, ensuring essential health care for every newborn infant, universal child vaccination and prevention and early detection of complications to ensure that all births are safe and assisted by capable health personnel, as well as other related aspects. MoH has prepared an action plan38 aimed at meeting HIV/AIDS targets. However, implementation of this action plan is crucial for reversing current HIV/AIDS trends. Eliminating mortality from TB requires much more—and tailored—efforts.
37 www.moh.gov.al: Action plan for maternal health—targets until 2015; Action plan for child and adolescent health—targets until 2015. 38 www.moh.gov.al: Plan of action on sexually transmitted infections and HIV/AIDS—targets until 2015.

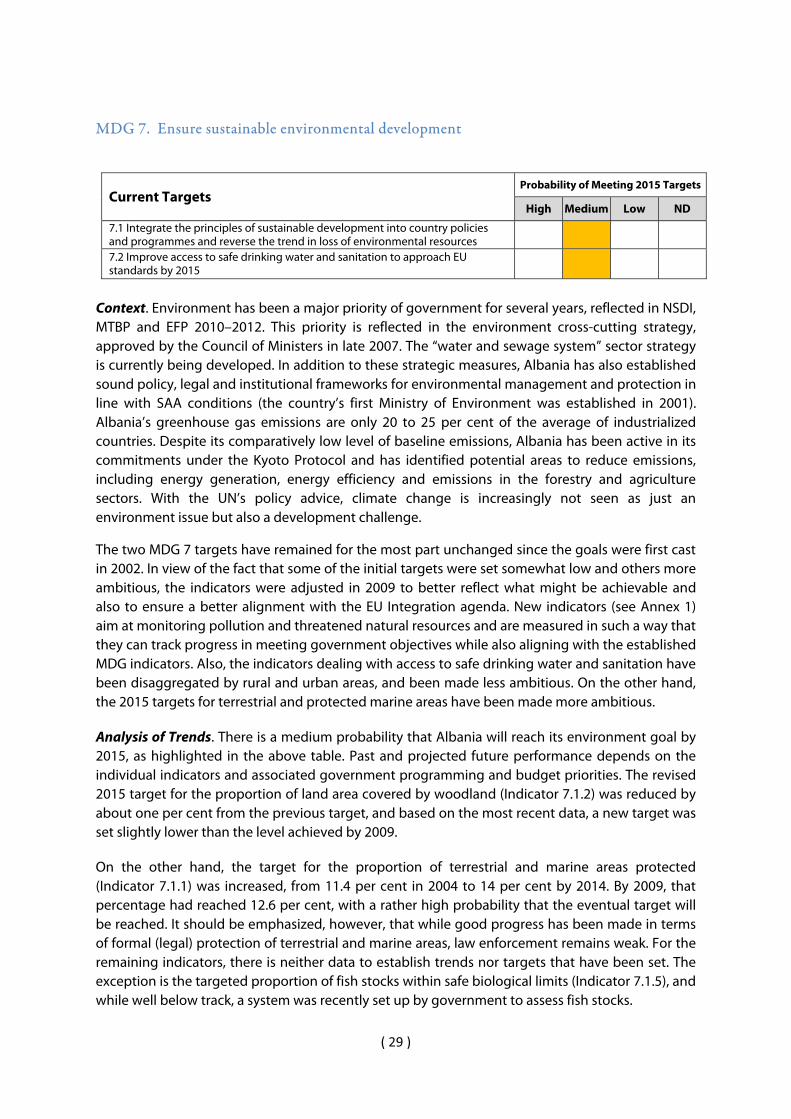
( 29 )
MDG 7. Ensure sustainable environmental development
Current Targets Probability of Meeting 2015 Targets
High Medium Low ND
7.1 Integrate the principles of sustainable development into country policies and programmes and reverse the trend in loss of environmental resources
7.2 Improve access to safe drinking water and sanitation to approach EU standards by 2015
Context. Environment has been a major priority of government for several years, reflected in NSDI, MTBP and EFP 2010–2012. This priority is reflected in the environment cross-cutting strategy, approved by the Council of Ministers in late 2007. The “water and sewage system” sector strategy is currently being developed. In addition to these strategic measures, Albania has also established sound policy, legal and institutional frameworks for environmental management and protection in line with SAA conditions (the country’s first Ministry of Environment was established in 2001). Albania’s greenhouse gas emissions are only 20 to 25 per cent of the average of industrialized countries. Despite its comparatively low level of baseline emissions, Albania has been active in its commitments under the Kyoto Protocol and has identified potential areas to reduce emissions, including energy generation, energy efficiency and emissions in the forestry and agriculture sectors. With the UN’s policy advice, climate change is increasingly not seen as just an environment issue but also a development challenge.
The two MDG 7 targets have remained for the most part unchanged since the goals were first cast in 2002. In view of the fact that some of the initial targets were set somewhat low and others more ambitious, the indicators were adjusted in 2009 to better reflect what might be achievable and also to ensure a better alignment with the EU Integration agenda. New indicators (see Annex 1) aim at monitoring pollution and threatened natural resources and are measured in such a way that they can track progress in meeting government objectives while also aligning with the established MDG indicators. Also, the indicators dealing with access to safe drinking water and sanitation have been disaggregated by rural and urban areas, and been made less ambitious. On the other hand, the 2015 targets for terrestrial and protected marine areas have been made more ambitious.
Analysis of Trends. There is a medium probability that Albania will reach its environment goal by 2015, as highlighted in the above table. Past and projected future performance depends on the individual indicators and associated government programming and budget priorities. The revised 2015 target for the proportion of land area covered by woodland (Indicator 7.1.2) was reduced by about one per cent from the previous target, and based on the most recent data, a new target was set slightly lower than the level achieved by 2009.
On the other hand, the target for the proportion of terrestrial and marine areas protected (Indicator 7.1.1) was increased, from 11.4 per cent in 2004 to 14 per cent by 2014. By 2009, that percentage had reached 12.6 per cent, with a rather high probability that the eventual target will be reached. It should be emphasized, however, that while good progress has been made in terms of formal (legal) protection of terrestrial and marine areas, law enforcement remains weak. For the remaining indicators, there is neither data to establish trends nor targets that have been set. The exception is the targeted proportion of fish stocks within safe biological limits (Indicator 7.1.5), and while well below track, a system was recently set up by government to assess fish stocks.
( 30 )
The percentage of the population declaring that they have access to safe drinking water has increased, from 69 per cent in 2002 to 75 per cent in 2008 and 82.1 per cent in 200939 (88% in rural areas and 74.7% in urban areas). At this rate, however, the national 2015 target of 98 per cent is unlikely to be reached. A mitigating factor not incorporated in the indicator is increasing access to inexpensive bottled water in both urban and rural areas. As previously reported, government had completed the transfer of water supply companies to local government, based on the cross-cutting Decentralization Strategy. Other dimensions of reform are still being developed: e.g. improvement of water supply company management and a price subsidy scheme for the poor to complement water price reform (increase). Also, a project was recently launched that will evaluate the water resources in two of the three major Albanian water basins.
98
Observed data Trend MDG Target level
90
With regard to the second target, which deals with safe drinking water and sanitation, the prospects appear more promising in terms of tracking in the right direction as illustrated in the preceding chart. The proportion of the population having access to sewage and septic systems has increased, from 63.8 per cent in 2002 to 86.3 per cent by 2008. With a strong likelihood of continued domestic and external financing in this area, the target of 90 per cent is likely to be reached by 2015. Successes, challenges and policy responses. As noted above, success has been achieved in terms of setting up the necessary policy and legal frameworks and supporting institutions. However, much remains to be done in terms of full implementation of many of the laws, and this will take considerable time. Hence, development of the needed institutional and human capacities remains the major challenge, along with the basic capacity to implement projects and programmes combined with sustainable financing. This includes the development of the necessary environmental monitoring and reporting systems. Although there has been an increased environmental awareness among Albanian institutions, general government expenditures on environmental protection per se over the period 2008–2010 have been very low.40
The global financial crisis could have a significant impact on achievement of a number of MDG indicators. The major risk is a dampening of internal forecasts for economic growth, which may constrain budgets, or cause government to postpone some of the larger sanitation projects, or re-allocate scarce domestic financial resources to the higher priority areas of health and education, as discussed under the respective MDG sections of this report, or any or all of these. However, water
39 INSTAT and IPH, 2010, Demographic and Health Survey 2008–2009. 40 EFP 2010 records no expenditures over this period (Table 3, page 98). An internal expenditure summary report of major function produced by the Ministry of Finance records expenditures to the amount of €326,000 in 2009 (a small fraction of the total of€380 million for the year) , but still up from €88,000 in 2007.
( 31 )
and sanitation will remain a top priority of government with no anticipated budget cuts.41 Government will continue to depend on external assistance in the form of grants and loans to finance major environmental initiatives associated with sewage treatment plants, including supplementary funding from the World Bank.
41 For example, some reductions have been made to the 2010 forestry budget.


( 33 )
MDG 8. Develop a global partnership for development
Current Targets Probability of Meeting 2015 Targets
High Medium Low ND
8.1 Ensure partnership with donor community in order to increase aid effectiveness
8.2 Improve access to trade markets of developed countries so that foreign debt is managed better and for a longer period
8.3 Improve access to ICT to the level of EU new member countries
Context. Albania has received a relatively stable but gradually declining flow of external assistance over the past several years. The relative importance of such assistance as a percentage of GDP, however, declined more substantially as the Albanian economy has grown, moved up the middle-income ladder, become less dependent on aid from bilateral sources and progressed toward EU integration. By 2008, the proportion of external assistance of GDP declined to 3.65 per cent (about €100 per capita) from a high of 12.7 per cent in 1999.42 As Albania pursues its strategy for European Integration, greater emphasis will be given to management of EU funding, such as the Instrument for Pre-Accession (IPA), and much less to traditional bilateral and other donor sources, as these are expected to gradually diminish and withdraw over time. Despite the relative decline in aid flows, the external partnership and aid management functions have evolved significantly over the years, primarily in response to donor demands and the government’s own internal demands for improved strategic management of aid. In 2002, only one target was set to track Albania’s progress in achieving national and global partnerships for development, namely to “ensure better harmonized and more effective development partnership with the donor community”. Several significant initiatives have been undertaken by government over the past four years to support the achievement of this goal, including the following:
� In 2003, a Donor Technical Secretariat (DTS) was set up to facilitate donor–donor and donor–government dialogue and coordination.
� In 2005, the Department of Strategy and Donor Coordination was instituted as the government’s newly elected reform-oriented prime central unit to secure ownership and coordination of external assistance and to ensure linkages to government’s main policy, planning and financial processes.
� In 2005 (March), the Paris Declaration was signed by the government and the majority of international organizations that comprised the donor community in Albania. A joint Harmonization Action Plan was developed and endorsed at the government–donor round table in late 2009.43
42 DSDC, External Assistance in Albania: Progress Report 2008, October, 2009, page 8. See also Albania National Report on Progress Toward Achieving the Millennium Development Goals, Government of Albania, 2004, page 59. 43 It is worthwhile to note that a Memorandum of Understanding between the government and a number of European donors on the Division of Labour was signed in early 2010.

( 34 )
� At about the same time, government proceeded with the launching of the Integrated Planning System (IPS) to streamline policy making, programming, budgeting, monitoring, evaluation and aid coordination tailored to its organizational structures and human resource capacities.44
� As part of the overall NSDI and sector strategy processes, Sector Working Group mechanisms were set up to support sectoral policy coordination and monitoring across government, as well as between government and donors. However, not all of the groups have met regularly.
� Government–donor round tables have been an on-going mechanism of Albania’s “Donor Co-ordination Architecture”, where government and heads of missions address strategic development issues.
� Albania’s One UN Programme was signed on 24 October 2007. Its objective is to better support Albania in achieving its goals as expressed in the SAA, the national priorities expressed in NSDI and IPS, and the programmes of international partners, and harmonization and aid effectiveness in the context of the Paris Declaration. Government and donors also see One UN initiative as significantly contributing to increased alignment of external assistance with national priorities but also increased leadership of government in guiding external assistance.
With relatively low progress in the single target that was set in 2002, the goal was redefined and made more ambitious in 2008, with new targets and indicators (see Annex 1). The main changes were: (1) in the first target, to emphasize the partnership between the government and donor community by incorporating three of the Paris Declaration monitoring indicators; (2) in the second target to ensure and measure the managerial sustainability of official development assistance as related to trade activity; and (3) in the third target, to transfer more ambitious ICT-related indicators from MDG 1 to measure Albania’s aspirations to EU integration in terms of attaining EU standards of access to ICT. Analysis of Trends. Albania, in cooperation with its external partners, has made good progress over the past ten years in developing its external relations and systems for managing development partnerships. Based on current trends, it is moderately likely that Albania will meet its targets on aid effectiveness, as noted in the table above. Due to the unavailability of data, it is not yet possible to measure progress in achieving the second target. The third target is expected to be reached well before 2015, should present trends hold out. A brief elaboration follows.
With respect to the first target, on ensuring partnerships with the donor community to increase aid effectiveness, the first three indicators relate more or less directly to those of the Paris Declaration (see Annex 2). These appear to be, on average, moderately on track, based on the most recent Survey on the Paris Declaration. Aid reported on budget (Indicator 8.1.1, Paris Indicator 3) increased from 32 per cent in 2005 to 73 per cent in 2007, well on the way to meeting the 85 per cent MDG target by 2015. On the other hand, the predictability of aid (Indicator 8.1.2, Paris Indicator 7) declined though a new monitoring cycle to be launched in 2010 is expected to help reverse this trend. The use of common procedures and a programme-based approach (PBA)
44 IPS is founded on two core processes that apply to all government organizations and activities: NSDI, which establishes the government’s medium to longer term goals and strategies for all sectors based on a national vision; and the Medium-Term Budgeting Programme (MTBP), which requires each ministry to develop a 3-year plan to deliver programme outputs to achieve its policy objectives and goals within the ministry’s expenditure ceiling as set out in the government’s fiscal plan. In addition, four core processes that affect a wide range of government organizations and activities and are reflected in NSDI and MTBP include European Integration, Government Programme, Public Investment and External Assistance.

( 35 )
(Indicator 8.1.3, Paris Indicator 9) has seen a moderate improvement and, with determined efforts, could reach the target of 66 per cent by 2015.45
DSDC and ministries continue to work on systems and procedures for the measurement of outcome indicators for the sector and cross-cutting strategies (Indicator 8.1.4) and the Government plans to have the systems in place and functional by 2015. For 2010, as part of a new results-based monitoring system, DSDC is evaluating a select number of strategies and quantitatively measuring some indicators with a view to producing an NSDI monitoring report in 2011. As no data, targets and benchmarks have been set for Indicator 8.1.5, nothing can be reported.
With respect to the third target on increasing access to ICTs, Albania has witnessed strong growth in overall availability, including basic telephony services (ICTs are also discussed as a key target under MDG 9). Such growth is a function in part to greater ministerial level attention to ICT-related policies. The first indicator (8.3.1) aims for a fixed telephony penetration rate of 20 per cent by 2015. By the end of 2009, the rate was reported to be 11.3 per cent (source AKEP). Mobile and cellular telephony penetration on the other hand (Indicator 8.3.2) has already achieved the 2015 target. By the end of 2009, the rate was 129 per cent (source AKEP). On a similar path, Internet user penetration (Indicator 8.3.3) by the end of 2009 was 31.7 per cent, and is expected to reach the target of 35 per cent well ahead of 2015.46
With the increasing shift to wireless services and other broadband-based services in Albania (as elsewhere in the world), there is likely to be less emphasis on establishing fixed telephone lines, and over time this indicator may be replaced with a more technologically relevant one. With respect to broad-band, the government recognizes that there must be greater access to technology and reliable broadband services through the development of a Broadband Network Infrastructure.47 This will help Albania transform to an information society.
Successes, challenges and policy responses. The successful achievement of the third ICT-related target ahead of schedule is a function of government leadership, structural reforms and resources. This is discussed in more detail in the next section dealing with the ICT-related targets of MDG 9. However, it is only moderately likely that Albania will achieve its directly related global partnerships target 8.1 by 2015. As noted above, considerable progress has been made in setting up the policy, legal and institutional frameworks associated with the partnerships goal.
The global financial crisis does not appear to have had a major impact on Albania’s aid flows or its ability to achieve MDG 8. The major risk is external in terms of the potential for sluggish growth in developed economies that may negatively affect their fiscal capacities to fulfil international aid commitments. Another risk is internal in terms of achieving less-than-expected economic growth, which may constrain budgets and government investments in partnership management related capacity development. Since the bulk of assistance over the period 2002–2008 has been in the
45 One example of an existing PBA in Albania is the Sector Wide Approach (SWAP) which has been under implementation within the education sector since June 2006 funded by World Bank and two other donors. This SWAP (the only one thus far in place in Albania) is established within the framework of the Education Excellence and Equity Project, the instrument for application of the national sector strategy (see also Albania Council of Ministers, Harmonization Action Plan for Albania, 13 November 2009, page 30). 46 Information as provided by the NAIS from different sources. See also: http://www.itu.int/ITU-D/icteye/DisplayCountry.aspx?code=ALB 47 The main problems with the current ICT infrastructure sector in Albania consist of: low penetration of fixed lines; low Internet penetration; low number of PCs in families; costly mobile phone, Internet access and Internet utilization services; low awareness of the use and benefits of ICT; digital gap compared to other developed or developing countries plus a digital gap between urban and rural areas; and lack of state policies and subsidies.
( 36 )
form of loans, with most commitments yet to be disbursed, there is a risk of this adding to Albania’s debt burden.
As a middle income country Albania is witnessing the exit of several key bi-lateral donors even though the development agenda is not finished, especially with respect to regional disparities and social inclusion. This is, however, offset by increasing levels of assistance from the EU, which so far exceeds the level of assistance provided by bilateral donors. Other challenges relate to the achievement of particularly Target 8.2 on improving access to trade markets of developed countries, and include the following:
� Low absorption capacities for external assistance continue to be a main issue, as reported six years ago, in the 2004 MDG progress report (Ibid, p. 56). As noted elsewhere in this report, the question is also not one of insufficient resources, but rather of how they are utilized. This applies not only to the various ministries in absorbing aid and implementing projects and programmes, but also of insufficient capacity of central organizations to coordinate at the various levels.
� The unfinished business of developing and implementing the supporting IPS and External Assistance Information Systems (IPSIS and EAMIS). Detailed specifications and plans for these systems were developed in early 2007, and their funding and development was envisaged in a joint government, World Bank IPS Trust Fund project, which has been extended to 2011.
� In light of continuing external financial and economic risks, government will make better use of external assistance to help eliminate trade and other economic barriers, and attract foreign investments in support of sustainable economic and social development.
� The issue of consistency between the MDG 8 and Paris Declaration indicators will be given further attention. NSDI Progress Report 2006–2007 argued that government may shift from the MDG 8 to the Paris indicators.48
48 DSDC, National Strategy for Development and Integration Progress Report 2006–2007, December, 2008, page 92.

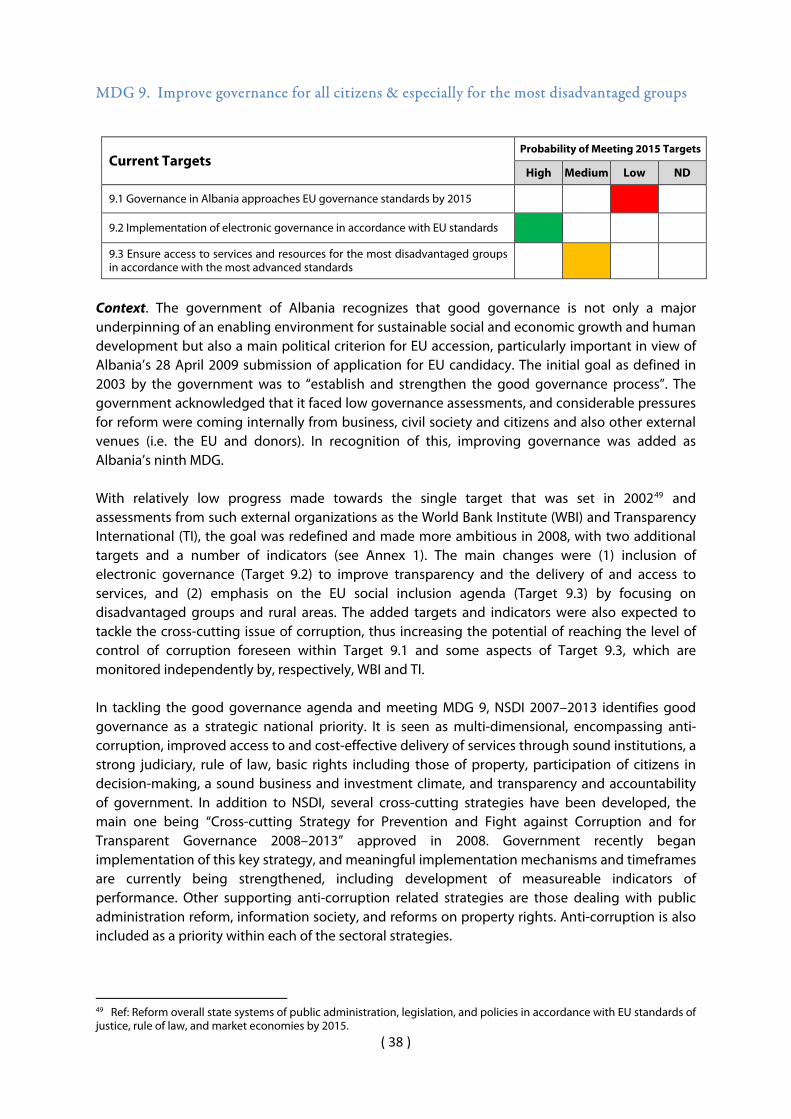
( 38 )
MDG 9. Improve governance for all citizens & especially for the most disadvantaged groups
Current Targets Probability of Meeting 2015 Targets
High Medium Low ND
9.1 Governance in Albania approaches EU governance standards by 2015
9.2 Implementation of electronic governance in accordance with EU standards
9.3 Ensure access to services and resources for the most disadvantaged groups in accordance with the most advanced standards
Context. The government of Albania recognizes that good governance is not only a major underpinning of an enabling environment for sustainable social and economic growth and human development but also a main political criterion for EU accession, particularly important in view of Albania’s 28 April 2009 submission of application for EU candidacy. The initial goal as defined in 2003 by the government was to “establish and strengthen the good governance process”. The government acknowledged that it faced low governance assessments, and considerable pressures for reform were coming internally from business, civil society and citizens and also other external venues (i.e. the EU and donors). In recognition of this, improving governance was added as Albania’s ninth MDG. With relatively low progress made towards the single target that was set in 200249 and assessments from such external organizations as the World Bank Institute (WBI) and Transparency International (TI), the goal was redefined and made more ambitious in 2008, with two additional targets and a number of indicators (see Annex 1). The main changes were (1) inclusion of electronic governance (Target 9.2) to improve transparency and the delivery of and access to services, and (2) emphasis on the EU social inclusion agenda (Target 9.3) by focusing on disadvantaged groups and rural areas. The added targets and indicators were also expected to tackle the cross-cutting issue of corruption, thus increasing the potential of reaching the level of control of corruption foreseen within Target 9.1 and some aspects of Target 9.3, which are monitored independently by, respectively, WBI and TI.
In tackling the good governance agenda and meeting MDG 9, NSDI 2007–2013 identifies good governance as a strategic national priority. It is seen as multi-dimensional, encompassing anti-corruption, improved access to and cost-effective delivery of services through sound institutions, a strong judiciary, rule of law, basic rights including those of property, participation of citizens in decision-making, a sound business and investment climate, and transparency and accountability of government. In addition to NSDI, several cross-cutting strategies have been developed, the main one being “Cross-cutting Strategy for Prevention and Fight against Corruption and for Transparent Governance 2008–2013” approved in 2008. Government recently began implementation of this key strategy, and meaningful implementation mechanisms and timeframes are currently being strengthened, including development of measureable indicators of performance. Other supporting anti-corruption related strategies are those dealing with public administration reform, information society, and reforms on property rights. Anti-corruption is also included as a priority within each of the sectoral strategies.
49 Ref: Reform overall state systems of public administration, legislation, and policies in accordance with EU standards of justice, rule of law, and market economies by 2015.
( 39 )
The global financial crisis does not appear to have had a major impact one way or the other on Albania’s ability to achieve MDG 9. The major risk is seen as limited fiscal space in light of government spending priorities on poverty reduction, health, education and other key sectors. On the other hand, the potential for corruption in differing forms may increase should the economy not grow at the rates forecast by government. The consequence could potentially be expenditure reductions to maintain budget deficit levels within established limits. Due to lack of basic data or inability to disaggregate, a few of the MDG governance indicators cannot be measured or can only be measured at an aggregate level. This includes the various measures on perceived corruption in sectors such as health and utilities (Indicators 9.3.1 through 9.3.4). Other indicators do not have baselines against which progress can be measured from 2002. Analysis of Trends. Based on present trends, it is projected that Albania will have a mixed performance in achieving MDG 9 by 2015. Similar to the ICT-related achievements in MDG 8, the greatest success has been in achievement—well ahead of 2015—of the second MDG 9 target dealing with e-governance. Over the past two years, Albania has witnessed tremendous growth in the availability of e-services across most basic services (see Annex 1, Indicator 9.2.1). Further, about 20 per cent of primarily Government-to-Business services are now offered at interactive levels (3rd and 4th). With respect to the UN e-participation 2010 index (Indicator 9.2.2), Albania improved by 82.2 per cent from the 2008 level, one of the highest rates of improvement in the region.50 However, in terms of overall e-government development as measured in a recent UN global survey of 183 countries, Albania ranked 85th in 2010, up marginally from 86th in 2008, and was lowest of those countries surveyed in Southern Europe. Similarly, in terms of the survey’s telecommunications infrastructure index and its components, Albania ranked 98th out of 190 countries covered.51
With respect to the very important Target 9.1 on improving governance to meet EU standards there has been a noticeable but minor improvement in the Corruption Perception Index (CPI), from a low of 2.5 in 2002 to 3.2 in 2009 (with a minor drop from 3.4 in 2008). With the exception of Indicator 9.1.2 dealing with political stability, which has shown moderate improvement, the other five indicators making up this target show either very marginal improvements or a general flattening over the past few years (see Annex 3). It is unlikely that Albania will achieve EU governance standards by 2015 if current trends continue.52
Achieving targeted levels in the rule of law (Indicator 9.1.5) and the control of corruption (Indicator 9.1.6) appear to be particularly challenging, especially in the areas dealing with property rights, health care and the handling of alleged corruption cases.53 As recently reported by government, proper functioning of rule of law “… requires the establishment of conditions and mechanisms of de-partisanship and de-politicization of central administration bodies to ensure efficient and full enforcement of the Constitution and laws. To achieve this goal, measures must be taken to encourage active participation of citizens in the decision-making process, and accountability of politicians in Albania’s democratization and integration process into the EU”. 54
50 Source: Institute for Electronic Participation (INePA), CEE region countries ranking according to the UN e-participation 2010 index measurement, Ljubljana, 9 April 2010. 51 UN-DESA, United Nations E-Government Survey 2010: leveraging e-Government at a time of financial and economic crisis, 2010, pages 73 and 119 respectively. 52 However, it is important to note that according to the Millennium Challenge Corporation (MCC), Albania had for 2010 received a mark of 0.09 or 53% towards the control of corruption. This result brings Albania nearer to the “Compact” Programme which is the highest level of programme that MCC provides. Source: http://www.mcc.gov. 53 As reported in the recent “Albania 2009 Progress report”, European Commission, Staff Progress Report, 14 October 2009, pages 11–12. 54 Government of Albania, “NSDI Progress Report 2008”, November 2009, page 16.
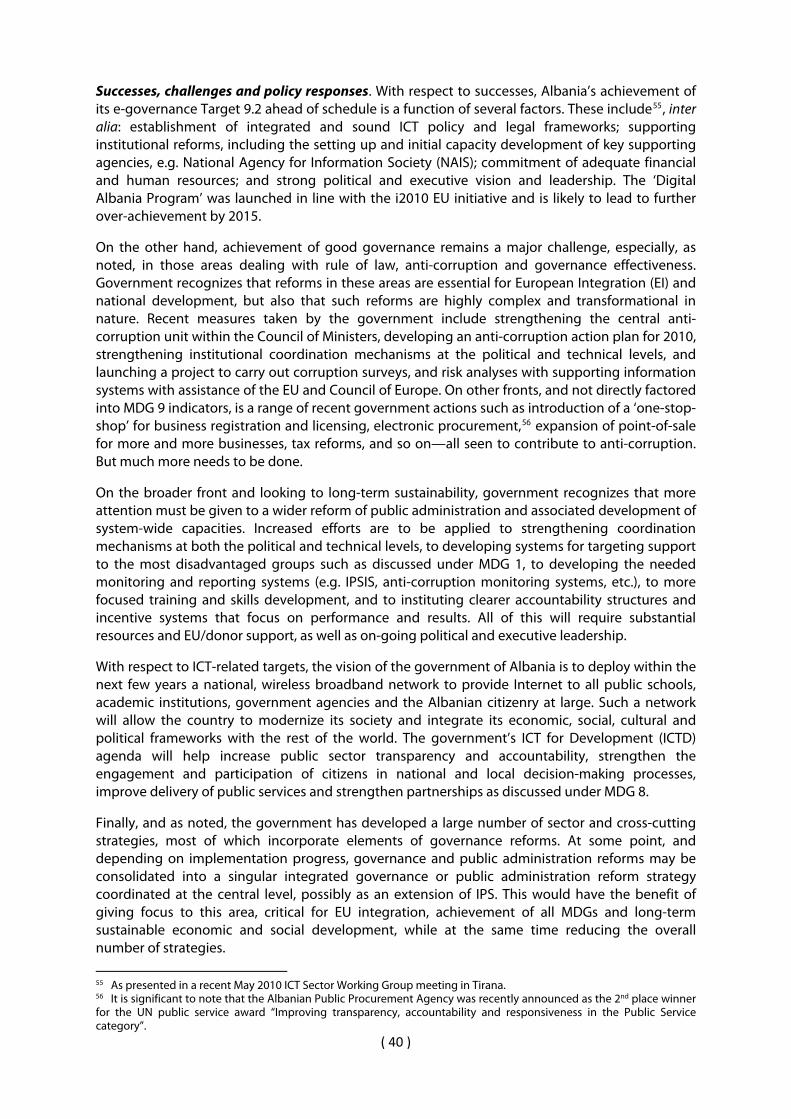
( 40 )
Successes, challenges and policy responses. With respect to successes, Albania’s achievement of its e-governance Target 9.2 ahead of schedule is a function of several factors. These include55, inter alia: establishment of integrated and sound ICT policy and legal frameworks; supporting institutional reforms, including the setting up and initial capacity development of key supporting agencies, e.g. National Agency for Information Society (NAIS); commitment of adequate financial and human resources; and strong political and executive vision and leadership. The ‘Digital Albania Program’ was launched in line with the i2010 EU initiative and is likely to lead to further over-achievement by 2015.
On the other hand, achievement of good governance remains a major challenge, especially, as noted, in those areas dealing with rule of law, anti-corruption and governance effectiveness. Government recognizes that reforms in these areas are essential for European Integration (EI) and national development, but also that such reforms are highly complex and transformational in nature. Recent measures taken by the government include strengthening the central anti-corruption unit within the Council of Ministers, developing an anti-corruption action plan for 2010, strengthening institutional coordination mechanisms at the political and technical levels, and launching a project to carry out corruption surveys, and risk analyses with supporting information systems with assistance of the EU and Council of Europe. On other fronts, and not directly factored into MDG 9 indicators, is a range of recent government actions such as introduction of a ‘one-stop-shop’ for business registration and licensing, electronic procurement,56 expansion of point-of-sale for more and more businesses, tax reforms, and so on—all seen to contribute to anti-corruption. But much more needs to be done.
On the broader front and looking to long-term sustainability, government recognizes that more attention must be given to a wider reform of public administration and associated development of system-wide capacities. Increased efforts are to be applied to strengthening coordination mechanisms at both the political and technical levels, to developing systems for targeting support to the most disadvantaged groups such as discussed under MDG 1, to developing the needed monitoring and reporting systems (e.g. IPSIS, anti-corruption monitoring systems, etc.), to more focused training and skills development, and to instituting clearer accountability structures and incentive systems that focus on performance and results. All of this will require substantial resources and EU/donor support, as well as on-going political and executive leadership.
With respect to ICT-related targets, the vision of the government of Albania is to deploy within the next few years a national, wireless broadband network to provide Internet to all public schools, academic institutions, government agencies and the Albanian citizenry at large. Such a network will allow the country to modernize its society and integrate its economic, social, cultural and political frameworks with the rest of the world. The government’s ICT for Development (ICTD) agenda will help increase public sector transparency and accountability, strengthen the engagement and participation of citizens in national and local decision-making processes, improve delivery of public services and strengthen partnerships as discussed under MDG 8.
Finally, and as noted, the government has developed a large number of sector and cross-cutting strategies, most of which incorporate elements of governance reforms. At some point, and depending on implementation progress, governance and public administration reforms may be consolidated into a singular integrated governance or public administration reform strategy coordinated at the central level, possibly as an extension of IPS. This would have the benefit of giving focus to this area, critical for EU integration, achievement of all MDGs and long-term sustainable economic and social development, while at the same time reducing the overall number of strategies.
55 As presented in a recent May 2010 ICT Sector Working Group meeting in Tirana. 56 It is significant to note that the Albanian Public Procurement Agency was recently announced as the 2nd place winner for the UN public service award “Improving transparency, accountability and responsiveness in the Public Service category”.

( 41 )
MDG PERFORMANCE—STATUS AT A GLANCE
MDG GOAL AND TARGETS Probability of Meeting 2015 Targets
High Medium Low ND
1. Eradicate extreme poverty and reduce the risk of social exclusion
1.1. Eradicate extreme poverty and reduce 3-fold absolute poverty between 2002 and 2015
1.2. Reduce unemployment rate toward EU employment rate, between 2002 and 2015
1.3. Improve income distribution so that the Albanian distribution model approaches the EU model between 2008 and 2015
2. Achieve high quality basic universal education
2.1. Ensure universal enrolment of basic education (1–9 yrs) by 2015 � � �
2.2. Improve education quality to approach OECD countries level
2.3. Increase spending for basic education to the level of new EU member states
3. Promote gender equality and empower women
3.1. Eliminate gender disparities in basic (grade 1 to 9) education by 2015
3.2. Eliminate gender disparities in elected bodies, in decision making in central and local government, and in judicial system
3.3. Proportion of budget allocated to gender equality and reduction violence against women and children increased by 50% between 2009 and 2015
3.4. Eliminate gender inequality in employment by reducing women's dependence on informal employment, closing gender gaps in earnings and reducing occupational segregation
4. Reduce child mortality
4.1. Reduce under-five mortality rate to 10 per 1,000 by 2015
5. Improve maternal health
5.1. Reduce maternal mortality rate 11 per 100,000 by 2015
6. Combat HIV/AIDS and Tuberculosis
6.1. Halt by 2015 and begin to reverse the spread of HIV/AIDS
6.2. Halt and eliminate mortality from tuberculosis, by 2015
7. Ensure sustainable environmental development
7.1 Integrate the principles of sustainable development into country policies and programmes and reverse the trend of loss of environmental resources
( 42 )
MDG GOAL AND TARGETS Probability of Meeting 2015 Targets
High Medium Low ND
7.2 Improve access to safe drinking water and sanitation to approach EU standards, by 2015
8. Develop a global partnership for development
8.1 Ensure partnership with donor community in order to increase aid effectiveness
8.2 Improve access to trade markets of developed countries so that foreign debt is managed better and for a longer period
8.3 Improve access to ICT to the level of EU new member countries
9. Improve governance for all citizens & especially for the most disadvantaged groups
9.1 Governance in Albania approaches EU governance standards by 2015
9.2 Implementation of electronic governance in accordance with EU standards
9.3 Ensure access to services and resources for the most disadvantaged groups in accordance with the most advanced standards

A
NN
EX 1
. ALB
AN
IA M
DG
S—RE
VIS
ED T
ARG
ETS
AN
D IN
DIC
ATO
RS
MD
G 1
: ER
AD
ICA
TE E
XTR
EME
POVE
RTY
AN
D R
EDU
CE
THE
RIS
K O
F SO
CIA
L EX
CLU
SIO
N
Revis
ed ta
rget
Re
vised
indi
cato
r
Source and periodicity
Source of data or Inst. Resp.
Unit
2002
2003
2004
2005
2006
2007
2008
2009
Targetedindicator 2015
Institutional responsibility
1.1. E
radic
ate
extre
me po
verty
an
d red
uce 3
-fold
abso
lute p
over
ty be
twee
n200
2 and
20
15
1.1.1.
Abs
olute
pove
rty he
adco
unt r
ate (p
erce
ntage
of po
pulat
ion be
low
the na
tiona
l pov
erty
line)
Tota
l
LSMS, Every three years, HBS
INSTAT
%
25.4
18.5
12.4
8
MLSAEO
F%
12
.98
M%
11.9
8
1.1.2.
Extr
eme p
over
ty he
adco
unt r
ate
Tota
l%
4.
73.
51.
20
F%
1.
30
M%
10
1.1.3.
Pov
erty
gap
Tota
l %
2.
31.
21.1
.4. S
hare
of po
ores
t quin
tile in
natio
nal c
onsu
mptio
n To
tal
%
148.
29.
2>1
0
1.1.5.
Pre
valen
ce of
unde
rweig
ht ch
ildre
n und
er 5
year
s of a
ge
Tota
l
DHS
%
14 (0
0)
85
nd
MoH
1.1.6.
Pre
valen
ce of
was
ting i
n chil
dren
unde
r 5 ye
ars o
f age
Tota
l%
11
(00)
7
9nd
1.1.7.
Pre
valen
ce of
stun
ting i
n chil
dren
unde
r 5 ye
ars o
f age
Tota
l%
32
(00)
22
19nd
1.2. R
educ
e un
emplo
ymen
t rate
tow
ard E
U em
ploym
ent r
ate,
betw
een 2
002 a
nd
2015
1.2.1.
Une
mploy
ment
rate
Tota
l
LFS, Admin data
INSTAT / MLSAEO
%
15.8
1514
.414
.113
.813
.513
13.1
9
MLSAEO
F%
13
.59
M%
12
.49
1.3. Im
prov
e inc
ome
distrib
ution
in or
der
that th
e Alba
nian
distrib
ution
mod
el ge
t clos
est to
EU
mode
l betw
een
2008
and 2
015
1.3.1.
At-r
isk-o
f-pov
erty
rate
Tota
l HBS
INSTAT
%15
.615
M%
16.1
15F
%
1515
1.3.2.
At-r
isk-o
f-pov
erty
rate
befor
e soc
ial tr
ansfe
r To
tal
%
nand
M%
nand
F%
na
nd
1.3.3.
Rela
tive a
t-risk
-of-p
over
ty ga
p To
tal
%
3.1
3M
%3.
33
F%
2.
93
1.3.4.
Ineq
uality
of in
come
distr
ibutio
n S80
/S20
quint
ile sh
are r
atio
Tota
l %
4.
14
( 43 )
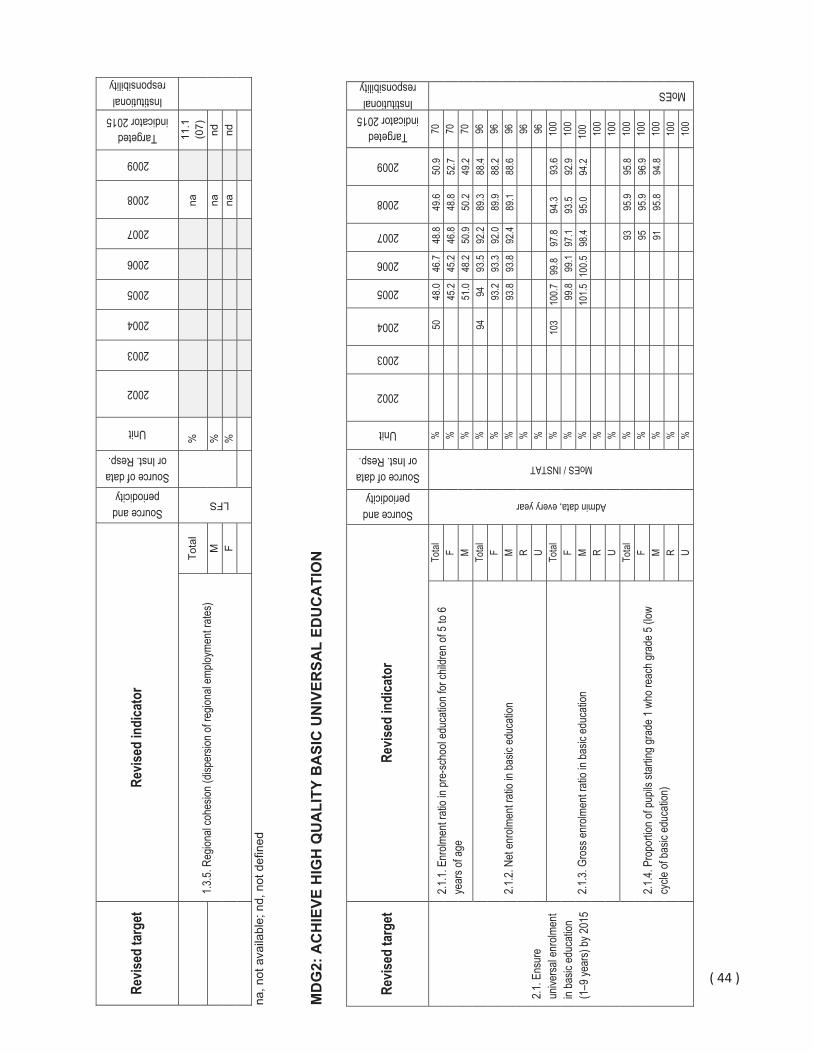
Revis
ed ta
rget
Re
vised
indi
cato
r
Source and periodicity
Source of data or Inst. Resp.
Unit
2002
2003
2004
2005
2006
2007
2008
2009
Targetedindicator 2015
Institutional responsibility
1.3.5.
Reg
ional
cohe
sion (
dispe
rsion
of re
giona
l emp
loyme
nt ra
tes)
Tota
l
LFS
%na
11.1
(07)
M
%na
ndF
%
nand
na, n
ot a
vaila
ble;
nd,
not
def
ined
MD
G2:
AC
HIE
VE H
IGH
QU
ALI
TY B
ASI
C U
NIV
ERSA
L ED
UC
ATI
ON
Revis
ed ta
rget
Re
vised
indi
cato
r
Source and periodicity
Source of data or Inst. Resp.
Unit
2002
2003
2004
2005
2006
2007
2008
2009
Targetedindicator 2015
Institutional responsibility
2.1. E
nsur
e un
iversa
l enr
olmen
t in
basic
educ
ation
(1
–9 ye
ars)
by 20
15
2.1.1.
Enr
olmen
t rati
o in p
re-sc
hool
educ
ation
for c
hildr
en of
5 to
6 ye
ars o
f age
Total
Admin data, every year
MoES / INSTAT
%50
48.0
46.7
48.8
49.6
50.9
70
MoES
F%
45.2
45.2
46.8
48.8
52.7
70M
%51
.048
.250
.950
.2 49
.2 70
2.1.2.
Net
enro
lmen
t rati
o in b
asic
educ
ation
Total
%94
9493
.592
.289
.3 88
.4 96
F%
93.2
93.3
92.0
89.9
88.2
96M
%93
.893
.892
.489
.1 88
.6 96
R%
96U
%96
2.1.3.
Gro
ss en
rolm
ent r
atio i
n bas
ic ed
ucati
on
Total
%10
3 10
0.799
.8 97
.8 94
.3 93
.6 10
0F
%99
.899
.197
.1 93
.5 92
.9 10
0M
%10
1.510
0.598
.4 95
.0 94
.2 10
0R
%10
0U
%10
0
2.1.4.
Pro
portio
n of p
upils
star
ting g
rade
1 wh
o rea
ch gr
ade 5
(low
cycle
of ba
sic ed
ucati
on)
Total
%93
95.9
95.8
100
F%
9595
.9 96
.9 10
0M
%91
95.8
94.8
100
R%
100
U%
100
( 44 )
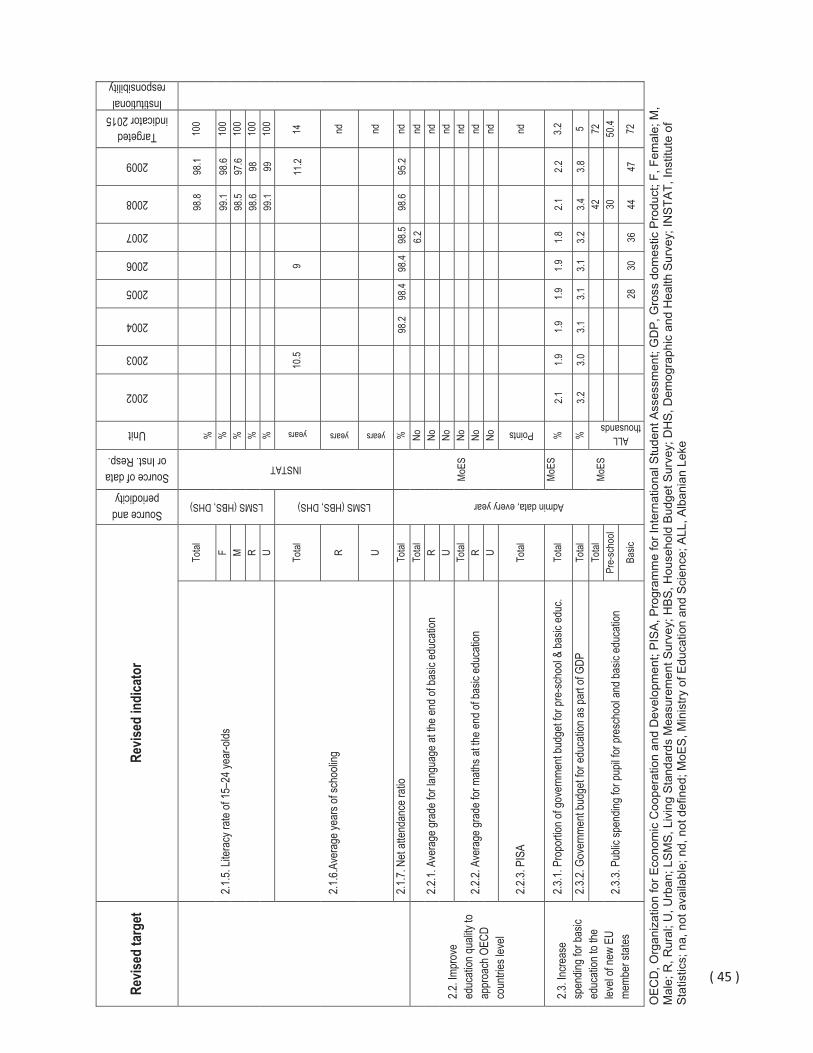
Revis
ed ta
rget
Re
vised
indi
cato
r
Source and periodicity
Source of data or Inst. Resp.
Unit
2002
2003
2004
2005
2006
2007
2008
2009
Targetedindicator 2015
Institutional responsibility
2.1.5.
Liter
acy r
ate of
15–2
4 yea
r-olds
Total
LSMS (HBS, DHS)
INSTAT
%98
.8 98
.1 10
0
F%
99.1
98.6
100
M%
98.5
97.6
100
R%
98.6
9810
0U
%99
.1 99
100
2.1.6.
Aver
age y
ears
of sc
hooli
ng
Total
LSMS (HBS, DHS)
years
10.5
911
.2 14
R
years
nd
U
years
nd
2.1.7.
Net
atten
danc
e rati
o To
tal
Admin data, every year
MoES
%98
.2 98
.498
.498
.598
.6 95
.2 nd
2.2. Im
prov
e ed
ucati
on qu
ality
to ap
proa
ch O
ECD
coun
tries l
evel
2.2.1.
Ave
rage
grad
e for
lang
uage
at th
e end
of ba
sic ed
ucati
on
Total
No6.2
nd
RNo
ndU
Nond
2.2.2.
Ave
rage
grad
e for
math
s at th
e end
of ba
sic ed
ucati
on
Total
Nond
RNo
ndU
Nond
2.2.3.
PIS
A To
tal
Points
nd
2.3. In
creas
e sp
endin
g for
basic
ed
ucati
on to
the
level
of ne
w EU
me
mber
state
s
2.3.1.
Pro
portio
n of g
over
nmen
t bud
get fo
r pre
-scho
ol &
basic
educ
. To
tal
MoES
%2.1
1.9
1.9
1.9
1.9
1.8
2.1
2.2
3.2
2.3.2.
Gov
ernm
ent b
udge
t for e
duca
tion a
s par
t of G
DP
Total
MoES
%3.2
3.0
3.1
3.1
3.1
3.2
3.4
3.8
5
2.3.3.
Pub
lic sp
endin
g for
pupil
for p
resc
hool
and b
asic
educ
ation
To
talALL
thousands
4272
Pre-
scho
ol30
50.4
Basic
28
3036
4447
72
OE
CD
, Org
aniz
atio
n fo
r Eco
nom
ic C
oope
ratio
n an
d D
evel
opm
ent;
PIS
A, P
rogr
amm
e fo
r Int
erna
tiona
l Stu
dent
Ass
essm
ent;
GD
P, G
ross
dom
estic
Pro
duct
; F, F
emal
e; M
, M
ale;
R, R
ural
; U, U
rban
; LS
MS
, Liv
ing
Sta
ndar
ds M
easu
rem
ent S
urve
y; H
BS
, Hou
seho
ld B
udge
t Sur
vey;
DH
S, D
emog
raph
ic a
nd H
ealth
Sur
vey;
INS
TAT,
Inst
itute
of
Sta
tistic
s; n
a, n
ot a
vaila
ble;
nd,
not
def
ined
; MoE
S, M
inis
try o
f Edu
catio
n an
d S
cien
ce; A
LL, A
lban
ian
Leke
( 45 )

MD
G3:
PR
OM
OTE
GEN
DER
EQ
UA
LITY
AN
D E
MPO
WER
WO
MEN
Revis
ed ta
rget
Re
vised
indi
cato
r
Source and periodicity
Source of Data or Inst. Resp.
Unit
2002
2003
2004
2005
2006
2007
2008
2009
Indicator 2015
Institutional responsibility
3.1. E
limina
te ge
nder
dis
pariti
es in
basic
(g
rade
1–9)
ed
ucati
on by
2015
3.1.1.
Rati
o of fe
males
to m
ales i
n bas
ic ed
ucati
on
Total
MoES,every year
MoES
INST
AT
No0.9
4 0.9
30.9
3 0.9
30.9
30.9
30.9
3 0.9
2 1
MoES
RNo
0.94
1
UNo
0.92
1
3.1.2.
Rati
o of li
terate
wom
en to
men
, 15–
24 ye
ars o
ld To
tal
LSMS (DHS)
INST
ATNo
1
1.01
1
RNo
0.
9 1
1U
No
1.1
1.01
1
3.2. E
limina
te ge
nder
dis
pariti
es in
elec
ted
bodie
s, in
decis
ion
makin
g in c
entra
l and
loc
al go
vern
ment,
an
d in j
udici
al sy
stem
MLSAEO,INSTAT
5.7
5.7
5.7
7.1
7.1
7.1
7.1
16.4
30
MLSAEO
3.2.1.
Pro
portio
n of s
eats
held
by w
omen
in na
tiona
l par
liame
nt To
tal
Parliament, every 4 years
%
3.2.2.
Pro
portio
n of fe
males
holdi
ng th
e pos
t of m
iniste
r and
depu
ty mi
nister
To
tal
Every year, admin data
%
14.2
an
d 25
7 an
d 25
.7
30
3.2.3.
Pro
portio
n of fe
males
in lo
cal e
lected
gove
rnme
nt bo
dies
Total
MoI, every 4 years
%
0–
16
0– 1657
30
3.2.4
.Pro
portio
n of fe
males
emplo
yed i
n the
civil
servi
ce, a
t four
hig
hest
levels
of of
fice
Total
DPA, every year
%
27
50
57
One
out
of 6
5 m
ayor
s (1
.5%
), ni
ne o
ut o
f 65
mun
icip
al c
ounc
il ch
airs
(16%
), si
x ou
t of 3
09 c
omm
une
chai
rs (1
.9%
) are
fem
ales
and
no
regi
onal
cou
ncil
chai
r is
fem
ale
( 46 )
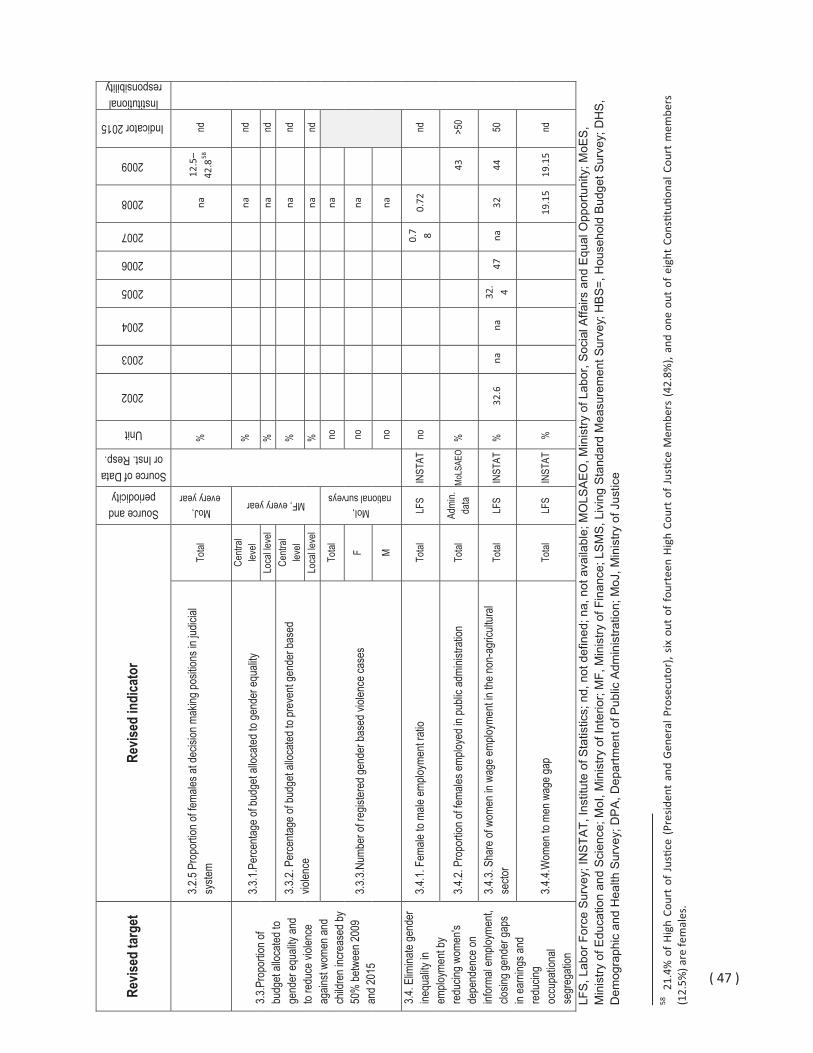
Revis
ed in
dica
tor
Source and periodicity
Source of Data
2007
2008
2009
Indicator 2015
Institutional responsibility
or Inst. Resp.
Unit
2002
2003
2004
2005
2006
Revis
ed ta
rget
3.2.5
Prop
ortio
n of fe
males
at de
cision
mak
ing po
sition
s in j
udici
al sy
stem
Total
MoJ, every year
%
na
12
.5–
42.8
58nd
3.3.P
ropo
rtion o
f bu
dget
alloc
ated t
o ge
nder
equa
lity an
d to
redu
ce vi
olenc
e ag
ainst
wome
n and
ch
ildre
n inc
reas
ed by
50
% be
twee
n 200
9 an
d 201
5
3.3.1.
Perce
ntage
of bu
dget
alloc
ated t
o gen
der e
quali
ty
Centr
al lev
el
MF, every year
%
na
nd
Loca
l leve
l %
na
nd
3.3.2.
Per
centa
ge of
budg
et all
ocate
d to p
reve
nt ge
nder
base
d vio
lence
Centr
al lev
el %
na
nd
Loca
l leve
l %
na
nd
3.3.3.
Numb
er of
regis
tered
gend
er ba
sed v
iolen
ce ca
ses
Total
MoI, national surveys
no
na
Fno
na
Mno
na
3.4. E
limina
te ge
nder
ine
quali
ty in
emplo
ymen
t by
redu
cing w
omen
's de
pend
ence
on
infor
mal e
mploy
ment,
clo
sing g
ende
r gap
s in
earn
ings a
nd
redu
cing
occu
patio
nal
segr
egati
on
3.4.1.
Fem
ale to
male
emplo
ymen
t rati
o To
talLF
SIN
STAT
no
0.
7 8 0.
72
nd
3.4.2.
Pro
portio
n of fe
males
emplo
yed i
n pub
lic ad
minis
tratio
n To
tal
Admi
n.da
ta Mo
LSAE
O%
43
>5
0
3.4.3.
Sha
re of
wom
en in
wag
e emp
loyme
nt in
the no
n-ag
ricult
ural
secto
r To
talLF
SIN
STAT
%32
.6
na
na
32.
4 47
na
32
44
50
3.4.4.
Wom
en to
men
wag
e gap
To
talLF
SIN
STAT
%
19.1
519
.15
nd
LFS
, Lab
or F
orce
Sur
vey;
INS
TAT,
Inst
itute
of S
tatis
tics;
nd,
not
def
ined
; na,
not
ava
ilabl
e; M
OLS
AE
O, M
inis
try o
f Lab
or, S
ocia
l Affa
irs a
nd E
qual
Opp
ortu
nity
; MoE
S,
Min
istry
of E
duca
tion
and
Sci
ence
; MoI
, Min
istry
of I
nter
ior;
MF,
Min
istry
of F
inan
ce; L
SM
S, L
ivin
g S
tand
ard
Mea
sure
men
t Sur
vey;
HB
S=,
Hou
seho
ld B
udge
t Sur
vey;
DH
S,
Dem
ogra
phic
and
Hea
lth S
urve
y; D
PA
, Dep
artm
ent o
f Pub
lic A
dmin
istra
tion;
MoJ
, Min
istry
of J
ustic
e
58
21.4
% o
f H
igh
Cour
t of
Jus
�ce
(Pre
side
nt a
nd G
ener
al P
rose
cuto
r),
six
out
of f
ourt
een
Hig
h Co
urt
of J
us�c
e M
embe
rs (
42.8
%),
and
one
out
of e
ight
Con
s�tu
�ona
l Cou
rt m
embe
rs
(12.
5%) a
re fe
mal
es.
( 47 )

MD
G4:
RED
UC
E C
HIL
D M
OR
TALI
TY
Revis
ed T
arge
t Re
vised
Indi
cato
r
Source and periodicity
Source of Data or Inst. Resp.
Unit
2002
2003
2004
2005
2006
2007
2008
2009
Targeted indicator 2015
4.1. R
educ
e the
un
der-f
ive m
ortal
ity
rate
to 10
/1,00
0 by
2015
4.1.1.
Infan
t mor
tality
per 1
,000 l
ive bi
rths
Total
DHS, admin. data, every year
DHS
Per thousand
35 (0
0)20
18
10
MoH
MoH
17.5
15.5
15.1
14.7
13
12
11.1
4.1.2.
Und
er 5
morta
lity ra
te pe
r 1,00
0 live
birth
s To
tal
DHS
Per thousand
39 (0
0)22
22
10
MoH
20.1
20.7
na
18
18
na*
12.4
4.1. 3
. Pro
portio
n of c
hildr
en va
ccina
ted ag
ainst
meas
les, r
ubell
a an
d par
otitis
To
tal
%95
94
96
97
94
.897
.6>9
595
>95
MD
G5:
IMPR
OVE
MA
TER
NA
L H
EALT
H
5.1. R
educ
e the
ma
terna
l mor
tality
ra
te to
11/10
0,000
by
2015
5.1.1.
Mate
rnal
morta
lity ra
tio
Total
DHS, Admin data, every year
INSTAT/MoH
Per 100,000
25.9
21.3
12.0
23.2
16.7
14.5
10
11
MoH
Rna
nd
U
na
nd
5.1.2
Perce
ntage
of w
omen
with
4 or
mor
e med
ical v
isits
durin
g pr
egna
ncy a
s rec
omme
nded
Total
%
42
47
47
43
na*
43
54.4
66.8
>70
R%
57
U%
82
5.1.3.
Pro
portio
n of b
irths a
ttend
ed by
skille
d hea
lth pe
rsonn
el To
tal
%10
0 na
99.3
>99
R%
99
>99
U%
99.9
100
( 48 )
Institutionalresponsibility
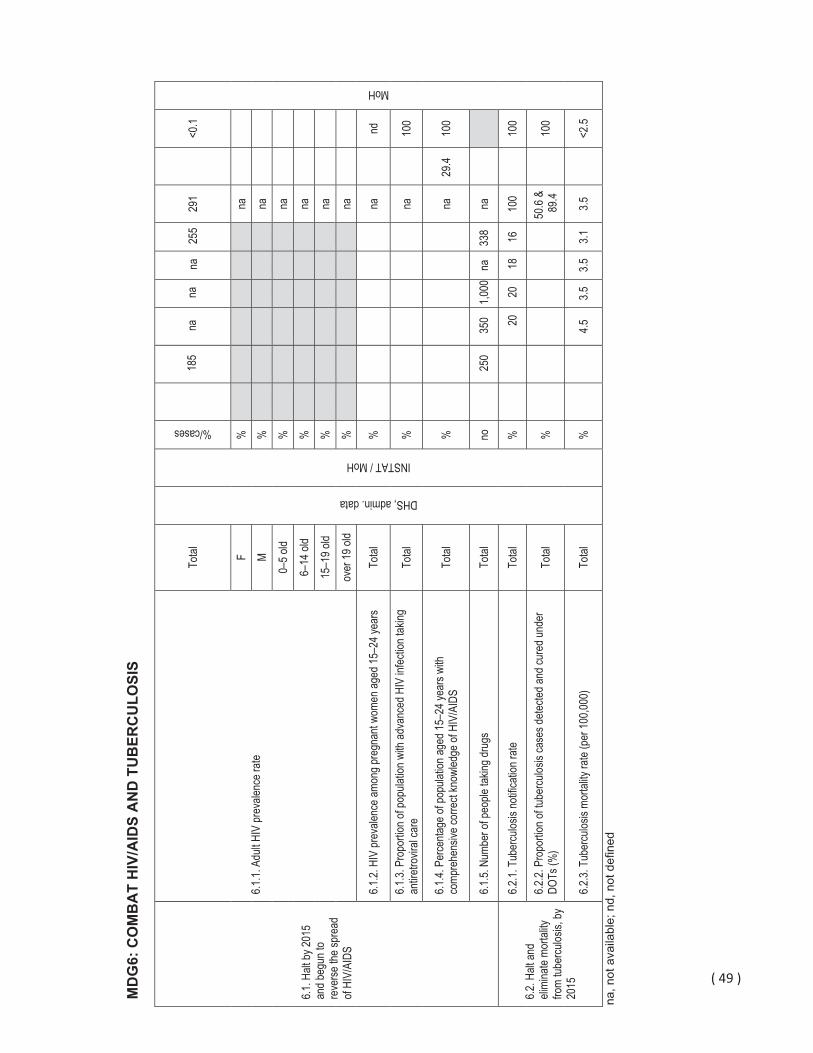
MD
G6:
CO
MB
AT
HIV
/AID
S A
ND
TU
BER
CU
LOSI
S
6.1. H
alt by
2015
an
d beg
un to
re
verse
the s
prea
d of
HIV/
AIDS
6.1.1.
Adu
lt HIV
prev
alenc
e rate
Total
DHS, admin. data
INSTAT / MoH
%/cases
185
na
na
na
255
291
<0.1
MoH
F%
na
M%
na
0–5 o
ld %
na
6–14
old
%na
15–1
9 old
%na
over
19 ol
d %
na
6.1.2.
HIV
prev
alenc
e amo
ng pr
egna
nt wo
men a
ged 1
5–24
year
s To
tal
%na
nd
6.1.3.
Pro
portio
n of p
opula
tion w
ith ad
vanc
ed H
IV in
fectio
n tak
ing
antire
trovir
al ca
re
Total
%
na
100
6.1.4.
Per
centa
ge of
popu
lation
aged
15–2
4 yea
rs wi
th co
mpre
hens
ive co
rrect
know
ledge
of H
IV/A
IDS
Total
%
na
29.4
100
6.1.5.
Num
ber o
f peo
ple ta
king d
rugs
To
tal
no
250
350
1,000
na
338
na
6.2. H
alt an
d eli
mina
te mo
rtality
fro
m tub
ercu
losis,
by
2015
6.2.1.
Tub
ercu
losis
notifi
catio
n rate
To
tal
%20
20
18
16
10
0 10
0
6.2.2.
Pro
portio
n of tu
bercu
losis
case
s dete
cted a
nd cu
red u
nder
DO
Ts (%
) To
tal
%50
.6 &
89.4
100
6.2.3.
Tub
ercu
losis
morta
lity ra
te (p
er 10
0,000
) To
tal
%4.5
3.5
3.5
3.1
3.5
<2
.5
na, n
ot a
vaila
ble;
nd,
not
def
ined
( 49 )
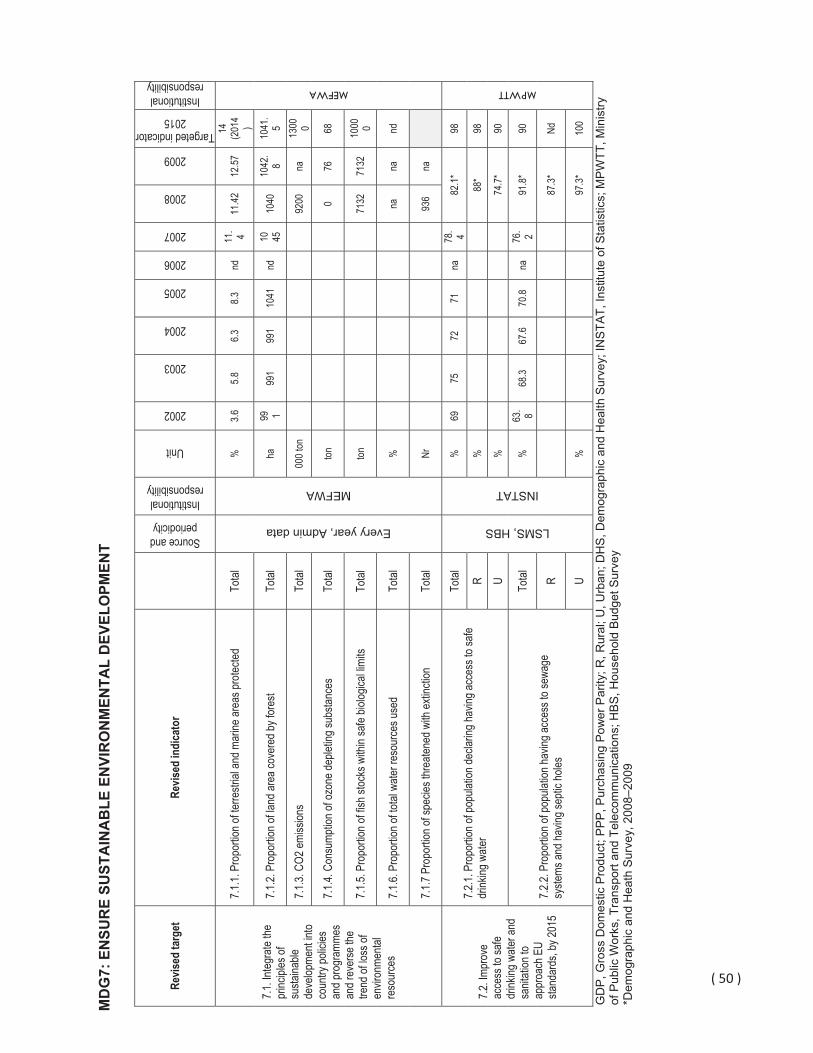
MD
G7:
EN
SUR
E SU
STA
INA
BLE
EN
VIR
ON
MEN
TAL
DEV
ELO
PMEN
T
Revis
ed ta
rget
Re
vised
indi
cato
r
Source and periodicity
Institutional responsibility
Unit
2002
2003
2004
2005
2006
2007
2008
2009
Targeted indicator2015
Institutional responsibility
7.1. In
tegra
te the
pr
incipl
es of
su
staina
ble
deve
lopme
nt int
o co
untry
polic
ies
and p
rogr
amme
s an
d rev
erse
the
trend
of lo
ss of
en
viron
menta
l re
sour
ces
7.1.1.
Pro
portio
n of te
rrestr
ial an
d mar
ine ar
eas p
rotec
ted
Total
Every year, Admin data
MEFWA
%3.6
5.8
6.3
8.3
nd
11. 4
11.42
12
.57
14 (201
4)
MEFWA
7.1.2.
Pro
portio
n of la
nd ar
ea co
vere
d by f
ores
t To
tal
ha99 1
991
991
1041
nd
10 4510
40
1042
.8
1041
.5
7.1.3.
CO2
emiss
ions
Total
00
0 ton
92
00
na13
00 0
7.1.4.
Con
sump
tion o
f ozo
ne de
pletin
g sub
stanc
es
Total
ton
0
7668
7.1.5.
Pro
portio
n of fi
sh st
ocks
with
in sa
fe bio
logica
l limi
ts To
tal
ton
7132
71
32
1000 0
7.1.6.
Pro
portio
n of to
tal w
ater r
esou
rces u
sed
Total
%
nana
nd
7.1.7
Prop
ortio
n of s
pecie
s thr
eaten
ed w
ith ex
tincti
on
Total
Nr
936
na
7.2. Im
prov
e ac
cess
to sa
fe dr
inking
wate
r and
sa
nitati
on to
ap
proa
ch E
U sta
ndar
ds, b
y 201
5
7.2.1.
Pro
portio
n of p
opula
tion d
eclar
ing ha
ving a
cces
s to s
afe
drink
ing w
ater
Total
LSMS, HBS
INSTAT
%69
7572
71na
78. 4
82.1*
98
MPWTT
R%
88*
98
U%
74.7*
90
7.2.2.
Pro
portio
n of p
opula
tion h
aving
acce
ss to
sewa
ge
syste
ms an
d hav
ing se
ptic h
oles
Total
%
63. 8
68.3
67.6
70.8
na76
. 291
.8*
90
R87
.3*
Nd
U%
97.3*
10
0
GD
P, G
ross
Dom
estic
Pro
duct
; PP
P, P
urch
asin
g P
ower
Par
ity; R
, Rur
al; U
, Urb
an; D
HS
, Dem
ogra
phic
and
Hea
lth S
urve
y; IN
STA
T, In
stitu
te o
f Sta
tistic
s; M
PW
TT, M
inis
try
of P
ublic
Wor
ks, T
rans
port
and
Tele
com
mun
icat
ions
; HB
S, H
ouse
hold
Bud
get S
urve
y *D
emog
raph
ic a
nd H
eath
Sur
vey,
200
8–20
09
( 50 )

MD
G9:
IMPR
OVE
GO
VER
NA
NC
E FO
R A
LL C
ITIZ
ENS
AN
D E
SPEC
IALL
Y FO
R M
OST
DIS
AD
VAN
TAG
ED G
RO
UPS
Revis
ed ta
rget
Re
vised
indi
cato
rs
Source and periodicity
Source of data or Inst. Resp.
Unit
2002
2003
2004
2005
2006
2007
2008
2009
Indicator 2015
Institutional responsibility
9.1. G
over
nanc
e in
Alba
nia ap
proa
ches
EU
gove
rnan
ce
stand
ards
by 20
15
9.1.1.
Voic
e and
acco
untab
ility
Every year, WBI
WBI
Points
45.7
49
49
48.6
48.1
49
51.4
na
81
DSDC
9.1.2.
Poli
tical
stabil
ity
Points
27.4
31.3
23.6
27.4
32.2
35.1
45.5
na
71
9.1.3.
Gov
ernm
ent e
ffecti
vene
ss
Points
32.2
32.7
41.7
31.3
35.5
43.1
44.5
na
76
9.1.4.
Reg
ulator
y qua
lity
Points
43.4
36.6
48.8
46.8
51.7
55.8
57
na
83
9.1.5.
Rule
of la
w
Points
19.5
15.7
20
24.3
26.7
28.1
32.5
na
74
9.1.6.
Con
trol o
f cor
rupti
on
Points23
.3 26
.2 26
.2 29
.128
.635
.739
.1 na
73
( 51 )
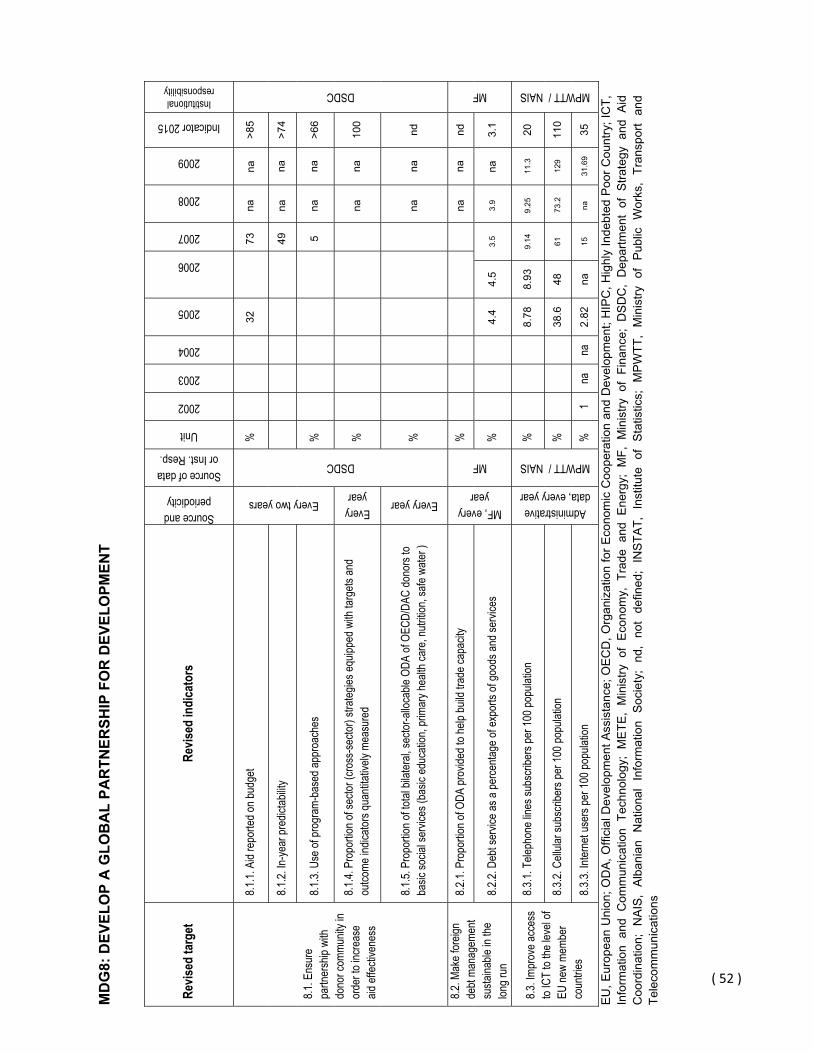
MD
G8:
DEV
ELO
P A
GLO
BA
L PA
RTN
ERSH
IP F
OR
DEV
ELO
PMEN
T
Revis
ed ta
rget
Re
vised
indi
cato
rs
Source and periodicity
Source of data or Inst. Resp.
Unit
2002
2003
2004
2005
2006
2007
2008
2009
Indicator 2015
Institutional responsibility
8.1. E
nsur
e pa
rtner
ship
with
dono
r com
munit
y in
orde
r to i
ncre
ase
aid ef
fectiv
enes
s
8.1.1.
Aid
repo
rted o
n bud
get
Every two years
DSDC
%32
73>8
5
DSDC
8.1.2.
In-ye
ar pr
edict
abilit
y 49
>74
8.1.3.
Use
of pr
ogra
m-ba
sed a
ppro
ache
s %
5>6
6
8.1.4.
Pro
portio
n of s
ector
(cro
ss-se
ctor)
strate
gies e
quipp
ed w
ith ta
rgets
and
outco
me in
dicato
rs qu
antita
tively
mea
sure
d
Everyyear
%na
100
8.1.5.
Pro
portio
n of to
tal bi
later
al, se
ctor-a
lloca
ble O
DA of
OEC
D/DA
C do
nors
to ba
sic so
cial s
ervic
es (b
asic
educ
ation
, prim
ary h
ealth
care
, nutr
ition,
safe
water
)
Every year
%na
nd
8.2. M
ake f
oreig
n de
bt ma
nage
ment
susta
inable
in th
e lon
g run
8.2.1.
Pro
portio
n of O
DA pr
ovide
d to h
elp bu
ild tr
ade c
apac
ity
MF, every year
MF
%na
nd
MF
8.2.2.
Deb
t ser
vice a
s a pe
rcenta
ge of
expo
rts of
good
s and
servi
ces
%4.
44.
53.
5 3.
9 3.
1
8.3. Im
prov
e acc
ess
to IC
T to
the le
vel o
f EU
new
memb
er
coun
tries
8.3.1.
Tele
phon
e line
s sub
scrib
ers p
er 10
0 pop
ulatio
n Administrative
data, every year
MPWTT / NAIS
%8.
788.
939.
14
9.25
11
.3
20
MPWTT / NAIS
8.3.2.
Cell
ular s
ubsc
riber
s per
100 p
opula
tion
%38
.648
61
73.2
12
9 11
0
8.3.3.
Inter
net u
sers
per 1
00 po
pulat
ion
%1
na
na
2.82
na15
na
31
.69
35
EU
, Eur
opea
n U
nion
; OD
A, O
ffici
al D
evel
opm
ent A
ssis
tanc
e; O
EC
D, O
rgan
izat
ion
for E
cono
mic
Coo
pera
tion
and
Dev
elop
men
t; H
IPC
, Hig
hly
Inde
bted
Poo
r Cou
ntry
; IC
T,
Info
rmat
ion
and
Com
mun
icat
ion
Tech
nolo
gy;
ME
TE,
Min
istry
of
Eco
nom
y, T
rade
and
Ene
rgy;
MF,
Min
istry
of
Fina
nce;
DS
DC
, D
epar
tmen
t of
Stra
tegy
and
Aid
C
oord
inat
ion;
NA
IS,
Alb
ania
n N
atio
nal
Info
rmat
ion
Soc
iety
; nd
, no
t de
fined
; IN
STA
T, I
nstit
ute
of S
tatis
tics;
MP
WTT
, M
inis
try o
f P
ublic
Wor
ks,
Tran
spor
t an
d Te
leco
mm
unic
atio
ns
( 52 )
nanana
nanananananana
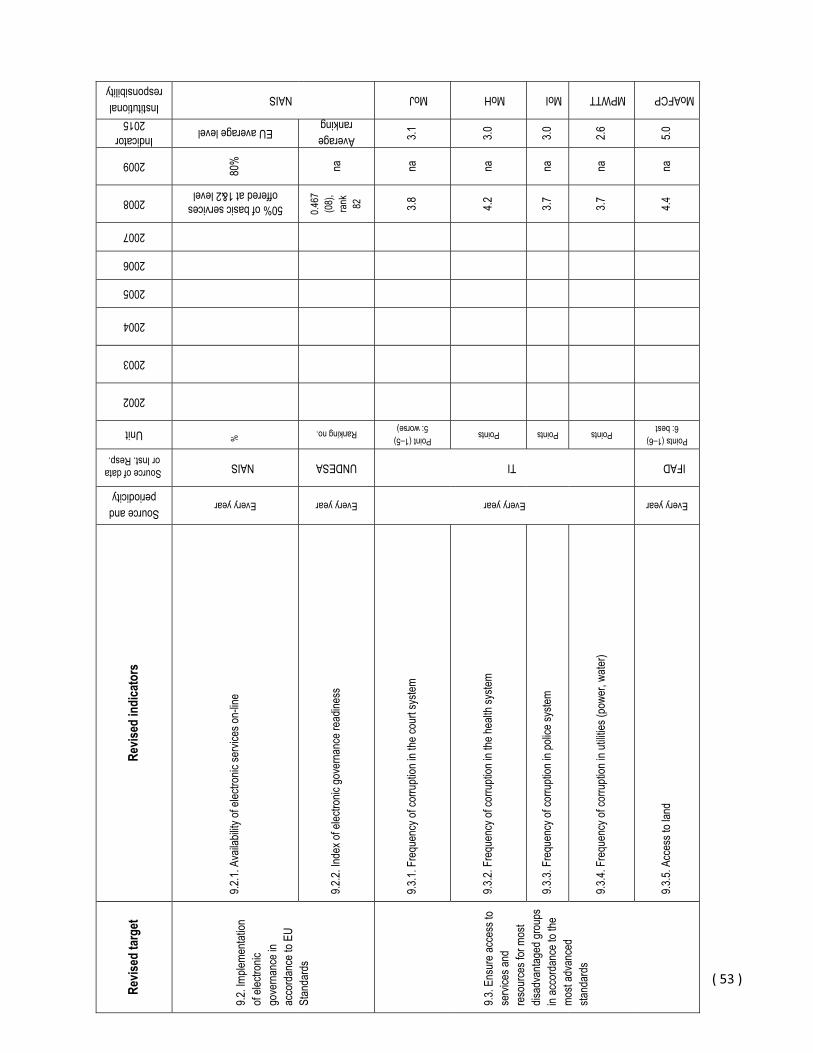
Revis
ed ta
rget
Re
vised
indi
cato
rs
Source and periodicity
Source of data or Inst. Resp.
Unit
2002
2003
2004
2005
2006
2007
2008
2009
Indicator 2015
Institutional responsibility
9.2. Im
pleme
ntatio
n of
electr
onic
gove
rnan
ce in
ac
cord
ance
to E
U St
anda
rds
9.2.1.
Ava
ilabil
ity of
elec
tronic
servi
ces o
n-lin
e
Every year
NAIS
%
50% of basic services offered at 1&2 level
80%
EU average level
NAIS
9.2.2.
Inde
x of e
lectro
nic go
vern
ance
read
iness
Every year
UNDESA
Ranking no.
0.467
(0
8),
rank 82
Average ranking
9.3. E
nsur
e acc
ess t
o se
rvice
s and
re
sour
ces f
or m
ost
disad
vanta
ged g
roup
s in
acco
rdan
ce to
the
most
adva
nced
sta
ndar
ds
9.3.1.
Fre
quen
cy of
corru
ption
in th
e cou
rt sy
stem
Every year
TI
Point (1–5) 5: worse)
3.8
na
3.1
MoJ
9.3.2.
Fre
quen
cy of
corru
ption
in th
e hea
lth sy
stem
Points
4.2
na
3.0
MoH
9.3.3.
Fre
quen
cy of
corru
ption
in po
lice s
ystem
Points
3.7
na
3.0
MoI
9.3.4.
Fre
quen
cy of
corru
ption
in ut
ilities
(pow
er, w
ater)
Points3.7
na
2.6
MPWTT
9.3.5.
Acc
ess t
o lan
d
Every year
IFAD
Points (1–6) 6: best
4.4
na
5.0
MoAFCP
( 53 )
na
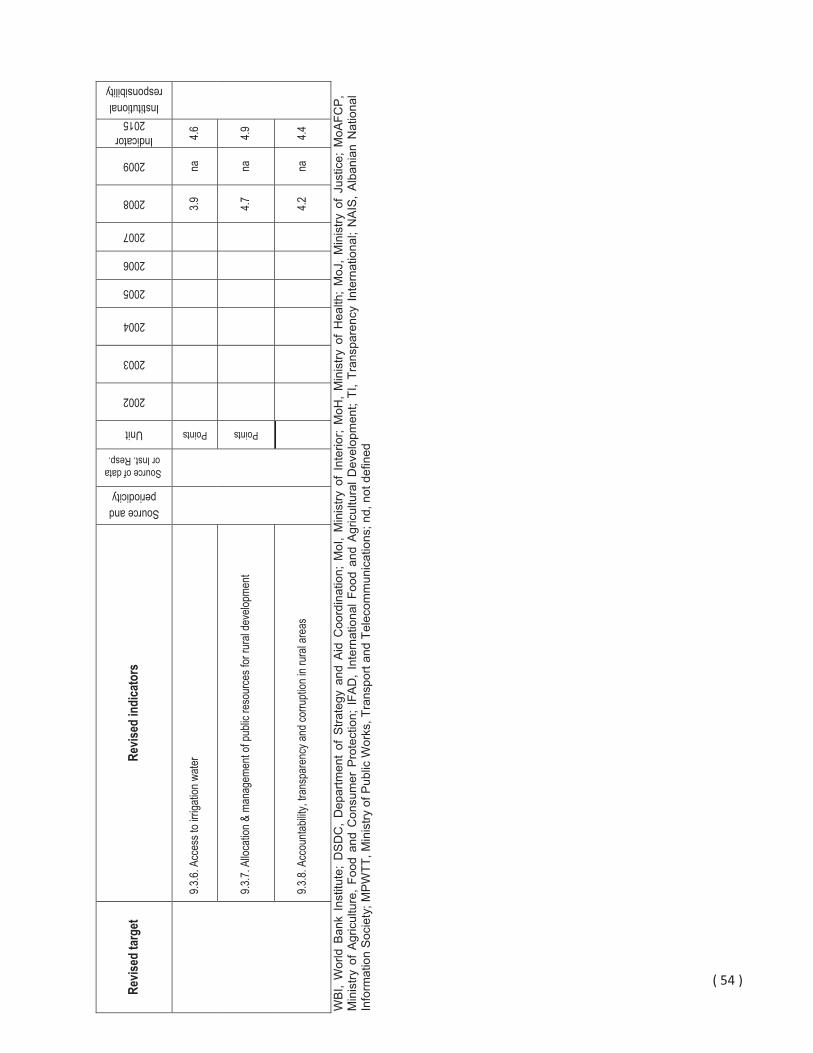
( 54 ) Re
vised
targ
et
Revis
ed in
dica
tors
Source and periodicity
Source of data or Inst. Resp.
Unit
2002
2003
2004
2005
2006
2007
2008
2009
Indicator 2015
Institutional responsibility
9.3.6.
Acc
ess t
o irri
gatio
n wate
r
Points
3.9
na
4.6
9.3.7.
Allo
catio
n & m
anag
emen
t of p
ublic
reso
urce
s for
rura
l dev
elopm
ent
Points
4.7
na
4.9
9.3.8.
Acc
ounta
bility
, tran
spar
ency
and c
orru
ption
in ru
ral a
reas
4.2
na
4.4
WB
I, W
orld
Ban
k In
stitu
te;
DS
DC
, D
epar
tmen
t of
Stra
tegy
and
Aid
Coo
rdin
atio
n; M
oI,
Min
istry
of
Inte
rior;
MoH
, M
inis
try o
f H
ealth
; M
oJ,
Min
istry
of
Just
ice;
MoA
FCP
, M
inis
try o
f A
gric
ultu
re,
Food
and
Con
sum
er P
rote
ctio
n; I
FAD
, In
tern
atio
nal F
ood
and
Agr
icul
tura
l Dev
elop
men
t; TI
, Tr
ansp
aren
cy I
nter
natio
nal;
NA
IS,
Alb
ania
n N
atio
nal
Info
rmat
ion
Soc
iety
; MP
WTT
, Min
istry
of P
ublic
Wor
ks, T
rans
port
and
Tele
com
mun
icat
ions
; nd,
not
def
ined

( 55 )
ANNEX�2�
SUMMARY�TABLE—PARIS�INDICATORS�
�
Indicator�2005�
Reference�2007� 2010�target�
1 Operational development strategies C C B or A
2a Reliable public financial management (PFM) systems
4.0 na 4.5
2b Reliable procurement systems na na Not applicable
3 Aid flows are aligned on national priorities 32% 73% 85%
4 Strengthen capacity by co-ordinated support 28% 51% 50%
5a Use of country PFM systems 14% 12% 43%
5b Use of country procurement systems 6% 10% Not applicable
6 Strengthen capacity by avoiding parallel PIUs 57 24 19
7 Aid is more predictable 49% 29% 74%
8 Aid is untied 59% 82% > 59%
9 Use of common arrangements or procedures 5% 14% 66%
10a Joint missions 9% 28% 40%
10b Joint country analytic work 22% 34% 66%
11 Results-oriented frameworks D D B or A
12 Mutual accountability No No Yes
na, not available Source:�“2008�Survey�on�Monitoring�the�Paris�Declaration.�Effective�Aid�by�2010?�What�will�it�take?”�3rd�High�Level�Forum�on�Aid�Effectiveness,�Accra,�Ghana,�September,�2008,�Chapter�on�Albania,�Table�9,�page�19.
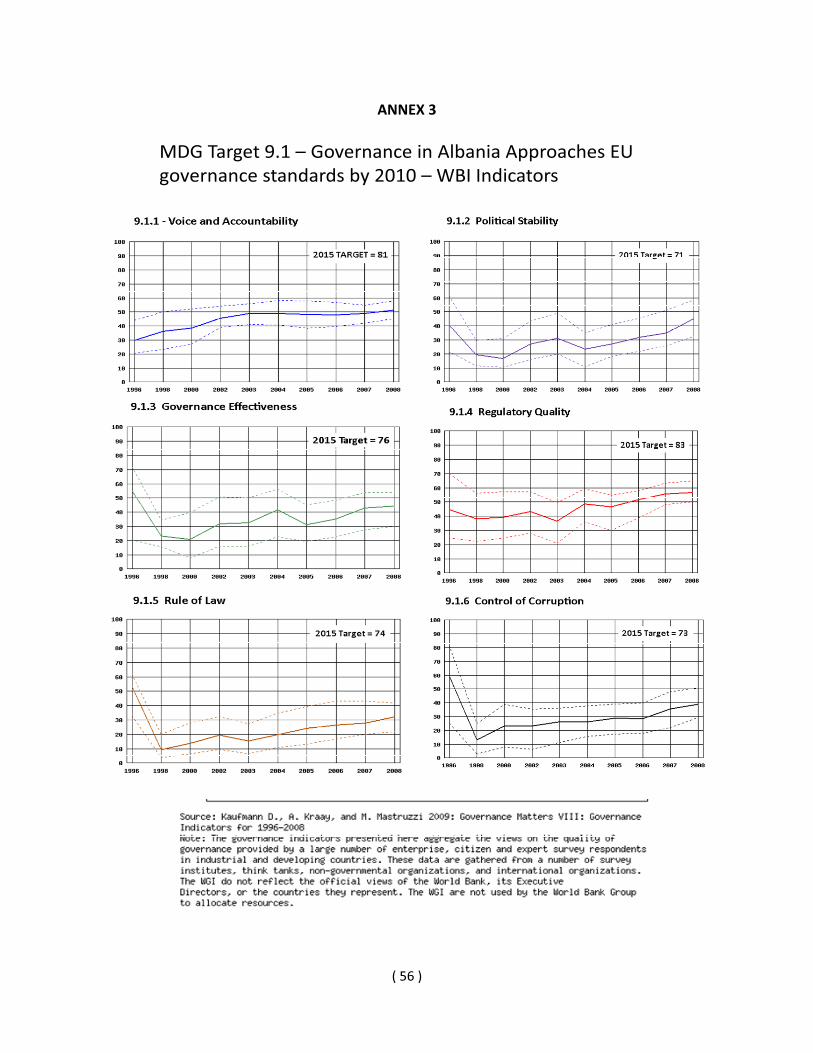
( 56 )
ANNEX�3�
MDG Target 9.1 – Governance in Albania Approaches EU governance standards by 2010 – WBI Indicators

( 57 )
ANNEX�4�
�LIST�OF�ACRONYMS�
ACIT Albanian Center for International Trade AKEP Electronic and Postal Communication Authority
(Autoriteti i Komunikimeve Elektronike dhe Postare) ANC Antenatal Care CEDAW Convention for the Elimination of All forms of Discrimination
against Women CEE Central and Eastern Europe
CPI Corruption Perception Index DESA Department of Economic and Social Affairs (UN) DHS Demographic Health Survey DOT� � Directly Observed Treatment (for Tuberculosis)�DSDC Department for Strategy and Donor Coordination DTS Donor Technical Secretariat EFP Economic and Fiscal Program (2010–2012) EC European Commission EI European Integration EU European Union FAO Food and Agricultural Organization GEL Gender Equality Law GDP Gross Domestic Product HBS Household Budget Survey ICS Institute for Contemporary Studies ICT Information and Communications Technology IMF International Monetary Fund INSTAT Institute of Statistics IPS Integrated Planning System LCS Living Conditions Survey LFS Labor Force Survey LSMS Living Standard Measurement Survey MDG Millennium Development Goal M&E Monitoring and Evaluation MEI Ministry of European Integration METE Ministry of Economy, Trade and Energy MoES Ministry of Education and Science MoF Ministry of Finance MOI Ministry of Interior MOLSAEO Ministry of Labor, Social Affairs and Equal Opportunities MPWTT Ministry of Public Works, Transport and Telecommunications MTBP Mid-Term Budgetary Programme NAIS National Agency for Information Society NGO Non-Government Organization NHDR National Human Development Report NSDI National Strategy for Development and Integration NSGE-DV National Strategy for Gender Equality and against Domestic Violence NSSED National Strategy for Socio-Economic Development

( 58 )
OECD Organization for Economic Cooperation and Development PAR Public Administration Reform PISA Programme for International Student Assessment SAA Stabilization and Association Agreement SIS Social Inclusion Strategy TB Tuberculosis TI Transparency International UNDP United Nations Development Programme UNICEF United Nations Children’s Fund WB World Bank WBI World Bank Institute

ce of the UN Resident Coordinator‘Papa Gjon Pali II’ Street,ABA Business Center, 6th Floor,Tirana, AlbaniaTel: +355 4 2233122Fax: +355 4 2232075www.un.org.al
Department of Strategy and Donor CoordinationCouncil of Ministers
Blv. Dëshmorët e Kombit,Tirana, Albania
Tel: +355 4 2277357Fax: +355 4 2226354
www.dsdc.gov.al