albee et al - g3: genes, genomes, genetics · 1" a.j."albee"et#al."...
TRANSCRIPT
1 A.J. Albee et al.
Identification of cilia genes that affect cell cycle progression using whole genome transcriptome
analysis in Chlamydomonas reinhardtti
Alison J. Albee*, Alan L. Kwan§1, Huawen Lin*, David Granas §, Gary D. Stormo §, and Susan K.
Dutcher*
• *Department of Genetics, Washington University School of Medicine, St. Louis, MO,
USA
• §Center for Genomic Sciences and System Biology Washington University, St. Louis, MO
USA
1 current address: Molecular and Cellular Technologies, Platform Technology and Science
GlaxoSmithKline Research and Development, Collegeville, PA USA
Data RNAseq data deposited: December 19, 2012; data to be released April 30, 2013 or upon
publication
G3: Genes|Genomes|Genetics Early Online, published on April 19, 2013 as doi:10.1534/g3.113.006338
© The Author(s) 2013. Published by the Genetics Society of America.
2 A.J. Albee et al.
Running Title: RNAseq during ciliogenesis
Key words: flagella, deflagellation, ZMYND10, NXN, SPATA4, GLOD4
Corresponding author: Susan Dutcher
Department of Genetics
Box 8232
660 South Euclid Avenue
Saint Louis, MO 63110
Phone: (314)362-3666
Fax: (314)362-7855
Email: [email protected]
3 A.J. Albee et al.
Abstract
Cilia are microtubule based organelles that project from cells. Cilia are found on almost every
cell type of the human body and numerous diseases, collectively termed ciliopathies, are
associated with defects in cilia including respiratory infections, male infertility, situs inversus,
polycystic kidney disease, retinal degeneration, and Bardet-Biedl Syndrome. Here we show that
Illumina-based whole genome transcriptome analysis in the biflagellate green alga
Chlamydomonas reinhardtii identifies 1850 genes upregulated during ciliogenesis, 4392 genes
down-regulated, and 4548 genes with no change in expression during ciliogenesis. We
examined 4 genes upregulated and not previously known to be involved with cilia (ZMYND10,
NXN, GLOD4, SPATA4) by knockdown of the human orthologs in human retinal pigment
epithelial cells (hTERT-RPE1) cells to ask if they are involved in cilia-related processes that
include cilia assembly, cilia length control, basal body/centriole numbers, and the distance
between basal bodies/centrioles. All of the genes have cilia-related phenotypes and,
surprisingly, our data show that knockdown of GLOD4 and SPATA4 also affects the cell cycle.
These results demonstrate that whole genome transcriptome analysis during ciliogenesis is a
powerful tool to gain insight into the molecular mechanism by which centrosomes and cilia are
assembled.
4 A.J. Albee et al.
Introduction
Cilia are hair-like organelles protruding from many types of cells in the human body.
They play both signaling and mechanical roles in cells. At the base of cilia lie microtubule-based
structures called basal bodies, which template and anchor cilia and recruit proteins needed for
ciliary assembly. The presence of cilia and basal bodies is linked to the cell cycle in many
organisms; mammalian cells that exit the cell cycle are quiescent, non-proliferating and
assemble cilia (TUCKER et al. 1979). When cells re-enter the cell cycle, they absorb their cilia in
late G1 (RIEDER et al. 1979) and basal bodies convert to centrioles to become part of the spindle
pole during mitosis. The prevailing hypothesis is that the cell cycle regulates the basal
body/centriole and the assembly of cilia. Depletion of cdk or cyclin A or E eliminates centriole
separation (LACEY et al. 1999). In many unicellular organisms such as Paramecium or
Tetrahymena, cilia are retained during division.
In recent years, interest in cilia as an important organelle resurfaced due to a growing list
of human diseases associated with ciliary defects, which cause a wide range of phenotypes that
include renal cysts, liver disease, cognitive impairment, retinal degeneration, obesity, skeletal
bone defects, laterality defects, and polydactyly (ALBEE and DUTCHER 2012). Abnormal
formation or function of these structures has been implicated as an underlying cause of many
syndromes and disorders that have traditionally been recognized as disjoint conditions. The
identification, characterization and implication of human ciliopathy disease genes have greatly
benefited from study in the model organism Chlamydomonas reinhardtii (PAZOUR et al. 2005).
Chlamydomonas is a unicellular, green alga that has two cilia/flagella that are morphologically
and biochemically similar to cilia found in humans. When environmental pH is lowered,
Chlamydomonas cells shed their cilia and ciliogenesis begins immediately once a neutral pH is
restored. The specific transcriptional induction of genes encoding many known cilia components
5 A.J. Albee et al.
during ciliogenesis have been widely reported and underscores one of the advantages of using
Chlamydomonas as a model organism to study cilia and ciliogenesis
Proteomic approaches using isolated Chlamydomonas cilia have generated an important
list of ciliary components albeit with the caveat that low abundance and membrane proteins are
not well represented (PAZOUR et al. 2005). This analysis has identified numerous structural
components, but components that regulate cilia assembly or function such as those which pre-
assemble dynein components in the cytoplasm were not identified (MITCHISON et al. 2012).
Genomic comparisons have also added to the list of ciliary components (AVIDOR-REISS et al.
2004; LI et al. 2004; MERCHANT et al. 2007; KWAN et al. 2010; HODGES et al. 2011). These
methods are complementary to proteomic methods, but they also generate an incomplete list
due to the fact that genes with conserved motifs such as kinases are discarded because they are
in a non-ciliated species. Many of the known ciliary components are upregulated during
ciliogenesis in Chlamydomonas. Previous methods to look at transcript levels focused on known
genes (LEFEBVRE and ROSENBAUM 1986), genes found by genomic comparisons (LI et al. 2004)
or proteomics (PAZOUR et al. 2005), or used an incomplete version of the Chlamydomonas
genome (STOLC et al. 2005). In addition, these studies focused on genes with increased fold
change at 30 min and this single time point may also yield an incomplete list of ciliogenesis
genes.
To generate a more complete picture of the genes required for ciliogenesis, we performed
RNA sequencing (RNA-seq) (NAGALAKSHMI et al. 2008) and mapped the reads to the v5.3.1
Chlamydomonas genome assembly. We compared transcript abundance at 3, 10, 30, and 60
min. during ciliogenesis with the pre-deflagellation transcript levels. We identified 1850 genes
with an increased fold change of at least 2.5 at one or more of the timepoints. From this set, we
analyzed 4 genes with homologs in humans using retinal pigment epithelial cells (hTERT-RPE1)

6 A.J. Albee et al.
expressing centrin-1/GFP and found that gene knockdown affects cilia, basal bodies/centrioles,
and two genes also play an unexpected role in cell cycle progression.
7 A.J. Albee et al.
Materials and Methods
Chlamydomonas sample preparation and RNAseq analysis
Chlamydomonas cell cultures were grown in 150mL Sager and Granick medium (R) to a
concentration of 7.2 x10⁶ cells per mL and 87.5% flagellated (LUX and DUTCHER 1991). Cells
were spun down in 50mL conical tubes in a Sorvall RT6000 for 10 minutes at 3500 RPM at
room temperature, and resuspended in 25mL 10 mM HEPES buffer. A 5mL aliquot was taken
and diluted to 50mL in R medium as “pre-treatment” sample. Acetic acid (0.5N) was added
dropwise to the remaining 20mL with constant stirring to reach a pH of 4.1 as measured by a
Corning pH meter 240 (Corning, NY) at 24°C. After 45 seconds, pH was restored to 7.1 with
0.5N KOH. Deflagellation was confirmed by phase microscopy. Deflagellated cells were diluted
10-fold into R medium at 22°C. Equal aliquots were taken at 0, 7, 27 and 57 minutes, spun in
Sorvall RT6000 for 3 minutes at 3500 RPM, bringing the total number of timepoints to five that
are labeled at pre deflagellation, 3, 10, 30, and 60 minutes.
RNA was extracted from Chlamydomonas cells with the Qiagen RNeasy Mini Kit (Qiagen,
Valencia, CA). Yield of total RNA from each sample was ~5 µg. After DNase I treatment, 10 µg
total RNA was used to make cDNA library with Illumina RNA-Seq Prep kit (Illumina, San Diego,
CA) and the cDNA libraries were sequenced on the Illumina Gene Sequencing Machine GAIIx.
The 36 base pair single end reads were aligned to the v5.3.1 Chlamydomonas genome using the
TopHat alignment software suite (TRAPNELL et al. 2009). Transcript abundance for 18,757 gene
models predicted on the v5.3.1 assembly were computed in FPKMs using the Cufflinks software
suite (TRAPNELL et al. 2010).
Expression profile clustering
The expression profile of each was determined for each gene from the ratio of its expression
(FPKM) at each time point to the expression in the pre-deflagellation sample. 1850 genes had
ratios of at least 2.5-fold for at least one time point and were used to identify common profile
8 A.J. Albee et al.
types using the method of (BRADY et al. 2007). Briefly, genes are first sorted by decreasing
variance of the profile and the top 75% of genes are then grouped by fuzzy k-means clustering. .
In contrast to standard k-means clustering, fuzzy k-means clustering assigns each profile a
probability of membership in each cluster and allows multi-cluster membership for a given
gene. Once initial membership is determined, the method determines the appropriate
membership probability cut-off such that the average gene is assigned to one cluster (BRADY et
al. 2007). Similarity between clusters is then determined by the Pearson correlations between
their mean profiles and a single-linkage hierarchical tree is generated. Branches of the tree with
Pearson correlation > 0.9 were merged into the final set of clusters and the mean profile for each
cluster determined. Individual genes were then assigned to clusters for which the Pearson
correlation between their profile and the mean profile of the cluster was >0.85, resulting in
nearly every gene being assigned to exactly one cluster (Brady et al 2007).
Gene knockdown experiments
Multiple constructs expressing shRNA (MOFFAT et al. 2006) (Table S1) were used for each gene
and delivered into cells using the lentiviral system in the presence of 10 µg/ml polybrene. The
medium containing the virus was incubated with hTERT-RPE1 cells expressing centrin-1/GFP (a
kind gift from Dr. Alexey Khodjakov, Wadsworth Center) for 2-6 hours. The cells were allowed
to recover and express the shRNA constructs overnight. The next day, 9 µg/ml puromycin was
added to the medium to select for cells that had integrated and expressed the construct.
Selection was maintained for 2 d. After 2 d, 1/5 of the cells were added to each of 2 wells of a 6-
well plate containing coverslips. RNA was isolated from the remaining cells and 1-3 µg RNA
used to make cDNA using SuperScript III (Life Technologies, Carlsbad, CA). Knockdown levels
were assessed by qRT-PCR using an iCycler (Bio-Rad, Hercules, CA). Values were normalized
using GAPDH as a control. Primers used for qRT-PCR analysis are listed in Table S2. The day
after the cells were passed onto coverslips, 10 µM 5-ethynyl-2-deoxyuridine (EdU; Life
9 A.J. Albee et al.
Technologies, Carlsbad, CA) was added to one of the coverslips. Twenty-four hours after EdU
addition, the cells were fixed and assessed for EdU uptake according to the manufacturer’s
instructions. The medium was changed on the other coverslip to serum-free medium. The cells
were maintained in serum-free medium for 72 hrs before the cells were fixed with 4%
paraformaldehyde and stained with an antibody against acetylated α-tubulin at 1:5000 (Sigma-
Aldrich, St. Louis, MO) and DAPI to visualize the cilia and DNA, respectively.
Plasmids
cDNA encoding GLOD4 (Accession BC008605), NXN (Accession BC009327), SPATA4
(Accession BC021731), and ZMYND10 (Accession BC033732) were ordered from Thermo
Scientific. cDNAs were cloned in-frame with YFP in pFLRu-MCS-YFP (FENG et al. 2010) using
PCR and In-Fusion HD cloning system (Clontech). For shRNAs that targeted the coding region,
site-directed PCR was performed on the genes to mutate the targeted DNA sequence with
synonymous changes. All genes were sequenced to ensure that they were in-frame with YFP and
contained only the introduced synonymous mutations.
Microscopy and Data Analysis
To assay EdU uptake, images were obtained with a PerkinElmer UltraVIEW VoX laser scanning
disk confocal system equipped with a Zeiss Axio Observer Z1 microscope, α-Plan-Apochromat
40x/1.2 water or 63x/1.46 oil DIC M27 objectives, and EMCCD camera. Images were acquired
with Volocity software. At least 100 nuclei (as judged by DAPI staining) were counted and the
number of nuclei that also had EdU staining was recorded as the percent of EdU uptake. The
control cells EdU uptake was set at 100% and the experimental samples were normalized to the
controls.
To assay cilia and basal bodies, images were acquired with 63x or 40X objective (described
above). For percent ciliation, the number of cilia present on at least 100 cells was recorded. The
10 A.J. Albee et al.
controls were set to 100% and the experimental samples were normalized to the controls. For
cilia length, the length of at least 100 cilia (as judged by acetylated α-tubulin staining) was
measured using Volocity software. For the number of basal bodies/centrioles per cell, the
number of cells containing 2, 3, 4, 5, or ≥6 basal bodies/centrioles (as judged by centrin-1/GFP
staining) were recorded in at least 100 cells and expressed as a percentage of the total number of
basal bodies/centrioles. For the distance between the basal bodies/centrioles, the distance
between mother and daughter basal bodies/centrioles (as judged by brightness of centrin-
1/GFP) was measured using Volocity software.
11 A.J. Albee et al.
Results
RNAseq generates a reliable transcriptome-wide ciliogenesis dataset
Illumina sequencing of mRNA isolated from pre-deflagellation, 3, 10, 30 and 60 minutes into
ciliogenesis produced a total of 99.4 million 36-mer single-end reads, for an average of 19.9
million reads per timepoint sample. This equates to 3.58Gb or a 32-fold coverage of the 112Mb
Chlamydomonas genome. TopHat (TRAPNELL et al. 2009) was used to compute expression
levels of 18507 Augustus gene models. Expression values calculated by Cufflinks are reported
in terms of fragments per kilobase transcribed per million reads mapped (FPKM)(TRAPNELL et
al. 2010). In five independent sets of RNAseq sequencing (pre-shock, 3, 10, 30 and 60 minutes),
96% of RNAseq reads align to the v5.3.1 Chlamydomonas genome assembly. v5.3.1 is the most
complete version of the Chlamydomonas genome and includes updated annotations,
predictions of alternate transcripts, and incorporates gene expression data. Aligning our
RNAseq data to the latest version of the genome gives a more accurate picture of upregulated
genes and includes transcripts not found in studies that used earlier versions of the genome
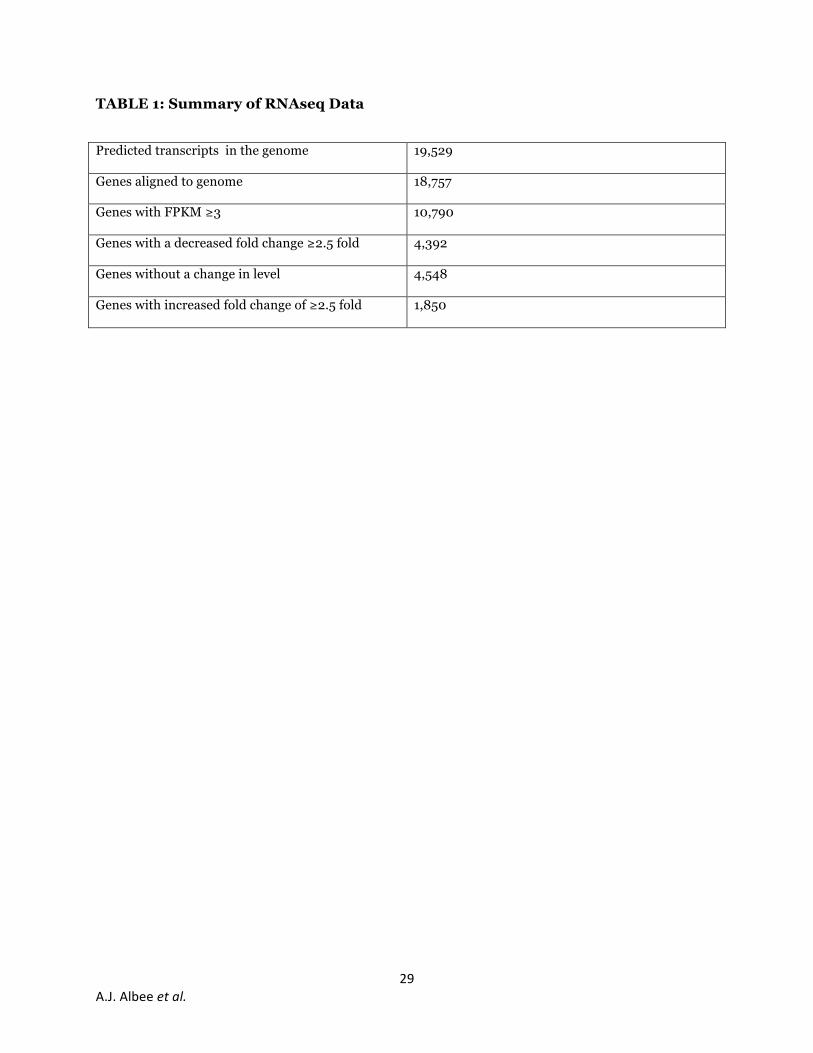
(PAZOUR et al. 2005; STOLC et al. 2005). For genes to be categorized as expressed, we required
that they have three FPKMs during at least one of our timepoints and we consider 10,813 genes
to be expressed. Any gene with a timepoint to pre-deflagellation expression value ratio of 2.5 or
greater is considered an upregulated gene and we found 1,850 predicted genes to be upregulated
at one or more timepoints (Table S3). We refer to these genes as upregulated even though we
recognize that these values are also a reflection of changes in transcription rate or message
stability. There are 4,392 genes downregulated, and 4,548 genes that do not alter their
expression level during ciliogenesis (Table 1). The observation that the cell downregulates
almost half of its genes during ciliogenesis highlights the commitment of the cell to assemble
cilia.
12 A.J. Albee et al.
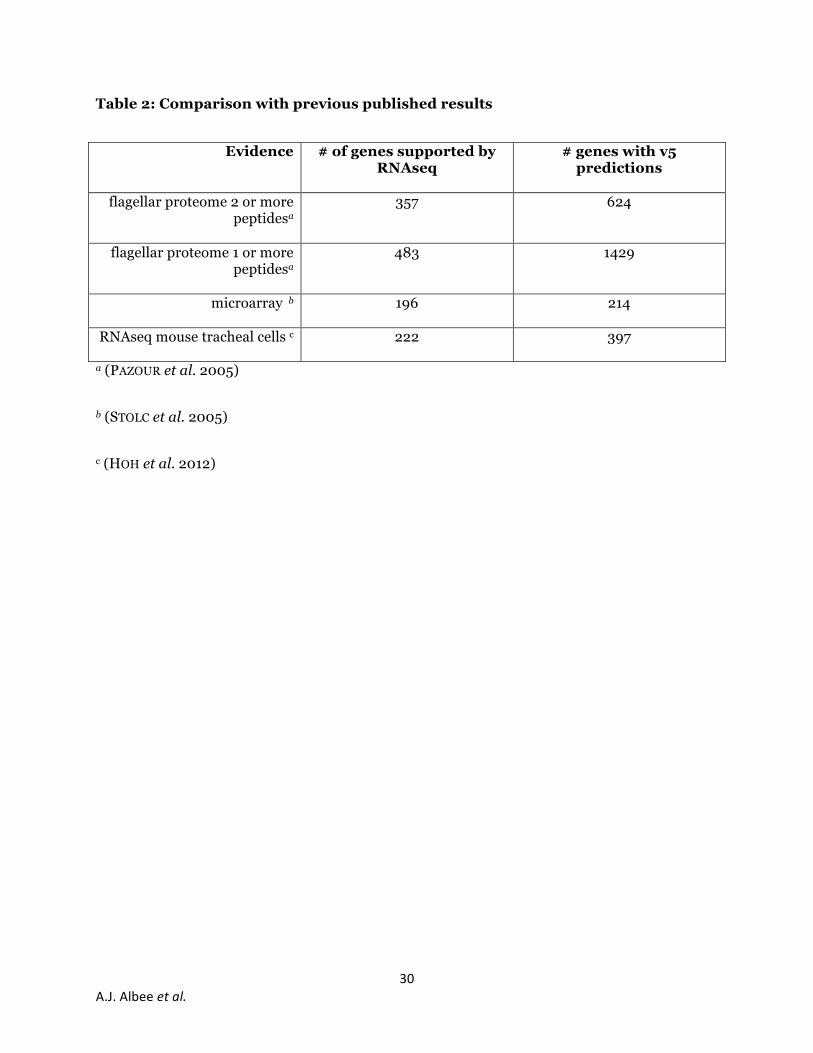
To evaluate the reliability of our data, we compared it to previous methods of identifying
ciliogenesis genes. The flagellar proteome contains 624 genes with v5.3.1 Chlamydomonas gene
predictions with two or more peptides (PAZOUR et al. 2005). Of these, 357 are found in our
RNAseq dataset (Table 2). Of the 1429 genes in the flagellar proteome identified by a single
peptide that have v5.3.1 gene predictions, 483 are found in our dataset. This suggests that not
all structural proteins in the flagella show upregulation. Stolc and colleagues used microarray
analysis to identify genes upregulated 30 min after deflagellation (STOLC et al. 2005), similar to
our method. Of the 214 genes with v5.3.1 gene matches that they identified, 196 genes are in our
RNAseq dataset (Table 2). Of the 18 genes identified by Stolc and colleagues not found in our
RNAseq data, 10 are heat shock proteins and may represent a stress response rather than a
ciliogenesis response. Five of genes have either no similarity to known genes or no predicted
domains. The remaining 3 genes include a DEAD-box helicase, a potential splicing factor, and a
membrane transporter. RNAseq of mouse tracheal epithelial cells (MTECs) undergoing
differentiation to become multiciliated, identified 649 genes (HOH et al. 2012) and of these 397
have homologs in Chlamydomonas. There are 222 genes (56%) with RNAseq support in both
Chlamydomonas and mouse. The MTECs generate 200-300 cilia per cell and must duplicate
their basal bodies in addition to generating cilia. Some of the genes identified in MTECs may be
due to basal body duplication or multiciliarity and may explain why only roughly half of those
genes are found in our data. This comparison shows that overall our data agrees with previously
published studies and reports many new genes that are likely to be involved in ciliogenesis.
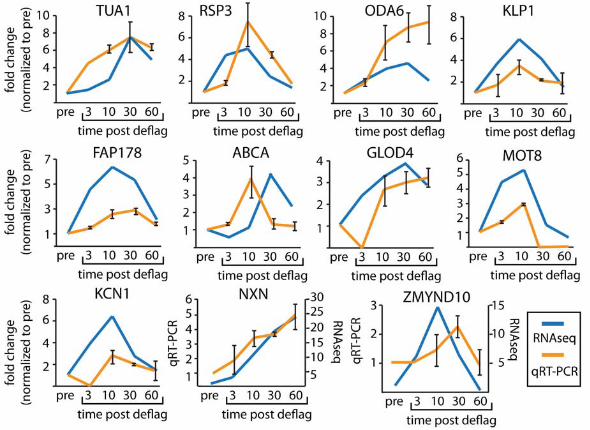
We further tested for genes upregulated in the RNAseq experiment by using qRT-PCR of
5 genes with previous support (α-tubulin (TUA1), radial spoke protein (RSP3), outer dynein arm
(ODA6), kinesin (KLP1), and flagellar protein 178 (FAP178)) and found agreement between our
qRT-PCR and RNAseq data (Figure 1). We also examined 6 genes with no previous ciliary
support (ABC transporter (ABCA), glyoxylase domain containing protein (GLOD4), lipid
13 A.J. Albee et al.
phosphatase (MOT8), potassium voltage gated channel (KCN1), nucleoredoxin (NXN), and
MYND domain containing protein (ZMYND10). The human gene names are given for ABCA,
GLOD4, NXN, and ZMYND10 as they do not have Chlamydomonas gene names. All other gene
names refer to the Chlamydomonas gene names. We find general agreement of upregulation
between RNAseq and qRT-PCR (Figure 1). Some of the differences may be due to the different
methods of normalization between RNAseq and qRT-PCR. RNAseq is normalized against
transcript levels across the transcriptome and qRT-PCR is normalized against a single control
gene (GAPDH). Absolute differences between RNAseq and qRT-PCR may reflect changes in a
single gene verses changes in the entire transcriptome.
Gene expression analysis reveals early ciliogenesis regulation programs
We examined the expression patterns during our time course to determine a set of principal
regulation profiles for genes that are upregulated during the first 60 minutes of cilia
regeneration in Chlamydomonas. We chose these to look at early timepoints based on previous
studies showing that many flagellar mRNAs begin to increase between 10-30 min and return to
pre-deflagellation levels 2-3 hrs post-deflagellation (SILFLOW and ROSENBAUM 1981; SCHLOSS et
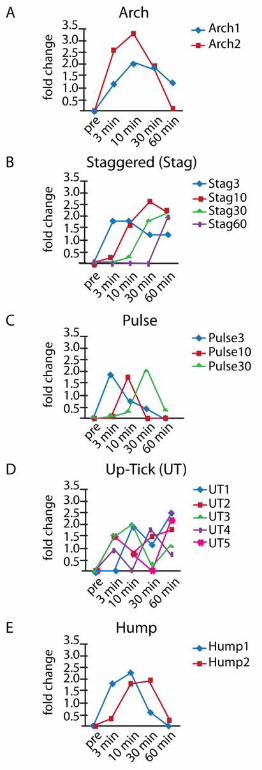
al. 1984). Sixteen principal regulation profiles are identified and then grouped into 5 main
patterns (Figure 2). The Arch group, containing patterns Arch1 and Arch2, shows increased
expression at 3 min, a peak expression at 10 min, and then decreasing expression at 30 and 60
min (Figure 2A). Arch2 is the most common pattern with 343 genes while Arch1 is the second
most common pattern with 336 genes (Table S3). Altogether, 37% of genes display the Arch
pattern. The Staggered (Stag) group consists of four profile patterns that show a burst of
expression at the 3, 10, 30, or 60 min timepoints with continued expression thereafter (Figure
2B). Stag30 is the third most common pattern with 226 genes, Stag10 is the fourth most with
189 genes, and Stag60 and Stag3 are the fifth and tenth most common with 165 and 49 genes,
respectively. Together the six patterns in the Arch and Staggered groups contain 71% of the
14 A.J. Albee et al.
upregulated genes. The remaining upregulated genes are categorized into three groups of profile
patterns: Hump, Pulse, and Up-Tick (UT) (Figures 2C-E) (number of genes in each pattern is
listed in Table S3). The Hump pattern shows significant upregulation over the course of two
timepoints, either at 3-minute and 10-minute (Hump1) or 10 min and 30 min (Hump2; Figure
2C). The Pulse pattern is similar to Hump patterns, but significant upregulation is sustained for
a single timepoint (Figure 2D). We observe a pulse pattern at each of the 3-minute (Pulse3), 10-
minute (Pulse10) or 30-minute (Pulse30) timepoints. We note that a fraction of upregulated
genes categorized as Stag60 may actually exhibit a 60-minute pulse if further data were
gathered at later timepoints. UT patterns have more complicated profiles with multiple peaks
and can be further sub-divided by the timepoints of their expression peaks (Figure 2D).
We then examined structural ciliogenesis genes to determine if these genes may show
similar patterns of expression. Of the IFT genes and associated motors, 90% of the genes fell
into the Arch category and 10% of the remaining genes are in the Stag group (Table S4),
suggesting that most genes involved with IFT display an Arch pattern of expression. Axonemal
dyneins display more varied expression patterns but still show an increase of genes with an Arch
expression pattern, with 60% of genes in Arch, 27% in Stag, 8% in Pulse, and 5% in Hump
(Table S4). Radial spoke genes and central pair genes also show an increase in Arch expression
pattern over all genes identified at 78% and 84%, respectively (Table S4). Overall, structural
ciliogenesis genes are more likely to have Arch expression patterns.
RNAseq identifies genes involved in ciliogenesis
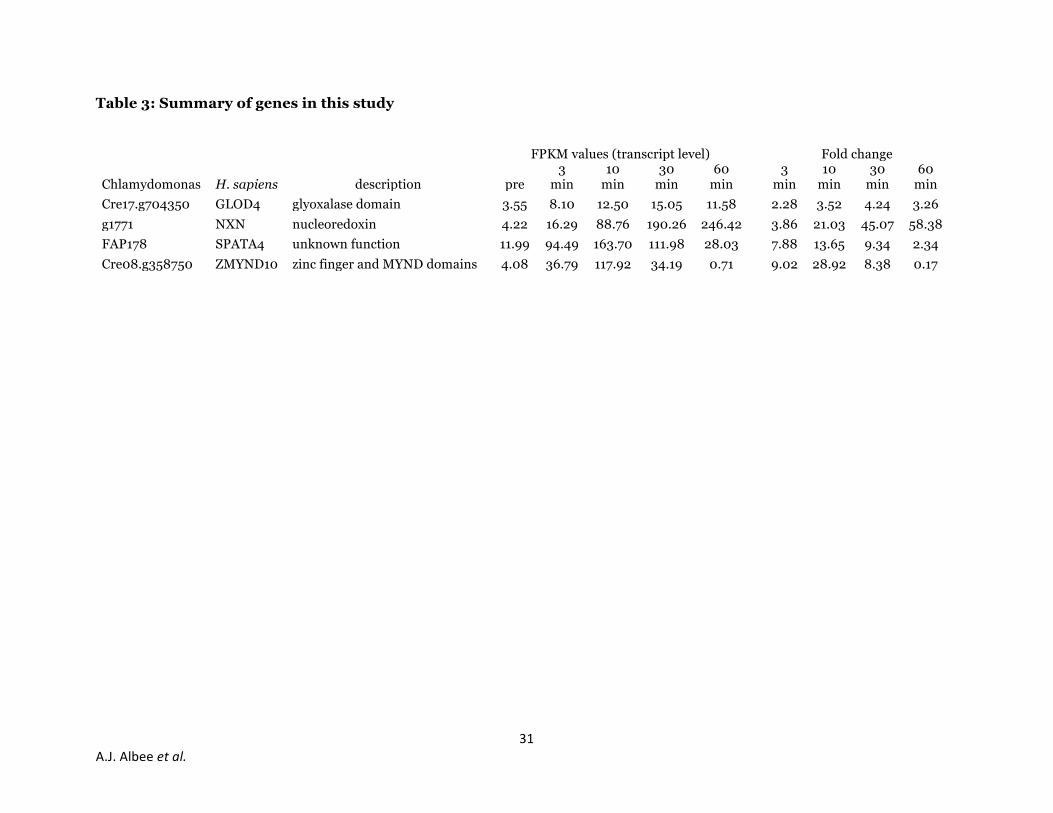
We chose 4 genes without prior associations with ciliogenesis that were upregulated by RNAseq
in Chlamydomonas and also had human homologs (Table 3) for further analysis in immortalized
human retinal pigment epithelial cells (hTERT-RPE1) expressing centrin-1/GFP. The RPE cells
assemble a primary cilium upon serum starvation. Each gene was knocked-down by lentiviral
shRNAs and selected with puromycin to enrich for cell populations that received the shRNAs
15 A.J. Albee et al.
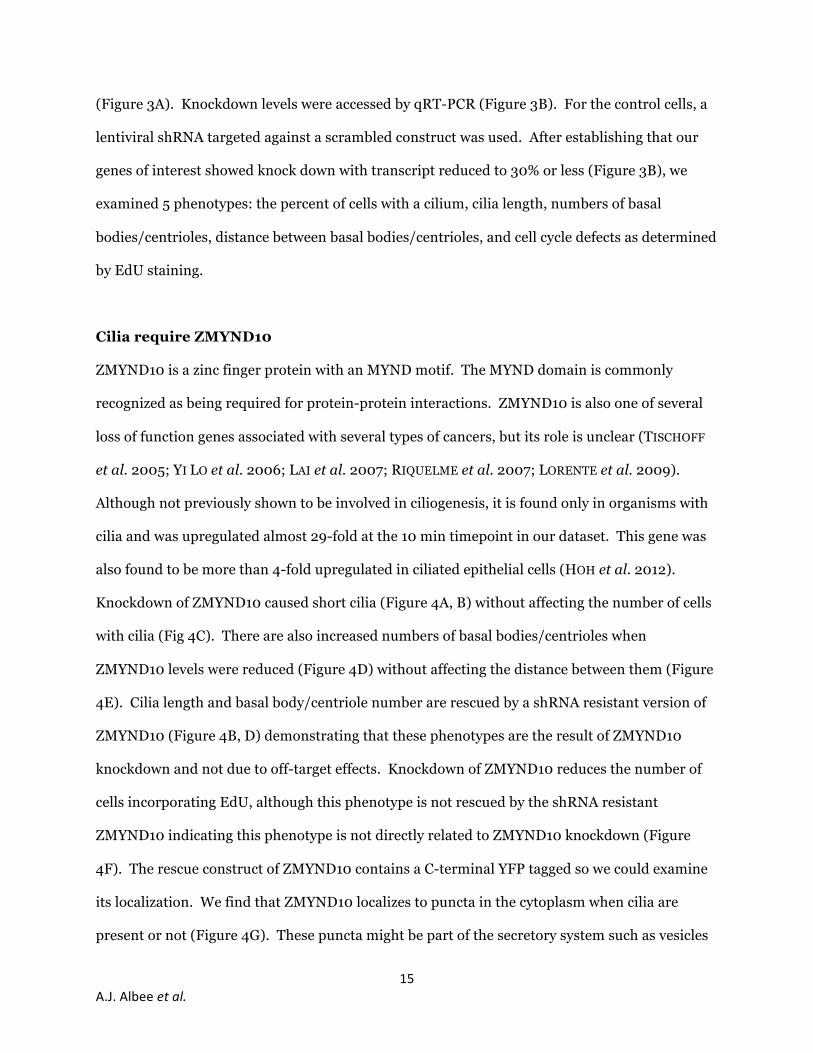
(Figure 3A). Knockdown levels were accessed by qRT-PCR (Figure 3B). For the control cells, a
lentiviral shRNA targeted against a scrambled construct was used. After establishing that our
genes of interest showed knock down with transcript reduced to 30% or less (Figure 3B), we
examined 5 phenotypes: the percent of cells with a cilium, cilia length, numbers of basal
bodies/centrioles, distance between basal bodies/centrioles, and cell cycle defects as determined
by EdU staining.
Cilia require ZMYND10
ZMYND10 is a zinc finger protein with an MYND motif. The MYND domain is commonly
recognized as being required for protein-protein interactions. ZMYND10 is also one of several
loss of function genes associated with several types of cancers, but its role is unclear (TISCHOFF
et al. 2005; YI LO et al. 2006; LAI et al. 2007; RIQUELME et al. 2007; LORENTE et al. 2009).
Although not previously shown to be involved in ciliogenesis, it is found only in organisms with
cilia and was upregulated almost 29-fold at the 10 min timepoint in our dataset. This gene was
also found to be more than 4-fold upregulated in ciliated epithelial cells (HOH et al. 2012).
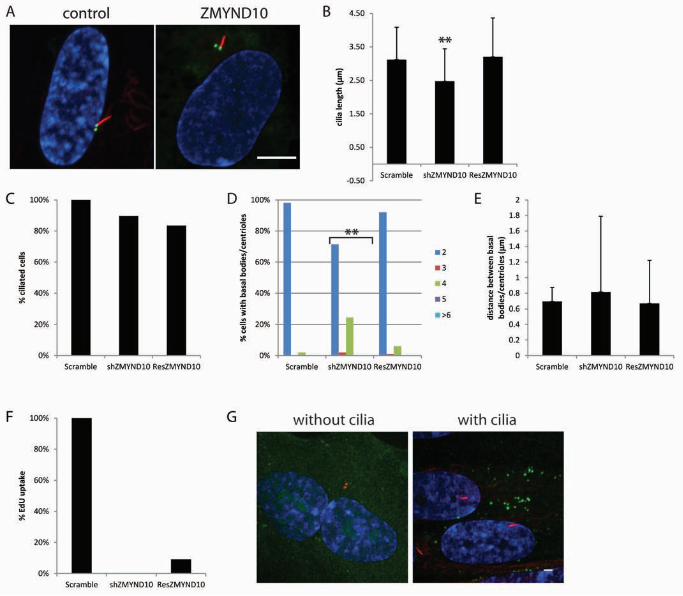
Knockdown of ZMYND10 caused short cilia (Figure 4A, B) without affecting the number of cells
with cilia (Fig 4C). There are also increased numbers of basal bodies/centrioles when
ZMYND10 levels were reduced (Figure 4D) without affecting the distance between them (Figure
4E). Cilia length and basal body/centriole number are rescued by a shRNA resistant version of
ZMYND10 (Figure 4B, D) demonstrating that these phenotypes are the result of ZMYND10
knockdown and not due to off-target effects. Knockdown of ZMYND10 reduces the number of
cells incorporating EdU, although this phenotype is not rescued by the shRNA resistant
ZMYND10 indicating this phenotype is not directly related to ZMYND10 knockdown (Figure
4F). The rescue construct of ZMYND10 contains a C-terminal YFP tagged so we could examine
its localization. We find that ZMYND10 localizes to puncta in the cytoplasm when cilia are
present or not (Figure 4G). These puncta might be part of the secretory system such as vesicles
16 A.J. Albee et al.
budding from the Golgi as has been shown for other proteins with ciliary phenotypes (FOLLIT et
al. 2006; KNODLER et al. 2010; DONALDSON and JACKSON 2011). Alternatively, they may be part
of a preassembly complex for axonemal components (MITCHISON et al. 2012).
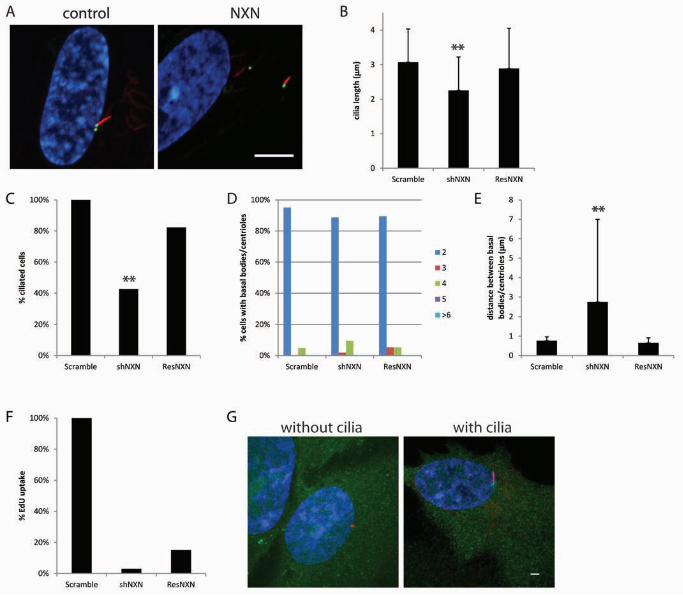
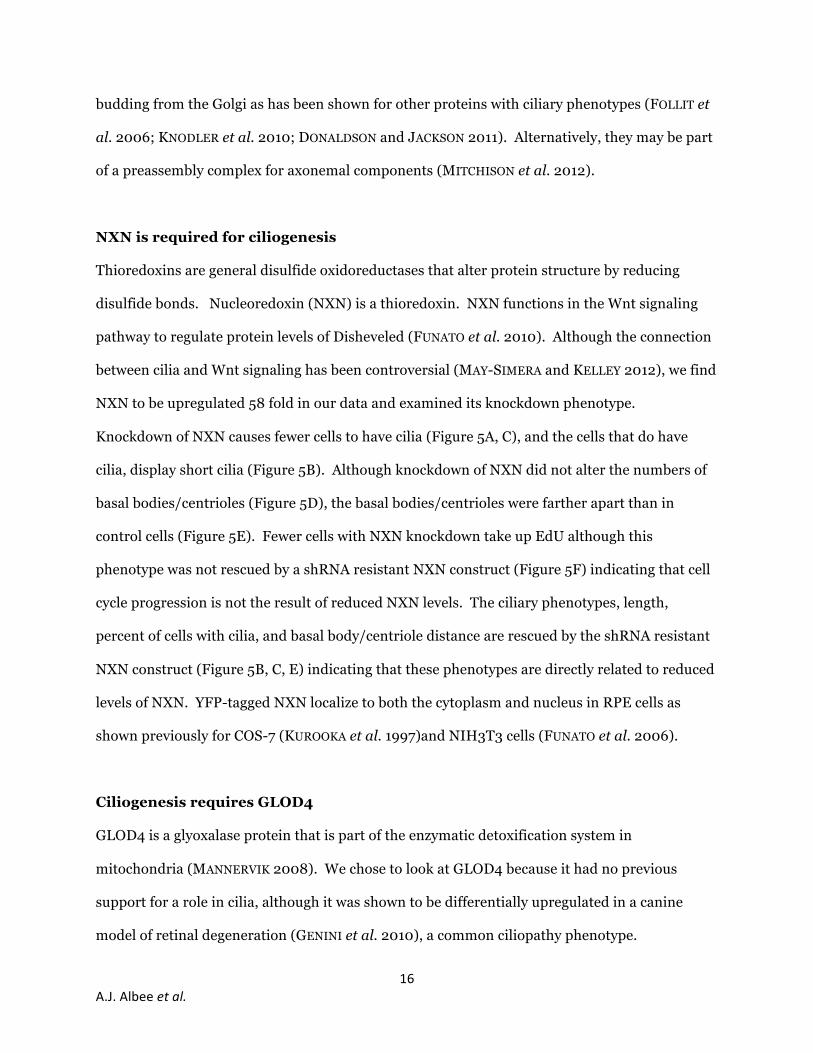
NXN is required for ciliogenesis
Thioredoxins are general disulfide oxidoreductases that alter protein structure by reducing
disulfide bonds. Nucleoredoxin (NXN) is a thioredoxin. NXN functions in the Wnt signaling
pathway to regulate protein levels of Disheveled (FUNATO et al. 2010). Although the connection
between cilia and Wnt signaling has been controversial (MAY-SIMERA and KELLEY 2012), we find
NXN to be upregulated 58 fold in our data and examined its knockdown phenotype.
Knockdown of NXN causes fewer cells to have cilia (Figure 5A, C), and the cells that do have
cilia, display short cilia (Figure 5B). Although knockdown of NXN did not alter the numbers of
basal bodies/centrioles (Figure 5D), the basal bodies/centrioles were farther apart than in
control cells (Figure 5E). Fewer cells with NXN knockdown take up EdU although this
phenotype was not rescued by a shRNA resistant NXN construct (Figure 5F) indicating that cell
cycle progression is not the result of reduced NXN levels. The ciliary phenotypes, length,
percent of cells with cilia, and basal body/centriole distance are rescued by the shRNA resistant
NXN construct (Figure 5B, C, E) indicating that these phenotypes are directly related to reduced
levels of NXN. YFP-tagged NXN localize to both the cytoplasm and nucleus in RPE cells as
shown previously for COS-7 (KUROOKA et al. 1997)and NIH3T3 cells (FUNATO et al. 2006).
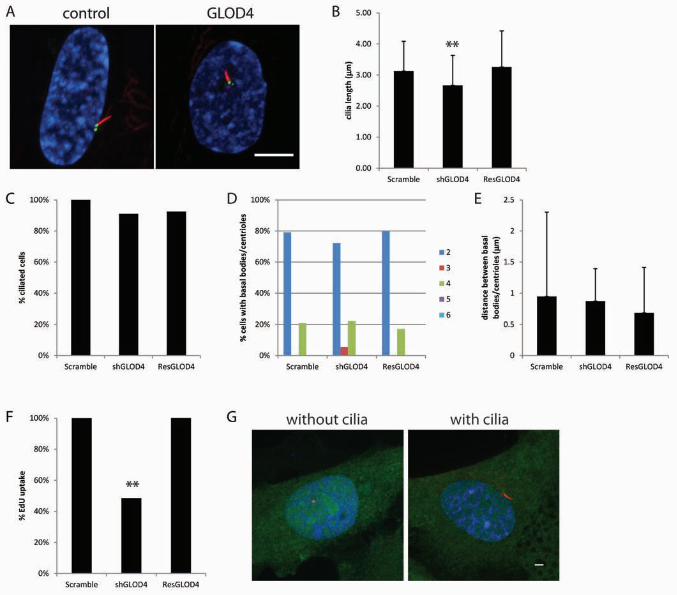
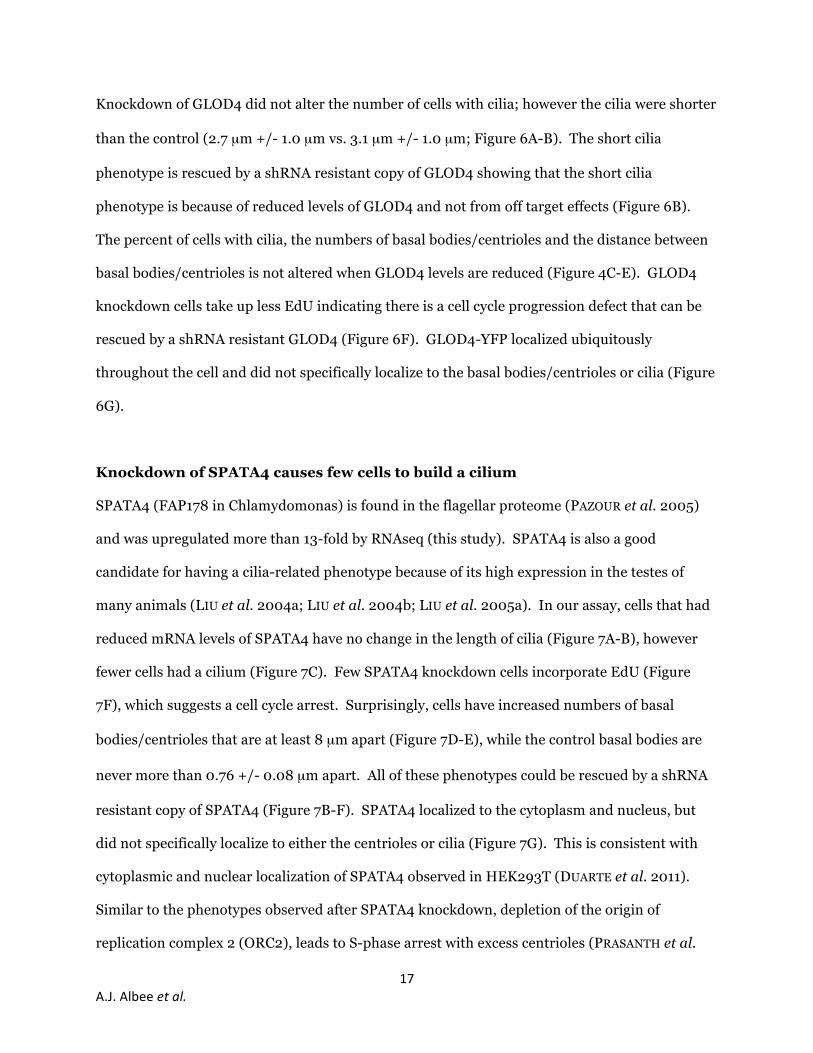
Ciliogenesis requires GLOD4
GLOD4 is a glyoxalase protein that is part of the enzymatic detoxification system in
mitochondria (MANNERVIK 2008). We chose to look at GLOD4 because it had no previous
support for a role in cilia, although it was shown to be differentially upregulated in a canine
model of retinal degeneration (GENINI et al. 2010), a common ciliopathy phenotype.
17 A.J. Albee et al.
Knockdown of GLOD4 did not alter the number of cells with cilia; however the cilia were shorter
than the control (2.7 µm +/- 1.0 µm vs. 3.1 µm +/- 1.0 µm; Figure 6A-B). The short cilia
phenotype is rescued by a shRNA resistant copy of GLOD4 showing that the short cilia
phenotype is because of reduced levels of GLOD4 and not from off target effects (Figure 6B).
The percent of cells with cilia, the numbers of basal bodies/centrioles and the distance between
basal bodies/centrioles is not altered when GLOD4 levels are reduced (Figure 4C-E). GLOD4
knockdown cells take up less EdU indicating there is a cell cycle progression defect that can be
rescued by a shRNA resistant GLOD4 (Figure 6F). GLOD4-YFP localized ubiquitously
throughout the cell and did not specifically localize to the basal bodies/centrioles or cilia (Figure
6G).
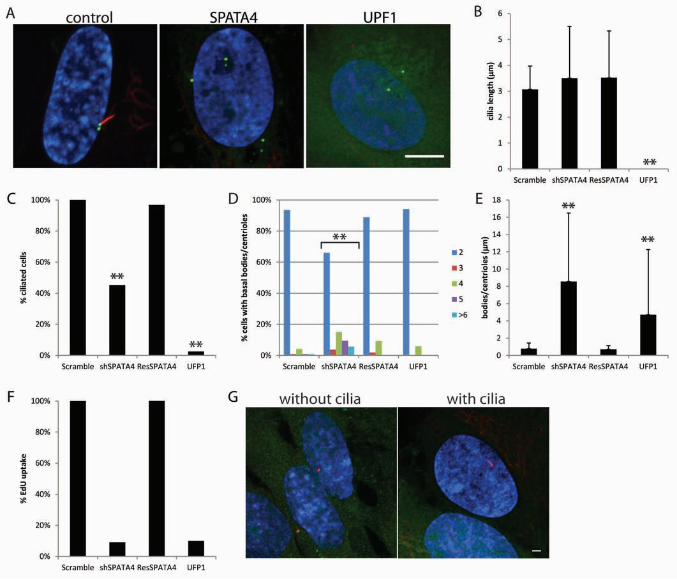
Knockdown of SPATA4 causes few cells to build a cilium
SPATA4 (FAP178 in Chlamydomonas) is found in the flagellar proteome (PAZOUR et al. 2005)
and was upregulated more than 13-fold by RNAseq (this study). SPATA4 is also a good
candidate for having a cilia-related phenotype because of its high expression in the testes of
many animals (LIU et al. 2004a; LIU et al. 2004b; LIU et al. 2005a). In our assay, cells that had
reduced mRNA levels of SPATA4 have no change in the length of cilia (Figure 7A-B), however
fewer cells had a cilium (Figure 7C). Few SPATA4 knockdown cells incorporate EdU (Figure
7F), which suggests a cell cycle arrest. Surprisingly, cells have increased numbers of basal
bodies/centrioles that are at least 8 µm apart (Figure 7D-E), while the control basal bodies are
never more than 0.76 +/- 0.08 µm apart. All of these phenotypes could be rescued by a shRNA
resistant copy of SPATA4 (Figure 7B-F). SPATA4 localized to the cytoplasm and nucleus, but
did not specifically localize to either the centrioles or cilia (Figure 7G). This is consistent with
cytoplasmic and nuclear localization of SPATA4 observed in HEK293T (DUARTE et al. 2011).
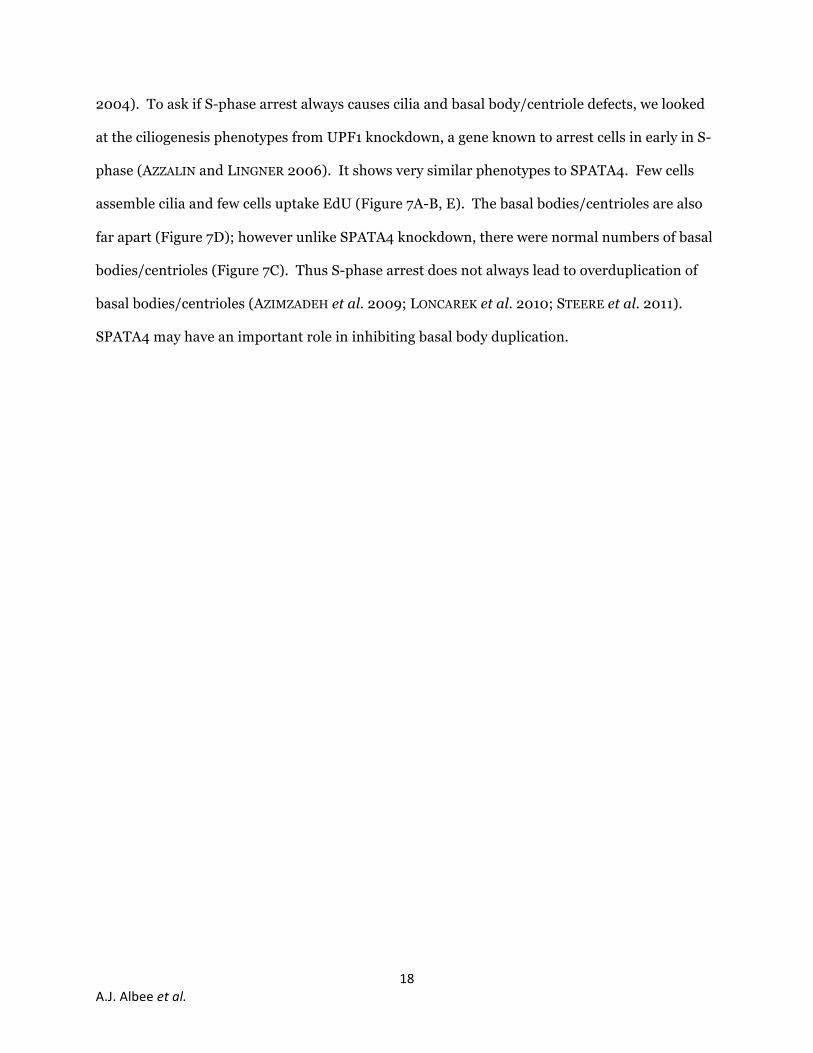
Similar to the phenotypes observed after SPATA4 knockdown, depletion of the origin of
replication complex 2 (ORC2), leads to S-phase arrest with excess centrioles (PRASANTH et al.
18 A.J. Albee et al.
2004). To ask if S-phase arrest always causes cilia and basal body/centriole defects, we looked
at the ciliogenesis phenotypes from UPF1 knockdown, a gene known to arrest cells in early in S-
phase (AZZALIN and LINGNER 2006). It shows very similar phenotypes to SPATA4. Few cells
assemble cilia and few cells uptake EdU (Figure 7A-B, E). The basal bodies/centrioles are also
far apart (Figure 7D); however unlike SPATA4 knockdown, there were normal numbers of basal
bodies/centrioles (Figure 7C). Thus S-phase arrest does not always lead to overduplication of
basal bodies/centrioles (AZIMZADEH et al. 2009; LONCAREK et al. 2010; STEERE et al. 2011).
SPATA4 may have an important role in inhibiting basal body duplication.
19 A.J. Albee et al.
Discussion
We used whole transcriptome analysis to identify 1850 genes upregulated at least 2.5 fold during
ciliogenesis in Chlamydomonas. Many genes required for ciliogenesis are upregulated including
all 16 IFT Complex B genes, 6 IFT Complex A genes, 3 anterograde motor and associated
proteins and 4 retrograde motor and associated proteins (Table S4). All 41 proteins, all 18 radial
spoke proteins, and 13 out of 15 central pair proteins had their transcripts upregulated (Table
S4). Additional genes that have been implicated in cilia assembly and function are found in our
RNAseq data. These include MORN1 (FAP266) that has been implicated in basal body assembly
in Toxoplasma (LORESTANI et al. 2010), PIH1D1, which is part of the prefoldin complex and
interacting proteins Reptin and Pontin have been implicated in cystic kidney disease in
zebrafish (SUN et al. 2004) and in Chlamydomonas. Tubby is linked to adult onset obesity
(Coleman and Eicher, 1990) and retinal degeneration (Ohlemiller et al., 1995) in mice and the
Tubby like proteins (TULP1-4) are also implicated or directly involved in cilia related processes
(MUKHOPADHYAY and JACKSON 2011). We find evidence of upregulation for Chlamydomonas
genes with human homologs that were previously predicted to be involved in cilia by
comparative genomics studies, but for which there existed neither qRT-PCR nor proteomic
evidence. Our data identifies human genes with Chlamydomonas homologs that are
upregulated during ciliogenesis. This set includes eight genes that have existing evidence of their
involvement in cilia or ciliogenesis (KAT, KIF21A, TXNDC3, DYNLT1, TUBB, ACT). There are
other genes with existing non-ciliopathy disease genes or mutant phenotypes to which our data
assigns novel cilia annotations, thereby suggesting some cilia involvement in new diseases or
mutant phenotypes, including COACH syndrome, Noonan syndrome, cleft lip and palate gene,
polycystic ovary syndrome and perinatal lethality in mice. The largest category in the remainder
of the set contains solute carriers/transporters, followed by Golgi/membrane trafficking
proteins, chaperonins, and kinases and phosphatases. The remainder of the protein annotation
groups includes proteins that are involved in or that are associated with mitochondria, lipid and
20 A.J. Albee et al.
inositol metabolism, cell cycle, ubiquitin, proteins that act on disulfide bonds and DNA repair.
These results suggest new areas where there may be cilia involvement and indicate the potential
of using Chlamydomonas as a model organism for the study of these diseases and phenotypes.
We observed the LBR gene to be upregulated in our dataset. In Chlamydomonas, the LBR
homolog is involved in sterol biosynthesis. Sterols play crucial roles in membranes where they
regulate membrane permeability and fluidity by interactions with other lipids and proteins.
Sterols are frequently enriched in detergent-resistant membranes, which organize molecules
involved in specialized signaling processes that include Agg2 and Agg3 in Chlamydomonas.
Chlamydomonas synthesizes ergosterol rather than cholesterol as in animal cells. We looked at
other genes in the ergosterol pathway to ask if they are upregulated after deflagellation. This
pathway uses the mevalonate independent 2-C-methyl-D-erythritol 4-phosphate (MEP)
pathway to synthesize delta-3-isopentenyl-pyrophosphate (IPP) as the start of the isoprenoid
pathway. Chlamydomonas has homologs of 11 of the 12 genes involved in ergosterol
biosynthesis in yeast. It may have additional genes that are needed for a sterol C24-
methylation-C25-reduction (�(25(27))-olefin) step not observed in yeast (MILLER et al. 2012).
None of the genes in the MEP pathway are upregulated while 9 of the 11 genes in the IPP
pathway are upregulated more than 2 fold (Table S4). These results implicate sterols as being
important for ciliogenesis.
We analyzed the function of 4 human homologs and found knockdown of all 4 genes cause
ciliogenesis defects in human retinal pigmented epithelial cells, which indicates that
upregulation during ciliogenesis in Chlamydomonas is an excellent way to identify genes that
are conserved in ciliogenesis. To our surprise, knockdown of 2 genes in RPE cells also had
profound effects on the cell cycle.
21 A.J. Albee et al.
We expected to find genes that produced cells with few cilia or short cilia. This is a common
phenotype seen with other genes with ciliary functions including the IFTs, kinesins and dyneins.
As we expected, knockdown of ZMYND10, NXN, and GLOD4 affected cilia formation and
showed short cilia. Previous work suggests a wide range of functions for these genes. The
expression of ZMYND10 is downregulated in cancers and may be a tumor suppressor (LIU et al.
2003; SHAO et al. 2010). Its expression pattern in ciliated tissues suggested it may be involved
in ciliogenesis (MCCLINTOCK et al. 2008), but our data is the first to demonstrate that it has a
role in ciliogenesis and affects cilia length and cell cycle progression. NXN is a nucleoredoxin
that inhibits Wnt/β-catenin signaling (FUNATO et al. 2006) and inhibits planar cell polarity
(FUNATO et al. 2008). Disruption of Wnt signaling may affect cilia so it is possible that ciliary
phenotypes seen in NXN knockdown cells are the result of a defect in this pathway. Unlike
other Wnt pathway mutants however, NXN also leads to disengagement of the basal
bodies/centrioles and may play a novel role or multiple roles in ciliogenesis. GLOD4 contains a
glyoxalase domain and thus may function as an enzyme. It was previously shown to be
downregulated in a canine model of retinitis pigmentosa (GENINI et al. 2010), but we are the
first to show a ciliary and cell cycle phenotype after knockdown.
SPATA4 is upregulated during spermatogenesis in several organisms (LIU et al. 2004a; LIU et al.
2005a; LIU et al. 2005b; XIE et al. 2007) although its role in spermatogenesis is not clear. From
our data, SPATA4 knockdown had no effect on cilia length, but fewer cells were able to build a
cilium. Knockdown of SPATA4 also leads to an arrest of cells in S-phase. Basal bodies must be
released from cilia to become centrioles and initiate duplication in S phase. By examining cells
that cannot progress through S-phase we highlight the lack of cilia in S phase cells. It may be
that SPATA4 is required for cell cycle progression during spermatogenesis.
22 A.J. Albee et al.
All of our ciliary phenotypes were rescued by shRNA resistant copies of our genes. The rescue
constructs also had C-terminal YFP tags to allow for localization of the proteins. It is surprising
that none of our genes localized to the basal bodies or cilia. ZMYND10 had the most distinctive
localization of cytoplasmic puncta, which may suggest its involvement in ciliary protein
trafficking like has been shown for other proteins (FOLLIT et al. 2006; KNODLER et al. 2010;
DONALDSON and JACKSON 2011). NXN, GLOD4, and SPATA4 did not localize to any distinctive
cellular structure. This lack of localization has been shown previously for NXN (KUROOKA et al.
1997; FUNATO et al. 2006) and SPATA4 (DUARTE et al. 2011). The shRNA resistant copies of
these genes are functional because they rescue the ciliary phenotypes and these genes are clearly
involved in ciliogenesis because upon knockdown the cells have fewer cilia and/or short cilia. It
is possible that these proteins are found in cilia or basal bodies at a specific part of the cell cycle.
It is also possible that they may be cytoplasmic assembly components like DNAAF3 (MITCHISON
et al. 2012). In a recent paper looking at proteomics in primary cilia (ISHIKAWA et al. 2012), the
authors generated GFP and FLAG tagged constructs of 18 of identified hits and found only 8
that localize to primary cilia. The authors interpreted this such that 10 were not bona fide ciliary
components, but our data suggest that more genes than previously thought that are involved in
ciliogenesis, but do not localize to the cilium.
It has been known for 3 decades that cilia are generally found on cells that have exited the cell
cycle, but only more recently has it been appreciated that genes involved in ciliogenesis also
have roles in cell cycle progression. Our data adds to the list of known genes involved in
ciliogenesis and cell cycle progression. It is not clear what signals control cilia absorption and
reentry of the cell cycle. Cilium absorption requires HEF1, AuroraA, and HDAC6, although
these genes appear to function independent of cell cycle progression (PUGACHEVA et al. 2007).
The interaction between HEF1 and AuroraA activates HDAC6 to deacetylate the acetylated
microtubules in the cilium, which causes them to become unstable and allows resorption to
23 A.J. Albee et al.
occur (PUGACHEVA et al. 2007). NDE1 and TCTEX-1 are also required for the transition from G0
to mitosis and their depletion causes cell cycle arrest (KIM et al. 2011; LI et al. 2011). Depletion
of NDE1 arrests cells leading to longer cilia (KIM et al. 2011). Furthermore it was found that
cells express low levels of NDE1 in G0 where it localizes to the mother centriole, but higher levels
in mitosis. Overexpression of NDE1 results in shorter cilia, which suggests that NDE1 regulates
ciliary length (KIM et al. 2011). Like, NDE1, TCTEX-1, a dynein light chain, is also needed for
cell cycle re-entry in a cilia-dependent manner (LI et al. 2011) although there is some
discrepancy as to whether it also regulates ciliary length (LI et al. 2011; PALMER et al. 2011).
Another gene involved in ciliary absorption is the gene PIFO that is expressed in the
mouse embryonic node (KINZEL et al. 2010). Two human patients haploinsufficient for PIFO
show cilia defects, centrosome overduplication, and mitotic defects stemming from uncoupling
of cilia resorption and cell cycle progression. The basal body fails to detach from the cilium
although centrosome duplication still occurs causing severe mitotic defects including both
mitotic spindles and cilia in the same cells (KINZEL et al. 2010). Interestingly, PIFO appears to
only be conserved in vertebrates, thus it may not be part of a conserved mechanism for cilia
resorption. Our results show SPATA4 has similar phenotypes to PIFO mutant cells including
centrosome over-duplication and cell cycle arrest. Since we only examined knockdown
phenotypes of genes that were conserved between Chlamydomonas and humans, GLOD4 and
SPATA4 may be part of a conserved mechanism of cilia resorption and warrant further study.
Whole genome transcriptome analysis gives us insight into entire pathways required for
ciliogenesis. The cilia assembly pathway is tightly linked to the cell cycle in mammalian cells as
only cells in G0/G1 have cilia. Most of the genes we tested have both cilia and cell cycle effects
that support the idea that these two cellular processes are intimately involved. Further analysis
of additional genes will help to provide more mechanistic understanding the coordination of
these pathways.
24 A.J. Albee et al.
Acknowledgements
We gratefully acknowledge the gift of hTERT-RPE1 expressing centrin-1/GFP cells from Alexey
Khodjakov at Wadsworth Center, Albany, NY. We thank Justin Morgan for assistance with the
analysis. The lentivirus collection is supported by funds from the Children’s Discovery Institute
at Washington University. This work was supported from the National Institutes of Health
(GM32834 to SKD and HG000249 to GDS). AJA is a Ruth L. Kirschstein-NRSA fellow
(GM093598).
25 A.J. Albee et al.
Figure Legends
FIGURE 1. Expression profiles during ciliogenesis are similar between RNAseq
and qRT-PCR. Genes with previous support for involvement in ciliogenesis (TUA1, RSP3,
ODA6, KLP1, and FAP178) and new genes (ABCA, GLOD4, MOT8, KCN1, NXN, and ZMYND10)
were examined for the upregulation pattern by RNAseq and qRT-PCR. Error bars on qRTPCR
data are the average of two independent experiments. Expression profiles generally agree
between the two methods.
FIGURE 2. Profile clustering identifies 16 principal upregulation expression
profiles organized into five pattern groups. (A) The Arch pattern shows increased
expression at 3 min, a peak expression at 10 min, and then decreasing expression at 30 and 60
min. This profile pattern group accounts for 37% of upregulated gene profiles. The first and
second most common principal expression profiles are found with this pattern (Arch1 (N=336;
18%) and Arch 2 (N=343; 19%), respectively). The Arch1 pattern shows expression that peaks at
10 or 30 min, but is still up at 60 min. The Arch2 pattern is similar to Arch1 except that the
genes are not upregulated at the 60 min timepoint. (B) The Staggered (Stag) pattern shows
genes with a burst of expression at the 3, 10, 30, or 60 min timepoints. The third, fourth, fifth
and tenth most common expression profiles are found with this pattern (Stag30 (N=226; 12%),
Stag10 (N=189; 10%), Stag60 (N=165; 9%), and Stag3 (N=49; 3%). (C) The Pulse pattern shows
upregulation at a single timepoint and accounts for 11% (N=196) of the upregulated genes. (D)
The Up-Tick (UT) pattern describes genes that show increased expression at one timepoint
followed by down-regulation at another timepoint followed by upregulation at a third timepoint.
Up-Tick patterns make up 3% (N=51) of upregulated genes and can be further sub-divided by
the timepoint of the up-tick. (E) Hump patterns make up 16% (N=290) and are profiles that are
pulse-like, but significant upregulation is sustained over two consecutive timepoints. Of the
26 A.J. Albee et al.
remaining fraction, 0.5% (N=9) show profiles that are outliers in that their profiles are not
adequately similar to any principal expression profile found in this analysis.
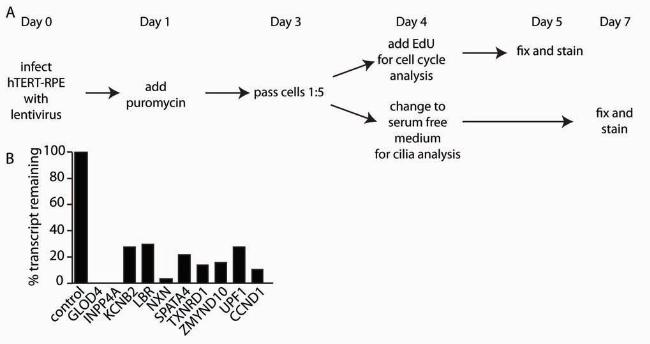
FIGURE 3. Knockdown by shRNA as a method to validate our dataset. (A) On Day 0,
hTERT-RPE1 expressing centrin/GFP were infected with lentivirus containing shRNAs. The
next day, puromycin was added to select for cells that incorporated the shRNAs. Following
selection (Day 3), cells were passed 1:5 and plated onto coverslips. On Day 4, one set of
coverslips received EdU and the other set had their medium changed to serum-free to induce
cilia growth. After 24 hrs. in EdU (Day 5), the coverslips were fixed and stained. After 3 days in
serum-free medium (Day 7), the coverslips were fixed and stained for acetylated α-tubulin. (B)
The amount of transcript remaining for each gene normalized to GAPDH. Although we used 4-5
shRNAs per gene, only the construct with the greatest degree of knockdown is shown here.
FIGURE 4. Depletion ZMYND10 causes short cilia. (A) Micrograph of control cells
showing normal cilia (left panel) and a micrograph of a representative image from ZMYND10
knockdown. Scale bar is 10 µm. Blue, DNA; Red, acetylated α-tubulin; Green, centrin/GFP. (B)
Graph showing cilia length after gene knockdown. Error bars represent standard deviation from
at least 100 cilia per gene knockdown. Significance was determined using a student’s t test with
two tails and unequal variance. **p<0.001. (C) Graph showing the percent ciliated cells
normalized to the control. * fewer cilia (D) Graph showing the percent of cells with 2, 3, 4, 5, or
≥6 basal bodies/centrioles. Indicates gene knockdowns that have increased numbers of
basal bodies/centrioles compared to the control. (E) Graph showing the distance between the
mother and daughter basal bodies/centrioles. Error bars represent standard deviation from at
least 100 cells per gene knockdown. Significance was determined using a student’s t test with
two tails and unequal variance. ** p<0.001 (F) The graph shows the percent of cells that up
took EdU normalized to the control. (G) Examples of localization of ZMYND10 in cells with and
without cilia. Green, gene-YFP; Red, centrioles left panel, cilia right panel; Blue, DNA.
27 A.J. Albee et al.
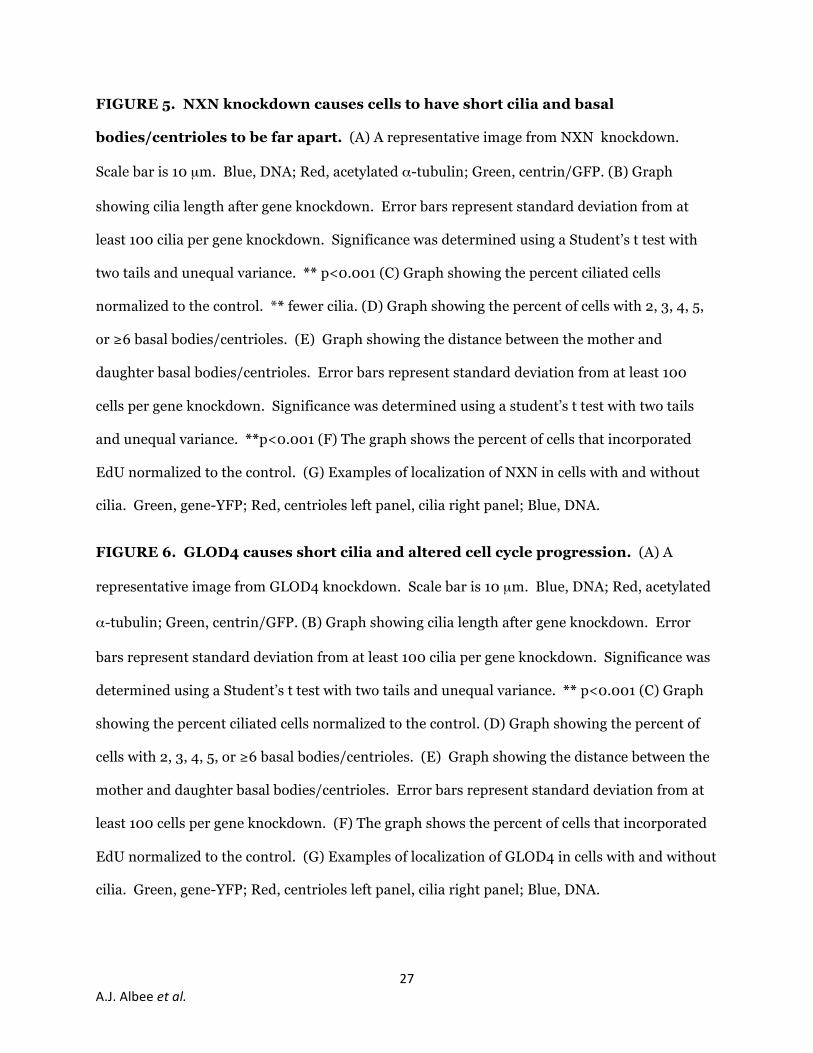
FIGURE 5. NXN knockdown causes cells to have short cilia and basal
bodies/centrioles to be far apart. (A) A representative image from NXN knockdown.
Scale bar is 10 µm. Blue, DNA; Red, acetylated α-tubulin; Green, centrin/GFP. (B) Graph
showing cilia length after gene knockdown. Error bars represent standard deviation from at
least 100 cilia per gene knockdown. Significance was determined using a Student’s t test with
two tails and unequal variance. ** p<0.001 (C) Graph showing the percent ciliated cells
normalized to the control. ** fewer cilia. (D) Graph showing the percent of cells with 2, 3, 4, 5,
or ≥6 basal bodies/centrioles. (E) Graph showing the distance between the mother and
daughter basal bodies/centrioles. Error bars represent standard deviation from at least 100
cells per gene knockdown. Significance was determined using a student’s t test with two tails
and unequal variance. **p<0.001 (F) The graph shows the percent of cells that incorporated
EdU normalized to the control. (G) Examples of localization of NXN in cells with and without
cilia. Green, gene-YFP; Red, centrioles left panel, cilia right panel; Blue, DNA.
FIGURE 6. GLOD4 causes short cilia and altered cell cycle progression. (A) A
representative image from GLOD4 knockdown. Scale bar is 10 µm. Blue, DNA; Red, acetylated
α-tubulin; Green, centrin/GFP. (B) Graph showing cilia length after gene knockdown. Error
bars represent standard deviation from at least 100 cilia per gene knockdown. Significance was
determined using a Student’s t test with two tails and unequal variance. ** p<0.001 (C) Graph
showing the percent ciliated cells normalized to the control. (D) Graph showing the percent of
cells with 2, 3, 4, 5, or ≥6 basal bodies/centrioles. (E) Graph showing the distance between the
mother and daughter basal bodies/centrioles. Error bars represent standard deviation from at
least 100 cells per gene knockdown. (F) The graph shows the percent of cells that incorporated
EdU normalized to the control. (G) Examples of localization of GLOD4 in cells with and without
cilia. Green, gene-YFP; Red, centrioles left panel, cilia right panel; Blue, DNA.
28 A.J. Albee et al.
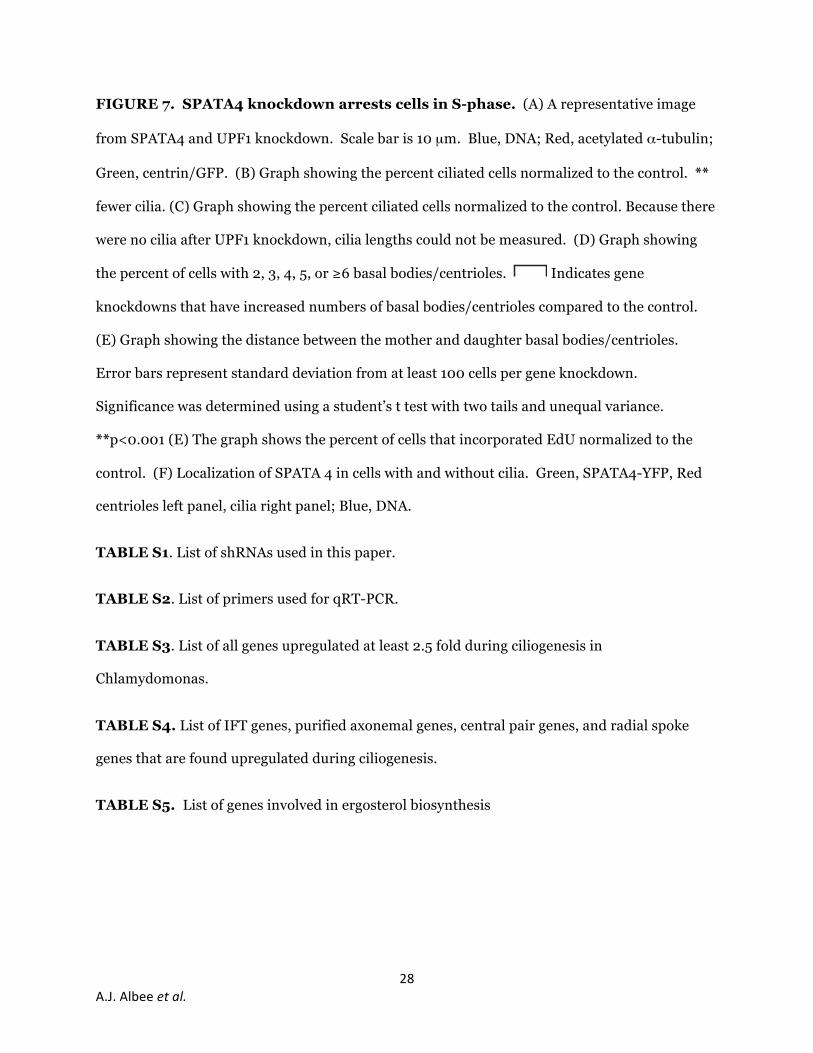
FIGURE 7. SPATA4 knockdown arrests cells in S-phase. (A) A representative image
from SPATA4 and UPF1 knockdown. Scale bar is 10 µm. Blue, DNA; Red, acetylated α-tubulin;
Green, centrin/GFP. (B) Graph showing the percent ciliated cells normalized to the control. **
fewer cilia. (C) Graph showing the percent ciliated cells normalized to the control. Because there
were no cilia after UPF1 knockdown, cilia lengths could not be measured. (D) Graph showing
the percent of cells with 2, 3, 4, 5, or ≥6 basal bodies/centrioles. Indicates gene
knockdowns that have increased numbers of basal bodies/centrioles compared to the control.
(E) Graph showing the distance between the mother and daughter basal bodies/centrioles.
Error bars represent standard deviation from at least 100 cells per gene knockdown.
Significance was determined using a student’s t test with two tails and unequal variance.
**p<0.001 (E) The graph shows the percent of cells that incorporated EdU normalized to the
control. (F) Localization of SPATA 4 in cells with and without cilia. Green, SPATA4-YFP, Red
centrioles left panel, cilia right panel; Blue, DNA.
TABLE S1. List of shRNAs used in this paper.
TABLE S2. List of primers used for qRT-PCR.
TABLE S3. List of all genes upregulated at least 2.5 fold during ciliogenesis in
Chlamydomonas.
TABLE S4. List of IFT genes, purified axonemal genes, central pair genes, and radial spoke
genes that are found upregulated during ciliogenesis.
TABLE S5. List of genes involved in ergosterol biosynthesis
29 A.J. Albee et al.
TABLE 1: Summary of RNAseq Data
Predicted transcripts in the genome 19,529
Genes aligned to genome 18,757
Genes with FPKM ≥3 10,790
Genes with a decreased fold change ≥2.5 fold 4,392
Genes without a change in level 4,548
Genes with increased fold change of ≥2.5 fold 1,850
30 A.J. Albee et al.
Table 2: Comparison with previous published results
Evidence # of genes supported by RNAseq
# genes with v5 predictions
flagellar proteome 2 or more
peptidesa
357
624
flagellar proteome 1 or more peptidesa
483
1429
microarray b
196
214
RNAseq mouse tracheal cells c
222 397
a (PAZOUR et al. 2005)
b (STOLC et al. 2005)
c (HOH et al. 2012)
31 A.J. Albee et al.
Table 3: Summary of genes in this study
FPKM values (transcript level) Fold change
Chlamydomonas H. sapiens description pre 3
min 10
min 30
min 60
min 3
min 10
min 30
min 60
min
Cre17.g704350 GLOD4 glyoxalase domain 3.55 8.10 12.50 15.05 11.58 2.28 3.52 4.24 3.26
g1771 NXN nucleoredoxin 4.22 16.29 88.76 190.26 246.42 3.86 21.03 45.07 58.38
FAP178 SPATA4 unknown function 11.99 94.49 163.70 111.98 28.03 7.88 13.65 9.34 2.34
Cre08.g358750 ZMYND10 zinc finger and MYND domains 4.08 36.79 117.92 34.19 0.71 9.02 28.92 8.38 0.17
32 A.J. Albee et al.
References
ALBEE, A. J., and S. K. DUTCHER, 2012 Cilia and Human Disease in eLS. John Wiley & Sons, Ltd. AVIDOR-REISS, T., A. M. MAER, E. KOUNDAKJIAN, A. POLYANOVSKY, T. KEIL et al., 2004 Decoding
cilia function: defining specialized genes required for compartmentalized cilia biogenesis. Cell 117: 527-539.
AZIMZADEH, J., P. HERGERT, A. DELOUVEE, U. EUTENEUER, E. FORMSTECHER et al., 2009 hPOC5 is a centrin-binding protein required for assembly of full-length centrioles. J Cell Biol 185: 101-114.
AZZALIN, C. M., and J. LINGNER, 2006 The human RNA surveillance factor UPF1 is required for S phase progression and genome stability. Curr Biol 16: 433-439.
BRADY, S. M., D. A. ORLANDO, J. Y. LEE, J. Y. WANG, J. KOCH et al., 2007 A high-resolution root spatiotemporal map reveals dominant expression patterns. Science 318: 801-806.
DONALDSON, J. G., and C. L. JACKSON, 2011 ARF family G proteins and their regulators: roles in membrane transport, development and disease. Nat Rev Mol Cell Biol 12: 362-375.
DUARTE, D. T., S. HUL and M. SACHER, 2011 A yeast two hybrid screen identifies SPATA4 as a TRAPP interactor. FEBS Lett 585: 2676-2681.
FENG, Y., L. NIE, M. D. THAKUR, Q. SU, Z. CHI et al., 2010 A multifunctional lentiviral-based gene knockdown with concurrent rescue that controls for off-target effects of RNAi. Genomics Proteomics Bioinformatics 8: 238-245.
FOLLIT, J. A., R. A. TUFT, K. E. FOGARTY and G. J. PAZOUR, 2006 The intraflagellar transport protein IFT20 is associated with the Golgi complex and is required for cilia assembly. Mol Biol Cell 17: 3781-3792.
FUNATO, Y., T. MICHIUE, M. ASASHIMA and H. MIKI, 2006 The thioredoxin-related redox-regulating protein nucleoredoxin inhibits Wnt-beta-catenin signalling through dishevelled. Nat Cell Biol 8: 501-508.
FUNATO, Y., T. MICHIUE, T. TERABAYASHI, A. YUKITA, H. DANNO et al., 2008 Nucleoredoxin regulates the Wnt/planar cell polarity pathway in Xenopus. Genes Cells 13: 965-975.
FUNATO, Y., T. TERABAYASHI, R. SAKAMOTO, D. OKUZAKI, H. ICHISE et al., 2010 Nucleoredoxin sustains Wnt/beta-catenin signaling by retaining a pool of inactive dishevelled protein. Curr Biol 20: 1945-1952.
GENINI, S., B. ZANGERL, J. SLAVIK, G. M. ACLAND, W. A. BELTRAN et al., 2010 Transcriptional profile analysis of RPGRORF15 frameshift mutation identifies novel genes associated with retinal degeneration. Invest Ophthalmol Vis Sci 51: 6038-6050.
HODGES, M. E., B. WICKSTEAD, K. GULL and J. A. LANGDALE, 2011 Conservation of ciliary proteins in plants with no cilia. BMC Plant Biol 11: 185.
HOH, R. A., T. R. STOWE, E. TURK and T. STEARNS, 2012 Transcriptional program of ciliated epithelial cells reveals new cilium and centrosome components and links to human disease. PLoS One 7: e52166.
ISHIKAWA, H., J. THOMPSON, J. R. YATES, 3RD and W. F. MARSHALL, 2012 Proteomic analysis of mammalian primary cilia. Curr Biol 22: 414-419.
KIM, S., N. A. ZAGHLOUL, E. BUBENSHCHIKOVA, E. C. OH, S. RANKIN et al., 2011 Nde1-mediated inhibition of ciliogenesis affects cell cycle re-entry. Nat Cell Biol 13: 351-360.
KINZEL, D., K. BOLDT, E. E. DAVIS, I. BURTSCHER, D. TRUMBACH et al., 2010 Pitchfork regulates primary cilia disassembly and left-right asymmetry. Dev Cell 19: 66-77.
KNODLER, A., S. FENG, J. ZHANG, X. ZHANG, A. DAS et al., 2010 Coordination of Rab8 and Rab11 in primary ciliogenesis. Proc Natl Acad Sci U S A 107: 6346-6351.
KUROOKA, H., K. KATO, S. MINOGUCHI, Y. TAKAHASHI, J. IKEDA et al., 1997 Cloning and characterization of the nucleoredoxin gene that encodes a novel nuclear protein related to thioredoxin. Genomics 39: 331-339.
33 A.J. Albee et al.
KWAN, A. L., S. K. DUTCHER and G. D. STORMO, 2010 Detecting Coevolution of Functionally Related Proteins for Automated Protein Annotation. Proc IEEE Int Symp Bioinformatics Bioeng: 99-105.
LACEY, K. R., P. K. JACKSON and T. STEARNS, 1999 Cyclin-dependent kinase control of centrosome duplication. Proc Natl Acad Sci U S A 96: 2817-2822.
LAI, H. C., Y. W. LIN, C. C. CHANG, H. C. WANG, T. W. CHU et al., 2007 Hypermethylation of two consecutive tumor suppressor genes, BLU and RASSF1A, located at 3p21.3 in cervical neoplasias. Gynecol Oncol 104: 629-635.
LEFEBVRE, P. A., and J. L. ROSENBAUM, 1986 Regulation of the synthesis and assembly of ciliary and flagellar proteins during regeneration. Annu Rev Cell Biol 2: 517-546.
LI, A., M. SAITO, J. Z. CHUANG, Y. Y. TSENG, C. DEDESMA et al., 2011 Ciliary transition zone activation of phosphorylated Tctex-1 controls ciliary resorption, S-phase entry and fate of neural progenitors. Nat Cell Biol 13: 402-411.
LI, J. B., J. M. GERDES, C. J. HAYCRAFT, Y. FAN, T. M. TESLOVICH et al., 2004 Comparative genomics identifies a flagellar and basal body proteome that includes the BBS5 human disease gene. Cell 117: 541-552.
LIU, B., S. LIU, S. HE, Y. ZHAO, H. HU et al., 2005a Cloning and expression analysis of gonadogenesis-associated gene SPATA4 from rainbow trout (Oncorhynchus mykiss). J Biochem Mol Biol 38: 206-210.
LIU, S., B. LIU, S. HE, Y. ZHAO and Z. WANG, 2005b Cloning and characterization of zebra fish SPATA4 gene and analysis of its gonad specific expression. Biochemistry (Mosc) 70: 638-644.
LIU, S. F., S. HE, B. W. LIU, Y. ZHAO and Z. WANG, 2004a Cloning and characterization of testis-specific spermatogenesis associated gene homologous to human SPATA4 in rat. Biol Pharm Bull 27: 1867-1870.
LIU, S. F., G. X. LU, G. LIU, X. W. XING, L. Y. LI et al., 2004b Cloning of a full-length cDNA of human testis-specific spermatogenic cell apoptosis inhibitor TSARG2 as a candidate oncogene. Biochem Biophys Res Commun 319: 32-40.
LIU, X. Q., H. K. CHEN, X. S. ZHANG, Z. G. PAN, A. LI et al., 2003 Alterations of BLU, a candidate tumor suppressor gene on chromosome 3p21.3, in human nasopharyngeal carcinoma. Int J Cancer 106: 60-65.
LONCAREK, J., P. HERGERT and A. KHODJAKOV, 2010 Centriole reduplication during prolonged interphase requires procentriole maturation governed by Plk1. Curr Biol 20: 1277-1282.
LORENTE, A., W. MUELLER, E. URDANGARIN, P. LAZCOZ, U. LASS et al., 2009 RASSF1A, BLU, NORE1A, PTEN and MGMT expression and promoter methylation in gliomas and glioma cell lines and evidence of deregulated expression of de novo DNMTs. Brain Pathol 19: 279-292.
LORESTANI, A., L. SHEINER, K. YANG, S. D. ROBERTSON, N. SAHOO et al., 2010 A Toxoplasma MORN1 null mutant undergoes repeated divisions but is defective in basal assembly, apicoplast division and cytokinesis. PLoS One 5: e12302.
LUX, F. G., 3RD, and S. K. DUTCHER, 1991 Genetic interactions at the FLA10 locus: suppressors and synthetic phenotypes that affect the cell cycle and flagellar function in Chlamydomonas reinhardtii. Genetics 128: 549-561.
MANNERVIK, B., 2008 Molecular enzymology of the glyoxalase system. Drug Metabol Drug Interact 23: 13-27.
MAY-SIMERA, H. L., and M. W. KELLEY, 2012 Cilia, Wnt signaling, and the cytoskeleton. Cilia 1: 7. MCCLINTOCK, T. S., C. E. GLASSER, S. C. BOSE and D. A. BERGMAN, 2008 Tissue expression
patterns identify mouse cilia genes. Physiol Genomics 32: 198-206. MERCHANT, S. S., S. E. PROCHNIK, O. VALLON, E. H. HARRIS, S. J. KARPOWICZ et al., 2007 The
Chlamydomonas genome reveals the evolution of key animal and plant functions. Science 318: 245-250.
34 A.J. Albee et al.
MILLER, M. B., B. A. HAUBRICH, Q. WANG, W. J. SNELL and W. D. NES, 2012 Evolutionarily conserved Delta(25(27))-olefin ergosterol biosynthesis pathway in the alga Chlamydomonas reinhardtii. J Lipid Res 53: 1636-1645.
MITCHISON, H. M., M. SCHMIDTS, N. T. LOGES, J. FRESHOUR, A. DRITSOULA et al., 2012 Mutations in axonemal dynein assembly factor DNAAF3 cause primary ciliary dyskinesia. Nat Genet 44: 381-389, S381-382.
MOFFAT, J., D. A. GRUENEBERG, X. YANG, S. Y. KIM, A. M. KLOEPFER et al., 2006 A lentiviral RNAi library for human and mouse genes applied to an arrayed viral high-content screen. Cell 124: 1283-1298.
MUKHOPADHYAY, S., and P. K. JACKSON, 2011 The tubby family proteins. Genome Biol 12: 225. NAGALAKSHMI, U., Z. WANG, K. WAERN, C. SHOU, D. RAHA et al., 2008 The transcriptional
landscape of the yeast genome defined by RNA sequencing. Science 320: 1344-1349. PALMER, K. J., L. MACCARTHY-MORROGH, N. SMYLLIE and D. J. STEPHENS, 2011 A role for Tctex-1
(DYNLT1) in controlling primary cilium length. Eur J Cell Biol 90: 865-871. PAZOUR, G. J., N. AGRIN, J. LESZYK and G. B. WITMAN, 2005 Proteomic analysis of a eukaryotic
cilium. J Cell Biol 170: 103-113. PRASANTH, S. G., K. V. PRASANTH, K. SIDDIQUI, D. L. SPECTOR and B. STILLMAN, 2004 Human
Orc2 localizes to centrosomes, centromeres and heterochromatin during chromosome inheritance. EMBO J 23: 2651-2663.
PUGACHEVA, E. N., S. A. JABLONSKI, T. R. HARTMAN, E. P. HENSKE and E. A. GOLEMIS, 2007 HEF1-dependent Aurora A activation induces disassembly of the primary cilium. Cell 129: 1351-1363.
RIEDER, C. L., C. G. JENSEN and L. C. JENSEN, 1979 The resorption of primary cilia during mitosis in a vertebrate (PtK1) cell line. J Ultrastruct Res 68: 173-185.
RIQUELME, E., M. TANG, S. BAEZ, A. DIAZ, M. PRUYAS et al., 2007 Frequent epigenetic inactivation of chromosome 3p candidate tumor suppressor genes in gallbladder carcinoma. Cancer Lett 250: 100-106.
SCHLOSS, J. A., C. D. SILFLOW and J. L. ROSENBAUM, 1984 mRNA abundance changes during flagellar regeneration in Chlamydomonas reinhardtii. Mol Cell Biol 4: 424-434.
SHAO, Y., W. ZHANG, C. ZHANG, Q. WU, H. YANG et al., 2010 High-resolution melting analysis of BLU methylation levels in gastric, colorectal, and pancreatic cancers. Cancer Invest 28: 642-648.
SILFLOW, C. D., and J. L. ROSENBAUM, 1981 Multiple alpha- and beta-tubulin genes in Chlamydomonas and regulation of tubulin mRNA levels after deflagellation. Cell 24: 81-88.
STEERE, N., M. WAGNER, S. BEISHIR, E. SMITH, L. BRESLIN et al., 2011 Centrosome amplification in CHO and DT40 cells by inactivation of cyclin-dependent kinases. Cytoskeleton (Hoboken) 68: 446-458.
STOLC, V., M. P. SAMANTA, W. TONGPRASIT and W. F. MARSHALL, 2005 Genome-wide transcriptional analysis of flagellar regeneration in Chlamydomonas reinhardtii identifies orthologs of ciliary disease genes. Proc Natl Acad Sci U S A 102: 3703-3707.
SUN, Z., A. AMSTERDAM, G. J. PAZOUR, D. G. COLE, M. S. MILLER et al., 2004 A genetic screen in zebrafish identifies cilia genes as a principal cause of cystic kidney. Development 131: 4085-4093.
TISCHOFF, I., A. MARKWARTH, H. WITZIGMANN, D. UHLMANN, J. HAUSS et al., 2005 Allele loss and epigenetic inactivation of 3p21.3 in malignant liver tumors. Int J Cancer 115: 684-689.
TRAPNELL, C., L. PACHTER and S. L. SALZBERG, 2009 TopHat: discovering splice junctions with RNA-Seq. Bioinformatics 25: 1105-1111.
35 A.J. Albee et al.
TRAPNELL, C., B. A. WILLIAMS, G. PERTEA, A. MORTAZAVI, G. KWAN et al., 2010 Transcript assembly and quantification by RNA-Seq reveals unannotated transcripts and isoform switching during cell differentiation. Nat Biotechnol 28: 511-515.
TUCKER, R. W., A. B. PARDEE and K. FUJIWARA, 1979 Centriole ciliation is related to quiescence and DNA synthesis in 3T3 cells. Cell 17: 527-535.
XIE, M. C., C. AI, X. M. JIN, S. F. LIU, S. X. TAO et al., 2007 Cloning and characterization of chicken SPATA4 gene and analysis of its specific expression. Mol Cell Biochem 306: 79-85.
YI LO, P. H., A. C. CHUNG LEUNG, W. XIONG, S. LAW, F. M. DUH et al., 2006 Expression of candidate chromosome 3p21.3 tumor suppressor genes and down-regulation of BLU in some esophageal squamous cell carcinomas. Cancer Lett 234: 184-192.