alberta beaver survey comprehensive data report
TRANSCRIPT

Innovative research. Engaged communities. Healthy landscapes.
Alberta Beaver Survey
Comprehensive Data
Report
Holly Kinas, Danah Duke and Nisha Panesar
Document prepared for Putting Beavers to Work for
Watershed Resiliency and Restoration

Alberta Beaver Survey
Comprehensive Data Report
Prepared by Holly Kinas, Danah Duke and Nisha Panesar
November 2017
Miistakis Institute Rm U271, Mount Royal University
4825 Mount Royal Gate SW Calgary, Alberta T3E 6K6
Phone: (403) 440-8444
Email: [email protected] Web: www.rockies.ca

Contents
Introduction .................................................................................................... 5
Survey Methods ............................................................................................... 5
Survey Creation ................................................................................................. 5
Survey Distribution ............................................................................................ 6
Analysis ............................................................................................................ 7
Text Analysis Assumptions ........................................................................ 7
Responses ........................................................................................................ 8
Summary of Key Results by Section................................................................. 9
Demographic .................................................................................................... 9
Eligibility ........................................................................................................... 9
Knowledge ........................................................................................................ 9
Feelings towards Beavers ................................................................................... 9
Concerns ........................................................................................................ 10
Local Beaver Presence ..................................................................................... 10
Historical Local Beaver Presence ....................................................................... 11
Beaver Benefits ............................................................................................... 11
Tolerance and Management Actions ................................................................. 11
Incentives ....................................................................................................... 12
Demographic .................................................................................................. 12
Additional Comments ....................................................................................... 12
Comprehensive Summary of Survey Responses for the Alberta Beaver Survey: Assessing Knowledge and Perceptions about Beavers ..................... 14
Demographic .................................................................................................. 14
Numeric and Graphical Responses by Question .......................................... 14
Eligibility ......................................................................................................... 16
Numeric and Graphical Responses by Question .......................................... 16
Knowledge ...................................................................................................... 17
Numeric and Graphical Responses by Question .......................................... 17
Feelings towards Beavers ................................................................................. 20
Numeric and Graphical Responses by Question .......................................... 20
Concerns ........................................................................................................ 26
Numeric and Graphical Responses by Question .......................................... 26
Local Beaver Presence ..................................................................................... 30
Numeric and Graphical Responses by Question .......................................... 30
Historical Local Beaver Presence ....................................................................... 38

Numeric and Graphical Responses by Question .......................................... 38
Beaver Benefits ............................................................................................... 46
Numeric and Graphical Responses by Question .......................................... 46
Tolerance and Management Actions ................................................................. 52
Numeric and Graphical Responses by Question .......................................... 52
Incentives ....................................................................................................... 57
Numeric and Graphical Responses by Question .......................................... 57
Demographic .................................................................................................. 59
Numeric and Graphical Responses by Question .......................................... 59
Final Comments .............................................................................................. 67
Numeric and Graphical Responses by Question .......................................... 67
Emergent Concerns ........................................................................................ 72
Emergent Benefits ......................................................................................... 72
Literature cited .............................................................................................. 74
Appendix A: Distribution Materials ................................................................ 76
Poster ............................................................................................................. 76
Post Card ........................................................................................................ 77
Beaver Survey Social Media Examples ............................................................... 78
Promotional tweet .................................................................................... 78
Reminder Tweets ..................................................................................... 78

ALBERTA BEAVER SURVEY COMPREHENSIVE DATA REPORT 5
Introduction
Beavers keep water on the landscape, leading to landscape stability and resiliency which benefits ecosystems, land owners and land managers. In parts of Canada and around the world, beavers are becoming increasingly valued for their role in watershed
health including, but not limited to, improved water storage, stream temperature moderation, reduced stream velocities, and habitat creation. As a result, beavers have
gained recognition as a tool for climate change adaptation and species-at-risk recovery. There is a growing interest in Alberta for using beavers as a tool for watershed restoration.
The Putting Beavers to Work for Watershed Resiliency and Restoration collaborative, with partner Cows and Fish (Alberta Riparian Habitat Management Society), was started
in the summer of 2016 and has been exploring the role that beavers play in watershed health in Alberta.. To date, the collaborative has focused its efforts on four main
components: hosting educational workshops and webinars on beaver ecology, benefits, and coexistence; hosting hands-on coexistence tools workshops; conducting social science research to evaluate Albertans' knowledge and perceptions about beavers, their
habitat, and their management; and creation of awareness materials to inform and encourage coexistence and acceptance of beavers by landowners, land managers, and
policy makers.
As part of the social science research component for Putting Beavers to Work, a survey
was chosen as the best method to assess rural Albertans’ knowledge and perceptions about beavers, their habitat, and their management. Evaluating Albertans knowledge and perceptions about beavers is a key component to the collaborative work as it will
help us better understand any knowledge gaps or emerging/reoccurring impacts that Alberta landowners are experiencing. The outcome of the survey is to develop
educational materials targeting any revealed knowledge gaps and areas of most concern, as well as providing insight into how Albertans approach beaver management.
Survey Methods
Survey Creation
A literature review of past beaver surveys was conducted and was used as the basis of
forming the questions within this survey; resources included: (Alberta Riparian Habitat Management Society, n.d.; Clements, 1998; D’eon et al., 1995; Department of Natural
Resources, 1988; Sandra A Jonker, Muth, Organ, Zwick, & Siemer, 2006; Sandra A Jonker, Muth, Zwick, & Siemer, 2009; Sandra Andrea Jonker, 2003; McKinstry & Anderson, 1998; Morzillo & Needham, 2015; Needham & Morzillo, 2011; New York
State Department of Environmental Conservation, 1992; Northeast Science & Technology, n.d.; Purdy, Decker, Malecki, & Proud, 1985; Reiter, Brunson, & Schmidt,

ALBERTA BEAVER SURVEY COMPREHENSIVE DATA REPORT 6
1999; Siemer, Brown, Jonker, & Muth, 2003; Siemer, Jonker, Decker, & Organ, 2013; Wigley & Garner, n.d.).
The Alberta Beaver Survey was an online survey hosted by SurveyMonkey Inc. (SurveyMonkey Inc., 2017) (https://www.surveymonkey.com/). Written PDF copies
were also made available at the request of participants or could be printed from the Putting Beavers to Work website (http://www.rockies.ca/beavers/index.php).
The survey was designed and pre-tested for distribution. The survey was designed to
protect the anonymity and voluntary participation of respondents.
The survey used a combination of: multiple choice, checkbox, matrix, rating, drop down, slider, true/false, and open-ended response style questions. When possible, multi-part questions used row randomization. Skip logic was applied to several questions, as
indicated in the comprehensive summary of questions below. There were a total of 49 questions in the survey.
On May 31, 2017 the “Southern Alberta Beaver Survey: Assessing Knowledge and Perceptions about Beavers” was launched and was open for participation until the closing date of July 26, 2017.
During the survey period the survey name was changed to “Alberta Beaver Survey: Assessing Knowledge and Perceptions about Beavers”, as the study area was expanded
to include all of the province of Alberta. The name was changed as a result of determining that the number of responses needed to statistically represent the southern
Alberta region (383 respondents, 95% confidence level, 5% margin of error) was similar to the number needed for the entire province (385 respondents, 95% confidence level, 5% margin of error).
The Putting Beavers to Work project recognizes that the survey is biased towards southern Alberta, defined as the municipalities included in the South Saskatchewan
River Basin. This bias is present because the distribution of the survey consisted of the Cows and Fish and Miistakis networks, which are heavily based in southern Alberta.
Survey Distribution
A distribution plan was created and primarily relied on the Cows and Fish and Miistakis networks distributing and promoting the survey to their networks, including landowners
they come in contact with. Distributors ranged from NGOs, government organizations, municipalities, and private landowners. Distribution of the survey link was also sent out
via Twitter and Facebook social media outlets. Distribution of the survey link and associated survey materials (poster, post card, social media examples, and written survey PDF) were sent to all distribution participants three times: initially with the
launch of the survey, a reminder in the middle of the survey period (4 weeks left), and a reminder near the end of the survey period (2 weeks left).
The below preamble was provided to all survey respondents as an introduction in both the written and online surveys:

ALBERTA BEAVER SURVEY COMPREHENSIVE DATA REPORT 7
This survey was created to assess knowledge and perceptions about beavers, their habitat and management in Alberta. The information collected will be used
to inform beaver management in Alberta, as well as help inform the development of education materials and management tools.
This survey is being conducted in partnership by the Miistakis Institute and Cows and Fish (Alberta Riparian Habitat Management Society), and will take
approximately 25-30 minutes to complete.
Participation in this survey is voluntary and results will be aggregated and feedback will not be attributed to any individuals. If you have questions about
this written survey, please contact Nisha ([email protected] or 403-440-8444).
The results of this survey will be available in a formal report created after the
survey period at: www.rockies.ca and www.cowsandfish.org.
A conclusion was provided to the respondents and is as follows:
Thank you for participating in our “Southern Alberta Beaver Survey: Assessing
Knowledge and Perceptions Towards Beavers.” The results of this survey will be available in a formal report created after the survey period at: www.rockies.ca
and www.cowsandfish.org.
If you would like more information about beaver ecology or methods to coexist
with beavers (i.e. pond leveling devices, exclusion devices, beaver reintroduction efforts, etc.) please contact Holly at the Miistakis Institute at [email protected], 403-440-8444, or the staff at Cows and Fish at [email protected], 403-
381-5538 (for regional staff check out cowsandfish.org/contact.html).
Funding for this research is generously provided by the Calgary Foundation.
In order to participate in this survey, participants were required to be at least 18 years of age or older. If they answered question #3, “Are you 18 years of age or older?” they
were directed to an explanation page and then the conclusion page. The explanation provided is below:
“In order to participate in this survey you must be 18 years of age or older.”
Any discrepancies between the SurveyMonkey Inc. survey form and the written survey form (ex. bolding, question formatting, lack of randomization of rows in some multi-part
questions in written survey) were negligible as we did not receive any written survey forms therefore analysis is based on the SurveyMonkey Inc. survey form.
Analysis
Questions that were open-ended were analyzed and categorized using HyperResearch
software (ResearchWare Inc., 2015).
Text Analysis Assumptions
ALBERTA BEAVER SURVEY COMPREHENSIVE DATA REPORT 8
When cleaning survey data for question 37, regarding municipality location of the property, the following conflicts occurred and were addressed:
When there was a conflict of more than one location given (ex. “City of Red
Deer/Red Deer County”) we choose to select the first location given and remove the second (from above example, City of Red Deer would be selected).
Some municipalities listed had changed names in the past so when a previous
name was used, it was corrected to the current name using the Government of
Alberta: Municipal Affairs (2017) Municipal Profiles webpage.
For open-ended numerical response questions, where respondents were asked to provide a number, the following assumptions were made in order to clean and analyze
the data:
Beaver population estimate
o Any time a range was given, the lower value was taken, so as not to
overestimate (ex. 5-6 beavers was coded as 5)
o Anytime a ‘more than’ (>) or ‘less than’ (<) symbol was used in the
response, it was categorized as the next closest number (ex. <5 was
coded as 4).
o When the term ‘colony’ was used for beaver population estimate, a colony
was coded as 5 individuals based on the book by Lorne Fitch (2016) that
states: “A typical colony contains an average of five individuals; the adult
pair, kits of the year and kits of the previous year.”
o For responses that referenced number of dams (ex. “1 dam, unsure of
family size”), it was coded as 1 beaver as a single individual can create a
dam and thus does not overestimate the population size. If the response
is multiple dams, it was still coded as 1 beaver. Similar to this, when
responses referenced the number of lodges, it was coded as 1 beaver per
lodge as family groups will live together in a single lodge so two lodges
assumes as least two beavers.
o For responses that state beavers are present but they are unsure of the
number they are coded as 1 beaver present.
For open-ended non-numerical response questions, where respondents were asked to provide text, the analysis approach varied for each question but typically was analyzed
by placing each response into categories or by noting emerging topics.
Responses
The survey was open from May 31, 2017 to July 26, 2017, inclusively. We received 639
usable surveys (0 of these were hard copy and 639 were completed on-line via
ALBERTA BEAVER SURVEY COMPREHENSIVE DATA REPORT 9
SurveyMonkey Inc.). Assuming a target population of 385, we can be 95% certain that
the results are accurate within (plus or minus) 5%. Response rate varied for each
question, therefore some questions may have varying statistical validity. There were
303 complete responses (every question answered).
Summary of Key Results by Section
Demographic
The majority of respondents (69.93%) own land/property and are responsible for the management of that land/property. There was an even representation from
respondents within southern Alberta (49.61%) and respondents in the other regions of Alberta (central and northern) (49.61%).
Eligibility
With the exception of 1 respondent, all respondents were 18 years of age or older and therefore eligible to complete the survey.
Knowledge
Overall, respondents indicated a high level of understanding towards beavers (average
correct response rate was 69.4%). The knowledge questions that resulted with the most discrepancy were in regards to fish movement barriers and beaver youth dispersal.
Confusion is apparent when it comes to who has legal authority to manage beavers on private land as responses varied greatly. Respondents’ top two answers were that private landowners (72.55%) and the Government of Alberta (65.45%) have legal
authority to manage beaver on private land in Alberta.
There is also a discrepancy in the knowledge about when a private landowner can
remove a beaver or beaver dam from their property as most respondents recognized a permit is required (42.45%) but there was a strong showing for respondents that answered they can remove a beaver/dam at any time (33.65%) as well as respondents
who don’t know when a beaver or dam can legally be removed (21.99%).
Feelings towards Beavers
Overall, the majority of respondents feel beavers are more beneficial (73.86%) than harmful (7.59%).
Responses to various statements (question 9) varied greatly, however, respondents indicated support for beavers on the landscape and as an important part of the ecosystem, a need to address damage caused by beavers, a desire to promote
coexistence and the need for beaver management.

ALBERTA BEAVER SURVEY COMPREHENSIVE DATA REPORT 10
When respondents were asked which situation would make them most happy with regard to beaver population, the majority of respondents answered that they would be
happy if beaver populations either increased (37.40%) or remained the same (37.00%). This outcome shows the support for beavers to persist, and even grow in numbers on
the landscape.
Concerns
The majority of respondents are not at all concerned about human, pet, or livestock health and safety related issues but 47.05% of respondents are slightly concerned about potential damage to their property.
Of the negative impacts caused by beavers listed, the two rated as a ‘serious problem’ were ‘flooding of crops or fields’ and ‘flooding of a home or other building,’ with the
other impacts being rated as ‘moderate problems.
Local Beaver Presence
42.19% of respondents have beavers living on their property, property they manage, or
adjacent properties within the last 5 years. Of these respondents, the majority of them, who answered the questions, indicated that beavers are common or very common and
estimate that 1-5 beavers currently exist on their property, property they manage, or adjacent properties.
While 29% of respondents indicate beavers to be a moderate (19.25%) or extreme (9.63%) problem, 27.81% indicate beavers as a slight problem while 36.36% of people living with beavers indicate beavers are not a problem at all indicating a high level of
coexistence in Alberta
The majority of respondents with beavers present described the severity of beaver
damage to their property in the last 5 years as light damage. The most common occurrence of damage, within their own property, is damage to trees or shrubs, with
38.30% having this occur more than 5 times. For each other type of damage, the majority of respondents have never experienced that type of damage or have only experienced it 1-2 times.
Respondents selected that ‘overflow of a pond, lake, or stream’ and ‘damage to trees or shrubs’ were tolerable, while ‘Flooding of a road or driveway,’ ‘Flooding of crops,
pasture, or fields,’ and ‘Damage to culverts (e.g. Plugged culverts, erosion around culverts)’ were unreasonable.
In conclusion, respondents show a high level of tolerance for damage caused by
beavers as they consider damage levels to be light and damage type to be tolerable. The majority of respondents have experienced tree and shrub damage multiple times
but have not often, or at all, experienced the more costly damage types such as flooding of a road or driveway or crops. It is plausible to infer that the majority of
landowners don’t see beavers as a serious problem, but those that experience a high level of damage consider them a serious problem.
ALBERTA BEAVER SURVEY COMPREHENSIVE DATA REPORT 11
Historical Local Beaver Presence
3.59% of respondents currently have no beavers living on their property, property they
manage, or adjacent properties within the last 5 years but have had them in the past (over 5 years ago). Of these respondents, the majority of them, who answered these
questions, indicated that beavers were uncommon or rare and estimate that historically 1-5 beavers existed on their property, property they manage, or adjacent properties
over a one year period.
Of the respondents who had beavers present in the past, the majority consider beavers only to be a slight problem (43.75%) and 37.50% consider beavers to be ‘not a
problem.’
Respondents described the severity of the damage caused by beavers historically as
light damage. The most common occurrence of damage, within their own property, reported by respondents who historically had beavers, and answered this question, is damage to trees or shrubs, with 40.00% having this occur 1-2 times. For each other
type of damage, the majority of respondents have never experienced this damage. Respondents selected all damage types to be either tolerable or not applicable.
In conclusion, when compared to the responses from respondents who currently have beavers present on their land, this group seems to have experienced less damage, and
the damage that did occur is considered to be light and tolerable.
Beaver Benefits
Respondents indicated their support for coexisting with beavers with 48.56% of
respondents indicating some level of interest in having beavers live on their property with 21.77% indicating no interest in having beavers live on their property.
Benefits from beavers are being realized with respondents indicating receiving increased
riparian vegetation (39.56%), increased species diversity (39.07%) and increased wildlife numbers (35.78%), and enhanced aesthetic qualities (55.53%) from beaver presence. There is also an indication of a need for greater understanding of the benefits
afforded by beavers as 37.23% indicated they do not know if they are receiving all the benefits they want from beavers. A majority of respondents also indicated a desire for
additional benefits afforded by beavers including increased riparian vegetation, increased species diversity, increased wildlife numbers, improved water quality, reduced flooding, aesthetic qualities and nature watching opportunities.
Tolerance and Management Actions
Overall, respondents are in favour of actions including undertaking research, riparian management, tree wrapping, using beaver coexistence tools, removing dams and
relocating beavers as a means to manage beavers. Two unacceptable actions include ‘frighten the beaver away’ or ‘destroy the beaver (lethal control).’

ALBERTA BEAVER SURVEY COMPREHENSIVE DATA REPORT 12
The vast majority of respondents have never undertaken any of the listed management actions with the exception of ‘leaving the beaver alone’
The variety of responses to who should be responsible for addressing problems with beavers (individuals 66.76%, municipal government 52.91%, provincial government
62.33% and regulated trappers 42.11%) indicates a need for clarity on roles and responsibilities related to beaver management.
Incentives
Respondents indicated their support for coexistence with beavers with their indication to take advantage of incentives that would allow beavers to live on their or
neighbouring property (information, technical support, tree planting, coexistence tools, financial compensation). Diversionary feeding was one incentive with less support. Two
additional incentives were noted including relocation related incentives to decrease potential issues (i.e. beaver-proof at a reduced cost to neighbours before relocation occurs), and information in the form of a ‘before and after’ case study of a beaver
project.
Demographic
79 different Alberta municipalities were represented in this survey and one municipality from the United States of America.
The majority of the respondents (48.87%) have owned or managed their land for 11-50 years and either own or manage ‘less than 1 acre (less than 0.40ha) (36.91%) or ‘more than one quarter section (more than 64.75ha) of land. 58.61% of respondents have
shoreline/streambank present that they own or manage. The top 3 primary land use activities that currently occur on the land that respondents own or manage is
residential-primary residence (33.6%), agriculture - livestock grazing (17.4%), and agriculture – annual crop (11.0%). The top 3 secondary land use activities that
currently occur on the land that respondents own or manage is natural areas (12.50%), hunting (10.71%), and agriculture – perennial crops (9.44%).
The mode age range of respondents is 36-45 (22.77%). 83.38% of the respondents
are ages 26-65.
Additional Comments
The top 5 formats for educational information on beavers and beaver management are: website (70.31%), online-video (eg. YouTube) (48.75%), in-person workshop (38.75%), e-mail (35.62%), and pamphlet/brochure (33.44%).
When respondents were asked to specify what they would like to know about beavers, their impacts, and/or how to coexist with them, the top 3 categories were determined:
Coexistence (how to coexist, mitigation tools), Benefits/impacts, Beaver General information (biology, ecology, population numbers, etc.).
114 respondents answered yes, they would like to receive information on beavers and beaver management. 116 respondents answered yes, they would be interested in
ALBERTA BEAVER SURVEY COMPREHENSIVE DATA REPORT 13
attending a workshop on beaver management, coexistence, or relocation. 53 respondents answered yes, they would be interested in accepting or donating a beaver
for relocation.

ALBERTA BEAVER SURVEY COMPREHENSIVE DATA REPORT 14
Comprehensive Summary of Survey Responses for the Alberta Beaver Survey: Assessing Knowledge and Perceptions about Beavers
Demographic
Numeric and Graphical Responses by Question
Southern Alberta Region
1. Do you currently live in or manage land in southern Alberta (yellow
section/“Beaver Survey Area”)?
Answer Choices
Responses
Yes 49.61% 317
No 49.61% 317
Don't know 0.78% 5
Answered 639
Skipped 0
49.61% 49.61%
0.78%
Yes No Don't know
0%
10%
20%
30%
40%
50%
60%
Fre
qu
en
cy

ALBERTA BEAVER SURVEY COMPREHENSIVE DATA REPORT 15
2. With respect to beavers, please select the category that you most relate to
personally (we recognize that more than one can apply but please select only one and respond to the survey from that perspective):
Answer Choices Responses
You own land/property in Alberta and are responsible for management of that land/property
69.93% 400
You own land/property in Alberta but are not responsible for management of that land/property
8.04% 46
You rent or lease land/property in Alberta and are responsible for management of that land/property
7.34% 42
You rent or lease land/property in Alberta but are not responsible for management of that land/property
14.69% 84
Answered 572
Skipped 67
69.93% of respondents own land/property in Alberta and are responsible for
management of that land/property.
69.93%
8.04% 7.34%
14.69%
You ownland/property inAlberta and areresponsible for
management of thatland/property
You ownland/property in
Alberta but are notresponsible for
management of thatland/property
You rent or leaseland/property inAlberta and areresponsible for
management of thatland/property
You rent or leaseland/property in
Alberta but are notresponsible for
management of thatland/property
0%
10%
20%
30%
40%
50%
60%
70%
80%
Fre
qu
en
cy
ALBERTA BEAVER SURVEY COMPREHENSIVE DATA REPORT 16
Eligibility
Numeric and Graphical Responses by Question
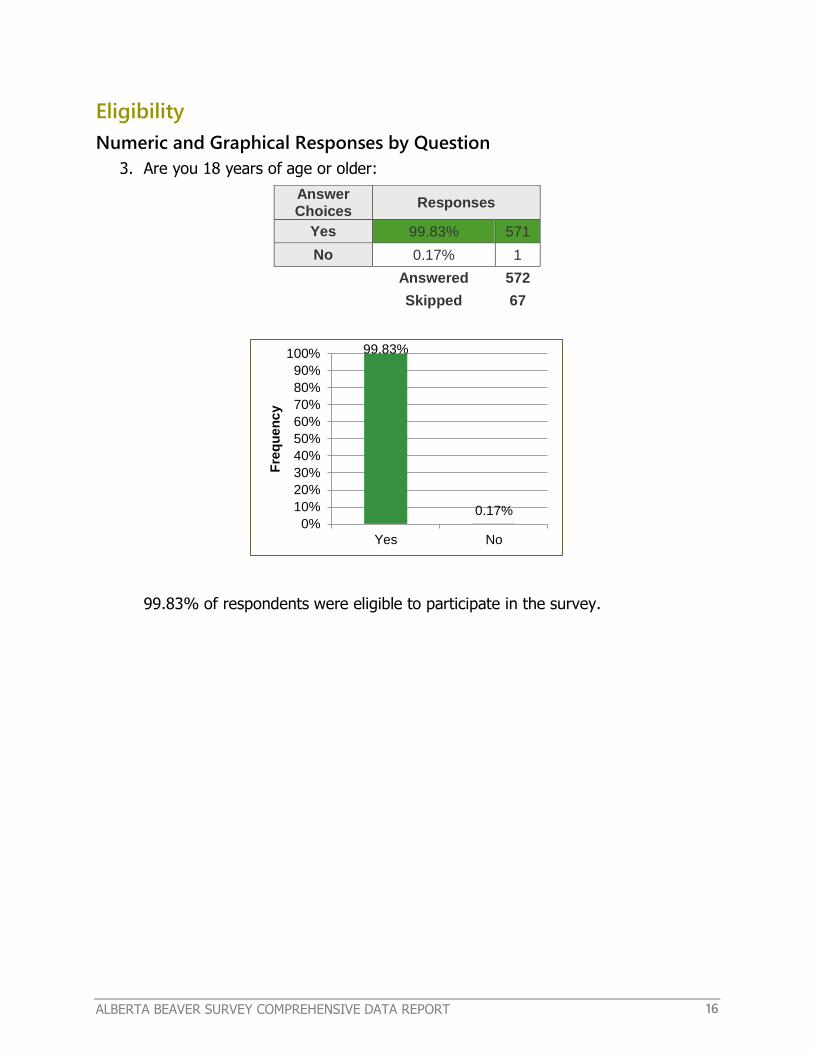
3. Are you 18 years of age or older:
Answer Choices
Responses
Yes 99.83% 571
No 0.17% 1
Answered 572
Skipped 67
99.83% of respondents were eligible to participate in the survey.
99.83%
0.17%
Yes No
0%
10%
20%
30%
40%
50%
60%
70%
80%
90%
100%
Fre
qu
en
cy

ALBERTA BEAVER SURVEY COMPREHENSIVE DATA REPORT 17
Knowledge
Numeric and Graphical Responses by Question
4. Please answer true or false to the following statements:
*Note: The correct answer has been shaded in blue. Question shaded in red were answered incorrectly or “don’t know” by the majority of respondents*
True False Don't Know Total
Beavers naturally exist in Alberta 94.44% 493 2.11% 11 3.45% 18 522
Beaver population numbers today are greater than their historic (pre-1900) numbers in Alberta
19.62% 102 44.62% 232 35.77% 186 520
Beavers spend the majority of their life in waterbodies
80.50% 421 8.80% 46 10.71% 56 523
Beavers build both dams and lodges 95.02% 496 0.96% 5 4.02% 21 522
Beavers eat fish 10.00% 52 71.35% 371 18.65% 97 520
Beavers must chew on wood because their teeth do not stop growing
83.52% 436 5.56% 29 10.92% 57 522
Beavers have webbed feet 87.00% 455 5.54% 29 7.46% 39 523
Beaver dams can create ponds (wetlands) that help replenish groundwater
87.76% 459 4.59% 24 7.65% 40 523
Beaver dams can create ponds that are important for fish such as trout
81.42% 425 7.66% 40 10.92% 57 522
Beaver dams act as barriers to fish movement in streams
44.44% 232 34.48% 180 21.07% 110 522
Beaver colonies can have up to 12 individuals living in one location
58.81% 307 8.81% 46 32.38% 169 522
Young beavers disperse at 6 months of age 22.88% 119 26.73% 139 50.38% 262 520
Beavers are driven to build dams based on the sound and feeling of running water
63.10% 330 10.13% 53 26.77% 140 523
Beavers create wetlands and habitat that benefits other living things
95.39% 497 1.54% 8 3.07% 16 521
Ponds created by beaver dams generally help reduce 63.29% 331 23.52% 123 13.19% 69 523

ALBERTA BEAVER SURVEY COMPREHENSIVE DATA REPORT 18
True False Don't Know Total
the threat of flooding
Water captured behind beaver dams results in lower flows and causes insufficient water downstream.
27.78% 145 61.30% 320 10.92% 57 522
Cutting of trees by beavers results in loss of tree populations
37.55% 196 52.30% 273 10.15% 53 522
Answered 523
Skipped 116
The majority of respondents answered the questions correctly. The two statements with incorrect answers were: “Beaver dams act as barriers to fish movement in streams” and “Young beavers disperse at 6 months of age.”
ALBERTA BEAVER SURVEY COMPREHENSIVE DATA REPORT 19
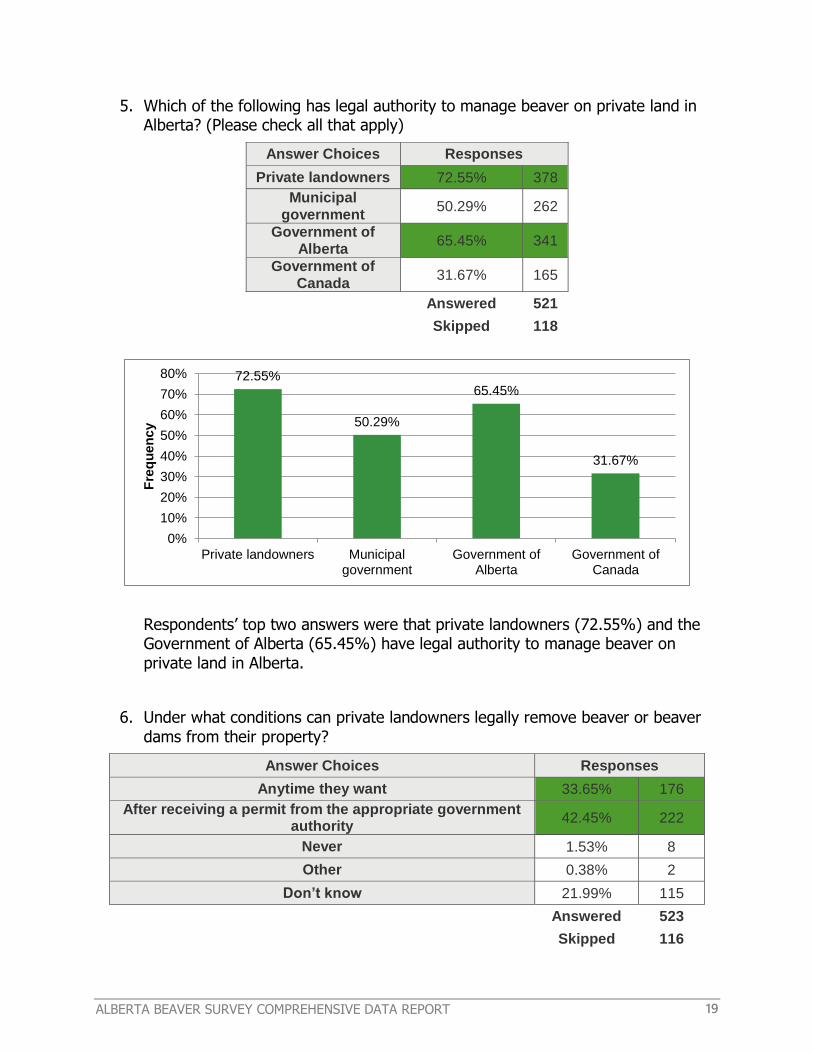
5. Which of the following has legal authority to manage beaver on private land in Alberta? (Please check all that apply)
Answer Choices Responses
Private landowners 72.55% 378
Municipal government
50.29% 262
Government of Alberta
65.45% 341
Government of Canada
31.67% 165
Answered 521
Skipped 118
Respondents’ top two answers were that private landowners (72.55%) and the Government of Alberta (65.45%) have legal authority to manage beaver on
private land in Alberta.
6. Under what conditions can private landowners legally remove beaver or beaver
dams from their property?
Answer Choices Responses
Anytime they want 33.65% 176
After receiving a permit from the appropriate government authority
42.45% 222
Never 1.53% 8
Other 0.38% 2
Don’t know 21.99% 115
Answered 523
Skipped 116
72.55%
50.29%
65.45%
31.67%
Private landowners Municipalgovernment
Government ofAlberta
Government ofCanada
0%
10%
20%
30%
40%
50%
60%
70%
80%
Fre
qu
en
cy

ALBERTA BEAVER SURVEY COMPREHENSIVE DATA REPORT 20
The majority of respondents’ believe that private landowners can legally remove beaver or beaver dams from their property ‘after receiving a permit from the
appropriate government authority’ (42.45%) and ‘anytime they want’ (33.65%).
*Note: Those respondents who answered “Other” did not leave open-ended responses.*
Feelings towards Beavers
Numeric and Graphical Responses by Question
7. In general, how do you feel about beavers?
Answer Choices Responses
Extremely Dislike 1.80% 9
Dislike 5.40% 27
Neutral 19.00% 95
Like 43.00% 215
Extremely Like 30.80% 154
Answered 500
Skipped 139
33.65%
42.45%
1.53% 0.38%
21.99%
Anytime theywant
Afterreceiving apermit from
theappropriategovernment
authority
Never Other Don’t know
0%
10%
20%
30%
40%
50%
Fre
qu
en
cy

ALBERTA BEAVER SURVEY COMPREHENSIVE DATA REPORT 21
73.80% of respondents like beavers.
Open-ended responses available upon request.
8. In general, do you feel beavers are:
Scale Responses
Extremely Harmful 1.00% 5
Harmful 6.59% 33
Neutral 18.56% 93
Beneficial 46.71% 234
Extremely Beneficial 27.15% 136
Answered 501
Skipped 138
73.86% of respondents feel beavers are beneficial.
Open-ended responses from the comments section were analyzed and the following categories were compiled and are stated in the table below:
1.80% 5.40%
19.00%
43.00%
30.80%
ExtremelyDislike
Dislike Neutral Like ExtremelyLike
0%
10%
20%
30%
40%
50%
Fre
qu
en
cy
1.00% 6.59%
18.56%
46.71%
27.15%
ExtremelyHarmful
Harmful Neutral Beneficial ExtremelyBeneficial
0%
10%
20%
30%
40%
50%
Fre
qu
en
cy

ALBERTA BEAVER SURVEY COMPREHENSIVE DATA REPORT 22
Category % Topic Mentioned
Times Topic Mentioned
Both Harmful and Beneficial 28.57% 24
Benefits 22.62% 19
Negative Impact 15.48% 13
Location/Activity Dependent 14.29% 12
Management 9.52% 8
Infrastructure 5.95% 5
Economy 2.38% 2
No Benefit 1.19% 1
100% 84
Open-ended responses available upon request.

ALBERTA BEAVER SURVEY COMPREHENSIVE DATA REPORT 23
9. To what extent do you disagree or agree with the following statements? (please select only one response per row)
Statements Strongly Disagree Slightly Disagree Neutral Slightly Agree Strongly Agree Total
I may never see a beaver, but it is important to me that they exist
3.80% 19 2.80% 14 12.20% 61 20.20% 101 61.00% 305 500
I am afraid of beavers 72.85% 365 13.97% 70 9.38% 47 2.59% 13 1.20% 6 501
I would get enjoyment from seeing beavers
3.60% 18 1.20% 6 12.80% 64 23.80% 119 58.60% 293 500
Beaver damage to roads or bridges is a major problem
14.74% 74 23.11% 116 22.11% 111 29.68% 149 10.36% 52 502
Beaver damage to property (other than roads & bridges) is a
major problem 15.20% 76 29.00% 145 22.00% 110 25.00% 125 8.80% 44 500
Beavers are an important part of the natural ecosystem
1.00% 5 1.60% 8 4.40% 22 18.00% 90 75.00% 375 500
Drinking water contaminated by beaver exposes people to
diseases 15.23% 76 17.84% 89 22.44% 112 31.86% 159 12.63% 63 499
Beavers are a nuisance 26.40% 132 27.20% 136 16.80% 84 24.60% 123 5.00% 25 500
People should be willing to tolerate some conflict with
beavers 1.61% 8 6.63% 33 8.63% 43 39.76% 198 43.37% 216 498
Beavers have a right to exist regardless of any damage they
cause 12.15% 61 17.33% 87 10.96% 55 28.69% 144 30.88% 155 502
When beaver dams burst they create flood damage to
downstream areas 11.75% 59 23.90% 120 25.50% 128 34.06% 171 4.78% 24 502

ALBERTA BEAVER SURVEY COMPREHENSIVE DATA REPORT 24
Statements Strongly Disagree Slightly Disagree Neutral Slightly Agree Strongly Agree Total
Beaver populations should be actively managed
7.21% 36 13.83% 69 21.64% 108 35.47% 177 21.84% 109 499
No beaver should be killed 32.53% 163 26.55% 133 14.77% 74 14.57% 73 11.58% 58 501
Beavers damage habitat for some wildlife or fish species
17.64% 88 22.04% 110 27.66% 138 26.25% 131 6.41% 32 499
Beavers cause more harm than good
49.40% 247 24.80% 124 15.60% 78 6.00% 30 4.20% 21 500
Answered 502
Skipped 137
Respondents’ answers to each topic varied greatly. Please see the highest answer rate for each topic highlighted in
green in the table above.

ALBERTA BEAVER SURVEY COMPREHENSIVE DATA REPORT 25
10. I would be happy if beaver populations:
Answer Choices Responses
Increased greatly 9.60% 48
Increased slightly 27.80% 139
Remained the same 37.00% 185
Decreased slightly 8.60% 43
Decreased greatly 3.40% 17
No opinion 13.60% 68
Answered 500
Skipped 139
37.40% of respondents would be happy if beaver populations increased, 37.00% would be happy if beaver populations remained the same, and 12% would be
happy if beaver populations decreased. 13.60% of respondents had no opinion.
9.60%
27.80%
37.00%
8.60%
3.40%
13.60%
Increasedgreatly
Increasedslightly
Remainedthe same
Decreasedslightly
Decreasedgreatly
No opinion
0%
10%
20%
30%
40%
Fre
qu
en
cy

ALBERTA BEAVER SURVEY COMPREHENSIVE DATA REPORT 26
Concerns
Numeric and Graphical Responses by Question
11. If beavers are or were present on your property (or land you manage) or neighbouring properties, how concerned would you be about each of the following? (please select only one response per row)
Not at all
concerned Slightly
concerned Moderately concerned
Extremely concerned
No Opinion Total
Your own personal health or safety
79.32% 376 11.18% 53 5.91% 28 2.95% 14 0.63% 3 474
Health or safety of children
56.33% 267 25.95% 123 10.76% 51 4.85% 23 2.11% 10 474
Health or safety of pets or livestock
53.05% 252 30.11% 143 9.05% 43 5.89% 28 1.89% 9 475
Spread of diseases by beavers
56.24% 266 27.06% 128 10.36% 49 4.44% 21 1.90% 9 473
Potential damage to your own property
(or property that you manage) by beavers
17.72% 84 47.05% 223 24.47% 116 10.13% 48 0.63% 3 474
Answered 475
Skipped 164
The majority of respondents are not at all concerned about human, pet, or livestock health and safety related issues but 47.05% of respondents are slightly concerned about potential damage to their property.
Open-ended responses available upon request.
ALBERTA BEAVER SURVEY COMPREHENSIVE DATA REPORT 27
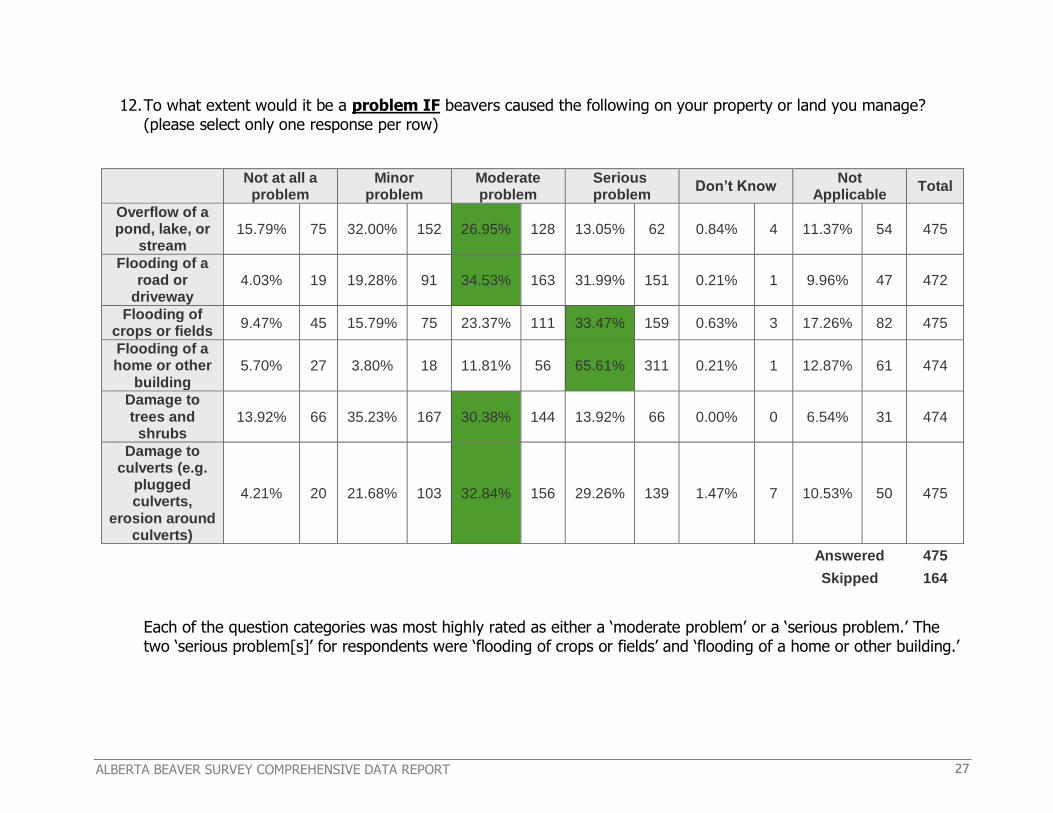
12. To what extent would it be a problem IF beavers caused the following on your property or land you manage? (please select only one response per row)
Not at all a problem
Minor problem
Moderate problem
Serious problem
Don’t Know Not
Applicable Total
Overflow of a pond, lake, or
stream 15.79% 75 32.00% 152 26.95% 128 13.05% 62 0.84% 4 11.37% 54 475
Flooding of a road or
driveway 4.03% 19 19.28% 91 34.53% 163 31.99% 151 0.21% 1 9.96% 47 472
Flooding of crops or fields
9.47% 45 15.79% 75 23.37% 111 33.47% 159 0.63% 3 17.26% 82 475
Flooding of a home or other
building 5.70% 27 3.80% 18 11.81% 56 65.61% 311 0.21% 1 12.87% 61 474
Damage to trees and
shrubs 13.92% 66 35.23% 167 30.38% 144 13.92% 66 0.00% 0 6.54% 31 474
Damage to culverts (e.g.
plugged culverts,
erosion around culverts)
4.21% 20 21.68% 103 32.84% 156 29.26% 139 1.47% 7 10.53% 50 475
Answered 475
Skipped 164
Each of the question categories was most highly rated as either a ‘moderate problem’ or a ‘serious problem.’ The two ‘serious problem[s]’ for respondents were ‘flooding of crops or fields’ and ‘flooding of a home or other building.’
ALBERTA BEAVER SURVEY COMPREHENSIVE DATA REPORT 28
Open-ended responses were captured in the ‘other’ category where respondents were asked to ‘please describe the impact and extent of the problem.’ Emergent concerns were noted and will be discussed as part of the summary of
this report. In the ‘other’ responses there were 8 respondents that mentioned the use of mitigation tools.
Open-ended responses available upon request.

ALBERTA BEAVER SURVEY COMPREHENSIVE DATA REPORT 29
13. Based on your present knowledge and experiences with beaver in Alberta, in your opinion, which statement best represents the extent of beaver damage in
Alberta over the past 5 years?
Answer Choices Responses
Increased greatly 6.30% 30
Increased slightly 18.07% 86
Remained the same
37.18% 177
Decreased slightly
11.55% 55
Decreased greatly
2.52% 12
No opinion 24.37% 116
Answered 476
Skipped 163
24.37% of respondents believe that extent of beaver damage in Alberta has
increased, 37.18% of respondents believe the extent of beaver damage in Alberta has remained the same, and 14.07% of respondents believe that extent of beaver damage in Alberta has decreased. 24.37% of respondents had no
opinion.
6.30%
18.07%
37.18%
11.55%
2.52%
24.37%
Increasedgreatly
Increasedslightly
Remainedthe same
Decreasedslightly
Decreasedgreatly
No opinion
0%
10%
20%
30%
40%
Fre
qu
en
cy
ALBERTA BEAVER SURVEY COMPREHENSIVE DATA REPORT 30
Local Beaver Presence
Numeric and Graphical Responses by Question
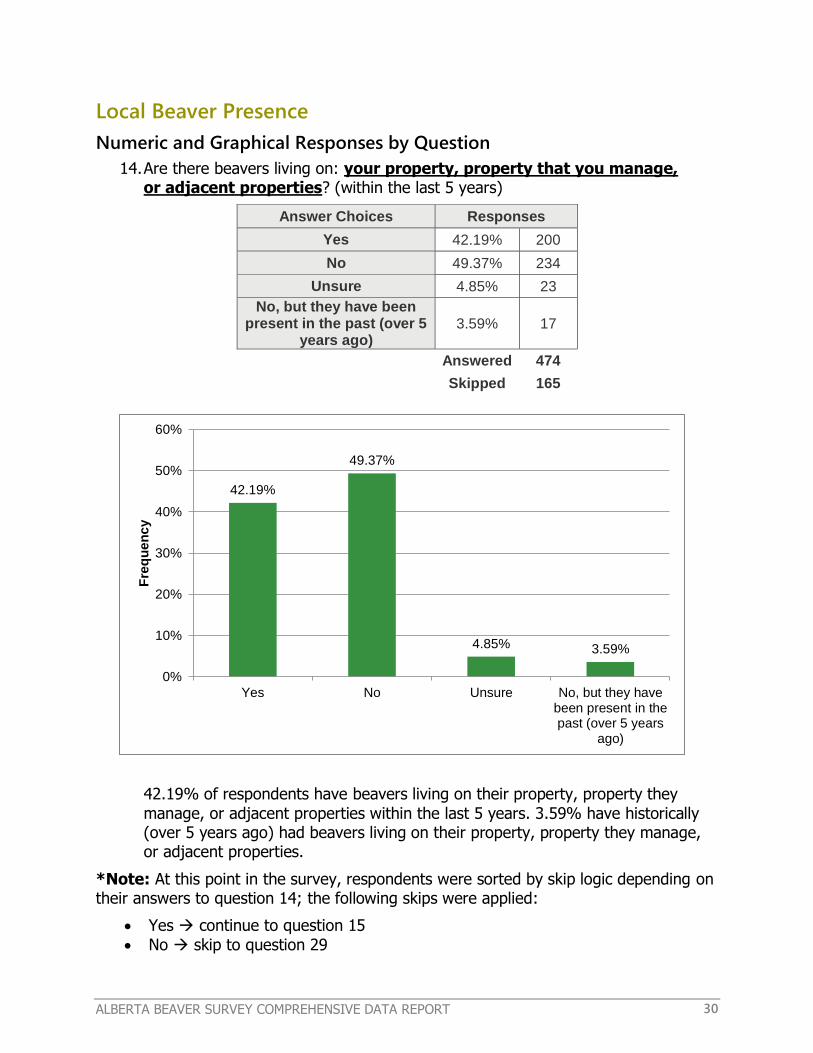
14. Are there beavers living on: your property, property that you manage, or adjacent properties? (within the last 5 years)
Answer Choices Responses
Yes 42.19% 200
No 49.37% 234
Unsure 4.85% 23
No, but they have been present in the past (over 5
years ago) 3.59% 17
Answered 474
Skipped 165
42.19% of respondents have beavers living on their property, property they
manage, or adjacent properties within the last 5 years. 3.59% have historically (over 5 years ago) had beavers living on their property, property they manage, or adjacent properties.
*Note: At this point in the survey, respondents were sorted by skip logic depending on their answers to question 14; the following skips were applied:
Yes continue to question 15
No skip to question 29
42.19%
49.37%
4.85% 3.59%
Yes No Unsure No, but they havebeen present in thepast (over 5 years
ago)
0%
10%
20%
30%
40%
50%
60%
Fre
qu
en
cy

ALBERTA BEAVER SURVEY COMPREHENSIVE DATA REPORT 31
Unsure skip to question 29
No, but they have been present in the past (over 5 years ago) skip to
question 22
This skip logic allowed for more targeted questions with the correct context for the
specific respondent’s circumstance.*
15. With regard to your property or property you manage which would you say is most true:
Answer Choices Responses
Beavers are very common 29.32% 56
Beavers are common 47.64% 91
Beavers are uncommon 18.32% 35
Beavers are rare 3.14% 6
Unsure if beavers are common 1.57% 3
Answered 191
Skipped 448
76.96% of respondents who have beavers on their property, property they manage, or adjacent properties, and answered this question, say that beavers
are common or very common on their property or property they manage.
29.32%
47.64%
18.32%
3.14% 1.57%
Beavers arevery common
Beavers arecommon
Beavers areuncommon
Beavers arerare
Unsure ifbeavers are
common
0%
10%
20%
30%
40%
50%
60%
Fre
qu
en
cy
ALBERTA BEAVER SURVEY COMPREHENSIVE DATA REPORT 32
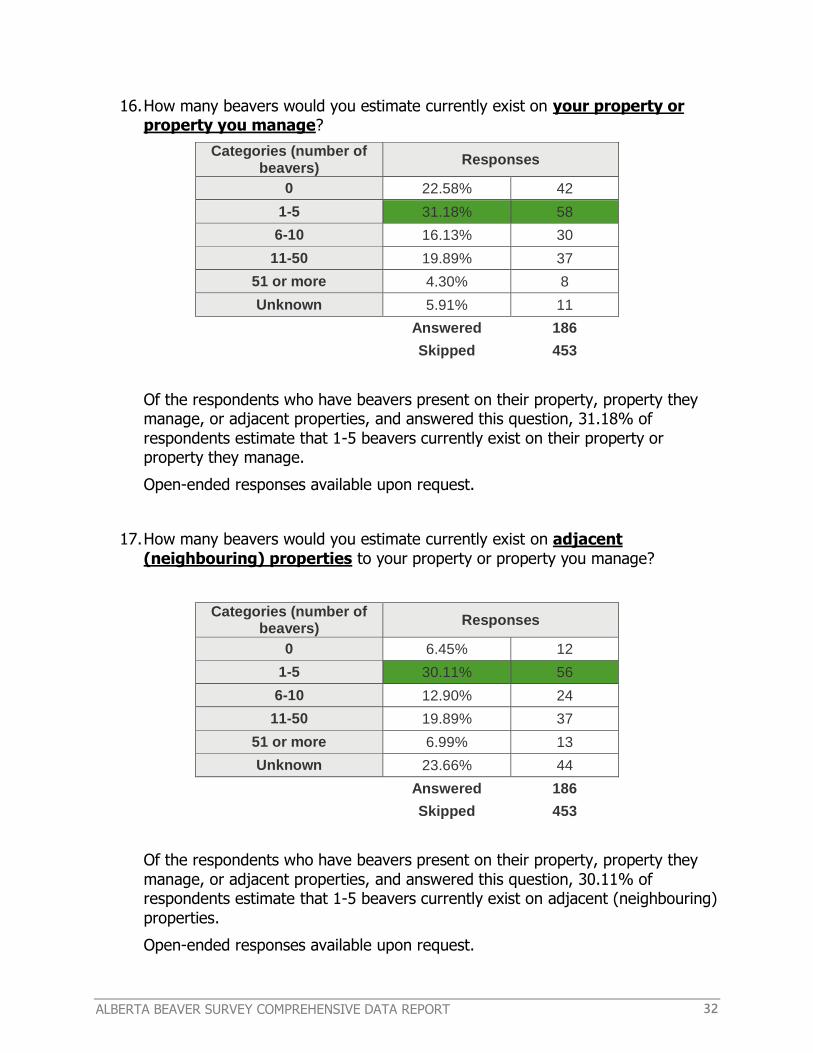
16. How many beavers would you estimate currently exist on your property or property you manage?
Categories (number of beavers)
Responses
0 22.58% 42
1-5 31.18% 58
6-10 16.13% 30
11-50 19.89% 37
51 or more 4.30% 8
Unknown 5.91% 11
Answered 186
Skipped 453
Of the respondents who have beavers present on their property, property they manage, or adjacent properties, and answered this question, 31.18% of
respondents estimate that 1-5 beavers currently exist on their property or property they manage.
Open-ended responses available upon request.
17. How many beavers would you estimate currently exist on adjacent
(neighbouring) properties to your property or property you manage?
Categories (number of beavers)
Responses
0 6.45% 12
1-5 30.11% 56
6-10 12.90% 24
11-50 19.89% 37
51 or more 6.99% 13
Unknown 23.66% 44
Answered 186
Skipped 453
Of the respondents who have beavers present on their property, property they
manage, or adjacent properties, and answered this question, 30.11% of respondents estimate that 1-5 beavers currently exist on adjacent (neighbouring)
properties.
Open-ended responses available upon request.
ALBERTA BEAVER SURVEY COMPREHENSIVE DATA REPORT 33
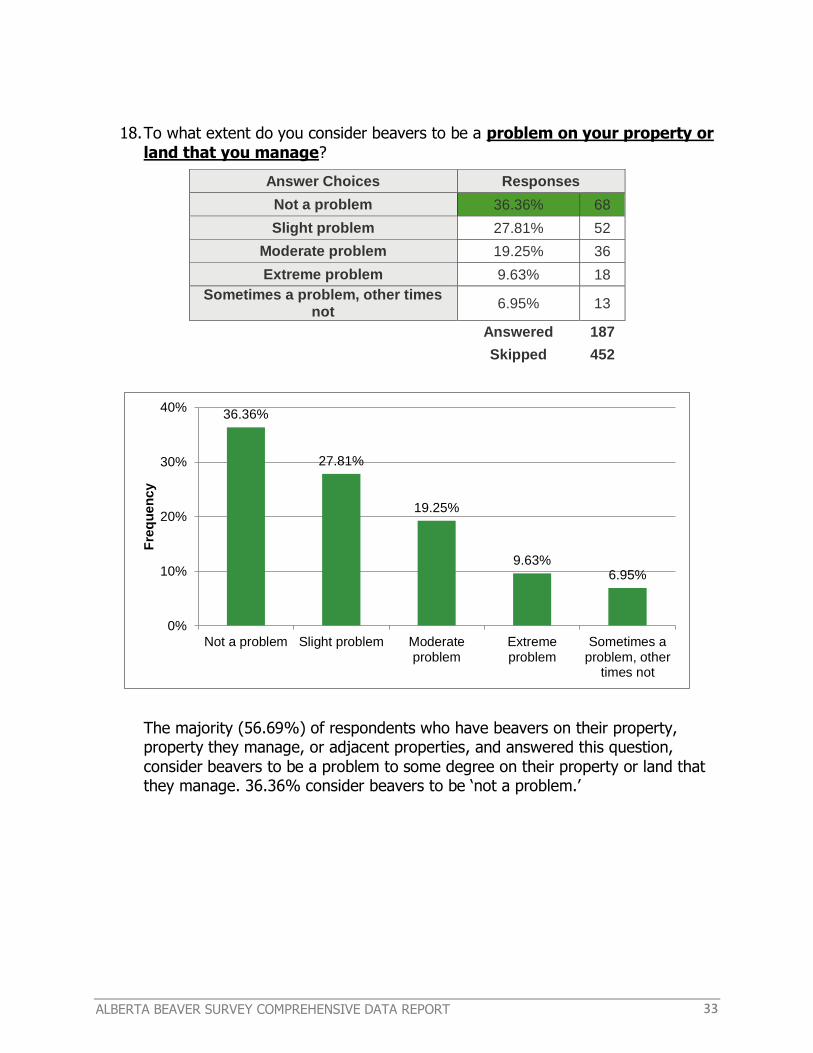
18. To what extent do you consider beavers to be a problem on your property or
land that you manage?
Answer Choices Responses
Not a problem 36.36% 68
Slight problem 27.81% 52
Moderate problem 19.25% 36
Extreme problem 9.63% 18
Sometimes a problem, other times not
6.95% 13
Answered 187
Skipped 452
The majority (56.69%) of respondents who have beavers on their property, property they manage, or adjacent properties, and answered this question,
consider beavers to be a problem to some degree on their property or land that they manage. 36.36% consider beavers to be ‘not a problem.’
36.36%
27.81%
19.25%
9.63% 6.95%
Not a problem Slight problem Moderateproblem
Extremeproblem
Sometimes aproblem, other
times not
0%
10%
20%
30%
40%
Fre
qu
en
cy

ALBERTA BEAVER SURVEY COMPREHENSIVE DATA REPORT 34
19. In general, how would you describe the severity of the beaver damage to your property in the last 5 years?
Answer Choices Responses
No damage 30.81% 57
Light damage 34.05% 63
Moderate damage 22.16% 41
Severe damage 7.57% 14
Highly variable damage, depending on the situation
5.41% 10
Answered 185
Skipped 454
The majority of respondents who have beavers on their property, property they manage, or adjacent properties, and answered this question indicate some level
of damage caused by beavers.
30.81%
34.05%
22.16%
7.57% 5.41%
No damage Light damage Moderatedamage
Severe damage Highly variabledamage,
depending onthe situation
0%
10%
20%
30%
40%
Fre
qu
en
cy

ALBERTA BEAVER SURVEY COMPREHENSIVE DATA REPORT 35
20. How often have beavers caused each of the following on your property over the past 5 years? (please select only one response per row)
Never 1-2 times 3-5 times
More than 5 times
Total
Overflow of a pond, lake, or stream
47.59% 89 28.88% 54 11.76% 22 11.76% 22 187
Flooding of a road or driveway 73.26% 137 16.58% 31 3.74% 7 6.42% 12 187
Flooding of crops, pasture, or fields
63.64% 119 20.86% 39 8.56% 16 6.95% 13 187
Flooding of a home or other building
95.70% 178 2.69% 5 1.61% 3 0.00% 0 186
Damage to trees or shrubs 18.09% 34 26.60% 50 17.02% 32 38.30% 72 188
Damage to culverts (e.g. Plugged culverts, erosion around
culverts) 55.61% 104 27.27% 51 4.81% 9 12.30% 23 187
Blocked irrigation or drainage ditches
75.14% 139 12.97% 24 3.78% 7 8.11% 15 185
Answered 188
Skipped 451
The most common occurrence of damage, within their own property, reported by respondents who have beavers on
their property, property they manage, or adjacent properties, and who answered this question, is damage to trees or shrubs, with 38.30% having this occur more than 5 times. For each other type of damage, the majority of
respondents have never experienced that type of damage or have only experienced it 1-2 times.
Open-ended responses were captured in the ‘other’ category where respondents were asked to ‘please describe the impact and how often beavers have caused it.’ Emergent concerns were noted and will be discussed as part of the
summary of this report. In the ‘other’ responses there was 1 respondent that mentioned the use of mitigation tools.
Open-ended responses available upon request.
ALBERTA BEAVER SURVEY COMPREHENSIVE DATA REPORT 36
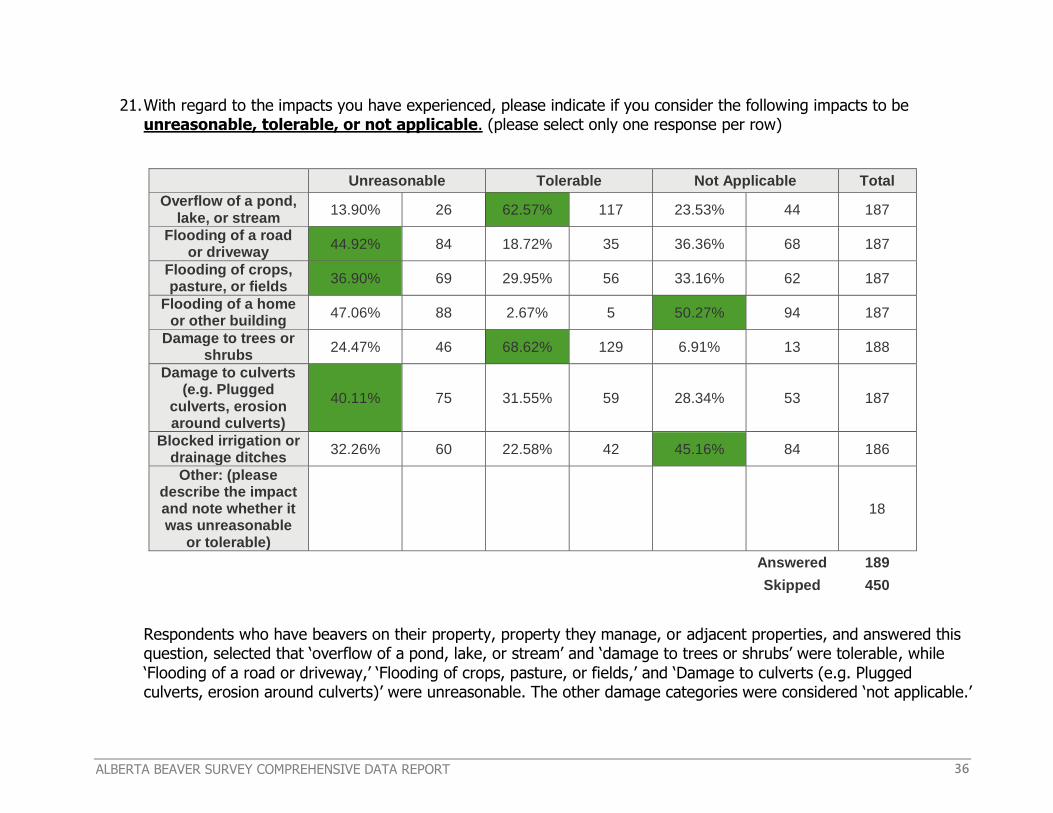
21. With regard to the impacts you have experienced, please indicate if you consider the following impacts to be unreasonable, tolerable, or not applicable. (please select only one response per row)
Unreasonable Tolerable Not Applicable Total
Overflow of a pond, lake, or stream
13.90% 26 62.57% 117 23.53% 44 187
Flooding of a road or driveway
44.92% 84 18.72% 35 36.36% 68 187
Flooding of crops, pasture, or fields
36.90% 69 29.95% 56 33.16% 62 187
Flooding of a home or other building
47.06% 88 2.67% 5 50.27% 94 187
Damage to trees or shrubs
24.47% 46 68.62% 129 6.91% 13 188
Damage to culverts (e.g. Plugged
culverts, erosion around culverts)
40.11% 75 31.55% 59 28.34% 53 187
Blocked irrigation or drainage ditches
32.26% 60 22.58% 42 45.16% 84 186
Other: (please describe the impact and note whether it was unreasonable
or tolerable)
18
Answered 189
Skipped 450
Respondents who have beavers on their property, property they manage, or adjacent properties, and answered this question, selected that ‘overflow of a pond, lake, or stream’ and ‘damage to trees or shrubs’ were tolerable, while
‘Flooding of a road or driveway,’ ‘Flooding of crops, pasture, or fields,’ and ‘Damage to culverts (e.g. Plugged culverts, erosion around culverts)’ were unreasonable. The other damage categories were considered ‘not applicable.’

ALBERTA BEAVER SURVEY COMPREHENSIVE DATA REPORT 37
Open-ended responses were captured in the ‘other’ category where respondents were asked to ‘please describe the impact and note whether it was unreasonable or tolerable.’ There were no emergent concerns noted from the
analysis of these responses. In the ‘other’ responses there were 4 respondents that mentioned the use of mitigation tools.
Open-ended responses available upon request.

ALBERTA BEAVER SURVEY COMPREHENSIVE DATA REPORT 38
Historical Local Beaver Presence
Numeric and Graphical Responses by Question
22. Historically, with regard to your property or property you manage which would you say is most true:
Answer Choices Responses
Beavers were very common 6.25% 1
Beavers were common 18.75% 3
Beavers were uncommon 31.25% 5
Beavers were rare 25.00% 4
Unsure if beavers were common
18.75% 3
Answered 16
Skipped 623
56.25% of respondents who historically had beavers on their property, property they manage, or adjacent properties, and answered this question, say that
beavers were uncommon or rare on their property or property they managed.
6.25%
18.75%
31.25%
25.00%
18.75%
Beavers werevery common
Beavers werecommon
Beavers wereuncommon
Beavers wererare
Unsure ifbeavers were
common
0%
10%
20%
30%
40%
Fre
qu
en
cy

ALBERTA BEAVER SURVEY COMPREHENSIVE DATA REPORT 39
23. How many beavers would you estimate historically existed on your property or property you manage over a one year period?
Categories (number of beavers)
Responses
0 7.41% 1
1-5 64.29% 9
6-10 7.41% 1
11-50 0.00% 0
51 or more 0.00% 0
Unknown 21.43% 3
Answered 14
Skipped 625
Of the respondents who historically had beavers present on their property, property they manage, or adjacent properties, and answered this question,
64.29% of respondents estimate that historically 1-5 beavers existed on their property or property they manage over a one year period.
Open-ended responses available upon request.
24. How many beavers would you estimate historically existed on adjacent
(neighbouring) properties to your property or property you manage over a one year period?
Categories (number of beavers)
Responses
0 14.29% 2
1-5 35.71% 5
6-10 21.43% 3
11-50 0.00% 0
51 or more 0.00% 0
Unknown 28.57% 4
Answered 14
Skipped 625
Of the respondents who historically had beavers present on their property,
property they manage, or adjacent properties, and answered this question, 35.71% of respondents estimate that historically 1-5 beavers existed on adjacent
(neighbouring) properties over a one year period.
Open-ended responses available upon request.

ALBERTA BEAVER SURVEY COMPREHENSIVE DATA REPORT 40
25. Historically, to what extent did you consider beavers to be a problem on your
property or land that you manage?
Answer Choices Responses
Not a problem 37.50% 6
Slight problem 43.75% 7
Moderate problem 0.00% 0
Extreme problem 0.00% 0
Sometimes a problem, other times not
18.75% 3
Answered 16
Skipped 623
The majority of respondents (43.75%) of respondents who historically had beavers on their property, property they manage, or adjacent properties, and answered this question, considered beavers to be a ‘slight problem’ on their
property or land that they manage. 37.50% considered beavers to be ‘not a problem.’
37.50%
43.75%
0.00% 0.00%
18.75%
Not a problem Slight problem Moderateproblem
Extremeproblem
Sometimes aproblem, other
times not
0%
10%
20%
30%
40%
50%
Fre
qu
en
cy
ALBERTA BEAVER SURVEY COMPREHENSIVE DATA REPORT 41
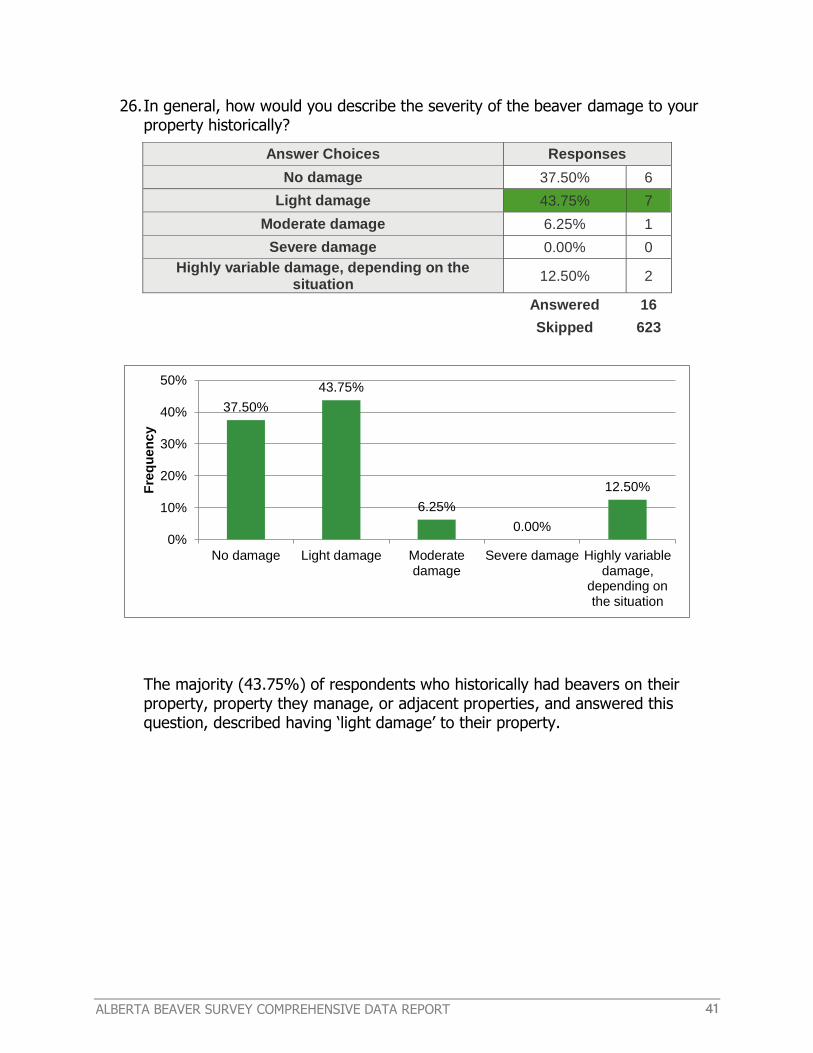
26. In general, how would you describe the severity of the beaver damage to your property historically?
Answer Choices Responses
No damage 37.50% 6
Light damage 43.75% 7
Moderate damage 6.25% 1
Severe damage 0.00% 0
Highly variable damage, depending on the situation
12.50% 2
Answered 16
Skipped 623
The majority (43.75%) of respondents who historically had beavers on their property, property they manage, or adjacent properties, and answered this question, described having ‘light damage’ to their property.
37.50%
43.75%
6.25%
0.00%
12.50%
No damage Light damage Moderatedamage
Severe damage Highly variabledamage,
depending onthe situation
0%
10%
20%
30%
40%
50%
Fre
qu
en
cy
ALBERTA BEAVER SURVEY COMPREHENSIVE DATA REPORT 42
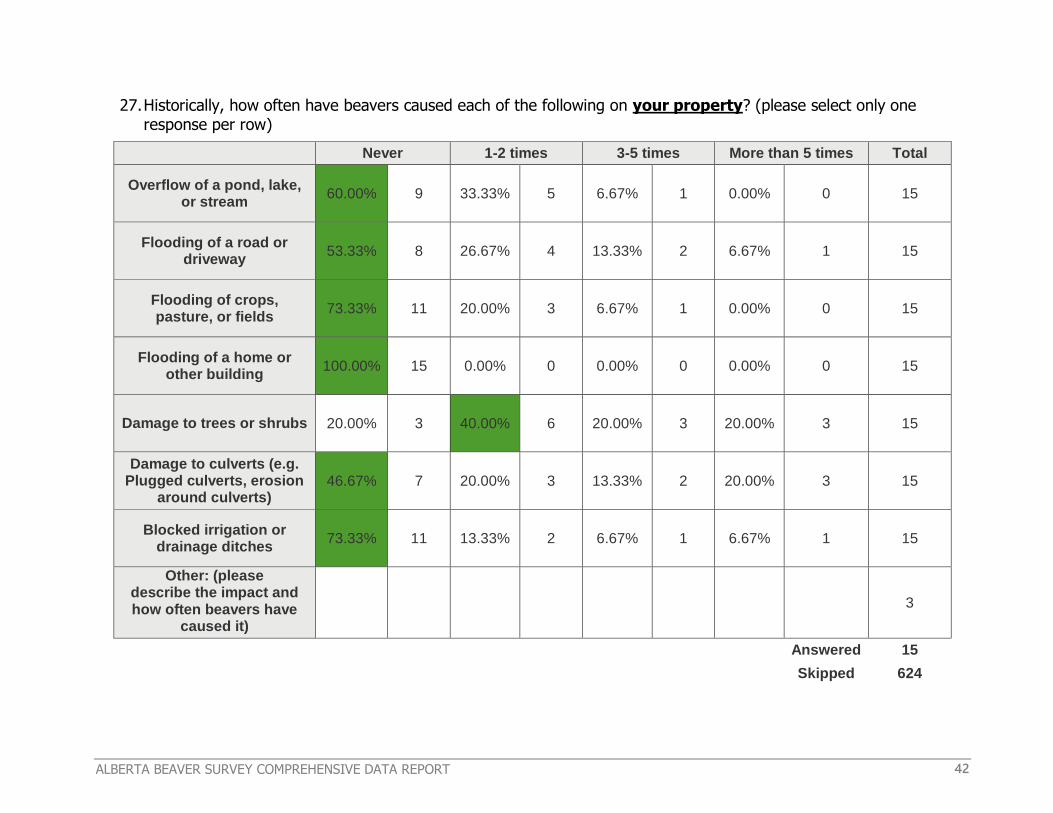
27. Historically, how often have beavers caused each of the following on your property? (please select only one response per row)
Never 1-2 times 3-5 times More than 5 times Total
Overflow of a pond, lake, or stream
60.00% 9 33.33% 5 6.67% 1 0.00% 0 15
Flooding of a road or driveway
53.33% 8 26.67% 4 13.33% 2 6.67% 1 15
Flooding of crops, pasture, or fields
73.33% 11 20.00% 3 6.67% 1 0.00% 0 15
Flooding of a home or other building
100.00% 15 0.00% 0 0.00% 0 0.00% 0 15
Damage to trees or shrubs 20.00% 3 40.00% 6 20.00% 3 20.00% 3 15
Damage to culverts (e.g. Plugged culverts, erosion
around culverts) 46.67% 7 20.00% 3 13.33% 2 20.00% 3 15
Blocked irrigation or drainage ditches
73.33% 11 13.33% 2 6.67% 1 6.67% 1 15
Other: (please describe the impact and how often beavers have
caused it)
3
Answered 15
Skipped 624

ALBERTA BEAVER SURVEY COMPREHENSIVE DATA REPORT 43
The most common occurrence of damage, within their own property, reported by respondents who historically had beavers on their property, property they manage, or adjacent properties, and answered this question, is damage to trees or shrubs,
with 40.00% having this occur 1-2 times. For each other type of damage, the majority of respondents have never experienced this damage.
Open-ended responses were captured in the ‘other’ category where respondents were asked to ‘please describe the impact and how often beavers have caused it.’
Open-ended responses available upon request.
ALBERTA BEAVER SURVEY COMPREHENSIVE DATA REPORT 44
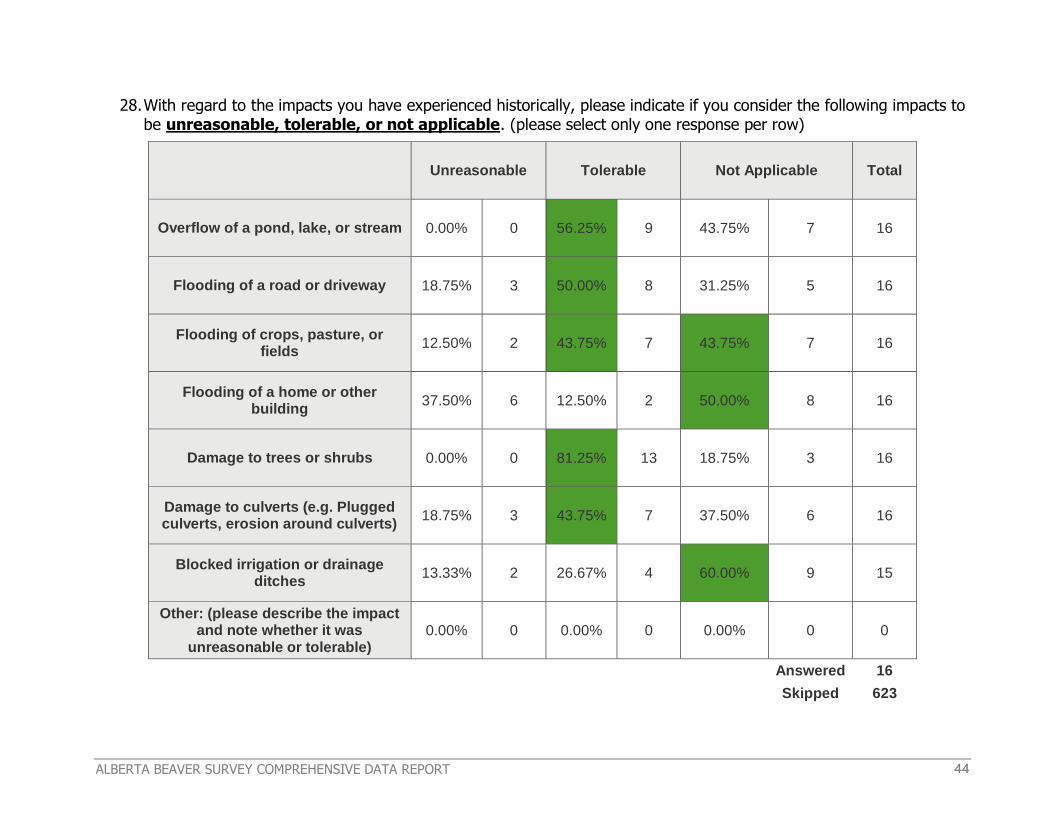
28. With regard to the impacts you have experienced historically, please indicate if you consider the following impacts to be unreasonable, tolerable, or not applicable. (please select only one response per row)
Unreasonable Tolerable Not Applicable Total
Overflow of a pond, lake, or stream 0.00% 0 56.25% 9 43.75% 7 16
Flooding of a road or driveway 18.75% 3 50.00% 8 31.25% 5 16
Flooding of crops, pasture, or fields
12.50% 2 43.75% 7 43.75% 7 16
Flooding of a home or other building
37.50% 6 12.50% 2 50.00% 8 16
Damage to trees or shrubs 0.00% 0 81.25% 13 18.75% 3 16
Damage to culverts (e.g. Plugged culverts, erosion around culverts)
18.75% 3 43.75% 7 37.50% 6 16
Blocked irrigation or drainage ditches
13.33% 2 26.67% 4 60.00% 9 15
Other: (please describe the impact and note whether it was
unreasonable or tolerable) 0.00% 0 0.00% 0 0.00% 0 0
Answered 16
Skipped 623

ALBERTA BEAVER SURVEY COMPREHENSIVE DATA REPORT 45
Respondents who historically had beavers on their property, property they manage, or adjacent properties, and
answered this question, selected all damage types to be either tolerable or not applicable.
There were no open-ended responses were captured in the ‘other’ category where respondents were asked to
‘please describe the impact and note whether it was unreasonable or tolerable.’
ALBERTA BEAVER SURVEY COMPREHENSIVE DATA REPORT 46
Beaver Benefits
Numeric and Graphical Responses by Question
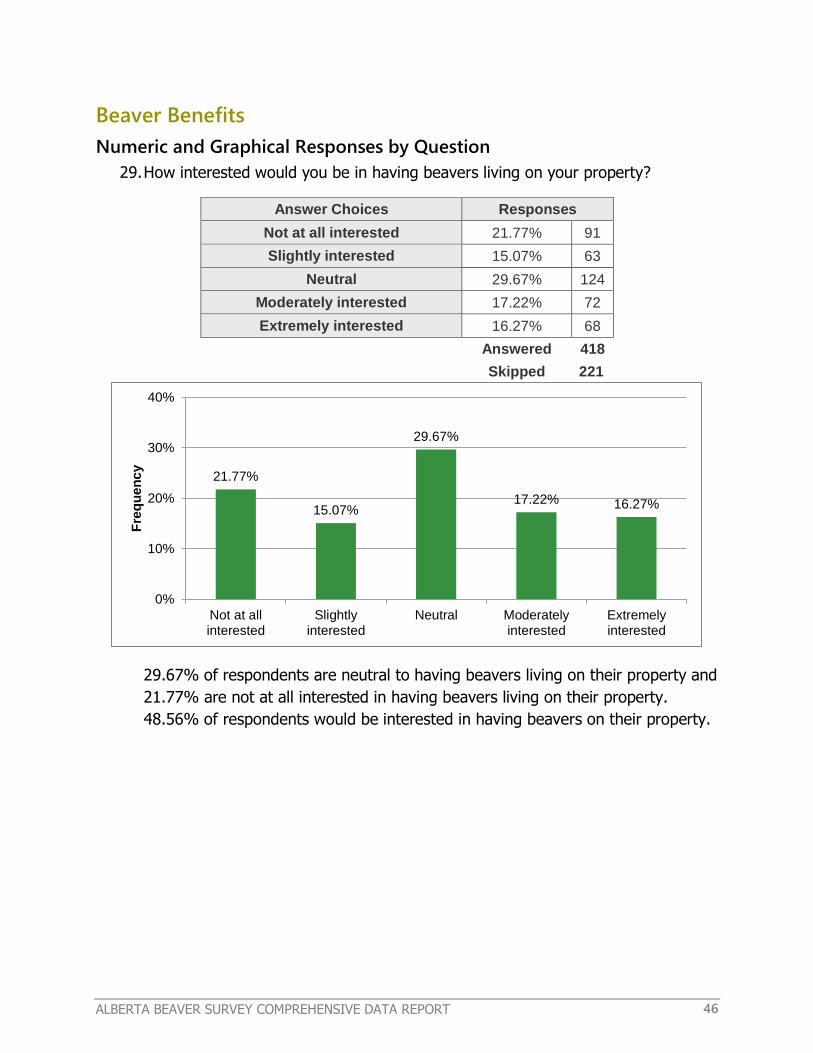
29. How interested would you be in having beavers living on your property?
Answer Choices Responses
Not at all interested 21.77% 91
Slightly interested 15.07% 63
Neutral 29.67% 124
Moderately interested 17.22% 72
Extremely interested 16.27% 68
Answered 418
Skipped 221
29.67% of respondents are neutral to having beavers living on their property and
21.77% are not at all interested in having beavers living on their property.
48.56% of respondents would be interested in having beavers on their property.
21.77%
15.07%
29.67%
17.22% 16.27%
Not at allinterested
Slightlyinterested
Neutral Moderatelyinterested
Extremelyinterested
0%
10%
20%
30%
40%
Fre
qu
en
cy

ALBERTA BEAVER SURVEY COMPREHENSIVE DATA REPORT 47
30. Do you receive all the benefits that you want to receive from beavers or beaver
wetlands?
Answer Choices Responses
Yes 40.10% 168
No 17.42% 73
Don’t know 37.23% 156
There are no benefits from beavers
5.25% 22
Answered 419
Skipped 220
40.10% of respondents answered yes, they receive all the benefits they want
from beavers or beaver wetlands, and 37.23% answered that they don’t know.
17.42% answered no, they do not receive all the benefits they want from
beavers or beaver wetlands. 5.25% of respondents answered that there are no
benefits from beavers.
40.10%
17.42%
37.23%
5.25%
Yes No Don’t know There are nobenefits from
beavers
0%
10%
20%
30%
40%
50%
Fre
qu
en
cy

ALBERTA BEAVER SURVEY COMPREHENSIVE DATA REPORT 48
31. Please select which category most applies to you with regard to receiving benefits from beavers: (please select only
one response per row)
I have received
this benefit
I have not received this
benefit but could
This benefit is not applicable
Not sure Total
Increased livestock watering areas
15.97% 65 14.25% 58 56.27% 229 13.51% 55 407
Increased riparian (streamside or shoreline)
vegetation 39.56% 161 20.64% 84 27.03% 110 12.78% 52 407
Increased species diversity 39.07% 159 22.60% 92 20.88% 85 17.44% 71 407
Increased wildlife numbers 35.78% 146 24.51% 100 22.06% 90 17.65% 72 408
Elevated water tables 27.76% 113 21.38% 87 29.73% 121 21.13% 86 407
Improved water quality (reduction of sediment,
etc.) 25.31% 103 21.62% 88 31.20% 127 21.87% 89 407
Reduced flooding 13.02% 53 29.73% 121 37.35% 152 19.90% 81 407
Increased fishing opportunities
14.22% 58 23.04% 94 48.77% 199 13.97% 57 408

ALBERTA BEAVER SURVEY COMPREHENSIVE DATA REPORT 49
I have received
this benefit
I have not received this
benefit but could
This benefit is not applicable
Not sure Total
Increased waterfowl hunting opportunities
14.04% 57 20.44% 83 53.69% 218 11.82% 48 406
Aesthetic qualities/nature watching opportunities
55.53% 226 16.95% 69 19.66% 80 7.86% 32 407
Other: (please specify the benefit and which category
it falls under) 38
Answered 410
Skipped 229
The majority of the respondents answered that either the benefit was not applicable or they are already receiving the benefit.
Open-ended responses were captured in the ‘other’ category where respondents were asked to ‘please specify the
benefit and which category it falls under.’ Emergent benefits were noted and will be discussed as part of the summary of this report. In addition, emergent concerns were noted from the ‘other’ category of this question and
will be discussed as part of the summary of this report.
Open-ended responses available upon request.

ALBERTA BEAVER SURVEY COMPREHENSIVE DATA REPORT 50
32. Please check off all of the benefits you would like to receive more of from
beavers and are applicable to your land/property:
I want to receive
more of this benefit
Increased livestock watering areas 82 25.15%
Increased riparian (streamside) vegetation 215 65.95%
Increased species diversity 242 74.23%
Increased wildlife numbers 235 72.09%
Elevated water tables 161 49.39%
Improved water quality (reduction of sediment, etc.)
211 64.72%
Reduced flooding 190 58.28%
Increased fishing opportunities 132 40.49%
Increased waterfowl hunting opportunities 90 27.61%
Monetary return from fur trapping 60 18.40%
Recreational trapping opportunities 64 19.63%
Aesthetic qualities 212 65.03%
Nature watching opportunities 251 76.99%
Other 17 5.21%
Other: (please specify) 32 9.82%
Answered 326
Skipped 313
The top selected benefits are highlighted in green in the table above.
Open-ended responses available upon request.
ALBERTA BEAVER SURVEY COMPREHENSIVE DATA REPORT 51
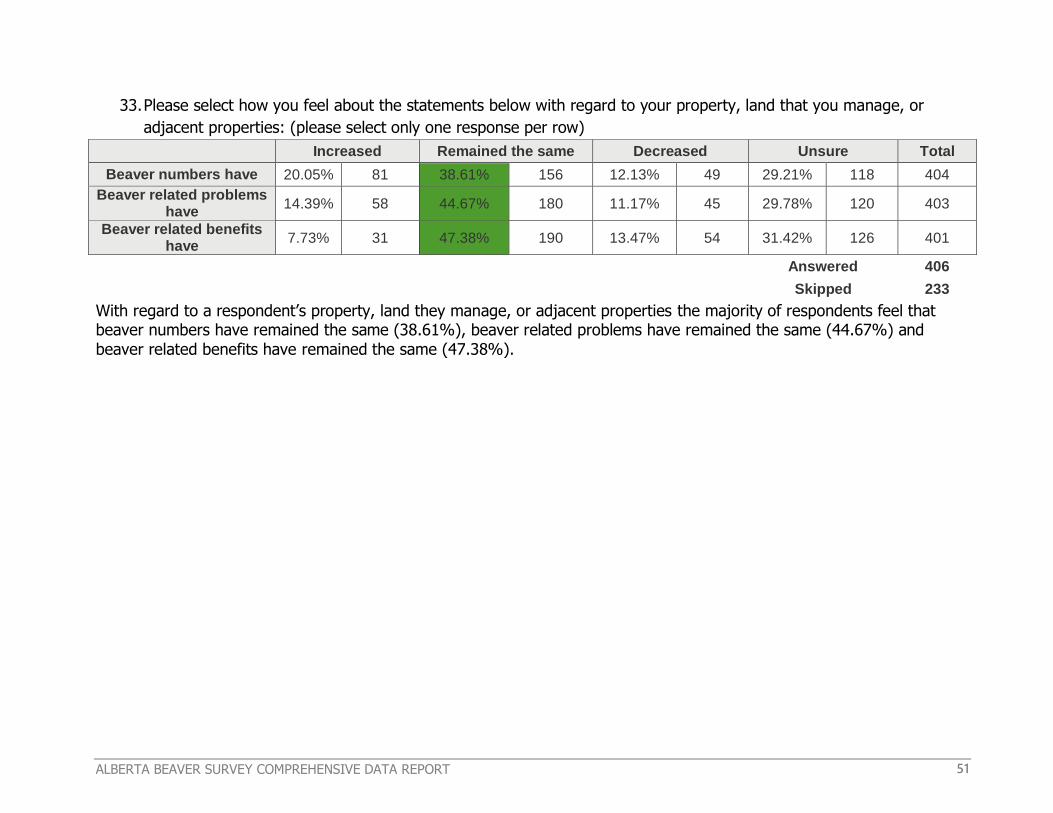
33. Please select how you feel about the statements below with regard to your property, land that you manage, or
adjacent properties: (please select only one response per row)
Increased Remained the same Decreased Unsure Total
Beaver numbers have 20.05% 81 38.61% 156 12.13% 49 29.21% 118 404
Beaver related problems have
14.39% 58 44.67% 180 11.17% 45 29.78% 120 403
Beaver related benefits have
7.73% 31 47.38% 190 13.47% 54 31.42% 126 401
Answered 406
Skipped 233
With regard to a respondent’s property, land they manage, or adjacent properties the majority of respondents feel that beaver numbers have remained the same (38.61%), beaver related problems have remained the same (44.67%) and
beaver related benefits have remained the same (47.38%).
ALBERTA BEAVER SURVEY COMPREHENSIVE DATA REPORT 52
Tolerance and Management Actions
Numeric and Graphical Responses by Question
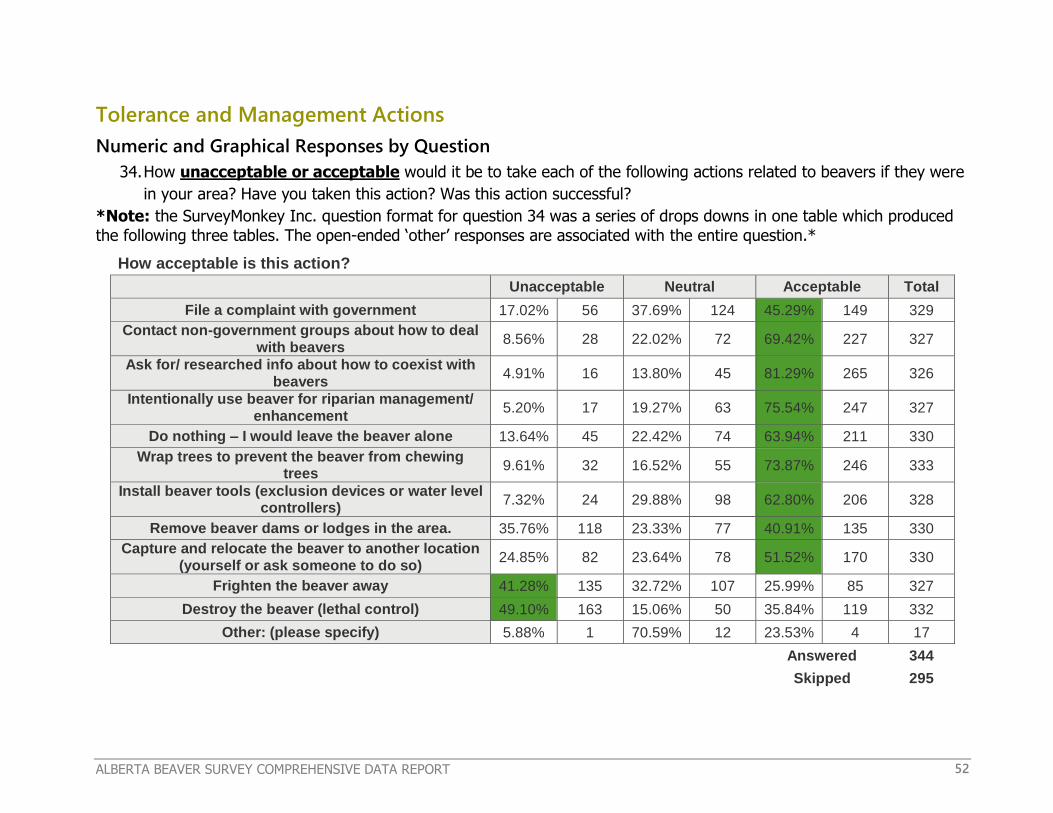
34. How unacceptable or acceptable would it be to take each of the following actions related to beavers if they were
in your area? Have you taken this action? Was this action successful?
*Note: the SurveyMonkey Inc. question format for question 34 was a series of drops downs in one table which produced
the following three tables. The open-ended ‘other’ responses are associated with the entire question.*
How acceptable is this action?
Unacceptable Neutral Acceptable Total
File a complaint with government 17.02% 56 37.69% 124 45.29% 149 329
Contact non-government groups about how to deal with beavers
8.56% 28 22.02% 72 69.42% 227 327
Ask for/ researched info about how to coexist with beavers
4.91% 16 13.80% 45 81.29% 265 326
Intentionally use beaver for riparian management/ enhancement
5.20% 17 19.27% 63 75.54% 247 327
Do nothing – I would leave the beaver alone 13.64% 45 22.42% 74 63.94% 211 330
Wrap trees to prevent the beaver from chewing trees
9.61% 32 16.52% 55 73.87% 246 333
Install beaver tools (exclusion devices or water level controllers)
7.32% 24 29.88% 98 62.80% 206 328
Remove beaver dams or lodges in the area. 35.76% 118 23.33% 77 40.91% 135 330
Capture and relocate the beaver to another location (yourself or ask someone to do so)
24.85% 82 23.64% 78 51.52% 170 330
Frighten the beaver away 41.28% 135 32.72% 107 25.99% 85 327
Destroy the beaver (lethal control) 49.10% 163 15.06% 50 35.84% 119 332
Other: (please specify) 5.88% 1 70.59% 12 23.53% 4 17
Answered 344
Skipped 295
ALBERTA BEAVER SURVEY COMPREHENSIVE DATA REPORT 53
The majority of respondents believe most actions are acceptable. The two unacceptable actions were to ‘frighten the
beaver away’ or ‘destroy the beaver (lethal control).’
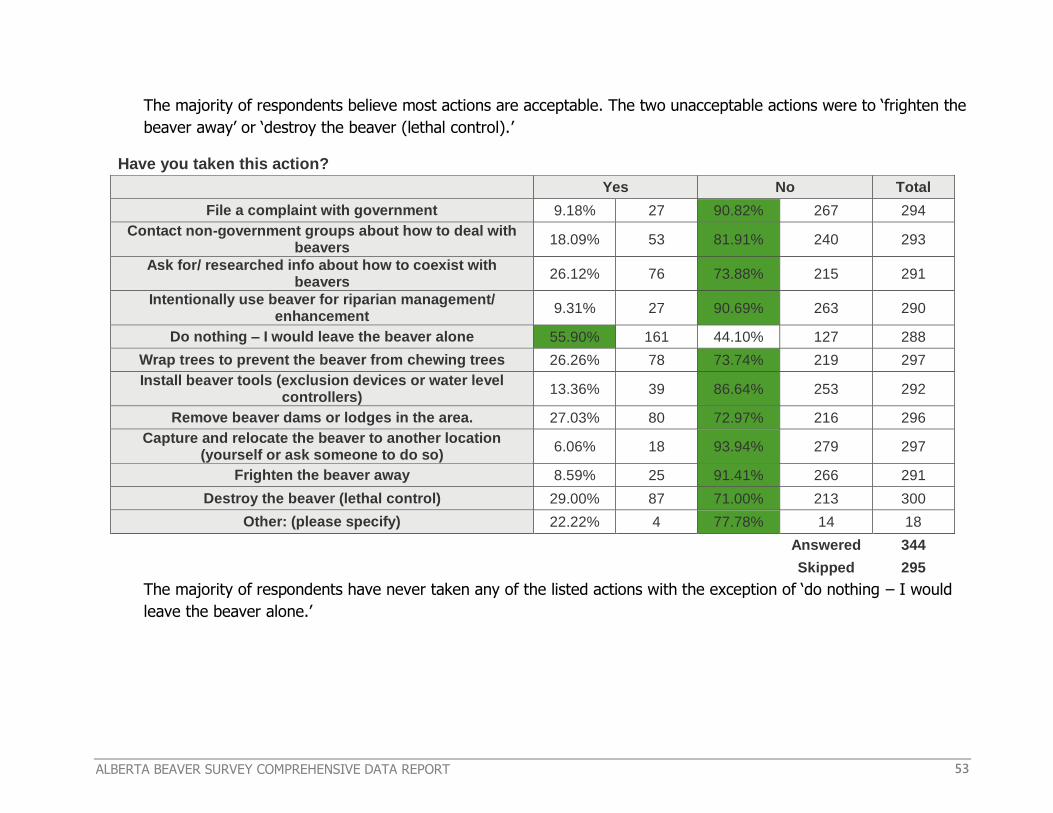
Have you taken this action?
Yes No Total
File a complaint with government 9.18% 27 90.82% 267 294
Contact non-government groups about how to deal with beavers
18.09% 53 81.91% 240 293
Ask for/ researched info about how to coexist with beavers
26.12% 76 73.88% 215 291
Intentionally use beaver for riparian management/ enhancement
9.31% 27 90.69% 263 290
Do nothing – I would leave the beaver alone 55.90% 161 44.10% 127 288
Wrap trees to prevent the beaver from chewing trees 26.26% 78 73.74% 219 297
Install beaver tools (exclusion devices or water level controllers)
13.36% 39 86.64% 253 292
Remove beaver dams or lodges in the area. 27.03% 80 72.97% 216 296
Capture and relocate the beaver to another location (yourself or ask someone to do so)
6.06% 18 93.94% 279 297
Frighten the beaver away 8.59% 25 91.41% 266 291
Destroy the beaver (lethal control) 29.00% 87 71.00% 213 300
Other: (please specify) 22.22% 4 77.78% 14 18
Answered 344
Skipped 295
The majority of respondents have never taken any of the listed actions with the exception of ‘do nothing – I would
leave the beaver alone.’
ALBERTA BEAVER SURVEY COMPREHENSIVE DATA REPORT 54
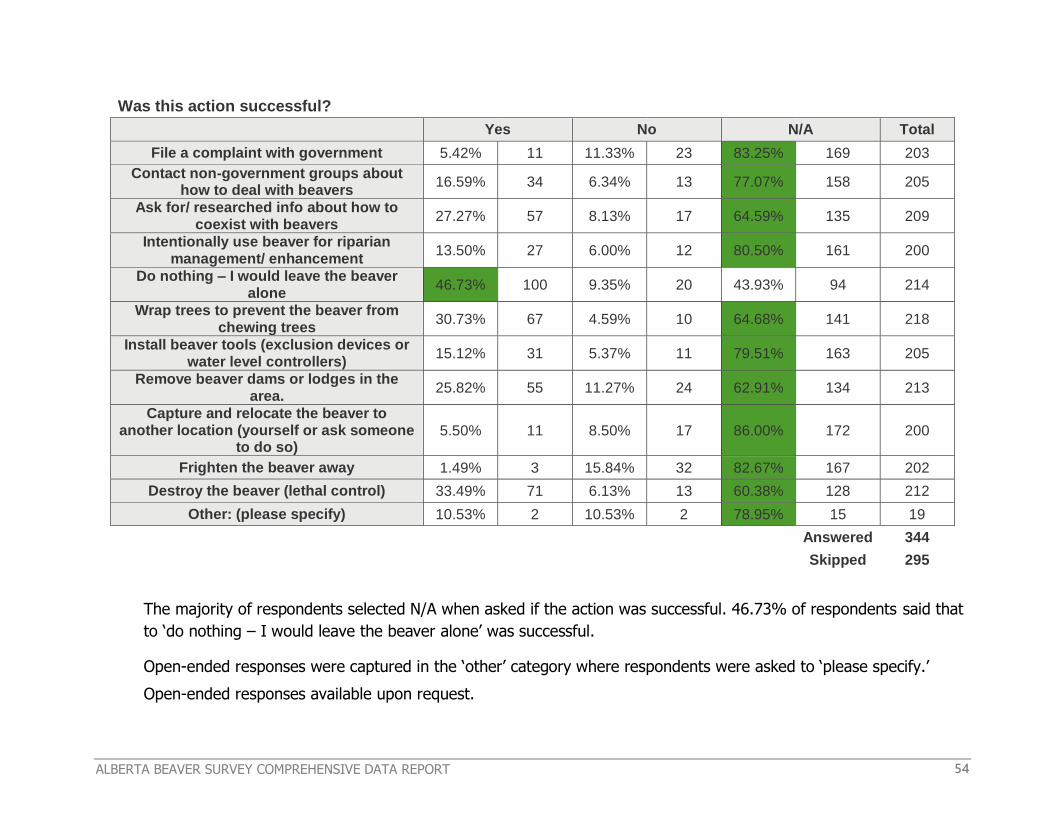
Was this action successful?
Yes No N/A Total
File a complaint with government 5.42% 11 11.33% 23 83.25% 169 203
Contact non-government groups about how to deal with beavers
16.59% 34 6.34% 13 77.07% 158 205
Ask for/ researched info about how to coexist with beavers
27.27% 57 8.13% 17 64.59% 135 209
Intentionally use beaver for riparian management/ enhancement
13.50% 27 6.00% 12 80.50% 161 200
Do nothing – I would leave the beaver alone
46.73% 100 9.35% 20 43.93% 94 214
Wrap trees to prevent the beaver from chewing trees
30.73% 67 4.59% 10 64.68% 141 218
Install beaver tools (exclusion devices or water level controllers)
15.12% 31 5.37% 11 79.51% 163 205
Remove beaver dams or lodges in the area.
25.82% 55 11.27% 24 62.91% 134 213
Capture and relocate the beaver to another location (yourself or ask someone
to do so) 5.50% 11 8.50% 17 86.00% 172 200
Frighten the beaver away 1.49% 3 15.84% 32 82.67% 167 202
Destroy the beaver (lethal control) 33.49% 71 6.13% 13 60.38% 128 212
Other: (please specify) 10.53% 2 10.53% 2 78.95% 15 19
Answered 344
Skipped 295
The majority of respondents selected N/A when asked if the action was successful. 46.73% of respondents said that
to ‘do nothing – I would leave the beaver alone’ was successful.
Open-ended responses were captured in the ‘other’ category where respondents were asked to ‘please specify.’
Open-ended responses available upon request.

ALBERTA BEAVER SURVEY COMPREHENSIVE DATA REPORT 55
35. Who do you think should be responsible for addressing problems with beavers on your property or
neighboring properties? (Please check all that apply)
Answer Choices Responses
Individual residents experiencing the problem
66.76% 241
Municipal government 52.91% 191
Alberta government 62.33% 225
Federal government 18.28% 66
First Nations council 15.24% 55
Private animal control personnel 21.88% 79
Citizen groups 11.91% 43
Regulated trappers 42.11% 152
Other: (please specify) 7.76% 28
Answered 361
Skipped 278
66.76%
52.91% 62.33%
18.28% 15.24% 21.88%
11.91%
42.11%
7.76%
0%
10%
20%
30%
40%
50%
60%
70%
80%
Fre
qu
en
cy

ALBERTA BEAVER SURVEY COMPREHENSIVE DATA REPORT 56
Respondents’ top 4 groups that they think should be responsible for addressing problems with beavers on their
property or neighboring properties is: individual residents experiencing the problem (66.76%), Alberta government
(62.33%), Municipal government (52.91%) and regulated trappers (42.11%).
Open-ended responses were captured in the ‘other’ category where respondents were asked to ‘please specify.’
Emerging categories for responsibility are: environmental non-governmental organizations, research groups, non-lethal management companies, with the top category being a shared approach to responsibility (shared between various groups).
Open-ended responses available upon request.
ALBERTA BEAVER SURVEY COMPREHENSIVE DATA REPORT 57
Incentives
Numeric and Graphical Responses by Question
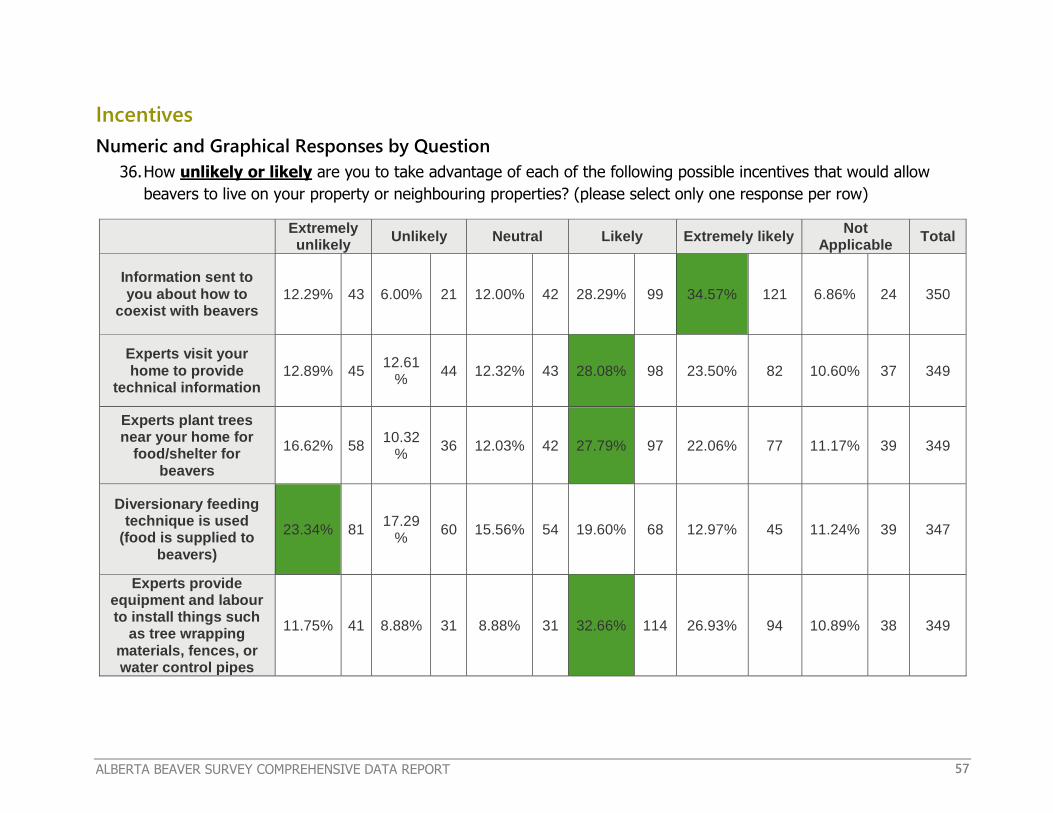
36. How unlikely or likely are you to take advantage of each of the following possible incentives that would allow
beavers to live on your property or neighbouring properties? (please select only one response per row)
Extremely unlikely
Unlikely Neutral Likely Extremely likely Not
Applicable Total
Information sent to you about how to
coexist with beavers 12.29% 43 6.00% 21 12.00% 42 28.29% 99 34.57% 121 6.86% 24 350
Experts visit your home to provide
technical information 12.89% 45
12.61%
44 12.32% 43 28.08% 98 23.50% 82 10.60% 37 349
Experts plant trees near your home for
food/shelter for beavers
16.62% 58 10.32
% 36 12.03% 42 27.79% 97 22.06% 77 11.17% 39 349
Diversionary feeding technique is used
(food is supplied to beavers)
23.34% 81 17.29
% 60 15.56% 54 19.60% 68 12.97% 45 11.24% 39 347
Experts provide equipment and labour to install things such
as tree wrapping materials, fences, or water control pipes
11.75% 41 8.88% 31 8.88% 31 32.66% 114 26.93% 94 10.89% 38 349
ALBERTA BEAVER SURVEY COMPREHENSIVE DATA REPORT 58
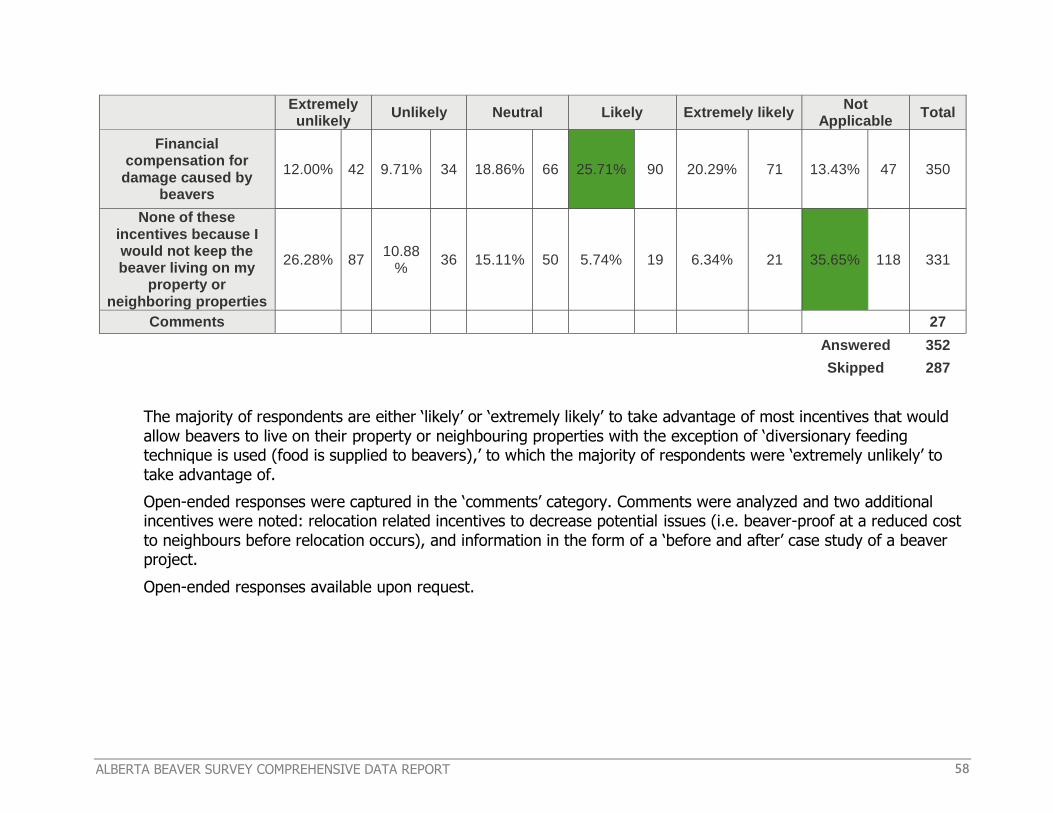
Extremely unlikely
Unlikely Neutral Likely Extremely likely Not
Applicable Total
Financial compensation for
damage caused by beavers
12.00% 42 9.71% 34 18.86% 66 25.71% 90 20.29% 71 13.43% 47 350
None of these incentives because I would not keep the beaver living on my
property or neighboring properties
26.28% 87 10.88
% 36 15.11% 50 5.74% 19 6.34% 21 35.65% 118 331
Comments
27
Answered 352
Skipped 287
The majority of respondents are either ‘likely’ or ‘extremely likely’ to take advantage of most incentives that would
allow beavers to live on their property or neighbouring properties with the exception of ‘diversionary feeding technique is used (food is supplied to beavers),’ to which the majority of respondents were ‘extremely unlikely’ to
take advantage of.
Open-ended responses were captured in the ‘comments’ category. Comments were analyzed and two additional incentives were noted: relocation related incentives to decrease potential issues (i.e. beaver-proof at a reduced cost
to neighbours before relocation occurs), and information in the form of a ‘before and after’ case study of a beaver project.
Open-ended responses available upon request.

ALBERTA BEAVER SURVEY COMPREHENSIVE DATA REPORT 59
Demographic
Numeric and Graphical Responses by Question
37. Please select the municipality where you own, rent, or lease land/property in
which you completed this survey in regards to:

ALBERTA BEAVER SURVEY COMPREHENSIVE DATA REPORT 60
Answer Choices Responses
Athabasca County 0.56% 2
Beaver County 0.56% 2
Big Lakes County 0.28% 1
Brazeau County 0.56% 2
California 0.28% 1
Camrose County 0.84% 3
Cardston County 0.56% 2
City of Airdrie 0.28% 1
City of Calgary 14.21% 51
City of Camrose 0.28% 1
City of Edmonton 1.67% 6
City of Grande Prairie 0.28% 1
City of Lacombe 0.28% 1
City of Leduc 0.56% 2
City of Lethbridge 1.11% 4
City of Medicine Hat 0.84% 3
City of Red Deer 2.23% 8
City of St. Albert 0.28% 1
City of Wetaskiwin 0.28% 1
Clear Hills County 0.28% 1
Clearwater County 1.67% 6
County of 40 Mile 1.11% 4
County of Barrhead 0.56% 2
County of Grande Prairie 0.56% 2
County of Lethbridge 3.06% 11
County of Minburn 0.56% 2
County of Newell 1.67% 6
County of Northern Lights 0.56% 2
County of Paintearth 0.28% 1
County of St. Paul 0.56% 2
County of Stettler 0.28% 1
County of Two Hills 0.28% 1
County of Vermilion River 0.56% 2
County of Warner 0.84% 3
County of Wetaskiwin 1.39% 5
Cypress County 2.79% 10
Flagstaff County 0.84% 3
Kananaskis Improvement District 0.28% 1
Lac La Biche County 0.28% 1
Lac Ste. Anne County 0.84% 3
Lacombe County 1.67% 6
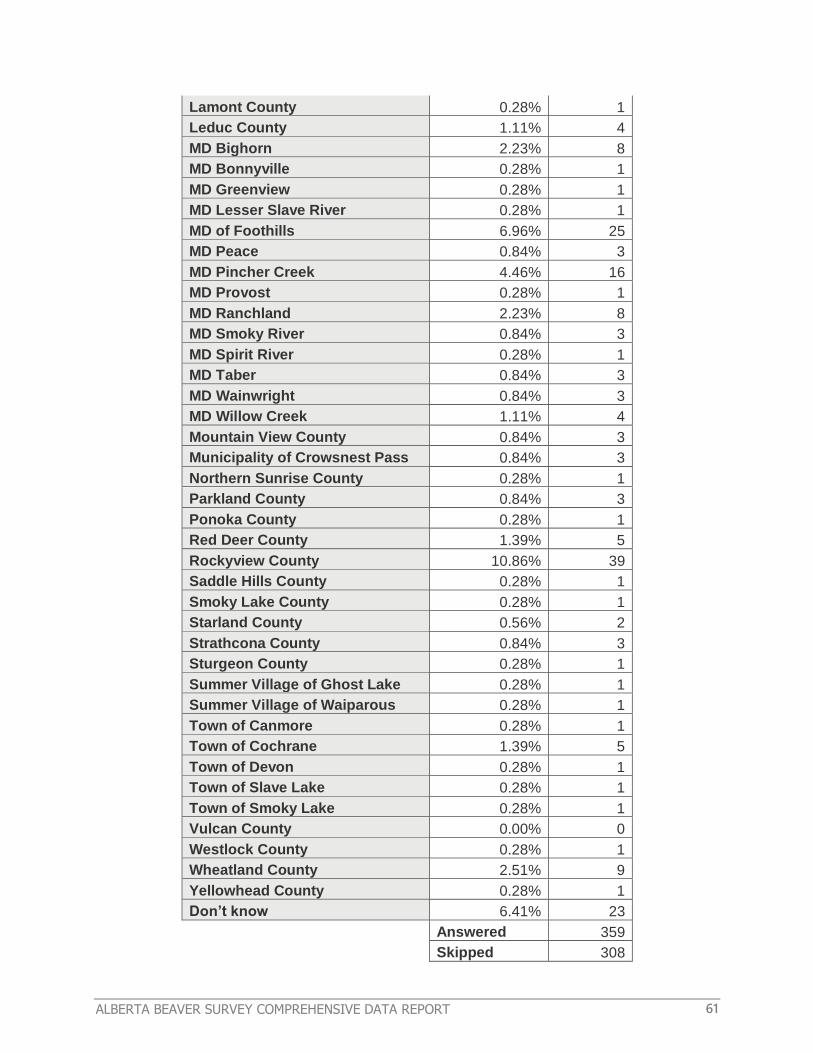
ALBERTA BEAVER SURVEY COMPREHENSIVE DATA REPORT 61
Lamont County 0.28% 1
Leduc County 1.11% 4
MD Bighorn 2.23% 8
MD Bonnyville 0.28% 1
MD Greenview 0.28% 1
MD Lesser Slave River 0.28% 1
MD of Foothills 6.96% 25
MD Peace 0.84% 3
MD Pincher Creek 4.46% 16
MD Provost 0.28% 1
MD Ranchland 2.23% 8
MD Smoky River 0.84% 3
MD Spirit River 0.28% 1
MD Taber 0.84% 3
MD Wainwright 0.84% 3
MD Willow Creek 1.11% 4
Mountain View County 0.84% 3
Municipality of Crowsnest Pass 0.84% 3
Northern Sunrise County 0.28% 1
Parkland County 0.84% 3
Ponoka County 0.28% 1
Red Deer County 1.39% 5
Rockyview County 10.86% 39
Saddle Hills County 0.28% 1
Smoky Lake County 0.28% 1
Starland County 0.56% 2
Strathcona County 0.84% 3
Sturgeon County 0.28% 1
Summer Village of Ghost Lake 0.28% 1
Summer Village of Waiparous 0.28% 1
Town of Canmore 0.28% 1
Town of Cochrane 1.39% 5
Town of Devon 0.28% 1
Town of Slave Lake 0.28% 1
Town of Smoky Lake 0.28% 1
Vulcan County 0.00% 0
Westlock County 0.28% 1
Wheatland County 2.51% 9
Yellowhead County 0.28% 1
Don’t know 6.41% 23
Answered 359
Skipped 308

ALBERTA BEAVER SURVEY COMPREHENSIVE DATA REPORT 62
*Note: originally the survey area was southern Alberta but was later expanded
to include the entire province. As a result, we could not change question 37 to
include every municipality in the province so if the respondent’s municipality was
not listed they had to fill in the ‘other (please specify)’ open-ended response
section. These responses were combined with the checkbox responses and
included in the summary table above. The municipalities that were
unrecognizable were removed from the calculation. Also, there is potential that
some respondents may have answered both the checkbox and the “other”
section.*
79 different Alberta municipalities responded to this question and one response
was from the United States of America. The “don’t know” response category was
not included as a municipality.
Open-ended responses available upon request.
38. Approximately how many years have you owned or managed this land?
The number of years that respondents have owned or managed their land was categorized into the following categories and results are provided.
Categories (years) Responses
0 2.89% 9
1-5 28.94% 90
6-10 12.54% 39
11-50 48.87% 152
51 or more 6.75% 21
Unknown 0.00% 0
Average (years) 18
Answered 311
Skipped 328
48.87% of respondents have owned or managed their land for 11-50 years.
Open-ended responses available upon request.

ALBERTA BEAVER SURVEY COMPREHENSIVE DATA REPORT 63
39. Approximately how much land do you own or manage?
Answer Choices Responses
Less than 1 acre (Less than 0.40ha)
36.91% 117
1 - 5 acres (0.40 - 2.02ha) 7.26% 23
6 – 20 acres (2.43 – 8.09ha)
6.94% 22
21 – 80 acres (8.50 – 32.37ha)
6.31% 20
81 – 160 acres (32.78 – 64.75ha)
8.83% 28
More than one quarter section (more than
64.75ha) 33.75% 107
Answered 317
Skipped 322
The majority of the respondents own or manage either ‘less than 1 acre (less
than 0.40ha) of land (36.91%) or ‘more than one quarter section (more than 64.75ha) of land.
40. Approximately how many kilometres (or miles) of shoreline or streambank do
you own or manage? (Please indicate the unit of measurement, km or mi)
Shoreline/Streambank Presence
Responses
No shoreline/streambank
38.46% 105
Shoreline/streambank present
58.61% 160
Unknown 2.93% 8
Answered 273
Skipped 366
58.61% of respondents have shoreline/streambank present that they own or
manage.
Please note that streams that were considered intermittent, ephemeral, or seasonal were included as shoreline/streambank present. Responses that were
“NA” or had streambank present but did not own or manage it were considered to be ‘no shoreline/streambank.’
Open-ended responses available upon request.
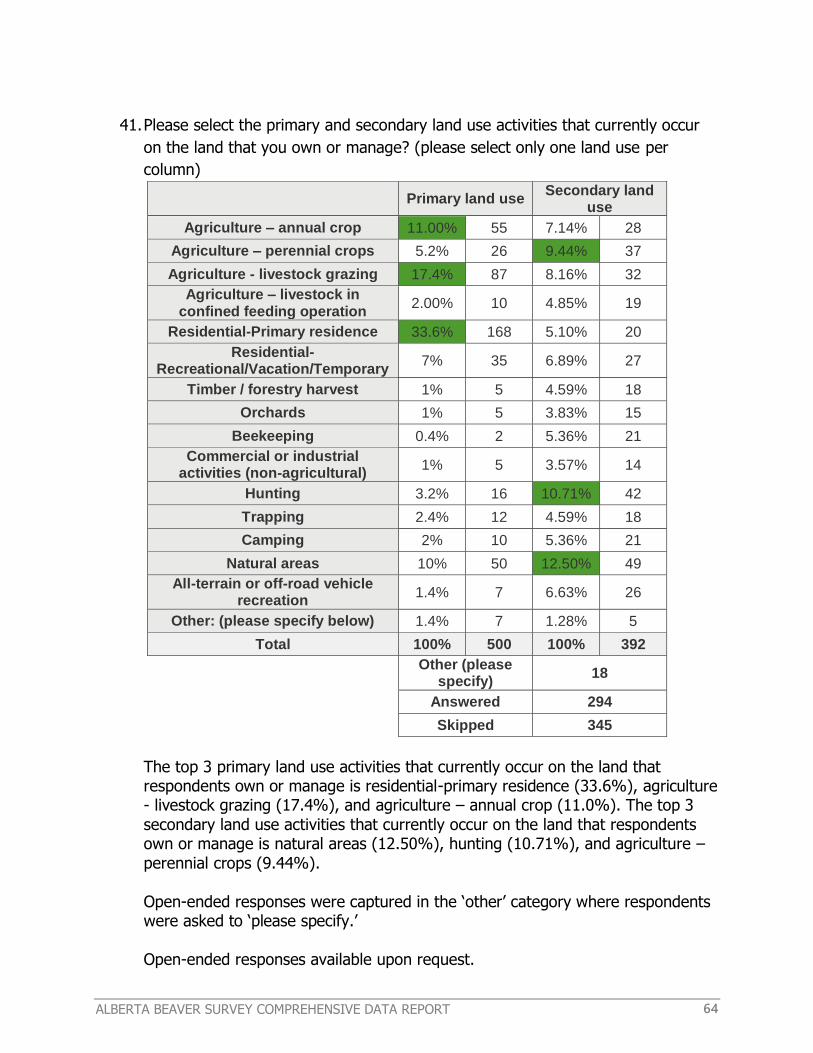
ALBERTA BEAVER SURVEY COMPREHENSIVE DATA REPORT 64
41. Please select the primary and secondary land use activities that currently occur
on the land that you own or manage? (please select only one land use per
column)
Primary land use
Secondary land use
Agriculture – annual crop 11.00% 55 7.14% 28
Agriculture – perennial crops 5.2% 26 9.44% 37
Agriculture - livestock grazing 17.4% 87 8.16% 32
Agriculture – livestock in confined feeding operation
2.00% 10 4.85% 19
Residential-Primary residence 33.6% 168 5.10% 20
Residential-Recreational/Vacation/Temporary
7% 35 6.89% 27
Timber / forestry harvest 1% 5 4.59% 18
Orchards 1% 5 3.83% 15
Beekeeping 0.4% 2 5.36% 21
Commercial or industrial activities (non-agricultural)
1% 5 3.57% 14
Hunting 3.2% 16 10.71% 42
Trapping 2.4% 12 4.59% 18
Camping 2% 10 5.36% 21
Natural areas 10% 50 12.50% 49
All-terrain or off-road vehicle recreation
1.4% 7 6.63% 26
Other: (please specify below) 1.4% 7 1.28% 5
Total 100% 500 100% 392
Other (please
specify) 18
Answered 294
Skipped 345
The top 3 primary land use activities that currently occur on the land that respondents own or manage is residential-primary residence (33.6%), agriculture - livestock grazing (17.4%), and agriculture – annual crop (11.0%). The top 3
secondary land use activities that currently occur on the land that respondents own or manage is natural areas (12.50%), hunting (10.71%), and agriculture –
perennial crops (9.44%).
Open-ended responses were captured in the ‘other’ category where respondents were asked to ‘please specify.’
Open-ended responses available upon request.

ALBERTA BEAVER SURVEY COMPREHENSIVE DATA REPORT 65
42. Please select your age range:
Answer Choices
Responses
18-25 5.54% 18
26-35 20.62% 67
36-45 22.77% 74
46-55 18.46% 60
56-65 21.54% 70
66-75 9.23% 30
76-85 1.23% 4
Over 85 0.62% 2
Answered 325
Skipped 314
The mode age range of respondents is 36-45 (22.77%). 83.38% of the respondents are ages 26-65.
5.54%
20.62% 22.77%
18.46%
21.54%
9.23%
1.23% 0.62%
18-25 26-35 36-45 46-55 56-65 66-75 76-85 Over 85
0%
10%
20%
30%
Fre
qu
en
cy
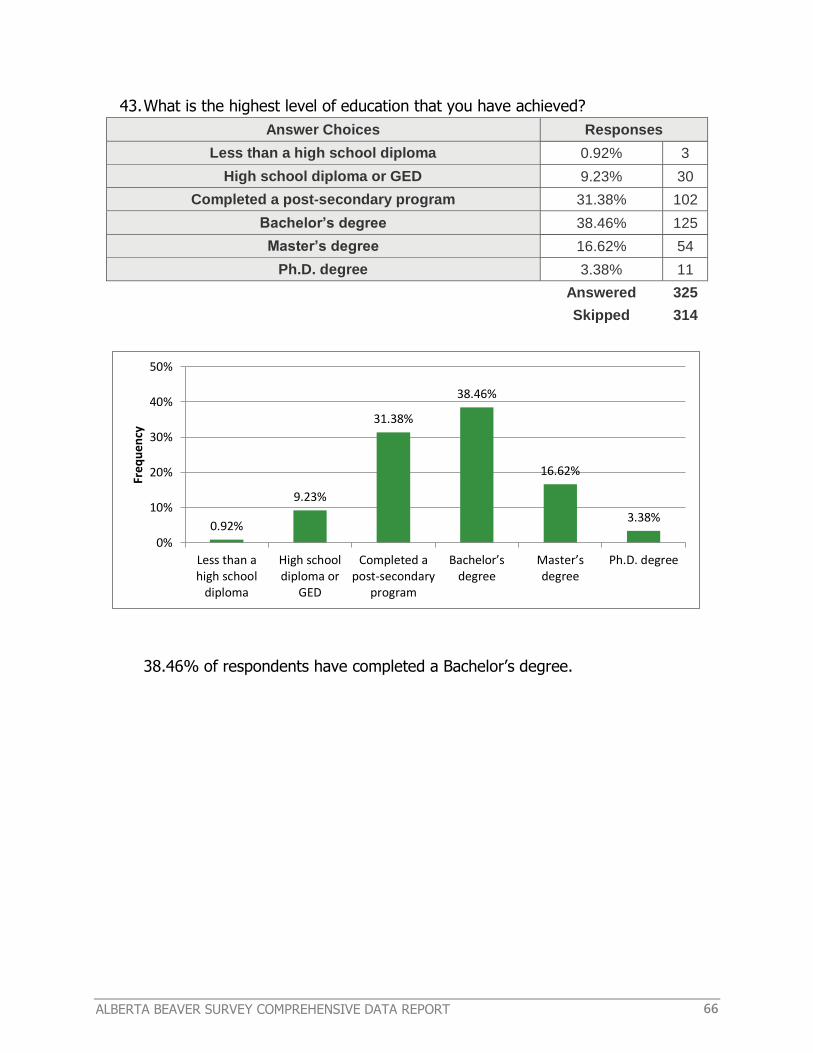
ALBERTA BEAVER SURVEY COMPREHENSIVE DATA REPORT 66
43. What is the highest level of education that you have achieved?
Answer Choices Responses
Less than a high school diploma 0.92% 3
High school diploma or GED 9.23% 30
Completed a post-secondary program 31.38% 102
Bachelor’s degree 38.46% 125
Master’s degree 16.62% 54
Ph.D. degree 3.38% 11
Answered 325
Skipped 314
38.46% of respondents have completed a Bachelor’s degree.
0.92%
9.23%
31.38%
38.46%
16.62%
3.38%
Less than ahigh school
diploma
High schooldiploma or
GED
Completed apost-secondary
program
Bachelor’s degree
Master’s degree
Ph.D. degree
0%
10%
20%
30%
40%
50%
Freq
uen
cy

ALBERTA BEAVER SURVEY COMPREHENSIVE DATA REPORT 67
Final Comments
Numeric and Graphical Responses by Question
44. We are planning on developing educational information on beavers and beaver management and want to provide it
in a format that will be most useful. Please check off your preference for the top 3 formats you would use below:
Answer Choices Responses
Newspaper Article 15.62% 50
Pamphlet / brochure 33.44% 107
Television 16.56% 53
Radio 9.06% 29
E-mail 35.62% 114
DVD 7.19% 23
Online-video (eg. YouTube) 48.75% 156
Podcast 13.12% 42
Blog 5.62% 18
Website 70.31% 225
In-person Workshop 38.75% 124
I am not interested in information about beavers
5.00% 16
Other (please specify)
12
Answered 320
Skipped 319
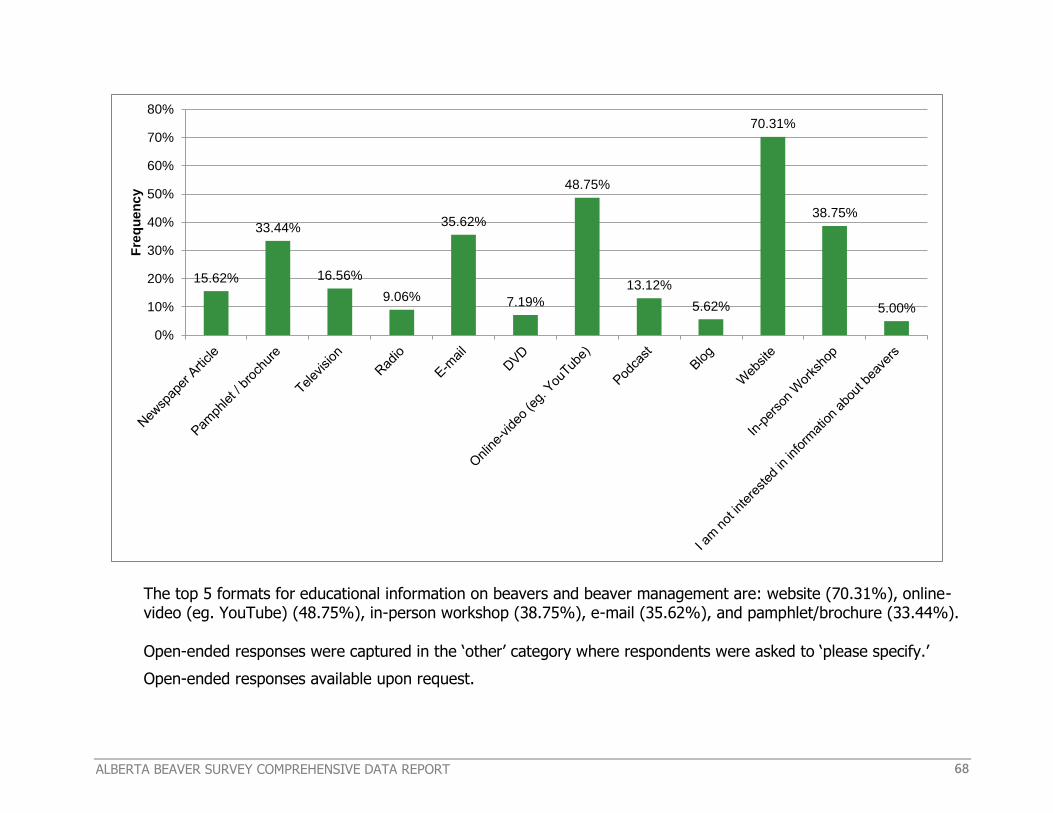
ALBERTA BEAVER SURVEY COMPREHENSIVE DATA REPORT 68
The top 5 formats for educational information on beavers and beaver management are: website (70.31%), online-video (eg. YouTube) (48.75%), in-person workshop (38.75%), e-mail (35.62%), and pamphlet/brochure (33.44%).
Open-ended responses were captured in the ‘other’ category where respondents were asked to ‘please specify.’
Open-ended responses available upon request.
15.62%
33.44%
16.56%
9.06%
35.62%
7.19%
48.75%
13.12%
5.62%
70.31%
38.75%
5.00%
0%
10%
20%
30%
40%
50%
60%
70%
80%
Fre
qu
en
cy

ALBERTA BEAVER SURVEY COMPREHENSIVE DATA REPORT 69
45. Please tell us what you would like to know about beavers, their impacts, and/or
how to coexist with them:
Answer Choices Responses
I don’t want to know about beavers, their impacts, or how to coexist with them.
28.15% 67
Please specify 71.85% 171
Answered 238
Skipped 401
171 respondents commented when they were asked to specify what they would
like to know about beavers, their impacts, and/or how to coexist with them. Open-ended responses were captured from the ‘please specify’ section.
Categories for what respondents would like to know are stated in the table below:
Category % Topic Mentioned
Times Topic Mentioned
Coexistence (how to coexist, mitigation tools) 32.49% 77
Benefits/impacts 27.00% 64
Beaver General information (biology, ecology,
population numbers, etc.)
16.03% 38
Everything 7.59% 18
Other 5.91% 14
28.15%
71.85%
I don’t want to know about beavers, their impacts, or how to coexist with them.
Please specify
0%
10%
20%
30%
40%
50%
60%
70%
80%
Fre
qu
en
cy

ALBERTA BEAVER SURVEY COMPREHENSIVE DATA REPORT 70
Education/dialogue (how to educate others, community dialogue, where to find information)
4.22% 10
Regulatory (laws, regulations, strategies) 3.80% 9
Factsheet 1.69% 4
Project/Learnings 1.27% 3
100% 237
Open-ended responses available upon request.
46. Would you like to receive information on beavers and beaver management?
Answer Choices Responses
No 60.96% 178
Yes 39.04% 114
Answered 292
Skipped 347
114 respondents answered yes, they would like to receive information on
beavers and beaver management. Respondents were given the option to provide their name, email address, and phone number. This information and all other
responses to this question have been withheld to protect respondents’ privacy.
47. Would you be interested in attending a workshop on beaver management,
coexistence, or relocation?
Answer Choices Responses
No 60.41% 177
Yes 39.59% 116
Answered 293
Skipped 346
116 respondents answered yes, they would be interested in attending a
workshop on beaver management, coexistence, or relocation. Respondents were given the option to provide their name, email address, and phone number. This
information and all other responses to this question have been withheld to protect respondents’ privacy.

ALBERTA BEAVER SURVEY COMPREHENSIVE DATA REPORT 71
48. Would you be interested in accepting or donating a beaver for relocation?
Answer Choices Responses
No 81.97% 241
Yes 18.03% 53
Answered 294
Skipped 345
53 respondents answered yes, they would be interested in accepting or donating a beaver for relocation. Respondents were given the option to provide their name, email address, and phone number. This information and all other
responses to this question have been withheld to protect respondents’ privacy.
49. If you have any additional comments about beavers please write them below:
Open-ended responses available upon request.

ALBERTA BEAVER SURVEY COMPREHENSIVE DATA REPORT 72
Emergent Concerns
Question 12, 20, 21, and 31 were analyzed for emergent concerns and revealed several concerns:
1. Replacement of Plants and trees (Q12)
2. Bank erosion from dam outflow (Q12)
3. Flooding may weaken the road (Q12)
4. Removal of wind break trees in an area where it’s difficult to grow large
trees(Q12)
5. Road flooding or blockage due to downed trees creates a concern about
access in/out of areas where there may be only one road in/out. This
causes a safety risk as emergency access is prevented. (Q12, 20)
6. Lost grazing area due to deadfall, cattle will not enter these areas. (Q12)
7. Danger while horseback riding as beaver chewed stumps can be an
impaling hazard to both horse and rider (Q8)
8. Lack of aeration in stream due to high water level (Q20)
9. Injury to pet dog (Q20)
10. Felling trees into areas that pose a safety risk (ex. near major roads,
fences, etc.) (Q20)
11. Blocked outflow from reservoir (Q20)
12. Flooding of an area with an electric cattle fence renders it useless (Q20)
13. “- upstream of dam water is killing riparian vegetation and causing slope
failures in banks
- great nature watching
- water table so high flooding park, causing complaints from
citizens regarding limited access on pathways
- upstream bank nesting of birds had lost nests
- great increase in mink populations” (Q31)
14. Elevated water table is a concern to some (ex. “Elevated water table is not
a benefit. Our driveway is a swamp because it wont dry up.”) (Q31)
These emerging concerns reflect the personal opinions of the respondents.
Emergent Benefits
Respondents were asked to select which category most applied to them with regard to receiving benefits from beavers (question 31) and had the opportunity to provide ‘other’

ALBERTA BEAVER SURVEY COMPREHENSIVE DATA REPORT 73
benefits as an open-ended response. From analysis of the responses, three emergent benefits were revealed:
1. A reduced risk of fire;
2. Beavers as a harvestable fur resource; and
3. Flood damage mitigation

ALBERTA BEAVER SURVEY COMPREHENSIVE DATA REPORT 74
Literature cited
Alberta Riparian Habitat Management Society. (n.d.). Beaver Management and Interest Survey.
Clements, K. L. (1998). Rural Landowners’ Attitudes and Knowledge About Beavers in
South Carolina and Georgia. Conservation Biology, Wildlife Ecology and Conservation. Gainesville, FL: University of Florida.
D’eon, R. G., Lapointe, R., Bosnick, N., Davies, J. C., MacLean, B., Watt, W. R., & Wilson, R. G. (1995). The Beaver Handbook: A Guide to Understanding and Coping with Beaver Activity.
Department of Natural Resources. (1988). Southern New York Beaver Management Survey. Ithaca, NY.
Fitch, L. (2016). Caring for the Green Zone: Beaver - Our Watershed Partner. Lethbridge, Alberta: Cows and Fish - Alberta Riparian Habitat Management Society.
Retrieved from http://cowsandfish.org/whatsnew/documents/BeaverOurWatershedPartnerforWEB.pdf
Government of Alberta: Municipal Affairs. (2017). Municipal Profiles. Retrieved August 1, 2017, from http://www.municipalaffairs.gov.ab.ca/mc_municipal_profiles
Jonker, S. A. (2003). Values and attitudes of the public toward beaver conservation in Massachusetts. ProQuest Dissertations and Theses. University of Massachusetts
Amherst. Retrieved from http://search.proquest.com/docview/305322242?accountid=10979%5Cnhttp://www.redi-bw.de/links/unifr?url_ver=Z39.88-
2004&rft_val_fmt=info:ofi/fmt:kev:mtx:dissertation&genre=dissertations+&+theses&sid=ProQ:ProQuest+Dissertations+&+Theses+A&I&atitle=&title=Val
Jonker, S. A., Muth, R. M., Organ, J. F., Zwick, R. R., & Siemer, W. F. (2006). Experiences with Beaver Damage and Attitudes of Massachusetts Residents toward Beaver. Wildlife Society Bulletin, 34(4), 1009–1021.
Jonker, S. A., Muth, R. M., Zwick, R. R., & Siemer, W. F. (2009). Human Dimensions of Wildlife Management Article Stakeholder Norms Toward Beaver Management in
Massachusetts. Journal of Wildlife Management, 73(7), 1158–1165. https://doi.org/10.2193/2004-160
McKinstry, M. C., & Anderson, S. H. (1998). Attitudes of private- and public-land managers in Wyoming, USA, toward beaver. Environmental Management, 23(1), 95–101. https://doi.org/10.1007/s002679900170
Morzillo, A. T., & Needham, M. D. (2015). Landowner Incentives and Normative Tolerances for Managing Beaver Impacts. Human Dimensions of Wildlife, 20(6),
514–530. https://doi.org/10.1080/10871209.2015.1083062

ALBERTA BEAVER SURVEY COMPREHENSIVE DATA REPORT 75
Needham, M. D., & Morzillo, A. T. (2011). Landowner Incentives and Tolerances for Managing Beaver Impacts in Oregon, Final Report, 139.
New York State Department of Environmental Conservation. (1992). St. Lawrence Valley Beaver Management Survey.
Northeast Science & Technology. (n.d.). Beaver Survey. Timmins, ON: Ontario Ministry of Natural Resources.
Purdy, K. G., Decker, D. J., Malecki, R. A., & Proud, J. C. (1985). Landowner Tolerance of Beavers: Implications for Damage Management and Control. In Second Eastern Wildlife Damage Control Conference (pp. 83–88).
Reiter, D. K., Brunson, M. W., & Schmidt, R. H. (1999). Public attitudes toward wildlife damage management and policy. Wildlife Society Bulletin, 27(3), 746–758.
https://doi.org/10.2307/3784098
ResearchWare Inc. (2015). HyperRESEARCH Version 3.7.5. Retrieved from http://www.researchware.com/
Siemer, W. F., Brown, T. L., Jonker, S. A., & Muth, R. M. (2003). Attitudes Toward Beaver and Beaver Management: Results From Baseline Studies in New York and Massachusetts March,. Ithaca, NY.
Siemer, W. F., Jonker, S. A., Decker, D. J., & Organ, J. F. (2013). Toward an
understanding of beaver management as human and beaver densities increase. Human-Wildlife Interactions, 7(1), 114–131.
SurveyMonkey Inc. (2017). SurveyMonkey Inc. Retrieved October 20, 2017, from
www.surveymonkey.com
Wigley, T. B., & Garner, M. E. (n.d.). Landowner Perceptions of Beaver Damage and
Control in Arkansas.

ALBERTA BEAVER SURVEY COMPREHENSIVE DATA REPORT 76
Appendix A: Distribution Materials
Poster

ALBERTA BEAVER SURVEY COMPREHENSIVE DATA REPORT 77
Post Card
ALBERTA BEAVER SURVEY COMPREHENSIVE DATA REPORT 78
Beaver Survey Social Media Examples
Promotional tweet
Please feel free to use the below tweets and add your own tags or hashtags:
Please take the @Miistakis and @CowsandFish #ABBeaverSurvey! Open till July 26 https://www.surveymonkey.com/r/albertabeaver
What cuts like a chainsaw & swims like a fish? Beaver! Take the @Miistakis and
@CowsandFish #ABBeaverSurvey! https://www.surveymonkey.com/r/albertabeaver
Busy as a beaver? Take a break and take the @Miistakis and @CowsandFish
#ABBeaverSurvey! https://www.surveymonkey.com/r/albertabeaver
Reminder Tweets
Only 4 weeks left! Have your say on beavers. Please do the #ABBeaverSurvey https://www.surveymonkey.com/r/albertabeaver
Only 2 weeks left! Have your say on beavers. Please do the #ABBeaverSurvey https://www.surveymonkey.com/r/albertabeaver
#ABBeaverSurvey