alberta heritage savings trust fund - annual report for ... › dataset ›...
TRANSCRIPT

nineteen ninety nine
AlbertaHeritage Savings Trust Fund
Annual Report
TREASURY

Page 2
Fund ProfileThe Fund, established in 1976, operatesunder the authority of the Alberta HeritageSavings Trust Fund Act. A new Act was passedand came into force on January 1, 1997 that setsout the new investment framework for theHeritage Fund. The Standing Committee on theAlberta Heritage Savings Trust Fund reviews andapproves the business plan and annual report of theFund. The Provincial Treasurer has responsibilityfor Fund investments.
An Investment Operations Committee has been established to add private sector financial and businessoversight of the Fund’s investment policies and results. The Investment Operations Committee ischaired by the Deputy Provincial Treasurer and consists primarily of private sector members. TheCommittee reviews and makes recommendations with respect to the business plan, annual report andinvestment policy statements for the Fund. The investment manager for the Fund is Alberta Treasury’sInvestment Management Division, with certain asset classes being managed by specialist externalmanagers (private sector investment managers).
The statutory mission of the Fund is:
“To provide prudent stewardship of the savings from Alberta’s non-renewableresources by providing the greatest financial returns on those savings for current andfuture generations of Albertans.”
Honourable Stockwell DayProvincial Treasurer
Additional copies of this report and copies of the future quarterly reports on the Heritage Fund may be obtained by writing:Heritage Fund, Room 304, Terrace Building, Edmonton, Alberta, T5K 2C3 or by telephoning (780) 427-4414.
TREASURY

Page 3
Table of ContentsPage
Provincial Treasurer’s Report ........................................................... 4The Year in Review .......................................................................... 5Business Plan .................................................................................... 6Transition Portfolio ........................................................................... 8Endowment Portfolio ........................................................................ 11Administrative Expenses .................................................................. 19Economic Climate ............................................................................ 20Glossary ............................................................................................ 22Auditor’s Report on Investment Returns .......................................... 25Financial Statements ......................................................................... 28List of Investments ........................................................................... 48

Page 4
Provincial Treasurer’s ReportThe restructuring of the Alberta Heritage Savings Trust Fund is now one third complete. As part of the restructuring, the Fund was divided intotwo distinct portfolios. The Endowment Portfolio was established to optimize long term returns while the Transition Portfolio earns income tosupport the immediate fiscal needs of the Province. On a gradual basis, the assets of the Transition Portfolio are transferred to the EndowmentPortfolio and the emphasis of the Fund will shift from providing income to optimizing long term returns. At the end of March 1999, approximatelyone third of the assets of the Heritage Fund were held in the Endowment Portfolio.
The Heritage Fund continues to play an important role in the fiscal success of the Province. During the 1998-99 fiscal year, the Fund generated$932 million in investment income. However, as the Fund becomes more heavily invested to optimize long term returns, its market value andtherefore the income it earns, will fluctuate more on a short term basis. Investing in equities, which generate much of their return through capitalappreciation, have generally out-performed bonds over the long term, but will endure short term fluctuations in prices as markets anticipate changingeconomic expectations. Short term market volatility was demonstrated by equity markets in 1998. The key is always to maintain a disciplined, longterm focus.
An important part of the restructuring was the introduction of clearly defined performance measures. In the case of the Transition Portfolio, theobjective is to earn a market rate of return greater than the market cost of the Province’s Canadian dollar debt. In the 1998-99 fiscal year theTransition Portfolio earned 5.4% while the market cost of the Province’s Canadian dollar debt was 5.9%. The underperformance is partly due to thereturns in the equity holdings of the portfolio. In the case of the Endowment Portfolio, we evaluate the performance in a number of ways. We look atthe Portfolio’s return relative to a policy benchmark calculated using returns on market indices. In the 1998-99 fiscal year the Endowment Portfoliohad a return of 4.7%, equal to the policy benchmark return. We also look at how the Portfolio has performed relative to other institutional portfolios.For this we look at surveys of fund returns. For the year ending March 31, 1999, the median or middle ranked fund return, based on an industrysurvey, was 1.3%.
Combining the Transition Portfolio and the Endowment Portfolio over two years, the Fund, as a whole, returned 7.5% (annualized) compared to themarket cost of the Province’s Canadian dollar debt of 6.8% (annualized).
While there is still a ways to go in terms of restructuring the Heritage Fund, much has already been accomplished. As we continue to review andassess the performance of the Fund, we have growing confidence that the Fund will be able to support Albertans’ current fiscal priorities and providean ongoing legacy for future generations.
Stockwell DayProvincial Treasurer
[original signed]

Page 5
11700
11750
11800
11850
11900
11950
12000
12050
0
200
400
600
800
1000
1200
The Year in Review• The Fund earned net income of $932.0 million in income in 1998-99,
down from $947.3 million a year earlier, reflecting lower realizedcapital gains due to market volatility and having a lower proportion ofthe assets invested in fixed income.
• The Government of Alberta financial statements are prepared on aconsolidated basis and therefore eliminates the income the HeritageFund receives on holding Alberta government and ProvincialCorporation securities. Net income of the Heritage Fund for the yearending March 31, 1999 on that basis is $816 million which is$115 million greater than budgeted.
• On March 31, 1999, the total equity of the Fund was $12,026.3 millionon a cost basis and $12,714.2 million on a fair value basis. On thecost basis, the equity of the Fund did not change from 1998 and on afair value basis, the Fund equity declined from the March 31, 1998amount of $12,969.5 million due to the transfer of the net income togeneral revenues of the province.
• Over the year, $1,205.4 million (at cost) was transferred from theTransition Portfolio to the Endowment Portfolio.
• The Transition Portfolio returned 5.4% and underperformed itsbenchmark of 5.9% by 50 basis points. The Endowment Portfolioreturned 4.7% the same as the policy benchmark of 4.7%. Combiningthe Transition Portfolio and the Endowment Portfolio over two years,the Fund, as a whole, returned 7.5% (annualized) compared to themarket cost of the Province’s Canadian dollar debt of 6.8%(annualized).
• On March 31, 1999 the long run equity benchmark exposure wasincreased to 60% from 55% and the foreign equity benchmarkexposure was increased from 20% to 30% for the EndowmentPortfolio.
• In addition to the annual report and quarterly updates, the StandingCommittee once again undertook a series of public meetings to reporton the Fund and answer Albertans’ questions.
Total Heritage Fund Income(millions)
Total Heritage Fund Equity*(millions)
1993 1994 1995 1996 1997 1998 19990
$11,945.4
$11,874.8
$11,825.5 $11,825.7
$12,001.4$12,026.3
$784.5
$1,103.5
$913.8
$1,045.6
$932.1 $947.3
$12,026.3
1993 1994 1995 1996 1997 1998 1999
$932.0
* Assets less liabilities, at cost.

Page 6
Business PlanThe business plan for the Heritage Fund describes the mission and specific investmentobjectives of the Fund and how the Fund will be invested, managed and measured. The businessplan is reviewed annually and is published as part of the budget. The Investment OperationsCommittee reviews and makes recommendations regarding the business plan and the investmentpolicies for the Fund. The Investment Operations Committee is largely composed of privatesector individuals with relevant financial and business expertise. The business plan is thenreviewed and approved by the Legislature’s Standing Committee on the Alberta HeritageSavings Trust Fund. The Standing Committee has representation from the major parties of theLegislature.
The Fund has been structured into two portfolios: the Transition Portfolio and the EndowmentPortfolio. Each portfolio has its own investment objective and policy which is closely tied to thegoals of the Fund. The three goals of the Fund, as outlined in the plan, remain as follows:
Goal 1 Earn income to support the government’s consolidated fiscal plan.
The Transition Portfolio is to provide a relatively stable level of interest income to thegovernment over the short to medium term horizon and to gradually transfer assets tothe Endowment Portfolio. The Transition Portfolio is expected to earn a market rate ofreturn greater than the market cost of the province’s Canadian dollar debt.
Goal 2 Make investments in the Endowment Portfolio to maximize long term financialreturns.
The Endowment Portfolio focuses on the long term investment horizon. The EndowmentPortfolio is being funded gradually over time with assets transferred from the TransitionPortfolio. Eventually all Heritage Fund assets will be invested in the EndowmentPortfolio. The investment policy for the Endowment Fund calls for a long term policyallocation of 60% in equities. Further, the policy allocation to foreign equities is 30% ofthe Endowment Portfolio.
Accounting for theHeritage Fund
The Heritage Fund is accountedfor on a cost basis. Costincludes the amount ofapplicable amortization ofdiscount or premium using thestraight-line method over thelife of the investments. Wherethere has been a loss in value ofan investment that is other thana temporary decline, theinvestment is written down torecognize the loss. Investmentsin loans are recorded at cost lessany unearned income andallowance for credit loss.
Investment income is recordedon the accrual basis where thereis reasonable assurance as to itsmeasurement and collectability.Capital gains or losses arerecognized in income when theasset is sold.
Fair or “market” values areprovided in schedules to thefinancial statements forcomparison purposes.

Page 7
0
2
4
6
8
10
12
14
Goal 3 To improve Albertans’ understanding and the transparencyof the Alberta Heritage Savings Trust Fund.
This goal includes the timely release of quarterly reports anddetailed discussion of the Fund within the Annual Report. Inaddition, the Standing Committee provides for ongoing publicconsultation through public meetings held throughout theprovince on an annual basis. Each Portfolio of the Fund iscompared to clearly defined performance benchmarks.
On March 23, 1999, the Fiscal Responsibility Act received Royal Assentand, until the accumulated gross debt is eliminated, the ProvincialTreasurer is not required to retain amounts for inflation proofing in theFund, but may retain such amounts as the Provincial Treasurer considersadvisable.
Transfer of Assets over Transition Period*($ billions)
Transition Portfolio Assets
Endowment Portfolio Assets
* Cost value: excludes accrued interest and accounts receivable,and additions to Endowment Portfolio due to inflation proofing.
1997 1998 1999 2000 2001 2002 2003 2004 2005Heritage Fund Assets (Cost Basis)at March 31, 1999 ($ millions)Total: $12,097.5 million
EndowmentPortfolio
33%*
TransitionPortfolio
67%*
* Excludes accrued interest and accounts receivable of $138.2 million.

Page 8
Investment ObjectiveThe legislated investment objective of the Transition Portfolio is to make investments with theobjective of supporting the government’s short term to medium term income needs as reflected inthe government’s consolidated fiscal plan. The investment objective of the Transition Portfolio isto earn a return that exceeds the interest cost of the Canadian dollar portion of the province’s debt.
Investment PolicyThe Transition Portfolio’s investment policy statement is reviewed and recommended annually bythe Investment Operations Committee to the Provincial Treasurer. The investment policystatement for the Portfolio is then approved by the Provincial Treasurer and forms the referencedocument for Alberta Treasury as the investment manager. The investment policy statement mustbe consistent with the business plan of the Fund and it provides the overall investment frameworkas well as specific policies and guidelines such as:
• a quality constraint for fixed income securities of investment grade (a minimum of a “BBB”credit rating or equivalent)
Transition PortfolioIntroductionThe Transition Portfolio transfers $100 million per month to the Endowment Portfolio. At March 31,1999, the fair value of the Transition Portfolio’s investments was $8.3 billion (includes loans totaling$107.8 million at cost) compared to a cost of $8.1 billion.
Transition Portfolio Breakdown of Investmentsas at March 31, 1999($ millions) 1999 1998
Fair Cost % Fair Cost %Value Value
Cash 45.0 45.0 0.6 78.6 78.6 0.8Marketable Fixed Income Securities 7,178.2 7,062.7 87.7 7,774.7 7,571.5 80.8Policy Investments
Provincial Corporation Debentures 902.0 771.8 9.6 1,370.1 1,199.3 12.8Project Loans — 107.8 1.3 — 408.2 4.4Canadian Equities 79.9 65.7 0.8 181.3 112.3 1.2
Total Policy Investments 982.0 945.3 11.7 1,551.4 1,719.8 18.4
Total 8,205.1 8,053.0 100.0 9,404.7 9,369.9 100.0

Page 9
• investment limits for the various categories of fixed income securities• controls to minimize the deviation of the Portfolio’s duration from
that of the province’s debt portfolio• a summary of the legislative authority and governance structure,
including specific duties of the investment manager• requirement to adhere to the “prudent person” rule when making investments• how investment performance is to be measured and what
benchmark is to be used in assessing performance (see below)• controls with respect to the use of derivatives. Derivative
instruments such as swaps can only be used to add value byenhancing fundamental investment strategies and cannot be usedfor speculative purposes. Over-the-counter derivatives may onlybe purchased from counterparties with at least a A+ credit rating atthe time of purchase.
Investment StrategyThe investment strategy, as expressed in the business plan and investment policystatement, is to invest in investment grade interest bearing securities within aduration range for the overall Portfolio of between 2.4 and 3.2 (to minimize thedeviation from the province’s debt portfolio duration). Duration is the weightedaverage of the timing of when cash flows (such as interest and principal) arereceived and provides a means of gauging how sensitive a fixed income portfolio isto increases or decreases in the general level of interest rates.
The bulk of assets in the Transition Portfolio continue to be in marketable fixedincome securities (87.7%). Provincial debentures constitute 9.6% and project loansare 1.3% of the Transition Portfolio. Corporate securities comprise 40.3% of theTransition Portfolio’s marketable fixed income securities. Federal government andFederal government guaranteed bonds constitute another 31.0% of the marketablefixed income securities. The third largest component of the fixed incomeinvestments, at 25.8% of the total, is the Transition Portfolio’s holdings of otherprovincial governments’ bonds.
Project loans have been substantially reduced. The Murphy Oil debenture has beenrepaid and the Alpac loans sold. As a result, on a cost basis the value of projectloans is now $107.8 million or 1.3% of the Transition Portfolio. These loans areRidley Grain Ltd. ($93.5 million) and Vencap Acquisition Corporation($14.3 million).
Transition Portfolio InvestmentBreakdown(% of cost)at March 31, 1999Total: $8,053.0 million
Deposits 0.6%Provincial Corporation
Debentures 9.6%Project Loans 1.3%Equities 0.8%
Marketable FixedIncome Securities
87.7%
Marketable Fixed Income SecuritiesBreakdown(% of fair value)at March 31, 1999Total: $7,178.2 million
Federal31.0%
Alberta1.9%
Corporate40.3%
Municipal1.0% Other Provinces
25.8%

Page 10
Term Structure of FixedIncome Securities*as at March 31, 1999 (Par Value)
In addition, $427.5 million of Provincial corporation debentures were repaid orredeemed. The Fund’s investment in provincial corporation debentures was reducedfrom $1,199.3 million at the beginning of the year to $771.8 million at March 31, 1999.
PerformanceFor the current fiscal year 1998-99, the one year market return for the TransitionPortfolio was 5.4% with a modified duration of 2.79 years. The benchmark cost ofborrowing was 5.9% during that same period with a modified duration of 2.81 years.The Transition Portfolio underperformed the Liability Portfolio due to:
• the equity holdings in the Transition Portfolio which had a negative effect of24 basis points on return;
• the return on cash, required to be transferred to the Endowment Portfolio detractedfrom performance;
• a significant portion of the Transition Portfolio, which is in Government of Canadabonds for liquidity purposes, returned less than the Alberta benchmark;
• until the Alpac loan was disposed of in May 1998, this investment did not earn anyincome; and
• a timing difference in the pricing of the Transition Portfolio relative to thebenchmark as the source of pricing is different.
When the Transition Portfolio and the Endowment Portfolio are combined over a twoyear period, the Fund, as a whole, returned 7.5% (annualized) versus the LiabilityPorfolio return of 6.8% (annualized).
The book value return of the Transition Portfolio for the 1998-99 fiscal year was 7.9%compared to a debt book value cost of 6.3%. The book value return on the TransitionPortfolio is higher than the book value cost of the Liability Portfolio due to the lowercost of borrowing in the Liability Portfolio and recognition of realized gains on the saleof securities in the Transition Portfolio.
Investment IncomeDuring the year, the Transition Portfolio generated investment income totalling$663.1 million. Approximately $70.8 million was accounted for by realized capitalgains and $592.3 million was due to interest, dividend and other income.
Market Return
Last 3 Last 6 1 yearmonths* months*
Transition 0.7 2.4 5.4Liability Portfolio 1.0 2.7 5.9
* Returns are not annualized.
Over 7 years12%
0 to 1 year10%
1 to 3 years27%
5 to 7 years27%
4 to 5 years11%
3 to 4 years13%

Page 11
Endowment Portfolio
IntroductionThe Endowment Portfolio was established on January 1, 1997 with a transfer from the “old”Heritage Fund of $1.2 billion of investments (at cost). This included equity holdings previouslyheld in the former Commercial Investment Division and a mix of short term and mid term fixedincome securities. Since the initial $1.2 billion funding, the Endowment Portfolio has received$100 million a month from the Transition Portfolio. The Endowment Portfolio has increased inmarket value to $4,334.3 million reflecting both transfers from the Transition Portfolio and marketappreciation. The Endowment Portfolio has undergone considerable change as the initial assetsand subsequent cash flow has been invested to meet the policy objectives.
Investment ObjectiveThe investment objective of the Endowment Portfolio is to optimize long term financial returnssubject to an acceptable level of risk. Alberta Treasury operates under the “Prudent Person Rule”by legislation. This assigns the investment manager the responsibility to restrict investments toassets that would be approved by a prudent investor. By investing to optimize long term returns itis expected that over time, the Heritage Fund will generate higher financial returns than in the pastwhen social and economic objectives were pursued or if only shorter term income objectives werepursued. Similar investment funds with long term investment horizons and an objective tooptimize long run returns, invest a significant amount of their assets in equities since equities havehistorically provided investors with higher total returns (dividends and capital gains) than interestbearing investments. This higher performance is generally offset by lower and less predictableincome flows. Based on historical experience, a similar asset mix policy would have generated areal rate of return of around 5.0%.
The return in each asset class is compared to a market benchmark. The performance of theEndowment Portfolio will be measured by comparing the actual return of the fund to the returngenerated by a benchmark portfolio asset mix. A four year measurement period is used to focusmanagement attention on the longer term. It is expected that over a four year period, managementwould add 0.5% in return over and above what would have been generated by the benchmarkportfolio asset mix.

Page 12
Investment PolicyThe Endowment Portfolio’s investment policy statement is reviewed andrecommended annually by the Investment Operations Committee to the ProvincialTreasurer. The investment policy statement for the Portfolio is then approved bythe Provincial Treasurer and forms the reference document for Alberta Treasury asthe investment manager. The investment policy statement must be consistent withthe business plan of the Fund and it provides the overall investment framework aswell as specific policies and guidelines such as:
• a quality constraint for fixed income securities of investment grade (a minimumof a “BBB” credit rating or equivalent)
• investment limits by asset class• a summary of the legislative authority and governance structure, including
specific duties of the investment manager• requirement to adhere to the “prudent person” rule when making investments• how investment performance is to be measured and what benchmark is to be
used in assessing performance (see below)• controls with respect to the use of derivatives. Derivative instruments such as
swaps can only be used to add value by enhancing fundamental investmentstrategies and cannot be used for speculative purposes. Over-the-counterderivatives may only be purchased from counterparties with at least a A+ creditrating at the time of purchase.
Investment StrategyThe strategy is to invest in a diversified portfolio to optimize long term returns at anacceptable level of risk. As liquid, marketable securities are transferred from theTransition Portfolio at an average of $100 million a month, the securities arereinvested based on the asset allocation policy established for the Portfolio. Theasset allocation policy has evolved over the last three years and is focussed on along run benchmark asset mix of 40% fixed income / 60% equities. The emphasisis on optimizing long term returns associated with equities relative to currentincome associated with fixed income.
Benchmark Measurement Index
Scotia Capital Markets 91 day T-Bills Index(SCM 91 Day T-Bills Index)Reflects the performance of the Canadian moneymarket as measured by investments in 91-dayTreasury Bills.
Scotia Capital Markets Universe BondIndex (SCM Universe Bond Index)Covers all marketable Canadian bonds with terms tomaturity of more than one year.The purpose of this index is to reflect performance ofthe broad Canadian bond market in a manner similarto the way the TSE 300 represents the Canadian equitymarket.
Toronto Stock Exchange 300 TotalReturn Index (TSE 300 Index)An index of 300 stocks, in fourteen subgroups, listedon the Toronto Stock Exchange designed to representthe Canadian equity market. It is a capitalization-weighted index calculated on a total return basis.
Morgan Stanley Capital InternationalWorld Index (excluding Canada)(MSCI World Index)An index of over 1,470 stocks on 23 stock exchangesaround the world designed to represent aninternational equity market (excluding Canada).The index is calculated on a total return basis, whichincludes investment of gross dividends beforededuction of withholding taxes. The index coversabout 60% of the issues listed on the exchanges of thecountries included.
Russell Canadian Property Index(Russell Index)An index comprised of institutionally held real estateinvestments consisting of over 1,100 propertiesdistributed across Canada.

Page 13
In order to manage the risk of increasing the equity exposure and further enhance the potential returns,the foreign equity target is 30% of the Portfolio’s market value. The foreign equity exposure willincrease the diversification of the fund across countries, industries and individual companies.In addition, the Fund’s exposure to enhanced growth opportunities would beincreased and therefore the potential for higher long run returns.
It is expected that an additional 0.5% return will be added through themanagement of the specific asset classes and the overall asset mix. To meet thisobjective, external managers are used in addition to the investments made byAlberta Treasury to take advantage of specialized knowledge and expertise.This has made it possible to invest in specific asset classes such as Canadian“small-cap” equities, U.S. equities, global equities and diversify investmentstrategies within the Canadian “large cap” equity component.
Asset MixOn March 31, 1999, deposits and fixed income instruments accounted for 46.7% oftotal investments in the Endowment Portfolio and equity investments accounted for49.4%. Taking the effect of equity swaps into account increases the equity exposureto 56.6%. Through the fiscal year, the Portfolio was gradually shifting towards thenew asset mix policy of 60% equity and including 30% in foreign equity effectiveMarch 31, 1999. By the end of the fiscal year, the portfolio was at the targetallocation for Canadian equities, 2% under in foreign equities and 1% under in realestate.
Policy Benchmark Benchmark Measurement IndexMarch 31
Asset Class 1998 1999
Deposits 3% 3% SCM 91 Day T-Bills IndexFixed Income Securities 42% 37% SCM Universe Bond Index
Total Deposits and Fixed Income Securities 45% 40%Equities
Canadian Equities 30% 25% TSE 300 IndexForeign Equities 20% 30% MSCI World Index
Real Estate 5% 5% Russell Index
Total Real Estate and Equities 55% 60%
Asset Class Allocation Endowment Portfolio’sTen Largest Equitiesby Country*Fair Value at March 31, 1999(millions)
Total:United States $543Japan $153United Kingdom $100France $74Germany $68Netherlands $49Switzerland $43Italy $29Australia $27Spain $19* Includes the effect of derivatives.
Distribution of Endowment Portfolio’sMarketable Fixed Income Holdings*Fair Value as at March 31, 1999Total: $1,410.8 million
Corporate37.4%
Canada30.6%
Alberta2.3%
Municipal1.0%
Other Provinces15.6%
Private Debt13.1%
* Excludes short term deposits and the Floating Rate Note Pool.
Page 14
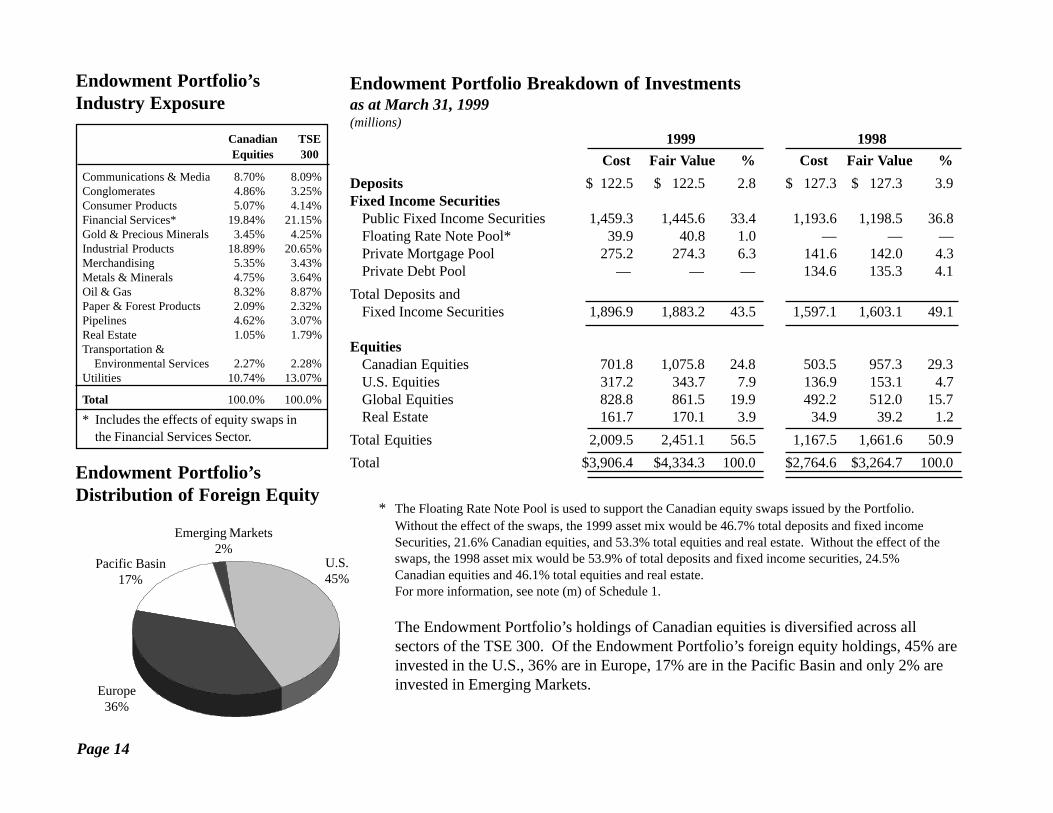
Endowment Portfolio Breakdown of Investmentsas at March 31, 1999(millions)
1999 1998
Cost Fair Value % Cost Fair Value %
Deposits $ 122.5 $ 122.5 2.8 $ 127.3 $ 127.3 3.9Fixed Income Securities
Public Fixed Income Securities 1,459.3 1,445.6 33.4 1,193.6 1,198.5 36.8Floating Rate Note Pool* 39.9 40.8 1.0 — — —Private Mortgage Pool 275.2 274.3 6.3 141.6 142.0 4.3Private Debt Pool — — — 134.6 135.3 4.1
Total Deposits andFixed Income Securities 1,896.9 1,883.2 43.5 1,597.1 1,603.1 49.1
EquitiesCanadian Equities 701.8 1,075.8 24.8 503.5 957.3 29.3U.S. Equities 317.2 343.7 7.9 136.9 153.1 4.7Global Equities 828.8 861.5 19.9 492.2 512.0 15.7Real Estate 161.7 170.1 3.9 34.9 39.2 1.2
Total Equities 2,009.5 2,451.1 56.5 1,167.5 1,661.6 50.9
Total $3,906.4 $4,334.3 100.0 $2,764.6 $3,264.7 100.0
* The Floating Rate Note Pool is used to support the Canadian equity swaps issued by the Portfolio.Without the effect of the swaps, the 1999 asset mix would be 46.7% total deposits and fixed incomeSecurities, 21.6% Canadian equities, and 53.3% total equities and real estate. Without the effect of theswaps, the 1998 asset mix would be 53.9% of total deposits and fixed income securities, 24.5%Canadian equities and 46.1% total equities and real estate.For more information, see note (m) of Schedule 1.
The Endowment Portfolio’s holdings of Canadian equities is diversified across allsectors of the TSE 300. Of the Endowment Portfolio’s foreign equity holdings, 45% areinvested in the U.S., 36% are in Europe, 17% are in the Pacific Basin and only 2% areinvested in Emerging Markets.
Pacific Basin17%
Emerging Markets2%
U.S.45%
Europe36%
Endowment Portfolio’sDistribution of Foreign Equity
Endowment Portfolio’s Industry Exposure
Canadian TSEEquities 300
Communications & Media 8.70% 8.09%Conglomerates 4.86% 3.25%Consumer Products 5.07% 4.14%Financial Services* 19.84% 21.15%Gold & Precious Minerals 3.45% 4.25%Industrial Products 18.89% 20.65%Merchandising 5.35% 3.43%Metals & Minerals 4.75% 3.64%Oil & Gas 8.32% 8.87%Paper & Forest Products 2.09% 2.32%Pipelines 4.62% 3.07%Real Estate 1.05% 1.79%Transportation &
Environmental Services 2.27% 2.28%Utilities 10.74% 13.07%
Total 100.0% 100.0%
* Includes the effects of equity swaps inthe Financial Services Sector.

Page 15
Endowment Portfolio PerformancePeriod ending March 31, 1999
Actual Fund Return BenchmarkWeightings Market Return Index Market Return
March 31, 3 6 9 1 Weight 3 6 9 11999 Months Months Months Year Months Months Months Year
Short term fixed income 3.3% 1.3% 2.6% 3.8% 5.0% SCM 91 Day T-Bills Index 3.0% 1.2% 2.5% 3.8% 4.9%Long term fixed income 39.7% 0.6% 2.5% 5.3% 6.8% SCM Universe Bond Index 42.0% 0.8% 2.7% 5.3% 7.0%Canadian Equities 25.3% 1.8% 16.2% -8.2% -9.2% TSE 300 Index 30.0% 2.1% 18.5% -9.3% -11.3%Foreign Equities 27.8% 4.3% 25.2% 11.4% 16.1% MSCI World Index 20.0% 2.0% 24.4% 14.0% 20.5%
(excluding Canada)Real Estate 3.9% 1.5% 11.7% 12.8% 13.4% Frank Russell Commercial 5.0% 3.3% 9.0% 12.5% 15.8%
Property Index
Total Portfolio 100.0% 2.0% 11.4% 3.3% 4.7% Total Portfolio 100.0% 1.6% 11.9% 3.3% 4.7%
Investment Performance
The one year performance of the Endowment Portfolio was in line with the policy benchmarkreturn of 4.7%. The absolute performance of the Portfolio was negatively impacted by the sharpcorrection in the equity markets in the second quarter of the fiscal year. The Portfolio did very wellin terms of asset allocation. The Endowment Portfolio was overweight in foreign equities, whichwas the best performing asset class. The Portfolio was also underweight in Canadian equitieswhich was the lowest performing asset class.
In terms of returns within the asset categories, the Canadian equity component outperformed itsmarket benchmark by 210 basis points. The outperformance was due to the large cap focus of thePortfolio.
Despite its high absolute returns, the foreign equity component underperformed expectations. Theunder performance can be attributed first to the strength and narrowness of the US and Europeanequity markets. Both markets were driven by a relatively small number of large cap stocks whichmade it very difficult for active managers to outperform the benchmark. The under performancecan also be attributed to the under exposure of the Portfolio to foreign currencies.

Page 16
A significant portion of the Portfolio is currently invested through swap contracts. These are entirelyhedged back into Canadian dollars. The benchmark assumes that investment is made in localcurrencies and therefore the return will include both market and currency returns. The decline in theCanadian dollar relative to most world currencies in 1998 added to the benchmark’s return andresulted in the Portfolio under performing. This was partially reversed in the first quarter of 1999 asthe Canadian dollar rallied. As the Canadian dollar continues to strengthen, the under performancedue to currency will correct.
On a relative basis the Endowment Portfolio did substantially better than other institutional funds.SEI, an asset management consulting firm, surveys the returns of institutional funds on a quarterlybasis. Based on SEI’s survey, the middle ranked or median fund earned 1.3% over the one year periodending March 31, 1999. This would have put the Portfolio into the top 25% of fund managers.
Investment IncomeThe Endowment Portfolio earned $270.5 million in the last year. $83.6 million was realized capitalgains and $186.9 million was interest, dividend and other income.
Profile of Individual Asset Classes
Short-term InvestmentsThe return over the course of the year, as measured by the ScotiaCapital Markets 91-day T-bill Index,was 4.9%, while the fund’s short term return was 5.0%. Short term investments are used totemporarily invest funds that have been raised through the sale of investments and will be re-allocatedto other investments. Liquidity is important and the focus is on high quality marketable securities.The average term to maturity will not exceed 180 days. At least 40% of the short term portfolio is ingovernment (Federal and provincial) and government guaranteed securities.
Long-term Fixed Income InvestmentsTotal return for the fund’s long term fixed income component was 6.8%, slightly below thebenchmark of 7.0%. The Portfolio is invested across a wide range of fixed income products includingpublicly traded bonds, mortgages and privately issued debt. The publicly traded bonds and privatedebt component returned 7.5% for the year and mortgages returned 6.5%. The under performanceoccurred early in the year when the Portfolio still held a number of shorter term bonds as a result of

Page 17
the initial transfer from the Transition Portfolio and therefore had a shorter duration than thebenchmark.
A portion of the publicly traded pool is managed on an index basis and is invested using swaps.The remainder is actively managed on a risk controlled basis through adjusting the duration andsector weightings.
Canadian EquityThe Canadian equity market returned minus 11.3% for the year ending March 31, 1999 asmeasured by the TSE 300 on a total return basis. The Fund’s combined Canadian equitycomponent returned minus 9.2% over the same period. The strong relative performance can beattributed to the heavy weighting to large capitalized companies in the portfolio which performedbetter than the broad market in 1989-99.
It is unlikely that large capitalized companies will, over the longer term, consistently out performthe market. To reduce the exposure to large capitalized companies, an investment in smallcapitalized companies has been established. In addition, as it grows, the Endowment Portfolio willbecome more diversified in terms of strategy, manager, style and capitalization.
Foreign EquityReturns in non-Canadian equity markets varied for the year ending March 31, 1999. The USmarket as measured by the S&P 500 index returned 25.7% in Canadian dollars. Europe performedwell in absolute terms returning 11.3% based on the Morgan Stanley European index. The Pacificregion earned 17.4% in Canadian dollars while Emerging Markets had a minus 15.9% return.
The foreign equity component was the most significant area of under performance. The Portfolioreturned 16.1% for the year but the benchmark returned 20.5%. Under performance can beattributed to three areas. First, the US market has been relatively narrow with a small number oflarge capitalized companies contributing most of the performance and a difficult market for activemanagers to out-perform. This was particularly evident in the US component of our globalmanagers (which included US investments). We have recently rationalized our manager structureto eliminate global mandates and now manage the US and international components on separatemandates. This will allow for tighter risk control relative to the performance benchmark.The second was our Canadian dollar swap exposure. Currently, nearly a half of the foreign equity

Page 18
exposure is through swaps with approximately two thirds on a hedged basis. The dollar declineddramatically against most world currencies during the first part of the year and only started to recoveras we moved into 1999. We continue to view the Canadian dollar as under valued and have seen adramatic pick-up in performance as the dollar began to recover. The third was our underweighting inthe US market. The US market has consistently appeared to be the most over valued market over thelast two years and we continue to underweight that market relative to the MSCI world index.
The foreign equity exposure is broadly diversified across all markets. Relative to the policy benchmark(equally weighted between the US and Europe and the Far East), the fund has an underweight in the USoffset by overweights in Europe, the Far East and emerging markets.
Real EstateThis was the second strong year in a row for real estate. The Frank Russell Commercial Property Indexreturned 15.8% while the Portfolio’s real estate return was 13.4%. The under performance was attribut-able to difference in calculation between the benchmark and the Portfolio’s return. The benchmark iscalculated on a gross basis and excludes capital expenditure and transaction costs. The Portfolio returnis calculated on a net basis and includes all costs. In addition, the Portfolio is valued annually (as atDecember 31) while the Frank Russell Commercial Property Index reflects new valuations quarterly. Ifcompared on a calendar year basis and if the Portfolio is calculated on the same basis as the index, thereturn would have been 16.4% versus 16.1% for the benchmark.
The real estate property is invested in a diversified portfolio which includes office buildings, industrialproperties and retail (shopping malls). The portfolio invests only in major Canadian urban markets.

Page 19
Administrative ExpensesAdministrative expenses include investment management, cash management, custodial and otherexpenses. External management and custodial fees are deducted directly from the income of theexternally managed pooled funds. Internal administrative expenses are deducted from theinternally managed pooled funds and directly from the Endowment Portfolio and the TransitionPortfolio.
In previous years, only administrative expenses directly charged to the Fund were reported. In the1998-99 year the administrative expenses charged directly to the Fund were $1.6 million($0.5 million in the Endowment Portfolio and $1.1 million in the Transition Portfolio) compared to$2.0 million in the 1997-98 year ($0.3 million in the Endowment Portfolio and $1.7 million in theTransition Portfolio).
The Fund’s total administrative expenses for the year ending 1998-99, including amounts deducteddirectly from the investment income of the pooled funds, amounted to $5.0 million compared to$3.5 million in the 1997-98 year.
The reason for the increase is the transfer of at least $1.2 billion each year from the TransitionPortfolio to the Endowment Portfolio. The Endowment Portfolio is more expensive to administerbecause it is predominantly invested in equities, a large portion of which are foreign equities whichare externally managed.
Administrative Expenses Breakdownfor the year ended March 31, 1999(millions)
1999 1998
Endowment Portfoliodirect $ 0.5 $ 0.3externally managed pools 2.9 1.4interally managed pools 0.5 0.1
3.9 1.8Transition Portfolio
direct 1.1 1.7
$ 5.0 $ 3.5

Page 20
Economic ClimateThe investment performance of the Heritage Fund is closely linked with economic conditions bothin Canada and abroad. Two themes dominated 1998. The first was the crisis in the Far Eastresulting in devaluation of the region’s currencies and downward pressure on commodity pricesand the second was the continued strength of the US economy.
The Canadian economy performed well during 1998. Real Gross Domestic Product (GDP)expanded at a rate of 3.0% versus 3.8% in 1997. Real consumption increased by 2.7% while thenet exports increased by 8.1% and investment spending rose by 4.1%. The growth in 1998 saw acontinued improvement in employment (the unemployment rate declined to 8.4% from 9.2% in1997 and dropped to 7.8% in the first quarter of 1999) and contained inflation.
A major risk to the Canadian outlook is the US economy. With a significant portion of the growthin 1998 accounted for by exports, a key concern is the continued strength of the US economy.Thus far, the US economy has maintained its momentum. For 1998, US real GDP expanded at a3.9% rate with a significant portion of the growth coming in the fourth quarter of 1998. Theconsumer was an important source of strength, with real consumption up 4.8% for the year.Investment spending was also strong, increasing 10.4% for the year. The strength of the USeconomy continues to be impressive, especially the momentum in the second half of the year. Thisappears to have continued into 1999, with strong employment growth (the US unemployment ratedeclined to 4.2% in the first quarter of 1999 versus 4.7% at the beginning of 1998). Inflationremains contained within the 1%-2% range.
Globally, the economic results for 1998 were mixed with some areas such as the Far Eastexperiencing recession and Europe steady but more subdued growth than in North America.Weakness in the Far East region had a deflationary impact on commodity prices and inflation ingeneral. A number of countries have implemented significant reforms and the prospects areimproving in this region. A key issue for the global economic growth in 1999 is whether apossible slowdown in growth in the US will be offset by a pick-up in growth in the Far East.

Page 21
While the recession in the Far East economies put downward pressure on inflation, the impact oncommodity prices hurt many developing countries and also had an impact on countries closely linkedto commodities. Canada was among those countries and the Canadian dollar experienced broadlybased pressure. Against the US dollar, the Canadian dollar started the year at $0.71 and then declinedthroughout the year to finish at $0.65. Although the Canadian dollar appears cheap in terms of relativepurchasing power, an improvement will be closely tied to an improvement in commodity prices.During the first quarter of 1999, the price of oil stabilized as did several other commodities. Furtherimprovement will be tied to a broadly based rise in global economic growth.
Short term interest rates in Canada rose slightly in 1998 with the 3-month Government of CanadaTreasury bill yield increasing from 4.0% to 4.7%. Long term rates, on the other hand, declined from5.6% to 4.9%. Early in the year, Canadian long bond yields were lower than the US although by theend of the year US bond yields had fallen to below Canadian yields. The economic instability wasreflected in wider credit spreads.
It was a volatile year in capital markets. Short term investments returned 4.7% based on theScotiaCapital Markets 91-day Treasury Bill Index. Bond returns were 9.2% based on theScotiaCapital Markets Universe Bond Index reflecting the drop in yields which results in an increasein bond prices. Canadian equities, as measured by the TSE 300 Index, returned –1.6%. Internationalequity markets fared better, the US equity markets as measured by the Standard and Poors 500 Index,was up 37.7% in Canadian dollars while Europe was up 38% and the Pacific Basin returned 10%. Thestronger relative performance of foreign equity markets reflects in part the widespread decline in theCanadian dollar and commodity exposure of the Canadian equity market.

Page 22
GLOSSARY
Accrued InterestInterest income that has been earned but not yet paid in cash.
Bond/DebentureA financial instrument showing a debt where the issuer promises to pay interest and repay the principal by the maturity date.
Book ValueSee Cost Value.
Capital GainThe market value received on sale of an asset beyond its book value or purchase price. If an asset is bought for $50 and sold for $75, therealized capital gain (profit) is $25.
Cost ValueThe value for which an asset was acquired.
DepositsLiquid, short term investments. A cash equivalent.
Duration (also called Modified Duration)Modified duration is the weighted average term to maturity of the security's cash flows (i.e., interest and principal) and is a measure of pricevolatility; the greater the modified duration of a bond, the greater its percentage price volatility.
Fair ValueFair value is the amount of consideration agreed upon in an arm's length transaction between knowledgeable, willing parties who are under nocompulsion to act. Fair value is similar to market value.
Fixed Income SecuritiesInterest bearing investments such as bonds or debentures and money market investments such as treasury bills and discount notes (see “Bond”and “Money Market Security”).
General Revenue Fund (GRF)The central operating account for the Province of Alberta. It is where most of the revenues received by the province are deposited and fromwhere most expenditures are made.

Page 23
Generally Accepted Accounting Principles (GAAP)These are accounting guidelines, formulated by the CICA’s (Canadian Institute of Chartered Accountants) Accounting Standards Committee,that govern how businesses report their financial statements to the public. They are the principles under which the financial statements of theHeritage Fund and other provincial funds are prepared. These principles help ensure fair presentation of the financial affairs of the province.
IncomeThe return from an investment. Can be derived from interest, dividends or appreciation in the value of the asset that is realized when the asset issold.
Internal Rate of ReturnThe internal rate of return is the average rate earned by each and every dollar invested during the period. This rate is influenced not only by themovements in financial markets and decisions made by portfolio managers, but also by the timing and size of the cash inflows and outflows andthe beginning and ending book or market values. Since the internal rate of return weights the final overall return by the size of the investmentand the timing and size of cash flows in each subperiod, the method produces inappropriate results if the purpose is to compare theperformance of two investment funds. For that purpose, the investment industry standard is to use time-weighted rates of return (see “Market(Value) Rate of Return”).
Investment IncomeInvestment income is income from realized capital gains, interest, dividends, security lending and swaps.
Investment PortfoliosA pool of securities held as an investment. Holdings of a diverse group of assets by an individual company or fund.
LiquidityDescribes the ease with which an asset can be turned into cash and the certainty of the value it will fetch.
Market (Value) Rate of ReturnThe market value rate of return measures income (dividends, cash interest and accrued interest) and capital appreciation (or capitaldepreciation). The method used to calculate the return is the time-weighted method with quarterly valuations. Time-weighted rates of returnare designed to eliminate the effect that the size and timing of cash flows has on the internal rate of return since the pattern of cash flowsvary significantly among funds. The investment industry uses time-weighted rates of return when comparing the returns of one fund to anotherfund or to an index.
Marketable SecurityAn investment for which there is usually a ready market.
Mid-term InvestmentA fixed income investment (bonds, debentures, treasury bills or discount notes) that matures in one to five years from the date of acquisition.
Modified DurationA measure of price volatility of fixed income securities (i.e., bonds). It is the weighted average term-to-maturity of the security's cash flows(i.e., interest and principal). The greater the duration of a bond, the greater its percentage price volatility.

Page 24
Money Market SecurityA fixed income security that matures within one year from the date of acquisition.
Net IncomeThe amount of earnings remaining after deducting expenses.
Nominal Rate of ReturnA measure of return that does not exclude or net out the effect of inflation (see Real Rate of Return).
Par ValueA value set as the face amount of a security, typically expressed as multiples of $100 or $1,000. Bondholders receive par value for their bonds onmaturity.
PortfolioThe collection of investment securities held by an investor or a subset thereof.
Provincial Crown CorporationsSpecial purpose companies which carry out government programs. Provincial Crown corporations are used because the nature of the programsare different than those delivered through government departments. The provincial Crown corporations discussed in this report generally offerfinancial services on a partial or full cost-recovery basis. Alberta Opportunity Company and the Alberta Social Housing Corporation areexamples of Alberta provincial Crown corporations.
Real Value or Real Rate of ReturnA measure of value or return after accounting for inflation. It is equal to the nominal value or return less an amount for inflation.
Realized/ UnrealizedTerms generally used to describe capital gains or losses. A gain or loss is realized when an asset is sold; prior to sale the gain or loss is unrealizedand it is only a potential gain or loss.
SecurityAny investment instrument such as a bond, common stock, deed of trust on property, or any evidence of indebtedness or equity.
Short term InvestmentAn investment with a maturity date of less than one year.
Term-to-maturityThe number of years left until a bond matures.
VolatilityIn financial matters, volatility of returns is the measurement used to define risk. The greater the volatility, the higher the risk.

Page 25
To the Provincial Treasurer
I have audited the Statement of Investment Returns of the Transition Portfolio and the Endowment Portfolio of the AlbertaHeritage Savings Trust Fund for the year ended March 31, 1999. This statement is the responsibility of the Fund'smanagement. My responsibility is to express an opinion on this statement based on my audit.
I conducted my audit in accordance with generally accepted auditing standards. Those standards require that I plan andperform an audit to obtain reasonable assurance whether the statement is free of material misstatement. An audit includesexamining, on a test basis, evidence supporting the amounts and disclosures in the statement. An audit also includesassessing the accounting principles used and significant estimates made by management, as well as evaluating the overallpresentation.
In my opinion, this statement presents fairly, in all material respects, the investment returns of the Transition Portfolio andthe Endowment Portfolio of the Fund for the year ended March 31, 1999 in accordance with the disclosed basis ofaccounting as described in Note 2 to the statement.
Peter Valentine, FCAAuditor General
Edmonton, AlbertaMay 26, 1999
AUDITOR'S REPORT ONINVESTMENT RETURNS
[original signed]

Page 26
Statement of Investment Returns of the Transition Portfolio andthe Endowment Portfolio
for the year ended March 31, 1999
1999 1998
Transition Portfolio
Short term fixed income 5.4 4.0Long term fixed income 5.7 8.3Policy loans (Note 2) 6.8 4.3Equities -24.0 —Total return 5.4 6.6
Endowment Portfolio
Short term fixed income 5.0 3.8Long term fixed income 6.8 10.7Real estate 13.4 21.7Canadian equities -9.2 40.6Foreign equities 16.1 29.8Total return 4.7 21.4

Page 27
Notes to the Statement of Investment Returns of the Transition Portfolio and the Endowment Portfolio
for the year ended March 31, 1999
Note 1 Authority and Purpose
The Alberta Heritage Savings Trust Fund operates under the authority of the Alberta Heritage Savings Trust Fund Act (the “Act”),Chapter A-27.01, Revised Statutes of Alberta 1980, as amended.
Note 2 Significant Accounting Policy
Rates of return have been calculated using the time-weighted method with monthly valuations.
The rate of return on investment measures the total proceeds received from an investment per dollar initially invested. Total proceeds include cash distributions(interest and dividend payments) and capital gains or losses (realized and unrealized). The investment industry uses time-weighted rates of return whencomparing the returns of funds with other funds or indices. The time-weighted rate of return is designed to eliminate the effect that the size and timing of cashflows has on the internal rate of return, since the pattern of cash flows vary significantly among funds.
According to the Heritage Fund Business Plan, the performance of both the Transition Portfolio and the Endowment Portfolio are to be measured on a marketvalue basis. Investment returns for the project loans are based on cost values.
Note 3 Uncertainty Due to the Year 2000
The year 2000 issue is the result of some computer systems using two digits rather than four to define the applicable year. Government computer systems thathave date sensitive software may recognize a date using “00” as the year 1900 rather than the year 2000, which could result in miscalculations or system failures.In addition, similar problems may arise in some systems if certain dates in 1999 are not recognized as a valid date or are recognized to represent something otherthan a date. The effects of the year 2000 issue may be experienced before, on, or after January 1, 2000. If not addressed, the effect on operations and financialreporting may range from minor errors to significant systems failure that could affect the ability to conduct some government operations. Despite thegovernment’s efforts to address this issue, it is not possible to be certain that all aspects of the year 2000 problem affecting the Fund, including those related tothe efforts of customers, suppliers and other third parties, will be fully resolved.
Note 4 Management Approval
The Statement of Investment Returns of the Transition Portfolio and the Endowment Portfolio has been approved by management.

Page 28
Auditor's Report ................................................................... 29Balance Sheet ...................................................................... 30Statement of Operations ...................................................... 31Statement of Changes in Financial Position ........................ 32Notes to the Financial Statements ....................................... 33Schedule of Endowment Portfolio Investments .................. 39Schedule of Transition Portfolio Investments ..................... 45
FINANCIAL STATEMENTS

Page 29
To the Provincial Treasurer
I have audited the balance sheet of the Alberta Heritage Savings Trust Fund as atMarch 31, 1999 and the statements of operations and changes in financial positionfor the year then ended. These financial statements are the responsibility of theFund’s management. My responsibility is to express an opinion on these financialstatements based on my audit.
I conducted my audit in accordance with generally accepted auditing standards.Those standards require that I plan and perform an audit to obtain reasonableassurance whether the financial statements are free of material misstatement. Anaudit includes examining, on a test basis, evidence supporting the amounts anddisclosures in the financial statements. An audit also includes assessing theaccounting principles used and significant estimates made by management, as wellas evaluating the overall financial statement presentation.
In my opinion, these financial statements present fairly, in all material respects, thefinancial position of the Fund as at March 31, 1999 and the results of its operationsand the changes in its financial position for the year then ended in accordance withgenerally accepted accounting principles.
Peter Valentine, FCAAuditor General
Edmonton, AlbertaMay 21, 1999
AUDITOR'S REPORT
FINANCIAL STATEMENTS
[original signed]
Page 30
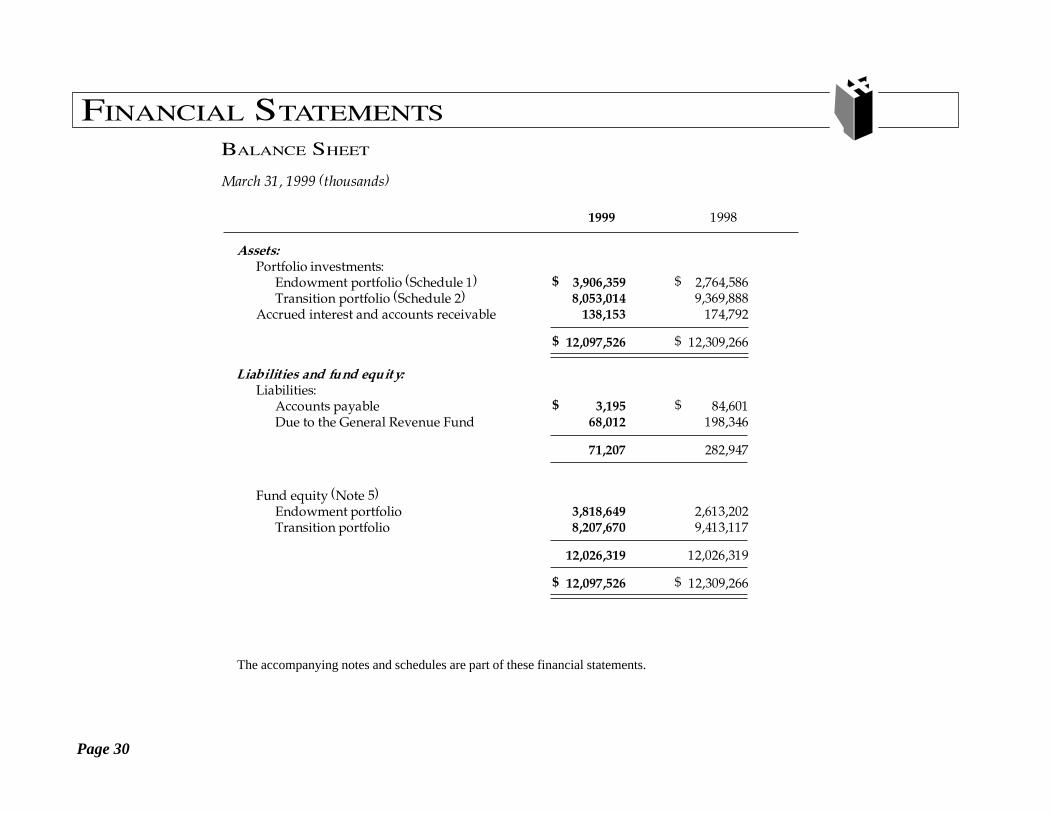
1999 1998
Assets:Portfolio investments:
Endowment portfolio (Schedule 1) $ 3,906,359 $ 2,764,586Transition portfolio (Schedule 2) 8,053,014 9,369,888
Accrued interest and accounts receivable 138,153 174,792
$ 12,097,526 $ 12,309,266
Liabilities and fund equity:Liabilities:
Accounts payable $ 3,195 $ 84,601Due to the General Revenue Fund 68,012 198,346
71,207 282,947
Fund equity (Note 5)Endowment portfolio 3,818,649 2,613,202Transition portfolio 8,207,670 9,413,117
12,026,319 12,026,319
$ 12,097,526 $ 12,309,266
The accompanying notes and schedules are part of these financial statements.
FINANCIAL STATEMENTS
BALANCE SHEET
March 31, 1999 (thousands)

Page 31
1999 1998Budget Actual Actual
Income:Investment income
Endowment portfolio $ 189,000 $ 270,545 $ 293,898Transition portfolio 614,400 663,117 769,585
803,400 933,662 1,063,483
Expenses:Administrative expenses (Note 7) 2,200 1,651 1,956Provision for loan impairment in the
Transition portfolio � � 114,219
2,200 1,651 116,175
Net income (Note 6) 801,200 932,011 947,308
Transfers:Transfers to the General Revenue Fund 716,200 932,011 922,347
Amounts retained (Note 5) 85,000 � 24,961
Net increase in fund equity $ 85,000 � 24,961
Fund equity at beginning of year 12,026,319 12,001,358
Fund equity at end of year $ 12,026,319 $ 12,026,319
FINANCIAL STATEMENTS
STATEMENT OF OPERATIONS
for the year ended March 31, 1999 (thousands)

Page 32
STATEMENT OF CHANGES IN FINANCIAL POSITION
For the year ended March 31, 1999 (thousands)
1999 1998
Operating transactions:Net income $ 932,011 $ 947,308Non-cash items included in net income (82,755) 20,595
849,256 967,903Decrease in receivables 36,639 83,150Increase (decrease) in payables (81,406) 49,561
Cash provided by operating transactions 804,489 1,100,614
Investing transactions:Proceeds from disposals, repayments and
redemptions of investments 7,817,615 13,520,333Purchase of investments (7,603,587) (13,777,554)
Cash provided by (applied to) investing transactions 214,028 (257,221)
Transfers:Transfers to the General Revenue Fund (932,011) (922,347)Increase (decrease) in Due to the General Revenue Fund (130,334) 150,898
Cash applied to transfers (1,062,345) (771,449)
Increase (decrease) in cash and cash equivalents (43,828) 71,944
Cash and cash equivalents at beginning of year 211,342 139,398
Cash and cash equivalents at end of year $ 167,514 $ 211,342
Consisting of Deposits in the ConsolidatedCash Investment Trust Fund:
Endowment Portfolio (Schedule 1) $ 122,504 $ 132,730Transition Portfolio (Schedule 2) 45,010 78,612
$ 167,514 $ 211,342
FINANCIAL STATEMENTS

Page 33
FINANCIAL STATEMENTS
NOTES TO THE FINANCIAL STATEMENTS
March 31, 1999
Note 1 Authority and Mission
The Alberta Heritage Savings Trust Fund operates under the authority of the Alberta Heritage Savings Trust Fund Act (the Act), Chapter A-27.01,Revised Statutes of Alberta 1980, as amended.
The preamble to the Act describes the mission of the Fund as follows:
�To provide prudent stewardship of the savings from Alberta�s non-renewable resources by providing the greatest financial returns on those savings for currentand future generations of Albertans.�
Investments of the Fund are held in an Endowment Portfolio and a Transition Portfolio. The Endowment Portfolio has the objective of maximizinglong term financial returns. The Transition Portfolio has the objective of providing income support to the Government�s consolidated fiscal plan overthe short term to medium term. Commencing in 1996-97, the Act provides that all assets in the Transition Portfolio must be transferred to theEndowment Portfolio by December 31, 2005.
Note 2 Summary of Significant Accounting Policies and Reporting Practices
These financial statements are prepared in accordance with generally accepted accounting principles.
The accounting policies of significance to the Fund are as follows:
(a) Portfolio investments
Fixed income securities, mortgages, equities and real estate investments held directly by the Fund or by pooled investment funds arerecorded at cost. Cost includes the amount of applicable amortization of discount or premium using the straight-line method over the life ofthe investments.
Investments in loans are recorded at cost less any unearned income and allowance for credit loss. Where there is no longer reasonable assuranceof timely collection of the full amount of principal and interest of a loan, a specific provision for credit loss is made and the carrying amount ofthe loan is reduced to its estimated realizable amount.
The cost of disposals is determined on the average cost basis.
Where there has been a loss in value of an investment in fixed income securities, mortgages, equities and real estate that is other than atemporary decline, the investment is written down to recognize the loss. The written down value is deemed to be the new cost.

Page 34
FINANCIAL STATEMENTS
(b) Investment Income
Investment income is recorded on the accrual basis where there is reasonable assurance as to its measurement and collectability. When a loanbecomes impaired, recognition of interest income in accordance with the terms of the original loan agreement ceases. Any subsequentpayments received on an impaired loan are applied to reduce the loan�s book value.
Income and expense on index swaps and interest rate swaps are accrued as earned and gains and losses arising as a result of disposal ofinvestments are included in the determination of investment income.
(c) Foreign Currency
Foreign currency transactions are translated into Canadian dollars using average rates of exchange, except for hedged foreign currencytransactions which are translated at rates of exchange established by the terms of the forward exchange contracts. Exchange differences onunhedged transactions are included in the determination of investment income.
(d) Investment Valuation
Fair value is the amount of consideration agreed upon in an arm�s length transaction between knowledgeable, willing parties who are underno compulsion to act. Fair values of investments held either directly by the Fund or by pooled investment funds are determined as follows:
(i) Public fixed income securities and equities are valued at the year-end closing sale price, or the average of the latest bid and ask pricesquoted by an independent securities valuation company.
(ii) Private fixed income securities, mortgages, provincial debentures are valued based on the net present value of future cash flows.These cash flows are discounted using appropriate interest rate premiums over similar Government of Canada benchmark bondstrading in the market.
(iii) The fair value of private equities is estimated by management.
(iv) Real estate investments are reported at their most recent appraised value, net of any liabilities against the real property. Real estateproperties are appraised annually by qualified external real estate appraisers.
(v) Fair values of loans are not reported due to there being no organized financial market for the instruments and it is not practicable withinconstraints of timeliness or cost to estimate the fair values with sufficient reliability.
(vi) The fair values of deposits, receivables, accrued interest and payables are estimated to approximate their book values.
(vii) The fair values of investments and any other assets and liabilities denominated in a foreign currency are translated at theyear-end exchange rate.

Page 35
Note 3 Investment Risk Management
Income and financial returns of the Fund are exposed to credit risk and price risk. Credit risk relates to the possibility that a loss may occur from thefailure of another party to perform according to the terms of a contract. Price risk is comprised of currency risk, interest rate risk and market risk.Currency risk relates to the possibility that the investments will change in value due to future fluctuations in foreign exchange rates. Interest rate riskrelates to the possibility that the investments will change in value due to future fluctuations in market interest rates. Market risk relates to thepossibility that the investments will change in value due to future fluctuations in market prices.
The Standing Committee on the Alberta Heritage Savings Trust Fund reviews and approves the business plan of the Fund. In order to earn an optimalfinancial return at an acceptable level of risk, the 1998-99 business plan establishes an asset mix policy of 35% to 55% fixed income instruments and 45%to 65% equities for the Endowment Portfolio and limits investments of the Transition Portfolio to include only fixed income securities other thansecurities transferred from the old structure. Risk is reduced through asset class diversification, diversification within each asset class, quality andduration constraints on fixed income instruments, and restrictions on amounts exposed to countries designated as emerging markets. Borrowing orleveraging is not allowed with the exception of pre-existing mortgages on real estate. Controls are in place respecting the use of derivatives(see Note 4). Forward foreign exchange contracts may be used to manage currency exposure in connection with securities purchased in foreigncurrency (see Note 4).
Note 4 Index Swaps, Interest Rate Swaps, Foreign Exchange and Futures Contracts
The Fund uses index and interest rate swaps held directly, or indirectly through pooled funds, to enhance return and for hedging risks. A swap is acontractual agreement between two parties to exchange a series of cash flows based on a notional amount and does not involve the exchange of theunderlying principal.
An index swap involves the exchange of a floating interest rate cash flow for one based on the performance of a market index. For interest rate swaps,parties generally exchange fixed and floating rate interest cash flows based on a notional value. The notional value is the amount to which a rate isapplied in order to calculate the exchange of cash flows. All swaps are supported by underlying securities. Leveraging is not allowed.
The following is a summary of the Fund�s proportionate share of the notional amount of index swaps and interest rate swaps held directly or issued bypooled funds at March 31, 1999:
FINANCIAL STATEMENTS

Page 36
FINANCIAL STATEMENTS
The fair value of swaps have been included in the determination of the fair value of the respective pooled investment funds.
Foreign exchange contracts are contractual agreements to exchange specified currencies at an agreed upon exchange rate and on an agreed settlementdate in the future. As at March 31, 1999, the Fund�s proportionate share of outstanding forward foreign exchange contracts issued by the ExternalManagers Fund amounted to $145,486,000 (1998: $67,768,000).
A stock index futures contract is an agreement to take or make delivery of an amount of cash reflecting the difference between changes in the level of thespecified stock index. As at March 31, 1999, the Fund�s proportionate share of the notional value of stock index futures contracts issued by the ExternalManagers Fund amounted to $5,062,000 (1998: nil).
Note 5 Fund Equity
Each year, commencing in 1996-97, a minimum of $1.2 billion of assets, at cost, will be transferred to the Endowment Fund from the Transition Funduntil all assets are transferred no later than 2005. In 1998-99 the Lieutenant Governor in Council approved this transfer of assets with a book value of notless than $1.2 billion.
Annually, a portion of net income of the Fund was retained in the Endowment Portfolio, as determined by multiplying the net assets of the Fund by thepercentage increase in the Canadian gross domestic product price index for the fiscal year. Section 11(1) of the Alberta Heritage Savings Trust Fund Act (theAct) required that, until the completion of the 1998-99 fiscal year, the Fund would be allowed to keep the lesser of (i) the income necessary to fully offsetinflation, and (ii) the amount, if any, by which the province�s surplus exceeds $500 million in that year. On March 23, 1999 the Fiscal Responsibility Actreceived Royal Assent and Section 11(1) of the Act was repealed. Section 11(5) was added to the Act and states that for fiscal years subsequent to 1999and until the accumulated debt is eliminated, the Provincial Treasurer is not required to retain amounts for inflation proofing in the Fund, but may retainsuch amounts as the Provincial Treasurer considers advisable. In 1998-99, no portion of the net income of the Fund was retained in the EndowmentPortfolio.
1999 1998
(thousands)
Index swaps:Bonds (Canadian Dollar Public Debt Pool) $ 250,319 $ 153,783Canadian equities, directly held 142,069 159,924Foreign equities (Global Structured Equity Pooled Fund) 292,227 163,946United States equities (US Passive Equity Pooled Fund) 168,296 59,523
Interest rate swaps:Directly held 134,614 65,000Canadian Dollar Public Debt Pool 179,896 76,977Global Structured Equity Pooled Fund 208,107 94,047Floating Rate Note Pool 138,048 108,365US Passive Equity Pooled Fund 15,247 �
Total $ 1,528,823 $ 881,565

Page 37
FINANCIAL STATEMENTS
Endowment Transition Total TotalPortfolio Portfolio 1999 1998
(thousands)
Deposit and fixed income securities:Deposits in the Consolidated Cash Investment Trust Fund $ 5,763 $ 3,168 $ 8,931 $ 7,565Public fixed income securities, directly held:
Government of Canada, direct and guaranteed 5,764 163,086 168,850 273,479Alberta, direct and guaranteed 1,120 11,524 12,644 15,998Other provincial, direct and guaranteed 7,156 166,389 173,545 186,606Municipal � 4,336 4,336 2,696Corporate 824 179,918 180,742 146,533Security lending 24 373 397 431
Provincial corporations debentures � 103,388 103,388 160,322Canadian Dollar Public Debt Pool 87,826 � 87,826 67,112Floating Rate Note Pool 8,318 � 8,318 3,320Private Mortgage Pool 16,406 � 16,406 7,820Private Debt Pool 4,707 � 4,707 1,889
137,908 632,182 770,090 873,771
Equities:Public Canadian equities, directly held 22,258 30,935 53,193 75,164Canadian Pooled Equity Fund 598 � 598 �External Managers Fund (Canadian) 3,335 � 3,335 2,518Private Equity Pool 808 � 808 1,847Private Equity Pool (98) (14) � (14) �External Managers Fund (Global) 44,474 � 44,474 14,084Global Structured Equity Pooled Fund 36,382 � 36,382 34,205United States Pooled Equity Fund 831 � 831 4,375US Passive Equity Pooled Fund 28,038 � 28,038 658External Managers Fund (United States) 16,051 � 16,051 5,000Security lending 82 � 82 44Swaps, direct (24,584) � (24,584) 50,924Private Real Estate Pool 4,378 � 4,378 893
132,637 30,935 163,572 189,712
Investment income 270,545 663,117 933,662 1,063,483Administrative expenses (Note 7) (502) (1,149) (1,651) (1,956)
Provision for loan impairment � � � (114,219)
Net Income $ 270,043 $ 661,968 $ 932,011 $ 947,308
Note 6 Net Income

Page 38
FINANCIAL STATEMENTS
Note 6 Net Income (continued)
Investment income is comprised of interest, dividends, amortization of discount and premiums, swap income, security lending income and realizedgains and losses, net of write-downs, on investments.
Investment income from the Endowment portfolio and the Transition portfolio includes net gains from disposal of investments totalling $83,614,000(1998: $101,081,000) and $70,774,000 (1998: $91,427,000) respectively.
Note 7 Administrative Expenses
Administrative expenses include investment management, cash management, safekeeping costs and other expenses charged on a cost-recovery basisdirectly from the Department of Treasury. External management and custodial fees are deducted directly from investment income of External ManagersFund (Canadian, Global and United States). During the year, the Fund�s share of administrative expenses deducted directly from investment income ofexternally and internally managed pooled funds (see Note 6) amounted to $2,896,000 and $493,000 respectively (1998: $1,381,000 and $161,000).Total administrative expense during the year, including amounts deducted directly from investment income of pooled funds amounted to $5,040,000(1998: $3,498,000) or approximately 4 basis points on rate of return (1998: 3 basis points).
Note 8 Uncertainty Due to the Year 2000
The year 2000 issue is the result of some computer systems using two digits rather than four to define the applicable year. Government computersystems that have date sensitive software may recognize a date using �00� as the year 1900 rather than the year 2000, which could result inmiscalculations or system failures. In addition, similar problems may arise in some systems if certain dates in 1999 are not recognized as a valid date orare recognized to represent something other than a date. The effects of the year 2000 issue may be experienced before, on, or after January 1, 2000. If notaddressed, the effect on operations and financial reporting may range from minor errors to significant systems failure that could affect the ability toconduct some government operations. Despite the government�s efforts to address this issue, it is not possible to be certain that all aspects of the year2000 issue affecting the Fund, including those related to the efforts of customers, suppliers and other third parties, will be fully resolved.
Note 9 Comparative Figures
Certain 1998 figures have been reclassified to conform to 1999 presentation.
Note 10 Approval of Financial Statements
These financial statements were approved by management.

Page 39
FINANCIAL STATEMENTS
1999 1998Cost Fair Value % Cost Fair Value %
Deposit in the Consolidated Cash Investment Trust Fund (a) $ 122,504 $ 122,504 2.8 $ 132,730 $ 132,730 4.1Fixed Income securities:
Public, directly held (b)Government of Canada, direct and guaranteed 63,772 65,439 1.5 170,738 172,125 5.3Provincial:
Alberta, direct — — — 35,907 36,890 1.1Other, direct and guaranteed 44,830 46,059 1.1 97,850 102,060 3.1
Corporate — — — 40,966 41,773 1.3Canadian Dollar Public Debt Pool (c) 1,350,689 1,334,164 30.8 848,113 845,622 25.9Floating Rate Note Pool (d) 181,982 182,865 4.2 154,509 154,998 4.7Private Mortgage Pool (e) 275,243 274,250 6.3 141,627 141,962 4.3Private Debt Pool — — — 134,587 135,338 4.1
Total deposit and fixed income securities (m) 2,039,020 2,025,281 46.7 1,757,027 1,763,498 53.9
Canadian equities:Public, directly held (f) 279,726 651,008 15.0 277,989 725,845 22.3Canadian Pooled Equity Fund (g) 40,598 41,760 1.0 — — —External Managers Fund (Canadian) (h) 210,681 215,144 5.0 46,846 52,664 1.6Private Equity Pool (i) 14,177 11,273 0.3 18,614 18,356 0.6Private Equity Pool (98) (i) 14,502 14,502 0.3 — — —
Total Canadian equities (m) 559,684 933,687 21.6 343,449 796,865 24.5
Foreign equities:External Managers Fund (Global) (h) 525,561 564,157 13.0 320,368 344,962 10.6Global Structured Equity Pooled Fund (j) 303,261 297,346 6.9 171,879 167,020 5.1US Passive Equity Pooled Fund (k) 170,381 170,466 3.9 60,823 63,073 1.9External Managers Fund (United States) (h) 143,616 171,535 4.0 72,737 84,832 2.6United States Pooled Equity Fund 3,139 1,675 — 3,373 5,224 0.2
Total foreign equities 1,145,958 1,205,179 27.8 629,180 665,111 20.4
Real estate (l) 161,697 170,146 3.9 34,930 39,234 1.2
Total equities and real estate (m) 1,867,339 2,309,012 53.3 1,007,559 1,501,210 46.1
Total investments (n) $ 3,906,359 $ 4,334,293 100.0 $ 2,764,586 $ 3,264,708 100.0
SCHEDULE OF ENDOWMENT PORTFOLIO INVESTMENTS SCHEDULE 1March 31, 1999 (thousands)

Page 40
NOTES TO SCHEDULE 1
The majority of the Endowment portfolio investments are held in pooled investment funds established and administered by the Provincial Treasurer.Pooled investment funds have a market based unit value that is used to allocate income to participants and to value purchases and sales of pool units.As at March 31, 1999, the Fund�s percentage ownership, at market, in pooled investment funds is as follows:
% Ownership
1999 1998
Canadian Dollar Public Debt Pool 16.4 12.1Canadian Pooled Equity Fund 2.0 �External Managers Fund 21.9 15.8Floating Rate Note Pool 7.5 11.0Global Structured Equity Pooled Fund 21.7 16.6Private Debt Pool � 17.3Private Equity Pool 13.6 13.4Private Equity Pool (98) 100.0 �Private Mortgage Pool 27.1 17.9Private Real Estate Pool 23.4 8.4US Passive Equity Pool 26.9 13.3United States Pooled Equity Fund 18.0 13.7
FINANCIAL STATEMENTS
(a) The Consolidated Cash Investment Trust Fund is managed with the objective of providing competitive interest income to depositors whilemaintaining maximum security and liquidity of depositors� capital. The portfolio is comprised of high quality short term and mid termfixed income securities with a maximum term-to-maturity of five years.
(b) Public fixed income instruments are managed with the objective of providing competitive returns over a four year period while maintainingmaximum security of the Fund�s capital. Return is maximized within the risk constraints on the portfolio by management of portfolio durationand issuer mix. Fixed income securities held by the Fund have an average effective yield of 5.22% per annum based on market for securitiesmaturing between one and twenty years (1998: 5.24%) and the following term structure based on par: 1 to 5 years - 47%; 5 to 10 years - 26%;10 to 20 years - 27%. As at March 31, 1999, securities with a fair value of $28,646,000 (1998: $106,213,000) were loaned to certain borrowers.The loans were secured by marketable securities with a fair value of $31,370,000 (1998: $112,373,000). During the term of the loan, the Fundretains the right to receive income on the securities loaned, in addition to the fees earned.
(c) The Canadian Dollar Public Debt Pool is managed with the objective of providing above average returns compared to the total return of theScotia Capital Markets Universe Bond Index over a four year period while maintaining adequate security and liquidity of participants� capital.The excess return is expected to be achieved through management of portfolio duration and sector rotation. The portfolio is comprised of highquality Canadian fixed income instruments and debt related derivatives. During the year, the pool received private fixed income securities fromthe Private Debt Pool and the Private Mortgage Pool. As at March 31, 1999, securities held by the Pool have an average effective yield of 5.51%per annum based on market (1998: 5.41%) and the following term structure based on par: under 1 year - 10%; 1 to 5 years - 37%; 5 to 10 years -24%; 10 to 20 years - 21%; over 20 years - 8%.

Page 41
(d) The Floating Rate Note Pool is managed with the objective of generating floating rate income needed for the swap obligations of the participantswith structured investments in foreign equities, domestic equities and domestic bonds. Through the use of interest rate swaps, the Pool providesinvestment opportunities in high quality floating-rate instruments with remaining term-to-maturity of ten years or less.
(e) The Private Mortgage Pool is managed with the objective of providing investment returns higher than attainable from the publicly traded bondmarket over a five to ten year period. The portfolio is comprised primarily of high quality commercial mortgage loans. Risk is reduced bylimiting investments to include NHA insured loans and first mortgage loans that provide diversification by property usage. The Pool does notinvest in mortgages on single family houses, hotels, motels, trailer parks or recreational properties. As at March 31, 1999, mortgages held by thePool have an average effective yield of 7.08% per annum based on market (1998: 7.37%) and the following term structure based on par:under 1 year - 9%; 1 to 5 years - 33%; 5 to 10 years - 42%; over 10 years - 16%.
FINANCIAL STATEMENTS
1999 1998
Cost Fair Value Cost Fair Value
(thousands)Deposit in the Consolidated Cash Investment Trust Fund $ 18,797 $ 18,797 $ 10,800 $ 10,800Public Fixed Income securities:
Government of Canada, direct and guaranteed 364,229 366,823 286,770 291,346Province of Alberta, direct and guaranteed 30,769 31,780 22,997 24,179Other provinces, direct and guaranteed 168,520 174,009 137,271 140,556Municipal 13,746 13,632 6,990 7,231Corporate 544,561 527,995 375,401 363,626
Private Fixed Income securitiesCorporate 193,991 185,052 � �
Total deposit and fixed income securities 1,334,613 1,318,088 840,229 837,738
Accounts receivable and accrued investment income 32,496 32,496 14,470 14,470Accounts payable (16,420) (16,420) (6,586) (6,586)
16,076 16,076 7,884 7,884
Total - Alberta Heritage Savings Trust Fund $ 1,350,689 $ 1,334,164 $ 848,113 $ 845,622Total Canadian Dollar Public Debt Pool $ 7,812,035 $ 8,112,618 $ 6,635,228 $ 7,000,911
The following is a summary of the Alberta Heritage Savings Trust Fund�s investment in the Canadian Dollar Public Debt Pool as at March 31, 1999:

Page 42
(f) Competitive returns and capital preservation are expected from investments in Canadian public equities. Risk is reduced by prudent securityselection and management of holdings in various industrial sectors. As at March 31, 1999, equity securities with a fair value of $99,820,000(1998: $58,298,000) were loaned to certain borrowers. The loans were secured by marketable securities with a fair value of $109,310,000(1998: $61,679,000). During the term of the loans, the Fund retains the right to receive income on the securities loaned, in addition to the feesearned. The following is a summary of directly held Canadian public equities which are listed by industrial classifications used by the TorontoStock Exchange:
1999 1998
Cost Fair Value % Cost Fair Value %
(thousands) (thousands)
Communications and media $ 16,269 $ 73,078 11 $ 8,752 $ 37,280 5Conglomerates 14,472 44,367 7 14,472 55,348 8Consumer products 5,176 26,722 4 13,800 51,357 7Financial services 4,657 20,571 3 4,657 21,655 3Gold and precious metals 21,334 28,987 4 21,334 37,338 5Industrial products 49,351 135,254 21 52,797 155,264 22Merchandising 11,543 39,900 6 12,262 41,164 6Metals and minerals 31,479 43,202 7 33,217 57,068 8Oil and gas 36,909 62,720 10 35,844 73,893 10Paper and forest products 12,005 15,707 2 13,471 22,897 3Pipelines 22,748 42,891 7 13,766 35,409 5Real estate 2,667 7,873 1 2,667 9,487 1Transportation and environmental services 14,027 16,602 3 14,027 30,814 4Utilities 37,089 93,134 14 36,923 96,871 13
$ 279,726 $ 651,008 100 $ 277,989 $ 725,845 100
FINANCIAL STATEMENTS
(g) The Canadian Pooled Equity Fund is managed with the objective of providing competitive returns comparable to the total return of the TorontoStock Exchange 300 Index while maintaining maximum preservation of participants� capital. The portfolio is comprised of publicly tradedequities in Canadian corporations. Risk is reduced by prudent security selection and sector rotation.

Page 43
(h) The External Managers Fund is managed by external managers with expertise in global equity markets and Canadian small capitalizedcompanies and large capitalized companies. The objective of the Fund is to provide investment returns higher than the total return of theapplicable Morgan Stanley, Standard & Poor�s and Toronto Stock Exchange indices over a four year period. The portfolio is comprised ofpublicly traded equity securities on Canadian and approved foreign markets. Risk is reduced through manager style and marketdiversification. The following is a summary of the Alberta Heritage Savings Trust Fund�s investment in the External Managers Fund, bygeographic region, as at March 31, 1999:
The following is a summary of assets and liabilities of the External Managers Fund as at March 31, 1999:
FINANCIAL STATEMENTS
1999 1998
(thousands)
Cash and short term securities $ 109,079 $ 130,426Investments - Public equities 3,438,393 2,270,812
- Fixed income securities 1,247 3,936Accounts receivable and accrued investment income 27,890 27,357Accounts payable (38,641) (32,978)
Total - External Managers Fund $ 3,537,968 $ 2,399,553
1999 1998
Cost Fair Value Cost Fair Value
(thousands)
Foreign Public Equity Pools:Multi Region $ 206,656 $ 218,518 $ 140,157 $ 154,058Europe 204,448 201,303 105,040 122,046Pacific Basin 104,299 132,253 75,171 68,858Emerging Markets 10,158 12,083 � �
525,561 564,157 320,368 344,962
United States 143,616 171,535 72,737 84,832
CanadianLarge capitalized companies 114,621 116,432 � �Small capitalized companies 96,060 98,712 46,846 52,664
210,681 215,144 46,846 52,664
Total - Alberta Heritage Savings Trust Fund $ 879,858 $ 950,836 $ 439,951 $ 482,458
Total - External Managers Fund $ 3,537,968 $ 4,338,781 $ 2,399,553 $ 3,043,960

Page 44
FINANCIAL STATEMENTS
(i) The Private Equity Pool and the Private Equity Pool (98) are managed with the objective of providing investment returns higher than attainablefrom the TSE 300 Index over a five to ten year period. The portfolio is comprised of equity investments in companies that show higher thanaverage growth potential. Risk is reduced by avoiding direct investments in start-up and venture capital situations and by limiting holdings inany single company.
(j) The Global Structured Equity Pooled Fund is managed with the objective of providing investment returns comparable to the total return of theMorgan Stanley World Equity Index. The Pool provides exposure to global markets through the use of structured investments such as foreignequity index swaps and as at March 31, 1999, 90% (1998: 81%) of the Pool�s underlying investments supporting the index swaps are held inunits of the Floating Rate Note Pool (see Schedule 1 (d)).
(k) The US Passive Equity Pooled Fund is a passively managed United States equity fund that provides a return equal to the total rate of theStandard & Poor�s 500 United States Equity Index. Futures, swaps and other structured investments may be used to enhance performance ofthe fund.
(l) The Private Real Estate Pool is managed with the objective of providing investment returns comparable to the Russell Canadian Property Indexover a five to ten year period. Real estate is held through intermediate companies which have issued to the Pool, common shares andparticipating debentures secured by a charge on real estate. Risk is reduced by investing in properties that provide diversification by geographiclocation, by property type and by tenancy. As real estate returns are positively correlated to inflation and negatively correlated to returns fromfixed income securities and equities, the Pool provides diversification from the securities market with opportunities for high return.
(m) Deposits and Floating Rate Note Pool units are used as the underlying securities to support the index swaps issued by the Fund (See Note 4).If the effect of the swaps were reflected in this schedule, deposit and fixed income securities would be reduced by $142,069,000(1998: $159,924,000) and Canadian equities increased by a corresponding amount. The resulting assets mix percentage would be 43.5% fixedincome and 56.5% equities.
(n) See Schedule 2, note (f).

Page 45
FINANCIAL STATEMENTS
1999 1998Cost Fair Value % Cost Fair Value %
Deposit in the Consolidated Cash Investment Trust Fund (a) $ 45,010 $ 45,010 0.6 $ 78,612 $ 78,612 0.7Fixed income securities:
Public, directly held (b)Government of Canada, direct and guaranteed 2,189,957 2,222,780 27.4 2,401,344 2,463,997 26.7Provincial:
Alberta, direct and guaranteed 132,129 134,188 1.7 208,133 212,104 2.3Other, direct and guaranteed 1,810,526 1,851,512 22.8 1,991,993 2,085,971 22.6
Municipal 71,888 75,165 0.9 61,704 64,671 0.7Corporate 2,858,237 2,894,530 35.6 2,908,280 2,947,935 32.0
Total deposit and fixed income securities, public 7,107,747 7,223,185 89.0 7,650,066 7,853,290 85.0
Provincial corporation debentures (c):Agriculture Financial Services Corporation 401,212 426,483 5.2 576,900 617,717 6.7Alberta Social Housing Corporation 230,558 326,252 4.0 476,444 587,703 6.5Alberta Municipal Financing Corporation 140,000 149,317 1.8 140,000 158,631 1.7Alberta Opportunity Company — — — 5,977 6,081 0.1
Total Provincial corporation debentures 771,770 902,052 11.0 1,199,321 1,370,132 15.0
Total deposit, debentures and fixed income securities 7,879,517 $ 8,125,237 100.0 8,849,387 $ 9,223,422 100.0
Canadian equities:Public, directly held
TransCanada Pipelines Limited 53,966 $ 63,812 — $ —NOVA Chemical Ltd. 11,714 16,077 — —NOVA Corporation of Alberta Ltd. — — 112,283 $ 181,276
Total Canadian equities 65,680 $ 79,889 112,283 $ 181,276
Loans:Ridley Grain Ltd.
11.303% due July 31, 2015 (d) 93,500 97,750Vencap Acquisition Corporation (e)
due 2001 and 2046 14,317 12,498Murphy Oil Company Ltd. — 37,970Alberta Pacific Pulp Mill Project — 260,000
Total loans 107,817 408,218
Total investments (f) $ 8,053,014 $ 9,369,888
SCHEDULE OF TRANSITION PORTFOLIO INVESTMENTS SCHEDULE 2March 31, 1999 (thousands)

Page 46
FINANCIAL STATEMENTS
NOTES TO SCHEDULE 2
(a) See Schedule 1, note (a).
(b) Public fixed income instruments are managed with the objective of providing a market rate of return higher than the market cost of theCanadian dollar portion of the Province�s debt portfolio on an annual basis. Any excess return is expected to be achieved through managementof portfolio duration as well as through issuer mix. As at March 31, 1999, fixed income securities held have an average effective yield of 4.91%per annum based on market value for securities maturing within a year (1998: 4.84%), and 5.30% per annum for securities maturing between1 and 35 years (1998: 5.34%). As at March 31, 1999, the securities have the following term structure based on par: under 1 year - 10%;1 to 5 years - 56%; 5 to 10 years - 33%; over 10 years - 1%. As at March 31, 1999, securities with a fair value of $857,691,000 (1998: $660,737,000)were loaned to certain borrowers. The loans were secured by marketable securities with a fair value of $939,235,000 (1998: $699,059,000).During the term of the loan, the Fund retains the right to receive income on the securities loaned, in addition to the fees earned.
(c ) As at March 31, 1999, Provincial corporation debentures have an average effective yield of 7.52% per annum based on market value(1998: 7.41%). The maturity profile based on expected repayments is as follows: under 1 year - $259,216,000; 1 to 5 years - $417,897,000; andover 5 years - $94,657,000. Interest rates on Alberta Municipal Financing Corporation debentures are fixed to maturity and redemption is by asingle payment of the full principal sum on maturity. In general the interest rates on the other provincial corporation debentures are fixed for afive year period only and repayment is by either semi-annual or annual instalments of the principal sum over the life of the debenture. TheProvince, through the General Revenue Fund, plans to borrow funds in the market and lend the funds to Agriculture Financial ServicesCorporation (AFSC) and lend or grant funds to Alberta Social Housing Corporation (ASHC). AFSC and ASHC will use the funds torepay the debentures held by the Transition Portfolio generally on the dates when the interest rates on these debentures are reset (every fiveyears). During the year, debentures amounting to $350,725,000 (1998: $496,815,000) were redeemed prior to maturity.
The Fund�s investment in provincial corporation debentures is summarized below:
1999 1998
(thousands)
Balance at beginning of year $ 1,199,321 $ 1,798,037Disposals, repayments and redemptions:
Agriculture Financial Services Corporation (175,688) (158,751)Alberta Social Housing Corporation (245,886) (427,201)Alberta Opportunity Company (5,977) (12,764)
Balance at end of year $ 771,770 $ 1,199,321
Fair values of Provincial corporation debentures are based on the net present value of future cash flows. Each individual cash flow payment isdiscounted at a rate which matches the term of the cash flow payment and is adjusted for a yield premium to reflect several factors. Theseinclude a liquidity premium to reflect the fact that if the debentures are sold, there will be a limited pool of these securities trading in the market;that the debentures would be new to the market and are not direct issues of the Province; a premium for the periodic interest reset featurewhere applicable; and a factor to reflect the blended payment structure of the debentures.

Page 47
(d) Under the terms of the loans, prior to July 31, 1985, interest on the loans has been capitalized and compounded annually; thereafter interest iscompounded semi-annually and payable annually to the extent of available cash flow for that purpose, and any shortfall is to be capitalized.The principal, including capitalized interest, is repayable on or before July 31, 2015. As at March 31, 1999 the allowance for credit losses amountsto $42,927,000 (1998: $42,927,000).
Grain throughput volumes are the main determinant of profitability of the grain terminal and its ability to service its loan from the province, andtherefore the value is sensitive to changes in grain throughput volumes. Grain throughputs are difficult to forecast because they are dependentin part upon port allocation decisions of the Canadian Wheat Board and a number of other factors such as crop size and composition.
(e) In October 1995, the Province agreed to terms of an Arrangement Agreement with Vencap Equities Alberta Ltd. (Vencap) and VencapAcquisition Corporation, an indirect wholly owned subsidiary of Onex Corporation. Pursuant to this Agreement, the province sold its$199,989,000 Vencap loan and four million Vencap share options for cash of $166 million and non-interest bearing payments totalling $63,988,000rescheduled on amended terms as follows:
- $11,400,000 is repayable in January 2001, and will bear no interest.- The balance of $52,588,000 is repayable in July 2046, and will also bear no interest.
The carrying value of the loan has been adjusted to an amount equal to the present value of anticipated loan repayments. The discount isamortized to investment income over the remaining term of the loan on a straight line basis.
(f) During the period, investments with a cost of $1,205,447,000 (market $1,207,196,000), including $1,200,000,000 in deposits in the ConsolidatedCash Investment Trust Fund and $5,447,000 in equities, were transferred from the Transition Portfolio to the Endowment Portfolio in accordancewith the investment provisions of the Alberta Heritage Savings Trust Fund Act.
FINANCIAL STATEMENTS

Page 48
Security Name Security Coupon (%) Maturity Par Value Book Value Market Value
Type
CANADIAN FIXED INCOMEToronto Dominion Centre Bond 6.30% 28-Feb-08 340,000,000 $ 339,959,969 $ 341,355,771Bay Wellington Tower Bond 6.40% 8-Apr-13 300,000,000 295,716,630 298,895,925Pacific Centre Bond 6.19% 31-Jan-03 267,000,000 265,816,724 265,984,322Government of Canada Bond 5.50% 1-Jun-09 194,420,000 199,275,248 200,933,070Province of Ontario Bond 9.50% 12-Jan-07 122,000,000 143,861,021 191,127,640Government of Canada Bond 9.75% 1-Jun-21 118,744,000 160,182,640 185,478,128Toronto Eaton Centre Floating Rate Note 5.59% 31-Oct-01 129,375,000 129,375,000 132,454,125Government of Canada Bond 13.00% 1-May-01 102,860,000 104,971,172 118,957,590Government of Canada Bond 10.50% 1-Mar-01 106,046,000 112,917,451 116,650,600Government of Canada Bond 11.00% 1-Jun-09 78,655,000 92,806,911 114,993,610
Total Ten Largest Issues $ 1,844,882,766 $ 1,966,830,781
Total Net Asset Value - Canadian Dollar Public Debt Pool $ 7,812,035,000 $ 8,112,618,000
Total Net Asset Value - Alberta Heritage Savings Trust Fund - Endowment Portfolio Holdings $ 1,350,689,000 $ 1,334,164,000
CANADIAN DOLLAR PUBLIC DEBT POOL
SCHEDULE OF TEN LARGEST ISSUES (BASED ON MARKET) SCHEDULE 1AS AT MARCH 31, 1999 (UNAUDITED)
List of Investments (Unaudited)
The following unaudited schedules present the ten largest investments in the pools where theEndowment Portfolio’s holdings were greater than 5%, the ten largest Canadian Public Equity issuesthat are directly held by the Endowment Portfolio, and the ten largest issues that are directly held in theTransition Portfolio. The Floating Rate Note Pool is presented because approximately 90% of theGlobal Structured Equity Pooled Fund is invested in the Floating Rate Note Pool. For a detailedlisting of all investments please call (780) 427-4414.
The following schedules present this detail:

Page 49
Security Name Number of Shares Book Value Market Value
CANADIAN PUBLIC EQUITIES, directly heldNorthern Telecom 597,600 $ 5,622,208 $ 56,174,400BCE 822,498 17,595,229 54,901,742Seagram 501,200 8,696,597 37,965,900Bombardier 1,530,000 2,595,645 30,370,500Thomson 633,529 3,655,462 26,766,600TransCanada Pipelines 1,279,336 15,620,191 24,627,220IMASCO 690,324 3,343,218 22,608,111Canadian Pacific 675,309 10,209,554 19,719,023Power Corporation of Canada 670,200 1,094,437 19,368,780ALCAN Aluminum 468,178 7,181,936 18,188,715
Total Ten Largest Issues $ 75,614,477 $ 310,690,991
Total Canadian Public Equities, directly held $ 279,726,000 $ 651,008,000
CANADIAN PUBLIC EQUITIES, DIRECTLY HELD
SCHEDULE OF TEN LARGEST ISSUES (BASED ON MARKET) SCHEDULE 2AS AT MARCH 31, 1999 (UNAUDITED)

Page 50
Security Name Country Number of Shares Book Value Market Value
Microsoft United States 344,113 $ 15,277,835 $ 46,775,933General Electric United States 234,157 17,107,307 39,186,810Cisco Systems United States 222,888 12,913,571 36,942,655Citigroup United States 351,733 17,480,581 33,987,836MCI Worldcom United States 246,550 12,000,037 33,031,961Novartis Switzerland 12,558 27,144,444 30,816,784Nippon Telegraph and Telephone Japan 1,870 21,511,431 27,708,751Telecom Italia Italy 1,899,984 17,528,287 27,641,834BP Amoco United Kingdom 1,046,218 21,745,114 26,750,502Home Depot United States 278,222 8,800,003 26,200,544
Total Ten Largest Foreign Issues $ 171,508,610 $ 329,043,610
Total Net Asset Value - External Managers Fund - Foreign Issues $ 2,344,276,000 $ 3,101,175,000
Total Net Asset Value - Alberta Heritage Savings Trust Fund - Endowment Portfolio Holdings $ 669,177,000 $ 735,692,000
EXTERNAL MANAGERS FUND (GLOBAL AND UNITED STATES)SCHEDULE OF TEN LARGEST FOREIGN ISSUES (BASED ON MARKET) SCHEDULE 3AS AT MARCH 31, 1999 (UNAUDITED)

Page 51
Security Name Security Coupon (%) Maturity Par Value or Book Value Market Value
Type Number of Shares
DEPOSIT IN THE CONSOLIDATED CASHINVESTMENT TRUST FUND $ 20,520,796 $ 20,520,796
CANADIAN FIXED INCOMEFloating Rate Note Pool (see Schedule 5) Pool Units 107,058,456 1,233,451,141 1,239,911,553GM Acceptance Canada Note 5.450% 21-Jan-02 25,000,000 25,000,000 24,925,000Canadian Imperial Bank of Commerce Floating Rate Bond 5.303% 07-Mar-07 20,000,000 20,000,000 19,982,000Toronto Eaton Centre Floating Rate Note 5.590% 31-Oct-01 24,375,000 24,375,000 24,955,125
Total Deposit and Fixed Income Securities 1,323,346,937 1,330,294,474
Accrued income and accounts receivable 42,843,079 42,843,079
Total Net Asset Value - Global Structured Equity Pooled Fund(a) $ 1,366,190,016 $ 1,373,137,553
Total Net Asset Value - Alberta Heritage Savings Trust Fund - Endowment Portfolio Holdings $ 303,261,000 $ 297,346,000
(a) Investments support the foreign equity index swaps of the pool which provide exposure to global markets.
GLOBAL STRUCTURED EQUITY POOLED FUND
DETAILED LIST OF INVESTMENTS SCHEDULE 4AS AT MARCH 31, 1999 (UNAUDITED)

Page 52
Security Name Security Coupon (%) Maturity Par Value or Book Value Market Value
Type Number of Shares
CANADIAN FIXED INCOMECanadian Imperial Bank of Commerce Floating Rate Bond 5.250% 30-Oct-07 150,000,000 $ 150,000,000 $ 149,812,500Ford Credit Canada Floating Rate Bond 5.248% 12-May-03 126,000,000 125,666,201 125,080,200Toronto Eaton Centre Floating Rate Note 5.590% 31-Oct-01 99,375,000 99,375,000 101,740,125Canadian Pacific Limited Bond 10.500% 30-Apr-01 50,000,000 53,761,205 54,957,500Associates Cap Note 5.550% 15-Dec-03 50,000,000 50,000,000 50,104,500Canadian Imperial Bank of Commerce Floating Rate Note 5.342% 4-Mar-08 50,000,000 50,000,000 49,970,000Canadian Imperial Bank of Commerce Floating Rate Bond 5.303% 7-Mar-07 30,000,000 30,000,000 29,973,000General Motors Acceptance Canada Note 5.700% 12-Mar-01 25,000,000 25,984,458 25,087,500General Motors Acceptance Canada Note 5.350% 11-Jan-01 25,000,000 25,000,000 24,962,500
Total Ten Largest Issues $ 609,786,864 $ 611,687,825
Total Net Asset Value - Floating Rate Note Pool $ 2,415,316,028 $ 2,422,076,644
Total Net Asset Value - Global Structured Equity Pooled Fund Holdings $ 1,233,451,141 $ 1,239,911,553
Total Net Asset Value - Alberta Heritage Savings Trust Fund - Endowment Portfolio Holdings $ 181,982,000 $ 182,865,000
FLOATING RATE NOTE POOL
SCHEDULE OF TEN LARGEST ISSUES (BASED ON MARKET) SCHEDULE 5AS AT MARCH 31, 1999 (UNAUDITED)

Page 53
Security Name Number of Shares Book Value Market Value
BCE 742,600 $ 40,228,685 $ 49,568,550Northern Telecom 407,800 26,539,128 38,333,200Royal Bank Canada 519,200 38,499,842 36,733,400Bank of Montreal 504,600 31,659,228 30,553,530Toronto Dominion Bank 417,250 22,873,922 28,831,975Bank of Nova Scotia 881,025 27,039,176 28,236,851Canadian Imperial Bank of Commerce 560,200 18,852,350 21,623,720Transcanada Pipelines 1,002,054 21,950,270 19,289,540Imasco 561,000 16,539,727 18,372,750Bombardier 719,500 13,107,641 14,282,075
Total Ten Largest Canadian Issues $ 257,289,969 $ 285,825,591
Total Net Asset Value - External Managers Fund - Canadian Issues $ 1,193,692,000 $ 1,237,606,000
Total Net Asset Value - Alberta Heritage Savings Trust Fund - Endowment Portfolio Holdings $ 210,681,000 $ 215,144,000
EXTERNAL MANAGERS FUND - CANADIAN
SCHEDULE OF TEN LARGEST CANADIAN ISSUES (BASED ON MARKET) SCHEDULE 6AS AT MARCH 31, 1999 (UNAUDITED)

Page 54
Security Name Location Book Value(a) Market Value(a)
Canada Place Edmonton, AlbertaRichmond Adelaide Centre Toronto, OntarioThe Atria North York , OntarioHabour Centre Vancouver Vancouver, British ColumbiaSelkirk Office Buildings Victoria, British ColumbiaWest Metro Centres Etobicoke, Ontario320 Bay Street Toronto, Ontario999 West Hastings Vancouver, British ColumbiaMississauga Executive Centre Mississauga, OntarioFitzpatrick Housing Co-operative Richmond Hill, Ontario
Total Net Asset Value - Private Mortgage Pool $ 965,091,000 $ 1,011,902,000
Total Net Asset Value - Alberta Heritage Savings Trust Fund - Endowment Portfolio Holdings $ 275,243,000 $ 274,250,000
(a) Book and market values have not been provided due to the confidentiality of the investments.
PRIVATE MORTGAGE POOL
CANADIAN PRIVATE MORTGAGES
SCHEDULE OF TEN LARGEST ISSUES (BASED ON MARKET) SCHEDULE 7AS AT MARCH 31, 1999 (UNAUDITED)

Page 55
Security Name Security Coupon % Maturity Par Value Book Value Market Value
Type
Hydro Quebec Bond 11.00% 15-Oct-04 $ 200,000,000 $ 197,663,954 $ 206,100,000Province of British Columbia Bond 10.75% 19-Feb-01 140,714,000 148,963,761 153,905,938Government of Canada Bond 7.75% 01-Sep-99 145,140,000 146,690,247 146,881,680Province of Ontario Coupon � 05-Apr-01 150,000,000 135,242,639 134,812,500Government of Canada Coupon � 01-Dec-04 166,600,000 122,134,777 124,950,000Government of Canada Bond 10.50% 01-Mar-01 112,000,000 119,226,429 123,200,000Hydro Quebec Bond 11.75% 15-Jul-05 110,000,000 110,000,000 119,130,000Government of Canada Bond 5.00% 01-Sep-04 113,866,000 112,560,175 113,979,866Province of Ontario Bond 9.75% 29-Oct-01 96,613,000 104,895,144 106,515,833Government of Canada Bond 11.75% 01-Feb-03 84,547,000 104,678,162 104,077,357
Total Ten Largest Issues $ 1,302,055,288 $ 1,333,553,174
Total Net Asset Value - Transition Portfolio (a) $ 8,053,014,000 $ 8,312,943,000
(a) Includes Policy Loans at cost.
ALBERTA HERITAGE SAVINGS TRUST FUND - TRANSITION PORTFOLIO
SCHEDULE OF TEN LARGEST CANADIAN ISSUES (BASED ON MARKET) SCHEDULE 8AS AT MARCH 31, 1999 (UNAUDITED)

Alberta Heritage Savings Trust FundRoom 304, 9515-107 StreetEdmonton, Alberta T5K 2C3Phone: (780) 427-4414
Alberta Heritage Savings Trust Fund Standing CommitteeChairman: Mr. Hung PhamDeputy Chairman: Mr. Victor DoerksenMembers: Mr. Bill Bonner
Ms. Debby CarlsonMr. Glen CleggMr. Ron HierathMr. Rob LougheedMr. Shiraz ShariffMr. Ron Stevens
Committee Clerk to the Standing CommitteeMrs. Diane Shumyla
Investment Operations CommitteeChairman: A.D. O’Brien
Deputy Provincial TreasurerMembers: Carl H. Otto, Carl Otto Associates Inc.
Robert L. Phillips, President and Chief Executive Officer, PTI Group Inc.Roger S. Smith, Vice-President (Research and External Affairs)
and Professor of Economic Analysis, University of AlbertaJohn D. Watson, Vice-President, Finance and Chief Financial Officer,
Alberta Energy Company Ltd.Secretary: Robert A. Bhatia, Assistant Deputy Provincial Treasurer, Treasury Operations
Investment ManagerAlberta Treasury
AuditorAuditor General of Alberta