albumins characterization in relation to rheological
TRANSCRIPT

J. Agr. Sci. Tech. (2015) Vol. 17: 805-816
805
Albumins Characterization in Relation to Rheological
Properties and Enzymatic Activity of Wheat Flour Dough
J. Tomić1∗, A. Torbica1, L. Popović2, I. Strelec3, Ž. Vaštag2, M. Pojić1, and S. Rakita1
ABSTRACT
The aim of this study was to characterize albumin fractions of four different wheat
varieties grown in a local climatic context, as well as to find the relationship between the
particular albumin fractions and enzyme activity of the tested wheat flours and dough
rheological properties. The determined content of albumin fractions ranged from 2.64 to
17.50% of total proteins. More than 50% of the albumins total amount was in the range
of 5-15 kDa of molecular weight. The obtained results indicated that albumin fraction 15-
30 kDa was related to certain rheological properties of dough, especially those related to
water absorption and uniaxial and biaxial resistance to extension. Regarding the
enzymatic status of flour, no strong relationship was found among the 5-15, 30-50 and 30-
60 kDa albumin fractions and proteolytic and αααα-amylolytic activity. However, the
albumin fraction 15-30 kDa showed significant correlation with proteolytic activity.
Keywords: α- amylolitic activity, Lab-on-chip electrophoresis, Proteins, Proteolytic activity.
_____________________________________________________________________________ 1 Institute of Food Technology, University of Novi Sad, Bulevar cara Lazara 1, 21000 Novi Sad, Serbia. ∗ Corresponding author: [email protected] 2 University of Novi Sad, Faculty of Technology, Bulevar cara Lazara 1, 21000 Novi Sad, Serbia. 3 Department of Applied Chemistry and Ecology, Faculty of Food Technology, J. J. Strossmayer University of Osijek, Franje Kuhača 18, 31000 Osijek, Croatia.
INTRODUCTION
Wheat flour quality is strongly influenced by protein content and composition, but their complexity prevents a clear differentiation in terms of the specific role they have in the overall quality. Wheat flour quality has been generally estimated on the basis of the characteristics and content of gluten proteins.
The content of albumins and globulins of wheat endosperm represents about 20% of the total wheat proteins (Merlino et al., 2009; Žilić et al., 2011). Singh et al. (2011) reported the slightly smaller proportion of albumins and globulins which ranged between 11.48 and 16.03%. Non-gluten proteins are mainly monomeric but both albumins and globulins tend to form polymers by forming inter-chain disulphide
bonds. The molecular weights of non-gluten proteins are mainly lower than 25 kDa, but subunits of molecular weight between 60 and 70 kDa could also be observed (Veraverbeke and Delcour, 2002).
The albumins are mostly monomeric physiologically active or structural proteins (Goesaert et al., 2005). Albumins include α-amylase, α-amylase/protease inhibitors (13 and 16 kDa) as well as enzymes with different physiological functions (62 kDa serine carboxypeptidase) (Singh et al., 2001). The inhibition activity of albumin fractions was confirmed by the study of Silano et al. (1975), who investigated the inhibition activity of the three albumin fractions (60, 24, and 12.5 kDa) toward amylases. Shewry et al. (1984) characterized certain albumins as trypsin/α-amylase inhibitor. Gao et al. (2009) analyzed the
Dow
nloa
ded
from
jast
.mod
ares
.ac.
ir at
11:
19 IR
ST
on
Thu
rsda
y D
ecem
ber
16th
202
1

__________________________________________________________________________ Tomić et al.
806
non-prolamin expression profiles during grain development of bread wheat and found that most of the proteins had masses of 14–97 kDa, which were mostly distributed in the pH 4–7 range. Out of 400 protein spots, 230 proteins were identified and more than 85% of the identified proteins were enzymes possessing different physiological functions. Similar findings were reported by Dong et
al. (2012) who found that among the identified 89 non-prolamin proteins more than 80% were various enzymes classified into eight functional categories including carbohydrate metabolism (27%), protein metabolism (27%), stress/defense/detoxification (11%), cell metabolism (6%), transcription/translation (4%), nitrogen metabolism (4%), photosynthesis (4%) and signal transduction (1%). Moreover, some high molecular weight albumins and certain globulins are considered to have a storage function (Gao et al., 2009; Dong et al., 2012).
There are indications in the literature for the contribution of certain albumins to wheat flour quality (Osipova et al., 2012). Weegels et al. (1995) reported that despite the fact that low Mr non-gluten proteins have inconsistent effects on loaf volume, they have profound effects on the biochemical and rheological properties of dough. On the other hand, Unbehend et al. (2003) and Prabhasankar (2002) revealed that content of albumin and globulin proteins did not show an influence on loaf volume of wheat bread or chapati-making quality.
While the influence of gluten proteins on technological quality of flour has been extensively studied, the limited number of studies have dealt with the influence of non-gluten proteins (albumins and globulins) on flour quality (Chiang et al., 2006; Gao et al., 2009; Osipova et al., 2012). Considering the general opinion that albumins and globulins of wheat endosperm have a secondary role in influencing the flour quality, they have been insufficiently studied (Gianibelli et al., 2001). The intensive changes of climate during the last few decades have been followed by breeding the genotypes more
resistant to the unfavorable conditions during cultivation. In this regard, it could be assumed that the role of albumins might have changed in terms of their influence on the technological quality of wheat.
In order to gain more knowledge on the wheat flour albumins and their influence on its properties, the aim of this work was: (1) to characterize albumin fractions of four different wheat varieties grown in four different locations in Serbia, and (2) to determine the existing relations between the particular albumins fractions and rheological properties of the tested wheat flours as well as to connect them with the enzyme activity.
MATERIALS AND METHODS
Samples
Four wheat varieties of Triticum aestivum, namely, Pobeda (Pob), Zvezdana (Zve), Gordana (Gord), and Apache (Ap) that were grown in 2011 in four locations i.e. Bačka Topola (BT), Sremska Mitrovica (SM), Sombor (SO), and Vršac (VR) in Northern Serbia were selected for the study. Pobeda, Zvezdana and Gordana were bred by the Institute of Field and Vegetable Crops, Novi Sad, Serbia, whereas Apache was bred by Limagrain, Chappes, France. The wheat samples were cleaned, tempered and milled using a Bühler MLU 202 (Bühler, Uzwil, Switzerland) according to AACC (1999).
The climatic conditions of 2011 growing season were to a certain extent different from the usual climate, with 1.3°C higher mean temperature and 17% lower mean precipitation.
Protein Extraction
The extraction of albumins was conducted following the sequential Osborne extraction procedure (Osborne, 1907) with modifications. The wheat flour (30 mg) was extracted with 300 µL of deionized water and vortexed for 10 seconds. After 24 hours
Dow
nloa
ded
from
jast
.mod
ares
.ac.
ir at
11:
19 IR
ST
on
Thu
rsda
y D
ecem
ber
16th
202
1

Albumins Impact on Wheat Dough Rheology _____________________________________
807
extraction at room temperature, the obtained extracts were clarified by centrifugation at 14,000 rpm for 20 minutes. The supernatant was collected as the albumin fraction and evaporated in a Reacti-Therm I (Thermo Fisher Scientific Bellefonte, PA, USA) to dryness at room temperature.
Lab-on-a-Chip Electrophoresis
Extracted samples were diluted with 2X treatment buffer (0,125M tris-Cl pH 6.8, 4% SDS, 20% glycerol, 10% 2-mercaptoethanol) and water (1 v/v treatment buffer and 1 v/v water) and heated at 100°C for 5 minutes. The chip-based separations were performed on the Agilent 2100 bioanalyzer (Agilent Technologies, Santa Clara, CA, USA) in combination with the Protein 80 Plus LabChip kit and the dedicated Protein 80 software assay on 2100 expert software. Bovine serum albumin was used as the standard for quantification of the non-gluten proteins. For each investigated wheat sample, analysis was conducted in two independent replications.
Rheological Properties of Wheat Dough
The rheological properties of wheat dough were determined using the Brabender Farinograph according to ICC 115/1, the Brabender Extensograph according to ICC 114/1, the Brabender Amylograph according to ICC 126/1, the Chopin Alveograph according to ICC 121 (ICC, 1992), and the Chopin Mixolab according to ICC 173 (ICC, 2011).
Gluten Index and Protein Content
Gluten index (GI) was measured in two different ways: according to the ICC standard method 155 (ICC, 1994) and after incubation of dough ball at 37°C for 90 minutes (Torbica et al., 2007). Protein content was determined by Infratec 1241
Grain Analyzer (Foss Analytical AB, Hillerød, Denmark).
Measurement of α-amylase Activity
Alpha-amylase activity (CU/g) of flour was determined using the alpha amylase assay procedure (Ceralpha method). At least three replicates were performed for each analysis.
Measurement of Proteolytic Activity
Proteolytic activity of wheat flour was determined following the procedure reported by Strelec et al. (2007) and Calucci et al. (2004) with some modifications. Flour (2.5 g) was extracted in 5 mL sodium acetate buffer (50 mM, pH 5.0). The proteolytic activity was measured by using 1% (w/v) hemoglobin (Hb) as substrate, dissolved in sodium acetate buffer (0.1M, pH 4.0). The reaction was initiated by adding flour extract (600 µL) in 2.7 mL of Hb and after incubation at 45°C for 1 hour terminated by adding 25% (w/v) trichloroacetic acid (TCA) and vortexing. The obtained suspension, after keeping at 4°C for 15 minutes, was cleared by centrifugation (10 minutes at 15,000×g) and 0.5 mL of the supernatant was utilized to determine the TCA-soluble products by the Lowry method (Lowry et al., 1951) using bovine serum albumin as standard protein. At least three replicates were performed for each analysis.
Statistical Analysis
For an overview of the effect of two factors (variety and location) in the complex of dataset on albumin content (g 100 g-1 flour), a two-way ANOVA was calculated. The comparison among means was done by the Fisher’s least significant differences regarded significant at p<0.05. The Principal Component Analysis (PCA) was performed to determine the relationship between the tested properties of wheat flour samples. For that purpose, relative amount of albumins, categorized into four
Dow
nloa
ded
from
jast
.mod
ares
.ac.
ir at
11:
19 IR
ST
on
Thu
rsda
y D
ecem
ber
16th
202
1

__________________________________________________________________________ Tomić et al.
808
(a)
(b) Figure 1. LoaC gel images of albumins from four different wheat varieties (a and b).
intervals according to their molecular weights (5–15; 15–30; 30–50, 50–65 kDa), was used. Relative albumin content in each group was determined by the ratio of the peaks area in each group over the peaks area in the overall four groups. In order to illustrate the variability of a chosen sample set, descriptive statistic was performed. Statistical methods were performed using the Software XLSTAT, version (2012.2.02).
RESULTS AND DISCUSSION
Albumin Characterization by Lab-on-a-
Chip Electrophoresis
Lab-on-a-Chip gel images of albumins obtained for wheat varieties selected for the study originated from different locations are presented in Figure 1 (a and b).
The gel images of albumin patterns showed diversity in separated fractions, both in qualitative and quantitative sense. Albumins of all tested wheat flour samples were characterized by rich protein pattern –the number of bands varied from 17 (SO-Pob) to 31 (SM-Gord)- corresponding to molecular weights from 5 to 65 kDa. Similar findings were reported by Chiang et al. (2006) and Baláz et al. (2012). By observing the albumin patterns of individual varieties, it could be noticed that albumin patterns of variety Gordana showed high similarity regardless of growing locations. However, in the case of the other varieties, the variations were more apparent in the region of higher molecular weights. This was particularly related to protein patterns of Pobeda, Zvezdana, and Apache from location BT. Thus, the differences between the protein profiles of the tested wheat flour were not
Dow
nloa
ded
from
jast
.mod
ares
.ac.
ir at
11:
19 IR
ST
on
Thu
rsda
y D
ecem
ber
16th
202
1
Albumins Impact on Wheat Dough Rheology _____________________________________
809
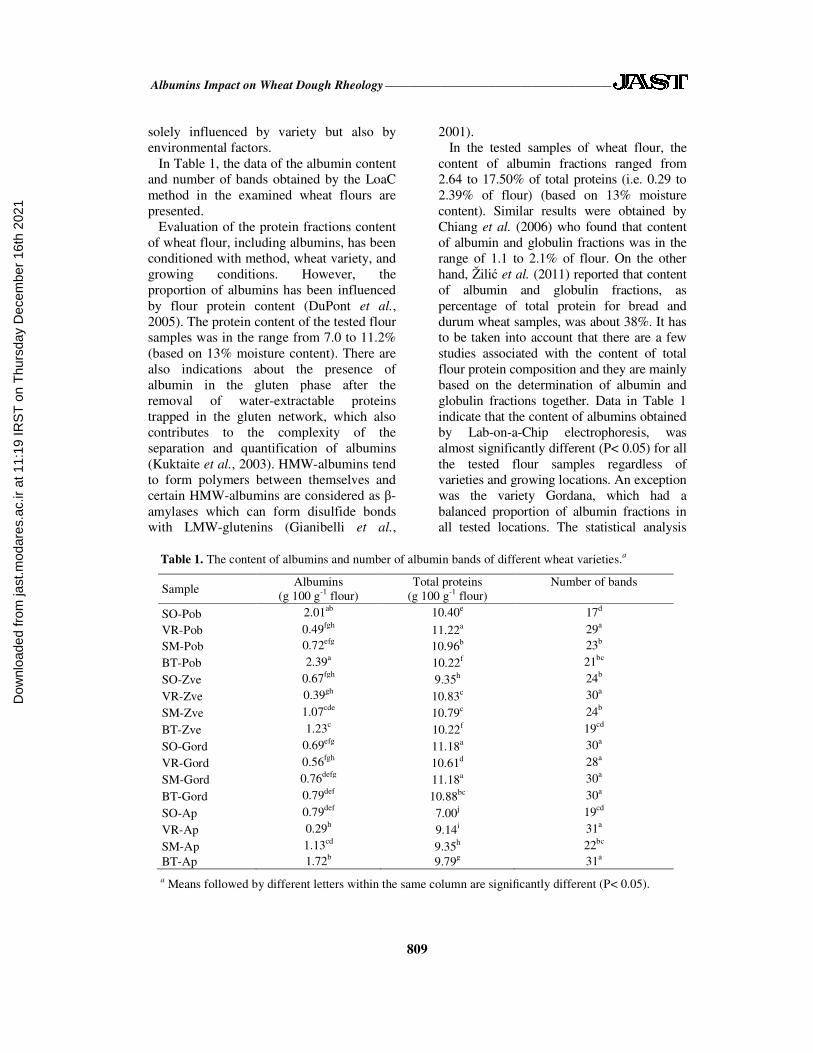
Table 1. The content of albumins and number of albumin bands of different wheat varieties.a
Sample Albumins
(g 100 g-1 flour) Total proteins
(g 100 g-1 flour) Number of bands
SO-Pob 2.01ab 10.40e 17d
VR-Pob 0.49fgh 11.22a 29a SM-Pob 0.72efg 10.96b 23b
BT-Pob 2.39a 10.22f 21bc
SO-Zve 0.67fgh 9.35h 24b
VR-Zve 0.39gh 10.83c 30a
SM-Zve 1.07cde 10.79c 24b
BT-Zve 1.23c 10.22f 19cd
SO-Gord 0.69efg 11.18a 30a
VR-Gord 0.56fgh 10.61d 28a
SM-Gord 0.76defg 11.18a 30a
BT-Gord 0.79def 10.88bc 30a
SO-Ap 0.79def 7.00j 19cd
VR-Ap 0.29h 9.14i 31a
SM-Ap 1.13cd 9.35h 22bc BT-Ap 1.72b 9.79g 31a a Means followed by different letters within the same column are significantly different (P< 0.05).
solely influenced by variety but also by environmental factors.
In Table 1, the data of the albumin content and number of bands obtained by the LoaC method in the examined wheat flours are presented.
Evaluation of the protein fractions content of wheat flour, including albumins, has been conditioned with method, wheat variety, and growing conditions. However, the proportion of albumins has been influenced by flour protein content (DuPont et al., 2005). The protein content of the tested flour samples was in the range from 7.0 to 11.2% (based on 13% moisture content). There are also indications about the presence of albumin in the gluten phase after the removal of water-extractable proteins trapped in the gluten network, which also contributes to the complexity of the separation and quantification of albumins (Kuktaite et al., 2003). HMW-albumins tend to form polymers between themselves and certain HMW-albumins are considered as β-amylases which can form disulfide bonds with LMW-glutenins (Gianibelli et al.,
2001). In the tested samples of wheat flour, the
content of albumin fractions ranged from 2.64 to 17.50% of total proteins (i.e. 0.29 to 2.39% of flour) (based on 13% moisture content). Similar results were obtained by Chiang et al. (2006) who found that content of albumin and globulin fractions was in the range of 1.1 to 2.1% of flour. On the other hand, Žilić et al. (2011) reported that content of albumin and globulin fractions, as percentage of total protein for bread and durum wheat samples, was about 38%. It has to be taken into account that there are a few studies associated with the content of total flour protein composition and they are mainly based on the determination of albumin and globulin fractions together. Data in Table 1 indicate that the content of albumins obtained by Lab-on-a-Chip electrophoresis, was almost significantly different (P< 0.05) for all the tested flour samples regardless of varieties and growing locations. An exception was the variety Gordana, which had a balanced proportion of albumin fractions in all tested locations. The statistical analysis
Dow
nloa
ded
from
jast
.mod
ares
.ac.
ir at
11:
19 IR
ST
on
Thu
rsda
y D
ecem
ber
16th
202
1

__________________________________________________________________________ Tomić et al.
810
Figure 2. Pie chart of the four MW intervals of albumins. The numbers and percentages of each protein
group are indicated.
confirmed the visual perception of gel images (Figures 1-a and -b).
In order to find the correlation between albumins and rheological properties as well as enzymatic activity, the total albumins were categorized into four intervals according to their molecular weights: 5–15; 15–30; 30–50, 50–65 kDa. The intervals were selected on the basis of the frequency of specific molecular weights and their quantities in most samples. Relative protein content in each group was determined by the ratio of the peaks area in each group over the peaks area in the overall four groups.
Figure 2 shows the results of average proportion of certain albumin fractions in the tested flour samples. Fraction in the range of 5-15 kDa, represented more than half of the total amount of albumins (57.13%). Some authors have indicated the existence of α-amylase inhibitors within this range (Singh and Skerritt, 2001; DuPont et al., 2005). The lowest content of albumin subunits was in the range of molecular weight from 50 to 65 kDa.
Analysis of Dough Rheological
Properties of Different Wheat Flours
In order to illustrate the variability of chosen sample set, descriptive statistic was performed and results are given in Table 2.
The parameters of empirical rheological methods are commonly used to determine
the optimal flour quality for a particular purpose.
According to the obtained results (Table 2), it could be noticed that values of tested parameters showed wide variability. Water absorption (WA) value presents the amount of water needed by flour to provide dough of optimal viscoelastic characteristics suitable for dough consistency and processing (Peymanpour et al., 2012). WA values were in the range of 53.63–62.73%, showing wide variability in terms of protein water absorption ability. The lowest value of WA belonged to the variety Apache, while the other two varieties had almost the same level of this parameter.
Dough development time (DDT) is the time from the first addition of water to the time when dough reaches the point of maximum consistency (500 BU). During this time, the water hydrates the flour components and the dough is developed. DDT was in the range of 1.5-13.0 min which indicated that tested flour samples had different levels of gluten structure compactness.
Gordana and Pobeda showed the highest dough strength properties based on Farinograph results. Both Farinograph DDT (average values: 10.1 and 7.6 minutes, respectively) and stability (Stab) (average values: 16.5 and 12.1 minutes, respectively)
Dow
nloa
ded
from
jast
.mod
ares
.ac.
ir at
11:
19 IR
ST
on
Thu
rsda
y D
ecem
ber
16th
202
1

Albumins Impact on Wheat Dough Rheology _____________________________________
811
for these varieties were extremely high, which implied that for the development of gluten complex, these flours required more energy and time. However, these flours could be kneaded for a long time without deterioration of the initial consistency. Moreover, these varieties expressed the lowest values of softening degree indicating stable cohesiveness of dough during kneading.
Based on the measured values of uni- and biaxial extension properties of wheat dough, the samples were grouped in a different way. Regarding Extensograph data, some variations were observed in both extensibility (Ex) and resistance (R). The higher variations in both parameters were observed between different locations.
Regarding the biaxial elasticity, Apache variety expressed the highest values of resistance to extension (P) and extensibility (L), while varieties Gordana and Pobeda had the maximum values of Alveograph deformation energy (W). Varieties Gordana and Pobeda had the same level of Amylograph peak viscosity (PV) which classified them as wheat suitable for processing in baking industry (Đaković, 1997). Characterization of the rheological behaviour of dough showed wide variability among tested samples for all Mixolab quality parameters. Variability among samples was also indicated by standard deviation values. Water absorption (WAMix) values were in the range of 49.60–60.00%. Dough development time
(DevMix) and dough stability (StabMix), which indicate strength of protein (Karaoğlu, 2011) were in the range of 0.92–8.62 and 4.72-11.58 minutes, respectively. Apache differed from the other varieties with low values of WAMix and DevMix, being in agreement with Farinograph results. Moreover, Apache expressed higher value of β slope which refers to gelatinization rate.
Measured gluten index (GI) values were in the range of 81.00–98.65%, showing different gluten strength from strong to very strong gluten (AbuHammad et al., 2012). The gluten index values obtained after
previous incubation of piece of dough at 37°C [GI (37°C)] were lower and within the range of 22.84–91.24%, which could be the consequence of activity of potentially present proteolytic enzymes that caused partial degradation of gluten (Rosell et al., 2002).
The values of proteolytic and amylolytic activity showed wide variability, indicating that these values were highly influenced by the variety, growing location, and their interaction. Over 80% of the tested samples had a peak viscosity values greater than 400 BU, which means that they had optimal or less than optimal values of amylolytic activity, while the proteolytic activity could be indirectly estimated on the basis of gluten index values at 37º C. Obtained values of proteolytic activity showed that variety had strong influence. In particular, the variety Ap was clearly separated by higher values of proteolytic activity. Regarding the growing localities, values of proteolytic activity showed statistically significant differences (data not shown).
Relationship between Flour Protein
Composition and Wheat Flour Quality
Indicators
In order to observe the relationship between the particular albumin fractions, rheological properties and enzymatic status of tested flours, the PCA was performed (Figures 3-a and -b). The first phase of the statistical analysis was to find correlation among albumin fractions and enzymatic status of flour. Obtained results showed that only albumin fractions of 15-30 kDa were correlated with the proteolytic activity (PA) (P< 0.05) and α-amylolytic activity (AMYL) (P> 0.05), although not statistically significant (data not shown).
Therefore, in further statistical analysis, only the content of 15-30 kDa albumin fraction was considered for the establishment of relations with dough rheological properties in order to define their
Dow
nloa
ded
from
jast
.mod
ares
.ac.
ir at
11:
19 IR
ST
on
Thu
rsda
y D
ecem
ber
16th
202
1

__________________________________________________________________________ Tomić et al.
812
(b) (a)
Figure 3. PCA loading plot (a) and PCA score plot (b) for all tested wheat samples.
relationship with the enzyme activity of flour (Figures 3-a and -b).
Besides the commonly used rheological methods for flour quality assessment, for further statistical analysis, Mixolab parameters were used. Mixolab represents appropriate device to establish the correct level of α-amylase activity in wheat flour because it offers information about the dough and not about flour suspended in water as it is the case with Amylograph or Falling Number device. Various studies have shown that the Falling Number index (which indicated alpha amylase activity in wheat flour) is predicted very well by the torque for cooking stability (C4) and the difference between points C5 and C4 (C54) (Codinǎ et al., 2010; Codinǎ et al., 2012). Also, the Mixolab device offers information about protein weakening (C2) and dough proteolytic activity.
The first two principal components explained 72.38% of the total variability between the samples from four locations (Figure 3-a). The first principal component (PC1) was associated with the content of albumins in the range 15-30 kDa, all Farinograph parameters (WA, DDT, Stab and SD), Mixolab water absorption (WAMix)
and dough development time (DevMix) and parameters related to starch gelatinization, cooking stability, starch gelling and gelatinization rate of flour (C3, C4, C5, β). Resistance and extensibility ratio by Extensograph (R/Ex), peak of viscosity determined by Amylograph (PV), dough resistance to extension (P) and the deformation energy (W) determined by Alveograph, modified gluten index [GI (37°C)] and proteolytic activity (PA) (Figure 2-a) were also described by the first principal component. The second principal component (PC2) was associated with Extensograph energy (E), Alveograph dough extensibility (L), swelling index (G) and Alveograph ratio (P/L), and α-amylolytic activity (AMYL).
Albumin fraction 15-30 kDa had moderate correlation coefficients with flour quality parameters, including water absorption (WA and WAmix, r= -0.52 and r=- 0.55, P< 0.05, respectively) and resistance to extension of dough which was measured uniaxial (R and R/Ex, r= -0.59 and r= -0.65, P< 0.05, respectively) and biaxial (P and P/L, r= -0.68 and r= -0.64, P< 0.05, respectively). The abovementioned dependencies were related to the protein component of flour.
Dow
nloa
ded
from
jast
.mod
ares
.ac.
ir at
11:
19 IR
ST
on
Thu
rsda
y D
ecem
ber
16th
202
1

Albumins Impact on Wheat Dough Rheology _____________________________________
813
This albumin fraction (15-30 kDa) showed lower correlation with the quality parameter of starch component of flour (C4) measured by Mixolab. This result indicated that albumin fraction of 15-30 kDa molecular weight possibly represented mainly the proteolytic enzyme complex, which was confirmed by statistically significant correlation coefficient (r= 0.75, P< 0.05), in contrast to statistically insignificant correlation coefficient with α-amylolytic activity (r= 0.42, P> 0.05). Total proteolytic activity values showed moderate correlation with the same rheological parameters as the fraction 15-30 kDa (WA and WAmix, r= -0.66 and r= -0.60, P< 0.05, respectively) and resistance to extension of dough which was measured uniaxial (R/Ex, r= -0.56, P< 0.05) and biaxial (P and P/L, r= -0.68 and r= -0.55, P< 0.05, respectively). Taking into account enzymatic nature of albumins (Bleukx et al., 1997), flour samples showed considerable decrease of water absorption ability (for which high molecular proteins were responsible) and decrease of extensibility and resistance measured at both axes (due to the cleavage of intra and intermolecular bonds of gluten proteins), which could be attributed to albumins’ influence. It could be the consequence of proteolysis which led to degradation of macromolecules.
In contrast to the proteolytic activity, the α-amylolytic activity values showed a statistically significant correlation only with rheological parameters L, G, P/L (r= 0.70; r= 0.71, and r= -0.61, P< 0.05, respectively) measured by Alveograph. Albumins (mainly β–amylase) include proteins that occur as polymers stabilized by interchain disulphide bonds (Veraverbeke and Delcour, 2002). It could be assumed that α-amylolytic enzymes act coupled with proteolytic enzymes in the bonds cleavage within the starch and gluten network, consequently, increasing the dough extensibility.
Statistical analysis of the obtained results showed that amount of 5-15 and 50-65 kDa albumin fractions were moderately correlated (r= -0.52 and r=0.55, P< 0.05,
respectively) with starch quality parameter of dough (C3-C4), which indicated the stability of the starch gel when heated (data not shown). The moderate correlation coefficient between albumin fraction of 5-15 kDa and C3-C4 might have indicated the amylase inhibitory activity which, according to many authors, related to this range of molecular weights (Singh et al., 2001; Gao et al., 2009). It was not possible to find stronger relationship between 5-15 kDa albumin fraction and α-amylolytic activity, reflecting the fact that climatic conditions for the studied growing season were unfavorable for high amylolytic activity.
In the corresponding score plot presented as Figure 3-b, the clear distinction between varieties is noticeable. Evidently, Serbian varieties were grouped together on the opposite side of the score plot in relation to the French variety Apache. The corresponding score plot (Figure 3-b) shows clustering of varieties, which might indicate that the variety had the dominant role in enzymatic status of wheat flour in the studied growing season.
CONCLUSIONS
The results obtained in this study showed that the contents of albumin fractions of the tested wheat flour samples were in a wide range depending on their variety characteristic as well as growing locations. Wide variability was also observed in the number of bands corresponding to molecular weights from 5 to 65 kDa. More than 50% of the total amount of albumins was in the range of 5-15 kDa of molecular weight.
The Principal Component Analysis showed that albumin fraction 15-30 kDa might have influence on rheological properties of dough, especially those related to water absorption and uniaxial and biaxial resistance to extension.
Regarding the enzymatic status of flour, no strong relation was underlined among the 5-15, 30-50 and 30-60 kDa albumin fractions and proteolytic and α-amylolytic
Dow
nloa
ded
from
jast
.mod
ares
.ac.
ir at
11:
19 IR
ST
on
Thu
rsda
y D
ecem
ber
16th
202
1

__________________________________________________________________________ Tomić et al.
814
activity. On the other hand, albumin fraction 15-30 kDa showed significant correlation with proteolytic activity and the highest correlation, although not statistically significant, with α-amylolytic activity.
Despite the indications of connection among the 5-15 and 30-60 kDa albumin fractions and the amylase inhibitors and α-amylolytic enzymes, the results of this study did not prove a causal relationship. Therefore, further investigations should be conducted covering wider range of wheat varieties in different growing seasons.
ACKNOWLEDGEMENTS
This paper is a result of the research within the project TR 31007 financed by the Ministry of Education, Science and Technological Development, Republic of Serbia.
REFERENCES
1. AbuHammad, W. A., Elias, E. M., Manthey, F. A., Alamri, M. S. and Mergoum, M. A. 2012. Comparison of Methods for Assessing Dough and Gluten Strength of Durum Wheat and Their Relationship to Pasta Cooking Quality. Int. J. Food Sci. Tech., 47: 2561–2573.
2. AACC. 1999. Standard No. 26-10.02: Experimental Milling: Introduction, Equipment, Sample Preparation, and Tempering and Standard No. 26-31.01: Experimental Milling—Bühler Method for Soft Wheat Straight-grade Flour: Approved Methods of the AACC. American Association of Cereal Chemists.
3. Balázs, G., Tömosközi, S., Harasztos, A., Németh, V., Tamás, Á., Morgounov, A., Belan, I., Ma, W. and Békés, F. 2012. Advantages and Limitation of Lab-on-a-chip Technique in the Analysis of Wheat Proteins. Cereal Res. Commun., 40: 562-572.
4. Bleukx, W., Roels, S. P. and Delcour, J. A. 1997. On the Presence and Activities of Proteolytic Enzymes in Vital Wheat Gluten. J. Cereal Sci., 26: 183-193.
5. Calucci, L., Capocchi, A., Galleschi, L., Ghiringhelli, S., Pinzino, C., Saviozzi, F. and Zandomeneghi, M. 2004. Antioxidants, Free Radicals, Storage Proteins, and Proteolytic Activities in Wheat (Triticum
aestivum) Seeds during Accelerated Aging. J. Agr. Food Chem., 52: 4274-4281.
6. Chiang, S. H., Chen, C. S. and Chang, C. Y. 2006. Effect of Wheat Flour Protein Compositions on the Quality of Deep-fried Gluten Balls. Food Chem., 97: 666–673.
7. Codină, G.G., Mironeasa, S., Bordei, D. and Leahu, A. 2010. Mixolab versus Alveograph and Falling Number. Czech J. Food Sci., 28: 185–191.
8. Codină, G. G., Mironeasa, S. and Mironeasa, C. 2012. Variability and Relationship among Mixolab and Falling Number Evaluation Based on Influence of Fungal α-amylase Addition. J. Sci. Food Agric., 92: 2162–2170.
9. Đaković, Lj. 1997. Faktori Kvaliteta Pšeničnog Brašna. In: “Pšenično Brašno”. 4th Edition, Zavod za Tehnologiju žita i Brašna, Tehnološki Fakultet, Novi Sad, Serbia.
10. Dong, K., Ge, P., Ma, C., Wang, K., Yan, X., Gao, L., Li, X., Liu, J., Ma, W. and Yan, Y. 2012. Albumin and Globulin Dynamics during Grain Development of Elite Chinese Wheat Cultivar Xiaoyan 6. J. Cereal Sci., 56: 615–622.
11. DuPont, F. M., Chan, R., Lopez, R. and Vensel, W. H. 2005. Sequential Extraction and Quantitative Recovery of Gliadins, Glutenins, and Other Proteins from Small Samples of Wheat Flour. J. Agr. Food
Chem., 53: 1575-1584. 12. Flander, L., Rouau, X., Morel, M. H., Autio,
K., Seppänen-Laakso, T., Kruus, K. and Buchert, J. 2008. Effects of Laccase and Xylanase on the Chemical and Rheological Properties of Oat and Wheat Doughs. J. Agr.
Food Chem., 56: 5732–5742. 13. Gao, L., Wang, A., Li, X., Dong, K., Wang,
K., Appels, R., Ma, W. and Yan, Y. 2009. Wheat Quality Related Differential Expressions of Albumins and Globulins Revealed by Two-dimensional Difference Gel Electrophoresis (2-D DIGE). J.
Proteomics, 73: 279-296. 14. Gianibelli, M. C., Larroque, O. R.,
MacRitchie, F. and Wrigley, C. W. 2001. Biochemical, Genetic, and Molecular
Characterization of Wheat Endosperm
Dow
nloa
ded
from
jast
.mod
ares
.ac.
ir at
11:
19 IR
ST
on
Thu
rsda
y D
ecem
ber
16th
202
1

Albumins Impact on Wheat Dough Rheology _____________________________________
815
Proteins. Publication No. C-2001-0926-01O, Inc., AACC.
15. Goesaert, H., Brijs, K., Veraverbeke, W. S., Courtin, C. M., Gebruers, K. and Delcour, J. A. 2005. Wheat Flour Constituents: How They Impact Bread Quality, and How to Impact Their Functionality. Trends Food
Sci. Tech., 16: 12–30. 16. Gralik, J. and Warchalewski, J. R. 2006. The
Influence of γ-irradiation on Some Biological Activities and Electrophoresis Patterns of Wheat Grain Albumin Fraction. Food Chem., 99: 289–298.
17. ICC, International Association for Cereal Science and Technology. Standard Methods 114/1, 115/1, 121, 126/1 (1992), 155 (1994), 173 (2011).
18. Karaoğlu, M. M. 2011. Dough Characteristics of Wheat Flour Milled from Wheat Grains Stored in Spike Form. Int. J.
Food Sci. Tech., 46: 1905–1911. 19. Kuktaite, R., Larsson, H. and Johansson, E.
2003. Protein Composition in Different Phases Obtained by the Centrifugation of Dough. Acta Agronomica Hung., 51: 163-172.
20. Lowry, O. H., Rosenbrough, N. J., Fair, A. L. and Randall, R. J. 1951. Protein Measurement with the Folin-phenol Reagents. J. Biol. Chem., 193: 265–275.
21. Merlino, M., Leroy, P., Chambon, C. and Branlard, G. 2009. Mapping and Proteomic Analysis of Albumin and Globulin in Hexaploid Wheat Kernels (Triticum
aestivum L.). Theor. Appl. Genet., 118:
1321–1337. 22. Osborne, T. B. 1907. The Proteins of the
Wheat Kernel. Carnegie Inst., Washington, DC.
23. Osipova, S. V., Permyakova, M. D. and Permyakov, A. V. 2012. Role of Non-prolamin Proteins and Low Molecular Weight Redox Agents in Protein Folding and Polymerization in Wheat Grains and Influence on Baking Quality Parameters. J.
Agr. Food Chem., 60: 12065−12073. 24. Peymanpour, G., Rezaei, K., Sorkhilalehloo,
B., Pirayeshfar, B. and Najafian ,G. 2012 Changes in Rheology and Sensory Properties of Wheat Bread with the Addition of oat Flour. J Agric Sci Technol 14:339–348.
25. Prabhasankar, P. 2002. Electrophoretic and Immunochemical Characteristics of Wheat Protein Fractions and Their Relationship to
Chapati-making Quality. Food Chem., 78: 81–87.
26. Primo-Martin, C., Valera, R. and Martinez-Anaya, M. A. 2003. Effect of Pentosanase and Oxidases on the Characteristics of Doughs and the Glutenin Macropolymer (GMP). J. Agr. Food Chem., 51: 4673–4679.
27. Rosell, C. M., Aja, S., Bean, S. and Lookhart, G. 2002. Effect of Aelia and Eurygaster Damage on Wheat Proteins. Cereal Chem., 79: 801–805.
28. Shewry, P. R., Lafiandra, D., Salcedo, G., Aragoncillo, C., Garcia-Olmedo, F., Lew, E. J. L., Dietler, M. D. and Kasarda, D. D. 1984. N-terminal Amino Acid Sequences of Chloroform/Methanol-soluble Proteins and Albumins from Endosperms of Wheat, Barley and Related Species. FEBS, 175:
359-363. 29. Silano, V., Furia, M., Gianpreda, L., Macri,
A., Palescandolo, R., B., A., Scardi, V., Stella, E. and Valfre, F. 1975, Inhibition of Amylases from Different Origins by Albumins from the Wheat Kernel. Biochim.
Biophys. Acta, 391: 170-178. 30. Singh, J. and Skerritt, J. 2001. Chromosomal
Control of Albumins and Globulins in Wheat Grain Assessed Using Different Fractionation Procedures. J. Cereal Sci., 33: 163–181.
31. Singh, J., Blundell, M., Tanner, G. and Skerritt, J. 2001. Albumin and Globulin Proteins of Wheat Flour: Immunological and N-terminal Sequence Characterization. J.
Cereal Sci., 34: 85–103. 32. Singh, S., Singh, N. and MacRitchie, F.
2011. Relationship of Polymeric Proteins with Pasting, Gel Dynamic- and Dough Empirical-rheology in Different Indian Wheat Varieties. Food Hydrocolloids, 25:
19-24. 33. Strelec, I., Ugarčić-Hardi, Ž., Balkić, J. and
Šimunić, N. 2007. Enzymatic Activity in Wheat Seeds of Different Protein Content. Agric. Conspec. Sci., 72: 239-243.
34. Torbica, A., Antov, M., Mastilović, J. and Knežević, D. 2007. The Influence of Changes in Gluten Complex Structure on Technological Quality of Wheat (Triticum
aestivum L.). Food Res. Int., 40: 1038–1045. 35. Unbehend, Lj., Unbehend, G. and
Lindhauer, M. G. 2003. Protein Composition of Some Croatian and German Wheat
Dow
nloa
ded
from
jast
.mod
ares
.ac.
ir at
11:
19 IR
ST
on
Thu
rsda
y D
ecem
ber
16th
202
1

__________________________________________________________________________ Tomić et al.
816
Varieties and Their Influence on the Loaf Volume. Food/ Nahrung, 47: 145-148.
36. Veraverbeke, W. and Delcour, J. 2002. Wheat Protein Composition and Properties of Wheat Glutenin in Relation to Breadmaking Functionality. Crit. Rev. Food
Sci., 42: 179-208. 37. Weegels, P. L., Orsel, R., van de Pijpekamp,
A. M., Lichtendonk, W. J., Hamer, R. J. and Schofield, J. D. 1995. Functional Properties
of Low Mr Wheat Proteins. II. Effects on Dough Properties. J. Cereal Sci., 21: 117-126.
38. Žilić, S., Barać, M., Pešić, M., Dodig, D. and Ignjatović-Micić, D. 2011. Characterization of Proteins from Grain of Different Bread and Durum Wheat Genotypes. Int. J. Mol. Sci., 12: 5878-5894.
هاي خمير ي و فعاليت آنزيم شناس رهيخم خواص ويژگي هاي آلبومين در رابطه با
آرد گندم
ژ. وازتاك، م. پوجيك، س. راكيتا، ا. استرلك، وپوويكپا. توربيكا، ل. ج. تاميك،
چكيده
) در چهار رقم albumin fractionsهدف اين پژوهش شناخت ويژگي هاي اجزاي آلبومين (
يت آنزيمي گندم در يك محيط آب وهوايي محلي و نيز يافتن رابطه بين جزء خاصي از آلبومين با فعال
آرد خمير هاي آزمون شده وخواص خميره شناسي آنها بود. محتواي اندازه گيري شده اجزاي آلبومين
% كل آلبومين ها در محدوده 50% كل پروتئين ها بود. وزن ملكولي بيش از 5/17% تا 64/2در محدوده
kDa 15 -5 بود. نتايج به دست آمده گواه آن بود كه جزءkDa 30 -15 آلبومين با برخي از خواص
معين خميره شناسي خميرها، به ويژه آنهايي كه مربوط به جذب آب و مقاومت به گسترش تك محوري
و دو محوري مي شد، ارتباط داشت. در ارتباط با وضعيت آنزيمي آردها، هيچ رابطه قوي بين اجزاي
kDa 15 -5، 30-50 kDa 60-30و kDa ي پروتئوليتيك (آلبومين و فعاليت هاproteolyticو (
α-amylolytic مد. با اين وجود، جزءĤآنزيم ها به دست ني kDa 30 -15 آلبومين همبستگي معني
داري با فعاليت هاي پروتئوليتيك نشان داد.
Dow
nloa
ded
from
jast
.mod
ares
.ac.
ir at
11:
19 IR
ST
on
Thu
rsda
y D
ecem
ber
16th
202
1