alcator c-mod quarterly review · mini-proposals, run plans and summaries, shot logs ... –...
TRANSCRIPT

Alcator C-Mod Quarterly Review
VideoconferenceJuly 20, 2004

DoE Quarterly 7/20/2004
Agenda
• Facility, operations, PEA’s• ICRF• Lower Hybrid• DNB and Associated
Diagnostics

DoE Quarterly 7/20/2004
FY2004 Program Execution Agreement (PEA) Tasks1. Operate the facility for 19 weeks (+/- 10%) of single shift research (4
days/week, 8 hours/day). September 2004 — JOULE Milestone: 18 weeks
2. Compare confinement and H-Mode thresholds in single-null, double-null and inner-wall limited discharges. September 2004— JOULE Milestone: on schedule
3. Complete detailed design of advanced ICRF antenna. September 2004— JOULE Milestone: on schedule (Wukitch)
4. Install first lower hybrid microwave launcher. September 2004 (Parker)5. Operate to 2 MA plasma current. July 2004 6. Investigate the dependence of scrape-off layer flows on magnetic
topology, and their influence on core rotation. May 2004 7. Test all-digital real-time control system. August 2004 (on schedule)8. Initial tests of ITER-prototype tungsten brush tiles. September 2004 9. Complete migration to linux computing environment for data acquisition
and analysis. September 2004

DoE Quarterly 7/20/2004
Operations (PEA #1)
• We have produced 1793 plasma discharges in FY2004 with a startup reliability of 81% (including clean-up periods)– Startup reliability once physics operation began is
more typically 85%– We maintained approx 30 shots/day (~20 at 8 Tesla)
• We have run 18.9 weeks in fy2004, satisfying our Joule milestone requirement of 18 weeks– Run completed May 7, 2004
• Summary table, including links to detailed information, for each run day located at– http://www.psfc.mit.edu/cmod/operations/FY04_research_table.html

DoE Quarterly 7/20/2004
Sample from On-Line Run Summary TableAlcator C-Mod FY2004 Research Operations
(Click on Links for Detailed Information)Date Mini-Proposal(s) Scheduled
DaysResearchRun Days*
CumulativeDays
% Complete 18 wk Target
Comment Pulses** DataPulses#
4-Nov-03 364 349 1 1 1 1.4% See Also 30 14
5-Nov-03 355 1 0 1 1.4% Alternator 0 0
6-Nov-03 364 349 1 1 2 2.8% See Also 29 26
7-Nov-03 364 1 1 3 4.2% 28 8
12-Nov-03 355 1 1 4 5.6% 22 11
13-Nov-03 332 1 1 5 6.9% 24 11
14-Nov-03 335 1 1 6 8.3% 27 15
18-Nov-04 335 1 1/2 6 1/2 9.0% Computer problems 15 10
20-Nov-03 350 1 1 7 1/2 10.4% 28 22
21-Nov-03 368 334A 1 1 8 1/2 11.8% 31 27
24-Nov-03 363 335 1 1 9 1/2 13.2% See Also 32 19
25-Nov-03 363 1 1 10 1/2 14.6% 32 26
26-Nov-03 362 1 1 11 1/2 16.0% 28 15
2-Dec-03 374 1 1 12 1/2 17.4% 28 22
3-Dec-03 367A 1 1 13 1/2 18.8% 28 17
4-Dec-03 319 332 1 1 14 1/2 20.1% See Also 37 22
5-Dec-03 355 1 1 15 1/2 21.5% 20 13
9-Dec-03 376 1 1 16 1/2 22.9% 33 28
10-Dec-03 376 1 1 17 1/2 24.3% 33 30
11-Dec-03 377 1 1 18 1/2 25.7% 28 22
12-Dec-03 374 1 1 19 1/2 27.1% 34 33
16-Dec-03 355 377 1 1 20 1/2 28.5% 21 17
17-Dec-03 377 1 1 21 1/2 29.9% 32 31
18-Dec-03 304 1 1 22 1/2 31.3% 30 29
19-Dec-03 361 1 1 23 1/2 32.6% 31 20
6-Jan-04 363 1 1 24 1/2 34.0% 33 22
7-Jan-04 376 1 1 25 1/2 35.4% See Also 28 25
8-Jan-04 376 1 1 26 1/2 36.8% 25 23
9-Jan-04 375 1 0 26 1/2 36.8% FMIT-4 fault 0 0
15-Jan-04 322 319 1 1 27 1/2 38.2% See Also 29 25
21-Jan-04 322 1 1 28 1/2 39.6% 26 26

DoE Quarterly 7/20/2004
Compare Confinement/H-Mode Threshold for Different Magnetic Configurations (PEA#2)
Five topologies compared

DoE Quarterly 7/20/2004
Low threshold found with lower nose limited configuration
• Results for most topologies were as-expected:– Lowest threshold for lower
single null (drift down)– Intermediate for double
null– Higher for upper single null– Highest for inner wall
limited• Lower nose limited threshold
same as lower single null

DoE Quarterly 7/20/2004
2 MA Operation (PEA#5)
• Prior to installation of asymmetric control coils, locked modes prevented operation above 1.6 MA
• Nulling out principal component of error field enabled operation to 2 MA

DoE Quarterly 7/20/2004
SOL flow is Topology Dependent
Balooning transport (⊥) drives particles out at mid-plane
Density gradient drives parallel SOL flow: direction depends on x-point location

DoE Quarterly 7/20/2004
SOL Flows, topology and core rotation (PEA#6)
• Core (and SOL) flows are very sensitive to topology
• Core flow driven by pressure (gradient) but SOL provides boundary condition– H-Mode transition occurs
when flow (shear) exceeds threshold
• LSN has least counter-flow (in L-Mode)– leading to lower H-Mode
threshold• Flow (and threshold) very
sensitive to Upper/Lower balance (mm’s matter)
(distance between separatrices)

DoE Quarterly 7/20/2004
Digital Plasma Control System (PEA#7)
• An all digital replacement for the existing analog/digital hybrid control system has been designed
• The real-time input and computation steps were tested during the spring campaign, and were shown to operate reliably at more than 20 kHz (twice the design specification)
• We are waiting for parts from the vendor to implement the final system with 128 inputs and 32 outputs (approx 2 wks)
• We plan to operate this system during the next campaign• Successful testing of this system will complete PEA #7
(August 2004)

DoE Quarterly 7/20/2004
W-Brush Tiles (PEA #8)• ITER relevant tile design capable of handling
25 MW/m2
• Tile modules will be installed in C-Mod at up to five toroidal locations in the outer divertor
• All hardware in-house this month (July)
Prototype Rapid PrototypeModel
Outer divertor
MoW
LockingPins
Inconel
tungsten rod

DoE Quarterly 7/20/2004
Data System Status
• Migration of all data acquisition and between-shot analysis to linux based computing systems is now complete (FY2004 PEA #9)
• The quantity of data taken per shot continues to grow exponentially and now exceeds 1.1 GByte per shot.
• Approximately half of this data is taken with non-CAMAC based devices
• Work is underway to create a set of web based tools for integrating and interrogating information from mini-proposals, run plans and summaries, shot logs and run comments from the electronic logbook. – These tools are aimed at improving the efficiency
of post-run analysis.
DoE Quarterly 7/20/2004
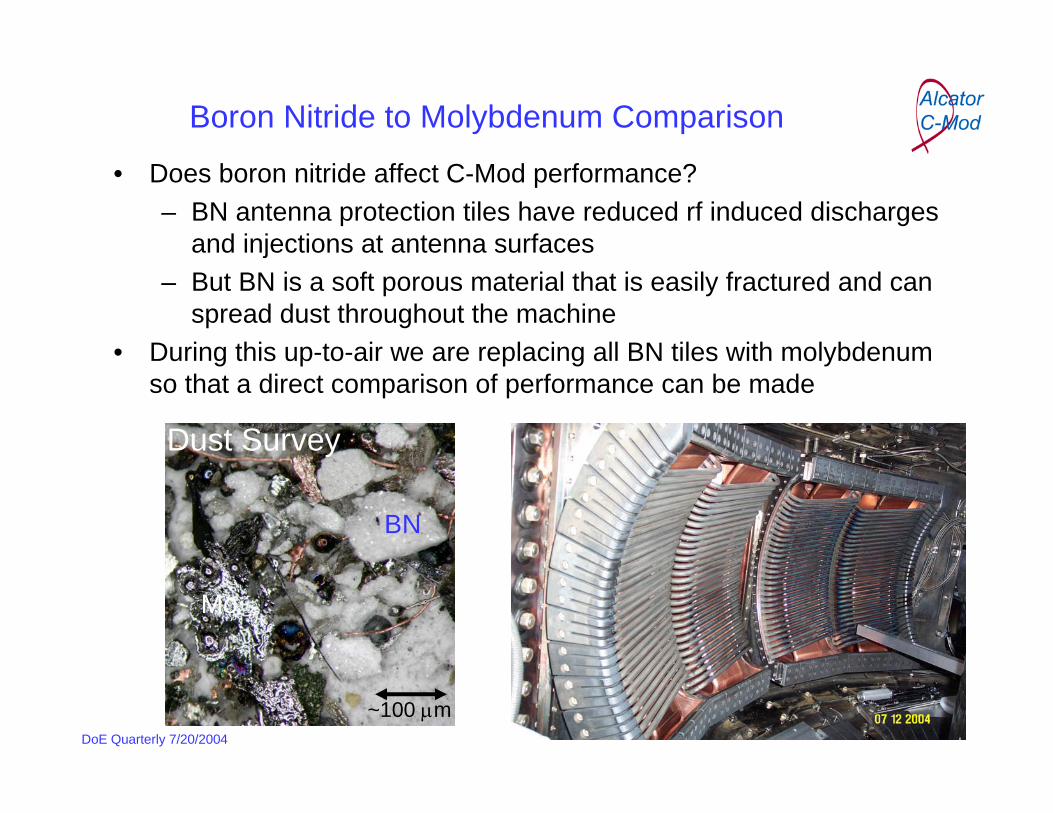
Boron Nitride to Molybdenum Comparison
• Does boron nitride affect C-Mod performance?– BN antenna protection tiles have reduced rf induced discharges
and injections at antenna surfaces– But BN is a soft porous material that is easily fractured and can
spread dust throughout the machine• During this up-to-air we are replacing all BN tiles with molybdenum
so that a direct comparison of performance can be made
BN
Mo
~100 µm
Dust Survey

DoE Quarterly 7/20/2004
Tasks During Current Maintenance PeriodEngineering Systems
• Development and installation of lower hybrid launcher (PEA#4)– Development of coupler window braze– High power testing of rwg/fwg and coupler windows– Amplitude and phase control– Coupler and klystron protection– Temperature and position control
• ICRF Systems– Improve tuning capability of FMIT#3 and FMIT#4
transmitters when operated at 50 MHz– Inspect, clean, refurbish all transmitters– Improvements to J-Port antenna voltage limits– Replace low power tube in FMIT#1 with new 2 MW tube
• Upgrade to TF gate drive boards

DoE Quarterly 7/20/2004
• MIT Alternator– Clean, inspect, refurbish all alternator systems– Add backup water cooling system for alternator to reduce
down-time if primary system fails• Inspect, clean, refurbish hi-yard breakers• Improvements to bus instrumentation• Upgrade of PC to PLC interface software for engineering
systems (power systems, cryo and vacuum)• Long pulse DNB
– Installation of breaker, contactor, and transformer• Installation of 8th non-axisymmetric control coil• Upgrades to engineering data acquisition hardware (CPCI)• Development of all digital plasma control system• Procurement and installation of brazing/sintering oven

DoE Quarterly 7/20/2004
Invessel/Vacuum• Replace BN protection tiles with molybdenum• Installation of massive gas puff disruption mitigation• Installation of cryopump baffles• Clean and refurbish first wall moly tiles • Clean and refurbish vacuum windows, shutters, etc• Refurbish inner wall probes• Installation of boron powder (~ 40 µm diameter)
injector• Characterization of dust (> 1 µm) collected from first
wall surfaces

DoE Quarterly 7/20/2004
Diagnostics• Relocation of diagnostics to accommodate lower hybrid
launcher– Mods to HIREX X-ray spectrometers– Relocate lithium pellet injector– Relocate Hα, CII, and periscope from C-Hor– Relocate gas feeds
• Installation of inner wall retro-reflectors for polarimetryexperiment
• Refurbishment of bolometer array• Addition of high resolution fire-wire based video
systems to monitor ICRF antennas and lower hybrid launcher grill
• MSE invessel calibration

DoE Quarterly 7/20/2004
• Upgrade and refurbish two color interferometer (TCI) including new CO2 laser
• Upgrade to PCI diagnostic including new CO2 laser• Upgrade to YAG Thomson scattering system
including new integrators • Installation of compact neutral particle analyzer
(CNPA)• Installation of hard X-Ray camera (superthermal
electrons)

DoE Quarterly 7/20/2004
Operations and Engineering Plans• Up-to-Air
– LH launcher installation– Installation of W-brush prototype tiles– Installation of upper divertor baffles– Diagnostic set upgrades and invessel
refurbishments– Massive gas puff at ITER-level high absolute
pressures (in collaboration with D. Whyte, U. Wisc.)
• Power room air conditioning (MIT financed at $250,000)
• Pumpdown late October 2004• First plasma operation with lower hybrid• Install long pulse DNB November 2004• Installation of upper divertor cryopump (CY2005)

Recent Results from ICRF Experiments and Status of ICRF Antenna Design
DoE Quarterly ReviewJuly 20, 2004
MIT, Cambridge MAPresented S.J. Wukitch
Plasma Science and Fusion Center, MIT, Cambridge, MA, USA
Outline:1. Results from antenna loading studies.2. Mode conversion physics 3. Antenna performance evaluation and plans 4. Status of antenna design

Loading Variations are Larger Than Predicted from Changes in Evanescent Length
Fast wave antenna loading can be expressed as
Where Le is the evanescent region thickness.
In C-Mod, Le varies by ~3 mm in transition from L to H mode.
• This corresponds to ~20% change in loading.
The loading variation from L to H mode can be from 8-10 Ω to 3-5 Ω.
Thus the observed variations cannot be explained by the change of Le alone.
)2exp( || eL LkR −∝
R (cm)
Le
Le
n e(m
–3)
n e(m
–3)

Antenna Loading is Dominated by Density Pedestal
Loading resistance• Decreases with larger
density pedestal;• Increases with SOL
density in EDA H-mode; and
• Is insensitive to the gap.
Using a 1-D physical model (load resistance is calculated from wave surface impedance at the Faraday screen), we find the loading variation is dominated by the density pedestal height.
• Small pedestal leads to higher loading.
A. Parisot, S. Wukitch, Y. Lin et al, accepted by Plasma Phys. Control. Fusion.

Phase Contrast Imaging System
Measures line integrated density fluctuations for 32 vertical chords.
• Converts phase variation into intensity variation by phase shifting the unshifted light λ/4 at the detector.
• Phase variation is introduced by the density fluctuations.
Wide spectrum of wavenumbers is measured simultaneously; spatial structure is probed over wide area
• 0.5 < |kR | < 8 cm-1
• 60 cm < R < 79 cm (R0=0.66 m, a=0.22 m)• Digitized at 10 MHz
For RF waves, a heterodyned technique is used where the laser beam is modulated near the RF frequency.
• RF wave induced fluctuations appear at the beat frequency.
RF
AN
TEN
NA
PCI Chords

Simultaneous Measurement of ICW, IBW and Fast Waves
Measurements from recent D(3He) experiments at 50 MHz (J antenna) have mapped the mode conversion region.
Both the forward and reflected fast waves are present.
The ICW and IBW are also present. FW (forward)
ICW
IBWFW (reflected)
kR (cm-1)
Am
plitu
deFr
eq. (
kHz)

Mode Conversion Details can Significantly Impact MCCD Efficiency
In addition to IBW, significant power can be mode-converted to the ICW.• ICW propagate towards the low field
side, where magnetic trapping is higher and reduces the CD efficiency.
• Large k|| up-shift results in power absorption on low energy electrons.
Mode conversion results in a loss of spectrum control due to the rapid k||up-shift associated with both IBW and ICW waves.• Driven current can be bipolar.
0.0 0.2 0.4 0.6 0.8 1.0r/a
0
5
10
15
j (M
A/m
2)
RF power : 3 MWTotal: 96 kA
BT=5.4 T, Ip=0.8 MA,ne0 = 1.4 x10²⁰ m-3, Te0 = 5 keV, and65% D, 15% 3He, 5% H

Continue to Increase Injected RF Power
Discharges with 6 MW of ICRF power have been achieved.
• 0.350 sec at 6 MW• 0.7 sec at 5.2 MW• 1 sec at 5 MW
Antenna power density has achieved
• 1.5 MW (10 MW/m2) for D and E antennas and
• 3 MW (11 MW/m2) for J-port antenna.
2
4
6
0.05
0.1
2
4
0.6 0.8 1.2 1.4
0.6
0.8
1
1.2
1.4
PRF
[MW]
Te0 [keV]
nline [x1020 m-2]
Time [sec]
1031106026 BT
=5.2 T IP
=0.8 MA
WMHD [MJ]
1.0

D and E Antenna Issues from Campaign 2002
Appeared to be more operationally limited:• Had lower maximum voltage and
power limit.» Reliable operation was limited to
30-35 kV.» Power was limited to ~ 1 MW
compared.• Simultaneous operation was more
difficult.• E-port had difficulty in operating at
lower plasma currents.Attributed lower operation voltage and
power to arcing in the feedthru.Modified feedthru to reduce E-field by
30%

D-Antenna Inspection Summary
No damage found on feedthrus.Arc damage on antenna straps to antenna box and FS elements.
• Arcing is where fields are along B and geometrically enhanced.
• Arcing appears to preferentially go to antenna center.
Broken BN front tile.Side tile wave washer melted for those closest to the plasma.Plating is blistering on strap #1.
• Plated with brighteners prior to campaign ’02.

E-Antenna Inspection Summary
No damage found on feedthrus.Arc damage on antenna straps to antenna box.
• Arcing is where fields are along B and geometrically enhanced.Broken BN front tile.Two fractured BN side tiles.Side tile wave washer melted for those closest to the plasma.

Assessment and Plans for D and E Antennas
No arcing was found on the feedthrus.BN tiles still failed – replace with Mo.
• Primary reason is the BN material is proving to be unsuitable for mechanical reasons.
• Will eliminate fasteners that have been damaged.• Investigate whether machine performance is limited by BN.
Blistered Cu plating was removed from D antenna strap.No other changes are planned for D and E-antennas.
• Modification of strip line requires significant disassembly to minimize EB.
• No immediate solution to eliminate charge crowding on the antenna straps.
» Using CST to investigate means of reducing this charge crowding.

J-port Antenna Issues from Campaign 2002
Issues to address with modifications:
• Failed BN tiles.• Damaged septum spine.• Damaged vacuum side of
feedthrus.• Vacuum coax center
conductors were damaged.Modifications:Improve electrical contacts at:
• The antenna mounting plate• From the vacuum strip line and spool piece contact with strip line
and current strap. Did not install RF contact along side plate (capacitors).Replaced septum spine.Replaced failed BN tiles with nose tiles.

J-port BN Tile Design
Replace front and cover tiles with single front tile.
• Previous nose tiles have not failed to date.
» Test indicates the tile fails ~1000 G.» Failed tiles suggests ~200 G loads.
• Shield fasteners from plasma.» Preload bevel washers to ~ 200 G so
the BN tile moves with metal tile.• Material under the fastener increased to
0.5”.• Increase front material by removing
metal.» Alleviate over heating.
Mo tile modified to accommodate thicker BN tile.
• Tile strength is not compromised.

Modified All Junctions to Improve Contact
Number of junctions showed signs of series arcing.
Improved contact by relieving the flat section leaving a shoulder.
To improve reliable contact and reduce E-fields in mounting plate.• Increased diameter of
opening and added full radius.
• Increased the bolt pattern from 4 bolts to 8 bolts.
• Relieved the plate to allow the plate to rest only around the openings.
• Plated the flange face with copper to improve contact.

J Antenna Survey
No arcing on the parallel plate transmission line or at the contacts.
Two broken BN nose tiles.Heavy melt damage in vicinity of #4 back
plate.Evidence of arcing found on back plate feed
thru.Had limited neutral pressure operation to
<0.3 mtorr.
up
up

Assessment of J Antenna Modifications
Modified BN tiles still failed.
No damage was found on the septum spine or feedthrus.
Improved electrical contacts appeared to work – no evidence of arcing was found on • The antenna mounting plate or• From the vacuum strip line and spool piece contact with strip
line and current strap. RF ground along side plate (capacitors) appears to be
important.• significant damage was found on the vacuum vessel and the
antenna back plate.

Planned Modifications
Replace BN tiles with Mo tiles.• Primary reason is the BN material is proving to be unsuitable
for mechanical reasons.• Investigate whether machine performance is limited by BN.
Improve RF grounding of J antenna.• Re-install capacitors.
Shorten the vacuum coaxial transmission line.• D and E have short vacuum coaxial lines.• Make J antennas vacuum coaxial line as short as possible.

Additional Issues to be Investigated Further
Evidence of arcing along B-field to septum on D and E antennas where E appears less than nominal 15 kV/cm.
• Initial modeling suggest increased fields due to charge crowding.
• Investigate means of mitigating the charge crowding.
Degradation of voltage handling in the presence of high neutral pressure (>0.3 mTorr).Observe degraded voltage handling for low plasma currents on D and E antennas.In He discharges, the voltage handling appears to be improved over deuterium discharges.
Test high dielectric constant film from TPL for DC breaks.Investigate compound insulating tiles to replace BN.

General Requirements for New Antenna
Antenna is to • Have maximize voltage (50 kV) and power handling
capability (3 MW),• Minimize impurity and density production,• Have pulse length up to 5 seconds at repetition time of
2000 seconds,• Have thermal loads at plasma limiter of 12 MW/m2 with a 3
mm scrape-off length,• Withstand a disruption load of 1 T/msec at 9 T, • be fed through a single horizontal port, and • Have 50-80 MHz range.
Antenna in-vessel assembly needs to be efficient.Diagnostics should be built into the design from the outset.

Antenna Concept
Use same folded strap design as on J-port.• Becomes a simple antenna if operated
for FS-less designUse parallel plate transmission line but
make vacuum transmission line as short as possible.• Test on J-port in summer/fall campaign.
Avoid or limit Epeak <10 kV/cm where E||B.Limit maximum E<35kV/cm.Have performed electrical analysis of one
vacuum assembly • Use CST (fields code )and Cosmos
(electrostatic code) to map field distribution along transmission line and antenna.

Comparison of Concept Strap to J-port
Reduce height of strap to• Shield antenna behind plasma limiter and• Simplify antenna box design.• More robust box results in simpler
protection tile design and fastening.May need to re-examine tap location.
• Space limitations may require moving central ground so the antenna would not be symmetric about midplane.
• Already run discharges with ~2 cm asymmetry.

Faraday Screen Options
Option 1: Mo screen• Similar to J-port with 50% transmission and TiNC coated.• Use electrical isolation at rod ends with sufficient
protection from the plasma.Option 2: Inconel screen• Similar to J-port with 50% transmission and Cu-plated
inconel 625 rods with TiNC coating.• Use electrical isolation at rod ends with protection from the
plasma.Option 3: Faraday screen-less• Antenna with only septum to protect antenna from plasma.• Intend to perform experiments using J-port later in FY04.
Design antenna to be able to implement any of the three options.

Thermal Loads
Thermal loads on antenna are a combination of plasma parallel heat flux, plasma radiation, and RF losses.• Parallel heat flux is 1200 W/cm2 at the plasma limiter face.
» Assume 3 mm scrape-off length which is consistent with probe measurements (can be as short as 2 mm near the limiter).
• Radiation heat flux is 30 W/cm2 (consistent with previous C-Mod thermal analyses).
• Induced RF losses in the Faraday screen is assumed to be 3% of the total injected power.
» Corresponds to 25 W/cm2.» Consistent with previous analyses on D and E antennas.
We are considering an antenna with and without a Faraday screen and different screen materials.
We are also considering BN protection tiles.

Faraday Screen Thermal Analysis
Faraday screen thermal properties are the primary thermal limit to antenna pulse length.
Heat load on Faraday screen is 120 W/cm2:• Parallel heat flux is 40 W/cm2.• Plasma radiation is 30 W/cm2.• RF induced losses is 25 W/cm2.
Investigated Inconel and Mo as screen material.• 5 sec pulse ∆T~460 ºC for Inconel• 5 sec pulse ∆T~520 ºC for Mo• Inconel melts at 200 W/cm2 for 5 sec but Mo is significantly
higher.• Mo FS has a less restrictive thermal operating range
compared to Inconel 625.
up
up

Faraday Screen Options
Operation without a Faraday screen would improve the overall thermal operating range of the antenna (allow for longer pulses at higher power).• Operating J antenna without a FS is planned and will allow
an assessment of antenna performance.• One potential issues is decreased antenna voltage capability.
Could consider using BN or other insulating material as FS material.• Lowers the heat load and has no directly induced disruption
loads.• Protects antenna from plasma but does not set the antenna
polarization.• We do not observe heating or impurity/density production
differences between D and E and J antennas (screen alignment is different).

Side tile and Antenna Strap Thermal Analysis Summary
Heat load on protection tiles is assumed to be 215 W/cm2 and dominated by parallel heat flux.• Parallel heat flux is 160 W/cm2.
» reduced from 1200 W/cm2 by ~2 scrape of lengths.• Plasma radiation is 30 W/cm2.• RF induced losses is 25 W/cm2.
For Mo tiles, ∆t~200ºC are expected for 10 sec pulses.• Max temperatures are near 500ºC and are well within acceptable
limits for Mo.Using BN tiles instead of Mo the max (surface) temperature rise ~160 ºC
per 5 sec discharge.Heat load on current straps is minimal.
• Parallel heat flux is negligible.• Plasma radiation is 30 W/cm2 between FS rods• RF losses are 4 W/cm2 (consistent with previous antenna analysis).
Inertial cooling is sufficient for both side tiles and antenna strap even in the FS-less design option.
up

Summary
Antenna loading variation is dominated by the density pedestal height.
Have simultaneously measured the fast, IBW, and ICW waves in D(3He) mode conversion scenario.
Completed post operation assessment of antennas.• Plan to replace BN tiles with Mo and• Reduce vacuum transmission line on J antenna.
Completed thermal analysis of conceptual 4-strap ICRF antenna design.• Limiting antenna element is the Faraday screen.
» A passively cooled Mo screen can be used for 5 sec long, high power, high performance discharges.
» Operation without a screen poses no problems from a thermal stand point.
• Inertial cooling is sufficient for both side tiles and antenna strap even in the FS-less design option.

Status of Lower Hybrid Project
Ron Parker
Alcator C-Mod Quarterly Review
20 July 2004

The LH Antenna System Consists of Three Main RF Components
Coupler (with vacuum windows)
Forward waveguide assembly
Rear waveguide assembly andsplitter network

Coupler Description
The four couplers conform to the surface of the plasma and arebolted to the forward waveguide assembly. The RF seal is madeby means of a thin metal gasket, the vacuum seal via a gold O-ringthat seals against the forward waveguide flange.
Each coupler has 24 ceramic vacuum windows brazed into the 24 waveguides formed by EDM cutting of a Ti block.
The coupler is made from Ti in order to minimize the difference in coefficient of thermal expansion between it and the Al2O3 ceramic.
Hydrogen takeup by the titanium during plasma operationis thought to be an issue limiting coupler performance; therefore the titanium is plated with Cu to eliminate this problem.

PPPL Coupler Status and Schedule
Couplers provided by PPPL have been stripped of original (faulty) plating andwindows. Current plan is to rebraze new windows into PPPL couplers using improvements in the brazing process that have been developed through extensive R&D at the PSFC.
We have sufficient ceramic metallized “bricks” (i.e., ceramic windows) to complete three PPPL couplers. These, plus existing spare coupler, can be used for launcher installation and initial LHCD experiments.
The brazing of the PPPL couplers is scheduled to proceed after one additional week of brazing R&D. Unfortunately, vacations at CPI delay the date at which the first coupler can be brazed until late August.
Assuming one coupler is brazed each week and allowing two weeks for each coupler to be cleaned, final machined and plated, the fabrication of the PPPL couplers would be completed by the end of September.
Allowing three weeks for integrated power and leak testing of full launcher brings the initial LH launcher installation date to late October with completion of launcher installation in early November.

PPPL Coupler Status and Schedule (Cont’d)
CPI shutdowns and vacations introduce a four week delay into the current schedulefor launcher installation.
A used vacuum oven suitable for brazing the couplers has been purchased and is being installed this week at the PSFC. First test brazes are scheduled for next week.
Having this oven at the PSFC will facilitate additional brazing R&D and recovertwo weeks in the schedule for completing the coupler brazes. This will allowthe launcher installation date to be brought forward by 2 weeks, leading to completion of the installation by the end of October.

As reported in last QR, 5 new blank Ti couplers have been manufactured under PSFC contract. They differ from PPPL couplers in that the flange is integrated (the coupler is fabricated out of a single block of material), the outer walls are thinned near windows (to reduce stresses in the end windows) and the corner radii are smaller (to reduce gaps at corners.)
PSFC Coupler Status
An expedited order for 240 metallized bricks for these couplers has been placed. Delivery of plated windows would begin in 2-3 weeks and be completed in ~ 4-5 weeks.
If serial production of plated windows begins in 2 weeks (to be confirmed this week), four PSFC couplers could be fabricated using the new PSFC oven by the end of September. Allowing three weeks for integrated power and leak testing sets the initial installation date in late October with completion in early November.

Integrated Forward-Rear Waveguide Power Testing
Integrated testing of the forward and rear waveguide assemblies has been carried out. While each waveguide assembly had been separately tested, integrated high-power transmission tests are required to establish the functionality of the RF gaskets used to join the individual waveguides of the two assemblies.
The test results showed that 96 of the 98 waveguides metacceptance criteria (45-50 kW @ 0.5 sec). Arcing occurred at one of the two remaining waveguides, likely due to inadequate compression of the gasket.
We are investigating cause of this arcing, and methods ofpredicting that arcing would occur without high-power testing (visible examination, TDR, failure of waveguide to hold pressure). The likely fix is a slightly thinner shim used to control the gasket compression on this waveguide.
These results, while positive, show the importance of full integrated testing at high power before installation!

Summary
Two paths are being followed to complete the coupler fabrication: using the original PPPL couplers and using new couplers fabricated by the PSFC.
These paths can initially be followed in parallel. If the rebraze of the PPPL couplers using the new PSFC vacuum oven is successful, initial installation of theLH launcher would use these couplers, begin in mid-October and be completed by the end of October.
If the rebraze of the PPPL couplers is not successful, the PSFC couplers would be used and the initial installation date would move to late October with completion in early November.
In either case, use of the new vacuum brazing oven at the PSFC is assumed, which moves the installation date forward by 2-3 weeks relative to brazing the couplers at CPI.

Recent DNB program highlights
Presented by R. Granetz
Alcator C-Mod quarterly review 20 July 2004

We are currently between beams
• Alcator C-Mod had been using a short-pulse (50 ms) diagnostic neutral beam on temporary loan from Consortio RFX (2+ years)
– 50 kV; 4-5 amps ion current from source
– Arc discharge plasma source → high full-energy fraction (80 – 90%)
• Worked well; gave a single time point during discharge
• Loan period has expired, and the beam was returned to RFX in May 2004

Typical DNB signals with RFXshort-pulse beam
0 0.5 1 1.5 200.20.40.60.811.2 -Ip (MA) 1030605021
0 0.5 1 1.5 20
1e+20
2e+20
3e+20nebar 1030605021
0 0.5 1 1.5 20
1
2
3
4 Te0 from ECE 1030605021
0 0.5 1 1.5 201020304050
DNB voltage (kV) 1030605021
0 0.5 1 1.5 2012345
DNB ion current (A) 1030605021
0 0.5 1 1.5 20.1
0.2
0.3
0.4Raw MSE Ch03 R=84.0cm 1030605021
0 0.5 1 1.5 25
6
7
8
9BES chan 1 (mW/m^2/sr) 1030605021
1 MA
ne= 1.5×10²⁰ m-3 (L-mode)¯
50 kV, 50 ms
4-5 amps ion current
Raw MSE signal
Raw BES signal

New long-pulse DNB being builtfor C-Mod by the Budker Institute
• Beam specifications:
– 1.5 s total beam on-time; able to be fully modulated (for example, with 50% duty factor, beam pulse can cover 3 s discharge duration)
– 55 kV, 8 amps ion current from source
– RF discharge plasma source is the baseline design; long lifetime, but with somewhat reduced full-energy fraction (60 – 70%)
– A long-lifetime arc source is also being developed as a possible alternative (higher full-energy fraction). Excellent progress has been made.

RF source vs arc source
• Arc sources produce hotter plasmas, and therefore have a higher yield of full-energy ions (i.e. H+), which is an important consideration for MSE.
– 80-90% for arc source vs ~ 60% for RF source
• But “cold cathode” arc sources suffer from erosion of the cathode material. This limits the source lifetime, or equivalently, the pulse length. (Arcing at the surface of the cathode produces electron emission, but also melting.)
Therefore, long-pulse diagnostic beams have used RF sources:

Budker beams with RF sourcesare used on TEXTOR and TCV
TCV DNB:• 20 – 55 keV• 2.8 amps• 2 seconds• 60% full-energy fraction
(of ion current in source)
TEXTOR DNB:• 20 – 50 keV• 2 amps• 10 seconds• 60% full-energy fraction
(of ion current in source)

Long-life arc source
• The key is to produce copious electrons in an arc discharge, but without arcing at the cathode.
– Use lanthanum hexaboride (LaB6), a well-known electron emitter, to provide a large number of electrons. (Yield is about 200 amps at 1600 °C)
– Feed the electrons into a hollow cathode, where low-voltage electron multiplication increases the current to 800 amperes. This is sufficient to yield an ion current of 8 amps through the plasma grid.

Arc plasma source withLaB6 cathode emitter

Prototype arc plasma source withLaB6 cathode emitter

Energy components of beam using theprototype LaB6 arc plasma source
0,5 1,0 1,5 2,0 2,5 3,0 3,5 4,00
2
4
6
8
10
Ion species mix at different time of diagnostic injector with LaB6palsma source. Accelerating voltage 50 kV. Magnetic mass-analyzerwith helium target. Beam current 1,9 A. Distance 5,15 m.Time of measure 200 ms. Duration of helium target valve 4 ms.
Sig
nal o
f mag
netic
mas
s sp
ectro
met
r
H+ - 80,1%
H2+ - 5%
H3+ - 13,3%
H2O - 0,6%
Magnetic coil current, A.

Energy component mix vs time & current(prototype LaB6 arc plasma source)
0 200 400 600 800 1000
10
20
30
40
50
60
70
80
90
18.08.03
Ion species mix at different time of diagnostic injector with LaB6palsma source. Accelerating voltage 50 kV. Magnetic mass-analyzerwith helium target. Beam current 1,8 -2 A. Distance 5,15 m.
Ion
frac
tion,
%.
time, ms.
E0 E1/2 E1/3
1,0 1,2 1,4 1,6 1,8 2,0 2,20
10
20
30
40
50
60
70
80
90
Ion species mix of diagnostic injector with LaB6 palsma source.Accelerating voltage 50 kV. Magnetic mass-analyzer with helium target.Time of measurment 200 ms from the start.H2O and other components < 0.7%. Distance 5.15 m.
Frac
tion,
%.
Beam current, A.
E0 E
1/2 E1/3

Schedule status for long-pulse beam
• All major components have been fabricated/procured (May)
• The design of the LaB6 arc source has been finalized (May)
• Beam assembly is in progress and is supposed to be finished Aug/Sept. This is currently on schedule.
• We may want to go to Budker to witness the beam performance and qualification tests in September
• Beam delivery to MIT is by end of October
• Beam will be installed on C-Mod during the first 3 weeks of November*, coinciding with the IAEA and APS conferences (since the tokamak will not be run then)
*subject to obtaining visas

MSE in-vessel calibration(May-July 2004)

Previous calibrations were based on beam-into-gas with B-fields
• Beam-into-gas calibrations are not consistent with EFIT at the plasma edge
Therefore, we decided to do an in-vessel calibration with a polarized light source

Plasma-facing lens was coated
• Coating consisted of boron compounds AND pitting of glass lens
• We do not know how or when this occurred. We have not seen this on past campaigns.
• Calibrations were done twice: first with the coated lens, and then with a virgin replacement lens
• Coating was found to reduce intensity, reduce polarization fraction slightly, and degrade spatial resolution, but did not significantly affect the measured polarization angle

In-vessel calibration setup
• An LED-array light source at 660 nm provided– unpolarized– linearly polarized– circularly polarized
• Source was precisely oriented (0.01°) on an optical table in the vessel
• For each MSE spatial channel, a scan of polarization angles was done with a precision (0.001°) rotating stage
• Metrology of viewing geometry, spatial resolution measurements, and background reflection measurements were also done.

Raw Angle Measured by MSE has Small Errors
• ~1o deviations from exact linearity have clear cos(2θ) and cos(4θ) components.
• Simulated MSE spectra confirm that such errors would be caused by mirrorimperfections – phase shifts and non-equal S/P reflectances.
• The deviations are largest at the outermost and innermost optical channels.
• These small errors can be completely accounted for in the analysis.
o

Error has cos(2θ) and cos(4θ) Components
• Phase shifts introduces cos(4θ) error and S/P reflectance ratio introduces cos(2θ) error.
• The dominant error is cos(4θ) due to phase shift. • Phase shift is largest for MSE channels at the edge of the field-of-view, smallest
near the optical axis.

MSE Invessel Calibration Data is Understood
• Fits include corrections of order 1o caused by phase shifts introduced by the three MSE mirrors.
• Final system response is linear to within ~ 0.02o across all channels. • System behavior during the invessel calibration is fully understood (no
toroidal field, no vacuum, no atomic physics).

Anomalous Features of Beam-into-Gas Calibration
• Apply in-vessel calibration data to beam-into-gas calibration shots. • Edge channels show significant ‘curvature’ response.• Slope of measured response is greater than unity for all channels.• ‘Offset’ exists for all channels.

Possible Causes of Observed Anomalies
• Atomic physics: geometrical effects on Iσ/Iπ ratio• Unlike situation during in-vessel calibration, the light emitted during
beam-into-gas shots has both σ and π components which are orthogonal.
• The unusual viewing geometry of C-Mod MSE at the plasma edgemay affect the Iσ/Iπ ratio and the measured angle.
• Zeeman splitting of Stark Spectrum• Magnetic field causes a small Zeeman splitting of the Stark emission
spectrum with circular polarization. • The phase shift induced by the MSE mirrors will convert any circularly
polarized light into partially linearly polarized light. • Faraday effect in MSE optical components
• MSE designed with low-Verdet glass. Faraday effect expected to be small.• Will measure Verdet constant of MSE optical components in the lab.
• Stress-induced bi-refrigence of vacuum window• Hard to reconcile with channel dependence of MSE response.

Recent CXRS results
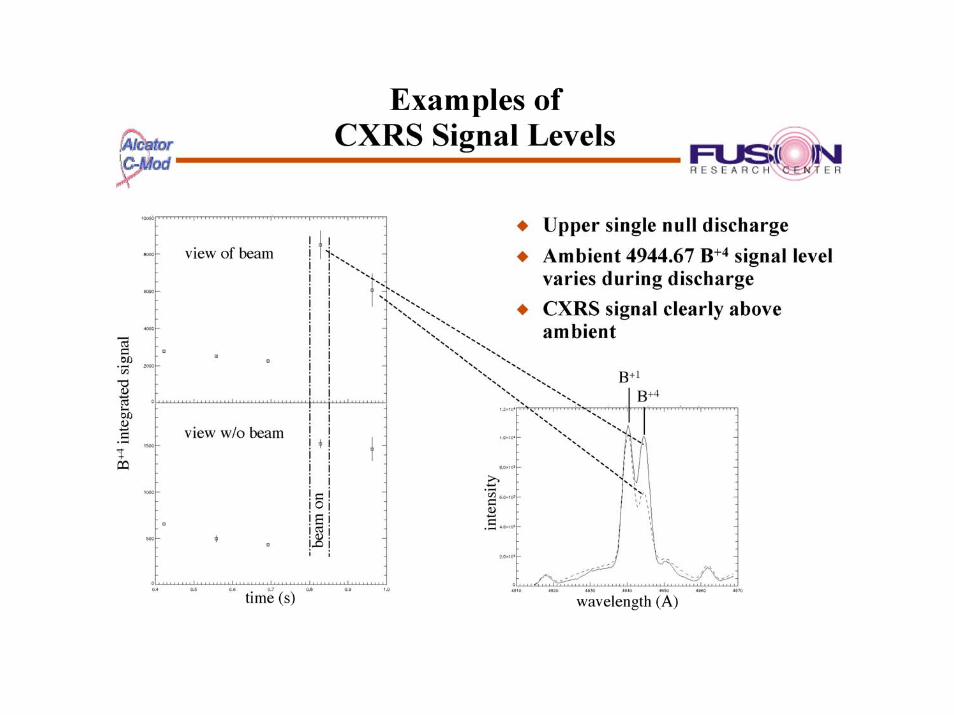


Beam penetration measurements
