alcohol and health - health in wales
TRANSCRIPT

alcohol and health A profile of alcohol and health in Wales

Main author: Andrea Gartner (WCfH)
Contributing authors: Hugo Cosh (NPHS), Rhys Gibbon (WCfH) and Nathan Lester (NPHS)
Acknowledgements: Thanks to the following people for their help with this report: Susan Belfourd (WCfH), Sonnda Catto (Health Scotland), Anna Childs (NPHS), Ciarán Humphreys (NPHS), Rhianon James (WCfH), Su Mably (WCfH), Cath Roberts (WAG), Josie Smith (NPHS), Lisa Williams (WCfH). Special thanks to Dan Dedman and Karen Tocque (both NWPHO) for their advice with alcohol-attributable indicators.
Publication details:Title: A profile of alcohol and health in WalesPublisher: Wales Centre for HealthDate: April 2009ISBN: 0-9545544-9-3
This publication is also available in electronic format (portable document format) on the WCfH website www.wch.wales.nhs.uk and the NPHS website www.nphs.wales.nhs.uk
Contacts:Wales Centre for Health14 Cathedral RoadCardiff CF11 9LJTel: 029 2022 7744Fax: 029 2022 6749Email: [email protected]
www.wch.wales.nhs.uk
©WCfH 2009

Content
Figures and tables 2
Key messages 4
1. Introduction 5
2. Definitionsofunitsanddrinkingpatterns 6
3. Patternsofdrinking 8 3.1 Drinking during pregnancy 8 3.2 Drinking in children and young people 9 3.3 Consumption in adults in Wales by age group and sex 10 3.4 Drinking patterns and trends in Great Britain 12 3.5 Drinking patterns by local authority in Wales 15 3.6 Comparison of survey results and sales data 16 3.7 International comparison of consumption estimates 17 3.8 Affordability and consumption 18
4. Mortality 19 4.1 Alcohol-related mortality (ONS definition) 20 4.2 Alcohol-attributable mortality 25
5. Admissionstohospital 28 5.1 Alcohol-related hospital admissions 28 5.2 Alcohol-attributable hospital admissions 34
6. Socio-economicpatternsinalcoholconsumptionandalcohol-relatedmortality 38
7. Alcohol-relatedcrime 41 7.1 Perceptions of alcohol-related crime 41 7.2 Violent crime attributable to alcohol by local authority 43 7.3 Driving under the influence of alcohol 44 7.4 Sexual assault 44
8. Otherdata 45 8.1 Referrals for treatment of alcohol misuse 45 8.2 Benefit claimants where the main medical reason is alcoholism 47
9. Conclusions 48
10.References 50
11. Appendices 52 Appendix 1: Data Sources 52 Appendix 2: Methodology and definitions 53 Appendix 3: Selected data tables 55
A profile of alcohol and health in Wales
1

Table 1 Number of units in common alcoholic drinks 6
Table 2 Overview of definitions of consumption patterns 7
Fig. 1 Estimated weekly alcohol consumption during pregnancy by country 8
Fig. 2 Percentage of 13-year olds who reported drinking at least once a week for 9 selected countries (2005/06)
Fig. 3 Percentage of 13-year olds who reported having been drunk at least twice for 10 selected countries
Fig. 4 Percentage who reported drinking above guidelines in the past week in Wales 11 by age and sex
Fig. 5 Percentage who reported binge drinking in the past week in Wales by age and sex 11
Fig.6 Reported average frequency of drinking alcohol by sex 12
Fig. 7 Percentage who reported binge drinking in the last week, 2006, by nation 13 and sex
Fig.8 Percentage who reported drinking above guidelines, 2006, by nation and sex 13
Fig. 9 Trend in reported binge drinking in males 1998-2006, by age group, Great Britain 14
Fig. 10 Trend in reported binge drinking in females 1998-2006, by age group, Great Britain 14
Fig. 11 Percentage who reported binge drinking by local authority, persons, 15 age-standardised
Fig. 12 Average weekly alcohol consumption: UK sales data, General Household survey 16 (GHS) and Welsh Health Survey (WHS)
Fig. 13 International consumption estimates for selected countries, litres per head of 17 pure alcohol, 2006
Fig. 14 Estimated affordability and consumption of pure alcohol per head aged 15 and 18 over, UK, 1980-2007
Table 3 Comparison of average annual alcohol-related and alcohol-attributable deaths 19 in Wales (numbers and percentages)
Fig. 15 Trend in alcohol-related mortality, three year rolling rate (EASR), by sex, Wales, 20 1991-2006
Fig.16 Alcohol-related mortality, European age-standardised rate (EASR), by nation, 21 persons, 2004 and 2007
Fig. 17 Percentage of alcohol-related deaths by condition, Wales, males, 2002-06 21
Fig.18 Alcohol-related mortality, European age-standardised rate (EASR) per 100,000, 22 ranked local authorities, males, 2002-06
Fig. 19 Per centage of alcohol-related deaths by condition, Wales, females, 2002-06 23
Fig. 20 Alcohol-related mortality, European age-standardised rate (EASR) per 100,000, 24 ranked local authorities, females, 2002-06
Fig. 21 Trend in alcohol-attributable mortality, annual European age-standardised rate 25 (EASR) per 100,000 by sex, Wales, 2001-06
Fig. 22 Alcohol-attributable mortality, European age-standardised rate (EASR) per 26 100,000, males, ranked by local authority, 2002-06
Fig. 23 Alcohol-attributable mortality, European age-standardised rate (EASR) per 27 100,000, females, ranked by local authority: 2002-06
Figures and tables
A profile of alcohol and health in Wales
2

Fig. 24 Trend in alcohol-related hospital admissions in Wales residents, European 29 agestandardised rate (EASR) per 100,000 by sex, 1999-2006
Fig. 25 Percentage of alcohol-related hospital admissions by condition, Wales, males, 29 2002-06
Fig.26 Percentage of alcohol-related hospital admissions by condition, Wales, 30 females, 2002-06
Fig. 27 Alcohol-related hospital admissions, age-specific rate (ASR) per 100,000, 31 Wales, 2002-06
Fig.28 Alcohol-related hospital admissions, European age-standardised rate (EASR) 32 per 100,000, ranked local authorities, males, 2002-06
Fig. 29 Alcohol-related hospital admissions, European age-standardised rate (EASR) 33 per 100,000, ranked local authorities, females, 2002-06
Fig. 30 Trend in alcohol-attributable hospital admissions in Wales residents, European 34 age-standardised rate (EASR) per 100,000 by sex, 1999-2006
Fig. 31 Alcohol-attributable hospital admissions, age-specific rate (ASR) per 100,000, 35 Wales, 2002-06
Fig. 32 Alcohol-attributable hospital admissions, European age-standardised rate 36 (EASR) per 100,000, ranked local authorities, males, 2002-06
Fig. 33 Alcohol-attributable hospital admissions, European age-standardised rate 37 (EASR) per 100,000, ranked local authorities, females, 2002-06
Fig. 34 Percentage of persons who reported binge drinking and drinking above 38 guidelines in the past week by WIMD fifth (age-standardised)
Fig. 35 Alcohol-related mortality, European age-standardised rate (EASR) per 100,000, 39 by WIMD fifth, persons, 2002-06
Fig.36 Alcohol-attributable mortality, European age-standardised rate (EASR) per 40 100,000, by WIMD fifth, persons, 2002-06
Fig. 37 Percentage of perceived major causes of crime, 2007/08 41
Fig.38 Percentage of violent incidents where the victim believed the offender(s) to 42 be under the influence of alcohol, 2007/08
Fig. 39 Violent crime attributable to alcohol, rate per 1,000, 2007/08 43
Fig. 40 Percentage of drivers involved in accidents: positive breath test results by 44 police force, 2006
Fig. 41 Number of referrals seen at treatment agencies for alcohol misuse by age 45 group, Wales, 2007/08
Fig. 42 Referrals seen for alcohol misuse, European Age-standardised Rate (EASR) 46 per 100,000, ranked by local authority, 2007-2008
Table 4 Number of Incapacity Benefits (IB) and Severe Disablement Allowance (SDA) 47 where main medical reason is alcoholism in Wales, Scotland and English regions May 2007
Table 5 Average weekly alcohol consumption in units: UK sales data, General 55 Household survey (GHS) and Welsh Health Survey (WHS)
Table6 Alcohol consumption per head in leading countries (BBPA estimates) 56
Table 7 Alcohol-related mortality, rate per 100,000, UK nations, persons 56
A profile of alcohol and health in Wales
3

Key messages
• Alcohol is a major preventable cause of death and illness in Wales. Around 1,000 deaths are attributable to alcohol per year in Wales.
• Alcohol consumption in children and young people is of particular concern. Wales had the highest percentage of all 40 countries surveyed in 13-year olds having been drunk more than twice (27% of boys and 26% of girls). In children aged under 16 more girls were admitted to hospital than boys with 215 admissions in boys and 295 in girls for alcohol-related conditions in 2006.
• Substantial inequalities were found between the most deprived and least deprived communities. The most deprived areas experienced alcohol-related mortality rates more than three times higher than the least deprived areas.
• Comparisons with UK sales estimates suggest that surveys including the Welsh Health Survey may underestimate alcohol consumption, and may only represent 55-60% of the true consumption figure.
• The number of deaths linked to alcohol can be estimated in different ways. There were 260 alcohol-related deaths per year amongst males in Wales (conditions most directly linked to alcohol) compared to 670 alcohol-attributable deaths (4.3% of all male deaths) using a new wider definition that includes conditions in part linked to alcohol. When estimating or monitoring the impact of alcohol on mortality these new indicators of alcohol-attributable harm should also be considered.
• The alcohol-related mortality rate for males almost doubled in the period of 1991-1993 to 2004-2006, although the trend has been levelling out in the latest UK rates released. The rate for persons in Wales in 2007 was slightly higher than the rate for England, and just over half the rate for Scotland.
• The trend in both alcohol-related and alcohol-attributable hospital admission rates is upwards, with rates approximately twice as high for males than females.
• The average annual number of alcohol-related hospital admissions for residents of Wales was around 8,400 for males and 4,500 for females (1.5% of all admissions).
• Alcohol is perceived to be a major cause of crime by around half of respondents to the British Crime Survey. There were an estimated 18,000 incidents of violent crime attributable to alcohol in Wales in the year 2007/08.
• There were around 15,300 referrals for treatment of alcohol misuse in Wales in the year 2007-08; around 1600 were for patients of age 19 and younger.
A profile of alcohol and health in Wales
4

Alcohol consumption is deeply ingrained within the culture of the UK and other western countries. Many people enjoy alcoholic drinks in moderation, and sensible drinking can have some benefit as it is associated with a lower risk of coronary heart disease and stroke in older people (BMA, 2008). But alcohol is also an addictive drug and alcohol misuse can lead to significant harm to the individuals, families and society. Alcohol is estimated to be the third highest of twenty-six risk factors for ill-health in the EU, ahead of overweight/obesity and behind only tobacco and high blood pressure (Anderson & Baumberg, 2006). It therefore presents a major public health challenge.
The new 10-year substance misuse strategy recently launched by the Welsh Assembly Government (2008) sets out a national agenda to reduce harm caused by alcohol, drugs and other substances. It aims to prevent substance misuse through education and other mechanisms; improve services for substance misusers; support and protect families and tackle the inappropriate availability of alcohol (Welsh Assembly Government, 2008).
There have been many reports on the topic of alcohol in the media recently, particularly relating to binge drinking and young people’s drinking. A number of health intelligence reports and data relating to alcohol and health have been published for England and the English regions. For Wales, reports are available on specific topics, for example on alcohol-related mortality (Welsh Assembly Government, 2007), or as alcohol sections in reports on substance misuse (NPHS, 2006; Welsh Assembly Government, 2008). The latest method used in England to estimate alcohol-attributable harm has not previously been applied to data for Wales. This joint health intelligence report by the Wales Centre for Health (WCfH) and the National Public Health Service for Wales (NPHS) addresses this gap for Wales and presents comprehensive information based on a number of available data sources on the subject. Like previous titles in this series, on smoking and rural health, it is aimed at public health professionals and the interested public, and intends to use as little technical jargon as possible.
1. Introduction
A profile of alcohol and health in Wales
5

2.Definitionsofunitsanddrinkingpatterns
Alcoholic drinks in the UK are measured in units and each unit corresponds to approximately 8 grams (g) or 10 millilitres (ml) of pure alcohol. The number of units in an alcoholic drink depends on the strength of the drink and the size of the measure. The strength of some drinks, for example wine, has increased in recent years and serving sizes can vary, making it difficult for consumers to count their unit intake.
The number of units in a drink is calculated by multiplying the amount in millilitres (ml) by the strength (Alcohol by Volume, ABV) and dividing the result by 1000. Information for consumers and a unit calculator can be found on the ‘Alcohol: know your limits’ website (units.nhs.uk) and Table 1 lists the number of units in common alcoholic drinks.
2.1 Alcohol units
Sensible drinking is consuming alcohol in a way that is unlikely to cause oneself or others significant risk of harm (Department of Health, 2007). Guidelines used to be defined in terms of weekly limits, but the Department of Health (2007) has shifted the emphasis to daily drinking limits.
It is recommended that men should not regularly drink more than 3-4 units per day and women not more than 2-3 units per day. Reported drinking above guidelines (i.e. levels above sensible drinking) from surveys used in this report refers to drinking above these recommended limits, and data is available for Wales.
2.2Sensibledrinking
Table1:Numberofunitsincommonalcoholicdrinks
Drink (and unit strength (ABV))
Quantity Units Quantity Units
Lager, beer and cider (4%) Bottle (330ml) 1.3 units Pint (568ml) 2.3 units
Lager, beer and cider (6%) Bottle (330ml) 2 units Pint (568ml) 3.4 units
Wine (10%) Standard glass (175ml)
1.75 units Large glass (250ml)
2.5 units
Wine (14%) Standard glass (175ml)
2.5 units Large glass (250ml)
3.5 units
Spirits (38-40%) (Gin, rum, vodka & whiskey)
Small measure (25ml)
1 unit Large measure (35ml)
1.4 units
Alcopops (5%) 1 bottle (275ml) 1.4 units
Source: Department of Health (2009)
A profile of alcohol and health in Wales
6

2.3 Hazardous drinkingHazardous drinking is a pattern of alcohol use that increases the risk of harmful consequences for the individual. It is measured in surveys as drinking between 22 and 50 units per week for men, and between 15 and 35 units per week for women (Deakon et al., 2008). In contrast to harmful use, hazardous use refers to patterns of use that are of public health significance despite the absence of any current disorder in the individual user (World Health Organisation, 2008). Figures from the Welsh Health Survey, although currently not produced for the definition of hazardous drinking, could provide valuable data for monitoring this group.
2.4HarmfuldrinkingHarmful drinking is a pattern of alcohol use that causes harm to physical and/or mental health and commonly, but not always, has adverse social consequences (World Health Organisation, 2008).
Women who regularly drink over 6 units a day (or over 35 units a week) and men who regularly drink over 8 units a day (or 50 units a week) are at highest risk of such alcohol-related harm (Department of Health, 2007). Figures from the Welsh Health Survey, although currently not produced for harmful drinking, could provide valuable data.
2.5 Binge drinkingThe term ‘binge drinking’ has no standard definition. It usually refers to drinking too much alcohol over a short period of time, e.g. in one evening, and typically leads to drunkenness (Department of Health, 2007). In surveys, it is usually measured as drinking over 6 units a day for women or over 8 units a day for men, and in practice, many binge drinkers drink substantially more than this level (Department of Health, 2007). This definition, also listed in Table 2, is used throughout this report where survey results are reported, with data available for Wales.
Table2:Overviewofdefinitionsofconsumptionpatterns
Category Men Women
Sensible drinking (recommended limit)
Not more than 3-4 units per day Not more than 2-3 units per day
Hazardous drinking (data not available for Wales)
22-50 units per week 15-35 units per week
Harmful drinking (data not available for Wales)
Above 50 units per week Above 35 units per week
Binge drinking Above 8 units during a single session
Above 6 units during a single session
A profile of alcohol and health in Wales
7

Figure 1: Estimated weekly alcohol consumption during pregnancy by UK nation
Source: Infant Feeding Survey 2005
0%
10%
20%
30%
40%
50%
60%
England Wales Scotland NorthernIreland
UnitedKingdom
Perc
enta
ge o
f po
pula
tion
Did not drink
Less than 1 unit
1–2 units
3–7 units
8–14 units
15 units or more
3.PatternsofdrinkingData on drinking patterns come from surveys which ask a sample of the population about their drinking habits. These results are then used as an estimate of drinking patterns in the population. The main survey of adults in Wales is the Welsh Health Survey, which annually asks around 15,000 residents in Wales about their health and lifestyle choices including drinking patterns. Another survey is the General Household Survey, which covers adults in England, Scotland and Wales, and allows comparisons across the United Kingdom. Further information on these surveys can be found in Appendix 1. Additionally, socio-economic patterns of alcohol consumption are discussed in Section 6.
3.1 Drinking during pregnancy Guidance from the Government for all four nations advises that pregnant women should avoid drinking alcohol, but if they choose to drink, they should not drink more than 1 to 2 units of alcohol once or twice a week (Department of Health, 2009). Additional advice from the National Institute for Health and Clinical Excellence (NICE) advises women to avoid alcohol in the first three months in particular, because of the increased risk of miscarriage. Based on results from the Infant Feeding Survey, it is estimated that 55% of women consumed alcohol during pregnancy in Wales (see Figure 1). Most of the women who choose to drink consume little alcohol with 40% of pregnant women overall drinking less than 1 unit a week. However, 7% of pregnant women in Wales drink more than 1 to 2 units per week.
A profile of alcohol and health in Wales
8
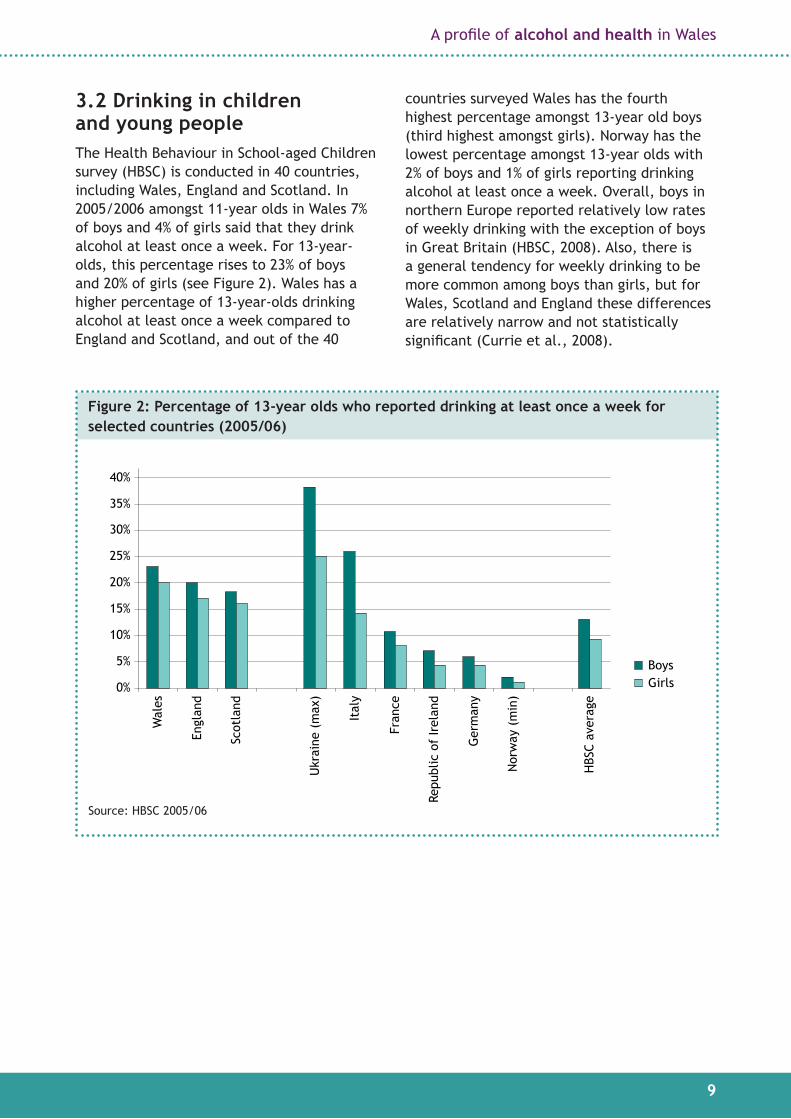
3.2 Drinking in children and young people The Health Behaviour in School-aged Children survey (HBSC) is conducted in 40 countries, including Wales, England and Scotland. In 2005/2006 amongst 11-year olds in Wales 7% of boys and 4% of girls said that they drink alcohol at least once a week. For 13-year-olds, this percentage rises to 23% of boys and 20% of girls (see Figure 2). Wales has a higher percentage of 13-year-olds drinking alcohol at least once a week compared to England and Scotland, and out of the 40
countries surveyed Wales has the fourth highest percentage amongst 13-year old boys (third highest amongst girls). Norway has the lowest percentage amongst 13-year olds with 2% of boys and 1% of girls reporting drinking alcohol at least once a week. Overall, boys in northern Europe reported relatively low rates of weekly drinking with the exception of boys in Great Britain (HBSC, 2008). Also, there is a general tendency for weekly drinking to be more common among boys than girls, but for Wales, Scotland and England these differences are relatively narrow and not statistically significant (Currie et al., 2008).
Figure2:Percentageof13-yearoldswhoreporteddrinkingatleastonceaweekforselectedcountries(2005/06)
0%
5%
10%
15%
20%
25%
30%
35%
40%
Wal
es
Perc
enta
ge o
f po
pula
tion
Engl
and
Scot
land
Ukr
aine
(m
ax)
Ital
y
Fran
ce
Repu
blic
of
Irel
and
Ger
man
y
Nor
way
(m
in)
HBS
C av
erag
e
BoysGirls
Source: HBSC 2005/06
A profile of alcohol and health in Wales
9

Children were also asked about their experience of drunkenness. Amongst 11-year-olds, 8% of boys and 4% of girls in Wales reported that they have been drunk at least twice. Amongst 13-year olds in Wales this percentage rises to 27% of boys and 26% of girls, the highest percentage of all 40 countries surveyed (see Figure 3). For 15-year-olds, the percentage of those that have been drunk at least twice doubles to 54% of boys and 52% of girls, compared to 13-year-olds.
Self reported intake is inevitably subjective, and there are some issues with the sample size and methodological variation (see also Appendix 1), however, these are concerning indications of alcohol use in children of such young age in Wales.
3.3 Consumption in adults in Wales by age group and sexSurvey results are essential to identify characteristics of those drinking, and patterns are reported by age group and sex.
Respondents to the Welsh Health Survey (see Appendix 1) were asked questions on their drinking habits including how often they drank and how much they drank on the heaviest drinking day in the previous week.
Results from the Welsh Health Survey 2007 showed that more men than women reported drinking above guidelines or binge drinking. This is highest in men at 56% amongst the 25-34 year olds, and decreases with age (see Figure 4). For women the highest percentage was 41% amongst the 16-24 year olds and decreases with age, particularly from age 55 and older.
A similar pattern is seen with binge drinking, although the decrease with age is more pronounced for binge drinking, particularly in females. The peak in binge drinking for men is 39% amongst the 25-34 year olds, and for females 27% amongst the 16-24 year olds (see Figure 5). The difference between men and women is wider for binge drinking than for drinking above guidelines.
Figure3:Percentageof13-yearoldswhoreportedhavingbeendrunkatleasttwiceforselected countries
0%
5%
10%
15%
20%
25%
30%
Wal
es(m
ax)
Perc
enta
ge o
f po
pula
tion
Scot
land
Engl
and
Repu
blic
of
Irel
and
Ger
man
y
Fran
ce
Ital
y
Nor
way
(m
in)
HBS
C av
erag
e
BoysGirls
Source: HBSC 2005/06
A profile of alcohol and health in Wales
10

Figure4:PercentagewhoreporteddrinkingaboveguidelinesinthepastweekinWalesbyage and sex
MalesFemales
16–24 25–34 35–44 45–54 55–64 65–74 75+
0%
5%
10%
15%
20%
25%
30%
35%
40%
45%
50%
55%
60%
Source: WHS 2007
Figure 5: Percentage who reported binge drinking in the past week in Wales by age and sex
Source: WHS 2007
0%
5%
10%
15%
20%
25%
30%
35%
40%
45%
Perc
enta
ge o
f po
pula
tion
16–24 25–34 35–44 45–54 55–64 65–74 75+
MalesFemales
A profile of alcohol and health in Wales
11

Figure 6 shows how often, on average, the respondents drank alcohol and the pattern is very different for men and women. 12% of men and 20% of women reported that they never drank, and 13% of men and 22% of women only drank alcohol at special occasions.
In men, those drinking on weekends and occasionally during the week were the largest group with 30%. 12% of males and 7% of females reported drinking alcohol on most days.
3.4 Drinking patterns and trends in Great Britain The General Household survey (see Appendix 1) covers England, Wales and Scotland and asks respondents about drinking patterns, including how much they drank in the past week. Results from the General Household Survey 2006 (GHS) show that in Wales 22% of men reported binge drinking on at least one day in the past week compared to 12% of women (see Figure 7). The corresponding percentages in Scotland and England are similar to Wales for males, and very slightly lower for females
in Wales. In contrast to the GHS figures, the corresponding percentage of men reporting binge drinking from the Welsh Health Survey 2005/06 was 25% and 13% for women, slightly higher than the GHS result. Similarly, Figure 8 shows that 42% of men and 34% of women in Wales reported that they drank above recommended guidelines, which is only very slightly higher than in Scotland and England. The corresponding figures as above from the Welsh Health Survey are 47% for men and 32% for women drinking above guidelines.
There are differences in survey methodology and sample size between the two surveys, which may account for these differences in results. A new methodology being implemented in future releases of the Welsh Health Survey is likely to increase these differences (further details on the surveys see Appendix 1). A discussion of surveys and their suitability to convey consumption levels in the population can be found in Section 3.6. To be able to compare figures for Wales, England and Scotland the General Household survey results are used in this section.
Figure6:Reportedaveragefrequencyofdrinkingalcoholbysex
Source: WHS 2007
0%
5%
10%
15%
20%
25%
30%
35%
Perc
enta
ge o
f po
pula
tion
MalesFemales
Never SpecialOccasions
only
Less thanonce
a week
Weekendsonly
Weekendsand
occasionallyduring the
week
Most days Every day
A profile of alcohol and health in Wales
12

Figure7:Percentagewhoreportedbingedrinkinginthelastweek,2006,bynationandsex
Source: General Household Survey 2006 (improved method)
0%
5%
10%
15%
20%
25%
30%
35%
40%
45%
Perc
enta
ge o
f po
pula
tion
MalesFemales
Wales Scotland England
Figure8:Percentagewhoreporteddrinkingaboveguidelines,2006,bynationandsex
Source: General Household Survey 2006 (improved method)
0%
5%
10%
15%
20%
25%
30%
35%
40%
45%
Perc
enta
ge o
f po
pula
tion
Wales Scotland England
MalesFemales
A profile of alcohol and health in Wales
13

Figures 9 for males and 10 for females illustrate the trend in the percentage of binge drinking in 1998-2006. Both charts suggest that binge drinking in the younger age groups has declined over the last few years. Amongst males aged 16-24, for example, 37% reported binge drinking in 2003 compared to 27% in 2006.
From 2006 onwards an improved methodology was used in light of changing glass sizes and drink strength, which generally shows higher percentages compared to the method shown here in the chart. Using the new method, however, would not allow a comparison over time.
Figure9:Trendinreportedbingedrinkinginmales1998-2006,byagegroup,GreatBritain
Source: General Household Survey 1998-2006 (previous method)
0%
5%
10%
15%
20%
25%
30%
35%
40%
Perc
enta
ge o
f po
pula
tion
1998 20012000 2002 2003 2004 20062005
16–24
25–44
45–64
65 and over
Figure10:Trendinreportedbingedrinkinginfemales1998-2006,byagegroup,GreatBritain
Source: General Household Survey 1998-2006 (previous method)
0%
5%
10%
15%
20%
25%
30%
40%
1998 20012000 2002 2003 2004 20062005
16–24
25–44
45–64
65 and over
A profile of alcohol and health in Wales
14

3.5 Drinking patterns by local authority in Wales Data from the Welsh Health Survey (see Appendix 1) allows a comparison of reported binge drinking in each local authority with the Wales average.
The age-standardised percentages are available for persons (see Figure 11) and show that binge drinking percentages are higher than the Wales average in Rhondda Cynon Taff and lower in Carmarthenshire, Monmouthshire and the Isle of Anglesey.
In an area where the population is younger, the respondents may be more likely to binge drink (see also Section 3.3) compared to areas with an older population. Age-standardised percentages are shown in Figure 11, as these are calculated proportions as if the local authorities had the same age profile as that of Wales. It therefore adjusts for the effect of age, when making comparisons between local authorities. It also should be noted that these are percentages of respondents resident in local authorities, which may not necessarily be where the drinking occurs. City centres in Cardiff or Swansea, for example, also attract revellers from neighbouring areas.
Figure 11: Percentage who reported binge drinking by local authority, persons, age-standardised
0%
5%
10%
15%
20%
25%
30%
Carm
arth
ensh
ire
Mon
mou
thsh
ire
Isle
of
Angl
esey
Conw
y
Cere
digi
on
Gw
yned
d
Pow
ys
Pem
brok
eshi
re
Den
bigh
shir
e
Flin
tshi
re
Wre
xham
The
Vale
of
Gla
mor
gan
New
port
Nea
th P
ort
Talb
ot
Card
iff
Torf
aen
Mer
thyr
Tyd
fil
Swan
sea
Brid
gend
Caer
phill
y
Blae
nau
Gw
ent
Rhon
dda
Cyno
n Ta
ff
Wales = 19%
Source: WHS 2005/07 (Percentages and Confidence intervals)
A profile of alcohol and health in Wales
15

3.6Comparisonofsurveyresultsand sales dataSurvey data are used to estimate alcohol consumption in the population. However, they are known to underestimate alcohol intake and it is suggested that survey estimates only represent between 55% and 60% of the true figure (Goddard, 2007; Catto, 2008). People tend to understate the amount they drink, partly unintentionally, as they genuinely forget some of the drinking or as it is increasingly difficult to calculate the units due to different strengths and serving sizes (Goddard, 2007). Some may deliberately understate the amount drunk, because they feel that it is not socially acceptable. It is also reported that under-representation of heavy drinkers in surveys may be one of the main reasons for the underestimation in the population (Goddard, 2007).
Figure 12 shows a comparison of weekly alcohol consumption for Great Britain and Wales and UK per person sales data. In 2006 the average weekly alcohol consumption per adult in Great Britain (General Household Survey) was 10.2 units, the estimated weekly consumption in Wales (Welsh Health Survey, see Appendix 1)
was 10.6 units and UK sales data was 21.2 units. Sales data are derived from HM Revenue and Customs’ duty clearances for alcohol released for sale, but not necessarily sold or consumed. They also include drinks industry figures and exclude, for example, cross-border shopping or illicit consumption, and unfortunately sales figures are not available for Wales separately. Also, data from the Welsh Health Survey and General Household Survey includes those aged 16 and above, whilst the UK sales figures are for those aged 15 and above. The estimated weekly consumption figures from the Welsh Health Survey are similar to those from the General Household survey for recent years. It is not clear how accurate the sales figures are as an estimate of consumption, but they are approximately twice the number of units compared to both survey results and suggest underestimation of alcohol intake in the population as reported by Goddard (2007).
While there may be underestimation in the survey results, survey data are still essential to identify characteristics of those drinking, for example comparisons between age groups, males and females, or frequency of drinking, which sales data cannot provide.
Figure12:Averageweeklyalcoholconsumption:UKsalesdata,GeneralHouseholdsurvey(GHS)andWelshHealthSurvey(WHS)
0
5
10
15
20
25
Perc
enta
ge o
f po
pula
tion
Uni
ts
1996 1997 1998 1999 2000 2001 2002 2003 2004 2005 2006 2007
UK per personsales, 15+
Avg. weeklyconsumption:GHS, adults inGreat Britain 16+
Estimated weeklyconsumption:WHS, adults inWales 16+
Source: BBPA, GHS, WCfH/NPHS from WHS (03/04, 04/05, 05/06 charted as 2004, 2005, 2006), 2007 WHS figure from WAG
A profile of alcohol and health in Wales
16

3.7Internationalcomparisonofconsumption estimates It is often assumed that alcohol consumption in the UK is higher than in other European countries. The consumption estimates in Figure 13 based on drinks industry figures and other sources show that the UK compares favourably to some European neighbours.
Germany, France and Spain are estimated to consume approximately 10 litres of pure alcohol per head compared to the UK with just over 8 litres. The Scandinavian countries, Australia and the USA are estimated to consume less. It is not certain how reliable these estimates are for all countries included, but this comparison is meant to give a general indication. Unfortunately figures for Wales are not available separately.
Figure13:Internationalconsumptionestimatesforselectedcountries,litresperheadofpurealcohol,2006
0
2
4
6
8
10
12
14
Swed
en
Cana
da USA
Finl
and
Aust
ralia
Net
herl
ands
Ital
y
UK
Repu
blic
of
Irel
and
Fran
ce
Ger
man
y
Spai
n
Czec
h Re
publ
ic
Litr
es p
er h
ead
Source: BBPA 2008
A profile of alcohol and health in Wales
17

3.8Affordabilityandconsumption It is widely reported that affordability of alcohol has increased and that this plays a significant role in the rise in alcohol consumption (British Medical Association, 2008). Figure 14 shows the affordability of alcohol (relative price of alcohol compared to other items) and estimated UK consumption of pure alcohol per person aged 15 and over.
Affordability of alcohol is based on the average price of alcohol compared to other goods indexed to prices in 1980 (value 100). A value of affordability above 100 means alcohol is more affordable. Affordability has increased by 69% between 1980 and 2007 and estimated UK consumption by 19% during the same period. Although no firm conclusions can be drawn from this type of chart, it suggests that estimated alcohol consumption has increased with rising affordability.
Figure14:Estimatedaffordabilityandconsumptionofpurealcoholperheadaged15andover,UK,1980-2007
60 4
5
6
7
8
9
10
11
12
80
100
120
140
160
180
1980
1981
1982
1983
1984
1985
1986
1987
1988
1989
1990
1991
1992
1993
1994
1995
1996
1997
1998
1999
2000
2001
2002
2003
2004
2005
2006
2007
Affo
rdab
ility
(19
80 =
100
)
Litr
es o
f pu
re a
lcoh
ol p
er h
ead
15+
Affordability of alcohol Estimated consumption
Source: (The Information Centre, 2008), BBPA 2008 (axis truncated)
A profile of alcohol and health in Wales
18

4. Mortality This report uses two ways of estimating the impact of alcohol on mortality. One is alcohol-related mortality, which is defined by the Office for National Statistics (ONS) to include only those causes of death most directly linked to alcohol use such as alcoholic liver disease (see Appendix 2). This definition is likely to underestimate the burden of alcohol use on mortality as it does not include conditions in part related to alcohol such as cancers of the mouth, oesophagus and liver. The second wider definition used is alcohol-attributable mortality, which includes deaths due to conditions in part attributable to alcohol (see Appendix 2 for further details).
There were substantial differences in the numbers of death between the two definitions. There was an average of 260 deaths per year in males using the ONS definition of alcohol-related mortality compared to 670 alcohol-attributable deaths in Wales, which were estimated to be attributable to alcohol. For females there was an average of 146 alcohol-related deaths, compared to 344 alcohol-attributable deaths per year. Table 3 shows the annual numbers of deaths and also the percentages of total deaths in Wales. Alcohol-attributable deaths for males accounted for 4.3% of the total deaths in males (2% for females). Whilst the percentages may appear small, these untimely deaths could be avoided.
Table3:Comparisonofaverageannualalcohol-relatedandalcohol-attributabledeathsinWales(numbersandpercentages)
Alcohol-relateddeaths(ONS) Alcohol-attributabledeaths Total deaths in Wales
Male 260 (1.7%) 670 (4.3%) 15422
Female 146 (0.9%) 344 (2%) 17115
Source: WCfH/NPHS from ONS ADDE (average 2002-2006)
A profile of alcohol and health in Wales
19

4.1Alcohol-relatedmortality(ONSdefinition)Alcohol-related mortality is defined by the ONS to include only those causes of death most directly linked to alcohol use such as alcoholic liver disease. Figure 15 shows the trend in alcohol-related mortality over time. Mortality rates for males have almost doubled from 8.8 per 100,000 in the period of 1991-1993 to 16.8 in 2003-2005. In the latest period of 2004-2006 this rate was only very slightly lower than the previous period at 16.7 per 100,000.
It appears that the rising trend has been slowing in recent years for males. For females the alcohol-related mortality rate was lower than for males and has increased from 4.9 per 100,000 in the period of 1991-1993 to a rate of 8.9 per 100,000 in 2004-2006. The latest ONS release of rates for 2007 shows that the UK trend for both males and females is levelling out (ONS, 2009). A comparison to rates in England, Northern Ireland and Scotland for persons is displayed in Figure 16. It shows that the rate for Wales was slightly higher than the rate for England, and slightly lower than the rate for Northern Ireland, in both 2004 and 2007. Scotland had the highest rate, nearly twice the rate for Wales in 2007.
Figure15:Trendinalcohol-relatedmortality,threeyearrollingrate(EASR),bysex, Wales,1991-2006
0
2
4
6
8
10
12
14
16
18
1991
–199
3
1992
–199
4
1993
–199
5
1994
–199
6
Males Females
1995
–199
7
1996
–199
8
1997
–199
9
1998
–200
0
1999
–200
1
2000
–200
2
2001
–200
3
2002
–200
4
2003
–200
5
2004
–200
6
Rate
per
100
,000
Source: WAG, WCfH/NPHS from ONS ADDE MYE
A profile of alcohol and health in Wales
20

Figure16:Alcohol-relatedmortality,Europeanage-standardisedrate(EASR),bynation,persons, 2004 and 2007
Source: ONS, GRO
0
5
10
15
20
25
30
2004 2007
Perc
enta
ge o
f po
pula
tion
England
Rate
per
100
,000
Wales
Northern Ireland
Scotland
Figure 17 shows the percentage of male alcohol-related deaths for each condition. It shows that nearly two thirds of the alcohol-related deaths in males (63.1%) were due to alcoholic liver disease and nearly a quarter of these deaths (23.0%) were due to fibrosis and cirrhosis of the liver.
Figure17:Percentageofalcohol-relateddeathsbycondition,Wales,males,2002-06
Source: WCfH/NPHS from ONS ADDE
0% 10%
Alcoholic liver disease
Fibrosis and cirrhosis of liver(excluding biliary cirrhosis)
Mental and behavioural disordersdue to use of alcohol
Accidental poisoning byand exposure to alcohol
Alcohol induced chonic pancreatitis
Others
20%
63.1%
23.0%
7.6%
3.2%
1.2%
0.4%
30% 40% 50% 60% 70%
A profile of alcohol and health in Wales
21

Figure 18 shows the alcohol-related mortality rates for males by local authority for the years 2002-2006. The rates for Monmouthshire and Powys are lower than the Welsh average of 16.6 per 100.000 people. Cardiff has a higher rate than the Welsh average, but other local
authorities with smaller populations have higher rates but are not statistically significantly different. Merthyr Tydfil has the highest rate at 23.2 per 100,000, nearly three times the rate for Powys at 8.3.
Figure18:Alcohol-relatedmortality,Europeanage-standardisedrate(EASR)per100,000,rankedlocalauthorities,males,2002-06
0
5
10
15
20
25
30
35
Pow
ys
Mon
mou
thsh
ire
Torf
aen
Gw
yned
d
Cere
digi
on
Caer
phill
y
New
port
Flin
tshi
re
Isle
of
Angl
esey
Blae
nau
Gw
ent
The
Vale
of
Gla
mor
gan
Pem
brok
eshi
re
Nea
th P
ort
Talb
ot
Den
bigh
shir
e
Rhon
dda
Cyno
n Ta
ff
Wre
xham
Swan
sea
Brid
gend
Card
iff
Carm
arth
ensh
ire
Conw
y
Mer
thyr
Tyd
fil
Rate
per
100
,000 Wales rate = 16.6
Source: WCfH/NPHS from ONS ADDE MYE
A profile of alcohol and health in Wales
22

Figure 19 shows the percentage of female alcohol-related deaths by condition. It shows that nearly two thirds of the alcohol-related deaths in females (63.0%) are due to alcoholic liver disease and a quarter of these deaths (25.3%) are due to fibrosis and cirrhosis of the liver.
Figure19:Percentageofalcohol-relateddeathsbycondition,Wales,females,2002-06
Source: WCfH/NPHS from ONS ADDE
0% 10%
Alcoholic liver disease
Fibrosis and cirrhosis of liver(excluding biliary cirrhosis)
Mental and behavioural disordersdue to use of alcohol
Accidental poisoning byand exposure to alcohol
Chronic hepatitis nec
Others
20%
63.0%
25.3%
5.9%
2.9%
1.8%
0.2%
30% 40% 50% 60% 70%
A profile of alcohol and health in Wales
23

Figure 20 shows the alcohol-related mortality rates for females by local authority for the years 2002-2006. The rate for Monmouthshire is lower than the Welsh average of 8.5
per 100,000 people, whereas Conwy has a significantly higher rate than the Welsh average. Alcohol-related mortality by deprivation is discussed in Section 6.
Figure20:Alcohol-relatedmortality,Europeanage-standardisedrate(EASR)per100,000,rankedlocalauthorities,females,2002-06
0
2
Mon
mou
thsh
ire
Brid
gend
Pem
brok
eshi
re
Nea
th P
ort
Talb
ot
Torf
aen
Carm
arth
ensh
ire
New
port
Cere
digi
on
Flin
tshi
re
Card
iff
The
Vale
of
Gla
mor
gan
Pow
ys
Gw
yned
d
Wre
xham
Rhon
dda
Cyno
n Ta
ff
Swan
sea
Den
bigh
shir
e
Caer
phill
y
Mer
thyr
Tyd
fil
Blae
nau
Gw
ent
Isle
of
Angl
esey
Conw
y
Rate
per
100
,000 Wales rate = 8.5
4
6
8
10
12
14
16
18
20
Source: WCfH/NPHS from ONS ADDE MYE
A profile of alcohol and health in Wales
24

4.2Alcohol-attributablemortalityAlcohol-attributable mortality is a wider definition than alcohol-related mortality reported in Section 4.1. It also includes deaths due to conditions which are in part attributable to alcohol and uses population attributable fractions to estimate alcohol-attributable deaths. Details on the definition and method can be found in Appendix 2.
Figure 21 shows the trend in alcohol-attributable mortality for males and females between 2001 and 2006. It shows that the
rate for males was higher than for females, and that the rate over time for females has been consistent. Although there are small fluctuations in the rate for males, there appears to be little change over the six years examined.
The rate for males in Wales in 2006 was 42.0 per 100,000, slightly higher than in England with a rate of 39.8. For females the corresponding rate for Wales was 17.5 per 100,000 compared to 16.2 for England, but this very small difference is unlikely to be statistically significant.
Figure21:Trendinalcohol-attributablemortality,annualEuropeanage-standardisedrate (EASR)per100,000bysex,Wales,2001-06
Source: WCfH/NPHS from ONS ADDE MYE using attributable fractions (see Appendix 2)
0
5
10
15
20
25
30
35
40
45
50
2001 2002 2003 2004 2005 2006
Males Females
Rate
per
100
,000
A profile of alcohol and health in Wales
25

Figure 22 shows the alcohol-attributable mortality rates for males for local authorities in Wales. The rate for males in Wales was 41.6 per 100,000 (2002 – 2006) and rates for Conwy and Carmarthenshire are significantly higher than the Wales average, compared to those for Monmouthshire and Powys which were
significantly lower. The alcohol-attributable mortality rates for females are displayed in Figure 23. The chart shows that the rate for females in Wales is 17.1 per 100,000 (2002 – 2006) with rates in Conwy significantly higher than the Wales average, and the rates in Monmouthshire significantly lower.
Figure22:Alcohol-attributablemortality,Europeanage-standardisedrate(EASR)per100,000,males,rankedbylocalauthority,2002-06
0
10
20
30
40
50
60
70
Mon
mou
thsh
ire
Pow
ys
Cere
digi
on
Torf
aen
Isle
of
Angl
esey
New
port
Gw
yned
d
Caer
phill
y
Flin
tshi
re
Card
iff
The
Vale
of
Gla
mor
gan
Blae
nau
Gw
ent
Rhon
dda
Cyno
n Ta
ff
Brid
gend
Swan
sea
Wre
xham
Den
bigh
shir
e
Nea
th P
ort
Talb
ot
Carm
arth
ensh
ire
Pem
brok
eshi
re
Conw
y
Mer
thyr
Tyd
fil
Rate
per
100
,000
Wales rate = 41.6
Source: WCfH/NPHS from ONS ADDE MYE using attributable fractions (see Appendix 2)
A profile of alcohol and health in Wales
26

Figure23:Alcohol-attributablemortality,Europeanage-standardisedrate(EASR)per100,000,females,rankedbylocalauthority:2002-06
0
5
10
15
20
25
30
35
Mon
mou
thsh
ire
Torf
aen
Nea
th P
ort
Talb
ot
Carm
arth
ensh
ire
New
port
Brid
gend
Card
iff
Pem
brok
eshi
re
Flin
tshi
re
Gw
yned
d
The
Vale
of
Gla
mor
gan
Pow
ys
Cere
digi
on
Caer
phill
y
Rhon
dda
Cyno
n Ta
ff
Swan
sea
Wre
xham
Isle
of
Angl
esey
Blae
nau
Gw
ent
Den
bigh
shir
e
Mer
thyr
Tyd
fil
Conw
y
Rate
per
100
,000 Wales rate = 17.1
Source: WCfH/NPHS from ONS ADDE MYE using attributable fractions (see Appendix 2)
A profile of alcohol and health in Wales
27

5. Admissions to hospitalHospital admissions data are useful both as an indicator of the level of alcohol associated harm in the population and also, of course, as an indicator of the burden placed on health services. The data included here relate to hospital admissions which are classed as:
• ‘inpatients’- emergency or elective admissions involving at least one overnight stay; or
• day cases - elective admissions where the patient is admitted during the day with the intention of receiving care but where no overnight stay is required.
The data exclude attendance at outpatient clinics and, importantly, accident and emergency (A&E) units. The data also, of course, exclude GP consultations. For this reason, the data will underestimate the true level of illness and health service use associated with alcohol. At the time of writing a new routine source of A&E attendance data called the Emergency Department Data Set (EDDS) is due to start collecting data from all Welsh A&E Units in April 2009. EDDS data will include information on the reason for the attendance, for example, whether it is alcohol-related.
As with the mortality analysis contained within section four of this report, the analysis of admissions has been undertaken for alcohol-related admissions, that is for diagnoses which are deemed to be entirely due to alcohol, and for alcohol attributable admissions, that is where the admission is either entirely or partially due to alcohol. Further information regarding the methodology is provided in the following sections and in Appendix 2.
5.1Alcohol-relatedhospitaladmissions Alcohol-related admissions include inpatient and day case admissions where there is any mention of one or more of the diagnoses specified by the ONS as being due to alcohol
such as, for example, alcoholic liver disease (see Appendix 2 for the full list of diagnoses). Since there are many other conditions requiring admission to hospital that are partly due to alcohol, the data will not reflect the true burden of alcohol in terms of population health and health services. Also, as mentioned above, since the data refer only to inpatients and day cases they focus on the more severe end of the spectrum of alcohol-related harm. Nevertheless, the data are still of value both for comparisons between areas and over time. The average annual number of alcohol-related hospital admissions for residents of Wales between 2002 and 2006 was 8,403 for males and 4,512 for females representing around one and a half per cent of all admissions. In children aged under 16 more girls were admitted than boys, with 215 boys and 295 girls admitted for alcohol-related conditions in 2006.
Figure 24 shows the trend in the age-standardised rate for alcohol-related hospital admissions in Wales for the period 1999 to 2006. It is clear that, in both females and males, rates have increased. It is not possible to say for certain whether this is due to a genuine increase in alcohol-related illness or other factors such as greater awareness of these conditions among medical staff composing patient notes or an increased tendency to admit patients with certain diagnoses.
Figure 25 shows a breakdown of the alcohol-related conditions for which males resident in Wales were admitted between 2002 and 2006. The chart shows the proportion (percentage) of alcohol-related admissions each condition accounts for. The largest condition was mental and behavioural disorders due to alcohol that accounted for over 60 per cent of admissions in males. The majority of admissions for this condition, when further broken down, are due to acute intoxication, dependence syndrome, harmful use and withdrawal state. Other major conditions were alcoholic liver disease and intentional self-poisoning due to alcohol.
A profile of alcohol and health in Wales
28

Figure24:Trendinalcohol-relatedhospitaladmissionsinWalesresidents,Europeanage-standardisedrate(EASR)per100,000bysex,1999-2006
Source: WCfH/NPHS from HSW (PEDW), ONS (MYE)
Males Females
Rate
per
100
,000
0
100
200
300
400
500
600
700
800
1999 2000 2001 2002 2003 2004 2005 2006
Figure25:Percentageofalcohol-relatedhospitaladmissionsbycondition,Wales,males,2002-06
Source: WCfH/NPHS from HSW (PEDW)
0% 10%
Alcoholic gastritis
Alcoholic cardiomyopathy
Chronic hepatitis
Degeneration of nervous systemdue to alcohol
Alcoholic polyneuropathy
Poisoning by & exposureto alcohol, undet.intent
20%
1.2%
0.6%
0.3%
0.2%
0.1%
30% 40% 50% 60% 70% 80% 90% 100%
Mental and behavioural disordersdue to use of alcohol
Alcoholic liver disease
Intentional self-poisoningby & exposure to alcohol
Chronic pancreatitis (alcohol-induced)
Fibrosis and cirrhosis of liver
Accidental poisoningby & exposure to alcohol
62.7%
16.8%
9.4%
3.3%
3.1%
1.9%
0.3%
A profile of alcohol and health in Wales
29

Figure26:Percentageofalcohol-relatedhospitaladmissionsbycondition,Wales, females,2002-06
Source: WCfH/NPHS from HSW (PEDW)
0% 10%
Chronic hepatitis
Alcoholic gastritis
Degeneration of nervoussystem due to alcohol
Poisoning by & exposureto alcohol, undet.intent
Alcoholic cardiomyopathy
Alcoholic polyneuropathy
20%
1.2%
0.8%
0.2%
0.1%
0.1%
30% 40% 50% 60% 70% 80% 90% 100%
Mental and behavioural disordersdue to use of alcohol
Intentional self-poisoning by& exposure to alcohol
Alcoholic liver disease
Fibrosis and cirrhosis of liver
Accidental poisoningby & exposure to alcohol
Chronic pancreatitis (alcohol-induced)
51.2%
21.0%
16.3%
4.4%
3.0%
1.4%
0.2%
Figure 26 shows the equivalent information for females. A similar pattern is exhibited with mental and behavioural disorders due to alcohol accounting for over 60 per cent of admissions and a breakdown of
‘sub-categories’ similar to males. However, the proportion of admissions due to intentional self-poisoning due to alcohol was more than twice as high in females compared with males.
A profile of alcohol and health in Wales
30

Figure27:Alcohol-relatedhospitaladmissions,age-specificrate(ASR)per100,000, Wales,2002-06
0
200
400
600
800
1000
10–1
5
Rate
per
100
,000
16–1
9
20–2
4
25–2
9
30–3
4
35-3
9
40-4
4
45–4
9
50–5
4
55-5
9
60-6
4
64–6
9
70–7
4
75–7
9
80–8
4
85+
MalesFemales
Source: WCfH/NPHS from HSW (PEDW), ONS (MYE)
Figure 27 shows the age-specific rates for alcohol-related admissions for males and females in Wales for the period 2002-06. The chart shows an ‘n’ shaped pattern, the middle-aged groups having the highest rates.
With the notable exception of the 10-15 year old age group, males exhibit higher rates than females.
A profile of alcohol and health in Wales
31

Figure 28 shows the age-standardised rate per 100,000 for alcohol-related hospital admissions for local authorities in Wales. Rates vary considerably, ranging from under 400 per 100,000 in Ceredigion to almost 900 in Blaenau Gwent. The four areas with the lowest rates for this indicator tend to exhibit lower than average rates for adverse health in general,
however other areas which tend to have poor health overall such as Rhondda Cynon Taff and Caerphilly show alcohol-related hospital admission rates which are similar to the Wales average. Conversely, there are some areas with better than average health overall such as Conwy and Denbighshire which exhibit a high rate for this indicator.
Figure28:Alcohol-relatedhospitaladmissions,Europeanage-standardisedrate(EASR) per100,000,rankedlocalauthorities,males,2002-06
0
100
Cere
digi
on
Pow
ys
Mon
mou
thsh
ire
The
Vale
of G
lam
orga
nFl
ints
hire
Rhon
dda
Cyno
n Ta
ff
Card
iff
Wre
xham
Torf
aen
Carm
arth
ensh
ire
Caer
phill
y
Brid
gend
Gw
yned
d
Pem
brok
eshi
re
New
port
Isle
of
Angl
esey
Nea
th P
ort
Talb
ot
Mer
thyr
Tyd
fil
Swan
sea
Den
bigh
shir
e
Conw
y
Blae
nau
Gw
ent
Rate
per
100
,000 Wales rate = 575
200
300
400
500
600
700
800
900
1000
Source: WCfH/NPHS from HSW (PEDW), ONS (MYE)
A profile of alcohol and health in Wales
32

Figure 29 shows the equivalent data for females. Across all areas the rate in females is much lower than in males (Figure 28). The difference between Monmouthshire and its neighbour, Blaenau Gwent, is stark, the rate being more than twice as high in Blaenau Gwent. In general, however, the pattern shown does not reflect the classic divide between
the more deprived valley areas and their less deprived counterparts. Rhondda Cynon Taff, for example has low rates whilst in Conwy rates are much higher than the Wales average. A similar pattern was also found for alcohol-related mortality where Conwy and Denbighshire had high rates for both males and females (see Section 4.1).
Figure29:Alcohol-relatedhospitaladmissions,Europeanage-standardisedrate(EASR) per100,000,rankedlocalauthorities,females,2002-06
0
100
200
300
400
500
600
700
Mon
mou
thsh
ire
Flin
tshi
re
Rhon
dda
Cyno
n Ta
ff
Cere
digi
on
Card
iff
Brid
gend
Pow
ys
Isle
of
Angl
esey
Caer
phill
y
Pem
brok
eshi
re
The
Vale
of
Gla
mor
gan
Wre
xham
Torf
aen
Nea
th P
ort
Talb
ot
Swan
sea
New
port
Carm
arth
ensh
ire
Mer
thyr
Tyd
fil
Gw
yned
d
Den
bigh
shir
e
Conw
y
Blae
nau
Gw
ent
Rate
per
100
,000
Wales rate = 297
Source: WCfH/NPHS from HSW (PEDW), ONS (MYE)
A profile of alcohol and health in Wales
33

5.2Alcohol-attributablehospitaladmissions As with the analysis of mortality in Section 4.2, alcohol-attributable hospital admissions give a fuller picture of the extent of harm and burden placed on health services due to alcohol. This is because, as well as including conditions which are entirely due to alcohol consumption, conditions which are partially due to alcohol are taken into account. As such, data showing alcohol-attributable hospital admissions are estimates which are derived using the methods developed by the North West Public Health Observatory (NWPHO); please refer to Appendix 2 for details. The average annual number of alcohol-attributable hospital admissions for residents of Wales
between 2002 and 2006 was 27,290 for males and 17,574 for females representing around five per cent of all admissions.
Figure 30 shows the trend in the age-standardised rate for alcohol-attributable hospital admissions in Wales for the period 1999 to 2006. It is clear that in both females and males, rates have increased. Due to the fact that the data are modelled using the method developed by NWPHO it is difficult to say with certainty that the trend is due directly to increased consumption of alcohol. The trend shown is in line with that for alcohol-related admissions (Section 5.1), however, it does not reflect the trend in alcohol-attributable deaths (Section 4) which has not shown any increase.
Figure30:Trendinalcohol-attributablehospitaladmissionsinWalesresidents,European age-standardisedrate(EASR)per100,000bysex,1999-2006
Source: WCfH/NPHS from HSW (PEDW), ONS (MYE)
0
500
1000
1500
2000
2500
1999 2000 2001 2002 2003 2004
Males Females
2005 2006
Rate
per
100
,000
A profile of alcohol and health in Wales
34

Figure 31 shows the age-specific rates for alcohol-attributable admissions for males and females in Wales for the period 2002-06. The chart shows how rates increase sharply with age. The rise with age in males is greater: rates in males and females in the younger age groups are not dissimilar; however, by age 85+ the rate for males is almost double that for females.
The pattern exhibited here is markedly different from the age specific rates for alcohol-related admissions. This is due to the fact that alcohol-attributable admissions include a number of high volume conditions which are strongly associated with age, for example hypertension (high blood pressure).
Figure31:Alcohol-attributablehospitaladmissions,age-specificrate(ASR)per100,000,Wales,2002-06
0
2000
1000
3000
5000
7000
4000
6000
8000
10–1
5
Rate
per
100
,000
16–1
9
20–2
4
25–2
9
30–3
4
35-3
9
40-4
4
45–4
9
50–5
4
55-5
9
60-6
4
65–6
9
70–7
4
75–7
9
80–8
4
85+
MalesFemales
Source: WCfH/NPHS from HSW (PEDW), ONS (MYE)
A profile of alcohol and health in Wales
35

Figure32:Alcohol-attributablehospitaladmissions,Europeanage-standardisedrate (EASR)per100,000,rankedlocalauthorities,males,2002-06
0
500
1000
1500
2000
2500
Pow
ys
Cere
digi
on
Mon
mou
thsh
ire
Card
iff
Gw
yned
d
Flin
tshi
re
Isle
of
Angl
esey
Wre
xham
New
port
Rhon
dda
Cyno
n Ta
ff
The
Vale
of
Gla
mor
gan
Caer
phill
y
Torf
aen
Den
bigh
shir
e
Conw
y
Pem
brok
eshi
re
Carm
arth
ensh
ire
Swan
sea
Nea
th P
ort
Talb
ot
Brid
gend
Mer
thyr
Tyd
fil
Blae
nau
Gw
ent
Rate
per
100
,000
Wales rate = 1671
Source: WCfH/NPHS from HSW (PEDW), ONS (MYE)
Figure 32 shows the male age-standardised rate per 100,000 for alcohol attributable hospital admissions for local authorities in Wales. The rate varies considerably ranging from 1162 per 100,000 in Powys to 2307 in Blaenau Gwent.
In comparison with alcohol-related admissions in males (Figure 27) the data show a slightly more typical pattern of ill-health with rates tending to be higher in urban and South Wales valley local authorities than in rural areas.
A profile of alcohol and health in Wales
36

Figure 33 shows the equivalent data for females. Rates are lower in females than males across all local authorities, however, once again, they vary considerably from 740 in Ceredigion to 1387 in Blaenau Gwent where the rate is noticeably higher than in any other local authority.
Figure33:Alcohol-attributablehospitaladmissions,Europeanage-standardisedrate (EASR)per100,000,rankedlocalauthorities,females,2002-06
0
200
400
600
800
1000
1200
1400
Cere
digi
on
Pow
ys
Card
iff
Mon
mou
thsh
ire
Gw
yned
d
Isle
of
Angl
esey
The
Vale
of G
lam
orga
n
Rhon
dda
Cyno
n Ta
ff
Wre
xham
New
port
Flin
tshi
re
Pem
brok
eshi
re
Torf
aen
Caer
phill
y
Den
bigh
shir
e
Carm
arth
ensh
ire
Conw
y
Swan
sea
Nea
th P
ort
Talb
ot
Brid
gend
Mer
thyr
Tyd
fil
Blae
nau
Gw
ent
Rate
per
100
,000
Wales rate = 937
1600
Source: WCfH/NPHS from HSW (PEDW), ONS (MYE)
A profile of alcohol and health in Wales
37

6.Socio-economicpatternsinalcoholconsumptionandalcohol-relatedmortalityIt is important to investigate whether drinking patterns and alcohol-related harm are related to deprivation, and whether alcohol use is a potential source of health inequalities.
Figure 34 shows the distribution of reported binge drinking and drinking above guidelines from the Welsh Health Survey across deprivation fifths as measured by the Welsh Index of Multiple Deprivation 2005 (WIMD). The chart shows that the percentages are only slightly different between the deprivation
fifths, suggesting that both binge drinking and drinking above guidelines are not very strongly related to deprivation.
Reported drinking above guidelines is slightly higher in the least deprived areas at 39% compared to the others, although this may not be statistically significant. Binge drinking appears slightly lower in the two least deprived fifths, particularly the second least deprived fifth, but statistical significance could not be established.
Figure34:PercentageofpersonswhoreportedbingedrinkinganddrinkingaboveguidelinesinthepastweekbyWIMDfifth(age-standardised)
Source: WHS 2007
0%
5%
10%
15%
20%
25%
30%
35%
40%
45%
Above guidelinesBinge
1 (least deprived)
2 3 4 5 (mostdeprived)
A profile of alcohol and health in Wales
38

Figure35:Alcohol-relatedmortality,Europeanage-standardisedrate(EASR)per100,000, byWIMDfifth,persons,2002-06
Source: WCfH/NPHS from ONS ADDE MYE, WAG (WIMD)
0
5
10
15
20
25
Rate
per
100
,000
1 (least deprived)
2 3 4 5 (mostdeprived)
Wales rate = 12.4
In contrast to alcohol consumption, there is a striking socio-economic pattern in both alcohol-related mortality and alcohol-attributable mortality. The alcohol-related mortality rate in the most deprived communities of Wales was 22.0 per 100,000 in 2002-2006, more than three times higher than 6.2 in the least deprived areas. The alcohol-related rate (see Figure 35) was significantly higher in the two most deprived fifths compared to the Wales rate of 12.4 per 100,000.
Similarly, the alcohol-attributable mortality rate (see Figure 36) in the most deprived communities was 43.8, more than twice the rate of 18.0 in the least deprived areas. Although the rate increase from the least deprived to the most deprived areas is steeper in alcohol-related mortality than in alcohol-attributable mortality, this pattern suggests that both alcohol-related and alcohol-attributable mortality are strongly related to deprivation as measured by the WIMD.
A profile of alcohol and health in Wales
39

It is not clear why alcohol consumption appears to be similar in the least and most deprived communities, whilst alcohol-related mortality is substantially higher in more deprived areas compared to least deprived areas. There may be differences in individuals’ binge drinking in the least and most deprived areas, for example the regularity of binge drinking or the actual units consumed. Figures for the heaviest drinkers amongst the binge drinkers would have to be analysed, but these are not available. It also may be that underestimation of consumption in surveys
(see Section 3.6) is proportionally greater in deprived areas, for example the under-representation of heavy drinkers. Further investigation would be required, however, to draw any firm conclusions.
There may be other factors contributing to the pattern in alcohol-related mortality rates, for example poorer general health and differences in individuals seeking help or treatment. It is clear, however, that deprived areas experience a greater burden of alcohol-related harm, suggesting that alcohol consumption is a source of health inequalities.
Figure36:Alcohol-attributablemortality,Europeanage-standardisedrate(EASR)per100,000,byWIMDfifth,persons,2002-06
Source: WCfH/NPHS from ONS ADDE MYE using fractions (see Appendix 2), WAG (WIMD)
0
10
20
30
40
50
Rate
per
100
,000
1 (least deprived)
2 3 4 5 (mostdeprived)
Wales rate = 28.8
A profile of alcohol and health in Wales
40

7.Alcohol-relatedcrimeAs well as potentially causing harm to the individual who is drinking, alcohol consumption can also have an effect on wider society through alcohol-related crime.
These crimes include violent behaviour, anti-social behaviour, disorderly behaviour, acquisitive crime and criminal damage (Finney et al., 2003). Data is available on recorded crimes from the Home Office and also on perceptions of crime from the British Crime Survey (BSC).
7.1Perceptionsofalcohol-related crime The British Crime Survey (BCS) asks respondents about their experience and perceptions of crime, including major causes of crime. Figure 37 shows the perceived major causes of crime in Britain from the British Crime Survey (2007/8). The chart illustrates that drugs and lack of discipline from parents are the most perceived major causes of crime in Britain. Approximately 50% of individuals perceive alcohol to be a major cause of crime in Britain, the third greatest cause of crime according to the survey.
Figure37:Percentageofperceivedmajorcausesofcrime,2007/08
0
10%
20%
30%
40%
50%
60%
70%
Dru
gs
Lack
of
disc
iplin
efr
om p
aren
ts
Alco
hol
Too
leni
ent
sent
enci
ng
Lack
of
disc
iplin
efr
om s
choo
l
Brea
kdow
n of
fam
ily
Too
few
pol
ice
Une
mpl
oym
ent
Pove
rty
80%
Source: BCS 2007/08
A profile of alcohol and health in Wales
41

Figure 38 shows the percentage of violent incidents where the victim believed the offender was under the influence of alcohol, by type of offence. It illustrates that a high proportion of victims perceived those offenders committing violence, wounding or assault with minor injury to be under the influence of alcohol. The proportion of those perceiving the offender not to be under the influence of
alcohol was higher for robbery and for assault with no injury, but only slightly higher for the latter. These data illustrate that the influence of alcohol can be at the very least a perceived major factor in violent incidence, however, care should be used in drawing conclusions from these data as they are based on perceptions of the victim alone.
Figure38:Percentageofviolentincidentswherethevictimbelievedtheoffender(s)to beundertheinfluenceofalcohol,2007/08
0%
10%
20%
30%
40%
50%
60%
70%
All violence Wounding Assault withminor injury
Assault withno injury
Robbery
Yes
No
Don’t know
Type of offence
Source: BCS 2007/08
A profile of alcohol and health in Wales
42

7.2 Violent crime attributable to alcohol by local authority Alcohol is implicated in many crimes, but it is not consistently recorded whether Alcohol was involved in any particular crime. It is estimated that 37% of violent crime is attributable to alcohol, based on urine samples provided on arrest (Deakon et al, 2008), suggesting that over 18,000 violent crimes in Wales in the year 2007/08 are estimated to be attributable to alcohol. Based on this proportion and recorded violent crime, rates per 1,000 population of violent crime against the person can be calculated.
These rates are published annually for England (Deakon et al, 2008).
Figure 39 shows these rates for Wales by local authority in 2007/08 and the chart suggests that the higher rates can be found in Newport and Cardiff, two predominantly urban areas that accommodate large numbers of revellers from within and the surrounding areas. Lower rates can be found in rural areas such as Powys and Ceredigion. It should be noted however, that these data are derived from estimates of the total violent crimes against a person and should therefore be interpreted with caution.
Figure39:Violentcrimeattributabletoalcohol,rateper1,000,2007/08
0
2
4
6
8
10
12
Pow
ys
Cere
digi
on
Carm
arth
ensh
ire
Mon
mou
thsh
ire
Brid
gend
Flin
tshi
re
Nea
th P
ort
Talb
ot
The
Vale
of G
lam
orga
nIs
le o
f An
gles
ey
Torf
aen
Pem
brok
eshi
re
Conw
y
Blae
nau
Gw
ent
Caer
phill
y
Rhon
dda
Cyno
n Ta
ff
Swan
sea
Gw
yned
d
Den
bigh
shir
e
Wre
xham
Mer
thyr
Tyd
fil
Card
iff
New
port
Rate
per
1,0
00
Wales rate = 6.1
Source: WCfH/NPHS from Home Office 2007/08 and ONS MYE
A profile of alcohol and health in Wales
43

7.3DrivingundertheinfluenceofalcoholDriving whilst under the influence of alcohol can impair an individual’s judgement and thus their ability to drive safely. The result can be slower reaction times and an inability to judge distance and speed as effectively. Increased alcohol levels can increase an individual’s confidence which can lead to more risk taking when driving (Deakon et al, 2008).
The data illustrated in Figure 40 show the proportion of people being involved in an accident and testing positive for alcohol by police force area. The proportion of individuals testing positive for alcohol in the blood following an accident was highest in South Wales with approximately 4% of results. The lowest was Dyfed Powys police force with just over 2%, although percentages in all forces were generally low.
7.4SexualassaultDue to the highly sensitive nature of sexual assaults, accurate estimates of the number of incidents can be difficult to ascertain. This is complicated by an overlap between serious sexual assault and partner abuse.
The influence of alcohol and drugs on sexual assault has been recorded in the British Crime Survey (BCS) which suggested that approximately 35% of sexual assault victims believed the offender was under the influence of alcohol (Povey et al, 2008).
Figure40:Percentageofdriversinvolvedinaccidents:positivebreathtestresultsbypoliceforce,2006
Source: WAG
0%
1%
2%
3%
4%
5%
Dyfed PowysPolice Force
GwentPolice Force
North WalesPolice Force
South WalesPolice Force
Wales = 3.4
A profile of alcohol and health in Wales
44

8.Otherdata
8.1Referralsfortreatmentofalcohol misusePeople with an alcohol problem can be referred for treatment, either through self-referral or through organisations including GPs. The Welsh National Database for Substance Misuse (WNDSM) contains details relating to people referred to treatment agencies for drug and alcohol problems since 2005. There were 15,301 referrals for alcohol misuse in Wales in 2007-08 (55% of all referrals). The most common source of referrals for alcohol was self-referral at 32% (Welsh Assembly Government, 2008).
Individuals can leave and subsequently return to treatment within a given year and may be counted more than once as a referral. Many individuals misuse a variety of substances and may only report some of them. The figures for misusing a particular substance such as alcohol may therefore be underestimated.
Figure 41 shows the number of referrals seen for alcohol misuse by age group for the year 2007/08. The data show that males have a higher number of referrals than females and that the highest number for males was amongst the 30-39 age group and for females amongst the 40-49 age group. There were 1602 referrals of age 19 and younger.
Figure41:Numberofreferralsseenattreatmentagenciesforalcoholmisusebyage group,Wales,2007/08
Source: WAG, Welsh National Database for Substance Misuse
0
500
1000
1500
2000
2500
3000
MalesFemales
Num
ber
of r
effe
rals
Under 12 12-19 20–29 30–39 40–49 50–59 60+
A profile of alcohol and health in Wales
45

Figure 42 shows the standardised rate per 100,000 for referrals seen for alcohol misuse by local authority in Wales for 2007-8. The chart shows that Rhondda Cynon Taff, Merthyr Tydfil, Denbighshire and Swansea have the highest rates while Monmouthshire has the lowest rate.
Caution should be used when interpreting these data as there are some technical difficulties with the system in some areas, and in addition data are self-reported. Also, the rates shown are those for referrals seen in any particular local authority and may not be a measure of those in need for treatment in the particular area.
Figure42:Referralsseenforalcoholmisuse,EuropeanAge-standardisedRate(EASR)per100,000,rankedbylocalauthority,2007-2008
0
100
Mon
mou
thsh
ire
Gw
yned
d
Nea
th,
Port
Tal
bot
Flin
tshi
re
Torf
aen
Carm
arth
ensh
ire
Pow
ys
Isle
of
Angl
esey
Wre
xham
The
Vale
of G
lam
orga
n
Caer
phill
y
Pem
brok
eshi
re
Cere
digi
on
New
port
Brid
gend
Card
iff
Blae
nau
Gw
ent
Conw
y
Swan
sea
Den
bigh
shir
e
Mer
thyr
Tyd
fil
Rhon
dda
Cyno
n Ta
ff
Rate
per
100
,000 Wales rate = 542
200
300
400
500
600
700
800
900
1000
Source: WAG, Welsh National Database for Substance Misuse
A profile of alcohol and health in Wales
46

8.2Benefitclaimantswherethe main medical reason is alcoholism People with a severe alcohol problem may be unable to work, and may be claiming benefits. In May 2007, there were 2,200 (1.1% of the total claimants) people in Wales claiming incapacity benefit (IB) and severe disablement allowance (SDA) where the main medical reason was ‘alcoholism’. Table 4 shows the numbers and percentages of such claimants of the total IB/SDA claimants for Wales,
Scotland and the English regions. Wales has the lowest percentage with 1.1% of the total claimants, whereas Scotland has the highest with 3.1%. This does not necessarily mean that alcoholism is less of a problem in Wales, as this percentage does not take into account the patterns of claims due to other main diagnoses or those which may be eligible but are not claiming this benefit. The definition of ‘alcoholism’ used is considered to be narrow, and may therefore also not include every person in part incapacitated by alcoholism.
Table4:NumberofIncapacityBenefits(IB)andSevereDisablementAllowance(SDA) wheremainmedicalreasonisalcoholisminWales,ScotlandandEnglishregions,May2007
Region AllIB/SDAclaimants (thousands)
Alcoholism (thousands)
Alcoholism as aproportionoftotal claimants
Wales 200.5 2.2 1.1%
Scotland 306.5 9.4 3.1%
English regions
North East 164.7 2.7 1.7%
North West 409.6 8.7 2.1%
Yorkshire and The Humber 239.2 3.8 1.6%
East Midlands 180.9 2.6 1.4%
West Midlands 242.6 3.6 1.5%
East of England 179.2 2.4 1.3%
London 311.5 6.8 2.2%
South East 241.1 4.8 2.0%
South West 198.0 4.3 2.2%
Source: Department for Work and Pensions, 2008
A profile of alcohol and health in Wales
47

9. ConclusionsThis report presents a range of available data on alcohol consumption patterns and harm relating to alcohol, providing evidence for the substantial impact of alcohol on health in Wales.
The extent of drinking in children and young people in Wales is of particular concern. Among 13-year olds in Wales, 23% of boys and 20% of girls reported drinking alcohol at least once a week. Wales had the highest percentage of all 40 countries surveyed in 13-year olds reporting having been drunk more than twice (27% of boys and 26% of girls). There were 1602 referrals for treatment of alcohol misuse in patients of age 19 and younger in 2007/08. In children aged under 16 there were more admissions to hospital in girls were than in boys, with 215 admissions in boys and 295 in girls for alcohol-related conditions in 2006.
Data for harmful/hazardous drinking, although widely used in England, is unfortunately not available for Wales. Hazardous use, in particular, increases the risk of harmful consequences in individuals, despite the absence of any current disorder. It refers to a pattern of use that is of public health significance and it would be advantageous if data for these measures could be developed from Welsh Health Survey data.
Substantial inequalities were found between the most deprived and least deprived communities in the experience of alcohol-related harm. Binge drinking and drinking above guidelines amongst adults is reported to be similar amongst the most and least deprived communities. In contrast, the most deprived areas experience alcohol-related mortality rates which are more than three times higher than those in least deprived areas. This suggests that alcohol consumption is a source of health inequalities.
Comparisons with UK sales estimates of consumption suggest that surveys including the Welsh Health Survey may underestimate alcohol consumption, and that survey results only represent 55-60% of the true consumption figure (Goddard, 2007; Catto, 2008). Whilst there may be underestimation in survey results, survey data are still essential to identify characteristics of those drinking for comparisons between age groups, males and females, or the frequency of drinking, which sales data estimates cannot provide. Survey figures for example for binge drinking in Wales, however, may not be suitable to indicate true consumption levels in the population as a whole.
This report uses two ways of estimating the impact of alcohol on mortality. One is alcohol-related mortality, which is defined by the Office for National Statistics to include only those causes of death most directly linked to alcohol use such as alcoholic liver disease. The second wider definition used is alcohol-attributable mortality, which includes deaths due to conditions in part attributable to alcohol and is widely used in England. Alcohol-attributable deaths accounted for 4.3% of all male deaths in Wales; these untimely deaths could be avoided. There were more than twice as many alcohol-attributable deaths than alcohol-related deaths, and when estimating and monitoring the burden of alcohol on mortality these new indicators of alcohol-attributable harm should also be considered.
The alcohol-related mortality rate for males has almost doubled between the periods 1991-1993 to 2004-2006, although it appears that the rising trend has been slowing for males in recent years. This trend has been levelling out in the latest UK rates release. The rate for Wales in 2007 was slightly higher than the rate for England, and slightly lower than the rate for Northern Ireland. The rate for Scotland was twice the rate for England.
A profile of alcohol and health in Wales
48

The alcohol-attributable mortality rate for males in Wales in 2006 was slightly higher than for England, whilst the corresponding rate for females was similar to England. The trend in alcohol-attributable mortality over time in Wales has been stable between 2001 and 2006.
Hospital admissions data are a useful indicator both of the extent of harm caused at the population level and the burden placed on health services by alcohol consumption. However, as the data do not include A&E or outpatient clinic attendance or, of course, GP consultations, the focus of these data is only on the more severe end of the spectrum of illness.
As with mortality data, hospital admissions information can be analysed according to whether the admission is alcohol-related or alcohol-attributable. The trend in the hospital admission rate is upward for both categories in males and females. Rates are twice as high in males compared with females for alcohol-related admissions and just under twice as high for alcohol-attributable admissions. Analysis of age-specific rates shows that whilst alcohol-related admissions peak in middle age, using the wider definition of alcohol-attributable admissions shows that rates increase sharply with age right through to the 85+ age group.
Alcohol-related and attributable admissions rates vary considerably across Wales. At the local authority level Blaenau Gwent exhibits consistently the highest rates in Wales for both males and females.
As well as potentially causing harm to the individual drinker, alcohol consumption can also have an effect on the wider society through alcohol-related crime. Alcohol was perceived to be a major cause of crime by around half of respondents to the British Crime Survey 2007/08. There were an estimated 18,000 incidents of violent crime attributable to alcohol in Wales in the year 2007/08.
Two mostly urban areas, Newport and Cardiff, had higher estimated rates of violent crime attributable to alcohol, whilst Powys and Ceredigion had lower rates.
This report presents information and data relating to alcohol and health from a number of sources, using the latest methods, and provides evidence for the substantial impact of alcohol use on the health of the people of Wales. It highlights inequalities in the experience of alcohol-related harm between the most and least deprived communities in Wales. Some of its indicators, particularly those for alcohol-attributable harm, are recommended for future monitoring of the burden of alcohol. It is clear that the effect of alcohol use presents a major public health challenge for Wales and the UK.
A profile of alcohol and health in Wales
49

10.ReferencesAnderson P and Baumbert B (2006) Alcohol in Europe, London: Institute of Alcohol Studies.
Breslow and Day (1987) and cited in Woodward M. (1999) Epidemiology - Study Design and Data Analysis, Chapman & Hall.
British Medical Association, BMA Board of Science (2008) Alcohol misuse: tackling the UK epidemic. Available at URL: http://www.bma.org.uk [accessed 20/11/08]
Catto, S (2008) How much are people in Scotland really drinking? Edinburgh: Health Scotland.
Currie C et al. (2008), eds. Inequalities in young people's health: HBSC international report from the 2005/2006 Survey. Copenhagen, WHO Regional Office for Europe, 2008 (Health Policy for Children and Adolescents, No. 5)
Deakon L, Hughes S, Tocque K and Bellis M (2008) Indications of Public Health in the English Regions 8: Alcohol. Liverpool: North West Public Health Observatory, Centre for Public Health, Liverpool John Moores University.
Devis T and Rooney C. (1999). Death certification and the epidemiologist. Health Statistics Quarterly 01, pp.21-33 [online]. Available at: http://www.statistics.gov.uk/downloads/theme_health/HSQ1Book.pdf [Accessed 23rd February 2009]
Department of Health (2007) Safe. Sensible. Social: The next steps in the National Alcohol Strategy. London: Department of Health.
Department of Health (2009) How many units in your drink, know your units, Alcohol Know your limits campaign. Available at URL: http://units.nhs.uk/howMany.html [Accessed 22/01/09]
Fay MP, Feuer EJ (1997) Confidence intervals for directly standardized rates: A method based on the Gamma distribution. Statistics in Medicine 1997;16:791-801
Finney A, Simmons C (2003) Guidance for local partnerships on alcohol-related crime and disorder data. Home Office Development and Practice Report 6. Available at URL: http://www.homeoffice.gov.uk/rds/pdfs2/dpr6.pdf [accessed 24/02/09]
Goddard, E (2007) Obtaining information about drinking through surveys of the general population, National Statistics Methodology Series No. 24, Newport: Office for National Statistics.
The Information Centre (2008) Statistics on alcohol: England 2008. Leeds: The Information Centre. Available at URL: http://www.ic.nhs.uk/pubs/alcohol08 [accessed 22/01/09]
Jones L, Bellis MA, Dedman D, Sumnall H and Tocque K (2008) Alcohol-attributable fractions for England. Alcohol attributable mortality and hospital admissions. Available at URL: http://www.nwph.net/nwpho/Publications/AlcoholAttributableFractions.pdf [accessed 20/11/08]
NPHS (2006) Health Needs Assessment 2006: Substance Misuse. National Public Health Service for Wales. Available at URL: http://www.wales.nhs.uk/sites3/page.cfm?orgId=719&pid=22804 [accessed 22/01/09]
Office for National Statistics (2009) News release – trend in alcohol-related deaths levelling out. Available at URL: http://www.statistics.gov.uk/pdfdir/alc0109.pdf [accessed 24/02/09]
Povey D, Coleman K, Kaiza P, Hoare J & Jansson K (2008) Homicides, Firearm Offences and Intimate Violence 2006/07. Supplementary Volume 2 to Crime in England and Wales 2006/07. Home Office Statistical Bulletin 03/08. Available at URL: http://www.homeoffice.gov.uk/rds/pdfs08/hosb0308.pdf [accessed 22/01/09]
A profile of alcohol and health in Wales
50

Welsh Assembly Government (2007) Alcohol-related deaths in Wales, 2005, Statistical Bulletin, SB 56/2007. Available at URL: http://new.wales.gov.uk/docrepos/40382/40382313/statistics/health/health-2007/sb56-2007?lang=en [accessed 20/11/08]
Welsh Assembly Government (2008) Working Together to Reduce Harm; Performance Management Framework: Substance Misuse in Wales, 2007-08. Cardiff: Wales Assembly Government. Available at URL: http://wales.gov.uk/dsjlg/publications/commmunitysafety/strategy/strategye.pdf?lang=en [accessed 20/11/08]
World Health Organisation (2008) Lexicon of alcohol and drug terms. Available at URL: http://www.who.int/substance_abuse/terminology/who_lexicon/en/index.html [accessed 20/11/08]
A profile of alcohol and health in Wales
51

11. Appendices
Appendix1:DataSources
Annual District Deaths Extract
The Annual District Deaths Extract (ADDE) is supplied by ONS and is based on details from the medical certificate of cause of death and other relevant particulars supplied by informants (usually relatives) to local Registrars. Data in this profile are based on the ‘underlying cause of death’. This is generally the most useful single cause for public health purposes (Devis and Rooney, 1999), and is defined by the World Health Organisation as:
a) the disease or injury that initiated the train of events directly leading to the death; or
b) the circumstances of the accident or violence that produced the fatal injury.
British Beer and Pub Association The British Beer and Pub Association publish an annual Statistical Handbook, containing drinks industry statistics such as sales, consumer expenditure, prices and licensing figures. The latest 35th edition was published in August 2008. Sales data used in this report is published as “UK consumption of alcoholic drink” and are derived from HM Revenue and Customs’ duty clearances for alcohol released for sale and industry figures. These data have been labelled “UK sales data” in this report (Figure 12) as in Catto (2008) to distinguish them from consumption figures sourced from consumer surveys. For international consumption estimates BBPA state that for some countries ‘best estimates’ were used as it was difficult to obtain up-to-date reliable data, however, it was not specified which countries they were. It is therefore unclear how reliable or comparable the individual country estimates are.
GeneralHouseholdSurveyThe General Household Survey is conducted by the Office for National Statistics and provides estimates for England, Scotland and Wales. The survey is used to present a picture of households, families and individuals. It commenced in 1971 and has been conducted annually since, except for breaks to review it in 1997/8 and for re-development work in 1999/2000. It includes questions on drinking behaviour, including amounts consumed on at least one day in the past week. These reported amounts are then matched to categories of binge drinking and drinking above guidelines as listed in Section 2. The unweighted sample size for Wales in 2006 was 888 (compared to 13,783 in the Welsh Health Survey 2005/06).
Since 2006 an improved method of converting volumes of alcohol drunk into alcohol units was introduced in light of changing glass sizes and drinks strength, in parallel to the previous method. The new method generally shows higher percentages than the previous one, and these are shown in the nation comparison in Figures 7 and 8. Using the new method, however, would not allow a comparison in time, and therefore the results using the previous method were used for the trends charts in Figures 9 and 10. http://www.statistics.gov.uk/StatBase/Product.asp?vlnk=5756
HealthBehaviourinSchool-agedChildren(HBSC)The Health Behaviour in School-aged Children study is a cross-national research study conducted in collaboration with the World Heath Organisation (WHO) Regional Office for Europe. It involves 40 countries from across Europe and North America and is conducted every four years. The study is school-based, and in Wales involves a sample of pupils aged around 11, 13 and 15. There are some concerns about bias due to self-reporting and the fact that those not attending school are not covered. The latest report published in 2008 (Currie et al., 2008) covers data for 2005/2006 and contains data from more than 400,000 young people (4,400 in Wales). http://www.hbsc.org
A profile of alcohol and health in Wales
52

InfantFeedingSurveyThe 2005 Infant Feeding Survey is a national survey providing estimates for the four countries of the UK. It covers the incidence, prevalence and duration of breastfeeding and other feeding practices adopted by mothers in the first eight to ten months after their baby was born, together with information about smoking and alcohol use. http://new.wales.gov.uk/docrepos/ 40382/40382313/statistics/health/1104216/infant-feed2005-final.pdf?lang=en
PatientEpisodeDatabaseforWalesThe Patient Episode Database for Wales (PEDW) is managed by Health Solutions Wales (HSW) and provides an electronic record of all inpatient and day case activity for Wales residents in NHS hospitals in Wales, England and elsewhere and for all patients treated in Welsh Trusts. Records within PEDW are based on finished episodes of care under a particular consultant in one health care provider (FCEs). Multiple FCEs may occur within one hospital provider spell (or stay in hospital). Admissions data in this profile are based on the admitting FCE.
WelshHealthSurveyThe Welsh Health Survey is a source of information about the health and health-related lifestyle of people in Wales. It started in 2003/04 and around 15,000 adults participate fully each year. It is nationally representative of people of different ages, sex and geographic area. Respondents to the Welsh Health Survey were asked questions on their drinking habits including how often they drank and how much they drank on the heaviest drinking day in the previous week. Survey results are then published based on the reported amounts and the definitions of binge drinking and drinking above guidelines as listed in section 2. A new improved method of converting volumes of alcohol drunk into alcohol units will be introduced from 2008 in light of changing glass sizes and drinks strength. This may mean that any differences between the Wales results of the GHS (where this has already been implemented, see previous paragraph) and the Welsh Health Survey are likely to be larger in future releases.
The WHS does not include a question on average weekly consumption, but an estimated weekly consumption could be derived using a methodology supplied by the Welsh Assembly Government (Statistical directorate).
Since the latest release of 2007 the period covered was changed to calendar years. In Figure 12 survey results of previous financial years were charted in the year they ended, i.e. results for 2005/2006 were charted as 2006. www.wales.gov.uk/statistics
Appendix 2: Methodology and definitions
Alcohol-relatedmortalityandhospitaladmissions(ONSdefinition)The term ‘alcohol-related’ is not used consistently in publications, but often refers to the definition published by the Office for National Statistics containing those conditions which are most directly related to alcohol.
These conditions are (including ICD-10 codes):
F10*: Mental and behavioural disorders due to use of alcohol
G31.2: Degeneration of nervous system due to alcohol
G62.1: Alcoholic polyneuropathy
I42.6: Alcoholic cardiomyopathy
K29.2: Alcoholic gastritis
K70*: Alcoholic liver disease
K73*: Chronic hepatitis nec (not elsewhere classified)
K74*: Fibrosis and cirrhosis of liver (excluding K74.3 - K74.5 - Biliary cirrhosis)
K86.0: Alcohol induced chronic pancreatitis
X45: Accidental poisoning by and exposure to alcohol
X65: Intentional self-poisoning by and exposure to alcohol
Y15: Poisoning by and exposure to alcohol, undetermined intent
*indicates that any fourth-character classification can be added to the first three characters
A profile of alcohol and health in Wales
53

Public Health Observatories in England publish “alcohol-specific” mortality or hospital admissions, which includes those conditions which are wholly attributable to alcohol i.e. those with alcohol-attributable fractions of 1. There is some overlap with the ONS definition, but there are differences and these measures are not comparable. This report uses alcohol-related measures using the ONS definition.
Alcohol-attributablefractionsA recent report by Liverpool University and the North West Public Health Observatory (NWPHO), commissioned by the Department of Health, published revised alcohol-attributable fractions for mortality and hospital admissions (Jones et al., 2008). Alcohol-attributable fractions (AAFs) were calculated for conditions where there was sufficient evidence in the recent epidemiological literature of a causal relationship between alcohol consumption and the disease or injury (Jones et al., 2008). The authors have published these AAFs for each condition and age group for England (see Jones et al., 2008). Alcohol consumption in Wales is considered to be similar to England, and it is assumed that the AAFs could also be applied to data for Wales, regardless of any differences between local authorities. Fractions are available for age 16 and above, and for ages 15 and under only those conditions entirely attributable to alcohol (fractions of 1) were included. The 36 conditions include certain cancers, stroke, and road traffic accidents. For example, the fraction for cancer of the lip, oral cavity and pharynx in males aged 25-34 is 0.5, with half of the deaths linked to alcohol, whilst alcoholic liver disease has a fraction of 1 for all age groups. Whilst applying these fractions to mortality or hospital admissions data may be considered experimental, these indicators, widely used in England, provide us with an additional method of estimating harm attributable to alcohol as well as comparisons to England. When using the results, it has to be made clear that they are estimates. These fractions were also used to calculate the updated National indicator on hospital admissions for England, and detailed guidance is due to be published soon.
A profile of alcohol and health in Wales
54

Alcohol-attributablemortalityAlcohol-attributable mortality includes deaths due to causes both wholly and in part linked to alcohol, using alcohol-attributable fractions as described in the previous section. Rates were calculated to be comparable with English indicators and as advised by NWPHO all positive fractions were applied to deaths data, because this indicator relates to alcohol-related harm
Table5:Averageweeklyalcoholconsumptioninunits:UKsalesdata,GeneralHouseholdsurvey(GHS)andWelshHealthSurvey(WHS)
Year UK per person sales estimate 15+
Averageweeklyconsumption: GHS,GreatBritain16+
Estimated weekly consumption: WHSWales16+
1996 18.8 10.7
1997 19.2
1998 18.8 11.5
1999 19.8
2000 20.0 12.0
2001 20.6 12.1
2002 21.2 12.1
2003 21.5
2004 22.1 10.9
2005 21.7 10.8 10.7
2006 21.2 10.2 10.6
2007 21.5 10.7
Source: BBPA, GHS (1992-1996 data is unweighted), WCfH/NPHS from WHS (03/04, 04/05, 05/06 listed as 2004, 2005, 2006), 2007 WHS figure from WAG
A profile of alcohol and health in Wales
55

Table6:Alcoholconsumptionperheadinleadingcountries(BBPAestimates)
Litresperheadofpurealcohol
Sweden 5.7
Canada 6.6
USA 7
Finland 7.5
Australia 7.6
Netherlands 7.8
Italy 8.1
UK 8.3
Republic of Ireland 8.6
France 10
Germany 10.2
Spain 10.2
Czech Republic 12.4
Source: BBPA
Table7:Alcohol-relatedmortality,rateper100,000,UKnations,persons
2004 2007
England 11 12
Wales 13 14
Northern Ireland 15 16
Scotland 26 25
Source: ONS, GRO
A profile of alcohol and health in Wales
56