alcohol use and abuse in bhutan - · pdf file1.2 social, cultural and economic significance of...
TRANSCRIPT

ALCOHOL USE AND ABUSE IN BHUTAN
Lham Dorji
Monograph No. 1
National Statistics Bureau

The Use and Abuse of Alcohol in Bhutan ISBN No: 978-99936-28-12-5 Publications Number: Monograph Series I
Copyright Statements: © National Statistics Bureau of Bhutan
This work is copyright. No part may be reproduced by any process without prior written permission from the National Statistics Bureau (NSB) of Bhutan. Requests and inquiries concerning reproduction and rights should be addressed to the National Statistics Bureau, Socio-Economic Research and Analysis Division.
Errors or misinterpretations and all viewpoints expressed
are the sole responsibility of the author.

About Monograph Series (MS)
The Monograph Series is the initiative of the Socio-Economic Research and Analysis Division (SERAD), National Statistics Bureau of Bhutan. The MS will be published on a regular basis covering socio-economic issues of relevance to Bhutan. Any individuals or researchers interested in socio-economic research are encouraged to contribute their research papers or reports. We will be happy to publish
them if the review finds them of high standard and relevant to our country.

Contents
IV
Table of Contents
List of Tables .................................................................... VII List of Figures .................................................................... IX List of Abbreviations .......................................................... XI Foreword .......................................................................... ….i Executive Summary ........................................................... iii Acknowledgement .............................................................. ix Introduction ....................................................................... 1 GNH accounts ..................................................................... 4 Steps towards creating GNH accounts ................................. 7 CHAPTER I ........................................................................ 10
1.1 History and Context of Alcohol Use in Bhutan ............ 10 1.1. Origin of alcohol use in Bhutan .......................................... 10 1.2 Social, cultural and economic significance of alcohol ........... 12 1.3 The ills of alcoholism from the traditional perspectives ........ 15
CHAPTER II ...................................................................... 19
2.1 Alcoholic Beverage Indicators ..................................... 19 2.1 Types of alcohol beverage ................................................... 19 2.2. Alcohol production and trade ............................................. 24 2.3 Alcoholic beverages consumption ........................................ 28 2.4 Unrecorded alcohol use in Bhutan (survey-based) ............... 34 2.5 Drinking variation across Dzongkhags ................................ 41 2.6 Per capita alcohol consumption (Based on recorded alcohol statistics) .................................................................................. 47 2.7 Per capita alcohol consumption (Based on unrecorded alcohol statistics, derived from BLSS) ................................................... 52 2.8 Standard drinks or serve sizes .......................................... 53 2.9 Alcohol and economy ......................................................... 57 2.10 Traditional alcoholic beverages, income, expenditure and trade ........................................................................................ 60 3.7 Alcohol taxation .................................................................. 66 2.11 Illegal Alcohol Business .................................................... 75 2.12 Drinking pattern ............................................................... 75 2.13 Drinking Patterns (Thimphu) ............................................. 81 2.13 (b) Harmful and Hazardous drinking ............................... 84 2.14 Drinking Trend in Bhutan ................................................. 87

Contents
V
2.14 (a) Youth and alcohol ....................................................... 88 2.14 (b) New drinking culture .................................................. 90
CHAPTER III ..................................................................... 95
3. Healthcare Cost of Alcohol Abuse.................................. 95 3.1 Introduction ........................................................................ 95 3.2 Study Justification .............................................................. 97 3.3 Theory and Methods ........................................................... 98 3.4 Costing analysis I ............................................................. 100 3.5 Costing analysis II ............................................................ 105 3.6 Results ............................................................................. 106 3.6.1 Wholly Attributable Alcohol Disease (AAFs=1) .............. 106 3.7 Conclusion ........................................................................ 115 3.8 Other costs of alcohol abuse ............................................. 115 3.8.1 Treatment of alcohol diseases in Traditional Medicine Hospital ................................................................................. 116 3.8.2 Drink driving and property damage .............................. 119 3.8.3 Drinking and family violence ........................................ 121
CHAPTER IV ................................................................... 124
Descriptive Analysis of Hospital Admissions for Alcohol Liver Disease in JDWNH (2005-2009)……….124 4.1 Introduction ...................................................................... 124 4.2 Methods ........................................................................... 125 4.2.1 Data source................................................................... 125 4.2.2 Statistical analysis ........................................................ 126 4.3 Results ............................................................................. 128 4.4 ALD Mortality Trend.......................................................... 133 4.5 Conclusion ........................................................................ 138
CHAPTER V ..................................................................... 139
Multiple Logistic Regression Analysis of Frequent Alcohol Use (FAU) among Thimphu Population in 2007 ............... 139 5.1 Abstract ............................................................................ 139 5.2 Introduction ...................................................................... 140 5.3 Method ............................................................................. 140 5.4 Data Source ...................................................................... 142 5.5 Data Analysis ................................................................... 142 5.6 Results ............................................................................. 143 5.6.1 Sample description or descriptive analysis ................... 143 5.6.2 Logistic regression analysis........................................... 144

Contents
VI
5.7 Conclusion ........................................................................ 151 CHAPTER VI ................................................................... 153 Alcoholism and Control Measure .................................... 153 6.1 Alcohol control policies ...................................................... 153 Conclusion ...................................................................... 169 Bibliography .................................................................... 171

Tables
VII
List of Tables
Table 1: Traditional alcohol use Nomenclature ........................ 12
Table 2: Different types of alcoholic beverages produced,
imported and sold in Bhutan and their strengths ............. 21
Table 3: AWP and BB’s annual production, sales and exports . 26
Table 4: Total and percentage alcohol consumption by types in
2003 and 2007 ................................................................. 36
Table 5: Indicators of alcohol consumption in Bhutan based on
BLSS 2003 and 2007 ........................................................ 39
Table 6: Per capita pure alcohol consumption derived from beer
sales statistics in 2010 ..................................................... 51
Table 7: Revenues from excise duty on domestic distillery
products, sales tax on beer and other alcoholic drinks
(2007-2008 & 2008-2009) ................................................ 58
Table 8 : Ara and banchang consumption, sales and
expenditure 2003 and 2007 .............................................. 62
Table 9: Excise Duty on domestic alcoholic beverages until 2010
......................................................................................... 68
Table 10: Prevalence of alcohol consumption and some drinking
indices by age and gender ................................................. 79
Table 11: Patterns of alcohol drinking indices by age and sex . 85
Table 12: Alcohol Attributable Fractions (AAFs) used in this
study (for ICD-10 diseases mostly recorded in JDWNRH)103
Table 13: AAFs for Diseases Partially Attributable to Alcohol 105
Table 14: Average unit cost at different level medical facility in
2009/2010 in Nu. ........................................................... 106
Table 15: Total cost of treating Alcohol Liver Disease (ALD, In-
patient) and other wholly attributable diseases: F10 & T501
cases in JDWNRH ........................................................... 108
Table 16: Total cost of treating Alcohol Liver Disease (out-patient
only) ................................................................................ 109
Table 17: Total cost of ALD and other wholly attributable
diseases in the country ................................................... 110

Tables
VIII
Table 18: Total cost of partially attributable diseases/conditions
in JDWNRH (At constant price) ....................................... 111
Table 19: Four major Diseases identified in HMIS partially
attributable to alcohol ..................................................... 112
Table 20: Out-country (India) treatment expenditure on patients
with alcohol attributable conditions................................ 112
Table 21: Total cost wholly and partially alcohol attributable
diseases in the country ................................................... 114
Table 22: Traditional Medical care service cost in 19
Dzongkhags (2007-2009). Cost expressed in Million Nu,
current price ................................................................... 118
Table 23: Cost of vehicle damage due to drunk-driving in
Bhutan (2005-2010) ....................................................... 120
Table 24: Alcohol-involved motor road accidents, injury and
dead in Bhutan (2005-2010) ........................................... 120
Table 25: Incidence of victims of different categories of domestic
violence supported by RENEW, 2009-2010 ..................... 121
Table 26: Directly standardized death rates for different age
stratum of ALD patients in JDWNRH (2005-2010).......... 129
Table 27: Age-Specific ALD Mortality Rate in JDWNRH ......... 131
Table 28: ALD diagnosis in different occupations groups (2005-
2009) .............................................................................. 132
Table 29: ALD cases and their Dzongkhag of origin ............... 133
Table 30: displays a very crucial final output that gives us the
coefficients and statistics of the variables that we have
included. ......................................................................... 148
Table 31: Model Summary ..................................................... 149

Figures
IX
List of Figures
Figure 1: Alcohol production and markets in Bhutan .............. 27
Figure 2: Import of Beer from India and Third Countries ......... 28
Figure 3: Sales trend of AWP’s whisky brand in local markets
(2000 and 2010)................................................................ 29
Figure 4: Sales trend of AWP’s Rum brands in local markets
(2000-2010) ...................................................................... 30
Figure 5: Sales trend of AWP’s brandy drinks in local markets
(2000-2010) ...................................................................... 31
Figure 6: Sales trend of AWP’s gin and other liqueurs in local
markets (2000-2010) ........................................................ 32
Figure 7: Sales trend of AWP’s top alcoholic beverages in local
markets (2000-2010) ........................................................ 33
Figure 8: Reported ara consumption across 20 dzongkhags .... 42
Figure 9: Bangchang consumption across 20 Dzongkhags (2003
& 2007) ............................................................................. 43
Figure 10: Consumption of beer by volume across 20
Dzongkhags ...................................................................... 44
Figure 11: Consumption of spirits by volume across 20
Dzongkhags ...................................................................... 45
Figure 12: Distribution of wine consumption by volume across
20 Dzongkhags ................................................................. 46
Figure 13: Top three alcoholic drinks in Bhutan (2003 and
2007) ................................................................................ 47
Figure 14: Per capita alcohol consumption by type and year ... 52
Figure 15: Domestic sales of AWP’s alcoholic products (2000-
2010) ................................................................................ 59
Figure 16: Percentage contribution to the GDP from AWP’s
excise duty and CIT, 2000-2010 ....................................... 60
Figure 17: Total annual households expenditure on different
alcoholic drinks in Bhutan ............................................... 63

Figures
X
Figure 18: Percentage household expenditure on alcoholic
beverages, 2000, 2003 and 2007 ...................................... 65
Figure 19: Alcohol-related treatment (incidence) in the
Traditional Medicine Centres (2007-2009) in 19
Dzongkhags .................................................................... 117
Figure 20: ALD Case Fatality Rate and Recovery Rate (JDWNRH,
1999-2010) ..................................................................... 128
Figure 21: (a) (b): ALD cases in different tiers of health facility in
Bhutan (2003-2009) (a) mortality trend and (b)
mortality+morbidity ........................................................ 134
Figure 22: ALD total CFR and survival rate in Bhutan (2003-
2009) .............................................................................. 136
Figure 23: ALD incidence by sex, 2003-2009 ......................... 137
Figure 24: Observed Groups and Predicted Probabilities
(histogram) ...................................................................... 150

Abbreviations
XI
List of Abbreviations
AA: Alcoholics Anonymous AAF: Alcohol Attribution Fraction ABV: Alcohol by Volume ABW: Alcohol by Weight AHB: Annual Health Bulletin AHI: Annual Household Income ALD: Alcohol Liver Disease AUDIT: Alcohol Use Disorder Identification Test AWP: Army Welfare Project BB: Bhutan Brewery BHUs: Basic Health Units BLSS: Bhutan Living Standard Survey BM: Black Mountain BNCA: Bhutan Narcotics Control Agency BST: Bhutan Sales Tax CBS: Centre for Bhutan Studies CFR: Case Fatality Rate CIT: Company Income Tax COI: Cost of Illness CSJ: Coronation Silver Jubilee DHs: District Hospitals DM: Diary Method DRC: Department of Revenue and Customs FAU: Frequent Alcohol Use FM: Frequency Method
GDB: Global Disease Burden GFM: Graduated Frequency Method GNH: Gross National Happiness GPI: Genuine Progress Index HED: Heavy Episodic Drinker HIMS: Health Information and Management System IARC: International Alcohol Research Centre ICD: International Classification Diseases IPD: Inpatient Department JDWNRH: Jigme Dorji Wangchuck National MoH: Ministry of Health NCD: Non-Communicable Disease
Abbreviations
XII
NFAU: Non-Frequent Alcohol Use NSB: National Statistics Bureau
NTMH: National Traditional Medicine Hospital OL: Opposition Leader OPD: Outpatient Department PA: Physical Activity PAF: Population Aetiological Fraction PSD: Patterns of Drinking Score QFM: Quantity Frequency Method RBP: Royal Bhutan Police RGoB: Royal Government of Bhutan RRHs: Regional Referral Hospitals
SDS: Sustainable Development Secretariat SERAD: Socio-Economic Research and Analysis Division STRM: Short Term Recall Method TEKP: Traditional Ecological Knowledge and Practices TLFB: Timeline Follow Back TWG: Technical Working Group VAT: Value Added Tax

Foreword
i
Foreword
The Monograph Alcohol Use and Abuse in Bhutan is the initiative of the Socio-Economic Research and Analysis Division (SERAD) that came into function in mid-2010. This is one of the demonstration studies conducted to assess data need and availability that would be required to create human capital account of the proposed balanced GNH accounts the Royal Government of Bhutan (RGoB) is keen to develop in next few years. This monograph marks the beginning of the monograph
series that the National Statistics Bureau (NSB) will [strive to] continue publishing. Our success in maintaining the continuity of the series in future will not only depend on our own in-house research capacity and effort, but also on the contribution of research papers and reports by scholars, academicians and others. Through our joint efforts, the NSB hopes to provide research and analysis that are important for evidence-based policy-decisions in various socio-economic areas of relevance to the Bhutanese people. Organised in six chapters, this monograph starts with a brief discussion on the benefits of alcohol and then draws out various themes surrounding alcohol abuse in the country. In essence, it covers alcohol consumption
indicators, healthcare costs, descriptive analysis of alcohol-related diseases, other alcohol abuse consequences, and policy discussions. As a baseline study, it is expected to serve as a valuable resource to researchers, academicians, service providers, policy makers and others who are endeavouring to control alcohol abuse in Bhutan. We hope this study will contribute towards influencing the nation’s response to the harmful consequences of alcohol abuse.
We are happy that this study was conducted at a time when both the government and public have started to recognise alcoholism as important policy issue. There is

Foreword
ii
now a broad consensus that alcoholism is emerging as the most challenging problem accompanying our rapid socio-
economic growth and transformation. The healthcare burden of alcohol-related morbidities and mortality is considerable. Reducing alcohol-related health problems is likely to become a priority area for public health interventions, especially when lifestyle related diseases begin to take their toll on the healthcare resources. This makes healthcare costing analysis--incorporated in this monograph--relevant even if the present costing is not comprehensive. The various alcohol
indicators and healthcare cost presented in this monograph simply lay the groundwork that will require regular updating and improvement. As much as the monograph covers important alcohol abuse issues, it also opens up new areas of research on alcoholism in the country. We hope many important researches on this subject will follow, particularly in assessing the overall social costs of alcoholism. The author has chosen not to make this study policy prescriptive, but to present various issues at a point where different segments of the Bhutanese population will be prompted to engage in discussions and debates. We apologise to our readers for any shortcoming in this
monograph, which may have resulted from our oversight. There is definitely a scope for updating and improvement when more data are available. We solicit your constructive comments and suggestions.
KUENGA TSHERING
DIRECTOR GENERAL
National Statistics Bureau
May, 2012

Executive Summary
iii
Executive Summary
Alcohol use and abuse in Bhutan is an inadequately researched subject. The present study represents the first endeavor to examine the various issues of alcohol use and abuse. Alcohol abuse is a serious problem that can affect the health, wealth, well-being and happiness of individuals, families and society. In Bhutan, the need to draw effective alcohol abuse
control or moderation policy interventions has become pressing. The effective policy response is contingent to a panoptic understanding of the various issues on alcohol use as a social commodity and the harm alcohol can cause when abused. Using alcohol-related information available from the national-level surveys, agent-specific statistics and medical records, this study draws the following observations:
1. Alcohol abuse results in numerous social and economic problems, which may cause great harm in Bhutan, given the easy accessibility, affordability of alcoholic beverages, and wide acceptability of alcohol consumption among the Bhutanese people. The rapidly changing socio-economic circumstances, intrusion of
modern liberalised values, and changing lifestyle are likely to change the type and quantity of drinks consumed and patterns of drinking. For example, party bingeing on alcohol by young people during the weekends can be seen as a neo-pattern drinking that can result in health risks and bigger social problems.
2. The domestic excise duty on distillery products alone contributed to about 1% of the total government revenue (DRC, 2009, pp.10), but this benefit cannot be
overemphasised, considering a substantial amount of harm associated with alcohol abuse. The burden of alcohol abuse goes beyond healthcare costs to

Executive Summary
iv
constitute the costs of criminal justice, productivity loss and implications to the wider Bhutanese economy
and the society.
3. Although, commercial alcoholic beverages are commonly available in the country, the local specialty home-brews constitute the most popular drinks among the Bhutanese population. The BLSS (2007) data revealed that about 86% of the total alcohol consumed by the Bhutanese people in 2007 was made up of local homebrews. This conforms to the WHO’s finding that local-brews (unrecorded alcohol consumption) tend to
be more popular in the developing countries (Global Alcohol Report, 2004).
4. The domestic liquor industry produced about 6.2 million litres of alcoholic beverages in 2000. Out of this quantity, 4.9 million litres were sold within the country and 1.6 million litres exported. In 2010, the annual domestic industrial liquor production rose to about 6.9 million litres; domestic sales increased to about 6.7 million litres. This implies that about 97.3% of the total liquor produced domestically was sold within the country in 2010.
5. The annual production of the local beer industry rose
from 8.4 million litres in 2008 to 13.8 million litres in
2010. The share of local beer sold in the domestic market increased from 6.9 million litres in 2008 to 12.4 million litres in 2010. The demand for local beer was growing in the Bhutanese market. The import of beer from India increased sharply in 2007 and then marginally between 2007 and 2010. The import of beer from third countries peaked at about 1 million litres in 2006, decreased in 2007, increased a little in 2008, and then declined steadily in 2009 and 2010. The import of wines from India and Thailand has risen in
recent years. This was a sign of change in the choice of drinks. This trend was almost similar to the one experienced in the developed nations at one point of

Executive Summary
v
time, where the consumers now shift their tastes from beer to wine (ICAP, 2006 cited in IARC.1998).
6. An interesting perspective can be drawn from the
growing trend in production and domestic market for industrial alcoholic beverages. The overall growth in the domestic market for commercial drinks suggests Bhutan has not achieved a stable market for alcoholic beverages, just as it is in developing and transitional economies. It indicates that the consumers are gradually changing their preferences from local brews to commercial drinks. This happens with the rise in
per capita income. In developed economies, the overall markets for common alcoholic beverages tend to remain stable—a sign that the consumers have reached the economic status so that they can buy expensive cosmopolitan brands of their own choices.
7. Among many commercial liquors produced in Bhutan, the most consumed brand was Black Mountain Whisky followed by the growing demand for Rock Bee Brandy. Like any other commodity, the consumption of the liquor products are shown to have been sensitive to their prices as against the popular theory that alcohol is not an ordinary commodity and is not price sensitive. There was a clear inverse relationship between price and consumption. The more expensive
premium brands like Special Courier Whisky, CSJ Whisky and Dragon Rum sold less, whereas the cheap brands like Black Mountain and Rock Bee Brandy sold more in the domestic market.
8. Given the higher demand for cheaper alcoholic brands, the policy makers might be able to influence the demand for cheaper brands by raising taxes that affect their prices. The recent tax raise on cheap liquor brands seems a prudent decision. Nonetheless, the
regulation of alcohol prices through taxation may not be able to control the change in consumers’ affordability brought about by change in real

Executive Summary
vi
disposable income and price of other commodities (food basket). The rise in per capita income may induce
consumers to switch to costly alcoholic beverages, which in Bhutan are taxed less than the cheaper brands.
9. The ways alcohol consumers respond to, and
compensate for price change, are complex. This occurs when there is a possibility for substitution. The likelihood of consumers substituting taxed-alcoholic beverages with traditional homebrews is high, as homebrews are untaxed, naturally cheaper and
constitute the most consumed alcoholic beverages in the country.
10. There was a vast difference in terms of industrial alcoholic beverages sold in the Bhutanese markets, and what was reported to have been consumed by the Bhutanese population in BLSS, 2007. Only 14% of the total alcoholic beverages consumed in 2007 were industrial alcoholic beverages. The question arises as to who consumed the rest It is possible that expats working in the roads and construction sectors consumed a lot because demand for alcoholic drinks was found to be going down when many of them went back to their homes to attend festivals.
11. The per capita pure alcohol consumption shows the extent of alcohol problems in any society. The adult per capita consumption in 2010 derived using the commercial drinks, came to 8.47 litres. This was much higher than the global per capita consumption of pure alcohol in 2002 (6.2 litres). This study assumes this as an overestimate, and justifications are provided in Chapter 2. Using beer as a proxy measure, the per capita consumption came to 3.06 litres of pure alcohol. Beer was used because of its lesser propensity to be
exported through border towns by way of informal channel. The combined pure alcohol per capita consumption of bangchang and ara was 0.86 litres
Executive Summary
vii
(unrecorded alcohol consumed). This estimate is close to the WHO’s (Global Status Report on Alcohol, 2004,
p.19) estimates of 0.62 litres (1997), 0.57 litres (2001) and 0.70 litres (2002) in Bhutan.
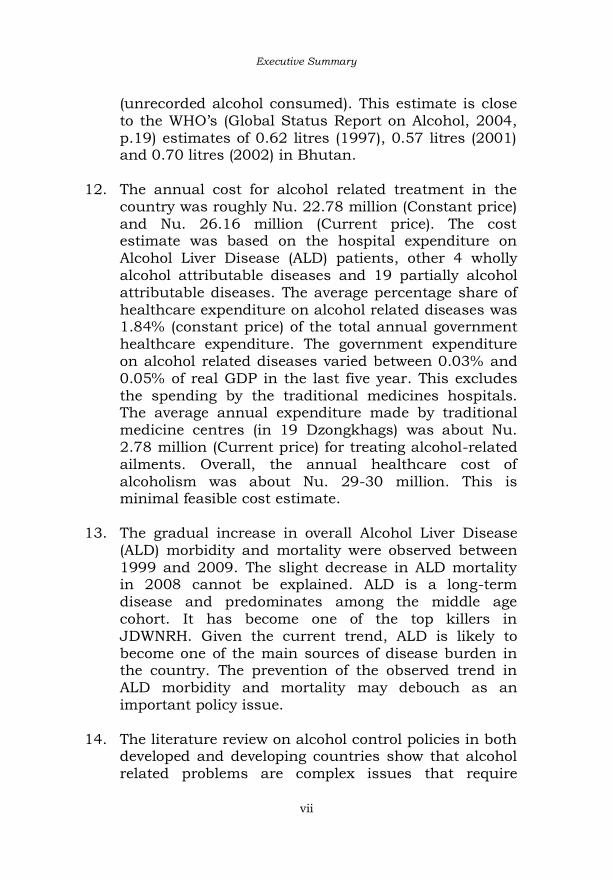
12. The annual cost for alcohol related treatment in the
country was roughly Nu. 22.78 million (Constant price) and Nu. 26.16 million (Current price). The cost estimate was based on the hospital expenditure on Alcohol Liver Disease (ALD) patients, other 4 wholly alcohol attributable diseases and 19 partially alcohol attributable diseases. The average percentage share of
healthcare expenditure on alcohol related diseases was 1.84% (constant price) of the total annual government healthcare expenditure. The government expenditure on alcohol related diseases varied between 0.03% and 0.05% of real GDP in the last five year. This excludes the spending by the traditional medicines hospitals. The average annual expenditure made by traditional medicine centres (in 19 Dzongkhags) was about Nu. 2.78 million (Current price) for treating alcohol-related ailments. Overall, the annual healthcare cost of alcoholism was about Nu. 29-30 million. This is minimal feasible cost estimate.
13. The gradual increase in overall Alcohol Liver Disease (ALD) morbidity and mortality were observed between
1999 and 2009. The slight decrease in ALD mortality in 2008 cannot be explained. ALD is a long-term disease and predominates among the middle age cohort. It has become one of the top killers in JDWNRH. Given the current trend, ALD is likely to become one of the main sources of disease burden in the country. The prevention of the observed trend in ALD morbidity and mortality may debouch as an important policy issue.
14. The literature review on alcohol control policies in both developed and developing countries show that alcohol related problems are complex issues that require

Executive Summary
viii
multi-level coordinated policies and actions. It is important to formulate a comprehensive single
national alcohol abuse control policy intervention, involving multi-level stakeholders rather than each individual ministry or agency taking alcohol control measures as the sub-set of their agent-level policies.

Acknowledgements
ix
Acknowledgement
This Monograph Series (I) has been completed with the support from several individuals and agencies. I thank Kuenga Tshering, Director General of NSB for his unfailing support provided in the form of constant guidance and motivation. My two research colleagues, Cheda Jamtsho and Sonam Gyeltshen, deserve thanks for their research assistance. Among many individuals from the government agencies, the Director and staff of Jigme Dorji Wangchuck National
Referral Hospital (JDWNRH) and (specially Palden Lepcha, senior record officer), have supported this study by providing access to the hospital’s medical records. In fact, the healthcare cost analysis of alcohol abuse rest on debt of gratitude to them. I thank doctor Lungten D. Zangmo and Kado Zangpo of the Ministry of Health for providing me access to the medical record maintained under the Bhutan Health Management and Information System (HMIS). The Managing Director of Army Welfare Project (AWP) shared us their annual production and sales statistics. I owe him debt of gratitude. Partha Basu, general manager of Bhutan Brewery provided us production and sales
statistics of Druk 11,000 beer. It is encouraging that the liquor industries have come to the fore to support this study. Major Pasang Dorji, Traffic Division, Royal Bhutan Police furnished support to this study by sharing information on alcohol-attributed automobile accidents, injuries, deaths and property damage. I thank him and the traffic division, RBP.
Dungtsho Karma Galeg of the National Institute of Traditional Medicines (NITM) provided me an access to medical records of alcohol-attributable medical conditions

Acknowledgements
x
treated in traditional medicine units in nineteen Dzongkhags. I owe him my thanks.
RENNEW Secretariat shared me the records of its clients. I thank staff of RENEW. Though many people and agencies helped me complete the study, nobody is responsible for any mistake. I take the responsibility of any factual error, and solicit comments that may be useful for possible updating in future.
LHAM DORJI

1
Introduction
It did not come as a surprise when the BBC reported in 2005 that Bhutan had begun to face up to alcohol problems (2005).1 This news report, albeit its emphasis on the cultural benefits of alcohol use, also emphasised on alcohol consumption in Bhutan as a growing social and economic problems. According to this BBC journalist, the drinking culture in the country has changed with a rapid social transition and economic prosperity, so that its negative consequences are
manifested in the augmenting episodes of psycho-physiological disorders and other social problems. Drinking alcohol in excess is emerging as a source of social problems in the country, evoking varying public responses. On the one hand, there are efforts to reduce unrestrained drinking through education, campaigns, counseling, rehabilitation, treatment and sanction. On the other hand, there are measures to restrict alcohol availability through tax-induced price increase, licensing of alcohol sales, sales regulations, drinking restrictions (occasion, place and time-based). All these efforts have so far brought a mixed result. The ban on the sale of tobacco was introduced in the
country partly on religious grounds and partly in recognition of its adverse health effects. The same prohibition could not be initiated for alcohol, firstly, because its use is deeply engrained in the Bhutanese culture, and secondly, it is not possible to create a society where no one drinks, and thirdly, just as ‘social lubricants effects theory’ (Bray, 2005) propose, many see several benefits for the moderate use of alcohol. Moderation or temperance of alcohol use is preferred to prohibition in many countries.
Although, many people admonished a far-reaching social cost of alcohol consumption than that of tobacco, the

Alcohol Use and Abuse in Bhutan
2
effort to control alcohol consumption par se excessive drinking remains a challenge. This is because drinking
alcohol provides interface for both social and anti-social behavior. The recent alternative adopted, amid contending perspectives, was to raise alcohol taxes. This move was considered significant, as it indicated the more serious official recognition of alcohol abuse as the major source of health, social and economic burden. Alcohol issue has taken a prominent space on the policy agenda, which many feel is good. The growing cases of alcohol abuse and the associated
problems in the country call for the need to determine as urgently and accurately as possible the indicators of alcohol consumption, drinking patterns, alcohol-related social, economic and health problems, and the estimation of the various costs of alcohol abuse to assist in the formulation of better alcohol abuse control measures. This monograph, though not exhaustive, is a groundwork for examining alcohol indicators--and significantly--to derive a preliminary estimate of healthcare costs of alcohol abuse in the country. This cost estimate may be useful for creating the human capital accounts that will constitute one of components of the proposed balanced GNH accounts.
Furthermore, it is hoped this monograph will provide some scientific basis for public debates and inform the authorities in meliorating alcohol abuse control policies and programmes, including the identification of research areas and need. The monograph covers various issues surrounding alcohol use and abuse in Bhutan, which is discussed in six chapters. Before going into the main subject, a short discussion on the proposed GNH accounts that the
government has directed the NSB to initiate, merit a space. This brief note on GNH accounts is necessary as this study is one of the demonstration studies planned to

Introduction
3
assess data availability and the need to create GNH accounts.
Chapter I consist of discussions on the alcohol use context in the country, taking into account the social, cultural and historical backdrops, and trends and practices of alcohol consumption. Chapter II is devoted to the indicators of alcohol use in the country using statistics derived from the Bhutan Living Standard Surveys (BLSS, 2003 & 2007), trade statistics, and other records collected from domestic
alcohol industries and various relevant agencies. These indicators include household alcohol consumption, per-capita alcohol consumption, standard drink size, domestic production and sales, alcohol imports and revenues, its contribution to the GDP and alcohol taxation. In Chapter III, an attempt is made to derive the crude healthcare costs of alcohol abuse. The social cost of alcohol derived can be underestimated because various cost components as prescribed in COI studies could not be included due to data constraints. This restrictive cost analysis relates to the healthcare cost of alcohol abuse to GDP. This is because GDP as national accounts include those components that harm society and
ignore those aspects that support the well being of our citizens. Alcohol production and trade, the money spent on alcoholic beverages, and other alcohol-related services are reflected positively in GDP accounts.
Chapter IV presents the analysis of Alcohol Liver Disease (ALD)—the disease that can be wholly attributable to alcohol abuse. It is identified as one of the top-most risk factors of hospital mortality. The trend in ALD morbidity and mortality across the country over the period of ten
years is discussed. A simple descriptive analysis on ALD in JDWNRH in relation to demographic variables such as the district of origin of ALD patients, age and occupational

Alcohol Use and Abuse in Bhutan
4
groups is done. The age-adjusted mortality rate, survival analysis, etc for ALD in JDWNRH is presented.
Chapter V presents a binary logistic regression analysis to predict Frequent Alcohol Use (FAU) pattern among Thimphu residents from the selected predictors using NCD (STEPS) 2007 survey data. The specific target drinking pattern of interest is Frequency of Alcohol Use categorised into dichotomous groups—-Frequent Alcohol Users (FAU) and Non-Frequent Alcohol Users (NFAU). The predictor variables for the model are gender, age (25-74 years), education, annual household income (AHI), and
physical activity (PA).
Chapter VI discusses various alcohol policies in the country, but no policy recommendations are made. This is to keep it open for meaningful public discussions. It is important that the public at large discuss various policy issues and get involved in the making and strengthening of alcohol abuse control policy measures.
GNH accounts The RGoB has directed National Statistics Bureau (NSB) of Bhutan to initiate the processes of conceptualising and creating GNH accounts. The RGoB, led by the present Prime Minister, Honourable
Lyonchhoen Jigme Y. Thinley is keen to develop GNH accounts to properly account for those components that contribute towards maximising GNH and discount those that do not. Several goods, services and activities make the country’s GDP grow, and some of them are misleadingly counted as positive signs of growing economy and human progress. For example, alcohol production, sales and consumption, health spending on alcohol patients, expenditure on
alcohol crime prevention and rehabilitation are all counted as a plus point in the current GDP. This is simply for the

Introduction
5
reason that money is transacted though these costs do not actually contribute much to the overall well being of the
society.
A GNH account is crucial to realise His Majesty the Fourth King’s bold proclamation that “Gross National Happiness (GNH) is more important than Gross Domestic Product (GDP).” At present, GDP remains the standard and most convenient measure of assessing the market economy, amid growing acceptance that GDP is not the best measure of the national achievement. The true meaning of His Majesty’s policy statement is echoed far and wide
today, at a time when the world is facing a financial crisis, climate change disasters and other problems of global dimension that many claim are the results of blindly pursuing GDP model of development.
His Majesty’s profound statement actually did not discredit GDP. It suggested the need to pursue economic growth that [seeks to] balance sustainable and equitable development with environmental conservation, cultural promotion and good governance. To demonstrate the importance of GNH over GDP as a measure for true human progress, a new system of national accounting is indispensible. It is in this light that the Stieglitz Commission and
neoclassical economists world-wide are now calling for a new and comprehensive accounting system that seeks to balance market measures against other forms of wealth such as human, social, cultural and natural capital. GNH accounts, which, if accomplished can help Bhutan to assess the true cost of economic activity and its fine balance with natural, social, cultural and human wealth.
In recent years, the Centre for Bhutan Studies (CBS) has
developed a comprehensive GNH index and indicators. The GNH index can be used as a summary measure of Happiness. However, the Happiness Index is a summative

Alcohol Use and Abuse in Bhutan
6
judgement that can sometimes be too broad to make a correct and intelligent policy.
The aggregate measure is crucial, but is not sufficient. The aggregate total has a tendency to hide the internal differences. In this context, the CBS’s effort to have both the GNH index and GNH indicators makes sense. Be it the GNH index or indicators, the issue of assessing the true cost and benefit of human activities must assume a central place, which can be achieved only by using the most comprehensive and expanded set of national accounts other than GDP in the current form and
practice. GNH indicators in general are important to assess progress by using physical measures in different units. For example, the social indicators like crime rate, poverty rate, morbidity and mortality rate, and so on, resulting from excessive consumption of alcohol are useful for policy formulation, but are not enough to assess how much each problem actually cost a society. Then again, GDP is an accounting system designed to only measure the country’s economy. Simon Kuznets, the architect of GDP, saw no flaw with GDP provided it was used to measure a country’s economy rather than to assess its progress, prosperity, well being and happiness.
Yet, those who adhere to just the economic dimension of growth and progress (GDP), are not serious about accounting those transactions or activities leading to negative social, cultural and environmental externalities.
For a country like Bhutan, the emphasis on maximising GNH and creating GNH accounts is crucial to correct the flaws of the current GDP as a measure of progress towards true prosperity and progress. Bhutan’s proposed GNH accounts is, in essence, all about identifying the best way
of achieving a proper trade-off between material and non-material advancement. It is about combining subjective and objective factors for assessing the overall societal

Introduction
7
progress that GDP fails to do. It is about matching the multiplicity and dynamism of what constitutes and
contributes to the people’s well being with what gets measured and remains ignored. For example, expenditure on redressing alcohol problems is positively measured whereas the value of pristine forests is not counted in GDP. Therefore, it is important for any society, aspiring for holistic development, to reinforce the true purpose of national accounts and shift towards a more meaningful and full measure of national progress (as intended by GNH accounts).
Steps towards creating GNH accounts NSB has made a modest progress in initiating the processes of developing GNH accounts. NSB organised two workshops in December 2010 and March 2011. The 2010 workshop was organised for NSB staff, statisticians, researchers and planning officers from other agencies and ministries. It was aimed at introducing the concepts and methods of developing GNH accounts. Dr. Ron Colman Tashi, the Director of Genuine Progress Index (GPI), North Atlantic, Canada, explained the need for Bhutan to create GNH accounts. He elucidated on the difference between the indicators and accounts. Colman demonstrated the basic principles and methodologies of
expanded capital accounting. The second workshop, held from March 29-30, 2011 in Thimphu, was purported to bring together the country’s policy makers, planners and implementers to engage in dialogue with Robert Costanza, one of the world’s foremost ecological economists and his team (Dr. Ida Kubiszewski, the assistant research professor at Portland University and David Batker, the Executive Director of Earth Economics and a fellow at the Gund Institute for
Ecological Economics). The workshop discussed on valuing natural capital and ecosystem services.

Alcohol Use and Abuse in Bhutan
8
This workshop sought to address the question: How do we properly and accurately account for the value of our
forests, soil, water resources, biodiversity, clean air, and protected areas, and for the costs of forest fires, pollution, climate change, soil degradation, natural disasters, and traffic congestion? The workshop served as the starting point to demonstrate vitally important natural capital accounting methods, and to discuss the subsequent steps towards working on developing GNH accounts.
The workshop further discussed about the possible collaboration between the Institute of Sustainable Solutions, Portland State University, USA and relevant sectors within the country to develop natural capital accounts for Bhutan. The Sustainable Development Secretariat (SDS) under GNH Commission funded the second workshop. The workshops’ diverse participants made several recommendations. The most important was to form a Technical Expert Working Group (TWG), comprising of representatives from various key agencies. They also recommended the GNH Commission to lead the TWG and hold the overall coordinating role of the entire processes of developing GNH accounts. As suggested, the GNHC has
now taken up the lead role in coordinating the overall process of developing GNH accounts. The TWG for the first component of the proposed GNH accounts—Natural Capital has been formed. To develop the natural capital accounts, the Memorandum of Understanding (MoU) is to be signed between the RGoB (represented by GNHC) and Institute of Sustainable Solutions, Portland University, US (to be represented by the State Board of Higher Education, Oregon). The other
component accounts to be developed afterwards are social capital, cultural capital, human capital and built capital accounts.

Introduction
9
NSB, as recommended by the March, 2011 workshop, decided to carry on two demonstration studies. These
studies are to serve as prelude to developing a GNH account: to conceptualise, assess data availability [and needs] and design methodologies. This study is related to the human capital dimension of the proposed GNH accounts. The other study under progress is a case study on natural capital. It explores and examines the role of Traditional Ecological Knowledge and Practices (TEKP) in several villages of Chukha Dzongkhag using a mixed approach.
The study assumes that the local communities practice traditional ecological knowledge, beliefs, folklores, cultural values and ceremonies to conserve natural ecosystems, amid the introduction of the modern natural resource management concepts and practices. These are the various components of environment conservation that are not counted in the conventional environmental valuation. In collaboration with NSB, Ida Kubiszewski et al have completed a study providing a preliminary estimate of the value of Bhutan’s natural capital and ecosystem services. According to this study, Bhutan’s natural wealth is worth Nu. 700 billion per year. More than 53% of the total value derived from the ecosystem services benefits the people outside Bhutan. This tells that Bhutan is the provider of
ecosystem services in the region, whereas, the country continue to remain an aid recipient.

10
CHAPTER I
1.1 History and Context of Alcohol Use in Bhutan
1.1. Origin of alcohol use in Bhutan
Alcohol in Bhutan, just like in other societies, is an important social and cultural substance and artifact that is used in a wide range of rituals, as medicines, and for various social events. The very term ‘chang’ in Dzongkha is expressed in oral traditions, songs, proverbs2, social
practices and rituals. Ara (brandy) has been described as one form of intangible cultural heritage (Namgyel, 2005), and its origin is discussed from a religious-historical perspective. One theory on the religious origin of alcohol suggests that Lha Wangpo Tsangpa Jajjin (Lord Indra and Vishnu in Hindu) used alcohol to heal wounded gods (lha)3 during war against demi-gods or lhamin4 (Thinley, cited in Namgyel 2005, p.362). They found a vase of duetsi (close to elixir) in a vast ocean that had since then become an important offering in Buddhism. It came to be held as a spiritually piquant substance used symbolically in many Buddhist rituals.
Another theory suggests that when the earth was formed, the ocean rose and rolled up with black poisons. At that time, the longevity nectar (chimed duetsi) originated from the moon. The god and goddesses rushed for this nectar; the former acquiring the substance. It is believed that the present day yeast originated from this nectar (Gyetshen, 1999, p.205). The gods are said to revel in longevity of life due to this nectar.5 The ancient use of alcohol in Bhutan is obvious from the
fact that many Bhutanese offer alcohol libations when worshiping local deities or pantheons. Some of these deities6 are believed to have been worshipped in the

History and Context of Alcohol Use in Bhutan
11
country before the advent of Buddhism. The local Bon priests and shamans often use drinks as a potent force to
initiate contacts with the supernatural powers and pronounce the oracles of gods.
Alcohol was used as an offering during Guru Ugyen Padmasambhava’s epoch. In Samye Chimphu (Tibet), Princess Trompas Gyen and twenty one ladies prayed to Guru to initiate them. She offered the Guru her mother’s jeweled goblet (with lotus design) filled with grape wine (Harding, 2003, p. 88). In tantric tradition, drink (wine) offerings to Lamas by ladies or potential yoginis are
synonymous to ritualistic intercourse--a tantric union of male and female polarities. This is undertaken with a vow of purity in order to become useful to a yogin (Houstan, 1998).7 The Mahayana sect regards chang (wine or beer, fermented liquor) as eternal nectar, and thus, it is logical to theorise that the drinking culture existed as far as the advent of Buddhism in Bhutan (Thinley, cited in Namgyel 2005, p. 420). Alcohol is used in tantric feast rituals along with meat. It is considered as an offering that is, to a modernist view, the subject of criticism. However, in those rituals, meat is treated as a substance symbolic of ‘skillful means’ (thab) that hooks spiritual attainment, and alcohol as symbolic of ‘wisdom’ (sherab)--the luminous
lamp of wakefulness.
Though it is claimed that the ara drinking tradition belonged to the people of eastern and central Bhutan, there is enough evidence of the vibrancy of a chang culture in western Bhutan. For example, various anecdotes associated with Lama Choje Rinpoche Drukpa Kuenley (1455-1529) who visited western Bhutan more often relate to chang hospitality (Thinley, cited in Namgyal, 2005).

Alcohol Use and Abuse in Bhutan
12
1.2 Social, cultural and economic significance of
alcohol
While the purpose of this monograph is to unveil the negative effects of alcohol, a brief mention of the wide-ranging social and religious functions of alcohol and an explanation of the drinking culture as part of a larger social and cultural configuration is important. The benefit account can be useful ‘later’8 in more elaborate cost and benefit analysis.
Alcohol use in Bhutan is a matter of considerable social
and cultural interest as is apparent from various traditional alcohol use nomenclatures (see table 1).
Table 1: Traditional alcohol use Nomenclature
Alcohol use category
Significance
Serkem chang Drink offerings to local deities
Tor chang Drinks furnished while making ritual cakes
Deutsi chang Spiritual offertory drinks
Sangdze chang Alcohol used as an ingredient of incense offering
Jinsek chang Used as an ingredient for warding off evils rituals
Yang chang Brewed for the god of wealth
Ngo chang Drink offerings for the sake of the dead
Tsan chang Drink offerings to local deity
Tshe chang Drinks brewed for long life rituals
Khando chang Ritual drinks related to individual astrology
Tshog chang Communal tradition of offering drinks to visitors (popular in east)
Duen chang Drinks to welcome guests (pastoral societies)

History and Context of Alcohol Use in Bhutan
13
Alcohol use category
Significance
Tengkor chang Drinking for reciprocity
Tsug chang Drinks to begin any important work
Bar chang Drinks served in the middle of work
To chang Drinks served before meals
Zhe chang Drinks served after meals
Branpa chang Drinks for free labour services (eastern Bhutan)
Nar chang Drinks to request labour help (eastern Bhutan)
Suwa chang Usually reception drinks
Dong chang Arrival drinks
Log chang Reciprocal drinks
Zim chang Night dose
Zheng chang Wake-up drinks
Lam chang Journey drinks
Source: Mainly extracted from Namgyel, 2005. There are other such terms not included here.
Chang or wine9 constitutes the most important ceremonial substance of marchang ceremony. In the past, marchang ceremonies were conducted to welcome guests and wish them good luck and longevity during which the guests would be served with drinks. This tradition is practiced symbolically only. Alcohol use in Bhutanese society is colloquially prescribed in fine details. These are manifested in the norms and patterns of drinking like the occasions, uses and places of drinking, though not much consideration is given to study their details and understanding their meanings. The forms and meanings of alcohol use are culturally defined, and bear strong relation to other aspects of culture and society (Madelbaum, 1965, p. 281). The cultural components of

Alcohol Use and Abuse in Bhutan
14
drinking are often ignored in alcohol studies pertained to the harm of using alcohol.
Social and cultural significance regulate the emotional behavior of drinking like demonstrations of bond, affection, solidarity and the expression of respects. Drinking solidarity signifies emotional bonding and social solidarity. The act of exchanging drinks among individuals and households in rural societies, just as Bray’s social lubricant effects theory (2005) suggests, serve the medium by which much needed farm labour is mobilised and the cooperation of others sought.
In the traditional Bhutanese society, people share drinks when they meet or depart. Alcohol serves as a consolatory treat during bereavement, as part of the relaxed ambience and pleasant sensation during festivities, a source of hospitality and as a reconciliatory agent during disputes. Festivals and other important social events are organised with alcohol as a central enhancement substance. The tradition of offering tshogchang to official guests as a welcome gesture is an example of the social function of alcohol. It symbolises respect to the visitors and communal proclivity towards opulent hospitality. Alcohol has ritualistic and symbolic functions. It is used to please deities and as a vital substance of various
offerings. In certain rituals, monks or lay monks and nuns use alcohol, though Buddhist vows do not permit them to consume alcohol (see footnote for the anecdote).10 In particular, chang used as libation offering (gser-skyems, literally ‘golden thirst’) connotes an elixir to quench thirst. Alcohol is a substantive drink consumed to quench thirsts in farming societies. This seems to be the reason for drinking being often considered appropriate for those who are involved in manual toil than for those whose tasks involve mental exertion.
Alcohol is used to ward off snakes and as protective substances from many evils, and as a medicine to cure certain illnesses. Alcohol is a cultural artifact. The volatile,

History and Context of Alcohol Use in Bhutan
15
but valuable nature of the fluid has led to the production of a rich material culture (Blocker et al, 2003) like the
production and use of chang palang, phob, etc to store and transport alcohol.
Alcohol is a part of child birth observances. Many mothers even consume alcohol as soon as babies are delivered to relieve pain and gain vigour. In many rural communities, children drinking has not been marked as social taboo though things are changing now (Dorji,C, 2006). It is likely that many children growing up in a drinking culture begin to form their impression about alcohol from an early age.
This may be one of the reasons for their early acquisition of drinking habits.
1.3 The ills of alcoholism from the traditional
perspectives
The consumption of alcohol to considerable excess is not consistent with the Buddhist core teachings. Buddhists accept alcohol as having both beneficial and harmful effects. When used as an essential substance of marchang ceremony, a container holding chang is ornamented with white butter or grains to vitiate the maleficent effects of alcohol, and a few white grains is added to a tserkyem chang. These signify that even the rituals and ceremonies that use alcohol as the main offering still treat it as
something malefic requiring purgation.
The Buddha discouraged his disciples not to use any intoxicants that could disturb their minds and obstruct their mental clarity required to attain Enlightenment. The five precepts of the Buddha: prohibition of murder, theft, false speech, sexual activity and use of intoxicants, constitute the basis for code of conduct for laities. Abstinence is supposed to help avoid the first four misconducts. The stricter-ten precepts (dompa chu) for
novice-monks forbid them from drinking even the amount held by a grass blade. However, the code of the Vinaya states that a little alcohol is tolerated as medicine

Alcohol Use and Abuse in Bhutan
16
provided it is boiled with oil so that it did not have the taste, colour or the smell of liquor.
At layman’s level, alcoholic intoxication is considered as the consequences of one’s own karma because one tends to become irresponsible of one’s action, speech and thoughts once intoxicated. It leads to further accumulation of negative karma. The Sigalaja Suttra for lay people describes the dangers of addiction to intoxicants: wasted money, increased quarrels, ill health, loss of fame and dignity and weakening of the mind—the sixth sense essential for controlling the six organs.
Nevertheless, the variation in Buddhist practices in different societies has led to some sects developing a tolerance to drinking and have developed their own raison d'être for using alcohol. Mahayana tradition insists on the non-duality of reality, asserting that there is no ultimate difference between samsara (conditioned) and the un-conditioned nirvana. Another important Mahayana teaching is the use of upaya or skillful means referring to timely use of ‘circumstances’ to progress towards Enlightenment or help others along the same path. Tantric Buddhism regards the previously prohibited activities and substances as tools to enlightenment when used by the properly initiated adepts, rather than them being held as hindrances to progress.
The prohibited substances are referred to four ritual elements: alcohol, meat, fish and parched grain. They are used by some groups in rituals, while others use them symbolically or as an element in meditation. However, it is acknowledge that the use of prohibited substances in powerful and dangerous rituals could result in 1,000 years in torment for the ‘uninitiated’ or the ‘careless’ and Enlightenment in one lifetime for the ‘initiated’. Vagbhata (pha-gyal) in his Astanga Hrdayam (or Yan-lag brgyad pa'I snin-po bsdus-pa zes bya-ba) 11 of the Tibetan Tanjur Tripitaka delves into the myths of alcoholism

History and Context of Alcohol Use in Bhutan
17
(SUT375, 550 AD). According to these Four Treatises of Tibetan Buddhism:
"He who is addicted to wine does not understand which is right and which is wrong; which is happiness and which is unhappiness; which is beneficial and which is non-beneficial for the present and future lives; which is suitable and which is unsuitable to his health and right living. With these bad effects, how do the wise indulge in it?”
It also speaks about the negative consequences of alcohol consumption on health and well being:
"In the wine reside delusion, fear, grief, anger and even death; so also insanity, infatuation, fainting, epilepsy, and convulsion. When loss of memory alone is present, then all the activities shall be improper. What to say when others are present?"
Nonetheless, Pha-Gyal did not totally disprove alcohol consumption. He acknowledged it as gratifying beverage if a person drinks sensibly, just as new sciences encourage moderate drinking for its positive psycho-pharmacological effects. He stressed on the subject of proper drinking, which according to him is not more than two cups of wine following a substantial meal, and recommended small quantities of wine at night to enhance one’s sexual potency. Here comes some level of accord between
Buddhist view of ‘sensible drinking’ with the new ideas that moderate alcohol consumption may reduce the risk of ischemic heart diseases (Booyse and Parks, 2001; Rehm et al. 2003c; Preedy and Watson, 2005) and delay aging, stroke and other cardiovascular diseases (Gold et al. 2010). Pha-gyal further classified proper alcohol use as follows:
1. One who drinks to derive a sense of pleasure and
combination thereof;

Alcohol Use and Abuse in Bhutan
18
2. The moderation in alcohol-derived infatuation, pride, anger, pleasure, and etcetera can be done
through judicious use of alcohol;
3. He who drinks alcohol considering his own health, season, time, place, type of alcohol, one’s own moral strength, and help from others and age;
4. Not to drink alcohol carelessly just to get drunk
though it is used as a tantric commitment substance.
He specified times of the day for drinking: people of kapha dominance to drink just before lunch; those of pitta right after lunch, and those of vata between lunch and dinner. He posited that the people of perfectly balanced constitution to drink any time they wish.12 Charak Samhita (Tsa-ra-ka sde-brgyad) is a 2,000 year old treatise on medicine. It states: ‘If a person takes it in right manner, in right dose, at right time and along with wholesome food, in keeping with his vitality and cheerful mind13 to him wine is like ambrosia. To a person who drinks whatever comes in hand and whenever he gets an opportunity, this very wine will act as a poison’. Many Bhutanese believe that alcohol becomes harmful when used in excess. This is evident from the verbatim ‘if
consumed in considerable excess even mother’s milk would turn toxic’.

19
CHAPTER II
2. Alcoholic Beverage Indicators Having looked in brief into the social, cultural and historical aspects of alcohol use in Bhutan, this chapter looks into various alcohol indicators such as types of alcohol consumed in the country, alcohol industry and trade, homebrew production and consumption, drinking trend, and youth drinking.
These alcohol indicators were derived using both the survey data (for unrecorded alcohol consumption) and the production and sales statistics of the Army Welfare Project (AWP) and Bhutan Brewery (BB). The trade statistics for the alcohol imports were available from the Ministry of Economic Affairs (MoEA) and Department of Revenue and Customs (DRC), Ministry of Finance.
2.1 Types of alcohol beverage
Since drinking alcohol is embedded in the customs and traditions, the local specialty alcoholic beverages also constituted the most popular drinks. The industrial alcoholic beverages were becoming increasingly popular. While the industrial alcoholic beverages such as distilled
spirits14 were produced in the country as early as the 1970s, the production and consumption of homebrews like ara (distilled from grains), bangchang (fermented and extracted from grains), singchang (extracted from grains), tongba, and chang-kyod were found to constitute the main drinks in Bhutan, according to Bhutan Living Standard Survey (BLSS, 2003 & 2007). This corresponded to the WHO’s findings on the popularity of locally-produced alcoholic beverages (unrecorded) in developing countries (Global Alcohol Report, WHO, 2004).
It is difficult to measure production and consumption of traditional alcoholic beverages as well as their alcohol

Alcohol Use and Abuse in Bhutan
20
compositions and strengths. This is because there is no reliable data on the use of traditional alcoholic beverages,
as the national level surveys contain little information on alcohol use pattern. There are only a few studies on local alcoholic beverages and their use. Namgyel (2005)’s study focuses on the ara culture in Bhutan, while Dorji (2004)’s paper on ‘the Myth Behind Alcohol Happiness’ draws on the socio-religious and traditional practices of alcohol use in Bhutan. Gyeltshen’s paper (1997) deals with the process of ara distillation in the Bhutanese indigenous practice. These were few
studies available for reference at the time of preparing this monograph. Industrially produced alcoholic beverages were grouped into beer (mainly malt barley), wine (vermouth, fortified, blended and sparkling) and distilled spirits (whisky, rum and brandies). These categories were based on the BLSS surveys, Bhutan trade statistics (International Trade Classification) and AWP’s production and sales record. The alcoholic drinks, both traditional or commercial, and locally produced or imported are given in table 2 along with their alcoholic contents (expressed in percentage per volume). The alcohol contents of different brands of alcohol
available in Bhutan are measured in French or Gay-Lussac system (percentage by volume, expressed as v/v). In the American Proof system, the alcohol content is expressed as double the percentage volume (IARC, 1988). In general, the amount of ethanol contained in different types of alcohol is multiplied by the ethanol conversion factors. These factors vary by country, but are generally 4-5% for beer, 12% for wine and 40% for distilled spirits (IARC,
1988). The most standard volume of alcoholic beverages sold in Bhutan are 750 ml, 650 ml (beer), 500 ml (canned beer), 335 ml (spirits), 180 ml (spirits).

Alcoholic Beverage Indicators
21
Table 2: Different types of alcoholic beverages produced, imported and sold in Bhutan and their strengths
Brand
% (v/v)
Source
Brand
% (v/v)
Source
1907 Whisky (750 ml)
42.8
AWP
Jachung Brandy (750, 375 & 180 ml)
42.8
AWP
K5 Whisky (750 ml)
42.8
AWP
Bhutan Deluxe Rum (750, 375 & 180 ml)
42.8
AWP
CSJ Whisky (750 ml) 42.8 AWP
Bhutan xxx Rum (750, 375 & 180 ml)
42.8 AWP
CSJ Rum (750 ml) 42.8 AWP
Royal xxx Rum (750, 375 & 180 ml)
42.8 AWP
Special Courier Whisky (750ml) 42.8 AWP
Bhutan Whisky (750, 375 & 180 ml)
42.8 AWP
Royal Supreme Whisky (750 ml)
42.8
AWP
Bhutan Brandy(750, 375 & 180 ml)
42.8 AWP
Bhutan Highland Whisky (750, 375 &
180 ml)
42.8
AWP
Tashi Delek Rum (750 ml)
42.8 AWP
Dragon Deluxe Rum (750, 375 & 180 ml)
42.8
AWP
Orange Liquor(750, 375 & 180 ml) 42.8 AWP
HIT Beer (650 ml)
8
India
Chang beer (500 & 330 ml) 6.4 Thailand
Haywards Beer (650 ml)
Royal challenge (650 ml)
5-7
India
San Miguel beer (500 & 330 ml) 5 India
5-7
India
Tiger Beer (330 ml)
5
Singapore

Alcohol Use and Abuse in Bhutan
22
Brand % (v/v) Source Brand % (v/v) Source
Golden Eagle (650 ml)
5-6
India
Foster (650 500 & 330 ml)
5
Australia
Dansberg (650 ml)
5.7
Denmark
Ochim (650 ml) 5-7 India
Budweiser (500 ml)
5-7
Imported
Carlsberg 5-7 Imported
Heineken
5-7
Imported
Singha Beer 5-7 Thailand
Druk 11, 000 Beer 8
Bhutan
Brewery
Apple and Khambu brandy & wine Bumthang
Wine general 13-15
Imported
Bumthang beer Bumthang
Port wine 18-20
Imported
Breezers 4.8 Imported
Fortified wine 20-22 Imported
Sparkling wine and coolers 7-12 Imported
Table wine 12-14 Imported
Spy 7 Thailand
Liquor and spirits 35- 40 Local
Ara 25-30 Local
Bangchang 15-20
Local
Singchang 20-25 Local
Tongba 15-20
Local
Changkyod 10-15 Local
Note: Alcoholic strengths for traditional beverages are assumed values; those of imported ones are based on the international standards (Lindsay’s Beer Page).

Alcoholic Beverage Indicators
23
The alcoholic strength of local ara and bangchang are not precisely known. Traditionally, the strengths are
expressed in terms of drinks quality of good or bad and strong or weak. The traditional drinks produced for sale are in general not as good as those drinks produced for household consumption. For the present purpose, the strengths of traditional drinks are assumed to be on average 25-30% for ara, 15-20% for bangchang, 20-25% for singchang and 15-20% for tongba.
Ara and bangchang are produced at homes for family consumption, though a few people produce these drinks
for cash income going against the prohibition. The homebrews continue to be cheaper and are considered as drinks of low income groups (Namgyel, 2005, pp.429). These drinks are produced from any type of grains. Ara that is prepared from a mix of red rice and wheat is known as changsum. It is graded number one. Those prepared from white rice as second grade, and wheat ara as third grade and maize ara as the last grade (Namgyel, 2005, pp.249, study done in Punakha). Bangchang is fermented liquor extracted from brew, and are considered to contain high caloric values. Singchang is normally extracted from rice brew.
Ara production involves two processes: grain (called lum or yu dama) is fermented and then distilled. The quality and
strength of drinks is determined by an appropriate combination of grains and yeast, temperature and the length of fermentation. Special ara is prepared by adding flavours and colours (red sandal wood). Some people add wasp of pupae, bone marrow of cow, fish, egg, etc for medicinal value (Gyaltshen, 1997, cited in Namgyel, 2005, pp. 435). The normal time length for ara distillation process [to start] is after two to three weeks of fermentation. Distillation entails heating the brew mixed with water (base liquid) so that volatile spirits evaporate,
condense and collect. The liquids are distilled several times to decrease alcohol strength.

Alcohol Use and Abuse in Bhutan
24
The commercial beers available in Bhutan are generally produced from barley and known as malt beer. Beers are
imported from India, Singapore, Philippines and Thailand. Grape Wines or Marc, Vodka, Gin and Geneva, Cordial and Liqueurs and Rum are imported from Austria, Australia, Denmark, Netherland, Singapore, UAE, Germany, US and UK, and sparkling wines and coolers are imported from Thailand and Singapore. The main industrial alcoholic beverages like whiskies, rums and brandies are produced and sold by the Army Welfare Project (AWP). The AWP is a domestic liquor
industry established in 1976 to generate revenue for the welfare of the army personnel. It was incorporated under the Companies Act of the Kingdom of Bhutan with the aim to foster economic growth and development. It produces more than 18 brands of liquor, and recently, it started producing wines. The AWP’s liquors are produced using spirits and natural spring water. The main distilleries are located in Gelephu (central Bhutan) and Samtse (South West). The Gelephu distillery has an installed a production capacity of approximately 365,000 cases per annum and produces premium brands. Samtse distillery produces about one million cases per annum of brands like Black Mountain whisky, Bhutan Rum, Gin and Liquors.15
Bhutan Brewery, a unit of Tashi Group of Companies started producing Druk 11000 Strong Beer in 2007. Its major share of production is exported; its domestic market is expanding.
2.2. Alcohol production and trade
The AWP is the major alcoholic beverage industry with its markets in Bhutan and India. The major shares of AWP’s
export products are distributed in Delhi, Karnataka and Assam. In 2000, the AWP produced about 6.2 million litres of alcoholic beverages out of which 4.9 million litres

Alcoholic Beverage Indicators
25
were marketed within the country and 1.6 million litres exported. The total AWP share in the domestic market in
2000 was 78.4% of the total production and the rest was exported. In 2010, the annual production rose to about 6.9 million litres; domestic sales increased to 6.7 million litres. The domestic market consumed roughly 97.3% of AWP’s total production (see table 3) according to the sales record. The production and domestic markets for Druk 11000 Beer produced by Bhutan Brewery has been expanding in the past three years (2008-2010). Bhutan Brewery
increased its annual production between 2008 and 2010 by about 5.4 million litres of beer. Its domestic markets share increased within three years by about 5.5 million litres. This indicates that the demand for beer in the country was rising. Druk 11000 is now marketed in Sikkim.
AWP’s production and sales record shows a slight variability in the annual production and sales of alcohol drinks. The domestic market for AWP’s alcoholic beverages was almost stable as indicated in figure 1 with slight increase in 2009 and 2010. However, the overall alcohol market was growing. In other words, the market has not attained maturity. The import of alcoholic beverages (excluding beer) had been increasingly steadily between
2006 and 2009. The highest increase in import was in 2010. The import of beer increased steadily from 2008, and added to beer imports was the domestic sales of Druk 11000 beer produced by Bhutan Brewery (BB) of Tashi Group of Companies.

Alcohol Use and Abuse in Bhutan
26
Table 3: AWP and BB’s annual production, sales and exports
Alcohol Beverage Industries (Million Litres)
2000
2001
2002
2003
2004
2005
2006
2007
2008
2009
2010
AWP production
6.2
6.8
5.4
4.9
4.9
4.7
4.9
6.1
5.1
4.4
6.9
AWP domestic sales
4.9
4.9
4.1
3.7
4.5
4.1
4.6
5.1
4.6
4.5
6.7
AWP domestic market (% of total pro.) 78.4 73.4 76.0 77 91.2 88.6 93.5 83 90.5 104* 97.3 AWP export
1.6
1.9
1.5
0.9
0.5
0.4
0.5
0.9
0.4
0.2
0.4
BB production
8.4
11
13.8
BB domestic sales
6.9
9.9
12.4
BB export
1.5
1.6
1.3
Source: AWP, 2011 & Bhutan Brewery, 2011. Note: Figures rounded. * In 2009, the percentage sold in the domestic market in 2009 came to around 104% that exceeded the actual production in the same year. It could be due to the sale of the previous stock. The total export in relatively 2009 was low.

Alcoholic Beverage Indicators
27
From Figure 1, two perspectives with regard to alcohol domestic markets can be drawn. Firstly, in the developed
economies, the markets for alcoholic beverages tend to remain stable, which is a sign that the consumers have reached the economic status that allows them to purchase any drinks of their own choices. On the contrary, developing and transitional economies normally tend to have growing alcohol beverage markets due to the shift from home produced alcoholic beverages to commercial brands that comes with the improvement in the consumers’ economic status (IARC, p.46). Secondly, while the sales of beer are steady or declining due to increased
competitions from wine and spirits in developed countries, developing countries in general show a shift from other alcoholic beverages to beer (ICAP, 2006 cited in IARC, 1998).
In Bhutan, the alcohol market was growing between 2006 and 2010, indicating a general shift to commercial brands. The increase in the sales of beer was so obvious. These two trends conformed to the trend experienced by low and middle income countries.
Figure 1: Alcohol production and markets in Bhutan

Alcohol Use and Abuse in Bhutan
28
Bhutan imports substantial quantities of beer from India. The popular Indian beers in the Bhutanese markets were
and are HIT, Golden Eagle (now rare in the market), and Fosters (Australian brand), Dansberg, Orchim, Heineken (German brands). The other brands are Carlsberg, Tiger, Singha, Chang and Budweiser that are imported from Singapore, Thailand, Philippines, Australia and Denmark. The import of beer from the third countries peaked at about 1 million litres in 2006, decreased in 2007, increased a little in 2008 and then declined steadily in 2009 and 2010. The decline in beer imports from third countries beginning 2008 could have been due to
availability of local Druk 11000 beer. The import from India increased sharply in 2007 and then a little between 2007 and 2010 (figure 2).
Figure 2: Import of Beer from India and Third Countries
2.3 Alcoholic beverages consumption
The domestic market for commercial brands was observed to be growing. This was being driven by the expanding demand for beer. There was an increase in the import of
other alcohol brands from India and third countries such as port wine, wine coolers and sparkling wine. This

Alcoholic Beverage Indicators
29
suggests change in the choices of drinks. The latest brands introduced in the Bhutanese market were Spy,
Breezer and Figuria wine, which are mostly preferred by the women. Though the domestic market for the AWP products has tended to become largely stable, there was a huge variation in demand among its different brands. Grouping the AWP products in four categories: whisky, rum, brandy and gin, ara duetsi & others, the most popular brand was whisky. Within the whisky category, the most consumed brand was Black Mountain (BM). The domestic sale of BM whisky was all time high. The sale
was above 1.5 million litres per annum between 2000 and 2007. Its sale volume declined between 2007 and 2010. The high demand for BM could have been due to its cheaper price compared to other premium brands like Special Courier, Highland Whisky and Coronation Whisky. The popularity of Changta Whisky declined over the years while that of Highland rose steadily. See figure 3 for details.
Figure 3: Sales trend of AWP’s whisky brand in local markets (2000 and 2010)

Alcohol Use and Abuse in Bhutan
30
Rum (normally produced from molasses or cane sugar) is produced in six brands. The annual sale of rum was not
as high as whisky. The most popular rums are Bhutan XXX Rum and Royal XXX Rum. These brands are popular among low-income consumers. These rums are cheaper than other brands like CSJ, Dragon Deluxe and Bhutan Deluxe Rum. The sales of Tashi Delek Rum increased from 2007. See Figure 4 for details.
Figure 4: Sales trend of AWP’s Rum brands in local markets (2000-2010)
The other most popular commercial drink in Bhutan was Rock Bee Brandy. Its domestic sale has risen from about 0.5 million litres in 2000 to over 1.5 million litres per annum in 2010. Rock Bee took over as a preferred drink for the low-income groups. Its retail price was almost
equivalent to that of Black Mountain whisky (figure 5).

Alcoholic Beverage Indicators
31
Figure 5: Sales trend of AWP’s brandy drinks in local markets (2000-2010)
Among the last group of AWP’s commercial drinks, the
sale of Sonfy Liqour was increasing rather usuriously since 2005. Sonfy is mostly preferred by the villagers, who, whether true or not consider this drink as mild and harmless to their health.16 This green coloured drink is cheaper as well. The crystal gin, once trendy, is now sold less in the market (figure 6). People preferred to drink gin mixed with lime or lemon juice.

Alcohol Use and Abuse in Bhutan
32
Figure 6: Sales trend of AWP’s gin and other liqueurs in local markets (2000-2010)
On the whole, whiskies were sold the most, followed by brandies, rums, sonfy and gin in the order. Looking at a specific brand, the sale of Black Mountain remained high until 2008 and was superseded by the sale of Rock Bee Brandy from 2009. The third most commonly sold drink was Sonfy Liquor (figure 7). The most notable aspect of the sale of these three brands was that they were relatively cheap. It is said that Indian expats were fond of Rock Bee and Black Mountain brands. Sonfy was popular among the villagers and other low-income groups.

Alcoholic Beverage Indicators
33
Figure 7: Sales trend of AWP’s top alcoholic beverages in local markets (2000-2010)
Like any other commodity, the consumption of the AWP products were shown to be sensitive to their prices as against the popular theory that alcohol is not an ordinary commodity and is not price sensitive. This is shown by an inverse relationship between price and consumption. The
more expensive premium brands like Special Courier whisky, CSJ whisky, Dragon Rum sold less, whereas the cheap brands like Black Mountain and Rock Bee sold more in the domestic markets. It seems many heavy drinkers more often than not go for cheaper brands. The consumption of inferior brands could have been determined by the affordability of the alcoholic beverages. However, it is early to correlate these trends with human behaviour pertaining to consumers’ demand for alcoholic beverages in relation to change in their

Alcohol Use and Abuse in Bhutan
34
incomes and the change in the price of other commodities in their food baskets (Rabinovich et al, 2009, pp. 24).
Going by the presence of higher demand for low-grade and cheap alcoholic brands, the policy makers might be able to affect the demand for these brands by raising their taxes that directly affect their prices, but such regulation may not be able to control the change in consumers’ affordability brought about by the change in real disposable income and price of other commodities (food basket). It is possible that with the rise in per capita income, a consumer may switch to premium brands,
which in Bhutan are taxed lesser than the low-grade brands.
It is important to research on how the change in ‘consumers’ affordability’ and prices of the popular drinks affect the overall alcohol consumption in the country. The experiences in other countries have shown that to the extent the public policy of controlling alcohol is focused on the prices of alcoholic beverages alone (like Bhutan’s new strategy of raising taxes of common brands) without taking into account the increase in income that drive up the affordability, alcohol pricing is not so effective to curb consumption and alcohol related harms (Rabinovich et al, 2009, pp. 28).
However, this is not to say that the recent raise in alcohol tax was a vacuous decision. From the policy point of view, it is still useful to regulate the price of popular brands through taxation, considering the ‘net effect’ of change in price, as everyone would not experience rise in real disposable income at the same time.
2.4 Unrecorded alcohol use in Bhutan (survey-
based)
Little is known about informal alcohol production and consumption in the country. Bhutan at the moment lags in terms of alcohol-specific surveys that can capture

Alcoholic Beverage Indicators
35
informal alcohol production and use, and in particular the drinking patterns and associated problems in the country.
The national level surveys that provide some information on alcohol consumption are Bhutan Living Standard Surveys (NSB, BLSS 2003 and 2007) and Gross National Surveys (CBS, 2007 & 2010). However, both surveys contain information that can at best allow calculation of consumption volume, but not the drinking patterns. The BLSSs data provide information to capture the aggregate alcohol consumption and provide the overall picture of alcohol consumption in the absence of other alcohol-
specific surveys. The BLSSs data shows that ara and bangchang were the most salient drinks in Bhutanese society. These are the customary drinks that are considered illegal for sale. The same dataset contains measures of alcohol consumption over different lengths of the reference period. The reference period is determined based on the respondents’ report on how much alcohol a household consumed in a typical week preceding the date of interview, a month or a year. The short recall period of a week, also called the “exact recall period method”, may allow for a higher recall rate and more reliable reporting, but may also lead to over-reporting. The longer recall period of a year can better capture typical higher drinking
occasions in the family than the shorter reference period, but it may not provide an accurate picture due to recall error. For the present purpose, a reference period of one month is used.
The aggregate home-made alcoholic beverages consumed in 2007 were about 10.33 million litres. It represented about 86% of total alcohol consumed in 2007. Just 1.71 million litres of commercial alcoholic beverages (around 14%) were consumed in 2007 as shown in table 4.
The overall consumption level, as per two BLLSs, did not change much between 2003 and 2007. The total alcohol consumption (ara, bangchang, rum, whisky and wine) was

Alcohol Use and Abuse in Bhutan
36
11.95 million litres in 2003 and about 12.03 million litres in 2007. The increase in the total alcohol consumption in
2007 (relative to that of 2003) was just 0.08 million litres. The total consumption in 2007 was close to the Ministry of Health’s estimate of 12.5 million litres of alcohol in the same year.
Interestingly, the commercial alcoholic beverages sold in the Bhutanese markets as shown by the sales records of AWP, BB and Trade Statistics do not tally with the total quantity consumed, reported in the BLSS. While the total domestic sales of AWP in 2003 and 2007 came to about
3.7 and 7.1 million litres respectively (excluding the imported alcoholic drinks), the total industrially-produced alcohol consumed as reported in the BLSSs was far less (1.82 and 1.71 million litres). The question is, who consumed about 5.4 million litres (7.1-1.71=5.4 Million
litres) of AWP’s alcoholic beverages recorded as sold in Bhutan in 2007?
Table 4: Total and percentage alcohol consumption by types in 2003 and 2007
Year
Ara
Ba
ngch
ang
Beer
Spir
its
Win
es
Tradit
ion
al
alc
ohol
Industr
ial
alc
ohol
Tota
l
Total annual consumption in Million Litres
2003 4.45 5.68 1.41 0.21 0.2 10.13 1.82 11.95
2007 4.64 5.69 1.5 0.18 0.03 10.33 1.71 12.03
% in
2003
37.24
47.53
11.80
0.03
1.67
84.77
15.23
100
% in
2007
38.57
47.30
12.46
1.50
0.25
85.87
14.21
100
Source: BLLS, 2003 & 2007
Given that the BLSS (2007) shows about 86% of alcohol consumed in the country was traditional home-made alcoholic beverages. As these drinks are normally cheaper,

Alcoholic Beverage Indicators
37
there arises a provocative question as to whether the recent tax increment for the industrially produced
alcoholic beverages without actually considering effective control mechanism of home-brewed alcohol production and consumption would really reduce the aggregate per capita alcohol consumption in the country. It suggests whether there is a need to either legalise the sale of home-made alcoholic beverages or prohibit it or strengthen the enforcement of the present law. Such decisions can be made only after considering a thorough cost and benefit analysis.
As shown in Table 5, out of the total alcoholic beverages consumed in 2003, ara constituted roughly 4.45 million litres while bangchang consumed in the same year was about 5.68 million litres. The total beer consumed in the year was about 1.41 million litres. In 2007, the total annual household ara consumption is estimated at 4.64 million litres, bangchang and beer came to approximately 5.69 and 1.50 million litres respectively.
The total volume of home-brews (ara and bangchang combined) purchased for household consumption was about 1.26 million litres (in 2003) and 1.77 million litres in 2007 (table 5). This means that considerable quantities of ara and banchang were traded in the market in spite of
the fact that the commercialisation of these local alcoholic beverages is legally prohibited. In terms of pricing, locally produced ara and bangchang tend to be cheaper than their commercially produced counterparts. In some parts of the world, illegal alcoholic beverages are approximately 2–6 times cheaper (McKee et al., 2005; Lang et al., 2006) than commercial alcoholic beverages. Looking at past trends, ara and bangchang are expected to become popular among the low-income people,
particularly with the industrial alcoholic beverages being taxed more.

Alcohol Use and Abuse in Bhutan
38
The mean monthly household consumption was about 31.72 litres of alcoholic beverages in 2003 and 22.3 litres
in 2007. Some studies have shown that mean consumption is highly correlated to heavy drinking and median to its associated problems, but those studies were mostly done in the western context (The Academy of Medical Science, 2004 cited in Graham, 2005, p. 3). The applicability of these findings to the Bhutanese context is still dubious. The monthly median household alcohol consumption in 2003 was 20.96 litres and 17.77 litres in 2007. That is, 50 % of the households consumed below 17.77 litres of alcohol per month in 2007. Table 5 provides
the mean and median household consumption and expenditure on alcoholic beverages.
These measures (mean and median) are sometimes considered as crucial indicators for policy decisions. Room et al (2005) concluded that alcohol consumption and its resultant problems rises with an economic development and increase in per capita income (Room et al, 2002).17 Policymakers in different countries in general expect to moderate alcohol problems by reducing the aggregate alcohol consumption. In absence of enough evidence, it is too early to conclude the strong association between mean consumption and alcohol problems in the country. Nevertheless, it is
important to know that the aggregate household consumption, as the international comparisons of drinking habits are based on the aggregate consumption data--and moreover--they can still show the overall consumption of alcoholic beverages by the Bhutanese population, which can serve some broad policy purpose.

Alcoholic Beverage Indicators
39
Table 5: Indicators of alcohol consumption in Bhutan based on BLSS 2003 and 2007
2003 2007
Indicators Ara BC Beer Spirit Wines Total Ara BC Beer Spirit Wines Total
Average monthly HH
consumption (Litres)
6.40
11.41
4.03
1.91
7.98
31.72
6.5
10.93
2.95
1.09
0.75
22.3
Average monthly total HH
consumption (Million litres)
0.37
0.47
0.12
0.02
0.02
1.00
0.39
0.47
0.12
0.01
0.003
1.00
Average annual household
consumption (Litres)
76.7
136.91
48.35
22.97
95.72
380.7
78.5
131.1
35.46
13.04
9.02
267.1
Average annual total
consumption (Milion litres)
4.45
5.68
1.41
0.21
0.20
11.95
4.64
5.69
1.50
0.18
0.03
12.03
Monthly median HH
consumption (Litres)
4.86
7.5
2.6
0.75
5.25
20.96
4.88
8.6
3.27
0.46
0.56
17.77
Annual median consumption (Litres)
58.3
90
31.2
9.00
63.00
251.5
58.6
103.2
23.4
5.57
6.7
197.4
Average total rural consumption (Million
Litres)
4.17
5.55
0.80
0.15
0.18
10.86
112
5.39
0.78
0.13
0.01
118.1
Average total urban
consumption (Mn. Litres)
0.27
0.13
0.61
0.06
0.02
1.09
9.77
0.30
0.71
0.05
0.02
10.85
Average alcohol purchased
(Million Litres)
0.68
0.58
1.20
0.11
0.04
2.60
1.05
0.72
1.3
0.10
0.02
3.19
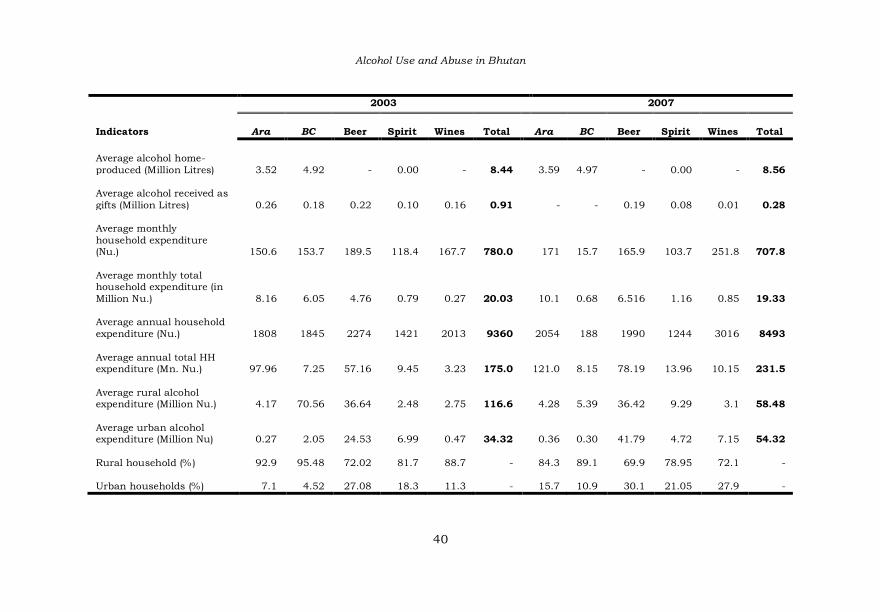
Alcohol Use and Abuse in Bhutan
40
2003 2007
Indicators
Ara
BC
Beer
Spirit
Wines
Total
Ara
BC
Beer
Spirit
Wines
Total
Average alcohol home-
produced (Million Litres)
3.52
4.92
-
0.00
-
8.44
3.59
4.97
-
0.00
-
8.56
Average alcohol received as
gifts (Million Litres)
0.26
0.18
0.22
0.10
0.16
0.91
-
-
0.19
0.08
0.01
0.28
Average monthly
household expenditure (Nu.)
150.6
153.7
189.5
118.4
167.7
780.0
171
15.7
165.9
103.7
251.8
707.8
Average monthly total household expenditure (in
Million Nu.)
8.16
6.05
4.76
0.79
0.27
20.03
10.1
0.68
6.516
1.16
0.85
19.33
Average annual household
expenditure (Nu.)
1808
1845
2274
1421
2013
9360
2054
188
1990
1244
3016
8493
Average annual total HH expenditure (Mn. Nu.)
97.96
7.25
57.16
9.45
3.23
175.0
121.0
8.15
78.19
13.96
10.15
231.5
Average rural alcohol expenditure (Million Nu.)
4.17
70.56
36.64
2.48
2.75
116.6
4.28
5.39
36.42
9.29
3.1
58.48
Average urban alcohol expenditure (Million Nu)
0.27
2.05
24.53
6.99
0.47
34.32
0.36
0.30
41.79
4.72
7.15
54.32
Rural household (%)
92.9
95.48
72.02
81.7
88.7
-
84.3
89.1
69.9
78.95
72.1
-
Urban households (%)
7.1
4.52
27.08
18.3
11.3
-
15.7
10.9
30.1
21.05
27.9
-

Alcoholic Beverage Indicators
41
The limitations of the aggregate alcohol consumption measures shown in the preceding table are: they explain
how much alcoholic beverages were consumed, but do not explain why and how they were drank. The volume of alcohol consumed may sometimes fluctuate due to a few high alcohol consumption occasions such as during the annual household rites and rituals, losar, festivals and other community events. The survey data may result in lower estimates of the total consumption by the population due to under-reporting and disproportionate under-representation of the heavy
drinkers. The BLLS is a household-based survey and does not report age and sex specific consumption rates that may vary between sub-population groups that are much needed to be understood for effective policy interventions. The aggregate household level figures are often prone to ecologic biases that are not found when the unit of analysis is individuals (Morgenstem, 1998). The household level consumption indicators do not show how the alcohol abuse problems are distributed in society. It is expected that the future BLLS 2012 would include more specific questions on alcohol use and its problems.
2.5 Drinking variation across Dzongkhags
The drinking variation in the type of alcoholic beverages and volume consumed across the districts were determined using BLSS data. Ara and bangchang were the most common drinks in the country. They constituted about 86% of the total reported alcohol consumption in 2007. The other drinks were wines, beer and spirits. The consumption of wine was low. This could be because wine is in general associated with the people of higher socio-economic status. The data conform to the common notion of space-specific inherency of certain home-made drinks.
As shown in figures 8-13, certain local drinks were more common in certain districts than others. For example, ara consumption was recorded highest in Trashigang and

Alcohol Use and Abuse in Bhutan
42
Mongar Dzongkhags of the eastern region. Haa and Paro Dzongkhags reported the lowest ara consumption (Figure
8)
Figure 8: Reported ara consumption across 20 dzongkhags
Bangchang was popular in Pemagatshel, Samtse and other south central districts. This drink was customarily
popular in lower sub-tropical zones where the climate is hot and humid (figure 9). There is no study elucidating reasons for its common use in these zones. One of the reasons could be due to the susceptibility of cereals to damage by various pests that thrive in moist, climatic conditions. The farmers, probably due to the lack of proper storage technology, prefer to convert grains into bangchang. Bangchang is consumed as food supplement and a ready source of carbohydrate.18 Atwater and Benedicts (1902) cited in Paolo (2001, pp. 276) suggested in their classic studies that alcohol is comparable to other energy sources such as carbohydrate and fat.

Alcoholic Beverage Indicators
43
If the custom of brewing bangchang is influenced by lack of proper storage to protect grains from pests, then the
need to promote technological innovations for storing cereals is conclusive. At present, the production of home-made alcohol is restricted, and the rule was formulated to reduce the conversion of grains into alcohol. This regulation can be viewed as a retroactive interference rather than delving into the source of the problem.
Figure 9: Bangchang consumption across 20 Dzongkhags (2003 & 2007)
Higher beer consumption was reported in districts like Thimphu, Chukha, Sarpang and Samtse where the major towns are located (figure 10). This does not mean beer was not consumed in rural areas. The local media reported that beer was available everywhere, even in small shops in remote villages. It reported that the people of Pemagatshel were spending close to Nu. 11.88 to 15.84 million on beer (roughly 0.22 million litres). This figure was derived from a
sole beer agent in the district.19 The fact that many shopkeepers in remote villages have truckloads of beer

Alcohol Use and Abuse in Bhutan
44
bottles to be disposed indicates the gaining popularity of beer in distant settlements. It has been observed, and
often reported in the national news, that the rural population who were used to consuming ara and bangchang had began to shift their tastes to beer. Some consumers do not even consider beer as liquor, but as some sort of ‘soft drink’ since its strength is simply sufficient to quench their thirst or replenish liquid and reinvigorate them.
Figure 10: Consumption of beer by volume across 20 Dzongkhags
Beer consumption is definitely correlative with income as this product has to be purchased. However, this study cannot confirm if it is an indication of the rise in rural income. Though the alcohol content in beer is less, beer is usually consumed in a large quantity, and in so doing increase its strength. It is important, on the part of
responsible individuals and agencies, to define the standard size of normal beer intake and promote the idea

Alcoholic Beverage Indicators
45
that beer is not a light drink when consumed in large quantities.
The spirits (mainly whisky, rum, brandy and gin) were consumed more in Chukha Dzongkhag. The other districts that reported higher consumption of spirits were Thimphu, Samtse, Paro and Punakha Dzongkhags (Figure 11). These are the Dzongkhags where major urban population resides.
Figure 11: Consumption of spirits by volume across 20 Dzongkhags
Wines were the least consumed alcoholic beverages in the country with the overall consumption concentrated in Thimphu and Chukha in 2007 (figure 12). Wines may not have been common drinks in 2007, but the growing

Alcohol Use and Abuse in Bhutan
46
popularity of various cheap brands of Indian wines in the country shows that some of the previously popular drinks
were being replaced by wines. AWP has now begun to produce wines, in response to the growing market for wines.
Figure 12: Distribution of wine consumption by volume across 20 Dzongkhags
Among the six categories of drinks, both local and commercial, bangchang was the most common drink, followed by ara and beer in 2007 (figure 13). The consumption of commercial wines was increasing. This trend could have been the result of introducing many new brands of cheap wines such as Figuria and others imported from India.

Alcoholic Beverage Indicators
47
Figure 13: Top three alcoholic drinks in Bhutan (2003 and 2007)
2.6 Per capita alcohol consumption (Based on
recorded alcohol statistics) Alcohol consumption in any given society is measured either by analysing production, imports and sales statistics or by using nationally representative surveys.
The market statistics for alcoholic beverages provides gross estimates and exclude the unrecorded consumption of home-brewed alcoholic beverages. These gross estimates can be determined to a certain extent in Bhutan using the available production and market statistics. However, these gross estimates may not represent the equivalent total consumption of alcohol.
The accuracy of per capita alcohol consumption estimate depends on several factors such as informal production,
tourists and overseas consumption, smuggling and cross border informal trade, duty-free sales, variation in alcohol

Alcohol Use and Abuse in Bhutan
48
strength, choice of alcohol brands, waste and stockpiling (WHO, 2000).
Only a few countries are in ideal position to produce all the information required to compute accurate per capita alcohol consumption. Considering these limitations, the WHO uses a simple method to derive the annual per capita alcohol consumption using a formula:
In the present case, since the data for domestic sales and imports are available, a straight-forward method is used by adding up the total imported alcoholic beverages and the quantity of domestic alcoholic beverages sold in the domestic market and dividing this sum by the total adult population (≥ 15) for 2010.
The per capita alcohol consumption or the amount of ethanol in litres that every Bhutanese adult consumed is estimated using 2010’s aggregate production, domestic sales and import statistics. The alcohol production and trade (domestic sales and imports) are converted into litres. The total alcohol consumed in the country in 2010 was about 40.75 million litres. This is an impure alcohol.
The alcoholic strengths of the beverages that are imported and produced in the country are expressed in alcohol by volume (v/v) or by proof. The alcoholic strengths of most of the AWP’s products are 42.8 % (v/v), that of Druk 11000 beer is 8% (v/v), 7%(v/v) on average is taken for imported beers, 15%(v/v) for wine, 40%(v/v) for imported whiskies, 37%(v/v) for vodka, 20% for liqueurs and cordials and 20% (v/v) for other imported alcoholic beverages. To convert each alcohol type by volume to pure alcohol, each volume is multiplied by their respective alcoholic strengths.20 The aggregate pure alcohol consumption in the country in 2010 was estimated at 4.09

Alcoholic Beverage Indicators
49
million litres. This sum is then divided by the adult population of 2010 (15 years and above) which according
to Statistical Year Book (2008) was about 4, 82,750. The per capita adult pure alcohol consumption is estimated at 8.47 litres. This is a high estimate by the regional standard. The global per capita consumption of pure alcohol in 2002 was 6.2 litres (IARC, 2002, pp. 62).
The estimate, though derived using proper statistics and method, cannot be accurate for four important reasons: firstly, it does not take into account the informal alcohol production and consumption; secondly, it does not
consider consumption by Bhutanese residents outside the country; thirdly, consumption by tourists and expatriate workers in the country is not known; and lastly, the prevalence of cross border trade in border towns is not considered. Therefore, this study considers the per capita alcohol consumption derived from the commercial or recorded alcoholic beverages statistics is an over estimation. In other words, it is not equivalent to what was actually consumed by the Bhutanese adult population in 2010. The limitations of the present data and method are illustrated. For example, the recorded sales of the AWP products in the Bhutanese markets plus imported liquors
vary from the real alcohol consumption values derived from the BLSS dataset. The commercial statistics show that about 14.02 million litres of alcohol were sold in Bhutan in 2007. This is the quantity of the AWP’s alcoholic products plus imported alcoholic beverages. However, according to the BLSS (2007) data, the Bhutanese on average consumed about 12.03 million litres of alcohol in 2007, out of which the industrially produced products accounted for only about
16% (1.71 million litres). The difference between the total industrial alcohol sold in the country in 2007 and what was actually reported (BLSS, 2007) to have been

Alcohol Use and Abuse in Bhutan
50
consumed by the Bhutanese people was about 12.31 million litres. Who consumed 12.31 million litres of
commercial alcoholic beverages that were sold in Bhutan in 2007? This discrepancy cannot be explained statistically, except to make some assumptions. The following assumptions are made: (1) this huge variation may be accounted for those alcoholic beverages consumed by travelers and expatriate workers, especially the huge number of Indian workers in the construction sector; (2) unrecorded exports by travelers and expats as well as illegal cross-border sales in the major border towns
of Bhutan. The cross border bootlegging of alcohol beverage is on the Bhutanese side. A large quantity of alcoholic beverages sold within Bhutan are said to be traded in the border towns. It is difficult to ascertain how much alcohol is normally informally traded, but the National Newspaper (Kuensel) reported that about 40% of alcoholic beverages sold in Bhutan eventually end up for re-sale in nearby Indian towns where alcohol tax is relatively high and alcoholic beverages are not easily accessible.21 The other possible scenario is the unrecorded exports both by a huge number of Indian travelers and expatriate workers when they return home, or when they travel
occasionally back to home for festivals (puja) and other celebrations22. These alcoholic beverages individually exported by expats are normally not recorded. Since the per capita alcohol consumption thus calculated using the production, imported and domestic sale statistics is assumed to be an ‘overestimate’, the other option is to use per capita estimate for a particular drink that is more likely to be consumed by the Bhutanese population.
The per capita beer consumption comes to about 3.06 litres of pure alcohol (table 6). Beer is used for this as a
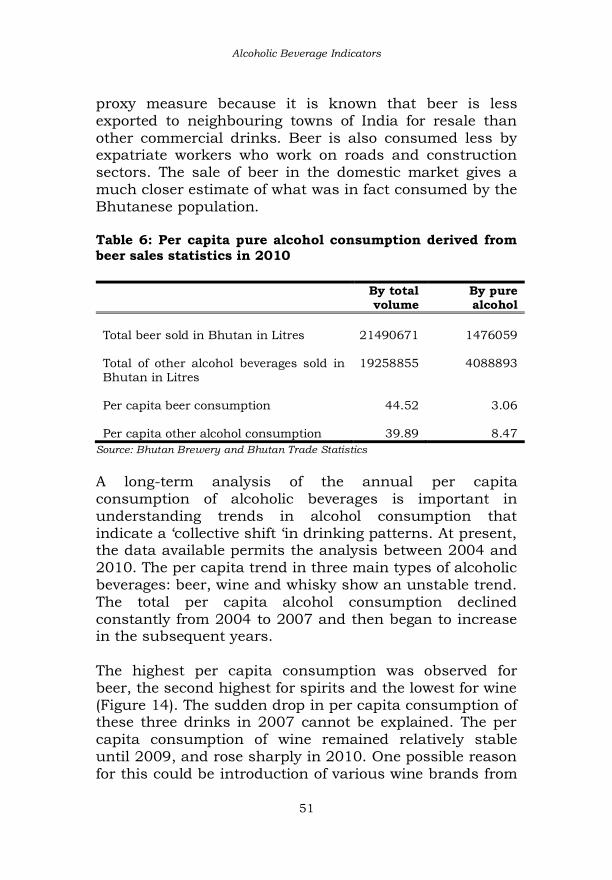
Alcoholic Beverage Indicators
51
proxy measure because it is known that beer is less exported to neighbouring towns of India for resale than
other commercial drinks. Beer is also consumed less by expatriate workers who work on roads and construction sectors. The sale of beer in the domestic market gives a much closer estimate of what was in fact consumed by the Bhutanese population. Table 6: Per capita pure alcohol consumption derived from beer sales statistics in 2010
By total volume
By pure alcohol
Total beer sold in Bhutan in Litres
21490671
1476059
Total of other alcohol beverages sold in Bhutan in Litres
19258855
4088893
Per capita beer consumption
44.52
3.06
Per capita other alcohol consumption
39.89
8.47
Source: Bhutan Brewery and Bhutan Trade Statistics
A long-term analysis of the annual per capita consumption of alcoholic beverages is important in understanding trends in alcohol consumption that indicate a ‘collective shift ‘in drinking patterns. At present, the data available permits the analysis between 2004 and
2010. The per capita trend in three main types of alcoholic beverages: beer, wine and whisky show an unstable trend. The total per capita alcohol consumption declined constantly from 2004 to 2007 and then began to increase in the subsequent years.
The highest per capita consumption was observed for beer, the second highest for spirits and the lowest for wine (Figure 14). The sudden drop in per capita consumption of these three drinks in 2007 cannot be explained. The per
capita consumption of wine remained relatively stable until 2009, and rose sharply in 2010. One possible reason for this could be introduction of various wine brands from

Alcohol Use and Abuse in Bhutan
52
India like port wine and figuria, and sparkling wine and wine coolers from Thailand. The variation in per capita
consumption between different years shows that the alcohol market for commercial brand was not stable, unlike in developed nations where per capita consumption of commercial brands does not change much.
Figure 14: Per capita alcohol consumption by type and year
2.7 Per capita alcohol consumption (Based on
unrecorded alcohol statistics, derived from BLSS)
The adult per capita alcohol consumption is again estimated using the unrecorded alcoholic beverage consumption. Here, unrecorded alcoholic beverages refer to the local brews that are mostly produced and consumed at home, and are not taxed and excluded from the official production and sale statistics. The fact that the alcoholic strengths of home-made alcoholic beverages cannot be determined accurately

Alcoholic Beverage Indicators
53
poses a serious problem in determining a per-capita alcohol consumption estimate in the country.
To calculate per capita pure alcohol consumption, one important requirement is to have accurate alcohol strengths expressed either in alcohol by volume or by weight. Currently, it is possible to estimate per capita figures only by using assumed alcohol strengths of ara and bangchang.
Taking the total adult population (aged 15 and above in 2007) as 448,555 and total consumption as about 1
million litres of alcoholic beverages, the per capita alcohol consumption is estimated at 2.23 litres (impure alcohol). The average alcohol content of home-brews was taken to be in the range of 20 to 30% v/v: ara (35%v/v), bangchang (25% v/v), beer (7% v/v), spirits (42% v/v) and wine (14% v/v). The combined pure alcohol per capita consumption of beer, spirits and wines was 0.06 litres, and the combined pure alcohol per capita consumption of bangchang and ara was 0.86. The total pure alcohol per capita consumption comes to about 0.92 litres (<1 litre) in 2007. This estimate is close to the WHO’s (Global Status Report on Alcohol, 2004, p.19) estimates of 0.62 litres (1997), 0.57 litres (2001) and 0.70 litres (2002).
2.8 Standard drinks or serve sizes
Estimating the standard amounts of alcohol consumed by a population require sufficient knowledge on the typical strengths and type of drinks. Both the survey data—the GNH survey 2010 and the STEP Survey for risk factors and prevalence of non-communicable disease in Thimphu, 2007 contains information on drinking frequency. These surveys have missed the important dimensions of drinking
patterns such as beverages type and serve sizes. There exists a considerable body of literature establishing the view that alcohol in moderate quantities can be less

Alcohol Use and Abuse in Bhutan
54
deleterious to health and general well being. However, the question is, ‘what is moderate or a reasonable quantity of
alcohol?’ In many industrialised nations, the scientific idea of measuring moderate drinks was developed in the 1970s, and improved in the 1980s. This measure was referred as ‘standard’ drinks (a unit of alcohol expressed in milliliters or grams). Still, the question remains as to what should be the specific amount of alcohol for a standard drink. There is no internationally agreed standard as different countries use different standards.
In 2002, it was found that about 16 countries had set the standard drink size ranging from 10-25 mililitres of alcohol.23 In Japan, the standard drink is about 25 ml, equivalent to 19.75 gram of ethanol. This variability can be attributed to the need for defining a standard drink in line with prevailing cultural norms and practices of a given society (Carruthers & Binns, 1992). As international scientific journals use different definitions of typical drink sizes, it sometimes results in confusion in reporting the findings. However, no effort has been made in Bhutan to set its national drink standard. Setting a ‘standard drink’ is not as simple as saying that a
peg of rum or a cup (phob) of ara is a standard drink. The difficulty arises in determining the size of cup or glass and type of alcohol. Bhutanese people tend to use a different size of cup and drink for different alcoholic beverages with varying strength. Despite this difficulty, having the national drink standard measurement set is crucial since this is an important concept for both alcohol research and other public health information. It can help make people aware, and at least,
let them know what and how much they are drinking, or whether they are drinking beyond the standard limit. This may serve as a good starting-point for promoting sensible
Alcoholic Beverage Indicators
55
drinking in the country. Its outcome can be useful when applied with other alcohol abuse control campaigns.
As consumers become more aware, they may use the information to monitor their own alcohol in-take. The change in drinking habits has been observed in the countries with their own drinking standards. Such information is included on the packaging (as labels), either as mandated by governments or voluntarily by producers (Hawks, 1999; Webster-Harrison, P.J,. et al 2002). To date, alcoholic beverages produced in Bhutan and imported from other countries have only the alcoholic
strengths on the label; there is no guidance on standard drinks units. Interestingly, alcoholic beverages are one of the few consumable products lacking complete and standardised information about the ingredients like calories and nutrients per serving. Standard units in developed nations vary between 8-14 grams. Turner (1990) analysed about 125 published epidemiological studies and found that the standard unit falls between 9 and 14 grams. In developed nations, instead of alcohol by volume (ABV), they often use alcohol by weight (ABW). The quantity of 10 gm as a standard drink is usually applied to report drinking data to ease international communication of epidemiological and other scientific research.
One complication in developing a standard drink size in Bhutan is that alcohol is mostly consumed at home or other places where the sizes of serve containers may vary and drinks poured are not quantified. The alcohol content of home-made alcohol such as ara and bangchang also varies. As a result, this complicates deciding a more accurate unit of standard drink. However, for the present purpose, a standard drink is considered as the amount of beverage that contains 10 grams of ethanol, measured at
20°C.

Alcohol Use and Abuse in Bhutan
56
To convert ABV to ABW, the formula given below is used:
The conversion from millilitres to grams requires application of the constant 0.79 i.e. grams = millilitres X 0.79 (Miller et al, 1991).
The formula to calculate standard drink is:
For example, a 750 ml bottle of Black Mountain (BM) which is 42.8% alcohol by volume is calculated as 0.75 x 42.8 x 0.789 = 25.03, to be rounded to one decimal place. This is approximately 25 standard drinks. A peg, which is by volume about 45 ml, contains approximately 1.5 standard drinks of Black Mountain. This applies to most of the spirits that are available in the Bhutanese markets such as Rock Bee Brandy, Gin, Rum, Sonfy etc, as these drinks have same alcoholic strength.
The beer is drunk in bottles and cans (shared or not shared with others). Most of the beer sold in the Bhutanese markets is about 7% v/v in strength and 650
ml in volume. The standard drinks per bottle of beer comes to about [0.650 x 7 x 0.789] =3.59 drinks. A person drinking a bottle of beer is considered to be consuming about 3. 59 standard drinks.
Assuming the alcoholic content of ara as 30% v/v and volume of a container that is normally used as 210 ml 24 , then number of standard drinks in a serve of ara is 4.97 [0.21 x 30 x 0.79], or approximately 5 standard drinks. What is safe drinking or serve size in Bhutan is not
determined. The standard drink sizes given here should be treated as derived for the purposes of analysis. It is not

Alcoholic Beverage Indicators
57
substantiated by research and endorsed by any competent authority.
In many countries lacking official guidelines for drinking, the WHO has recommended that men can drink a maximum of three standard drinks, while women can drink no more than two standard drinks.25The WHO further recommended that people should not exceed four standard drinks on any occasion and that they should abstain from drinking at least once a week. These recommendations are in relation to health risks, but do not consider other alcohol related social and economic
problems.
2.9 Alcohol and economy
A rapid expansion of alcohol markets in the country was observed between 2007 and 2010. Looking at alcohol use from benefit perspective (Midnaik and Room, 1992), alcohol is a source of public revenue. It provides business for the retail and bars (market). Given the huge number of bars and alcohol retailers in the country, the business of selling alcohol creates money transactions and employment, promotes the hospitality sector and serves as direct source of cash income for the families involved in the production and sale of traditional alcoholic beverages.
Going by the contribution of the alcohol industries to the national revenue, the domestic excise duty on distillery products amounted to Nu. 152.57 million in 2008 and Nu. 140.35 million in 2009. The domestic excise duty on distillery products alone contributed 1% of the total revenue (DRC, 2009, pp. 10). Sales tax on alcoholic beverages including that of aerated water contributed about 1.58% of total national revenue. Table 7 provides the details.

Alcohol Use and Abuse in Bhutan
58
Table 7: Revenues from excise duty on domestic distillery products, sales tax on beer and other alcoholic drinks (2007-2008 & 2008-2009)
Source of
revenue
2007-
2008
(Actual
Gross)
2007-08
(Net
Revenue)
2008-
09
(Actual
Gross)
2008-09
(Net
Revenue)
% over
Total
Revenue
AWPL
20.29
20.29
21.36
21.36
0.15
Sales tax on beer,
aerated water
and alcoholic
drinks in Mn.
Nu.)
184.30
184.30
221.46
221.46
1.58
Excise duty on
distillery
products (in Mn.
Nu.)
152.56
152.56
140.38
140.38
1.00
Total (in Mn. Nu.)
357.15
357.15
383.20
383.20
2.73
Source: DRC, Ministry of Finance, 2008 & 2009
Expressed in monetary terms, the yearly sales of distillery products of the Army Welfare Project (AWP) increased steadily from 2003 and peaked in 2007 (Nu 349 million worth of sales) and decreased in the subsequent years (figure 15). As stated earlier, this is an indication that the market for AWP’s distillery products has not attained maturity. This normally occurs when the consumers are sensitive to the price of alcoholic beverages in relation to their purchasing power or per capita income. That is, the consumers in the Bhutanese markets have not attained the stage when the change in price of alcoholic beverages does not affect their consumption.

Alcoholic Beverage Indicators
59
Figure 15: Domestic sales of AWP’s alcoholic products (2000-2010)
The DRC has observed a decline in the revenue from the excise duty on domestic distillery products in recent years. The DRC accounted this decline to the increase in the price of locally manufactured alcohol and the availability of substitute products like beer and wine from India (DRC, 2009, pp. 10). From a policy standpoint, even if the steps are taken to reduce the production of the domestic alcoholic beverages, its results are likely to be nullified by the increased import of beer and other alcoholic products from India and third countries.
Besides, AWP and other domestic alcohol industries pay Company Income Tax (CIT). The total contribution of AWP to GDP in terms of excise duty and CIT was about 0.37% of GDP (figure 16) in 2010. The overall contribution of liquor industries can be higher if the sales tax and other distribution services are considered.

Alcohol Use and Abuse in Bhutan
60
Figure 16: Percentage contribution to the GDP from AWP’s excise duty and CIT, 2000-2010
The government’s decision to liberalise production and distribution of industrial alcoholic beverages has led to burgeoning alcohol business. In 2010, more than 3,000 bar licenses were operable across the country. This decsion can be considered as the initiative towards promoting the private sector and market justice. However, due to the recent upsurge on the public debate on alcohol’s negative effects on society, this policy is faced
with a ‘value dilemma’ of whether this economic interest should be allowed to pose an increasing rate of health and social problems.
2.10 Traditional alcoholic beverages, income,
expenditure and trade
The BLSSs provides some information for estimating the volume of informal trade of home-made alcoholic beverages like ara and bangchang. It has responses to a question whether the home-made alcoholic beverages that
the respondents’ households consumed were home-

Alcoholic Beverage Indicators
61
produced or purchased in a defined period, and the latter can provide a rough market size for traditional beverages.
As shown in Table 8, the total volume of ara sold in the market was roughly 0.68 million litres in 2003 and 0.72 million litres in 2007. Out of 86% of traditional drinks consumed in 2007, ara constituted about 38.56% of the total alcoholic beverages; bangchang made up about 47.29%. Roughly, the total value of the ara business in 2003 was worth Nu. 18.14 million and Nu. 35 million in 2007 (imputing average price of ara as Nu. 20 in 2003 and Nu. 25 in 2007). The monetary transaction value of
bangchang in 2003 and 2007 are estimated at Nu. 7.73 million and Nu. 14.4 million respectively. This implies that in 2007, total illegal business of ara and bangchang was worth Nu. 49. 40 million. The data shows that the home production and its business were sizeable. Many people believe that home-produced alcoholic beverages carry the benefit of having low alcoholic strength. Contrarily, since the production of these beverages is not monitored for quality and strength, there had been many cases of fatal consequences as a result of adulteration, including poisoning and deaths. Drinks that are home-produced for sale are usually of low quality and strength and often adulterated. Even though
beer is said to be gaining ground against local ara and bangchang on the basis of prestige and increased per capita income, these traditional drinks are likely to dominate the informal market, as they are not taxed and somewhat cheaper.

Alcohol Use and Abuse in Bhutan
62
Table 8 : Ara and banchang consumption, sales and expenditure 2003 and 2007
2003 2007
Indicators Ara Bangchang
Total Ara Bangchang
Total
Average alcohol purchased (Mn.Ltrs.)
0.68
0.58 1.26
1.05
0.72 1.77
Average alcohol home-produced (Mn. Ltrs.)
3.52
4.92 8.44
3.59
4.97 8.56
Average alcohol received as gifts (Mn. Ltrs)
0.26
0.18 0.44
-
-
Average monthly HH expenditure (Nu.)
150.6
153.7 304.3
171.2
15.65 186.9
Average monthly total household expenditure (Mn. Nu.)
8.16
6.05 14.2
10.12
0.68 10.8
Average annual household expenditure (Nu.)
1808
1845 3653
2054
187.8 2241.8
Average annual total HH expenditure (Mn. Nu.)
97.96
7.25 105.2
121.0
8.15 129.15
Average rural alcohol expenditure (Mn. Nu)
4.17
70.56 74.73
4.28
5.39 9.67
Average urban alcohol expenditure (Mn. Nu)
0.27
2.05 2.32
0.36
0.30 0.66
Source: BLSS, 2003 and 2007

Alcoholic Beverage Indicators
63
The data further showed that between 2003 and 2007, the market for ara expanded almost by three quarters and
bangchang by one third. The home-produced alcoholic beverages provide an alternative source of income for low-income people, particularly for women. As demonstrated in Figure 17, ara and bangchang were the drinks on which the highest expenditure was incurred, despite the widely held notion that having bars everywhere makes the commercial/industrial drinks easily accessible to a majority of the population, including the under-aged.
Figure 17: Total annual households expenditure on different alcoholic drinks in Bhutan
However, Rehm et al (2004) suggested that alcohol consumption analysis should rely largely on the type and quality of the data. In this expenditure analysis, even if the expenditure on the household consumption is reported based on whether alcoholic beverages were purchased or not purchased, there is likely to be some error in the estimation of the total expenditure. This error is expected to arise due to the higher probability of

Alcohol Use and Abuse in Bhutan
64
misreporting on whether the alcoholic beverages they consumed were purchased or not. Alternatively, a simple
qualitative distinction between positive expenditure and zero expenditure on alcohol is preferred, but this distinction is not made here.
It is noticeable that contemporary life is changing in Bhutan in terms of identity and lifestyle that in turn shapes the alcohol consumption patterns in many dimensions and proportions. While some rich people prefer the better quality local brews, beer, wine and other cosmopolitan drinks, the poorer segments of society seem
to consume anything that is available to them.26With the increasing reach of industrial alcoholic beverages even to remotest parts of the country, the likelihood of rural people spending on the industrial alcoholic beverages may increase. From the public health perspective, branded products are assured of their purity, but the WHO Expert Committee Report (2007, pp. 10) cautions that the trend of market concentration for cosmopolitan drinks in a small number of urban localities can lead to many problems, including alcohol-related youth issues. The towns are places where youth come for various purposes and pick up drinking habits.
Alcoholic beverages account for some share of household budget expenditures. These expenditures can be higher in families of heavy drinkers. In 2007, the household expenditure on alcoholic beverages was about 4% of the total food expenditure, with a higher expenditure share among the rural population. This difference can be due to a larger segment of rural population. Figure 18 shows the percentage household expenditure on alcoholic beverages against the total household expenditure (2000, 2003 and 2007). This expenditure was relatively higher in 2000 than
in 2007. However, these figures should be interpreted with caution. This does not necessarily suggest that the expenditure on alcoholic beverages was less in 2000. As

Alcoholic Beverage Indicators
65
the percentage share of the total household food expenditure was taken, the difference can be attributed to
change in the items included in the food basket for different years. The food basket of 2007 contained more items than that of 2000 and so the total food expenditure (against which the percentage household expenditure on alcoholic beverages was calculated) is expected to be high. There is no doubt that the purity and quality of industrialised alcoholic beverages can be monitored, but alcohol’s net effect is negative everywhere on health and other social and economic dimensions (WHO, 2002, pp. 2).
The use of better production technology in liquor industries has rendered the production less labour-intensive. This implies that the liquor industries can provide limited employment opportunities. The major chunk of employment related to alcohol industry comes from the retail sales, in bars, hotels and restaurants. These social and economic advantages, nonetheless, have to be weighed against their overall negative impacts on the society.
Figure 18: Percentage household expenditure on alcoholic beverages, 2000, 2003 and 2007

Alcohol Use and Abuse in Bhutan
66
3.7 Alcohol taxation
The recent tax raise on alcohol can be justified through evidences in other societies where higher taxes on alcoholic beverages have led to increased prices and reduced per capita consumption and associated problems. In most of the developed countries, it was found that alcohol excise tax led to the increase in the price and decrease in demand. Clement et al (1983 &1989) established that in seven developed nations, covering the period from the mid-1950s to mid-1980s, price elasticity
(how much of the alcohol consumption changes with change in prices) for beer was -0.35, for wine it was -0.6 and for spirits -0.98. This means that the increase in the price of spirit by 10% led to a decrease in spirit consumption by 9.8% (Berg et al, 2008, pp. 2).
Taxing alcoholic beverages is usually justified on four grounds. First, alcohol consumption causes negative externalities and taxing them higher is necessary to internalise them. Second, demand and supply for alcoholic beverages is inelastic up to a certain point. The elasticity of demand and supply is crucial for perfect market system, and this ‘inelasticity’ can cause some market distortion. Alcoholic beverages are taxed more to prevent market distortion. Third, it is a source of government
revenue and fourth, tax-induced alcohol pricing is easier to implement irrespective of its efficacy (GDB, 2004, pp.57).
The official policy to raise alcohol taxes in Bhutan is that people will consume less. Retail prices can be, of course, influenced by all types of taxes: excise tax and indirect taxes like custom duties and sales taxes. The custom duty or import tax is imposed in general on all imported products, and can be considered as a mechanism to
protect domestic industries. The import duty can also influence alcohol consumption since the burden of such taxes is passed on to consumers.

Alcoholic Beverage Indicators
67
Alcohol taxes differ among the countries. The four main methods by which alcohol excise tax rates are set
comprise of the levies based on the volume of pure alcohol in the product (specific rate), based on the volume of each beverage type (unitary rate), based on the price of alcohol product (ad valorem, by value) and a combination of the three methods (combination rate).
In Bhutan, General Sales Tax (VAT-Value Added Tax) on alcoholic beverages, particularly on beer and the excise tax on other alcoholic beverages are levied. The excise duty rates on domestically manufactured alcoholic
beverages imposed until 2010 was based on ad-valorem rates at ex-factory price. This tax ranged from 20 to 60%.27 Table 9 shows excise duty on various brands of alcoholic beverages produced mainly by AWP. The excise duties are not expressed as a percentage of the value of the product. As shown in Table 9— excise tax is such that the higher the value of the product, the lower the tax. As a result, expensive alcoholic beverages are taxed lower than the low-budget brands. This raises an issue of equity provision, as wealthier individuals do not bear a higher tax burden because more expensive liquors are taxed lower. In other countries, such as Malaysia, alcohol taxation is either based on a specific
rate (tax fixed on amount per unit of absolute alcohol) and ad valorem (calculated as a percentage of the price of alcohol). Considering the harm that arises from alcohol use, a tax that reflects pure alcohol content of their products is usually considered the best. That is, more the alcoholic content of the drinks, more the levies.

Alcohol Use and Abuse in Bhutan
68
Table 9: Excise Duty on domestic alcoholic beverages until 2010
Brands Drinks value
category
Volume (ml/litres)
Excise duty (%)
Revised Excise Duty Rate (%)28
Coronation SJ Whisky
High retail price
750 20 30 Apple Brandy 750 20 Khambu Brandy 750 20 Apple Wine 650 20 Special Courier whisky 750 30 30 Royal Supreme whisky 750/375/180 30 60 Bhutan Highland 750/375/180 30 60 Coronation Silver Jubilee Rum
750/375/180 30 60
Liqueurs 375 30
Rock Bee Brandy
Low retail price
750/375/180 50 60
Dragon Rum 750/375/180 50 60
Spiced liquors 750/375/180 60 Black Mountain whisky 750/375/180 60 60 Changta whisky 750/375/180 60 60 Jachung Brandy 750/375/180 60 Bhutan XXX Rum 750/375/180 60 75 Royal Rum 750/375/180 60 75 Snow Line Gin 750/375/180 60 75 Crystal Dry Gin 750/375/180 60 75 Pacham Gin 750/375/180 60 75 Sonfy 750/375/180 60 75 60 Under proof (gallon) 4.5 60
Source: DRC, Bhutan
In addition, the excise permit fees of Nu.30 per case containing not more than 12 litres for all imported alcohol and beer are collected by the DRC (DRC, 2009). The license fee imposed on liquor shops is determined through the highest bid offered by the eligible bidder during the open auction conducted by DRC. The amount imposed varies depending on the subsequent auction or tender rates.
The Import Permit Fee and Fee on brand registration were introduced in 2011. The annual brand registration fee is

Alcoholic Beverage Indicators
69
Nu. 20,000 per brand for a dealer. The BST is imposed on beer. The Business Income Tax (BIT) is collected from bars
and restaurants that sell alcohol. The Bhutan Sales Tax (BST) or ad valorem for beer has been revised from 50% to 100% for beer imported from India and 200% for beer imported from other countries. The ad valorem rate is desirable, as it keeps pace with inflation. In Bhutan, it is applied only to beer because it is complicated to administer due to price variation between alcoholic beverages types, brands, sale outlets and other market factors.
The recent increase in alcohol taxes has been received with both support and discontent. There are divergent views on the revision of the ad valorem rate on beer. Some people think that the sale of beer should be promoted through lowered ad valorem because of its lower alcoholic content and as a means to encourage the drinkers to switch from ‘hard drinks’ to ‘mild drink’ (beer). According to the rationale behavior theory, humans will always go for substitutes when they find the price of existing commodities affecting their economic capacities, which in the present case is to opt for local brews (not taxed and hence cheaper) and other hard drinks. The taxes for hard drinks like Black Mountain Whisky, Rock
Bee Brandy and Sonfy with higher alcoholic contents have remained the same or increased marginally. The Opposition Leader (OL) has written on his online blog that taxes for high premium alcoholic beverages have remained lower than fruit juices.
Studies in other countries have shown that youths are more sensitive to change in prices. A tax-induced price increase of alcoholic beverages affects the drinking pattern among young people by lowering discount time factor and
due to stringent budgetary constraints. That is, the young population do not care for the future costs of alcohol related harms, and thus, the current rise in beer (as youth

Alcohol Use and Abuse in Bhutan
70
normally prefer beer) prices can affect their drinking habits both positively ( if they drink less beer due to
higher prices) and negatively (if they shift their choice to drinking hard drinks instead of beer).
Since alcohol is a social commodity as well as a source of great harm, policy makers are normally confronted with the selection of the best practical solutions among the full array of policy options. It is important that a few issues surrounding the alcohol taxation policy are discussed here to provoke debate and meaningful deliberations.
First, inflation control generally restrains the taxes and prices of goods and services. However, taxes on almost all industrialised alcoholic beverages in Bhutan are based on fixed excise duty that is not frequently adjusted to inflation. The real price and not nominal (not adjusted for inflation) of alcoholic beverages should rise at or beyond the inflation rate (Rehm, Room & Edwards, 2001) in order to make tax-induced alcohol price control effective. The explanation for this is that economic growth can enhance the economic capability of individuals and with it the consumers’ purchasing power, bringing down the real price29 of drinks. For example, the industrialisation and economic growth in China have led to a decrease in the alcohol prices relative to the disposable income. This has
led to a sharp increase in the overall consumption.
On the other hand, it justifies the government’s intervention, as leaving the alcohol market free may lead to externality costs to the society. Moreover, alcohol demand and supply is inelastic, as they are determined by the addictive nature of the commodity rather than the price mechanism that free markets create. The basic concept underlying the tax raise on alcoholic
beverages is to achieve economic efficiency and attain social well being. Generally, the policy analysts refer to ‘efficient policy’ as those that maximise welfare (value of

Alcoholic Beverage Indicators
71
consumer sovereignty) not simply to minimize the cost. The government intervention is justified on the grounds
that alcohol as a unique and addictive product meets the criteria like externalities, lack of risk awareness, imperfect information; chronic alcoholism (non-rational behaviour) and the inefficient level of use prevention (public good) (Grant et al, 1983, 16).
Rational risk taking bahaviour implies that the individuals need an appropriate idea of alcohol use, which the market does not provide. The prices of alcoholic drinks are distorted by the externalities (good social character).The
drink industries in general do not provide adequate information on the risk involved in drinking. It is always the other organisations that end up providing such information. The externality cost of alcohol abuse exist in the form of harm the alcohol consumers inflict on others through events such as traffic accidents, violence or emotional distress to family members. The other burden they impose on the groups or society takes the form of medical treatment costs, more so, when this cost is borne by public institutions at the expense of others. There is no question that the government can generate a substantial amount of money through alcohol taxes. This
revenue is the net benefit of alcohol consumption to society. In reality, taxes are a transfer that merely redistributes purchasing power. Taxes do not increase consumption possibilities of the society as a whole. The increase in alcohol expenditure does not necessarily contribute to economic progress. It is not a sign of the increase in the consumers’ aggregate willingness to pay (Grant et al, 1983, pp. 26). Furthermore, taxing alcohol should include the assessment of the possibility of the
black market or smuggling. The social and legal costs that ensue from black marketing may sometimes even up the revenue generated.

Alcohol Use and Abuse in Bhutan
72
At the same time, the benefits in terms of government revenue do not justify the uncontrolled expansion of
alcohol production, imports and markets because according to rationale choice theory, even though the consumers may purchase and consume alcohol through their own choices, they often do not recognise the alcohol costs and its negative externality effects on the society (Lehto, 1995 cited in Thamarangsi, 2008, pp. 6). Drinking to harmful level leads to contingent and hidden costs normally not borne by drinkers themselves, but passed on to other individuals and society.
Second, although raising alcohol tax would lead to increased revenue for the government, from the societal perspective, tax revenues are transfer payments that do not actually increase the actual productivity, but simply allow the flow of money from one place to another or from one hand to another. If alcohol taxes are seen as a health policy instrument rather than to generate revenues for the government, a portion of the additional tax revenues earned are normally added to healthcare budget in other countries. This contribution is specified in the budget allocation. However, this is not the case in Bhutan at present.
Third, against opposing views, the 7th National Assembly session, 2011, while discussing Alcohol Tax Bill decided to
tax low-priced alcoholic beverages more than the premium brands on the basis that the premium brands are already priced higher and that increasing taxes on the low-priced drinks can deter the mass consumption of low and medium brands. Under this revised alcohol-tax regime, it is possible that the medium and low brand consumers would shift their preference to the premium brand if relative prices decrease within different categories of drinks. The efficacy
of using a lopsided tax-induced strategy to control alcohol consumption and minimise harm may sometimes become dubious.

Alcoholic Beverage Indicators
73
Fourth, whether the recent revision of an alcohol taxes can effectively reduce per capita alcohol consumption in
the immediate future would need some careful assessment. Its impact can be understood only after a time gap. For the time being, the effectiveness of alcohol taxes as an alcohol control policy tool can only be assumed to work. No one knows whether this strategy is working to reduce alcohol consumption and alcohol abuse problems.
Fifth, there is a possibility that the current alcohol taxation structure may lead to a denial of equity among
the mass population. It may not necessarily lead to a Pareto improvement, but rather bring a Kaldor-Hicks improvement. That is, on the whole people who become worse off due to the current alcohol tax policy can be compensated by those who are better off at the societal level.
Sixth, as stated earlier, the way alcohol consumers respond to and compensate for price change is complex. This occurs when there is a possibility for substitution. The possibility of the consumers substituting taxed-alcoholic beverages with traditional drinks is high as these are untaxed and naturally cheaper. The idea behind alcohol taxation is that ‘if taxation of alcohol increases the price, other things kept constant, there will be a benefit’.
High tax on alcoholic beverages can increase the price, but it will also increase potency (taxing beer will mean a higher demand for hard drinks or change the taste for local alcoholic beverages).
Seventh, some people view that the new rule to tax bar owners (an additional Nu. 15,000) has affected those people whose livelihoods depend largely on the sale of drinks. It was reported in one of the Parliamentary sessions that about 6,438 people hold bar licenses. This
also means there is a bar for every 46 people in the country30 and that bar owners are highly taxed rather

Alcohol Use and Abuse in Bhutan
74
than taxing the distributors who sell alcoholic products at higher prices.
Eighth, the alcohol control option through tax increase deserves some normative considerations since high taxes in general lead to lower rates of alcohol consumption. However, the policy-makers and tax officials should not overlook the possibility that this would impinge on the legitimacy of individual right of access to a commodity by responsible drinkers. John Stuart Mill’s ‘harm principle’ states that the actions
of individuals should only be limited to prevent harm to other individuals. “The only purpose for which power can be rightfully exercised over any member of civilised society against his will, is to prevent harm to others.”31 Liberal politics maintains that no one should be forcibly prevented from acting in any way he chooses, provided his acts are not invasive of the free acts of others. So long as people drink sensibly and do not harm others, alcohol taxation policies that interfere in trade also infringe on the liberty of the buyers. Restricting irresponsible drinkers does not justify restricting the freedom of choice to all buyers until the negative externalities are fully accounted. Economists
often tend to argue that if individuals are informed about their choices, and still choose to consume alcohol, consumer sovereignty should reign and taxes should be imposed only to correct for externalities.
Lastly, it may be possible that the consumption of alcohol may decrease if taxed high, but the question remains-- how much has it declined? How did drinking patterns change? What type of alcohol is least consumed? What are the substitutes? All these questions need to be looked at,
and answers must be derived from frequent research and assessment.

Alcoholic Beverage Indicators
75
2.11 Illegal Alcohol Business
In many parts of Bhutan, illicit liquor (refer to ara and bangchang) production and marketing assume the status of a cottage industry with every village and town having such illegal operations, besides brewing for home consumption. The DRC consider food grains (mostly imported) as being misused when they are used to brew alcohol beverages. The production of ara for commercial purposes is illegal, though business is rampant. The rule allows up to 20 kg of grains for ara brewing for personal use after getting a 30-day permit from the DRC or
dzongkhag.
To curb the illegal production and sale of local brews, the DRC claims they conduct field inspections on illegal production and sale of ara and local brews three times a year without issuing any prior notice, besides responsive investigations for the complaints. Excise inspections on illegal liquor are conducted in urban areas and along the highways. The violators are fined Nu. 100 a bottle of ara, Nu. 500 for 20 kg of bangchang, Nu 50 for a bottle or one kg of other illicit products in liquid or solid form, and Nu 200 a bottle for the sale of liquors obtained free of duty or imported illegally. The excise authorities confiscate liquors along with the equipment for fermentation and distillation. The laws thus allow for search and seizure, sanctions and
destruction of captured liquor. Nonetheless, how successfully these rules are implemented remains a question in the face of growing market for the local brews.
2.12 Drinking pattern
The 2010 GNH survey, carried out by the Centre for Bhutan Studies (CSB), included five questions related to alcohol consumption.
These questions do not seem to have been designed to capture the problems related to alcohol abuse, but the

Alcohol Use and Abuse in Bhutan
76
data is sufficient to draw some preliminary conclusions on drinking pattern for the present purpose.
It was the population based survey covering about 7143 respondents across 20 districts. The main questions regarding alcohol consumption were: (1) In your entire life, have you ever consumed any kind of alcohol? (2) How old were you when you first started drinking? (3) Have you consumed any type of alcohol during the past 12 months? (4) How often did you consume alcohol during the past 12 months? (5) During the last 12 months, how often did you drink enough to feel intoxicated or drunk, that is, when
your speech was slurred, you felt unsteady on your feet, or you had blurred vision? Question (4) is used here to measure frequency of drinks. However, the number of drinks, volume and alcohol type were not captured in the survey.
While the survey was not exactly designed to measure frequency of drinks, an attempt is made to use this data to apply Frequency Measure (FM) method among others like Quantity Frequency Measure (QFM), Graduated Frequency Measure (GFM), Short-term Recall Method (STRM), Diary Method (DM) and Timeline Follow Back (TLFB). The FM method queries the respondents on their typical
drinking frequency in a given timeframe. Question 4 asks if a respondent drinks every day, occasionally or not at all. Because the FM method does not assess the amount of alcohol consumed on each drinking occasion, it does not allow estimation of a person’s average or total volume of alcohol consumed. The FM method is not the best method to determine the volume of alcohol consumed, but nothing can be done at the moment unless alcohol-related questions are
rephrased and revised in the next survey or in other similar surveys.

Alcoholic Beverage Indicators
77
There is another methodological limitation. The information used here is self-reported consumption, which
is subject to both intentional and unintentional errors of recall by respondents. Denial is often the characteristic of the substance abuse survey. The alcohol dependent often denies the correct answer, and so they underreport the frequency and their drinking habits. Other than estimating how often a person drink, this data does not permit applying standard drink concept.
In the WHO’s Comparative Risk Assessment (CRA) for calculating the Global Burden Disease (GBD, 2004), a
composite index called as Patterns of Drinking Score (PDS) is used. PDS measure the risky and less risky pattern of drinking. It reflects how people drink instead of how much they drink. PDS has different array of drinking attributes such as quantity of alcohol consumed per occasion, festive drinking, proportion of drinking events when drinkers get drunk, the amount drank by the individuals who drink daily or nearly daily, drinking with meals and drinking in public places (Global Status Report on Alcohol and Health, 2011, pp. 15). Exact PDS cannot be applied here, but one of its parameters can be used. Question 5 asks respondent about the proportion of
drinking events that leads to severe intoxication or make person drunk. Higher frequency of drinking events that renders a person drunk reflects higher risky drinking pattern. The WHO (GSR, pp. 16, 2011) defines Heavy Episodic Drinkers (HED) as those who drink at least 60 grams or more of pure alcohol on at least an occasion in the past week. The present data cannot be used to exactly fit this definition, but those who drink to get drunk occasionally
still show a pattern of binge drinking, and some may fall in the HED category.

Alcohol Use and Abuse in Bhutan
78
Of the respondents aged 15–98 years in 2010, 33.5% of male and 36.2% of female abstained from drinking in the
last 12 months. The abstainers here are taken as those individuals who drank in their lifetime, but never drank 12 months prior to the survey. The highest proportion of former drinker was observed in the age range of 36-55 in the case of males, and 26-55 in the case of females. Among the current drinkers, the majority of them were in the age group 26-35 for both male and female. However, females were more likely to be non-drinkers than males (females who did not drink at all in the lifetime was 36.5% and for males was 22.8 %).
Among the current drinkers, 24.5% of males drank daily and female drinking daily was 15.1%. However, more females tended to drink occasionally than male (Table 10). The higher proportion of occasional drinkers was observed in the age groups of 26-55 for both males and females. The individuals drinking daily and getting drunk was insubstantial. However, 18.1% of males and 11.7% of females got drunk occasionally to the extent that one’s speech became slurred, felt unsteady on feet, or had blurred vision. Intoxication level drinking is an important determinant to understand drinking patterns, but it should not be considered as heavy or chronic drinking pattern.
The mean drinking onset age for males was 19.77 and for females it was 20.11. The worrisome trend was that 22% of drinkers had begun drinking at the age of 18 years or before. At this age, young people are not permitted to
drink by legal provisions.

Alcoholic Beverage Indicators
79
Table 10: Prevalence of alcohol consumption and some drinking indices by age and gender
Male (%) Female (%)
Age category
Age category
Drinking pattern 15-25 26-35 36 45 46-55 56-65 66+ Total
15
to
25
26
to
35
36
to
45
46
to
55
56
to
65 66+ Total
Percentage of respondents who get drunk / who do not drink to drunkenness:
Daily 0.0 0.0 0.1 0.0 0.0 0.0 0.2 0.0 0.0 0.0 0.2 0.1 0.0 0.3
Occasionally 0.7 3.2 3.7 3.1 4.1 3.3 18.1 0.5 1.9 2.3 3.6 2.1 1.3 11.7
Never 3.7 14.0 17.0 18.5 16.4 12 81.7 7.6 20.9 20 18 13.1 8.4 87.9
Total 4.4 17.2 20.8 21.7 20.4 15.4 100 8.2 22.8 22 22. 15.4 9.6 100
Percentage of respondents who never drank in their lifetime:
Non-drinker
1.8
3.8
4.6
4.6
3.8
4.1
22.8
7.3
11
9.2
6.8
5.3
4
43.2
Percentage of respondents who drank in their lifetime but did not drink in the last 12 months:
Abstention (12 months)
2.7
6.5
7.3
7.4
5.8
3.8
33.5
5.1
9.8
7.8
7.3
4.2
1.9
36.2
Percentage of respondents who drank in their lifetime and continue to drink:
Current drinker
8.8
25.2
23
18.8
14.9
9.5
100
15
30
22
18
10
5.4
100

Alcohol Use and Abuse in Bhutan
80
Source: GNH survey, 2010, CBS
Male (%) Female (%)
Age category Age category
Drinking pattern
15
to
25
26
to
35
36
to
45
46 to 55
56
to
65 66+ Total
15
to
25
26
to
35
36
to
45
46
to
55
56
to
65 66+ Total
Percentage of respondents who are current drinkers; and drinks daily and occasionally:
Daily 0.8 3.4 4.9 5.0 3.4 0.9 24.5 0.6 3 3.5 3.9 0.9 0.0 15.1
Occasional 8.0 21.6 18 13.8 9.0 5.4 75.5
14.0 28 18 14 6.8 4.4 84.9
Drinking onset (mean age) 19.97 (SD=8.84)
20.11 (SD=7.75)
Drinking onset (age
groups) 18 years below
Male
17.9
15.7
2.2
12.2
Female Total
14.2 29.3
1.6 29.9
24.8 3.8
11.4 37.0
19-30 years 31-50 year)
51 years and above

Alcoholic Beverage Indicators
81
As 18% of males and 12% of females got drunk occasionally, these kinds of drinking patterns can be
taken as ‘binge drinking’. How often a person gets drunk depends on how he or she drinks (with or without meals), the type of drinks, body tolerance and volume. Binge drinking here refers to excessive occasional consumption that can lead to feelings of intoxication and temporary physical dysfunction, whether intentional or unintentional. Only this qualitative definition can be used at present, as there is no standard amount of alcohol that is officially quantified to be considered as binge drinking.
Normally, all kinds of social problems such as traffic accidents, fights and violence occur when a person drinks to an extent that his speech becomes slurred or body become unstable. The probability of an alcohol-related injury tend to be greater among those who get occasionally drunk compared to daily moderate drinkers and heavy alcohol dependents (Gruenewald et al., 1996; Treno et al., 1997 cited in Assanangkornchai et al, 2010, pp. 2010). This occasional heavy drinking pattern occurs mostly in the young age groups (25-45). This should be considered as an issue of concern.
2.13 Drinking Patterns (Thimphu)
The NCD (STEPs) survey data (MoH, 2007) based on
Thimphu population is used to perform the QF analysis. The QF method inquires about the typical consumption pattern over a specific period. This method requires respondents to report the average alcoholic beverages they consume. For example, the NCD survey data provides information on average number of drinks a person drank in a day, week and month. This information can be used to derive the QF result. This survey asked the type of drinks the respondents consumed, and has assumed drinks to be beer, wine, spirits, fermented cider, and (ara, bangchang and singchang). Dawson,1998; Russell et al, 1991 suggested that a single question on overall

Alcohol Use and Abuse in Bhutan
82
consumption gives a lower estimate than data from beverage-specific questions summed across beverages.
While the QF method uses single and multidimensional measures, only a single scale can be used in this study (i.e average drinks per day). With this method, two numbers - quantity and frequency - are multiplied. The quantity is based on the response to a question on the number of standard drinks a person consumed each day.
2.13 (a) Abstainer32
The NCD survey used a reference period of a week, month and a year. The choice of reference period directly affects the way the alcohol consumption is measured. A short-term reference period such as a week (exact recall period) can minimise problems related to retentivity, but do not provide information useful to assess usual pattern of alcohol intake throughout the year. An individual’s pattern of drinking varies with season, and therefore, exact representative drinking week is difficult to be determined. The exact recall period is not suited for the population where people consume alcoholic beverages on an irregular basis. In such case, it is likely to consider the infrequent drinkers as abstainers. The short recall period can also simply provide the volume
of alcohol intake rather than allow to link consumption with alcohol-related problems, as these problems usually occur over a long period (Dawson, 1998).
A long recall period of a month or a year is recommended to assess the population’s accurate drinking pattern and problems. The survey has not collected information on alcohol-related problems, and therefore it is not feasible to assess the alcohol problems among drinkers using this data.
Therefore, this part is confined to assessing drinking patterns, including the prevalence of risk drinking rather

Alcoholic Beverage Indicators
83
than problems linkage. The questions related to the volume and frequency of alcohol consumed was asked in
the NCD survey, but beverage specific question was not asked.
The NCD survey has provided the respondents with pre-coded response categories (coded 1-16 drinks) representing drinking frequencies, instead of asking them an actual number of drinking days such as daily, 5-6 times a week, 3-4 times a week, etc. This second approach, if used, can avoid response error, as some individuals tend to become embarrassed to report the
frequency in the actual number of drinks (Ivis et al, 1997 & 2000). The survey has used the score card.
Among the respondents who consumed alcohol, 34.9% of men and 30.8% of women were current drinkers. Abstention rate was higher among women (63.7%) than among male drinkers (59.8%). In the present context, the abstainers are the respondents who never consumed 12 or more alcoholic drinks in a year preceding the survey (Dawson et al. 1995 cited in Mary C. Dufour, 1999, pp. 10). Among the current drinkers, the mean value of the daily intake was about 3 standard drinks (about 30 gm per drinking day) for men and 2 standard drinks (about 20 gm
per drinking day) for women. These standards are considered to be below the WHO recommended cutoff point (WHO, 2000) of 41-60 gm per drinking day in men and 21-40 gm drinking day in women aged <20 years. This means that on average, Thimphu residents were moderate drinkers. About 91.1% of current men drinkers consumed less than 40 gm per drinking day and 83.5% of women consumed less than 20 gm per drinking day. However, this does not imply that drinking pattern in the country was temperate.

Alcohol Use and Abuse in Bhutan
84
2.13 (b) Harmful and Hazardous drinking
The AUDIT (Alcohol Use Disorder Identification Test), developed by the WHO is used to identify people with hazardous and harmful patterns of drinking. However, STEPS, NCD has not asked questions that can allow the use of AUDIT score. In the NCD report, hazardous drinking was considered as the consumption of 40-59.9 gm of pure alcohol by males and 20-39.9 gm of pure alcohol by females on average in a day. 3.9% of men and 10.4% of women were engaged in hazardous drinking. The greater proportion of both men and women engaged in
hazardous drinking were in the age category of 45-75 years (table 11).
About 4.9% of men consumed more than 60 gm of pure alcohol per day and 5.7% of female consume more than 40 gm of pure alcohol in a day within the past seven days. The WHO (2004) categorise such drinking pattern as heavy episodic drinking (HED). On average, 6.8% of current drinkers who drank in the last 7 days (both sexes) were engaged in harmful drinking. Women were found to be more likely to be engaged in harmful drinking than men. Harmful drinking patterns increased by age for both men and women, with the highest percentage of harmful drinking among them being in the age category 45-75 years.

Alcoholic Beverage Indicators
85
Table 11: Patterns of alcohol drinking indices by age and sex
Male (age groups) Female (age groups)
Alcohol consumption (%) 25 - 34 35-44 45- 54 55- 74 Ave
25 -
34
35-
44
45 -
54
55-
74 Ave Total
% current drinker (last 30 days)
37.5* ± 6
39.8 ± 6.0
27.3 ± 5.5
29.8 ± 6.9
34.9 ± 3.1
26.4 ± 5.1
27.1 ±5.2
26.2 ± 5
20.8 ± 5.3
25.5 ± 2.6
30.8 ± 2.0
% drank in last 12 months
5 .0
± 2.7
5.8
±2.9
5.5
± 2.8
4.7
± 3.2
5.2
± 2.4
7.6
± 3.1
4.9
± 2.5
5.0
± 2.5
5.3
± 2.9
6.0
± 1.4
5.6
± 1.0
Abstainer
57.5
± 6.1
54.4
± 6.0
67.2
± 5.8
65.6
± 7.1
59.9
± 3.0
66
± 5.5
68
± 5.5
68
± 4.5
73.8
± 5.7
68.5
± 2.8
63.7
± 2.1
Drinking frequency (12 months)
Daily
14.5
± 6.7
23.5
± 7.7
32.1
± 10
36.4
± 12
23.0
± 4.1
12.1
± 6.5
17.2
± 7.7
25.3
± 8.7
29.2
± 12
18.3
± 3.9
21.2
± 2.9
% 5-6 days per week
7.3
± 4.8
7.6
± 4.7
6.0
± 5.0
11.1
± 7.7
7.9
± 2.7
1.0
± 2.0
3.2
± 3.6
5.3
± 4.5
5.7
± 5.8
3.2
± 1.6
6.1
± 1.8
% 1-4 days per week
35.5
± 8.9
37.0
± 8.7
33.3
±10
23.7
± 10
33.8
± 4.9
28.3
± 8.9
29.0
± 9.3
32.6
± 9.5
27.6
± 11
29.3
±4.8
32.1
± 4
% 1-3 days per month
25.5
± 8.1
21.8
± 7.5
20.2
± 8.7
17.9
± 9.6
22.5
± 4.3
33.3
± 9.4
32.3
± 9.5
30.5
± 9.3
18.5
± 9.9
30.3
± 4.9
25.5
± 3.3
No. of standard drinks on drinking day (12 months)
% 1 drink
26
± 8.9
27.4
± 8.5
23.2
± 9.1
20.5
± 11
25.1
± 4.8
54.8
± 11
36.7
± 11
25.9
± 9.6
54.0
± 14
44.5
± 5.8
32.4
± 3.7

Alcohol Use and Abuse in Bhutan
86
Male (age groups)
Female (age groups
Alcohol consumption (%) 25 34
35-
44
45-
54
55-
74 Ave.
25 -
34
35 -
44
45 -
54
55-
74 Ave. Total
Mean No. of standard drinks
2.9
± 0.5
2.7
±0.5
2.9
± 0.5
3.8
± 0.7
3.0
± 0.2
1.6
± 0.2
2.0
± 0.3
2.7
± 0.5
2.1
± 0.5
2.0
± 0.2
2.6
± 0.2
% 5+drinks/day (men), 4+drinks/day
(women) 4.6
± 11 15.1
± 8.2 13.6 ± 10
22.5 ± 15
11.9 ± 3.9
4.4 ± 6.1
7.8 ± 7.5
34.8 ± 14
13.4 ± 17
12.1 ± 4.6
0.00 ± 0.0
Hazardous and harmful drinking in the last 7 days
% harmful drinking (=>6drinks/day,=>4
drinks/day)
1.5
± 3.1
4.1
±4.6
9.1
± 8.5
13.3
± 11
4.9
± 3.6 00
2.0
± 3.8
10.9
± 9
7.7
± 10
5.7
± 6.7
6.8
± 6.9
% of hazardous drinking
1.5
± 7.3
5.5
± 5.2
2.3
± 2.4
8.75
± 2.4
3.9
± 7.3
6.7
± 8.2
9.8
± 9.9
13.0
± 15
14.2
± 4.5 10.4
%< 40 g (male) and <20 g (female) of pure
alcohol per day
96.9
± 3.1
90.4
± 6.8
88.6
± 9.5
77.9
± 14
91.1
± 3.5
93.3
± 6.7
88.2
± 9
76.1
± 12
73.0
± 17
86.0
± 3.9
83.5
± 11
Source: Report on 2007 STEPS Survey for Risk Factors and Prevalence of Non-Communicable Disease (NCD) in Thimphu, 2009, page
53-57, Ministry of Health, Bhutan. *± (Confidence Interval)

Alcoholic Beverage Indicators
87
Around 10% of young men aged 25-34 years and 2.4% of women aged 25-34 years were engaged in occasionally
risky drinking habit. Six drinks on any drinking occasion within the last 12 months was taken as a risky drinking habit. This fulfilled the criteria of occasional heavy drinking habit during which a drinker consume the amount of alcohol that can lead to higher probability of acute alcohol-related harms such as injury, violence and risky sexual behaviour (Gruenewald et al., 1996; Treno et al, 1997).
Regular heavy drinkers or alcohol dependents run the
risks of most alcohol related problems, but they also constitute a small number who contribute less to most aggregate alcohol problems (Harold, 1998, p.11). The problem lies with those who are considered occasional drinkers and non-dependents on alcohol. They contribute to a greater number of alcohol-related problems like street brawls, family violence, traffic crashes and other accidents (Edwards et al,. 1994 cited in Harold, 1998, p.11). In Thimphu, young occasional drinkers--mainly the party and drayang goers-- account for a disproportionately large number of alcohol-involved street violence and traffic accidents, rather than the alcoholics or alcohol dependents. At the society-level, alcohol problems are haphazard in nature—probabilistic and time-dependent,
in which occasional heavy drinkers are largely involved.
2.14 Drinking Trend in Bhutan
Notwithstanding that alcohol is culturally embedded, drinking practices in the country, especially drinking contexts (places, time and purposes) have changed over time. They continue to change along with economic and social changes induced by a rapid economic growth, urbanisation and exposure of young people to universal
values and ideals.

Alcohol Use and Abuse in Bhutan
88
In general, culture is not static and so are the drinking customs of the people, depending on the influence of
relaxed social mores and the rapid spread of popular culture through new media like internet and television. The rising incomes and demographic changes and the move towards greater urbanisation influence drinking practices. These are well-established patterns shared by many countries, developed and developing alike.
2.14 (a) Youth and alcohol
According to 2010 GNH survey (CBS), about 8.8% of male
and 14.6% of females aged between 15-25 years were current drinkers. Among them, 0.7% of males and 0.5% of females got occasionally drunk to a level that they experienced both physical and mental abnormality. The National Baseline Assessment of Drugs and Controlled Substance Use in Bhutan (BNCA, 2009) study found that among students (class VII-XII), 32% of them self-reported that they used alcohol once in the past one month; 19% of them reported as occasional drinkers and 0.37% as regular drinkers.
Even in absence of reliable data to validate, it is clear that a substantial number of Bhutanese children--both urban and rural--are brought up in an environment where
alcohol consumption is commonplace. Many of them learn about alcohol with relative ease when they become adolescents. The 2010 GNH survey 33 shows the mean drinking onset age as 18 years (±7) with some drinking as early as at the age of 12. On average, males started to drink at the age of 17 (±7) and the females at 19 (±7). The BNCA (2009) estimated the mean age at the onset of alcohol use at 16 years (±3). The widespread drinking culture, social acceptability, visibility and accessibility to alcoholic beverages can be considered to be some of the
general factors contributing to the early onset of drinking.

Alcoholic Beverage Indicators
89
The ‘social learning’ perspective asserts that drinking families influences the early onset of drinking among
children. This theory affirms (Fossey, 1994, pp.35) that society communicates its culture to the individuals through the process of socialisation, and that the families drinking alcohol serve as avenue for socialisation for not only the adults, but for their children (Fossey, 1994). Families or parents are social models who can exert considerable influence on their children’s behavioral patterns. Many studies evince that awareness of parental drinking habits predicted the alcohol-related attitudes and
bahaviour among adolescents (Maddox, 1970, cited in Fossey, 1994, p. 35).
The ‘direct modeling’ theory further confirms the early acquisition of a particular habit through observation of the behaviour of the ‘role models’ (Fossey, 1994 & 2005). In some rural Bhutanese families, parents are involved in the process of initiating children into using alcohol. The BNCA study (2009) found a strong association between self-reported alcohol use among Bhutanese high-school students and exposure to alcohol-related problems in their families. It observed 39% of classes IX-X and 37% in classes XI-XII reporting their subjection to cruel treatment by their parents and adults who drank.
While there is no concrete data to show that drinking among young people is on the rise, subjective assessment (Dorji, Voices of Bhutanese Youth, 2005) reveals that young people were initiated into drinking through peer pressure. Young people are usually observed to be drinking together on occasions. About 33% of them bought drinks using their own earning, while 40% of them relied on others to get drinks (BNCA, 2009, pp.12).
A new culture of intoxication is emerging. This is manifested in the mushrooming of drayangs and

Alcohol Use and Abuse in Bhutan
90
discotheques in urban centres, where young people come and drink together. A wider range of alcoholic beverages
have been introduced in the markets in recent years to suit all tastes and budgets. As Measham & Brain (2005, pp. 276) concluded that an increasing number of young people in advanced nations form their identities through alcohol consumption, many Bhutanese youths who are exposed to western trendy lifestyles seem to drink to attain self-gratification and integration.
2.14 (b) New drinking culture
Bhutanese society now confronts two competing forces with respects to drinking pattern: the culturally-induced use of alcoholic drinks in rural communities and the emerging commercial interest that promote the expansion of drinking and drinking places into new social contexts. The entertainment market (drayang and party places), operating with commercial interests shape the new social contexts of drinking. The appearance of new alcohol brands is creating ‘cosmopolitan effects of global alcohol brands’. New drinks like Spy, light wine and cider are becoming popular, as the market now targets women. Applying social interpretive perspective, four main factors seem to determine drinking patterns in Bhutan: (1) extreme cold weather during winter leads to drinking; (2)
cultural acceptability and use of alcohol for hospitality; (3) availability of a wide variety of cheap alcoholic beverages including the imported ones, and (4) influence from western trendy lifestyles. This list is not exhaustive.
There is no need for hard facts to prove that the culture of draying, pub, café and discos provide different spatial avenues for drinking, adding to other places like numerous bars, festive occasions, traditional games, sport events and homes. This transition in drinking spaces has
created a new socialising culture in urban locations where on the nights of weekends a significant number of young people, including girls, visit these entertainment venues.

Alcoholic Beverage Indicators
91
Some of them linger in public spaces, occasionally creating dissonance on the streets. Such movement of
people from homes to public spaces often bring into display some disciplinary behavior and family embroilment, especially when married men or women are involved in late-night drinking in drayangs and discos. Weekend drinking holds significance, as these marks a distinction between work and leisure and get-on to foster social ties. At the same time, this trend leads to irregular and intermittent heavy drinking patterns or irregular intoxication, which according to Sande (1996:302 cited in Thomas M. Wilson (91, 2005) is a sign of social problems
and the emergence of undesirable social dynamics. Reducing the quantity or accessibility to alcohol beverages is important since most young people drink together as peers and depend on others to get drinks. Having less alcohol beverages available implicates less drinking. However, what is more important is the need to instill in the young people a responsible attitude towards drinking, right from their early ages. This entails redefining responsible drinking among young people in more culturally sensitive ways, given the social acceptability of alcohol. The youths must be taught to view alcohol as a commodity not to be abused, but to be used for better purposes. They must learn to recognise alcoholic
beverages not as intoxicants, but as social enhancers. The parents have more positive role to play in this respect.
Effective communication about alcohol plays a vital role in shaping young people’s beliefs and perceptions. Mass media influences young people’s views, but the multiplicity of media sources present images that portray alcohol as a source of entertainment and understate the negative consequences of alcohol consumption.
Early intervention on the prevention of alcohol problems among the younger groups, no matter what their costs are, can be justified on the grounds that drinking alcohol

Alcohol Use and Abuse in Bhutan
92
is an addictive behavior that generally starts at young age. This is a problem that if addressed can reduce harm in all
segments of the population (Mullahy and Sindelar, 1990b). The use of education and media to control alcohol-related problems has been met with limited success in many countries, though it remains an important strategy. These measures fail when the education or media-based activities are implemented without social, physical and economic reinforcements. In the Bhutanese education system, there is widely held
view among students that the prevention of drugs and alcohol is not satisfactorily covered in their curriculum and co-curricular activities. The BNCA study (2009) reported that about 50% of class VII-VIII students considered that their curriculum covered this issue only to a ‘certain extent’; 20% of them regarded it was well-covered and 30% reported it was inadequate. About 20% of class IX-X students and 22% of class XI-XII students reported that positive knowledge and skills on alcohol use were not covered enough.
While teachers and parents discuss or advise their children about the ill effects of alcohol and drugs, the BNCA study data reveals the exiguity of such social support: 66% of class VI-IX student-subjects reported that
their teachers discuss drugs and alcohol only occasionally; 48% of them reported their parents discuss this issue sometimes, and about 3% reported that their parents and teachers did not discuss the issue with them (see BNCA report, 2009. pp. 21). There are now divergent views emerging on alcoholism. Many view alcoholics as some kind of moral degenerates; a few people regard alcohol dependence as a disease. The view of the society towards the family of alcohol is
becoming strong, and housewives are regarded as tragic victims of alcoholic husbands. This view is growing, especially with the revamped efforts by non-government

Alcoholic Beverage Indicators
93
agencies supporting women to expose drinking outrages by husbands on their wives.
In traditional Bhutanese society, drinking to get drunk in general is taken to be normal, but as aberrant when drinking into a stupor. A traditional saying that ‘man drinks alcohol; alcohol do not drink men’ euphemises that one who indulges in heavy and frequent drinking lacks self-will. Though alcoholism is socially accepted, many know it possesses a powerful malevolency when consumed beyond
the limit. However, from the health point of view, the alcoholics or their family members do not bother much to get medical care until it is too late. This is a bad trend that needs remediation. The physiological effects attributed to alcohol vary: some people drink just to feel its pleasant effects; some drink for the mellow conviviality and others drinks to get drunk. These variations depend on the cultural toleration of drinks. The Bhutanese, mainly in the east and central regions, are known to drink more. Some villagers go on a drinking bout for days during festive occasions and use alcohol to revive themselves from hangovers. A saying, “ills related to alcohol can be cured by alcohol” seems to influence a relentless drinking.
It is universally accepted that men drink more than women (with some exceptions). It is also admitted that men create more problems when they are drunk. They tend to become more socially disruptive, as evident from subjecting women to domestic violence and economic suffering as a result of scarce cash resource caused by alcohol expenditure. Despite the fact that women are generally considered as
victims of alcoholism, one needs to take into account that women can play a promotional role in alcohol consumption. In rural societies, women are the primary

Alcohol Use and Abuse in Bhutan
94
producers of traditional alcoholic beverages. In urban areas, many of them develop a vested economic interest in
the alcohol trade, as many of the bar operators are usually women. The question then arises whether women can play a leading role in reducing alcohol consumption and in promoting renewed efforts to curb alcohol abuse, or whether men should be totally blamed for their alcoholic behaviour. What should be the positive role of women in this respect?

95
CHAPTER III
3. Healthcare Cost of Alcohol Abuse
3.1 Introduction
The purpose of alcohol policies, according to the WHO’s Global Alcohol Status Report, 2004 is to serve the interest of public health and social well being. Alcohol policies in many countries usually originate from
the ‘recognition’ that excessive alcohol consumption among the citizens pose major impacts on the public healthcare expenditure. Flagrant alcohol abuse34 is associated with huge costs to families, communities, healthcare resources and economy. The enormous costs that alcohol abuse cause to a society merit cost estimation, which even if inaccurate (due to data limitations and requirement of diverse sources of information) can still explicitly or implicitly draw public policy concerns and aid in sound policy interventions.
Many studies are undertaken in developed nations to address the societal cost of alcohol abuse. Single et al (2001) first published international guideline for estimating the cost of substance abuse. It was later
published by the WHO. Rice et al has set a good precedence to estimating societal cost of alcohol abuse (Hodgson & Meiners, 1979). Parker D.L et al (1983) showed that social and economic consequences of alcohol abuse are significant, estimable and avoidable to a certain extent, and that these costs can be minimised through appropriate policy interventions (Parker, D.L et al, 1983). They reasoned that for any policy interventions to work, the policy-makers must know the cost estimates of alcohol abuse.
Estimating societal costs of alcohol abuse is important for Bhutan, considering the special circumstances such as

Alcohol Use and Abuse in Bhutan
96
the ready availability of alcohol, low restriction on alcohol use and cultural disposition to drinking. From the policy
perspective, alcohol abuse is emerging as a major health problem at a time when the government is facing resource scarcity to address lifestyle related diseases amid several other competing priorities. Despite all these, no analysis on the cost of alcohol abuse has been done in Bhutan. In this respect, this study is expected to provide some understanding of the consequences of alcohol abuse in the country even if the present quality of data and analysis limits it to only a
rudimentary analysis of healthcare cost. This report seeks to determine the healthcare costs related to some major alcohol-attributable morbidities and mortality. This study may contribute to the national alcohol prevention policy debates, and more than this, it should serve as groundwork for creating human capital account of the proposed balanced GNH accounts. It is expected to contribute towards illustrating the Cost-of-Illness (COI) methodologies that can be applied to estimate the costs of tobacco, drug abuse, obesity, physical activity, chronic illness and other emerging lifestyle-related diseases in the country.
This study should not be considered as a perfect alcohol COI study. Such studies are expected to evolve. It is prepared as a basis for future studies on avoidable costs of various substances abuse. It is supposed to provide baseline cost information that we can improve and update as and when the information becomes available. It also recognises that it is not feasible to precisely measure societal cost of alcohol abuse; such costs can be only approximated.
Healthcare Cost of Alcohol Abuse
97
3.2 Study Justification
Many studies across the world has converged their findings to conclude that alcohol abuse is associated with health disorders, social problems like traffic accidents, family violence, crime, and youth misbehaviour and economic problems including loss of productivity due to morbidity and premature deaths, work absenteeism, and so on.
Alcohol abuse in Bhutan is emerging as a major health problem. This is clear enough even in absence of a proper
prevalence documentation. It has been identified as one of the five major causes of preventable morbidities and mortality (AHB, MoH, 2010). Like in other societies, the changing socio-economic state influences cultural dynamics and lifestyle including the change in alcohol drinking pattern resulting in new health problems. There has been a significant decline in communicable diseases and increase in non-communicable disease (NCD). This ‘epidemiologic transition’ from the prepotency of infective diseases to communicable diseases may pose a strong challenge to the sustainability of the free public healthcare services. Alcohol abuse problem may become one of the most critical risk factors of overall disease burden in the
country.
The psycho-physiological consequences of exacerbated use of alcohol and the associated healthcare costs have come to the limelight of health authorities and policy makers. The psychiatric unit of the hospital has identified alcohol dependence as a common problem, as out of 1,500 psychiatric patients treated within given three years, 10% of them were alcoholics. On average, more than 90 deaths under medical care alone in a year are attributed to
Alcohol Liver Disease (ALD). Alcohol abuse is associated with traffic accidents, family violence and street fights.

Alcohol Use and Abuse in Bhutan
98
According to the WHO, alcohol abuse contributes to nearly 60 ICDs (WHO, 2000a). Alcohol is becoming a leading risk
factor in low mortality developing countries (WHO, GBD, 2004, p. 1). This has to do with the harmful effects of excessive alcohol on the human body. It can affect all body systems in many different ways; no organs are immune to its effects (Bower, 1992 cited in Thamarangsi, 2008, pp.2).
The estimates done in other countries suggest that the overall cost of alcohol abuse constitutes a substantial part of GDP (Klingemann & Gmel, 2001 cited in Global Status Report on Alcohol, 2004, WHO, p. 65). These costs,
according to Klingemann and Gmel (2001), are termed as ‘social costs’ which accrue from the costs associated with alcohol abuse that are not borne by the drinkers, but which bring negative impact on the society. Harwood, Fountain and Livermore (1998) refer to two types of social costs: direct and indirect. They define the former as value of goods and services directed to address negative consequences of alcoholism and the latter as the loss in productivity and other intangible costs produced by excessive drinking.
Since the government bears the major costs of medical care and rehabilitation, it is reasonable to conclude that alcohol abuse imposes tremendous costs on the public health care resources in the country. The estimation of the
social cost of alcohol abuse is justified in other countries, because it far exceeds the combined costs of tobacco or drug abuse (Catalyst Health Consultants, 2001; Varney and Guest 2002; Fenoglio et al. 2003; Room et al. 2005). The same line of reasoning can be applied to Bhutan.
3.3 Theory and Methods
In the light of several theoretical frameworks and practical approaches used in the conventional alcohol attributable
costs studies that often lead to confusion (WHO, 2009), it is important to determine the costs that one is interested in, and in the proper costing methods.

Healthcare Cost of Alcohol Abuse
99
The WHO (2010) has chosen three dimensions of alcohol-attributable costs. First, health and crime expenditures,
often called as direct costs in COI studies. This includes extra resources spent on healthcare, law enforcement, prevention cost and damage to property due to drunk-driving accidents. Second, labour and productivity costs usually referred to as indirect costs that include reduction in economic output as a result of diminished capacity, injuries, disability, premature deaths. The third type of cost is non-financial welfare costs. It refers to pain and suffering experienced by drinking individuals and their families and communities. This cost is also called as
intangible cost in COI studies. While all three categories of costs need to be determined to make a complete cost estimate, this study is confined to a single direct healthcare cost component. The other cost components are simply explained rather than deriving the costs in monetary terms. This is only due to data limitations. Every effort was made to collect all the relevant data from different agencies, but it did not help much as many agencies did not fully cooperate--and even if a few did--the data was not fully usable for this purpose. Their statistics were maintained in the format that did not serve the present purpose. Two datasets were used: JDWNRH’s medical records and
dataset maintained by Bhutan Health Information and Management System (HMIS, MoH). Elaborate analysis on ALD was done using JDWNRH medical record, as ALD was one of the major causes of mortality in this hospital. The medical records of this hospital follow the ICD-10 system that makes it easier to identify partially alcohol-attributable diseases. JDWNRH’s dataset was chosen for the main analysis assuming that a greater number of last stage ALD patients
attend the national referral hospital. Most alcoholic patients seem to seek medical care when they have ‘progressed’ into the long-term health effect of alcohol

Alcohol Use and Abuse in Bhutan
100
abuse. The HMIS’ database was used to derive the crude cost estimates at the national level. The problem with the
HMIS database was that it had been maintained as per the national disease classification system in which diseases are classified in broad categories.
To arrive at the national cost estimate, the costing analysis was done at two levels. The costing analysis for JDWNRH was done in more detail, and according to the approach adopted in other similar studies. The data was more case specific and maintained as per ICD-10. The costing analysis for Regional Referral Hospitals (RRHs),
District Hospitals (DHs) and BHUs was done rather in crude way.
3.4 Costing analysis I
Alcohol is casually related to more than 60 International Classification Diseases (ICDs), and many disease outcomes are related to alcohol abuse (Rehm, Graham, Room et al., 2003). The concept of categorical attribution was applied to estimate alcohol-attributable healthcare cost for identifiable disorders. When applying the categorical attribution, two forms of attribution--wholly and partially attributable to alcohol abuse were used. Diseases such as Alcohol Liver Disease (ALD, ICD-K70),
mental and behavioral disorder due to alcohol abuse (ICD-F10), toxic effect of alcohol (T51) and Alcoholic Disease Syndrome (T501) were considered to be wholly attributable to alcohol abuse, and thus, were assigned 100% or a value of 1.
Just as in other countries, much interest was focused on the inpatient care cost for selected diseases, identifiable as wholly attributable to alcohol abuse, and those conditions partially attributable to alcohol. The number of patients
admitted with conditions wholly attributable to alcohol was obtained using JDWNRH medical records (retrospective approach). To estimate the cost of wholly

Healthcare Cost of Alcohol Abuse
101
alcohol-attributable hospitalisation, the exact number of days the patients stayed in JDWNRH during each
admission episode was determined using the hospital record (for the year 2005, 2006, 2007, 2008 and 2009). These hospital-stay durations were multiplied by per bed day costs for all diagnosis.35 A prevalence-based approach was used to estimate the cost. This means the cost was based on past and present alcohol consumption.
A per bed day cost was directly imputed from the recent healthcare costing analysis conducted by the MoH (The cost of Your Healthcare-A costing of healthcare services in
Bhutan, 2009-2010, PPD, MoH, September, 2011).36 This healthcare costing report contains unit cost for inpatient, outpatient and disease-specific inpatient cost for all level of hospital (see table 14). An average was taken from a five years time frame to derive costs at an annual level, which was calculated both at the current and constant rates. The unit cost per diagnosis, though available, was not factored in the case of JDWNRH’s dataset analysis. The patients’ hospital stay-based costing was limited to JDWNRH. The outpatient ALD cases in JDWNRH were insignificant and excluded.
For those conditions that were partially attributable to alcohol, the ICD conditions were identified using the similar study conducted in Thailand (Thavorncharoensap,
M, 2006). The list of diseases chosen for cost estimation in this study almost corresponded to the ones used in the study by Rehm et al (2003). These diseases were considered to have multiple causes with alcohol being one of the causal factors (partly attributable condition). Examples of other harmful effects of alcohol include risks of hypertension and stomach ulcers, indirect pancreatic damage (Apte Wilson and Korsten, 1997) or some neuropsychiatric conditions and neoplasm. The other diseases related to alcohol are liver cirrhosis, alcoholic
psychosis, mental disorders, epilepsy, hypertension and some digestive system diseases (WHO, Int. Guide…, 2002). See Table 12 for the list of partially attributable

Alcohol Use and Abuse in Bhutan
102
conditions. Many other partially attributable diseases could not be included because there was simply no data.
The most important issue was how to derive Alcohol Attributable Fractions (AAFs) or Population Aetiological Fractions (PAFs). The AAFs are the indirect quantification of morbidity and mortality due to a specific risk factor. This factor is a coefficient that measures the proportion of the frequency of each health disorder and deaths considered attributable to alcohol abuse. In other words, AAF is the proportion of the total cases of
disease or injury that is unlikely in absence of exposure to the risk factor (English et al,. 1995). The AAFs =P(RR-1)/[1+P(RR+1)] for the country could not be determined at present due to the requirement of information such as Relative Risks (RRs) of a particular disease for different levels of alcohol abuse and the Prevalence (P) rate for alcohol consumption among adult population.
In absence of the country-specific alcohol attribution factors, the only option at this point was to use the AAFs applied in other countries, that is, those that were derived through established epidemiological criteria and found [by reviews and meta-analysis] to be sufficiently reasonable to use at the international level.
This study accepts that the use of externally-derived AAFs can be somewhat problematic, as it takes into account similar risks and exposure for populations that are potentially dissimilar. However, this approach was the best one could do. Extensive literature reviews revealed there are [limited] similar studies done in a few developing countries. The study that was useful for the present purpose was that of Thavorncharoensap et al (2006) in Thailand. The AAFs for different disease conditions were
excerpted from this study. Some AAFs were derived from other sources (see Table 12).

Healthcare Cost of Alcohol Abuse
103
Table 12: Alcohol Attributable Fractions (AAFs) used in this study (for ICD-10 diseases mostly recorded in JDWNRH)
Disease/condition
AAFs ICD-10 Code
Source of information
M F
Alcohol Liver Disease (ALD) 1 1
Wholly attributable
Alcoholic disease syndrome 1 1
Wholly attributable
Mental and behavioral disorders due to use of alcohol 1 1
Wholly attributable
Acute and chronic pancreatitis 0.36 0.1 K85, K861 Carroa G et al. 2000
Cholethaiasis -0.19 -0.07 K80 Gutjahr E et al. 2001
Liver cirrhosis 0.82 0.27 K70-K74 Rehm J et al 2004
Degenerative nervous system 1 1 G312 Rehm J et al 2004
Diabetes mellitus -0.06 -0.02 E10 - E14 Gutjahr E et al. 2001
Epilepsy 0.66 0.21 G40 - G41 Gutjahr E et al. 2001
Ethanol toxicity 1 1 T510 English DR et al 1995
Female breast cancer 0 0.05 C50 Rodolfo B et al 2001
Hemorrhagic stoke 0.14 -0.07 I63 - I66 Reynolds K et al 2003

Alcohol Use and Abuse in Bhutan
104
Disease/condition
AAFs
M F
ICD-10 Code
Source of information
Ischemic heart disease -0.12 -0.06 I20 - I24 Carroa G et al 2000
Ischemic stroke -0.01 -0.11 I60 - I62 Reynolds K et al 2003
Laryngeal cancer 0.68 0.26 C32 Gutjahr E et al. 2001
Liver cancer 0.49 0.16 C22 Gutjahr E et al. 2001
Mouth and oropharynx cancer 0.52 0.17 C00-C14 Gutjahr E et al 2001
Esophageal cancer 0.6 0.24 C15 Gutjahr E et al 2001
Oesophageal varices 0.77 0.23 I85 Gutjahr E et al 2001
Other neoplasm 0.14 0.04 D00-D48 Rehm J et al 2004
Psoriasis 0.38 0.17 L40 Gutjahr E et al 2001
Stomach cancer 0.69 0.1 C16 English DR et al 1995
Contact with knife, sword or dagger 0.083 0.083 W26 Ridolfo et al2001
Spontaneous abortion 0 0.4 O03 ARDI37
Source: Most of AAFs are same as the ones used in Thavorncharoensap et al, 2006, the economic costs of alcohol consumption in Thailand, 2006.

Healthcare Cost of Alcohol Abuse
105
The number of in-patients in JDWNRH with partially-attributable conditions was multiplied by their
corresponding AAFs (Table 13) and then by the unit cost of each diagnosis. Per bed day costs could not be factored in as calculating the number of patient stay in JDWNRH for all conditions partially attributable to alcohol involve looking singly over 5,000 medical face sheets within the same dataset. There was no time to follow this approach.
Table 13: AAFs for Diseases Partially Attributable to Alcohol
Disease/condition
AAFs
M F
ICD-10
Code
Source of
information
Diabetes mellitus -0.06 -0.02 E10 -E14
Gutjahr E et al. 2001
Epilepsy 0.66 0.21 G40 -G41
Gutjahr E et al.
2001
Hypertension 0.21 0.12 I10 - I15
Carroa G et al. 2000
Ischemic Heart
Disease -0.12 -0.06 I20 - I24
Carroa G et al. 2000
Other neoplasm
0.14
0.04
D00-D48
Rehm J et al 2004
3.5 Costing analysis II
A crude cost estimate was derived for the whole country using the hospital admission (both inpatient and outpatient) episodes of wholly and partially attributable to alcohol. The database used here was that of HMIS, MoH. The number of admissions (IPD) and out-patients (OPD) episodes for ALD and other partially attributable conditions (broadly categorised as shown in table 13) were derived for three levels of health facility, namely Regional Referral Hospital (RRH), District Hospitals (DHs) and BHUs. The cost for each condition (inpatient and outpatient) was estimated by multiplying the number of hospital admissions and visits by the unit cost per

Alcohol Use and Abuse in Bhutan
106
hospital admission (IPD) or hospital visit (OPD). The unit cost for both inpatient admission and outpatient visit was
obtained from the MoH’s costing analysis (2009-2010) as shown in Table 14.
Table 14: Average unit cost at different level medical facility in 2009/2010 in Nu.
JDWNRH
RR
Hospital
District
Hospital BHU I
Unit cost Unit cost Unit cost
Unit
cost
Outpatient Department
(OPD)
OPD visit 597 635 307 163
Inpatient
Department
(IPD)
Admissions 17848 17354 10116 5657
Used for
partially
attributable
disease
(DHs, RRHs
and BHUs)
Bed Days 2810 2795 NA NA
Used for
ALD (K70,
F10, T501)
JDWNRH
Source: The cost of Your Healthcare: A costing of healthcare services in Bhutan, 2009-2010, PPD, Ministry of Health, p. 20.
3.6 Results
3.6.1 Wholly Attributable Alcohol Disease (AAFs=1)
In JDWNRH, a total of 598 episodes (185 died) of ALD between 2005 and 2009 was observed. Their last stay in the hospital and those patients who recovered totaled to about 9,131bed days. At a cost per bed day of Nu. 2,810, JDWNRH alone spent about Nu. 20.6 million (taken at constant price for five years). At current price, it was
about Nu. 25.66 million. This came to about Nu. 4.12 million per year.

Healthcare Cost of Alcohol Abuse
107
Going by the five years healthcare expenditure for three wholly alcohol attributable conditions (ALD for all health
facilities plus F10-Mental and behavioural disorders due to use of alcohol and T51-Toxic effect and alcohol in JDWNRH), the total cost amounted to about Nu. 64.50 million (Table 15). This was about Nu. 13 million per year at constant price. This cost was incurred on inpatients alone.
The cost for ALD inpatients in 42 district hospitals was about Nu. 18.9 million over five years. On average, annual expenditure in 42 district hospitals for ALD inpatients
alone was Nu. 3.7 million. The ALD medical care cost was second highest in 42 district hospitals when all health facilities were taken together. The third highest expenditure was on the ALD patients admitted in Gelephu Regional Referral Hospital (total for five years was Nu. 6.9 million), and the fourth highest was spent in Mongar Referral Hospital (total for five years was Nu. 5.8 million). Total ALD outpatient cost for five years (2005-2009) was about Nu. 0.72 million (average outpatient cost for ALD per year was Nu. 0.14 million). The ALD outpatient cost in 42 hospitals was the highest. The second highest was in Mongar RRH, and the third highest was in Gelephu RRH. The outpatient cost for ALD in JDWNRH was negligible, and so was omitted (see Table 16).This indicates that
patients being admitted in JDWNRH and other hospitals were usually the ‘most progressed’ in ALD. In all, the total cost of outpatients wholly attributable to alcohol was less by almost Nu. 63 million.

Alcohol Use and Abuse in Bhutan
108
Table 15: Total cost of treating Alcohol Liver Disease (ALD, In-patient) and other wholly attributable diseases: F10 & T501 cases in JDWNRH
Year
JDWNRH*
Gelephu RR Hospital
Mongar RR Hospital
District Hospitals Total
Mn. Nu F10+ T501
Mn. Nu Mn. Nu Mn. Nu Mn. Nu
Cu Co
Cu
Co Cu Co Cu Co Cu Co Cu Co
2005 3.7 3.4
1.1
0.9 4.3 3.9 1.2 1.1 4.6 4.2 14.8 13.5
2006 5.7 4.9
2.8
2.4 0.7 0.6 1.8 1.9 5.1 4.3 15.5 13.4
2007 6.7 5.6
1.7
1.4 0.7 0.6 1.7 1.4 6.3 5.2 17.2 14.1
2008 4.6 3.5
2.2
1.6 1.0 0.8 1.9 1.5 5.1 3.9 14.8 11.3
2009 4.4 3.2
2.8
2.1 1.4 1.1 1.8 1.0 6.8 4.9 16.9 12.3
Total 25.2 20.6
10.4
8.3 8.2 6.9 7.6 5.8 27.8 18.9 79.2 64.5
*cost for JDWNRH calculated based on patient bed-day, F10+T501 wholly attributable diseases added to JDWNRH. Abbreviation- Co:
Constant Price and Cu: Current Price.

Alcohol Use and Abuse in Bhutan
109
Table 16: Total cost of treating Alcohol Liver Disease (out-patient only)
Gelephu RR Hospital Mongar RR Hospital All hospitals Total
In. Mn. Nu. In. Mn. Nu. In. Mn. Nu. In. Mn. Nu.
Year Cu. Co. Cu. Co. Cu. Co. Cu. Co.
2005 0.018 0.008 0.03 0.03 0.1 0.09 0.2 0.1
2006 0.008 0.007 0.12 0.11 0.13 0.12 0.27 0.23
2007 0.018 0.015 0.04 0.03 0.11 0.09 0.17 0.14
2008 0.029 0.022 0.02 0.01 0.10 0.07 0.15 0.11
2009 0.038 0.028 0.00 0.00 0.10 0.08 0.15 0.11
0.112 0.088 0.22 0.19 0.55 0.45 0.88 0.72
*JDWNRH, ALD outpatient cost negligible, so ignored. Co: Constant price, Cu: current price
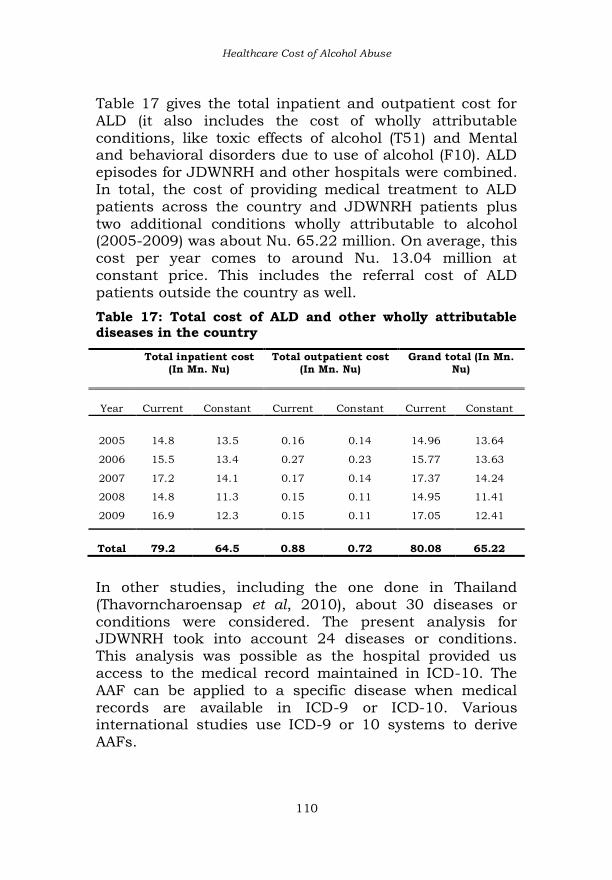
Healthcare Cost of Alcohol Abuse
110
Table 17 gives the total inpatient and outpatient cost for ALD (it also includes the cost of wholly attributable
conditions, like toxic effects of alcohol (T51) and Mental and behavioral disorders due to use of alcohol (F10). ALD episodes for JDWNRH and other hospitals were combined. In total, the cost of providing medical treatment to ALD patients across the country and JDWNRH patients plus two additional conditions wholly attributable to alcohol (2005-2009) was about Nu. 65.22 million. On average, this cost per year comes to around Nu. 13.04 million at constant price. This includes the referral cost of ALD patients outside the country as well.
Table 17: Total cost of ALD and other wholly attributable diseases in the country
Total inpatient cost
(In Mn. Nu)
Total outpatient cost
(In Mn. Nu)
Grand total (In Mn.
Nu)
Year
Current Constant Current Constant Current Constant
2005 14.8 13.5 0.16 0.14 14.96 13.64
2006 15.5 13.4 0.27 0.23 15.77 13.63
2007 17.2 14.1 0.17 0.14 17.37 14.24
2008 14.8 11.3 0.15 0.11 14.95 11.41
2009 16.9 12.3 0.15 0.11 17.05 12.41
Total 79.2 64.5 0.88 0.72 80.08 65.22
In other studies, including the one done in Thailand (Thavorncharoensap et al, 2010), about 30 diseases or conditions were considered. The present analysis for JDWNRH took into account 24 diseases or conditions. This analysis was possible as the hospital provided us access to the medical record maintained in ICD-10. The AAF can be applied to a specific disease when medical records are available in ICD-9 or ICD-10. Various international studies use ICD-9 or 10 systems to derive
AAFs.

Alcohol Use and Abuse in Bhutan
111
The total cost of partially attributable diseases or
conditions in JDWNRH for five years (2005-2009) was
about Nu. 21.41 million (Table 18). Taking an average,
this cost was about Nu. 4.28 million per year.
Table 18: Total cost of partially attributable
diseases/conditions in JDWNRH (At constant price)
Disease/ Conditions 2005 2006 2007 2008 2009
Total
Neoplasm (ICD: C01, C03,
C04, C10, C15, C16, C22,
C32, C50) 2.84 2.41 3.8 3.2 4.02 16.27
Malignant neoplasm of
unspecified parts of tongue,
palate and mouth (ICD:
CO2, C05 and CO6 0.01 0.09 0.13 0.04 0.05 0.33
Epilepsy (G40-G41) 0.04 0.57 0.57 0.47 0.51 2.16
Hypertension, stroke (I10, I
11, I 13, I 47, I 12, I 64, I
63, I 48) 0.24 0.3 0.43 0.42 0.36 1.75
Pancreatitis, Liver cirrhosis,
other diseases of liver and
pancreas (K73, K74, K76,
K85, K86) 0.22 0.16 0.18 0.21 0.22 0.98
Cholelithiasis (K80) -0.06 -0.49 -0.55 -0.50 -0.72 -2.32
Psoriasis (L40) 0.02 0.04 0.03 0.04 0.02 0.16
Spontaneous abortion (O03) 0.09 0.40 0.42 0.56 0.61 2.08
Total 3.4 3.5 5.0 4.4 5.07 21.41*
*Total cost is about Nu. 26.59 million in current price.
At the national level, data for partially attributable diseases was selected from the HMIS. It has medical records for 180 BHUs, 42 district hospitals and two regional referral hospitals. On top of the ALD, only four diseases partially attributable to alcohol could be used for the costing (Table 19) using HMIS data for the whole
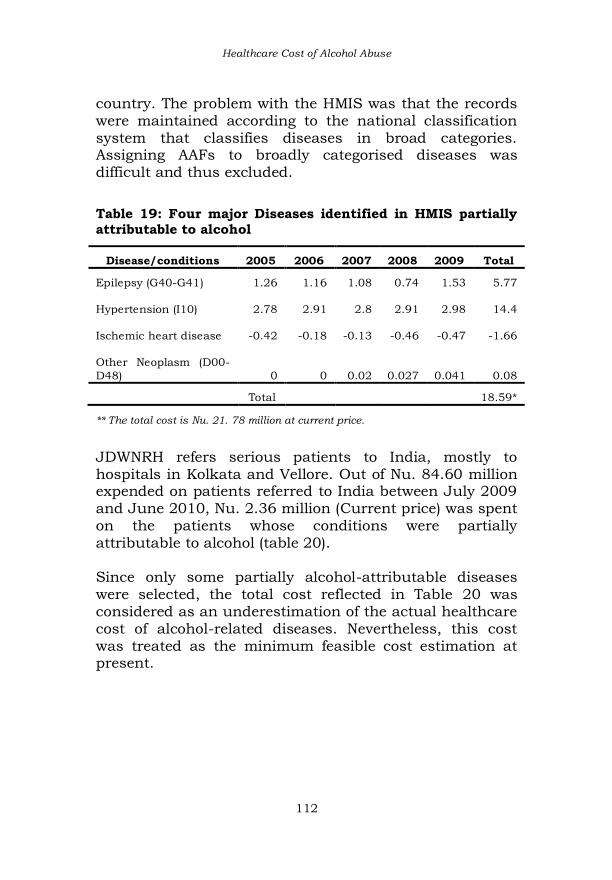
Healthcare Cost of Alcohol Abuse
112
country. The problem with the HMIS was that the records were maintained according to the national classification
system that classifies diseases in broad categories. Assigning AAFs to broadly categorised diseases was difficult and thus excluded.
Table 19: Four major Diseases identified in HMIS partially attributable to alcohol
Disease/conditions 2005 2006 2007 2008 2009 Total
Epilepsy (G40-G41) 1.26 1.16 1.08 0.74 1.53 5.77
Hypertension (I10) 2.78 2.91 2.8 2.91 2.98 14.4
Ischemic heart disease -0.42 -0.18 -0.13 -0.46 -0.47 -1.66
Other Neoplasm (D00-
D48) 0 0 0.02 0.027 0.041 0.08
Total 18.59*
** The total cost is Nu. 21. 78 million at current price.
JDWNRH refers serious patients to India, mostly to hospitals in Kolkata and Vellore. Out of Nu. 84.60 million expended on patients referred to India between July 2009 and June 2010, Nu. 2.36 million (Current price) was spent on the patients whose conditions were partially attributable to alcohol (table 20). Since only some partially alcohol-attributable diseases were selected, the total cost reflected in Table 20 was considered as an underestimation of the actual healthcare cost of alcohol-related diseases. Nevertheless, this cost was treated as the minimum feasible cost estimation at present.

Alcohol Use and Abuse in Bhutan
113
Table 20: Out-country (India) treatment expenditure on patients with alcohol attributable conditions
Alcohol
Attribution
Fraction
Final Diagnosis &
Treatment Out come
M
F
No.
of
case
Total cost
(Mn. Nu)
Current
price
Cost
attributed
to alcohol
(Mn. Nu.)
Current
price
Cirrhosis of Liver (K70-
K74) 0.82 0.27 3 633,493 519,464
Acute Pancreatitis (K85,
K861) 0.36 0.10 4 394,947 43,833
Esophageal Cancer (C15) 0.77 0.23 8 844,470 408,063
Hypertension (I10-I15) 0.21 0.12 3 268,611 52,307
Breast Cancer ((C50) 0 0.05 6 368,720 18,436
Stomach cancer ((C16) 0.69 0.1 2 209,564 62,291
Diabetes Mellitus (E10-
E14)
-
0.06 0.02 1 868,093 17,362
Mouth and Oropharynx
cancer (C00-C14) 0.52 0.17 18 2,195,519 1,123,879
Laryngeal Cancer (C22) 0.68 0.26 1 121,000 82,280
Epilepsy (G40-G41) 0.66 0.21 1 76,000 15,960
Degenerative Nervous
System (G312) 1 1 1 7,458 7,458
Other Neoplasm (D00-D48) 0.14 0.04 1 63,539 8,895
Total
6.05 2.36
Source: Treatment Referral Office JDWNRH, Thimphu.
As shown in Table 21, the total cost for alcohol related treatment in the country was roughly Nu. 105.3 million for five years (2005-2009) at a constant price (Table 3.10) and Nu. 130.81million at current price. There was not much variation in the annual cost between 2005 and 2009.

Healthcare Cost of Alcohol Abuse
114
Taking the average, the annual healthcare cost for alcohol related diseases was about Nu. 21.06 million (Constant
price) and Nu. 26.16 million (Current price). Added to this cost was the expenditure on the patients referred to India. This expenditure was about Nu. 2.36 million (Current price) or Nu. 1.72 million (Constant price). Therefore, annual expenditure on alcohol-related diseases or conditions was roughly Nu. 22.78 million (Constant price) or Nu. 26.16 million (Current price).
Table 21: Total cost wholly and partially alcohol attributable diseases in the country
Total
(for
ALD
and
other
wholly
alcohol
attribut
able)
Total (for
partially
attributab
le
diseases
in
JDWNRH)
Total (for
partially
attributab
le
diseases
in 20
districts
Grand
Total
% of Govt.
health
expenditu
re
% of
GDP
Year
In Mn.
Nu
(Constan
t Price)
In Mn.
Nu
(Constant
Price)
In Mn.
Nu
(Constant
Price)
In Mn.
Nu
(Consta
nt Price)
In Mn. Nu.
(Constant
Price)
Real
GDP
2005 13.64
3.40
3.62 20.66 1.97 0.05
2006 13.63 3.48 3.89 21.00 1.75 0.04
2007 14.24 5.01 3.76 23.01 1.12 0.05
2008 11.41 4.44 3.22 19.07 Nil 0.03
2009 12.41 5.07 4.08 21.56 Nil 0.03
Total 65.22
21.4
18.59 105.3
Out-country (India) referral cost for alcohol-attributable conditions (2009-2010) was added to calculated percentage share of treating these conditions to government healthcare expenditure and percentage share of GDP. At the time of this cost estimation, the government healthcare expenditure for 2008-2010 was not available. Taking figures for a three year (2005-2007) on average, the percentage share of healthcare costs per

Alcohol Use and Abuse in Bhutan
115
year for alcohol related diseases or conditions was about
1.84% at constant price. The percentage share to the overall healthcare government expenditure was decreasing over the years. This could have been due to the increase in government healthcare expenditure in recent years. The government expenditure on alcohol related diseases or conditions to real GDP over the last five years varied between 0.03 and 0.05.
3.7 Conclusion
This cost estimation includes just the direct healthcare component of COI studies. It is possible that the largest cost component is not covered. Usually, the indirect cost outweighs direct cost, but indirect cost could not be determined at present. In Thailand, indirect cost associated with productivity loss due to alcohol-induced premature mortality and morbidity, constituted about 95.8% of the total cost in 2006. The healthcare cost was about 3.5% of the GDP, the cost of property damage due to drunk driving and road accidents was 0.5% of the GDP and the cost associated with law enforcement was 0.2% of GDP (Thavorncharoensap, M et al, 2010). Going by Thailand’s experience, the present cost estimation constitutes just a small proportion of the total social and economic cost of alcohol abuse in Bhutan. A comprehensive costing needs to be done to get the close estimate of the overall cost of alcohol abuse to the Bhutanese society. It is probable that the social and economic cost of alcoholism in Bhutan can be considerably huge.
3.8 Other costs of alcohol abuse
Besides being a risk factor to health, alcohol leads to crime, work absenteeism, loss of productivity, damage to
Healthcare Cost of Alcohol Abuse
116
property and physical abuse and suffering, all with spillover effects on the happiness and well being of the
families and society. These problems deserve attention in such a study, but these are the areas that had to be dropped due to data constraints. The various other consequences of alcohol abuse are just discussed rather than imputing costs in monetary terms. These are the main limitations of this study, which will be discussed in the end of this chapter with the aim to apprise readers that the healthcare cost estimate is just a small cost component part of much
bigger cost of alcohol abuse. 3.8.1 Treatment of alcohol diseases in Traditional Medicine Hospital
The National Traditional Medicine Hospital (NTMH) serves as the referral hospital for traditional medicine services in the country. Introduced in 1967, the traditional medicine system was gradually integrated into Bhutan’s healthcare system. Traditional medicine centres are available in most of the allopathic hospitals across the country and are accessible to all sections of the Bhutanese society with no extra cost. Many Bhutanese seek medical services for a wide-range of chronic diseases such as asthma, rheumatism, sinusitis, arthritis, liver problems and
diseases related to digestive and nervous systems (Dendup, U & Jamphel, K, AHB, 2010, pp. 17). The NTMH provided access to the data on alcohol-related hospital treatment in 19 districts for the period between 2007 and 2009. However, the data from the NTMH was not available, though NTMH could have treated more cases. Depending on the location of the centres across 19 districts, they were grouped and put under their respective Dzongkhags to provide Dzongkhag level
traditional medical care services provided to illnesses related to alcohol. According to the traditional medicine system, alcohol-related diseases are broadly covered into

Alcohol Use and Abuse in Bhutan
117
four categories: Gall Bladder Disease (mKhris ned), (bed sMrug), Liver Diseases (mChing ned) and (grang rlung). The Dzongkhag-wise distribution of service availed is presented in the Figure 19.
Figure 19: Alcohol-related treatment in the Traditional Medicine Centres (2007-2009) in 19 Dzongkhags
Source: National Traditional Medicine Institute, Thimphu. The data for NTHM is not available.
0 200 400 600 800
1000 1200
Par
o
Tras
hig
ang
Bu
mth
ang
Ch
ukh
a
Pem
agat
shel
Pu
nak
ha
Mo
nga
r
Haa
Tro
ngs
a
Sam
dru
pjo
ng…
Sarp
ang
Tsir
ang
Zhem
gan
g
Lhu
ents
e
Wan
gdu
eph
o…
Tras
hiy
angt
se
Dag
ana
Sam
tse
Gas
a
2009
0 200 400 600 800
1000 1200
Tras
hig
ang
Par
o
Bu
mth
ang
Mo
nga
r
Tro
ngs
a
Haa
Pu
nak
ha
Ch
ukh
a
Wan
gdu
eph
o…
Pem
agat
shel
Sarp
ang
Sam
tse
Sam
dru
pjo
ng…
Tras
hiy
angt
se
Tsir
ang
Dag
ana
Zhem
gan
g
Lhu
ents
e
Gas
a
2008
0 200 400 600 800
1000 1200
Tras
hig
ang
Par
o
Bu
mth
ang
Mo
nga
r
Tro
ngs
a
Haa
Pu
nak
ha
Ch
ukh
a
Wan
gdu
eph
od…
Pem
agat
shel
Sarp
ang
Sam
tse
Sam
dru
pjo
ngk…
Tras
hiy
angt
se
Tsir
ang
Dag
ana
Zhem
gan
g
Lhu
ents
e
Gas
a
2007
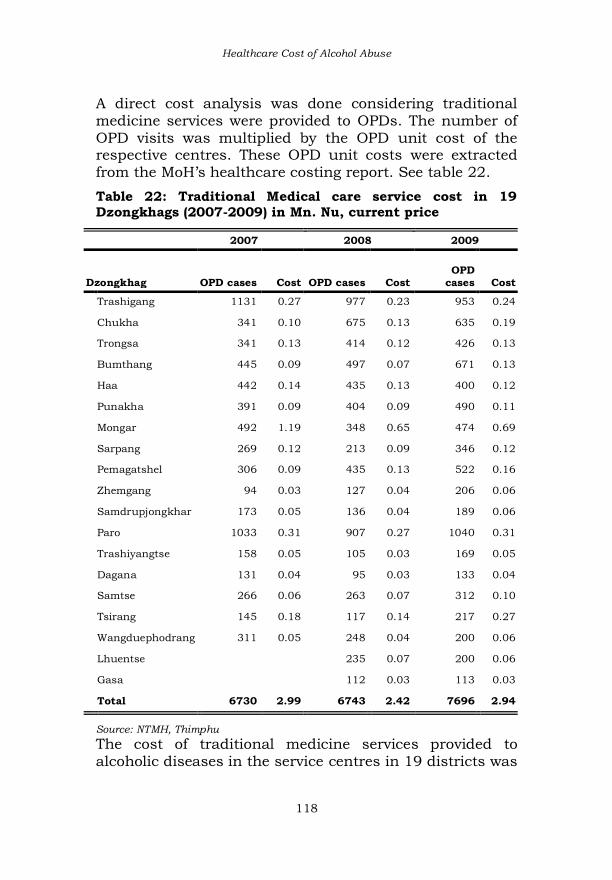
Healthcare Cost of Alcohol Abuse
118
A direct cost analysis was done considering traditional medicine services were provided to OPDs. The number of
OPD visits was multiplied by the OPD unit cost of the respective centres. These OPD unit costs were extracted from the MoH’s healthcare costing report. See table 22.
Table 22: Traditional Medical care service cost in 19 Dzongkhags (2007-2009) in Mn. Nu, current price
2007 2008 2009
Dzongkhag OPD cases Cost
OPD cases Cost
OPD
cases
Cost
Trashigang 1131 0.27 977 0.23 953 0.24
Chukha 341 0.10 675 0.13 635 0.19
Trongsa 341 0.13 414 0.12 426 0.13
Bumthang 445 0.09 497 0.07 671 0.13
Haa 442 0.14 435 0.13 400 0.12
Punakha 391 0.09 404 0.09 490 0.11
Mongar 492 1.19 348 0.65 474 0.69
Sarpang 269 0.12 213 0.09 346 0.12
Pemagatshel 306 0.09 435 0.13 522 0.16
Zhemgang 94 0.03 127 0.04 206 0.06
Samdrupjongkhar 173 0.05 136 0.04 189 0.06
Paro 1033 0.31 907 0.27 1040 0.31
Trashiyangtse 158 0.05 105 0.03 169 0.05
Dagana 131 0.04 95 0.03 133 0.04
Samtse 266 0.06 263 0.07 312 0.10
Tsirang 145 0.18 117 0.14 217 0.27
Wangduephodrang 311 0.05 248 0.04 200 0.06
Lhuentse 235 0.07 200 0.06
Gasa 112 0.03 113 0.03
Total 6730 2.99 6743 2.42 7696 2.94
Source: NTMH, Thimphu
The cost of traditional medicine services provided to alcoholic diseases in the service centres in 19 districts was

Alcohol Use and Abuse in Bhutan
119
about Nu.2.78 million (current price) per year. This is the
case when diseases are assumed to be wholly attributable to alcohol, which may not be correct. Nevertheless, given the complexity involved in determining the AAFs, there was a little one could do other than to assume these diseases as wholly attributable to alcohol.
3.8.2 Drink driving and property damage According the Statistical Year Book (NSB, 2010), there were 461 recorded motor road accidents in 2009 due to all
causes. The Traffic Division, Thimphu of the Royal Bhutan Police recorded 112 accidents throughout the country as attributable to alcohol. This suggests that 24.30% of the total motor accidents on the record were attributable to drunk-driving in 2009. A simple description of the property damage due to drunk-driving is presented in table 23. The costing analysis could not be done for the reason that (1) it is complex to determine who bears the cost resulting from motor accident related to property damage (can be culvert, poles, fence, house, etc); and (2) the cost associated with damage of vehicles can be external or internal, depending on the vehicle ownerships (say, in case of collision); it is hard to know the cost the owners has to bear. Horlings & Scogging (2006) made the case that a greater degree of damage leads to higher insurance premiums, thereby affecting the benefits accrued to everyone who insures their vehicles. The fact that the insurance companies in Bhutan do not pay premium when a person responsible for motor accidents is found intoxicated, invalidates the Horling & Scogging’s argument. However, the third party insurance scheme ensures that any other party whose property is damaged due to inebriation of a person responsible for crash or accident is compensated.

Healthcare Cost of Alcohol Abuse
120
Table 23: Property damage due to drunk-driving
Year
No. of MV
accidents &
damage
Total
property
damage
No. of other
property damage
2005 24 34 10
2006 21 30 9
2007 27 37 10
2008 26 32 6
2009 112 154 42
2010 110 119 9
Total
320
406
86
Source: Traffic Division, Thimphu, Royal Bhutan Police, 2011
Alcohol-related motor accidents incur administrative cost such as policy implementation, law enforcement, drunk-driving campaigns, and etcetera. These costs could not be estimated. The medical care cost associated with the alcohol-involved motor accidents was not accounted for the reason that the nature of hospitalisation could not be determined. Table 24: Alcohol-involved motor road accidents, injury and dead in Bhutan (2005-2010)
Year
No. of MV
accidents Injured
Dead Adult
Minor
Total
casualty
2005 24 34 10 11 2 14
2006 21 30 9 9 0 9
2007 27 37 10 15 0 40
2008 26 32 6 22 1 56
2009 112 154 42 6 0 30
2010 110 119 9 34 0 65
Total 320 406 86 97 3 214
Source: Traffic Division, RBP, Thimphu, 2011

Alcohol Use and Abuse in Bhutan
121
3.8.3 Drinking and family violence The costing for alcohol-related family violence could not be done. Except for a few social organisations catering to the welfare of the alcoholics, a large part of the costs are borne by the families and communities who support them through social safety net. Omitting this cost will introduce significant downward bias, but without sufficient data, both theoretical possibilities of counting these costs and practical measurability remain difficult.
The cost of treating and helping the alcoholics and their family members constitute an important component of the COI studies. The number of victims (incidence) supported by RENEW is presented with no analysis (Table 25). The alcohol and drugs related cases are not so notable.
Table 25: Incidence of victims of different categories of domestic violence supported by RENEW, 2009-2010
Year 2010 2009
Willful negligence 71 43
Abuse and battery 110 97
Prostitution 1 1
Extramarital affairs 23 6
Alcohol and drugs 4 2
Child labour 0 2
sexual harassment 2 5
Rape 6 0
Trafficking 0 1
Assault 4 2
Mental health 3 7
Re-admission 18 28
Others 26 25
Total
268
239 Source: RENEW Secretariat, Thimphu.

Healthcare Cost of Alcohol Abuse
122
Many rehabilitation and help centres are established in the country to support alcoholics and their victims. It is
possible that these centres would have maintained their expenditure records, identifiable for those attributable to alcohol and other drugs. However, this costing analysis may have to be done separately in future. The alcohol-attributable crime and court cases costs are expected to account for a significant economic burden. Estimating these cost components is again not possible. It is difficult to determine the relationship between alcohol and crime or court cases from the records available.
Having their records maintained in a format that the role of alcohol in crime and lawsuits can be captured or identified can be useful to estimate indirect cost of alcohol abuse in future. It is just a matter of improving the present system of maintaining both crime and court records so that alcohol-related crime and court cases are discernible. The cost of alcohol-related crime can be based on the loss incurred on the offenders and victims as consequences of the crime, as well as the overall cost of policing and administering justice. Likewise, the cost of court cases includes the cost of rendering justice by judiciary system and the cost to the litigants.
The cost associated with alcohol research activity is usually included in the COI studies; this costing could not be done in this study. The alcohol abuse prevention costs such as the cost of health campaigns by NGOs, Royal Bhutan Police (RBP) campaigns, and school-based alcohol prevention education could not be incorporated owing to lack of data and due to the fact that costs are split among many organisations.
A well-conducted COI studies estimates the labour cost that arise from the productivity loss due to alcoholism, as well as indirect costs that ensue as a result of efficiency

Alcohol Use and Abuse in Bhutan
123
loss in one area of economy, and its ripple effects in other
sectors of economy (WHO, 2009: 32, 116). The loss of productivity at work is visible in the organisations where people often miss work or where they work under the influence of alcohol and its associated hangover symptoms. There is no record for these components to estimate the cost of productivity loss.
The premature mortality cost is another important component of COI studies. The human capital approach is applied in most of the COI studies. The estimate is based
on how much economic value a person would have created if this person lived to the full average national life expectancy. This cost component was dropped.

124
CHAPTER IV
Descriptive Analysis of Hospital Admissions for Alcohol Liver Disease in JDWNH (2005-2009)
4.1 Introduction
Alcohol Liver Disease (ALD ICD-10:K70) is one of the main causes of morbidity and mortality in Bhutan. The ALD is usually the consequence of excessive consumption of alcohol over a long period. ALD is preventable as well.
Chronic drinking causes several types of liver disease including in pathological changes in liver such as fibrosis, cirrhosis, steatosis and alcoholic hepatitis (Liang.W, et al, 2010, 34). The hospital episode-based morbidity (hospital admissions across the country) for ALD has increased from 937 in 2003 to 1,602 in 2009 (almost by twice in 6 years). The ALD continued to be one of the topmost morbidities and cause of deaths and contributed 10-13% of total deaths in the country (AHB, 2006, pp.10). In 2009, 134 indoor patients died of ALD. Between 2005 and 2009, 117 deaths on average per year were attributed to ALD (HMIS, MoH). ALD did not come among the top ten morbidities
recorded in JDWNRH statistics (2007, 08 and 09), but was the second most common cause of deaths in 2007, after Septicemia. ALD constituted 11.24% of deaths in JDWNRH in 2007, 5.30% in 2008, and in 2009, it became the topmost cause of mortality in 2009 in the same hospital (11.45% of all the hospital deaths).
ALD-induced deaths can be one of the most reliable and
robust indicators of overall alcohol-related problem in the Bhutanese society. Brunn et al (1975) reviewed several clinical and non clinical studies of heavy drinkers and

Alcohol Use and Abuse in Bhutan
125
found that a greater proportion of heavy drinkers died of liver cirrhosis, which is a common form of liver disease. It
was this study that laid the foundation for an influential public health policy of controlling alcohol liver disease through price and availability control mechanisms (Mann, et al, pp. 2009, 2003). ALD (K70-ICD) has many types, the most prevalent being fatty liver, alcoholic hepatitis and cirrhosis.
Although ALD has become one major source of disease burden, no proper study has been done on ALD morbidities and mortality. This chapter aims to describe
ALD admissions, mortality and some demographic characteristics of the ALD patients.
4.2 Methods
4.2.1 Data source A retrospective descriptive analysis of ALD morbidity and mortality in JDWNRH is done using the hospital statistics for the period between 1999 and 2010. To analyse some demographic variables like occupation and ALD patients’ origin, the analysis was confined to the period between 2005 and 2009. It should be noted that different reference years were used for different analysis.
JDWNRH records contain discharge statistics which were collected as the routine hospital episode statistics (1999-2010). This database is chosen as it contains patients’ information such as date of admission, discharge, present and permanent address and occupation. The data (JDWNRH) covered the subjects who had been referred from District Hospitals (DHs) and Regional Referral Hospitals (RRHs). The hospital episode is one best source of data on alcohol-
related deaths and illness. However, this source focuses on the individual patients and contains little or no information on how these drinkers harms others. The data

ALD Descriptive Analysis
126
reported here can be under-represented because many could have died outside the healthcare system. Moreover,
ALD cases are mostly not reported unless severe symptoms are observed. It is likely that those individuals with less severe symptoms of ALD do not seek medical services. For the healthcare costing analysis, every admission with ALD diagnosis was counted, even if the patient was re-admitted. This was done on the grounds that every re-admission would have incurred cost on the hospital. However, to analyse the demographic variables like
Dzongkhag of origin and occupation of the ALD patients, care was taken to ensure that the re-admission was not recounted. This was done by ensuring that the same registration number was not counted twice.
4.2.2 Statistical analysis To derive Case Fertility Rate (CFR), Directly Standardised Mortality Rate (D-SMR) and other trend analysis, all the episodes of hospital re-admissions that occurred before 365 days were included. At the end of one year, if there was any re-admission, it was recorded as a new index admission. Case Fatality Rates (CFRs) was calculated using a simple formula:
The direct standardisation method was applied to calculate Standardised Death Rates (SDR). This was calculated to compare ALD mortality with the deaths resulting from all other causes in JDWNRH for the period 2005-2010 (adult deaths, age >15). That is, the number of ALD deaths from among 1,000 deaths due to other causes. In this direct standardisation method, the age-specific death rates for ALD were also applied. The unique thing about this approach was that instead of using total

Alcohol Use and Abuse in Bhutan
127
ALD population to derive ALD death rates, the number of deaths (due to all other causes) was used.
JDWNRH’s total inpatient population was used as a standard population. The age-group specific weights were derived from the standard population. The directly standardised rate of death for each age stratum was calculated using the formula:
Where:
rk = rate in k-th stratum of the study population (study population here is ALD deaths in JDWNRH)
Nk = number of persons in k-th stratum of the standard population (Standard population here is total deaths due to all other causes in JDWNRH in 2009)
N = total number of persons in the standard population ( Nk)
Wk = weight for each stratum (equal to Nk/N)
means summation over the k strata.
The age-adjusted direct ALD Mortality Rate was calculated for specific age-groups to compare mortality at different age groups between 2005 and 2010. As mortality varies greatly by sex, age-specific mortality rate were given

ALD Descriptive Analysis
128
separately for males and females. This was preferred assuming that the alcohol related mortality is strongly
related not only to age but to gender as well.
4.3 Results
The Case Fatality Rate (CFR) for ALD in JDWNRH was compared between male and female. Of all 1,011 ALD cases (1999-2010), 333 died of ALD, making the overall fatality rate of 33% (Figure 20). The male CFR was higher than that of female indicating more probability of men dying of ALD. The male CFR increased and peaked in
2002, 2006 and 2008. The female CFR remained stable from 1999 to 2001, decreased in 2002 and equaled that of men in 2007. In all, the CFR was decreasing from 2007.
Figure 20: ALD Case Fatality Rate and Recovery Rate (JDWNRH, 1999-2010)
In Table 26, the crude ALD death rate (out of deaths due to other causes in JDWNRH, 2005-2010) was 137 deaths per 1,000. The crude rate, which is a summary measure, has a tendency to hush up the heterogeneity of stratum-
specific mortality rates. Looking at different age stratums, the most ALD deaths occurred in the 35-49 age groups.

Alcohol Use and Abuse in Bhutan
129
This is of concern, because ALD patients die at a young age. The deaths due to all other causes occurred mostly in
the age group 65-79. This excludes deaths at the age 15 and below. Table 26: Directly standardised death rates for different age stratum of ALD patients in JDWNRH (2005-2010)
Age Group
Deaths in JDWNRH (2005-2010)
ALD death Rate*
JDWNRH Inpatients Pop (2005-
2010)
All causes except ALD
Death rate (all causes) ALD
15-19 58 1.43
0 0.0 4068
20-24 83 0.81
4 4.8 10298
25-29 85 0.86
5 5.9 9864
30-34 86 1.68
14 16.3 5127
35-39 87 2.47
29 33.3 3517
40-44 95 3.85
30 31.6 2470
45-49 111 4.94
32 28.8 2245
50-54 130 6.04
28 21.5 2154
55-59 121 6.95
17 14.1 1741
60-64 130 6.59
9 6.9 1974
65-69 155 8.88
18 11.6 1745
70-74 157 9.63
11 7.0 1631
75-79 112 11.03
7 6.3 1015
80-84 62 9.58
2 3.2 647
85+ 35 11.90
0 0.0 294
15-19 58 1.43
0 0.0 4068
Total 1507 206
48789
Crude rate 136.7 (ALD deaths per 1000 other deaths)
*ALD deaths per 1000 deaths from all other causes in JDWNRH

ALD Descriptive Analysis
130
The directly standardised rate of ALD deaths among deaths due to all other causes was derived by using the
formula given below:
The directly standardised rate of deaths due to ALD was
118 per 1,000 deaths due to other causes in JDWNRH. This also implies that about 12% of deaths that occurred in JDWNRH constituted ALD mortality. The adjusted ALD mortality rate derived separately by sex shows higher rates of ALD deaths among men in the 44-49 age group. Higher rates of ALD deaths were observed among women in the 50-54 age groups (Table 27). The mean age of alcohol deaths was 49.28 with standard deviation of 12.95. It has been found that alcohol liver disease is higher in countries where people traditionally consume more alcohol (Robert E. & Mann et al, 2003, pp 213). The rising cases of ALD in the country indicate either the increased reporting to the hospitals, or an
increase in the alcohol consumption among the Bhutanese population, or an increase in other hepatitis virus infections (because people who have hepatitis viruses are more likely to suffer from liver disease when they drink).
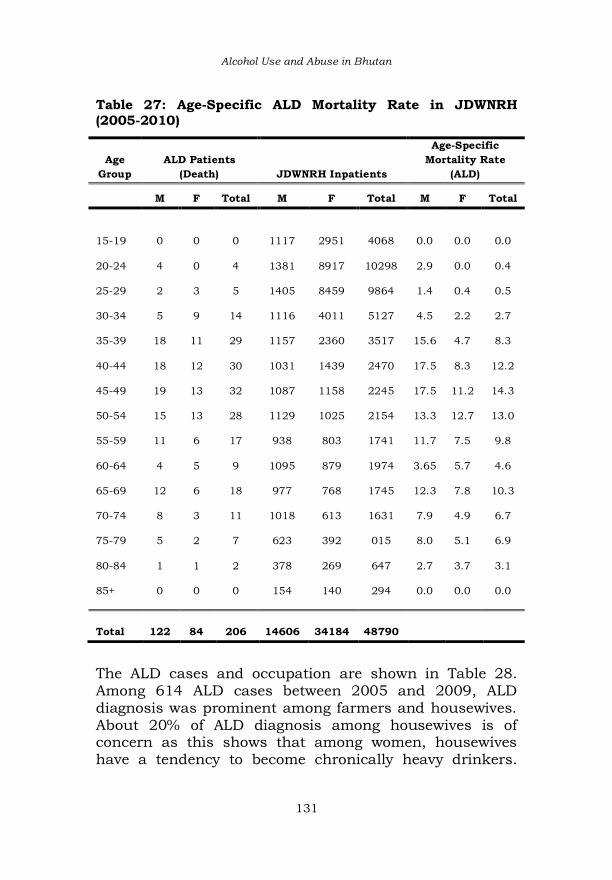
Alcohol Use and Abuse in Bhutan
131
Table 27: Age-Specific ALD Mortality Rate in JDWNRH (2005-2010)
Age
Group
ALD Patients
(Death) JDWNRH Inpatients
Age-Specific
Mortality Rate
(ALD)
M F Total M F Total M F Total
15-19
0
0
0
1117
2951
4068 0.0 0.0 0.0
20-24 4 0 4 1381 8917 10298 2.9 0.0 0.4
25-29 2 3 5 1405 8459 9864 1.4 0.4 0.5
30-34 5 9 14 1116 4011 5127 4.5 2.2 2.7
35-39 18 11 29 1157 2360 3517 15.6 4.7 8.3
40-44 18 12 30 1031 1439 2470 17.5 8.3 12.2
45-49 19 13 32 1087 1158 2245 17.5 11.2 14.3
50-54 15 13 28 1129 1025 2154 13.3 12.7 13.0
55-59 11 6 17 938 803 1741 11.7 7.5 9.8
60-64 4 5 9 1095 879 1974 3.65 5.7 4.6
65-69 12 6 18 977 768 1745 12.3 7.8 10.3
70-74 8 3 11 1018 613 1631 7.9 4.9 6.7
75-79 5 2 7 623 392 015 8.0 5.1 6.9
80-84 1 1 2 378 269 647 2.7 3.7 3.1
85+ 0 0 0 154 140 294 0.0 0.0 0.0
Total
122
84
206
14606
34184
48790
The ALD cases and occupation are shown in Table 28. Among 614 ALD cases between 2005 and 2009, ALD diagnosis was prominent among farmers and housewives. About 20% of ALD diagnosis among housewives is of concern as this shows that among women, housewives have a tendency to become chronically heavy drinkers.
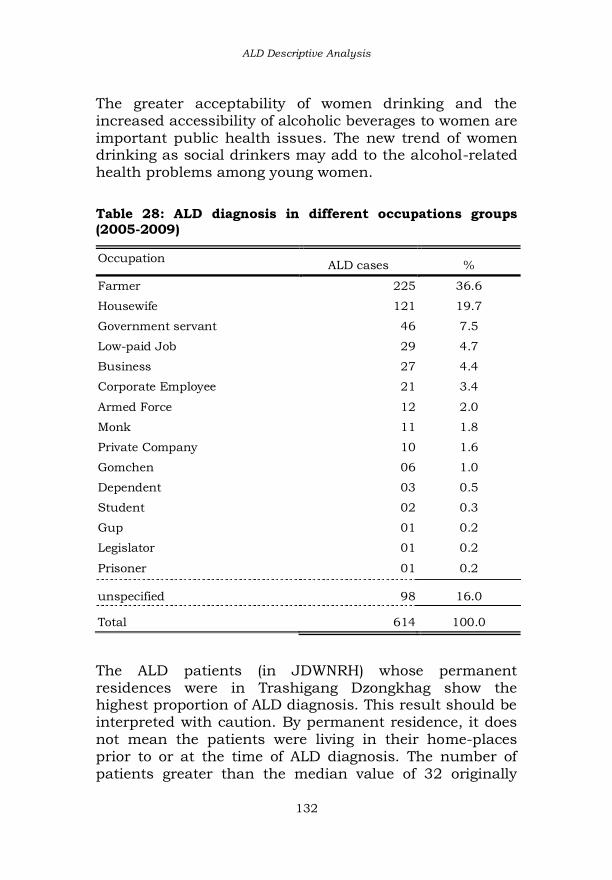
ALD Descriptive Analysis
132
The greater acceptability of women drinking and the increased accessibility of alcoholic beverages to women are
important public health issues. The new trend of women drinking as social drinkers may add to the alcohol-related health problems among young women.
Table 28: ALD diagnosis in different occupations groups (2005-2009)
Occupation ALD cases %
Farmer 225 36.6
Housewife 121 19.7
Government servant 46 7.5
Low-paid Job 29 4.7
Business 27 4.4
Corporate Employee 21 3.4
Armed Force 12 2.0
Monk 11 1.8
Private Company 10 1.6
Gomchen 06 1.0
Dependent 03 0.5
Student 02 0.3
Gup 01 0.2
Legislator 01 0.2
Prisoner 01 0.2
unspecified 98 16.0
Total 614 100.0
The ALD patients (in JDWNRH) whose permanent residences were in Trashigang Dzongkhag show the highest proportion of ALD diagnosis. This result should be interpreted with caution. By permanent residence, it does
not mean the patients were living in their home-places prior to or at the time of ALD diagnosis. The number of patients greater than the median value of 32 originally

Alcohol Use and Abuse in Bhutan
133
belonged to Thimphu, Samtse, Pemagatshel, Chukha, Mongar and Punakha (table 29).
Table 29: ALD cases and their Dzongkhag of origin
Frequency Percent
Trashigang 63 10.3
Thimphu 52 8.5
Samtse 47 7.7
Pemagatshel 46 7.5
Chukha 38 6.2
Mongar 34 5.5
Punakha 33 5.4
Dagana 31 5.0
Sarpang 31 5.0
Wangdue 30 4.9
Tsirang 28 4.6
Paro 28 4.6
Zhemgang 27 4.4
Lhuentse 27 4.4
Trashiyangtse 25 4.1
Bumthang 21 3.4
Samdrupjongkhar 14 2.3
Haa 9 1.5
Non-national 14 2.3
Total 614 100.0
4.4 ALD Mortality Trend
The ALD mortality rate has increased in the last 7 years (2003-2009). This analysis is for the whole country, based on the data extracted from HMIS. The ALD cases of JDWNRH are incorporated in the HMIS database.

ALD Descriptive Analysis
134
The current trend of ALD mortality reported in the country shows that harmful effects of drinking reported to the
referral hospitals were the more serious cases. The reported cases of ALD mortality increased from BHUs to district hospitals, regional referral hospitals and in the national referral hospital, whereas, the morbidities related to ALD were observed to be higher in the lower tiers of hospital systems. The less serious ALD cases may not have been even reported to hospitals, though potentially a large segment of the population may have been experiencing mild ALD symptoms.
It may be possible that minor illnesses were not taken seriously to the level of seeking medical care, until it was too late. For example, there is a social stigma in Bhutan when it comes to seeking psychiatric help to cure those psychiatric conditions caused by alcoholism. Except for some dip in 2008, both ALD morbidity and mortality cases on the whole were rising steadily between 2003 and 2009 (figure 21 (a) (b)).
Figure 21: ALD mortality cases in different tiers of health facility in Bhutan (2003-2009)-a
0
100
200
300
2003 2004 2005 2006 2007 2008 2009
BHU
District Hospital
Regional Referral Hospital

Alcohol Use and Abuse in Bhutan
135
Figure 22: ALD mortality+morbidity cases in different tiers of health facility in Bhutan (2003-2009)-b
As shown in Figure 22, the total CFR in the country increased gradually between 2006 and 2009. The development of ALD is a long term process and is the result of long-term alcohol consumption. In the initial years, ALD symptoms are mild and remain undetected.
It is possible that the prevalence of undiagnosed ALD was higher than reported in the hospital records. The higher rate of survival (recovery) was observed. This can be due to advances in disease management, but it also would have occurred with significant cost to the hospital healthcare resources. The higher rate of ALD recovery cases suggest more resources were spent on this otherwise preventable disease.
225 147 203 254 229 212 212 0
500
1000
1500
2000
2003 2004 2005 2006 2007 2008 2009
BHU I District hospitals
Gelephu RR hospital Mongar RR hospital
JDWNRH Total

ALD Descriptive Analysis
136
Figure 23: ALD total CFR and survival rate in Bhutan (2003-2009)
More than 67% of the total ALD patients under medical care between 1999 and 2010 in JDWNRH recovered. About 68.3% of men and 64.94% of women recovered after treatment. Alternatively, the survival comparison between men and women can be made by dividing the number of survivors by the number of deaths in each gender category. For men, it was about 643:204, which is 3.15 and for females, 239:129, which is, 1.85. The probability of men surviving was almost 3.15 times the probability of dying, while for women, the probability of recovering was
1.85 times more than the probability of dying. In other words, the probability of dying for men was 1:3.15=0.29 times the probability of surviving while for women the probability of dying was 1:1.85=0.54 the probability of surviving. In general, the odds of surviving is calculated using the formula:
Odds survival =

Alcohol Use and Abuse in Bhutan
137
The odds ratio of survival for men was =3.15/0.29=10.86 and 1.85/0.54=3.42 for women. The odds of survival for
men was about seven times more than that of women. On the contrary, it was observed that ALD incidence (between 2003 and 2009) was higher among men than women (Figure 23)
Figure 24: ALD incidence by sex, 2003-2009
The odds of the survival ratio indicate women were less likely to recover from ALD than men, but it is difficult to establish whether Bhutanese women in general are at greater risk of developing ALD. In UK, studies have established that women tend to be more susceptible to severe liver damage after a short period of excessive drinking and at a lower alcohol intake (Saunder, J B et al, 1981, pp. 1140). These authors have attributed more susceptibility of women to alcoholic hepatitis and to difference in body composition and immune reactivity between the sexes. Frezza et al (1990) has shown that females are actually at higher risks of ALD because of the biological factors.
412
564 563
720 738
620
721
328 392
468 499 522 513
630
2003 2004 2005 2006 2007 2008 2009
ALD cases across Bhutan by sex
Male Female

ALD Descriptive Analysis
138
4.5 Conclusion
In this study, the gradual increase in overall ALD morbidity and mortality were observed between 1999 and 2009. A slight decrease in ALD mortality in 2008 cannot be explained. This increase in ALD hospital admissions among the Bhutanese population suggests an increase in the prevalence of total ALDs among the population. ALD is a long-term disease and predominates among the middle age cohort. The prevention of the observed trend in ALD morbidity and mortality is likely to emerge as an important policy issue.

139
CHAPTER V
Multiple Logistic Regression Analysis of Frequent Alcohol Use (FAU) among Thimphu Population in 2007
5.1 Abstract
I have used a binary logistic regression analysis to predict Frequent Alcohol Use (FAU) pattern among Thimphu residents from the selected predictors (NCD survey, 2007).
The specific target drinking pattern of interest is the Frequency of Alcohol Use categorised into dichotomous groups—-Frequent Alcohol Users (FAU) and Non-Frequent Alcohol Users (NFAU). The predictor variables for the model are gender, age (25-74 years), education, annual household income (AHI), and physical activity (PA). The results show that the model examining all the five independent variables together is not statistically significant, though only the gender variable comes out as the strongest predictor of the FAU. The other predictor variables do not contribute much to the predictive power of the model. In other words, the odds of drinking frequency decrease by a factor .504 if a
respondent is woman compared to a man, controlling for other variables. The logistic model here explains about 20% of the variance in the Frequent Alcohol Use (FAU) among the Thimphu population in 2007. Or alternatively, it classifies 79.1 % of the cases of Non-Frequent Alcohol Users. I conclude that the model is not the best-fit model, but it may reveal some important policy issues.

Alcohol Use Pattern Thimphu
140
5.2 Introduction
The Ministry of Health (MoH) Statistics reveal that alcohol abuse among the Bhutanese is one of the leading preventable causes [among 5] of morbidities and mortality. Between 2003 and 2007, the annual Alcohol Liver Disease (ALD) death rate alone was 92, not including the other 60 or more conditions that the WHO has attributed to the alcohol misuse. The ALD was listed as one of the top causes of disease burden and mortality in the country.38 The WHO has also identified Bhutan as the highest per
capita alcohol consumption country in South Asia (2006).The alcohol misuse is linked to other problems such as traffic accidents, family violence, divorces, fights and youth problems. The purpose of this chapter is to assess the impact of a set of predictors on frequency of alcohol use among Thimphu population. This analysis seek to answer the question: can we accurately predict the Frequent Alcohol Use (FAU) among Thimphu population from age, gender, education, Annual Household Income (AHI) and Physical Activity (PA)? I have structured the paper as follows: First, I briefly reviewed the methodological strategy and the data source. Then, I presented the results of the data analysis using
descriptive statistics and multiple logistic regressions. Finally, I summarised the study results.
5.3 Method
The dependent or the outcome variable of interest, Frequent Alcohol Use (FAU) pattern was constructed as ‘yes or no’ dichotomous indicators, based on the response to NCD (2007) survey questionnaire item: “In the past 12 months, how frequently have you had at least one drink?
Respondents who answered they drank daily, 5-6 times a week and 1-4 times a week are classified as the FAUs (coded ‘Yes=1’) and (coded ‘No=0’) for Non-Frequent
Alcohol Use and Abuse in Bhutan
141
Alcohol User (NFAUs)—those who drank less than once in
a month plus those who did not drink at all within last 12 months. The categorical dependent variable of the study necessitated the use of multiple logistic regression model to investigate whether the likelihood of frequent alcohol use among Thimphu population is related to the selected predictors. I preferred to use the backward stepwise method, as there
is no previous research to base my hypothesis. In this analysis, I was not so interested in causality, but to explore the best model that fits the data in hand. I believed this method could eliminate the suppressor effects that normally occur when a predictor has a significant effect due to another variable being held constant. The logistic regression model fitted to the data is:
(Where b0 is a constant. b1, b2 . . . b1 are logistic coefficients or
estimates for the parameters, 1, 2. . . 11). The codes 1 and 2 or 3 are used which the SPSS by design convert them to dummy code 0 and 1 when the reference category is set. *AHI is Annual Household Income, PA-Physically Active and NPA-Non-Physically Active.

Alcohol Use Pattern Thimphu
142
5.4 Data Source
This study drew data from the NCD Survey 2007 (MoH) questionnaire containing items designed to elicit information from Thimphu population, about the fore-mentioned categories of alcohol use frequency, along with some basic demographic information. The survey had selected Thimphu for being the ‘home’ for the largest urban population comprising the individuals from every part of the country. The study population included any Bhutanese individual
of both sexes, and aged between 25-74 years, living in Thimphu City at the time of study between July and September, 2007. A sample size of 2,800 people was targeted, and this size was determined according to the STEPS approach of estimating minimum sample size, inflating it to adjust expected 12% of none response.39 Since the sampling was designed well, I have omitted post-stratification weighting of the sample. A stratified two-stage sample was drawn, using the PHCB, 2005 as a sampling frame. The first stage of sampling took 19 blocks out of 46 blocks using probability proportionate to size (PPS) sampling [restricted to the Bhutanese]. The second stage of sampling selected individuals within each selected block. A listing of households and people (aged
25-74 years) was prepared for every sample block as a sampling frame [NCD Report, MoH, 2008].
5.5 Data Analysis
The preliminary analysis of the data was performed to check the assumptions of logistic regression with respect to the selected predictors. I have subjected all the predictors to linear regression analysis to evaluate multi-collinearity among them. The rationale behind doing this
was that multi-collinearity among the predictors in logistic regression creates problems for the validity of the model. In particular, it affects the validity of the statistical tests of

Alcohol Use and Abuse in Bhutan
143
the regression coefficients by inflating their standard
errors (Garson quote, 2010). Mayer (1995) suggested that that a tolerance value of less than 0.1 almost certainly indicates a serious collinearity problem. The result of the analysis shows that the data did not violate the multi-collinearity assumption. The tolerance value of each independent variable was greater than 0.791, which exceeds the suggested criteria of below 0.10 (Mayers, 1995 & Pallant, 2007). Lack of multicollinearity among the independent variables was further supported
by the obtained Variance Inflation Factor (VIF) values which range from 1.05 to 1.27. Mayers (1990) suggested that a VIF value greater than 10 is a serious case of concern, and in the present data, the VIF values were below the cut-off value of 10 (see table in annexure 2). The final condition value was 15. 606, which was not big compared to other dimensions. I concluded that there was no collinearity problem in the model.40 After this preliminary analysis of the data, I performed a descriptive analysis to give some basic background for the analysis. I used the binary logistic regression procedure in SPSS 16.0 to determine whether the likelihood of FAU can be predicted from the independent variables.
5.6 Results
5.6.1 Sample description or descriptive analysis
Among the respondents, approximately 40.4% were Sharchops, 27% Ngalongps, 19.5% Lhotshampas, 8.6% Bumtaps/Khengpas and 3.3% others (see Descriptive Analysis Output Table 3 in the annexure). About 38% of the respondents have consumed alcohol within the past 12 months and 62 % did not drink. The proportion of the respondents by age groups who consumed alcohol was 8.4% (age group 25-34), 8.6% (age group 35-44), 7.3% (age

Alcohol Use Pattern Thimphu
144
group, 45-54) and 10% (age above 55). The prevalence of ‘ever drank alcohol in the past 12 months’ was higher
among Sharchops (17.5%) than among Ngalong (8.4%), Bumtaps/Khengpas (3.6%) and Lhotsampas (7.1%). In the sample, there were 1,009 men and 1,292 women. 1,318 of them had no formal education while 1,073 had some formal education [ranging from less than primary education, monastic education to the post graduate level].
5.6.2 Logistic regression analysis The initial log likelihood (-2LL) was 2512.685, and after
adding a new predictor variable (age), the log likelihood41 changed to 2512.593, which was just a change of 0.092 (also a chi square value42 in the model). The reduction was too small, and therefore, the model was no better than before adding the age variable. The small chi square value [251.685-251.593=.092] shows insignificant reduction—and moreover—it was not significant at p<.0001. The ‘significance value’ was about 0.762. The Hosmer and Lemeshow Test statistic was 8.239 at 0.411 significance value. This value was not significant, indicating the new model was not fairly predicting the real world data. See the tabled results output in Table 30 and 31.
The estimate model was represented as:
This shows that the age coefficient was not statistically significant (sig: 0.762). Exp (B)43 for age variable was 0.999 [lower limit 0.992 and upper limit 1.006], implying that for an age difference, a person was 0.999 times less likely to be the FAU. For example, a 26 year-old person was likely to drink 0.999 times less than a 25 year-old person. The model

Alcohol Use and Abuse in Bhutan
145
classified just 20.9% of the FAUs or 79.1% of Non-
Frequent Alcohol Users (NFAUs). So my first conclusion was: overall the model was not predicting FAU significantly better than the initial model (that is, when the age as a predictor variable was not included), or in other words, there was no significant contribution of the age variable to the predictive power of the model.44Thus, there was no difference in drinking frequency between different age groups.
On adding the new gender predictor to the model, the -2LL reduced by 31.259 with 1 degree of freedom (df) significant at below p<.0001. This shows that gender had statistically significant explanatory power in explaining the variations in the FAU. The -2LL was now 2481.426 less than the previous -2LL value [2512.593]. This reduction—even though slightly—tells us that the model was better predicting the AFU than it was before the gender variable was included. The estimate model was represented as:
The classification table predicted how well the new model
predicted group membership. This new model (i.e with gender included) correctly classified 1940 NFAUs but misclassified 512 FAUs, or it correctly classified 79.1 % of the NFAU cases. For the FAUs, it classified 512 and misclassified 1940 NFAUs, or classified 20.9% of the FAU cases. This has not changed from the previous model. The output table showed the b-value was same as the b-value in the linear regression that represents the change in the outcome resulting from a unit change in the
predictor variable. This coefficient in the logistic regression represent the logit of the outcome variable (FAU) associated with one unit

Alcohol Use Pattern Thimphu
146
change in the predictor variable. The crucial statistics here was the Wald Statistic (squared by SPSS) which is a
chi-squared distribution. It tells us whether b-coefficient for the gender variable (predictor) was significantly different from zero. The Wald Statistic of 30.943 with significance less than 0.001 tells us that the gender was a significant of the FAU. The exp (B) column showed the relative odds that indicated that women were 0.573 less likely to drink than men. The confidence interval for exp (B) was between 0.470 and 0.697.
The Model if terms Removed tells us the removal effect of removing gender variable from the model. The log LR for this model was highly significant (p<.0001) indicating that removing gender variable from the model greatly affected the predictive ability of the model. I conclude at this stage that there was some variation in the frequency of alcohol use among men and women. Men were more likely to be frequent drinkers than women, and more precisely, the odds that women would resort to frequent drinking was almost half that of men. This conforms to the international trend. The model which now contains 2 parameters, gender and
education has collectively reduced -2LL by 42.42. The -2LL was now 2412.374. However, since the change brought about by adding the education variable was not significant at p<.0001. The education variable was not adding much to the model. Rather, we can see that the gender has the greater explanatory power in the model so far. The estimate model is represented as:

Alcohol Use and Abuse in Bhutan
147
The log LR for this model was not significant (p<.0001)
indicating that removing the education variable from the model did not affect much the predictive ability of the model. The conclusion was that there was not much of a variation in the drinking frequency between those individuals who have some level of formal education, and those who were uneducated. I now added the Annual Household Income (AHI) to the
model. This was a categorical model as I have grouped the individuals into three income groups, namely below Nu. 5000, between Nu. 5001 and Nu. 19,000 and above Nu. 19,000. I have set up dummy (indicator) variables by making the first category [AHI below Nu. 5,000] the reference category. The model now classified 21.4 % of the FAU cases, which was a slight change or improvement from the previous model.
The AHI1 (between Nu. 5000 and Nu. 19,000) which contrasted with AHI0 group (>Nu. 5,000) has an exp (B) of 0.998, which means that a person in AHI1 was only 0.98 times likely to drink less frequently than a person in AHI0 group (below Nu. 5000), having allowed for gender and age.
Likewise, a person in the AHI2 group was 1.017 times likely to drink more than a person in AHI0 group. All these, however, were not significant and I therefore, concluded that there was not much variation in the FAU between different income groups. That is, the people in different income groups shared almost the same drinking frequency pattern. Finally, I added the last predictor variable ‘physical activity’ classified into whether a person was physically active or not, based on if a person had any vigorous-intensity sports, fitness or recreational activities that

Alcohol Use Pattern Thimphu
148
caused a large increase in breathing or heart rate for at least 10 minutes continuously. The result could have been
different if I have considered the PA related to work (or on the job physical activities).
Table 30: displays the final output that gives us the coefficients and statistics of the variables that we have included.
B S.E. Wald Df Sig. Exp(B)
95.0% C.I.for EXP(B)
Lower Upper
Step 1a
c3 -.006 .005 1.193 1 .275 .994 .984 1.005
SexGroup(1) -.485 .144 11.381 1 .001 .616 .465 .816
EduLev(1) -.318 .148 4.614 1 .032 .728 .544 .973
AHI .026 2 .987
AHI(1) -.016 .293 .003 1 .957 .984 .554 1.749
AHI(2) .017 .221 .006 1 .939 1.017 .659 1.569
PhyActive(1) .273 .179 2.309 1 .129 1.314 .924 1.867
Constant -.716 .359 3.990 1 .046 .489
Step 2a
c3 -.006 .005 1.194 1 .275 .994 .984 1.005
SexGroup(1) -.484 .144 11.358 1 .001 .616 .465 .817
EduLev(1) -.317 .148 4.620 1 .032 .728 .545 .972
PhyActive(1) .274 .179 2.346 1 .126 1.315 .926 1.868
Constant -.705 .304 5.393 1 .020 .494
Step 3a
SexGroup(1) -.466 .143 10.680 1 .001 .627 .474 .830
EduLev(1) -.262 .139 3.574 1 .059 .769 .586 1.010
PhyActive(1) .292 .178 2.694 1 .101 1.340 .945 1.899
Constant -
1.008 .127 62.527 1 .000 .365
Step 4a
SexGroup(1) -.504 .140 12.899 1 .000 .604 .459 .795
EduLev(1) -.250 .138 3.270 1 .071 .779 .594 1.021
Constant -.950 .122 60.875 1 .000 .387
a. Variable(s) entered on step 1: c3, SexGroup, EduLev, AHI, PhyActive.
The variables omitted from the final model were age, AHI, Physical Activity. The model showed these variables were

Alcohol Use and Abuse in Bhutan
149
not significant predictors of the FAU (outcome). Table 31
also presents a summary of the raw scores binary logistic regression coefficients, Wald statistics, odds ratios [(Exp (B)] along with a 95% CI. Wald statistics45 indicate that the model predict Frequent Alcohol Use (FAU) as it was 60.875 at significance level p<.0001, but only when the predictor gender variable was taken into account. Thus, the strongest predictor of FAU was gender, in particular, women. The odds ratio for women was 0.604 i.e., the odds of
someone being a frequent alcohol user decreased by a factor of 0.604 if the person was a woman, when compared to men, adjusting for the effects of the other predictors in the model. Other predictors did not make significant contribution to the model (FAU). Education variable contributed very slightly to the model.
Table 31: Model Summary
Step -2 Log likelihood Cox & Snell R
Square Nagelkerke R
Square
1 1418.183a .013 .020
2 1418.208a .013 .020
3 1419.415a .012 .018
4 1422.035a .010 .015
Estimation terminated at iteration number 4 because parameter estimates changed by less than .001.
The results of the logistic regression analysis also show that the full model which considered all the independent variables together has -2LL of 1422.035. This was a change of 13.713 at a significant level of p<.001. The addition of the physical activity as a predictor did not significantly improve the ability to predict FAU. The model
classified approximately 21.4% of the FAU cases. The “pseudo” R estimates indicated the model explained only

Alcohol Use Pattern Thimphu
150
between 1% (Cox & Snell R Squared) and 1.15% (Nagelkerke R Squared) of the variance in FAU.
The histogram of the observed and predicted probabilities shows that all the cases for which the FAU and NFAU have occurred are all clustered together in the middle, while I suppose they should cluster separately at the two ends. Many cases were also misclassified because the Fs and Ns are mixed. See Figure 24 below. Figure 25: Observed Groups and Predicted Probabilities
160 ┼ ┼
│ │
│ F │
F │ F F F F │
R 120 ┼ F FFF F ┼
E │ N FFN F │
Q │ N FNNN F │
U │ N FNNN N │
E 80 ┼ N NNNNFN
┼
N │ N NNNNFNF FFF
│
C │ FN NNNNNNF FFF
│
Y │ NNFNNNNNNNFFNNN
│
40 ┼ NNNNNNNNNNNFNNN
┼
│ NNNNNNNNNNNNNNNF
│
│ FNNNNNNNNNNNNNNNN
│
│ NNNNNNNNNNNNNNNNN NNNNF
│
Predicted ─────────┼─────────┼─────────┼─────────┼────────
─┼─────────┼─────────┼─────────┼─────────┼──────────
Prob: 0 .1 .2 .3 .4 .5 .6 .7 .8 .9 1
Group: NNNNNNNNNNNNNNNNNNNNNNNNNNNNNNNNNNNNNNNNNNNNNNN
NNNFFFFFFFFFFFFFFFFFFFFFFFFFFFFFFFFFFFFFFFFFFFFFFFFFF
Predicted Probability is of Membership for Frequent Alcohol Users (FAU) The Cut Value is .50 Symbols: N - Non Frequent Alcohol Users (NFAU) F - Frequent Alcohol Users (FAU)
Each Symbol Represents 10 Cases.

Alcohol Use and Abuse in Bhutan
151
5.7 Conclusion
I conclude that except for the gender variable, other predictors did not contribute to the model. The model did not perfectly fit the data, and therefore, it was not a good model. However, I would like to point out the following findings:
1. Women were less likely to drink frequently than men [among the Thimphu population].
2. There was no significant variation in the drinking frequency between the individuals of different ages (in the 25-74 age range), meaning there was not much difference, for example, between the drinking frequency of a 60 year-old person from a 30 year- old person.
3. There was not much difference in drinking
frequency of the people in different income groups, education groups and whether they did physical exercises or not. That is, whether a person was rich or poor or educated or not, the drinking frequency remained almost the same. This leads us to other important research issues:
First, the fact that there was no great variation in drinking frequency between those in different education and income groups tells us that the campaigns on the ill-effects of alcohol alone cannot be effective in our context where alcohol is widely available at cheaper prices. Second, the fact that the drinking frequency of those individuals in the low income groups did not differ much from those in the high income groups, hint that raising the alcohol taxes and indirectly making alcohol difficult to access may be effective in reducing the FAU among the low-income groups.

Alcohol Use Pattern Thimphu
152
Third, at this stage, I do not conclude that raising alcohol tax is a best policy option, but suggest it may be one
alternative policy than a complete alcohol ban or status quo. However, the decision to adopt such a policy option must come only after further research [especially based on the Cost and Benefit Analysis-CBA] to examine whether or not raising alcohol tax can reduce FAU among the poor income groups. The current data may not be adequate for such elaborate analysis. For example, the 2010 GNH Survey, which is supposed to be the most comprehensive,
has no information on the types of drinks (brand) and the volume a person drinks. It simply contains information on the frequency of drinking which, just as this study, may not lead to any worthwhile conclusion. There certainly is a need to conduct more specific and properly designed alcohol prevalence and use surveys in the country. Fourth, the complete ban on alcohol is certainly not a best option [considering Bray’s Lubricant Effect Theory, and the so many other social and cultural use of alcohol in our context]. I suggest the need to encourage sound research to arrive at effective policy options, rather than base our decisions on mere supposal discussions that are more likely to lead to judgmental errors.

153
CHAPTER VI
Alcoholism and Control Measures As pointed out in the beginning, this monograph restrain from making any policy prescription. Identifying solutions for alcohol problems is a complex issue that requires a better understanding of the problems. This understanding can only be attained through the combination of research and public discussions. This
chapter simply raises issues surrounding alcohol control policies, citing some examples of relevance, rather than making recommendations. Every available data pertinent to this study was explored, used and presented in the form that will inform policy makers and the general public on various alcohol indicators, alcohol abuse and its associated problems, and the status of the existing alcohol control policies. It is hoped that this report would provoke debate and discussions on alcohol problems, raise awareness about the need for comprehensive alcohol policies, and serve as an advocacy tool for identifying policy gaps.
6.1 Alcohol control policies When the ban on the sale of tobacco was effectuated, many people also called for the prohibition of alcohol. It was a positive sign that the proposal to proscribe alcohol sale did not occur, because elsewhere history has proven that the ban on alcohol sale had not worked. It would have been a great mistake to view alcohol from a narrow perspective of prohibition.
Over the past century, the formulation of alcohol control policy had been more of accepting adult drinking in a responsible manner (Babor et al, 2003, cited in GBD,

Alcoholism and Control Measures
154
2004, pp. 2). For example, it did not work in United States, and its experience shows that it is better to allow
people self-determination and let them engage in responsible behaviour through other means like education, promotion of responsible behavior, drinking environment, etc.
The US response to alcoholism throughout their history provides a very good lesson to other countries, and Bhutan too can benefit from this lesson. In the 1880’s, the Women’s Christian Temperance Union
started to denounce alcohol. Alcohol in the US became a commodity, which if used in excess would pose some moral questions or lead to some ethical issue. The Anti-Saloon League eventually led to adoption of the prohibition amendment (1920). In the 1930s, there was the beginning of new conceptions of the alcohol problem (Moore, 1990 cited in Philip, 2007, pp. 2). The ban on alcohol that the US introduced in 1920 had to be repealed after 13 years. The founding of Alcoholics Anonymous (AA) and well-founded researches gave the basis for a scientific understanding of alcoholism. Rather than considering alcohol consumption as a problem of the general
population, the focus then shifted to those who were vulnerable to alcoholism. The measures thus adopted were directed not at controlling the alcohol supply, but to help the vulnerable ones who could not handle alcohol properly. Alcohol was regarded as a problem for those who could not control it. The liquor industry accepted this perspective because it helped them to exonerate their products from any blame (Philip, 2007, pp. 2). However, this was later recognised as a narrow policy
agenda, as focusing on a narrow group missed the larger groups who actually posed greater problems such as youth abuse, domestic violence and other problems

Alcohol Use and Abuse in Bhutan
155
including drunk driving. There came a divagation in alcohol control policy conception.
The US government started to look at the alcohol problems from a broader or a more community –based perspective, involving the community rather than just the alcoholics and recognised alcohol as a public health problem. This gave rise to a strong proposal for the need to develop population-based, comprehensive, multifaceted, evidence-driven and pragmatic approach (Bruun et al. 1975 cited in Philip, 2007, pp.3).
The ban on alcohol still continued to prove disappointing, as the prohibition--despite several years of enforcement-- failed to convey the anticipated results. This perplexed the Americans. The national prohibition was repealed and replaced by state level alcohol control system and taxes, expecting this would create an orderly and legalised market conducive to moderate drinking (Phillip, et al, 2007).
Heavy drinking was the norm when the first congress was held in the 1970s. The first secretary of the US Secretary advocated the tax increase on whisky, asserting that it would raise public revenue and promote alcohol moderation. At the same time, the national health priority was to establish and promote alcoholism research and
treatment. This followed the emergence of new laws on drink driving, national minimum drinking age, etc. But these laws too led to another problem particularly when the people began to equate drunk driving and underage drinking (ibid, pp.3) with alcohol problems. In recent years, the US declared that true temperance come from a balance between control and accessibility, facilitated by effective regulation which helped shape
public opinion (Jurkiewicz, 2008, pp.1). This basically means developing a comprehensive alcohol policy that

Alcoholism and Control Measures
156
includes various measures to moderate several alcohol-related problems through coordinated actions.
The prohibition, according to economic theory, is defined as the forbiddance imposed by the government or any other regulatory bodies on the exchange of goods and services. There were many cases of failure of ‘bans’ in other countries, as a ban on drugs often led to wars, suggesting effective prohibition is unrealisable and not beneficial. Prohibition has both costs and benefits. When the cost
comes in the form of law enforcement, regulation and emergence of unintended ‘black markets’, the cost outweighs the benefits. Thorton (2007, pp. 3) suggest that the only long-term solution caused by the misuse of a product is to legalise the product. In doing so, the product is treated as any other ordinary commodity, which the markets can control through normal legal constraints and its interests. Creating black markets through the banning of the commodity is counterproductive. Criminalisation of the product makes it even dearer and more difficult to acquire and leads to several social and economic problems. Prohibition entails the establishment of enforcement agencies, and when it survives for long time, it appears in
political sentience that the prohibition is successful albeit with so many undesirable social and economic implications (ibid, pp. 3). Prohibition is made with good intent, but the ban also results in increased prices for the banned products, increased violations, regulatory corruption, product substitutions and black marketing. The public choice theory clearly makes prohibition of alcohol as an impossible social policy, because as long as mankind exists, the consumption of alcohol will exist.
Alcohol consumption is perceived as a leisure activity. The majority of people prefer leisure to labour, with the latter

Alcohol Use and Abuse in Bhutan
157
considered as the means to attend the former. Such leisure activities, though deeply deplorable by some, will
continue. The only successful way to minimise the harms of such an activity is to raise its standards to avoid the use of the products to the extent of self-destruction. The likely cost of enforcement should be taken into consideration when prohibition is made, including disrespect for laws.
The noble prize winning economist Milton Friedman realised the impossibility of prohibition. He even proposed
the re-legalisation of drugs based on his careful observations of history and on the grounds that prohibition is both unethical and impractical (ibid, pp.10). Our own history has proven that proscription of home-production and alcohol sale has not been a success story. It is neither feasible nor preposterous to expect home production of alcohol to be prevented by law enforcement officers (Irvin Fisher, 1930, pp.454).
The rationale for alcohol prohibition is the perceived benefits usually in terms of reduced consumption, abuse and associated diseases and social problems. Prohibition can deter some occasional users of alcohol, but it is unlikely to deter those who are addicted or
dependent on alcohol, and they may resort to a substitution. What is of concern is that drinking is a part of the Bhutanese culture. It is deeply valued even in religious activities.46 In this context, completely eliminating its use to create a sober society is next to impossible. It is good that the National Assembly did not decide to ban alcohol; otherwise it would have led to some unrealistic attempt and another booby trap.
Complete elimination of alcohol from any society is not possible, particularly when it is an inherent component of

Alcoholism and Control Measures
158
social and cultural heritage. It is better to harmonise livelihood with alcohol rather than battling with it. Having
diverse views on alcohol control policies in itself is an indication of the complexity of alcohol consumption problems, and it further indicates that addressing alcohol related problems is not easy and simple. No single policy can solve the entire problem, as it requires a range of policy spectrum. Alcohol policy include measures to reduce alcohol availability, restriction on the sales of alcohol, alcohol taxation, drink-driving counter measures, education, drinking context and place
regulation, early interventions and treatment, etc.
In general, there are three set of policies to reduce the negative consequences of alcohol on society: population-based policies, problem directed policies and direct interventions (Godfrey & Maynard, 1995). Population-based policies include taxation, advertisements, reducing alcohol outlets, drink spaces, drinking age limits and health education. These policies are regarded as ‘blunt instruments’ because it is directed at both problematic and light drinkers (GAS, 2004. pp. 3). The problem directed polices are aimed at specific alcohol related problems, such as drink driving and alcohol related crimes. The third set of policies is directed at
individual drinkers and includes treatment and rehabilitation. All three categories of alcohol control policies are in place in Bhutan, though they are implemented in varying degree of effectiveness and in discreet manner. The government is making a tremendous effort to reduce the consumption of alcoholic beverages through legal provision and policies such as age limit, dry days, taxation on alcoholic beverages, drinking places, etc.
For example, drinking alcohol is restricted in Dzong areas and educational institutions, and the sale of alcohol is

Alcohol Use and Abuse in Bhutan
159
prohibited during the events such as tsechu, bumdhey, and the sale of liquors to children below 18 years old is
prohibited.
The other control measures include direct control over factory and distillery products. The DRC has to approve all the labels on liquor products, control alcohol advertisement, monitor the arrival of the raw materials in the distilleries and breweries, and regulate the strength and quality of the spirits. Despite the presence of a large array of alcohol control
policies, there seem to be a fundamental incompatibility between these policies and economic need to liberalise trade and open access to alcoholic beverages. The Ministry of Economic Affairs, then the Ministry of Trade, for example, liberalised bar licenses a decade or more ago, leading to a huge number of bars in the country. The alcohol control policies are also defined more within agricultural (restriction on ara sale because it affects grains availability) and trade contexts (bar license liberalisation) rather than as separate health and social issues. The need for an alcohol control policy is to reduce per capita alcohol consumption. There is now a wealth of
scientific evidence to prove the high correlation between per capita consumption and alcohol problems (Holder & Edwards, 1995, Ludbrook et al., 2002). At the same time, experience in other countries show that no single alcohol policy (such as alcohol taxation) is effective to reduce alcohol consumption and its associated problems. They found that it is more effective to incorporate a range of measures (mixed policy) that are effective, sustainable and publicly acceptable.
Governments in general have three choices to manage and control alcohol production and distribution: state

Alcoholism and Control Measures
160
monopoly, licensing system and uncontrolled system. State monopoly has been found to be effective in
controlling both the physical and economic availability by limiting private-profit opportunity, marketing, elimination of price competition and limiting the number of outlets and time restriction on alcohol sales (Holder et al., 1998; GBD, 2004, pp. 16).
In Bhutan, the production and sale of alcoholic beverages was initially managed, if not wholly by the government, although in recent years the need to liberalise trade and provide private entrepreneurs the opportunities for
business could have led to adoption of partial control in the form of licensing system of alcohol production and distribution. Although the alcohol industry had been set up since 1972, the marketing approach had been benign with the sole purpose to generate revenue to sustain the welfare of soldiers. The marketing of alcoholic beverages is strictly regulated by the government with ban on alcohol advertisement. One example, an advertisement portraying an archer with a beer was removed, although this billboard was once displayed across the country.
The licensing system is now considered as an effective measure of alcohol abuse control. This system can be
effective if obtaining retail license is made difficult and costly, and if it is accompanied by effective enforcement of laws on the retail sale of alcoholic beverages. For example, by imposing a heavy price on licenses, with strict sanctions for violating alcohol sale to children, it can reduce the number of outlets and alcohol availability to children. However, a strategy combination is not adequate given that much of the alcohol consumed in the country is made at home. For Bhutan, strict licensing or alcohol tax raise are unlikely to reduce the problems of alcohol abuse,
unless something is done to curb home-based alcohol production and trade.

Alcohol Use and Abuse in Bhutan
161
The government, in order to limit the number of bars and control alcohol consumption, have revised the bar license
fees (following the decision of the 86th session of the National Assembly). The license fee in the major towns was raised from Nu. 5000 to Nu 15, 000 depending on the location and size of the alcohol outlets.47 At the same time, bar licensing has now become a difficult task of balancing between liberalism and restriction, between individual freedom and collective responsibility.
Curbing the number of bars and retail outlets and their locations have been found to have significant effects on
limiting the physical availability of alcohol, that in turn impacts consumption through its influence on perceived availability and on the total cost of obtaining alcoholic beverages (Edwards et al., 1994 cited in GBD, 2004, p. 30). Bhutan has sales restrictions, but how effectively are they enforced is not known. Going by what is observed, these restrictions are inadequately enforced owing to insufficient manpower to monitor.
Driving while intoxicated is forbidden according to the Road Safety and Transport Authority Act. However, this rule is only enforced in the form of a breath test normally after justified suspicion, that is, when erratic driving is
observed, or after accidents. The effective enforcement of this legislation can come with frequent and random road checks. There is strong research evidence that highly visible, random and non-compromising checks or testing, can have sustained and significant effects in reducing drink-driving and associated accidents, injuries and deaths (Babor et al., 2003)
The legislation pertaining to the quality control of alcoholic beverages also exist. They are special commodities, and
therefore monitoring their qualities is necessary. The commercial manufacturers in the country, according to DRC, are made to ensure that the alcoholic products are

Alcoholism and Control Measures
162
of quality and the contents are as specified and declared to the consumers. The manufactures must provide a
monthly statement of principal raw materials to excise officers, including details of manufacturing costs, cost of packaging and discounts.
While monitoring the quality of the industrial alcoholic beverages is not a big issue, the production and sales of ara and bangchang raise some questions, particularly with known cases of ara brewers in the towns adding chemicals, clinical spirit, tobacco and a certain kind of rubber in the brew to make the liquor strong.48
The sale of home-brewed alcohol is banned and the offender is liable to imprisonment, as per the provisions of the Civil and Criminal Court Procedures of the Kingdom of Bhutan49. Seized or confiscated illicit liquors (ara and bangchang), according to the law, should be destroyed once the penalties have been imposed, including the expenses for transport and handling of detained or seized goods. The Trade Department has specified the alcohol sales time according to which the sale of alcohol is not permitted before 1 PM.50 Tuesdays are declared as dry days during which no bars are allowed to sell alcohol. The rule also requires bar owners to separate from shops and restricts
selling of alcohol near educational institutions including Dzongs and Dratshangs, Rabdeys, Gomdeys, etc.51 The Penal Code of Bhutan specifies that public intoxication as an offence, as it engenders oneself, others or property (Section 383, Chapter 27). It considers the illegal sale of alcohol (section 392) and sale to children, sales during prohibited days and in restricted places (Section 392, chapter 27, Penal Code) as offence subject to suspension or revocation of their trade licenses (section
392, chapter, 27).

Alcohol Use and Abuse in Bhutan
163
However, the implementations of all these measures are not as effective as expected, and violations continue in
various degrees and locations. Home-brewing more than permitted quantity remains a long standing practice despite its illegality.
There is a wide range of policy options to control alcohol consumption, but interestingly there is no single and comprehensive policy measure that is able to combat and reduce alcohol-related problems. The implementation of various rules to control alcohol abuse is not sustainable, as they are enforced in an irregular manner. This results
in lax enforcement of alcohol legislations and strategies. This study assumes that a flagrant abuse of alcohol will remain even with the raise in alcohol tax, because there are certain loopholes that will permit the illegal sale of alcohol, especially the local ara and bangchang that are not taxed, that are popular in the country and have the potential to serve as ‘substitutes’.
An increasing number of societies are beginning to accept that it is futile to prohibit the sale of alcohol and consumption. Rather than treat alcohol as a toxic commodity, they consider alcoholic beverages as an essential component of a productive life.
The key issue for both developing and developed societies is to promote a balanced lifestyle, which also entails moderate drinking that is more likely to bring a net gain to society. The question is how one defines a happy and productive life and alcohol’s place in it. GNH indicators must determine this, and find out the role of alcohol in shaping these indicators. In general, the policies aimed at reducing the per capita consumption through taxation, price regulation and
access restriction can be considered as collective regulation, and may serve some controlling purpose by reducing accessibility to alcohol.

Alcoholism and Control Measures
164
However, these policies alone may remain far less effective
in addressing the alcohol related problems as long as the harmful pattern of drinking continues among the consumers, and if the illicit alcohol use is not contained at the acceptable level. In view of this scenario, it is important that the policy makers do not fully rely on the collective regulation, but concomitantly promote good alcohol-related practices by inculcating and promoting responsible drinking habits among the drinkers. The most effective strategies that other countries have seen are the preventive measures that seek to alter the system that
produces alcohol problems. Drinking in Bhutan is a socially and culturally acceptable habit, and therefore any policy related to alcohol control should also appeal the community. The community-based initiative to control the use of meat during religious events are proving effective because they conveys the message that meat consumption during religious events is iniquitous act and opposed to the Buddhist teachings, and thus establishes a formal social control mechanism. Such initiatives can be effective to control alcohol for which the monastic communities and spiritual leaders have a major role to play. For instance, His Holiness the Je Khenpo issued kasho for the stoppage of meat and wine
as offertory for the dead and as burnt offerings during cremations, which has been quite successful (NA, the 81st Session June 28, 2003). The trend in consuming hard drinks during religious events seems to have waned in the recent years but people now drink beers during such occasions. The recent hike in the beer tax may restrain this trend to a certain extent. The community-based approach is seen as one of the most
effective way that may be of relevance to Bhutan. The basis for this is that alcohol problems are the natural results of complex, dynamic and an adaptive community

Alcohol Use and Abuse in Bhutan
165
system. Alcohol problems provide “preventive paradox”, which means while problems are concentrated among
long-term, heavy drinkers with guaranteed problems and who need to be persuaded to treatment or rehabilitation, the bulk of alcohol problems are scattered among the population (Phillip J. Cook, 2007, pp.8) within the communities. Except for a few local community-based initiatives to reduce alcohol consumption during the important events, Bhutan largely follows the ‘catchment-area approach’ which is a form of targeted intervention. For example,
counseling youths about the risks and rehabilitation of alcoholics. This step should be appreciated, but it should not be considered as ‘be-all and end-all’ risk preventive approach, because it ignores the role of bars and other retail shops that sell alcohol to young people, alcoholic parents and other community members who do not directly interact with the population at risk. Sometimes, targeted intervention that works with other forms of drugs or risk elements prove wasted when applied to alcohol.
There is no doubt that heavy drinkers or alcoholics run the risk of most damage, but they also constitute a small number who contribute less to most aggregate alcohol problems (Harold, 1998, pp.11). The problem lies with those who are considered occasional drinkers and non
dependents on alcohol. They are the ones who contribute to a greater number of associated problems such as street brawls, family violence, traffic crashes and other accidents (Edwards et al,. 1994 cited in Harold, 1998, pp.11). In Thimphu, young occasional drinkers (mainly the party goers) account for a disproportionately large number of alcohol-involved street violence and traffic accidents rather than the alcohol dependent people.
Simply focusing on high-risk individuals or small groups
produce short-term solutions due to replacement effects and the high potential for the population to adapt to the

Alcoholism and Control Measures
166
composition and behaviors of these sub-groups (Harold, 1998, pp.10).
This study views that a national perspective cannot effectively guide local level interventions. It is the community members who ‘knows and can do the best’ to develop and implement community-level alcohol [problems] prevention strategies. Moreover, drinking is not only a personal choice, but also a matter of social customs that varies slightly from one community to another. In Bhutanese communities, just as
elsewhere in world, people are concerned about youth drinking, violence, alcohol dependency, alcohol-related accidents, injuries and deaths. They just need the impetus to initiate community-based control measures from the local lams, leaders and other spearheads, including indirect support from the state and non-state actors to initiate temperance of alcohol use or abstinence of alcohol from the selected community events.
The prohibition of the large scale production and sale of ara and bangchang is justified on the grounds that farmers resort to converting grains into liquor impacting food security. But have the concerned agency thought about why farmers, especially in lower warm and moist areas resort to excessive use of bangchang instead of
using grains as food? One prominent reason this study gathered is that, because of warm and moist conditions, farmers fail to preserve their grains from various pests. They are compelled to convert grains into bangchang rather than allow them to be destroyed by insects. Instead of forbidding farmers from making home brews, it would have been much more logical to help them develop appropriate and cheap grain storage technology accompanied by community-driven health campaigns on the dangers of excessive alcohol consumption.
Alcohol has both social and religious significance and the problems arise when people misuse this substance. Any

Alcohol Use and Abuse in Bhutan
167
policy designed to prevent this misuse must be so designed that it does not portray it simply as a malignant
substance, but as the one that would ensure both individual and society’s temperance. Doing so will entail integrating various policy options and coordinating actions by the relevant stakeholders. A single policy instrument such as alcohol taxation cannot prevent all the problems associated with alcohol. As alcohol consumption in general is determined by various factors like availability, accessibility, affordability and acceptability, all the policy measures must be undertaken
in a coordinated manner to tackle these four broad areas.
It is important that the government formulate a comprehensive, single national alcohol policy involving multi-level stakeholders, rather than each individual ministry or agency taking them up as the sub-set of their policies. Coordinated action is required. Just as the Bhutanese culture is characterised by a more holistic thinking—the idea that the whole cannot be fully understood simply by understanding some of its parts, a single but holistic approach to alcohol control mechanism is crucial. The Ministry of Agriculture, for example, cannot frame
strategies related to alcohol (say ara production and sale) in isolation from the Ministry of Economic Affair’s alcohol taxation and ara regulation policy and the Health Ministry’s strategies to reduce Non-Communicable Diseases (NCD). The alcohol control policy should focus on larger groups rather than on individuals at risk, and on interventions that alter the social, economic and physical environment that promote shifts in conditions less conducive to alcohol
abuse.

Alcoholism and Control Measures
168
The most important aim should be to bring about a system level approach that do not consider short
measures and narrowly focused solutions. The system level approach is desirable because of the higher probability of generating replacement effects. This approach involves modifying the system structure and contexts so that alcohol is not abused. Some may assume that effective counseling to youth groups at risk of alcohol abuse can bring desired results and others may believe that public campaigns can reduce alcohol consumption, but since the abuse of alcohol
occurs in a complex system where a series of inter-related factors are involved, these assumptions may sometimes not be correct. Therefore, understanding these complex system and factors are absolutely necessary to design an effective and sustainable alcohol control policies and programmes, which will come only through research and studies, otherwise the society will run the risk of adopting policies that are based on some hodgepodge ideas and assumptions, without enough scientific assessment. Considering the effectiveness of the tobacco control policies at the regional or local level initiated by some local governments, local strategies appear to be effective. Since
alcoholism takes a heavy toll on healthcare resources, it is worthwhile to strengthen the public health strategies that not only focus on the alcoholic patients, but also on those who are at risk of abusing alcohol and other preventive measures. This will entail formulating both short-term (direct intervention) and long-term policies and interventions. In Bhutan’s case, it is the difficulties associated with enforcing alcohol control policies, which can be
strengthened. It is crucial not to base the national-level strategies merely on the majority consensus, but to be

Alcohol Use and Abuse in Bhutan
169
strongly founded on the informed decisions through research and constant evaluation.
An increase in excise taxes can help to raise the price and reduce alcohol consumption, but this rise should be based on an accurate estimation of the point where pushing it higher will force consumers to use unregulated, homebrew markets. Drink driving punishment should be immediate, certain and uniformly administered. Monitoring illegal alcohol markets is difficult and the ensuring product safety is an
issue. Community development such as creating recreational facilities as alternative activities to drinking, education and persuasion aimed at high risk groups such as youths, pregnant women, value clarification to youths and life skill training are important steps that may bring good results rather than taking short and discreet efforts. Public education programmes aimed at the community at large, both through mass media and social marketing campaigns including counter advertising (warning labels), plus increased access to detoxification services and brief intervention therapies have worked satisfactorily in other countries.52
Conclusion
Starting from the historical and cultural dimensions of alcohol consumption, this monograph covered wide-range of topics like alcohol indicators, healthcare cost analysis, ALD trend in the country, and discussions on alcohol prevention policies. However, this study is just a beginning; there are many themes or areas of research. It is hoped that researchers and experts will explore further on alcohol abuse and related problems and contribute to evidence-based policy and decision making.
In many developed countries, alcohol researches are carried extensively. This is not the case in Bhutan. It is

Alcoholism and Control Measures
170
timely and imperative that research on alcoholism and its effects on individuals, families, communities and the
country as a whole is encouraged and supported.

Bibliography
171
Bibliography
Alanko, T (1984). An Overview of Techniques and Problems
in the Measurement of Alcohol Consumption. In: Smart, R.G.; Cappell, H.; Glaser, F.; Israel, Y.; Kalant, H.; Popham, R.E.; Schmidt, W.; and Sellers, E.M., eds. Research Advances in Alcohol and Drug Problems. Vol. 8. New York: Plenum Press, pp. 199–226.
AG Shaper (1990). Alcohol and mortality: a review of
prospective studies. Br J Addict 85: 830–848.
AIHW Knowledgebase (2006). Alcohol Consumption in
Standard Drinks Per Day-Self Report, Meta data item. Accessed from http://meteor.aihw.gov.au in 2006.
American Psychiatric Association. Handbook of Psychiatric Measures (2000). Washington, DC: the Association.
AMS (2004). Calling Time: the Nation’s Drinking as a Major
Health Issue. London: The Academy of Medical Sciences. Armor, D.J., and Polich, M.J (1992). Measurement of alcohol
consumption. In: Pattison, E.M., and Kaufman, E., eds. Encyclopedic Handbook of Alcoholism. New York: Gardner Press.
Armor, D.J.; Polich, J.M.; and Stambul, H.B. Alcoholism and Treatment. New York: John Wiley & Sons, 1978.
Assanangkornchai,S, Sam-Angsri, N, Rerngpongpan, S & Lertnakorn, A (2010). Patterns of Alcohol Consumption in the Thai Population: Results of the National Household
Survey of 2007.Alcohol & Alcoholism.
Atwater,W.D, & Benedict, F.G (1902). An Experimental Inquiry regarding the Nutritive value of alcohol. In Agar,
D.P (eds).

Bibliography
172
Babor, T.F et al. (2003). Alcohol: no ordinary commodity.
Oxford, Oxford University Press.
Babor, T.F.; Brown, J.; and Del Boca, F.K (1990). Validity of self–reports in applied research on addictive behaviors:
Fact or fiction? Addict Behav.
Babor, T.F.; Steinberg, K.; Anton, R.; and Del Boca, F (2000). Talk is cheap: Measuring drinking outcomes in clinical trials. J Stud Alcohol, pp. 55–63
Bales, Robert F (1992). "Attitudes toward Drinking in the Irish Culture". In: Pittman, David J. and Snyder, Charles R. (Eds.) Society, Culture and Drinking Patterns. New York:
Wiley, pp. 157–187.
Bhutan Alcoholism related deaths increasing, www.
Kuenselonline.com
Bobak ,M, McKee, M, & Rose R, Marmot, M. (1999). Alcohol Consumption in a National Sample of the Russian
Population. Addiction 94:856–66.
Bowman, R.S.; Stien, L.I.; and Newton, J.R (1975). Measurement and interpretation of drinking behavior. J Stud Alcohol 36:1154–1172.
Brain, K. (2000). Youth, Alcohol and the Emergence of the Post-modern Alcohol Order. Institute of Alcohol Studies. http://www.ias.org.uk/iaspapers/brainpaper.pdf
Bray, J.W (2005). Alcohol use, human capital, and wages.
Journal of Labor Economics,
Brown, J.; Kranzler, H.R.; and Del Boca, F.K. Self–reports by alcohol and drug abuse inpatients: Factors affecting
reliability and validity.

Bibliography
173
Bruun K, Edwards G, Lumio M, Mäkelä K, Pan L, Popham Re, Schmidt W, Skog O-J,Sulkunen P & Österberg E
(1975). Alcohol Control Policies in Public Health Perspective.
Helsinki, Finnish Foundation for Alcohol Studies.
Carole, L. J & Murphy, J.P (2008). Why We Control Alcohol the Way We Do in Social and Economic Control of Alcohol The 21st Amendment in the 21st Century, Louisiana State University Baton Rouge, Louisiana, U.S.A.
Carole, L. J & Murphy, J.P (2008). Social and Economic Cost of Alcohol Control: the 21st Amendment in 21st Century,
CRC Press Taylor & Francis Group, Boca Raton.
Carruthers, S.J. & Binns, C.W. (1992). The Standard Drink and Alcohol Consumption. Drug and Alcohol Review, 11,
363-370.
Cox, James C. and Ronald L. Oaxaca (1982). The Political Economy of Minimum Wage Legislation in Economic
Inquiry 20.
Clark, W. B., and Midanik, L.T. Alcohol Use and Alcohol Problems Among U.S. Adults: Results of the 1979 Survey. Alcohol and Health Monograph No. 1. Rockville, MD: National Institute on Alcohol Abuse and Alcoholism, 1982.
Clements, K.W. (1983), "Taxation of Alcohol in Australia", in Head, J.G. (ed.) Taxation Issues of the 1980's, Australian
Taxation Research Foundation.
Clements, K.W. and Johnson, J.W. (1982), "The Demand for Beer, Wine and Spirits: A System Wide Analysis", Journal
of Business, S6, 273-304.
Clements, K.W. and Selvanathan, E.A. (1989), The Economic Determinants of Alcohol Consumption, Economic Research
Centre, The University of Western Australia.

Bibliography
174
Clements, R. (1998). A Critical Evaluation of Several Alcohol Screening Instruments using the CIDI-SAM as a Criterion
Measure. Alcoholism: Clinical and Experimental Research, 22, 985–993.
Cook P (2007). Paying the tab: the costs and benefits of alcohol control. Princeton, Princeton
Cook, P.J & Moore, M.J (2002). The Economics of Alcohol Abuse and Alcohol-Control Policies. Terry Sanford Institute of Public Policy, Duke University. Health Affairs
(Millwood).
Dawson, D.A (2000). Alternative measures and models of
hazardous consumption. J Subst Abuse 12(1–2):79–91.
Dawson, D.A., and Room, R (2000). Towards agreement on ways to measure and report drinking patterns and alcohol–related problems in adult general population surveys: The Skarpo Conference overview. J Subst Abuse 12(1–2):1–21.
Deborah A. D, (1998). Methodological Issues in Measuring Alcohol Use, NIIA publications.
Dendup , U & Jamphel, K, (2010), PRU, ITMS, DMS, Ministry of Health, Bhutan.
Dorji C (2006). The Myth behind the Alcohol and Happiness. Proceedings of the Second International Conference on Gross National Happiness. Nova Scotia, Canada, St. Francis Xavier University, Antigonish (http://gpiatlantic.org/conference/papers.htm. Accessed
23 November 2006).
DRCC, MoF, Bhutan (2009). National Revenue Report, Thimphu: Bhutan.

Bibliography
175
Easton, B (1997). The Social Cost of Tobacco Use and Alcohol Misuse, Public Health Monograph Series No. 2, Wellington
School of Medicine: Wellington South
Edwards, G., Anderson, P., Babor, T.F., Casswell, S., Ferrence, R., & Giesbrecht, N., (1994). Alcohol policy and the public good. New York: Oxford University Press.
English DR et al (1995). The Quantification of Drug Caused Morbidity and Mortality in Australia, 1992. Canberra, Commonwealth Department of Human Services and
Health.
Ezzati, M., Lopez, A.D., Rodgers, A., Vander Hoorn, S., Murray, C.J.L., & the Comparative Risk Assessment Collaborating Group (2002) Selected major risk factors and global and regional burden of disease. The Lancet
360, 1347-1360.
Fenoglio, P, Parel V & Kopp, P. (1997). The social cost of alcohol, tobacco and illicit drugs in France, Eur Addict
Res;9:18– 28.
Fenoglio, P, Parel V, Kopp P (2003). The social cost of alcohol, tobacco and illicit drugs in France, 1997.
European Addiction Research, 9(1):18–28.
Field, A. (2009). Discovering Statistics Using SPSS. London:
Sage.
Fisher, I. (1909). Report on National Vitality, Its Wastes and Conservation, the National Conservation
Commission.Washington, DC: Government Printing Office.
Fletcher, A.M. (2001). Sober for good: New solutions for drinking problems—Advice from those who have succeeded.
Boston: Houghton-Mifflin.

Bibliography
176
Fossey, E. (1994). Growing up with Alcohol, Routledge:
Taylor & Francis e-Library.
Frezza, M, Di Padova, C & Pozzato, G et al (1990). High blood alcohol levels in women: The role of decreased gastric alcohol dehydrogenase activity and first-pass metabolism. New England Journal of Medicine 322:95–99.
Galanter, M (2002). Eds. Recent Development in Alcoholism, Services Research in the Era of Managed Care, Volume 15,
New York University of School of Medicine: New York.
Gmel, G.; Rehm, J.; Room, R.; and Greenfield, T.K (2000). Dimensions of alcohol–related social and health consequences in survey research. J Subst Abuse 12(1–
2):113–138.
Graham, K, Wilsnack, R, Dawson, D & Vogeltanz, N. (1998) Should Alcohol Consumption Measures be Adjusted for
Gender Differences? Addiction, 93:1137–47.
Graham,L, K.W Dawson, D.R, & Vogeltanz, N. (1998) Should alcohol consumption measures be adjusted for gender differences?. Addiction 93:1137–47.
Graham, L (2005). Alcohol Indicators Report: A framework of alcohol indicators describing the consumption of use,
patterns of use, and alcohol-related harms in Nova Scotia.
Grant, K.A.; Tonigan, J.S.; and Miller, W.R. Comparison of three alcohol consumption measures: A concurrent
validity study. J Stud Alcohol 56:168–172, 1995.
Grant, M, Plant, M & Williams, A. (1983). Economics of
Alcohol, Gardner Press Inc. New York: USA
Grayson, D. (2004). Some Myths and Legends in Quantitative
Psychology. Understanding Statistics, 3(1).

Bibliography
177
Godfrey C & Maynard A (1995). The economic evaluation of alcohol policies. In: Holder HD & Edwards G, eds. Alcohol and Public Policy: Evidence and Issues, pp. 238-260. Oxford, Oxford University Press.
Gruenewald P.J, Mitchell P.R & Treno A.J. (1996) Drinking and Driving: Drinking Patterns and Drinking Problems.
Addiction, 91:1637–49.
Gutjahr E, Gmel G, Rehm J (2001). Relation between average alcohol consumption and disease: an overview, European
Addiction Research.
Gyaltshen, D (1997). The Ara Distillation Process: Production of Tradition Brew in Bhutanese Indigenous Knowledge,
eds. Ura, K & Madandavi, M.
Harding, Sarah. The Life and Revelations of Pema Lingpa.
Snow Lion Publications, 2003.
Harold, D. (1998). (Eds.,). Control Issues in Alcohol Abuse Prevention: Strategies for States and Communities.
Greenwich: JAI Press, Inc., 169-98.
Harold D. Holder (1998) Alcohol and the Community: A systems Approach to Prevention. Cambridge University
Press: New York.
Holder, H.D. & Wallack, L.M. (1986). Contemporary perspective for the prevention of alcohol problems: an empirically-derived model. Journal of Public Health Policy,
1, 324-39.
Harwood, H., Fountain, D., Livermore, G., (1998). The Economic Costs of Alcohol and Drug Abuse in the United States 1992. NIH Publication No. 98-4327, The Lewin
Group, Fairfax, VA.
Bibliography
178
Hodgson,T, & Meiners, M.(1982). Cost-of-illness Methodology: a Guide to Current Practices and
Procedures. Milbank Memorial Fund Quarterly/Health and Society; 60(3):429–62.
Holder, D. H (1998). Alcohol and the Community: A Systems Approach to Prevention. Cambridge University Press, New
York.
Holder, D.H, (1998). Alcohol and the Community: A System Approach to Prevention, Prevention Research Center,
Berkeley, California, Cambridge University Press.
Horlings E, Scoggins A (2006). An ex ante assessment of the economic impacts of EU alcohol policies. Cambridge, United Kingdom, RAND Corporation (http://www.rand.org/pubs/technical_reports/2006/RAND_TR412.pdf, accessed 12 July 2011).
Houstan, G.W (1982). Wings of White Crane Patna, Delhi: Motialal Banarsiddas.
IARC (1988). Monographs on the Evaluation of the Carcinogenic Risk of Chemicals to Humans. Vol 44. Lyon, France: International Agency for Research on Cancer.
1988, pp 1–416.
International Center for Alcohol Policies (June 2000). Who
are the abstainers? ICAP Reports 8.
Isidore S. Obot & Robin Room (2005). Alcohol, Gender and Drinking Problems: Perspectives from Low and Middle
Income Countries, World Health Organization: Geneva.
Ivis, F.J., Adlaf, E.M & Rehm, J. (2000). Incorporating the AUDIT into a General Population Telephone Survey: a
Methodological Experiment. Drug & Alcohol Dependence.

Bibliography
179
Jack, S. Blocker, David, M. F, Jr. & Ian R. T (2003). Alcohol
and Temperance in Modern History: A Global Encyclopedia.
Jernigan, D (2002). Alcohol in Developing Societies: a Public Health Approach, Summary World Health Organization,
printed in Finland.
Khantipalo, B (1970) Buddhism Explained: An Introduction to the Teachings of Lord Buddha, p. 200. Thai Watana Panich Press, Bangkok.
Klingemann, H., & G. Gmel, eds. (2001).Mapping the Social Consequences of Alcohol Consumption. Dordrecht,
Netherlands: Kluwer Academic Publishers.
Kuensel (2011, June 20). No borders for Bhutanese Booze. Retrieved from www.kuenselonline.com retrieved on
August, 25, 2011.
Lieber, Charles S (1992). Medical and Nutritional Complications of Alcoholism: Mechanisms and
Management. New York: Plenum.
Mackenbach JP et al. (2008). Socioeconomic inequalities in
health in 22 European
Maddox, G (1970) (EDs). The Domesticated Drug: Drinking Among Collegians, New Haven, CT: College & University
Press: 234–53.
Mandelbaum, D.G (1965). Alcohol and Culture. In: Current Anthropology, Volume 6: No. 3, 281-288+289-293. The University of Chicago Press (www.jstor.org/stable/2739922. Accessed: 10/06/2011
00:42).
Mark, S, Gold M.D, & Adamec, C (2010). The Encyclopedia of
Alcoholism and Alcohol Abuse. (extract source).

Bibliography
180
Mary C. D, (1999). What is moderate Drinking? Defining Drinks” and Drinking Levels, Alcohol Research & Health,
Volume 23, No. 1.
Matthijs van den, Pieter HM van Baal, Luqman Tariq, Albertine J Schuit1, G Ardine de Wit & Rudolf T Hoogenveen (2008). The Cost-effectiveness of Increasing
Alcohol Taxes: a Modeling Study, BMC Medicine.
Mayfield, D., McLeod, G., & Hall, P. (1974). The CAGE questionnaire: Validation of a new alcoholism instrument.
American Journal of Psychiatry, 131, 1121–1123.
McCormick, A., Cohen, I., Clement, L., & Rice, C. (2007). Binge Drinking among Post-Secondary Students in British Columbia. Abbotsford, BC: BC Centre for Social Responsibility. Retrieved October 21, 2011, from http://bccsr.ca/files/Binge%20Drinking%20Report_
0.pdf.
Measham, F. (2004). "The Decline of Ecstasy, the Rise of 'Binge' Drinking and the Persistence of Pleasure."
Probation Journal, 51(4): 309-26.
Meyers, R. J., & Smith, J. E. (1995). Clinical guide to alcohol treatment: The community reinforcement approach. New
York: Guilford.
Midanik LT, Room R (2005). Contributions of Social science to the alcohol field in an era of Biomedicalization. Social
Science and Medicine, 60(5):1107–1116.
Midanik, L. The validity of self–reported alcohol consumption and alcohol problems: A literature review. Br J Addict 77:357–382, 1982.
Midanik, L.T. Comparing usual quantity/frequency and graduated frequency scales to assess yearly alcohol

Bibliography
181
consumption: Results from the 1990 United States
National Alcohol Survey. Addiction 89:407–412, 1994.
Miller, W. R., & Munoz, R. F. (2005). Controlling your drinking: Tools to make moderation work for you. New
York: Guilford.
MoH, Bhutan (2009). Report on 2007 Steps Survey for Risk Factors and Prevalence of Non-Communicable Diseases in Thimphu.
Moore, M., and D. Gerstein (1981). Alcohol and Prohibition: Beyond the Shadow of Prohibition. Washington, D.C.:
National Academy Press.
Mullahy, J., Sindelar, J.L., (1994a). Do Drinkers know when to say when? An Empirical Analysis of Drunk Driving.
Economic Inquiry 32, 383–394.
Mullahy, J., Sindelar, J.L., (1994b). Alcoholism and Income: the Role of Indirect Effects. The Milbank Quarterly 72,
359–375.
Myers, R. (1990). Classical and Modern Regression with
Applications (2nd edition). Boston, MA: Duxbury.
National Institute on Alcohol and Alcoholism (1997). Alcohol and Health: Special Report to the U.S. Congress.
Washington, D.C.: Department of Transportation.
Namgyel, G (2010, April 9). Beer guzzling villages, April 9, 2010, Bhutan Observer, Retrieved on September, 2010
from www.bhutanobserver.bt.
Namgyel, S (2005). Arak Culture: An Intangible Cultural Heritage of Bhutan in the Proceedings of the 5th Colloquium on Tangible and Intangible Culture of Bhutan, pp. 415-439,
eds. Khenpo Tashi, P. National Museum of Bhutan, Paro.

Bibliography
182
Parker, D.L, James, M.S, Schultz, M.S, Lois, G, Berkelman, R, Patrick, L, Remington, M.D (1983).The Social and
Economic Costs of Alcohol Abuse in Minnesota, 1983 AJPH, Volume.77, No. 8. Minneaspolis: Minnesota
Department of Health.
Parker, D.A., Wolz, M.W. & Harford, T.C. (1978). The prevention of alcoholism: an empirical report on the effects of outlet availability. Alcoholism: Clinical & Experimental
Research, 2, 339-43.
Phillip, J. C (2007). Paying the tab: the economics of alcohol
policy, Princeton University Press.
Rabinovich, L. et al,.(2009 C). The Affordability of Alcoholic Beverages in the European Union: Understanding the link between Alcohol Affordability, Consumption and Harms, RAND Corporation, DG SANCO: European Commission.
Rabinovich, L., J. Tiessen, B. Janta, A. Conklin, J. Krapels, C. van Stolk (2008) Reducing Alcohol Harm: International
Benchmark Cambridge, U.K.: RAND Europe.
Reeder,V.C., Aikens, M.,Li,X.N & Booyse, F.M (1996). Alcohol and Fibronolytic System. In: Zakhari, S. & Wassef,M., eds. Alcohol and the Cardiovascular System, National Institute
on Alcohol Abuse and Alcoholism.
Rehm J, Room R, Graham K, Monteiro M, Gmel G, Sempros, C.T. (2003). The relationship of average volume of alcohol consumption and patterns of drinking to burden of disease: an overview. Addiction, 98:1209-1228.
Rehm, J. et al. (2004). Alcohol Use. In: Ezzati M et al., eds. Comparative Quantification of Health Risks: Global and Regional Burden of Disease due to Selected Major Risk Factors. Geneva, WHO: 959–1108
(http://www.who.int/publications/cra/chapters/volume1
/0959-1108.pdf, accessed 28 October 2011).

Bibliography
183
Rehm, J.; Greenfield, T.K.; Walsh, G.; Xie, X.; Robson, L.; and Single, E. Assessment methods for alcohol
consumption, prevalence of high risk drinking and harm: A sensitivity analysis. Int J Epidemiol 28(2):219–224,
1999.
Rehm,J, et al. (1997). Alcohol Consumption and Coronary Heart Disease Morbidity and Mortality. International
Journal of Epidemiology: 146(6):495–501, 1997.
Rice, D.P., Kelman, S. & Miller, L.S. (1990). The Economic Costs of Alcohol and Drug Abuse and Mental Illness, 1985. San Francisco, CA: San Francisco Institute for Health and
Aging.
Rice, D.P (1993). The economic cost of alcohol abuse and
alcohol dependence: 1990, Alcohol Health and Research World.
Rice D, Cooper B (1967). The economic value of human life,
American Journal of Public Health.
Ridolfo, B, & Stevenson, C (2001). The Quantification of Drug-caused Mortality and Morbidity in Australia, 1998, Drug Statistics Series No. 7, AIHW Cat. No. PHE 29, AIHW,
Canberra.
Robert E. M, Reginald G. S, & Govoni, R (2003). The
Epidemiology of Alcoholic Liver Disease, Vol.27, No. 3.
Room , R, Selin K. (2005.) Problems from Women's and Men's Drinking in Eight Developing Countries. In Obot I, Room R (eds). Alcohol, Gender and Drinking Problems: Perspectives from Low and Middle Income Countries. Geneva: World Health Organization. 227.
Room R & Selin K. (2005). Problems from women's and men's drinking in eight developing countries. In Obot I, Room R (eds). Alcohol, Gender and Drinking Problems:

Bibliography
184
Perspectives from Low and Middle Income Countries.
Geneva: World Health Organization. 227.
Room, R, Babor T, Rehm, J. (2005) Alcohol and public
health. Lancet 365:519–30.
Room, R (1990). Measuring alcohol consumption in the United States: Methods and rationales. In Kozlowski, L.T.; Annis, H.M.; Cappell, H.D.; Glaser, F.B.; Goodstadt, M.S.; Israel, Y.; Kalant, H.; Sellers, E.M.; and Vingilis, E.R., eds. Research Advances in Alcohol and Drug Problems. Vol. 10.
New York: Plenum Press.
Room, R (1992). “The Impossible Dream? Routes to Reducing Alcohol Problems in a Temperance Culture.” Journal of
Substance Abuse 4: 91–106.
Rosenberg, M. (1989). Society and the adolescent self-image.
Middletown, CT: Wesleyan University Press.
Rosenberg, N., Laessig, R. & Rawlings, R.R. (1974). Alcohol, age, and fatal traffic accidents. Quarterly Journal of Studies on Alcohol, 35, 473-89.
Ross, R, & Preedy, V.R (Eds.). (2004). Nutrition and Alcohol: Linking Nutrient Interactions and Dietary Intake. New York:
CRC press.
Rotgers, F & Davis, B.A (2006). Treating Alcohol Problems,
John Wiley & Sons, Hoboken, New Jersey.
Russell, M, Peirce, R.S, Vana, J.E, Nochajski, T.H, Carosella, A.M, Muti, P, Freudenheim, J, & Trevisan, M (1998). Relations among Alcohol Consumption Measures derived from the Cognitive Lifetime Drinking History. Drug Alcohol
Review.
Saltz, R.F., Gruenewald, PJ. & Hennessy, M. (1992). Candidate alcohol problems and implications for
Bibliography
185
measurement: general alcohol problems, outcome
measures, instrumentation, and surrogates.
Saunder,J.B, Davis,M & Williams,R (1981). Do women develop alcoholic liver disease more readily than men?
British Medical Journal, Volume 282, 4th April.
Saunders, J.B, and Conigrave, K.M (1990). Early
identification of alcohol problems. CMAJ 143:1060–1069.
Seidman, E. (1988). Back to the future, community psychology: unfolding a theory of social intervention.
American Journal of Community Psychology, 16, 3-24.
Single, E et al. (2003). International Guidelines for Estimating the Costs of Substance Abuse (2nd edition). Geneva, WHO (www.emcdda.europa.eu/attachements.cfm/att_1981_EN_International guidelines 2001 edition, [accessed 10
October 2011].
Single, E, Easton B (2001). Estimating the economic costs of alcohol misuse: why we should do it even though we shouldn’t pay too much attention to the bottom-line results. Annual Meeting of the Kettil Bruun Society for Social and Epidemiological Research on Alcohol, Toronto, May 2001 (http://www.eastonbh.ac.nz/?p=107, accessed
12, April, 2011).
Single, E., and Wortley, S (1994). A comparison of alternative measures of alcohol consumption in the Canadian
National Survey of Alcohol and Drug Use. Addiction.
Skog, O J. (1986). An analysis of divergent trends in alcohol consumption and economic development. Journal of Studies on Alcohol.
Single E, Robson L, Xie X, Rehm J (1996). The cost of substance abuse in Canada. Ottawa: Canadian Centre on
Substance Abuse.

Bibliography
186
Sobell, L.C., and Sobell, M.B (1990). Self–report issues in
alcohol abuse: State of the art and future directions.
Sobell, L.C., and Sobell, M.B (1996). Timeline Followback (TLFB) for Alcohol (Version 4.0b) [computer software].
Toronto: Addiction Research Foundation.
Societies: A Public Health Approach. Helsinki, Finnish Foundation for Alcohol Studies in collaboration with World Health Organization.
Richupan, S (2005). Alcohol Products Taxation: International
Experiences and Selected Practices in Asia, Siam
Development Institute, Thailand.
Stockwell, T., Hawks, D., Lang, E., & Rydon, P. (1996) Unraveling the Preventive Paradox. Drug and Alcohol
Review, 15, 1, 7-16.
Straus, R., and Bacon, S.D (1953). Drinking in College. New
Haven, CT: Yale University Press.
Thaksaphon, T (2008). Alcohol Policy in Process in Thailand,
Massey University, Auckland, New Zealand.
Thavorncharoensap,M, Teerawattananon,Y, Yothasamut,J, Lertpitakpong,C, Thitiboonsuwan,K, Neramitpitagkul,P &
Chaikledkaew, U (2006). The Economic Costs of Alcohol Consumption in Thailand. http://www.biomedcentral.com/1471-2458/10/323
(accessed on 20th July, 2011)
Thinley, K (2002) Chang Gi Nyemig (The Ill Effects of Alcohol),
KMT Press, Thimphu.
Thinley, K (2002) Ja Dang Chang Gi Lhamo Nyigi Tshoetam (Debate between Goddesses of Tea and Chang), KMT
Press, Thimphu.

Bibliography
187
Thomas, M. W. (2005). Drinking Cultures: Alcohol and
Identity, Berg, New York,
Thorton, (2007). The Economics of Prohibition, The Ludwig
von Mises Institute, Aubrun, Alabama.
Tranmer, M & Elliot, M. Binary Logistic Regression.
Treno, A.J, Gruenewald, P.J & Ponicki, W.R. (1997). The Contribution of Drinking Patterns to the Relative Risk of Injury in Six Communities: a Self-report based Probability
Approach. J Stud Alcohol.
Turner, C., 1990. How much Alcohol is in a Standard Drink?
An Analysis of 125 Studies. British Journal of Addiction.
U.S. Department of Health and Human Services (1998). The Economic Costs of Alcohol and Drug Abuse in the United States 1992. Washington, DC, U.S. Government Printing
Office.
Varney, S.J, & Guest, J.F (2002). The Annual Societal Cost of Alcohol Misuse in Scotland. Pharmacoeconomics, 20:891-
907.
Votey, H. L.& Phillips, L. (1976). Minimizing the Social Cost of Drug Abuse: An Economic Analysis of Alternatives for
Policy. Policy Sciences 1 (September): 315-36.
Webster-Harrison, P. J., Barton, A. G., Sanders, H. P., Anderson, S. D., & Dobbs, F. (2002). Alcohol awareness and unit labeling. Journal of Public Health and Medicine,
24, 332–333.
WHO (2004). Global Status Report: Alcohol Policy. Geneva: World Health Organization, Department of Mental Health
and Substance Abuse.

Bibliography
188
World Health Organization (2000). International guide for monitoring alcohol consumption and related harm:
WHO/MSD/MSB/ 00.4. Geneva: Department of Mental Health and Substance Dependence, Non-communicable Diseases and Mental Health Cluster, World Health
Organization.
World Health Organization (2000). International Guide for Monitoring Alcohol Consumption and related Harm. Department of Mental Health and Substance Dependence Non-communicable Diseases and Mental Health Cluster, World Health Organization.
World Health Organization (2004). WHO global status report on alcohol 2004 Available at:http://www.who.int/substance_abuse/publications/global_status_report_2004_overview.pdf. Accessed
November 10, 2011.
World Health Organization (2007). WHO Expert Committee on Problems Related to Alcohol, Second Report: WHO Technical Report Series 944, Geneva: Switzerland.
World Health Organization (2008b). The Global Burden of Disease: 2004 update. Geneva, http://www.who.int/evidence/bod, accessed 28 July,
2010.
World Health Organization (2002). Burden of disease project.
Geneva: World Health Organization.
World Health Organization (2004). Global Status Report:
Alcohol Policy, Geneva.
World Health Organization Statistics on Adult per capita alcohol consumption. Accessed in 2006 from
http://www.who.int.

Endnotes
189
1Geeta Pandey, BBC News, Thursday, March 31, 2005, http://news.bbc.co.uk/2/hi/south_asia/4369471.stm, BBC News, Thimphu, accessed July, 2011. 2For example ‘bu kye chin ming; chang drangpa chin tam’: ‘To a new-born child a name (is due), to the beer to be drunk a talk’. 3They are supposed to enjoy (among the beings of six cyclic existence) blissful existence and to be possessed of qualities and capacities superior to those of ordinary human beings. Nevertheless, they are considered inferior to Buddhist saints; they can never attain Buddhahood, without having previously assumed the nature of man. 4One of the six classes of beings, living on the slopes of the Sumeru below ‘lha’ against whom like titans they were constantly fighting. 5Dorji Gyeltshen, Driglam Namsha Debthar, 1999. Nectar is used because in classical mythology, mortals who eat and drink ‘nectar’ become immortal. 6The deities, both national and local, were incorporated into the system of Buddhism when they were found to be numerous and too much endeared by people, to be entirely cast aside; so they are worshipped and presented with various offerings. 7This was originally written by Sixth Dalai Lama Thangya Gyamtsho (1683-1706), Poem goes: Rivers from Pure Crystal Mountains; Flow down as herbal nectar; drinking gifts of mermaid; Yeshe Khandro, with pureness; One need not suffer damnation.” 8Comprehensive cost and benefit analysis on alcohol use and abuse is expected to be carried out later. This must be done in view of the fact that alcohol plays a central role in regulating village functions, be it in terms of celebrating festivals, extending hospitality or mobilising farm labour and other services.
Endnotes
190
9This is bangchang; ara is distilled alcohol and it is more like whisky. 10One day, one of the Buddha’s followers was on alms-begging when he met a beautiful lady leading a goat and carrying a jar of wine (chang). She fell in love with the monk at first sight, and she approached him “You look handsome. Can we make love?” The monk refused saying it was sinful. She asked him to then kill the goat as she was on her way to a butcher. He refused again. She offered him the third choice, that is, to drink chang. The monk did not see Buddha had restricted drinking and therefore, thought he would not go against his vows if he accepted the drink. Upon drinking chang, he touched the lady and killed the goat. When Buddha came to learn about it, he restricted drinking among the monks and nuns and warned the people of its negative effects. 11Vagbhata's (Pha-gyal) Astanga Hridaya Samhita (Tibetan: Yan-lag brgyad pai' snin-po bsdus-pa zes bya-ba) of the Tibetan Tanjur Tripitaka and Indian Brihat Trayi Sutra Study. This is an extremely important and influential work. According to one school of thought, it is the foundation of the Tibetan Four Treatises (Circa 728-786 C.E.). It reached Persia and Arabia by the late 700s to the mid 800s from where it deeply influenced Unani. Vagbhata's. This dates to around 550-600 C.E. at the latest. This delves into the mysteries of alcoholism. 12 Inside the body, there are three doshas which govern the phyico-chemical and physiological activities. These three doshas are Vata (from ether and air), Pitta (from fire and an aspect of water), and Kapha (from water and earth).Individual constitution is acquired at birth and remains constant through life.

Endnotes
191
13Panchamakara Skt., panchamakara; this refers to Five Observances. This infamous ritual of the Five Observances has shocked many Westerners and shamed many an Indian writer on Tantric religion. The observances or ingredients of this ritual gathering are the five (Skt., pancha) makara. Traditionally, the panchamakara is celebrated by at least eight persons; four women and four men. Concerning the ritual, the Kamakhya Tantra says the following: "The true devotee should worship the Mother of the Universe with liquor, fish, meat, cereal and copulation."
14Unsweetened alcoholic beverages based on distilled alcohol with a percentage of alcohol greater than perhaps 30% are referred to as spirits. Spirits are produced by distillation of a fermented product, concentrating the alcohol and eliminating some of the by-products. 15This is based on the information presented in the AWP’s website: www.awp.org.bt. 16Personal communication with six individuals who drink Sonfy. Interviews were conducted between September 5 and September, 15, 2011 in Changzamtog, Thimphu. Their names are withheld. 17Alcohol in Developing Societies: A Public Health Approach. 18The proposition is based on the author’s interview with the farmers of Norbugang, Nganglam in 2001. Many of them whom he spoke to said that they have no alternative, but to convert their cereals to ‘liquid food’ rather than allow the grains to be devoured by insects and other pests. They specifically mentioned about the harm done by an insect they locally called as ‘langpo che bu’. This insect resembles an elephant anatomically.
19Namgyel, G (2010, April 9). Beer guzzling villages, April 9, 2010, Bhutan Observer, Retrieved on September, 2010 from
www.bhutanobserver.bt.
20If strength is expressed by weight, then volume is normally multiplied by the specific gravity of alcohol (0.79, 1 ml of

Endnotes
192
ethanol=0.79g). Some beverages are reported in proof, which can also be converted into weight. 21Kuensel (2011, June 20). No borders for Bhutanese Booze. Retrieved from www.kuenselonline.com on August, 25, 2011. 22Personal interviews with Indian expatriate workers in the construction sector evinces that most of them take home the commercial alcohol sold in Bhutan when they return home for festivals (puja) or for other reasons. They also take soaps (eg: Harmony Soap from Bangladesh) as gifts for their friends and relatives. 23http://www.cleavebooks.co.uk/dictunit/notes6.htm#whatitabout, Accessed on 21st November, 2011, Monday. 24Ara in many places is served in typical 130 ml Chinese cups and normally two drinks are served per drink (second serve is called chang-dren) and assumed to be about 80-100 ml. In total, ara served per drink is assumed to be about 200-210 ml. When ara is served in glass, the most common glass size is 350 ml. 25Women typical reach higher blood alcohol content than men who have consumed equivalent amounts of alcohol. Women normally produce less stomach enzymes that break down alcohol. 26This trend is observed in almost all developing societies. WHO in Alcohol in developing societies: a public health approach. Summary postulates that in developing societies, the choice to drink, how much, where and when are becoming means for claiming an identity, which is increasingly shaped by global patterns. 27A tax levied on the difference between a commodity's price before taxes and its cost of production. 28Excise Duty rates on the ex-factory rates on domestically manufactured alcoholic beverages other than beer applied from 20th June, 2011 as the Tax Bill presented in the 7th session of the 1st parliament.

Endnotes
193
29The real price refers to the price measured in terms of purchasing power and not affected by general price inflation. 30Prime Minister’s report to the National Assembly of Bhutan, 3rd session, 2009. June 26, 2009. 31Extracted from http://en.wikipedia.org/wiki/Harm_principle [accessed on 25th October, 2011]. 32Lifetime abstainers are people who have never consumed 12 or more (12+) alcoholic drinks in any one year; former drinkers are people who have consumed 12+ drinks in at least one year but not in the past year and current drinkers are people who consumed 12+ drinks in the past year. 33This survey (2010) covered about 7142 respondents from 20 Dzongkhags. The respondents were aged 15 and above, and therefore, those who have started their early drinking practice do not relate to recent events. 34Alcohol ‘misuse’ is used instead of ‘abuse’ because several studies has proven that responsible use of alcohol has some health benefit (in prevention of coronary disease) and several other social and cultural functions. Misuse here refers to any cost-generating aspect of alcohol consumption. 35I have spent considerable time to do the hospital costing analysis, and halfway through, I learnt that the Ministry of Health was also doing a hospital costing analysis. I abandoned my own hospital costing analysis, which by then became too complicated. 36 the MoH’s study was launched on 19 December, 2011. 37 http://apps.nccd.cdc.gov/ARDI/HomePage.aspx. 38 Health Statistics, the Ministry of Health, Bhutan. 39MoH, Bhutan (2009). Report on 2007 Steps Survey for Risk Factors and Prevalence of Non-Communicable Diseases in Thimphu.
Endnotes
194
40The Collinearity Diagnostics Table (CDT) gives the eigen values of the scaled, uncentred-cross products matrix, the condition index, and the variance proportions for each predictor. The eigen values are fairly similar, and therefore, the uncentred-cross products matrix is well-conditioned, and the derived model is likely to be unchanged by small changes in measured variables. I have annexed the CDT as annexure 2. Expressing the other way, that is, using condition indexes, which represent the square root of the ratio of the largest eigen value to the eigen value of interest (for the dimension with the largest eigen value, the condition index is always 1, which is the case with the dimension 1). 41The overall fit of the model is assessed using the log likelihood statistic. The value is multiplied by 2 (-2LL), and this multiplication is done to make it approximately chi-square distribution. This can make it possible to compare values against those that is expected to get by chance alone. Large log likelihood value indicates poorly fitting statistical model. Lower log likelihood value indicates that the model is predicting the outcome variable more accurately. 42The model’s chi-square value is an analogue if the F-test for the regression sum of squares. In an ideal world, we would like to see a non-significant -2LL and highly significant model chi-square statistics. This indicates that the new model, when a new predictor is added is better than without those predictors. 43EXP (B) is the proportionate change in odds (or change in odds). If the value is greater than 1, then it indicates that as the age (predictor) increase, the odds of outcome occurring (FAU) increases. The value less than 1 indicates that as the predictor increases, the odds of FAU occurring decreases. 44The degree of freedom is the number of parameters in the new model (that is, the number of predictors plus 1) which in this case is 2 minus the number of parameters in the initial model [which is 1, the constant]. Therefore, in the present case, df=2-1=1. 45Wald statistic is analogues to estimated regression coefficient (b) and their standard errors used to compute a t-statistic. Wald statistic is used in logistic regression and has a special

Endnotes
195
distribution known as the chi-square distribution. This tells us whether b-coefficient for a particular predictor is significantly different from zero. If it is significantly different from zero then we conclude the predictor is making significant contribution to the prediction of the outcome variable. 46Bhutan Alcoholism related deaths increasing, www.kuenselonline.com. 47Category A: Thimphu, Phuentsholing, Samdrupjongkhar and Gelephu, Category B: Paro, Mongar, Trashigang and Samtse and Category C: rest of the district towns. 48Illegal ara flows in gallons, June 4, 2010 (Bhutan Observer) http://www.who.int/whosis/indicators/compendium/2008/3alu/en/index.html. 49Section 17, Rules on the Sales Tax: Customs and Excise Act of the Kingdom of Bhutan, 2000. 50Circular issued by the Ministry of Trade and Industry vide letter No. MTI/111-71/274, dated Januarary, 1999. 51Circular issued by the MTI vide letter No. MTI/111/-71/274 dated January 7, 1999 52Symposium: "Medicine Meets Millennium" Alcohol Problems in Developing Countries: Challenges for the New Millennium, Charles D.H.