alexandra spitz - zentrum für europäische ...ftp.zew.de/pub/zew-docs/dp/dp0304.pdf · germany...
TRANSCRIPT

ZEWZentrum für EuropäischeWirtschaftsforschung GmbH
C e n t r e f o r E u r o p e a nE c o n o m i c R e s e a r c h
Discussion Paper No. 03-04
IT Capital, Job Content and Educational Attainment
Alexandra Spitz

Discussion Paper No. 03-04
IT Capital, Job Content and Educational Attainment
Alexandra Spitz
Die Discussion Papers dienen einer möglichst schnellen Verbreitung von neueren Forschungsarbeiten des ZEW. Die Beiträge liegen in alleiniger Verantwortung
der Autoren und stellen nicht notwendigerweise die Meinung des ZEW dar.
Discussion Papers are intended to make results of ZEW research promptly available to other economists in order to encourage discussion and suggestions for revisions. The authors are solely
responsible for the contents which do not necessarily represent the opinion of the ZEW.
Download this ZEW Discussion Paper from our ftp server:
ftp://ftp.zew.de/pub/zew-docs/dp/dp0304.pdf
Das Papier entstand im Rahmen des Forschungsprojekts "Informationstechnologien, Arbeitsplatzorganisation und qualifikatorische Lohnstruktur" im Auftrag der Landesstiftung Baden-Württemberg.
The paper was written as part of the research project "ICT, Work Organization, and Wages Across and Within Skill Groups" commissioned by the Landesstiftung Baden-Württemberg foundation.

Non–technical Summary
The impact of technological change on the labor market has always been a major concern
of economic research. The discussion even intensified in the last two decades due to the fast
diffusion of personal computers at workplaces, and due to the empirical evidence that workers
with high levels of education are more likely to use computer technology. This led to the
hypothesis that information technologies are skill–biased, implying the labor demand to shift
towards employees with higher educational attainment.
This study explores the link between information technologies and employees with higher
educational levels by investigating how the introduction of computer technology alters the skill
requirements of occupations. It is argued that computer technologies do not replace whole
occupations, however, they rather substitute for repetitive and routinized tasks. Compared to
previous technological developments that were mainly amenable to routinized manual tasks,
computer technologies are additionally able to replace simple human cognition such as perceiv-
ing, choosing, and manipulating processes. Furthermore, computer technologies are comple-
mentary to analytical and interactive activities.
These technological features of computer technologies shifts the relative skill requirements
of occupations towards analytical and interactive activities, for which employees with higher
educational attainment have comparative advantages.
The analysis is based on a large data set of employees, covering four points in time, 1979,
1984/85, 1991/92, and 1998/99. The data set contains detailed information on the tasks that
employees actually perform on–the–job, the technology they use, as well as on the educational
attainment of employees.

IT Capital, Job Content and Educational Attainment
Alexandra Spitz
Centre for European Economic Research (ZEW), Mannheim
Januar 2003
Abstract
Based on a large data set containing information on occupations between 1979 and
1999, this study explores the “black box” surrounding the skill–biased technological change
hypothesis by analyzing the mechanisms that induce information technologies to be com-
plementary to employees with higher skill levels. Using direct, multidimensional measures
of occupational skill requirements, the analysis shows that IT capital substitutes repetitive
manual and repetitive cognitive skills, whereas it complements analytical and interactive
skills. These changes in the within occupational task mix result in an increased deploy-
ment of employees with high levels of education who have comparative advantages in
performing non–repetitive cognitive tasks.
Keywords: skill–biased technological change, job task content, vocational education
JEL classification: O30, J23, J24, C30
Address: Centre for European Economic Research (ZEW)
Research Group Information and Communication Technologies
P.O. Box 10 34 43
D–68034 Mannheim
Germany
Phone: +49/621/1235–293
Fax: +49/621/1235–333
E-Mail: [email protected]
Acknowledgments: The paper was written as part of the research project “ICT, WorkOrganization, and Wages Across and Within Skill Groups” commissioned by the Landes-stiftung Baden-Wurttemberg foundation. I am indebted to David Autor, Miriam Beblo, IreneBertschek, Lex Borghans, Bernd Fitzenberger, Thomas Hempell, Frank Levy, and ElisabethMueller for their suggestions and comments.

1 Introduction
In the last decades industrialized countries have witnessed a large increase in the supply of more
educated workers and rising returns to education. This development favors the argument that
technological change has been skill-biased, shifting labor demand towards employees with higher
levels of skills. However, “...(skill–biased technological change) also tends to be something of a
residual concept, whose operational meaning is often labor demand shift with invisible cause”
(Bresnahan (1999), p. 340).
This study aims to open the “black box” of skill–biased technological change (SBTC) by
investigating the mechanism that induces information technologies (IT) to be complementary
to employees with higher levels of education. It is argued that the rapid diffusion of IT cap-
ital (which is mainly due to the exogenous price decline in IT devices) causes changes in the
requirement for different kinds of skills at workplaces, which in turn shifts in the educational
composition of employees.
The analysis is performed using direct measures of occupational skill requirements that are
based on the activities that people perform on the job. These activities are classified in six
skill categories: analytical tasks like research, planning or evaluation activities, interactive tasks
like the coordination and delegation of work, repetitive cognitive tasks like double entry book-
keeping and calculating, repetitive manual tasks like machine feeding or running a machine,
non–repetitive manual tasks like housekeeping or restoring houses, and computing tasks. These
skill categories have been identified as being particularly important in modern work environ-
ments (e.g. Autor et al. (2001), Green et al. (2001), Howell and Wolff (1991), and Stasz
(1997)).
The main focus in this study is on within occupational changes in skill requirements, which
are assumed to be mainly technology–driven. However, as will be illustrated in the descriptive
part of the paper, changes in the distribution of employment by occupational groups may also
have important impacts on skill requirements.
The main hypotheses tested are, that (1) IT capital substitutes repetitive manual and repet-
itive cognitive activities, that (2) IT capital is complementary to analytic and interactive activ-
ities, and that (3) IT capital increases the requirement for computing skills. Thus, in contrast
to widespread believes, IT capital does not substitute whole occupations. The scope for sub-
stitution is limited to certain tasks. This limited substitution relationship (Bresnahan (1999))
between IT capital and occupational tasks shifts the demand for labor towards employees with
higher levels of educational attainment who are supposed to have a comparative advantage in
1

performing non–repetitive cognitive tasks (Autor et al. (2001)).
The empirical analysis is based on occupation–by–industry groups. These groups are synthe-
sized by aggregating individual level data. The data set contains four waves that were launched
in 1979, 1985/86, 1991/92 and in 1998/99 with 26,000 observations on average. The data set
is unique in the sense that it draws a clear picture of the task composition of occupations, that
is, employees who participate in the survey indicate what they actually do on their jobs. The
occupational classifications are constant over time, such that detailed analyses on the chang-
ing skill requirement patterns within occupations can be carried out on the basis of the task
descriptions. In addition, the data set contains information on the equipment used by the
workforce to perform the tasks (for example personal computers, pencils, or typewriters) and
information on the human capital of employees.
Using weighted seemingly unrelated regression (SUR) techniques, the main findings are that
highly computerizing occupation–by–industry groups are positively related to changes in the
requirement for interactive, analytical and computing skills, whereas they are negatively related
to changes in the requirement for repetitive cognitive and repetitive manual skills. Depending
on the tasks, computerization accounts for between 8 and 137 per cent of the changes in skill
requirements.
In addition, structural equations are set up based on temporal ordering of cause and effects.
Using three–stage–least–square (3SLS) estimation techniques, the results indicate that the shifts
in skill requirements are positively related to changes in the fraction of employees with high
levels of educational attainment.
The paper is arranged in 6 sections. The next section discusses previous theoretical and
empirical results concerning the relationship between IT capital, job skill requirements, and
education. Section 3 describes the data set and the variables. Section 4 presents stylized facts
on the occupational, educational, and technological trends in Germany since 1979. Section 5 in-
vestigates econometrically the relationship between IT capital, occupational skill requirements,
and educational attainment on the basis of synthetic occupation–by–industry groups. Section
6 concludes.
2
2 Technology, Skills and Education in the Workplace
SBTC is one of the most prominent hypothesis explaining labor market trends across indus-
trialized countries in the last three decades (for example Acemoglu (2002), Acemoglu (1998)).
The extensive empirical research devoted to SBTC in recent years also reflects the attention
that has been given to this question not only by researchers but also by policy makers. Chen-
nells and van Reenen (1999) give a comprehensive overview of the literature on SBTC, covering
the major empirical studies in this field of research. For Germany, empirical studies by Falk
(2001), Falk and Koebel (2001), Fitzenberger (1999), and Kaiser (2000) support the view that
technological change in the recent years has been skill–biased.
Human capital theory forms the basis of conceptual approaches to skills (Becker, 1964).
In this view, skills are defined as the stock of human capital embodied in individuals. How-
ever, as this relatively vague definition might already suggest, there are a variety of empirical
measurement strategies used to gauge the skill level of individuals.
Most studies use “traditional” skill measures to assess the skill level of employees such
as broad categorizations (production workers/non–production workers (Berman et al., 1994) or
blue–collar/white–collar workers (Berndt et al., 1992) or levels of formal educational attainment
(Kaiser, 2000). These classifications are divisions according to occupational groups which are of
limited usability in determining skill requirements. They document the structural shift towards
increased deployment of white–collar work in all major sectors of industrialized countries and
the increased employment of employees with higher levels of formal education. It is unlikely
that they capture homogeneous groups of workers, and that they show what kinds of activities
these workers are qualified for. In reality, some blue–collar jobs may for example require
more skills than many white–collar jobs. Further, these skill classifications fail to capture the
multidimensional nature of skills as set out by Spenner (1983).
In addition, these studies do not distinguish between the skills that people bring to jobs in
the sense of individual possessions like knowledge, abilities or capacities and skills that jobs
require, that is, skills that are required to perform certain tasks (Spenner, 1983, 1990). This
distinction is, however, important since the possession of certain skills cannot be equated with
their use. The massive increase in the share of employees with high educational attainment in
industrial economies does not necessarily imply the existence of a higher number of skilled jobs
(Borghans and de Grip, 2000). People with equal investment in their formal education may
attain very different levels of skills. Moreover, the acquisition of skills continues after school,
as does the depreciation of skills. In addition, the labor market might use the level of formal
3

education as a signal of some underlying abilities rather than a source of skill supply (Borghans
et al., 2001).
The skill measurement strategy in this analysis is in the tradition of studies that use direct
measures of skills that rely implicitly on the assumption that the employees’ occupational
duties are an unbiased measure of employees’ skills. Most of these studies use the Dictionary
of Occupational Titles to analyze how skill requirements of jobs in the U.S. have changed in the
last decades (see Autor et al., (2001), Rumberger (1981), Howell and Wolff (1991), and Wolff
(2000)).1 In a nutshell, they find that the changing occupational and industry employment
patterns resulted in a upgrading of cognitive and interactive skills and a declining demand for
manual skills.
Two of these studies investigate the relationship between changes in skill requirements and
technological developments. Autor et al. (2001) use five measures of occupational skill re-
quirements: non–repetitive cognitive/analytic, non–repetitive cognitive/interactive, repetitive
cognitive, repetitive manual, and non–repetitive manual tasks. On various aggregation levels,
they find that computer technology substitutes repetitive tasks, both manual and cognitive, and
complements for non–repetitive cognitive tasks, both analytic and interactive. Wolff (2000) uses
various measures of technological activity and three measures of occupational skills. They find
that industry computerization is positively related to changes in interactive skills as well as
to changes in substantive complexity. However, they do not find any significant relationship
between computerization and changes in manual skills.
The skill categories used in these studies are those which case studies identified as the “key”
skills required by modern workplaces of industrialized countries (for example Hirschhorn (1984),
Stasz (1997, 2001). Their overall importance is mainly ascribed to the diffusion of IT capital
at workplaces and stems from two arguments: First, the distinction between manual and cog-
nitive tasks results from one technological feature unique to IT capital. Compared to previous
technologies that were only amenable to repetitive manual tasks, IT capital is also amenable to
repetitive cognitive tasks. This particular feature is due to the fact that IT capital, with the help
of software programs, is able to store, retrieve, and act upon information. Second, although in
principle computer technology is only amenable to repetitive and well–defined tasks, it also has
the potential to complement non-repetitive cognitive tasks (analytical and interactive tasks).
IT capital is in particular said to increase the requirement for interactive skills such as problem
solving, teamwork, and communication skills as computer–based management techniques like
1One exception is the study by Green et al. (2001) who use the British Skill Survey to investigate various
sources of workplace skills, in particular problem–solving, communication, social, and teamworking skills.
4

customer relationship management intensify the contacts with customers. Moreover, customer
service has become an important dimension of competition. Cooperation of workers has be-
come more important due to modern work organization. Collaborative work forms (also called
‘high performance work practices’) like self–managed teams, problem–solving groups or quality
circles have been broadly adopted in the 90s (Osterman (2000)). Personal interaction increases
as firms concentrate increasingly on the integration of all parts of the internal processes (plan-
ning, construction, sales, etc.), inter–firm relationships (for example strategic alliances), and
high flexibility of technology (Altmann et al. (1986b)).
As Bresnahan (1999) pointed out, an examination of the history of IT applications reveals
the importance of organizational computing such as corporate accounting, billing, or payroll
systems since the late 50s. The examples show that organizational computing applications are
designed for specific departments, typically information–intensive functional areas of companies,
rather than for a person. This argument is also emphasized by industrial sociologists who stress
the new type of rationalization which is associated with IT capital: systemic rationalization,
which is characterized by a change in the major aims of rationalization purposes. Rationaliza-
tion takes place increasingly in a perspective of reorganizing the whole production processes
within firms. The aim is to integrate and reorganize the different parts of the production pro-
cess to enhance the overall efficiency (Altmann et al. (1986a), Baethge and Baethge–Kinsky
(1995)). Thus, IT capital does not take over whole occupations. It is able to substitute and
complement certain tasks, however, the scope for substitution is limited, as Bresnahan (1999)
argues. He focuses on white–collar work, since “computers are good at repetitive task, and
bureaucracies are full of repetitive tasks that might be automated” (p. F403). Computers thus
revolutionized a formerly mainly paper- and people–based organization. This development has
had a large impact on white–collar work, in particular as the increased industrialization allowed
this type of work to be separated into “front–office” and “back–office” components. Employ-
ees in the back–office mainly perform data processing tasks. This concerns mostly clerks with
medium levels of education. Front–office workers, in contrast, foster customer contacts and re-
lationships with entities outside the firm which increases the requirements for interactive skills
for these kinds of workers.
In this study, the limited substitution relationship between IT capital and workplace tasks
is investigated. It is viewed as the main mechanism on which SBTC is based since it increases
the relative requirement for non–repetitive cognitive tasks (analytical and interactive) for which
employees with higher levels of educational attainment have comparative advantages. However,
the analysis not only concentrates on white–collar work. It is argued that IT as a general pur-
5

pose technology has comparable effects on blue–collar work. IT capital substitutes routinized,
repetitive manual tasks. Not literally by taking these tasks over. However, IT capital is em-
bedded in various machineries such as CNC and CAD machines that are capable to perform
these tasks. Thus, the limited substitution relationship between IT capital and workplace tasks
is also present in blue–collar work.
The limited substitution mechanism changes the task composition of occupations. Autor
et al. (2001) is the only study that investigates how IT capital shifts the occupational tasks
composition. They find a positive relationship between IT capital and non–repetitive analyt-
ical and non–repetitive interactive tasks, and a negative relationship between IT capital and
repetitive cognitive tasks.
3 Data Set and Definitions of Variables
The analysis is based on the so–called BIBB/IAB–data set which is a survey among employees.
It contains four cross–sections that were launched in 1979, 1985/86, 1991/92 and in 1998/99.
Based on these individual level data, occupation–by–industry groups are synthesized, where
occupations are defined on the 2–digit–level.2 This level of classification contains nearly 100
different occupations. Table A in Appendix B lists the 42 industries that are considered. The
estimations are based on 2125 occupation–by–industry groups. 35 per cent of the groups are
observed in each of the four waves, 52 per cent in three or four waves, whereas 31 per cent are
only observed once.3
People are classified according to the occupation they actually perform (Erwerbsberuf),
rather than according to the occupation they learned (Ausbildungsberuf). This allows to an-
alyze how technology changes what people actually do on the job. By contrast, occupational
training curricula remain fairly stable over time and reveal little about task changes within oc-
cupations. The focus on occupations that people actually perform has two implications: First,
people are not necessarily classified within the occupational title they have learned. Second,
2The classification of occupational titles corresponds to that of the German Federal Employment Bureau,
1988.3The data set has various advantages compared to the Dictionary of Occupational Titles (DOT), a data
set that is often used by researchers in the U.S. for questions related to skills. The DOT is a survey in which
experts examine the task content of occupations. The experts assign scores to different indicators characterizing
the occupations. This proceeding encourage behavior of analysts that results in an underestimation of the true
changes in job content. Moreover, occupational titles in the DOT are not consistent over time (for detailed
criticism see Spenner (1983) and references cited there).
6
people classified within the same occupational title may have different educational background.
This source of variation will be analyzed later.
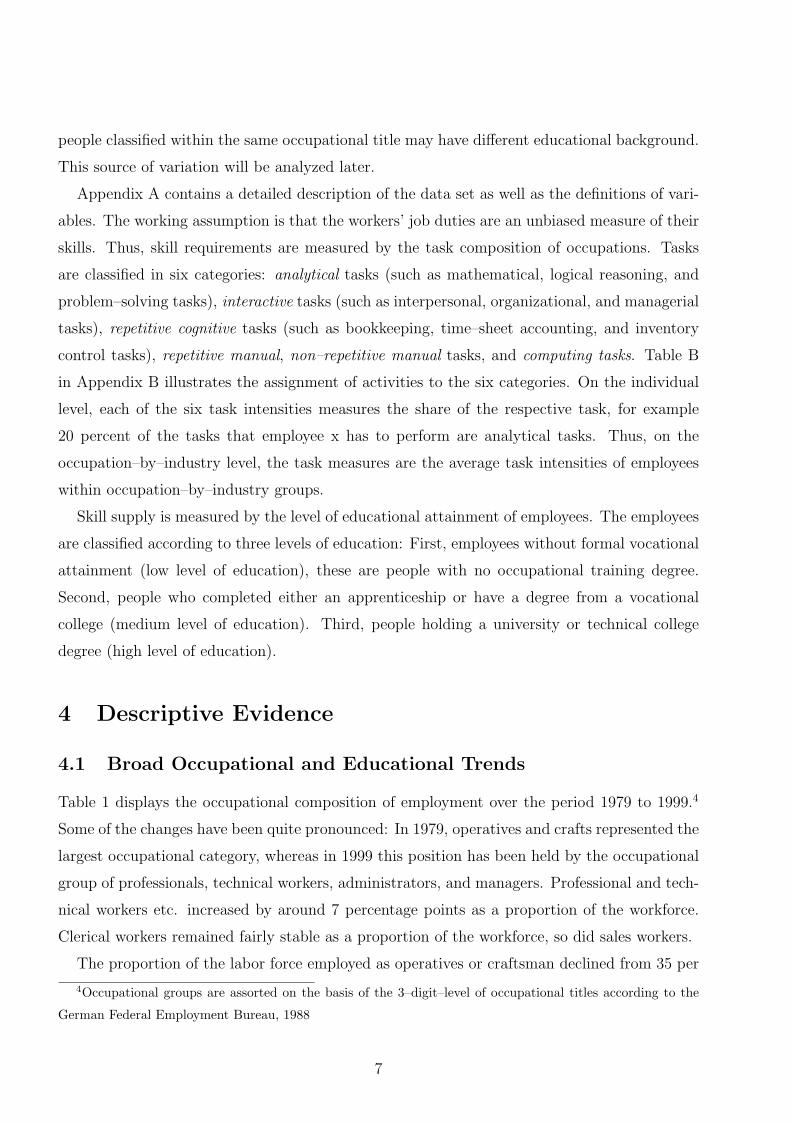
Appendix A contains a detailed description of the data set as well as the definitions of vari-
ables. The working assumption is that the workers’ job duties are an unbiased measure of their
skills. Thus, skill requirements are measured by the task composition of occupations. Tasks
are classified in six categories: analytical tasks (such as mathematical, logical reasoning, and
problem–solving tasks), interactive tasks (such as interpersonal, organizational, and managerial
tasks), repetitive cognitive tasks (such as bookkeeping, time–sheet accounting, and inventory
control tasks), repetitive manual, non–repetitive manual tasks, and computing tasks. Table B
in Appendix B illustrates the assignment of activities to the six categories. On the individual
level, each of the six task intensities measures the share of the respective task, for example
20 percent of the tasks that employee x has to perform are analytical tasks. Thus, on the
occupation–by–industry level, the task measures are the average task intensities of employees
within occupation–by–industry groups.
Skill supply is measured by the level of educational attainment of employees. The employees
are classified according to three levels of education: First, employees without formal vocational
attainment (low level of education), these are people with no occupational training degree.
Second, people who completed either an apprenticeship or have a degree from a vocational
college (medium level of education). Third, people holding a university or technical college
degree (high level of education).
4 Descriptive Evidence
4.1 Broad Occupational and Educational Trends
Table 1 displays the occupational composition of employment over the period 1979 to 1999.4
Some of the changes have been quite pronounced: In 1979, operatives and crafts represented the
largest occupational category, whereas in 1999 this position has been held by the occupational
group of professionals, technical workers, administrators, and managers. Professional and tech-
nical workers etc. increased by around 7 percentage points as a proportion of the workforce.
Clerical workers remained fairly stable as a proportion of the workforce, so did sales workers.
The proportion of the labor force employed as operatives or craftsman declined from 35 per
4Occupational groups are assorted on the basis of the 3–digit–level of occupational titles according to the
German Federal Employment Bureau, 1988
7

Table 1: Distribution of Employment by Occupational Groups
Occupational Group 1979 1985/86 1991/92 1998/99
White–collar workers 53.7 53.2 54.4 60.4
Professional, Technical workers, Managers, Administrators 23.0 24.1 24.4 30.1
Clerical 22.7 21.2 21.6 21.8
Sales 8.0 7.9 8.4 8.5
Blue–collar workers 38.8 38.0 36.6 30.1
Operatives and Craft 35.4 35.1 33.7 27.5
Laborer 3.4 2.9 2.9 2.6
Personal service workers 6.6 7.6 7.9 8.5
Farm workers 1.0 1.2 1.1 1.0
The sample includes workers ages 15–65 with residence in West Germany and German nationality.
Details on the construction of occupational groups can be found in the Data Appendix.
cent to around 28 per cent. Laborers always played a minor role as a proportion of the labor
force.
Comparing these occupational trends in West Germany with comparable figures for the U.S.
(for example Wolff, 2000), the occupational changes appear to be relatively modest. Contrary
to the relatively stable occupational trends for clerical work and sales work in West Germany,
clerical work in the U.S. witnessed a sizeable reduction as a proportion of the labor force and
sales work witnessed a sizeable increase.
Table 1 documents that in addition to the structural shift towards service industries the
importance of service occupations increased throughout the economy.5 Traditionally, service
work is categorized into three groups: personal service, clerks and administrative support, and
sales. Face to face or voice to voice interactions are considered as fundamental aspects of work.
However, there is considerable variation in the content of work of these occupational categories
and, thus, in the substitutability of parts of the work tasks by IT capital. The work of clerks
and administrative support, with a high fraction of work tasks being transactional in nature, is
particularly amenable to the introduction of computer technology. The work of sales, however,
with a high fraction of work being more relational in nature, is only in a limited scope amenable
to IT capital (Committee on Techniques for the Enhancement of Human Performance, 1999).
5Bund-Lander-Kommission (2001), p. 37, Figure 1, displays changes in the sectoral structure of employment
in West Germany between 1978 and 1999.
8

In addition, as Table 2 documents, clerical and sales occupations have also major differences
in the educational structure of employees. Clerical occupations witnessed an educational up-
grading within the last two decades, whereas the educational structure of sales occupations
remained fairly stable.
Table 2: Distribution of Educational Attainment by Occupational Groups
Occupational Group 1979 1985/86 1991/92 1998/99
Professional, Technical etc.
highly educated 30.47 31.47 41.93 42.22
medium educated 53.11 49.81 53.48 52.22
low educated 16.42 18.72 4.59 5.56
Clerical
highly educated 2.37 3.34 9.00 10.07
medium educated 79.20 79.69 79.06 81.22
low educated 18.43 16.97 11.93 8.72
Sales
highly educated 1.48 1.52 3.86 2.83
medium educated 83.81 82.26 82.95 82.78
low educated 14.71 16.21 13.19 14.39
Operatives and Craft
highly educated 0.59 0.52 0.96 1.35
medium educated 78.04 77.65 81.37 81.56
low educated 21.37 21.84 17.67 17.09
The sample includes workers ages 15–65 with residence in West Germany
and of German nationality. Details on the construction of occupational
groups can be found in the Data Appendix.
The fourth category of service work analyzed in this study, containing professionals, technical
workers, managers and administrators, is becoming more and more important. In 1998/99,
their importance as a fraction of the workforce was equal to that of all blue–collar workers.
Professionals and technical workers such as scientists, engineers, lawyers or technicians are
often termed experts or knowledge workers, who are viewed as being critical to both economic
growth in industrial countries and the structural change towards postindustrial economy. The
growth in professional and technical work is mainly attributed to four related trends:6 corporate
6Committee on Techniques for the Enhancement of Human Performance (1999), p.146ff., and references cited
9

growth, commercialization of scientific knowledge in particular physics and chemistry as well
as advances in life sciences, demographic changes, and technological change.
This service category is often viewed as being comprised of ‘high–skilled’ occupations, result-
ing from the educational structure of employees. As Table 2 shows, the occupational category
of professionals, technical workers, managers, and administrators always held the highest pro-
portion of employees with university or technical college degree. This group of occupations
witnessed a relatively sharp increase in the share of employees with high levels of education
over the period 1979 to 1999. The proportion of employees with low levels of education corre-
spondingly declined.
Many studies classify the skill level of employees using broad occupational classifications
such as white–collar/blue–collar workers. As already noted, however, every occupational group
is composed of employees with different educational background (Table 2). Employees with
medium levels of education always represented the largest proportion within each occupational
group, both for white–collar and blue–collar occupations.7
Table 3 documents, that the West German labor force as a whole witnessed a sizeable relative
increase in the proportion of workers with high levels of education.
Table 3: Employment Shares of Different Educational Groups
Aggregate Trends in the Employment Share of Different Educational Groups
1979 1985/86 1991/92 1998/99
High Levels of Education 8.1 8.9 13.3 16.4
Medium Levels of Education 71.1 68.3 71.2 70.3
Low Levels of Education 21.8 22.8 15.4 13.3
The sample includes workers ages 15–65 with residence in West Ger-
many and of German nationality.
The proportion of the workforce holding a university degree or a degree from a technical
college increased from about 8 per cent in 1979 to 16 per cent in 1999, whereas the proportion of
employees without formal educational attainment experienced a substantial decline. However,
workers with medium level of education who either completed an apprenticeship or have a degree
there.7The table does not contain the descriptive results for laborers, personal service workers, and farmers.
Laborers and farm workers only represent a small proportion of the workforce. Personal service workers are not
part of the main interest of this study. However, the results are available on request from the author.
10

from a vocational college still represent the largest proportion of the workforce. Compared
to other figures that document the structure of qualification of employees in West Germany
(see for example Bund-Lander-Kommission (2001), p. 35, Table 6), the figures in Table 3
seem to be representative. The small overrepresentation of employees with medium levels of
education is attributable to the fact that the data set in this study excludes employees with
foreign nationality whereas other statistical sources refer to all West German employees. West
German employees with foreign nationality, however, tend to have lower levels of education
compared to their German counterparts. Moreover, the data set contains part–time workers.
Male part–time employees tend to have high educational levels.
Summarizing the descriptive results, in the last two decades of the twentieth century, West
Germany witnessed a substantial increase in white–collar occupations and a corresponding re-
duction in blue–collar occupations. It also experienced a considerable increase in the proportion
of employees with high levels of education. The occupational group of professionals, technical
workers, managers, and administrators, who saw the highest increases as a fraction of the work-
force, put the highest emphasis on employees with high levels of education. Formal degrees
seem to have become more important in all occupational groups. However, the descriptive
figures also demonstrate that each occupational category is compound by employees with all
three levels of formal education.
4.2 Trends in Occupational Skill Requirements
In addition to these trends in the occupational composition of employment, it is also interesting
to investigate trends in skill requirements. As already noted, the working assumption is that the
respondents occupational duties are an unbiased measure of occupational skill requirements.
The descriptive results displayed in Table 4 show that three out of the six skill measures witness
quite clear aggregate trends over the period 1979 to 1999. The trend in interactive tasks is the
most pronounced. In 1979, interactive tasks represented on average around 10 per cent of the
activities on–the–job, whereas in 1999 they represented more than 60 per cents. Although
still representing a small proportion of activities on–the–job, computing tasks also experienced
an increase in importance between 1979 and 1999. In contrast, the proportion of repetitive
cognitive tasks witnessed a sizeable reduction.
These trends in aggregate skill requirements may result from transformations along two
tracks: First, from changes in the occupational structure of employment (see subsection 4.1),
and second, from changes in skill requirements within occupations.
11

Table 4: Trends in Aggregate Skill Requirements
analytic interactive repetitive repetitive non-repetitive computer
skills skills cognitive manual manual skills skills
1979 12.8 11.5 15.2 10.9 49.2 0.3
1985/86 10.0 23.8 16.7 18.8 27.9 2.8
1991/92 8.3 23.6 15.3 11.4 36.1 5.3
1998/99 15.2 63.7 3.0 2.1 11.0 5.0
The sample includes workers ages 15–65 with residence in West Germany and of
German nationality. Details on the construction of task intensities can be found in
the Data Appendix.
Table 5 displays descriptive figures on task intensities by major occupational groups since
1979. Professional and technical workers, administrators, and managers have always had the
highest intensities in analytical skill and, together with sales personnel, in interactive skills.
The figures show, however, an increase in the average proportion of interactive activities
in the work of all occupational categories. In 1998/99 interactive tasks represent the high-
est proportion of on–the–job activities for both blue– and white–collar occupational groups.
Repetitive manual and repetitive cognitive task intensities, in contrast, sharply declined and in
1998/99 they play only a minor role in all occupational groups.
In the late 70s, computing skills started to play an important role at the workplace of all
occupational groups. Since then, computer skills increased as a fraction of on–the–job activities
within all occupational groups, but most pronounced for clerical workers.
Sales workers witnessed an increase in the proportion of analytical, interactive, and comput-
ing tasks in the period 1979 to 1999. In contrast, the proportion of repetitive cognitive tasks
declined on average.
In 1979, the work of operatives and craftsmen was dominated by non–repetitive manual,
repetitive manual and repetitive cognitive activities. Since then, they experienced a sharp
increase in the requirements for analytical and interactive skills.
12

Table 5: Distribution of Skill Requirements by Occupational Groups
Occupational Group 1979 1985/86 1991/92 1998/99
Professional, Technical etc.
analytic 25.24 20.80 17.04 18.46
interactive 24.60 38.85 38.27 61.08
repetitive cognitive 17.32 16.09 15.06 4.73
repetitive manual 5.30 5.34 4.13 0.62
non–repetitive manual 27.10 16.28 20.27 9.65
pc–skills 0.44 2.64 5.24 5.45
Clerical
analytic 17.96 11.01 7.99 13.75
interactive 8.68 26.61 24.90 65.92
repetitive cognitive 25.60 44.73 39.80 4.42
repetitive manual 15.47 6.88 1.99 0.21
non–repetitive manual 31.38 2.23 10.45 5.46
pc–skills 0.91 8.54 14.86 10.24
Sales
analytic 7.50 2.73 1.80 9.72
interactive 23.55 59.11 58.55 74.62
repetitive cognitive 18.64 17.92 13.84 1.67
repetitive manual 20.34 13.95 1.27 0.50
non–repetitive manual 29.87 4.31 21.88 10.74
pc–skills 0.10 1.98 2.67 2.75
Operatives and Craft
analytic 3.03 4.80 4.65 16.81
interactive 3.85 7.08 6.97 58.20
repetitive cognitive 9.02 3.52 3.63 0.72
repetitive manual 9.24 35.27 25.02 5.72
non–repetitive manual 74.81 48.88 58.51 16.26
pc–skills 0.05 0.44 1.23 2.29
The sample includes workers ages 15–65 with residence in West Ger-
many and of German nationality. Details on the construction of
occupational groups and task intensities can be found in the Data
Appendix.
13

Employees with higher levels of education are often viewed as having comparative advan-
tages in performing non–repetitive cognitive task, in particular analytical but also interactive
tasks. Table 6 displays the means of task intensities by educational groups. The descriptive
evidence confirms this view. In addition, the higher the educational attainment the higher the
requirements for computing skills. In contrast, the figures indicate that employees with low
levels of education are more occupied with repetitive manual and with non–repetitive manual
tasks.
Table 6: Distribution of Task Intensities by Educational Groups
analytic interactive repetitive repetitive non-repetitive computer
skills skills cognitive manual manual skills skills
high levels of education 19.1 53.6 12.1 2.0 8.3 5.0
medium lev. of education 11.4 28.4 13.3 10.9 32.5 3.4
low levels of education 8.0 23.2 10.0 15.9 41.4 1.5
The sample includes workers ages 15–65 with residence in West Germany and of
German nationality. Details on the construction of task intensities can be found in
the Data Appendix.
4.3 Workplace Computerization in West Germany between 1979
and 1999
Whereas at the beginning of the IT revolution main–frame computers dominated the data–
processing units of large firms, from the late 70s on personal computers began to diffuse to
business users. Due to the steady price decline, this diffusion process has been pronounced.
Table 7 displays the percentage share of computer users at work. The table shows that within
twenty years, more than half of the workforce uses computers on–the–job. Between 1979 and
1999, computer diffusion increases on average by around 45 per cent per annum.
Table 7 also demonstrates that the adoption of computer technologies increases in educational
attainment of employees. In 1979, already more than ten per cent of employees with high levels
of education used a computer at the workplace. In 1999 this fraction has increased to more
than 80 per cent.
The computer diffusion process was not uniform with respect to different economic sectors.
14

Table 7: Trends in Aggregate Computer Use and Within Different Educational Groups
Diffusion of Computer, Terminals, Portables, electronic data processing devices
Overall Low Educated Medium Educated Highly Educated
1979 6.0 3.7 6.0 12.4
1985/86 18.1 10.1 19.8 25.5
1991/92 34.5 16.1 33.6 60.7
1998/99 55.4 27.2 54.4 82.7
The sample includes workers ages 15–65 with residence in West Germany and
of German nationality.
Table 8 demonstrates that the key adopters of computer capital are service industries in which
information is the most important good. Whereas major previous technologies were used firstly
in manufacturing, computer use was relatively low in manufacturing in 1979 and is still below
average in 1999. The table also demonstrates the vanguard function of financial services (Barras,
1990). In 1979, financial services already had the highest penetration rates of computer capital.
In 1999, nearly every employee within these sectors uses a computer at work. Although the
public and quasi public sectors had relatively low computer penetration rates in 1979, they
catched up in the twenty years thereafter. From the mid–80s on, these sectors had the second
highest fractions of computer users.
However, this differentiation according to sectors plays down that IT capital not only had
major influence on service industries but also on the service functional areas of manufacturing
industries. As Table 9 shows, computer adoption was quite different for different occupational
groups.
Table 8: Diffusion of Computer Capital by Sectors
1979 1985/86 1991/92 1998/99
Manufacturing Sectors 4.8 15.2 31.1 46.1
Financial Sectors 24.3 63.0 83.3 96.9
Services Sectors 6.0 16.7 33.2 58.5
Public Sector 4.4 17.8 40.9 60.5
The sample includes workers ages 15–65 with residence in
West Germany and of German nationality.
It was particularly pronounced in professional, technical, managerial, administrative, and
15

clerical occupations. The diffusion of computer capital was much broader among clerical occu-
pations than among sales occupations. This may indicate the division of office work in back–
and front–office functions as for example Bresnahan (1999) pointed out, with employees in the
back–office being occupied with data–entry and data–processing tasks (clerks), and employees
in the front–office spending most of their time serving customers and clients (sales personnel).
In contrast to the widespread diffusion of computers in most white–collar bureaucracies,
operatives and crafts occupations witnessed a much slower penetration rate of computer capital
at the workplace. Because of the relatively narrow definition of IT capital in this study, these
figures miss the high importance of IT capital “embedded” in machine devices such as computer
numerical controlled (CNC) machines employed by blue–collar workers. Thus, these figures are
rather conservative measures of the adaption of IT capital by blue–collar occupations.
Table 9: Diffusion of Computer Capital by Occupational Groups
Occupational Group 1979 1985/86 1991/92 1998/99
White–collar workers
Professional, Technical workers, Managers, Administrators 8.5 23.4 47.3 71.8
Clerical 13.4 43.7 70.7 90.9
Sales 3.7 15.1 23.5 44.5
Blue–collar workers
Operatives and Craft 1.4 4.2 12.3 24.9
Laborer 0.6 1.8 11.2 21.4
Personal service workers 3.0 6.6 15.2 31.9
The sample includes workers ages 15–65 with residence in West Germany and of German nation-
ality. Details on the construction of occupational groups can be found in the Data Appendix.
16
5 Empirical Findings on Skills, Education and Technol-
ogy in the Workplace
5.1 Technology and Skill Requirements
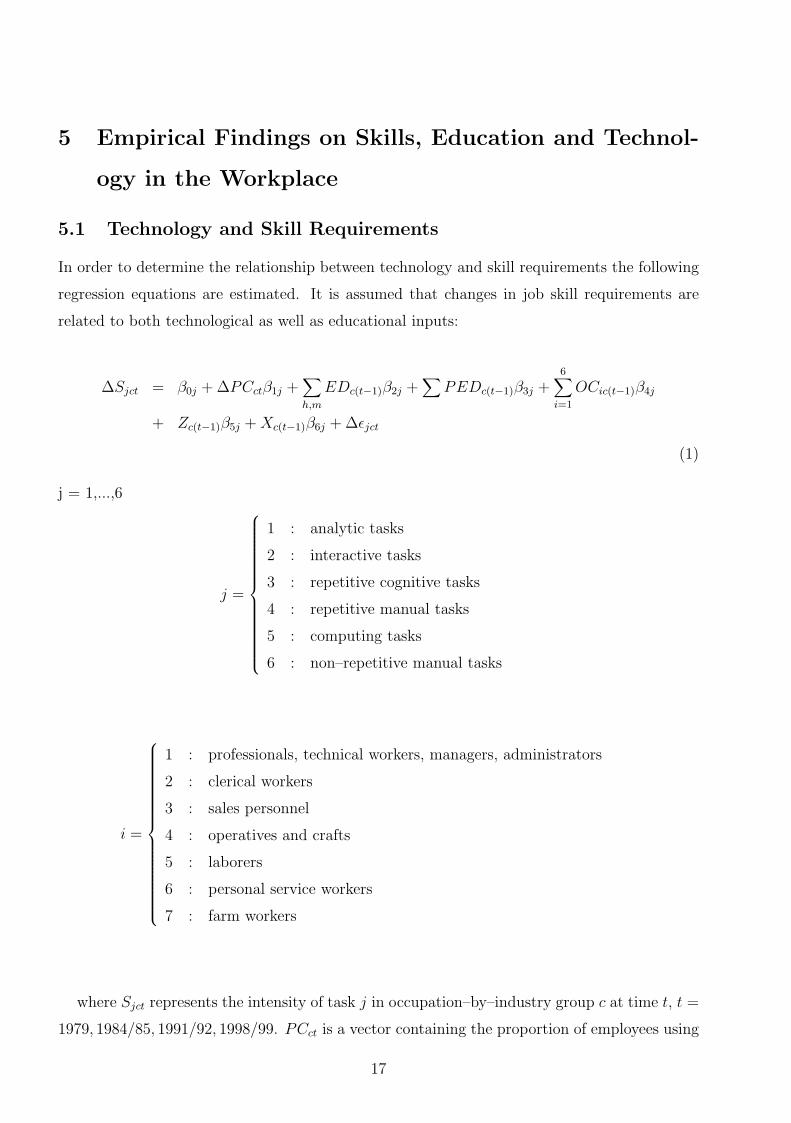
In order to determine the relationship between technology and skill requirements the following
regression equations are estimated. It is assumed that changes in job skill requirements are
related to both technological as well as educational inputs:
∆Sjct = β0j + ∆PCctβ1j +∑h,m
EDc(t−1)β2j +∑
PEDc(t−1)β3j +6∑
i=1
OCic(t−1)β4j
+ Zc(t−1)β5j + Xc(t−1)β6j + ∆εjct
(1)
j = 1,...,6
j =
1 : analytic tasks
2 : interactive tasks
3 : repetitive cognitive tasks
4 : repetitive manual tasks
5 : computing tasks
6 : non–repetitive manual tasks
i =
1 : professionals, technical workers, managers, administrators
2 : clerical workers
3 : sales personnel
4 : operatives and crafts
5 : laborers
6 : personal service workers
7 : farm workers
where Sjct represents the intensity of task j in occupation–by–industry group c at time t, t =
1979, 1984/85, 1991/92, 1998/99. PCct is a vector containing the proportion of employees using
17

a computer within occupation–by–industry group c at time t and EDct is a vector containing the
proportion of employees in the particular educational group (h = high levels of education, m =
medium levels of education). PEDct is a vector containing information on knowledge obtained
through work–based learning, that is the mean years of work experience within occupation–by–
industry groups and the mean years of tenure with the current employer within occupation–by–
industry groups. OCict represents employment shares in different occupational groups i. Zct
contains various interaction terms. Interacted variables are all defined as deviations from their
means. Further control variables such as the share of part–time employees, share of female
workers, income classes, time–, and sector dummies are included in Xct. ∆ denotes annualized
changes (in percentage points) between t and t − 1 in the respective variable. The β′s are
allowed to vary across the task equations, however, they are assumed to be constant over time.
Table C in Appendix B summarizes the definitions of variables and Table D displays summary
statistics.
The literature suggests that there is a correlation between changes in skill requirements and
the pace of technological change. Thus, in the first specification changes in task intensities
are regressed on contemporaneous changes in computer use. In addition, it is assumed that
the initial stock of educational attainment EDc(t−1) within occupation–by–industry group also
matters for changes in skill requirements by enabling occupations with higher levels of edu-
cational attainment to adopt technology faster. As skill requirements at workplaces have a
high practical component, the stock of work experience and tenure with the current employer
within occupation–by–industry group are also considered as important factors influencing the
restructuring of the occupational task composition.
The occupation–by–industry groups are defined on the 2–digit–level of occupational clas-
sification. This aggregation level contains employees in various occupational groups, such as
managers, clericals or sales personnel (defined on the 3–digit–level). The pace of changes in
skill requirements caused by technological developments may also be related to the occupational
structure of employees within occupation–by–industry groups. For example, technical change
may have different effects on occupation–by–industry groups whose employees are mainly cleri-
cal workers compared to occupation–by–industry groups whose employees are mainly operatives
and crafts.
The notion that the effect of technical change on skill requirements depends on the educa-
tional and occupational structure of occupation–by–industry groups is captured by including
various interaction terms in the regression equation (Zct).
Equations (1) are estimated simultaneously as a system of seemingly unrelated regres-
18

sions (SUR). The system estimation technique allows the consideration of cross–equation con-
straints. By construction, for each observation the task intensities Sj sum up to 100 over
all equations (∑6
j=1 Sjct = 100), which leads the ∆Sj to sum to zero. This implies that
out of the six task equations only five are linearly independent and that for each obser-
vation the disturbances across equations must always sum to zero. In addition, this also
leads the parameters estimated by equation–by–equation OLS to obey following conditions:∑6j=1 β0j =
∑6j=1 β1j =
∑6j=1 β2j =
∑6j=1 β3j =
∑6j=1 β4j =
∑6j=1 β5j =
∑6j=1 β6j = 0. One
procedure is to estimate five out of the six equations simultaneously and to obtain parameter
estimates of the “left–out” equation indirectly by using the above conditions. From an econo-
metric perspective, the parameter estimates of the above specifications are invariant to the
choice of the “left–out” equation.8 However, since the hypothesis concerning the relationship
between non–repetitive manual tasks and IT is that IT is neither a complement nor a substitute
for these tasks, it seems straightforward to drop this equation since the results for the other
equations are more interesting from an economic point of view. Weighted SUR–estimations are
performed, with the number of individuals within occupation–by–industry group as weights.
However, before presenting the results for the rich specification that controls for numerous
effects, Table 10 displays the first–order relationship between technological change and changes
in occupational skill requirements detected by a bivariate regression.
Table 10: Basic Bivariate Regression: Changes in Within–Occupational Skill Requirements
Dep. Variables: 10 x (Annualized Changes in Task Intensities)
∆ analytic ∆ interactive ∆ repetitive ∆ repetitive ∆ computing
cognitive manual
∆ computer use * 10 -0.02** 0.02 0.04*** -0.12*** 0.10***
(0.01) (0.02) (0.01) (0.02) (0.00)
Intercept 2.52*** 27.63*** -8.23*** 0.15 -0.17
(0.44) (0.89) (0.53) (0.89) (0.18)
Pseudo−R2 0.00 0.00 0.00 0.01 0.16
χ2 (3001 dof) 4.33 1.21 8.98 37.60 579.14
Number of observations: 3002
Standard errors are in parentheses; regressions are weighted by the number of individuals in
occupation–by–industry groups; ***,**,*–indicate significance on the 1, 5, 10 per cent level.
Only two of the coefficients are in line with the hypotheses. The bivariate regressions detect
8See Berndt (1991), p.473 ff. for a discussion of the choice of which equation is deleted.
19
that technological change is significantly negative related to repetitive manual tasks, and that
it is significant positively related to changes in computing tasks. However, the results for the
analytical task equation and for the repetitive cognitive task equation contradict the hypothe-
ses. These findings are interpreted as indicating that changes in workplace skill requirements
not only depend on changes in technology, but are also influenced by the educational and
occupational conditions that prevail within occupation–by–industry group.
Table 11 displays the results of specification 1. The results indicate a complementary rela-
tionship between IT and analytical, interactive and computing tasks, and a substitutive rela-
tionship between IT and repetitive manual tasks. However, it is found that rapid technological
change is significantly positive associated with changes in repetitive cognitive tasks, which
contradicts the hypothesis.
Changes in analytical task intensities: Changes in analytical skill requirements are signif-
icantly related to changes in computer use. The size of the coefficient indicates that nearly
20 per cent of the changes in task intensities may be accounted for by changes in IT usage
within occupation–by–industry groups.9 The results also show that besides of technological
changes other factors are significantly related to changes in analytical skill requirements. As
the performance of analytical tasks requires foundation skills and knowledge in natural science,
occupation–by–industry groups with both high levels of shares of employees with medium edu-
cation and high levels of shares of highly educated employees are positively related to changes
in analytical skill requirements. In addition, having a highly experienced workforce, that for
example has a lot of expertise concerning the production processes or concerning the organi-
zational structure of the firm, facilitates changes in analytical skill requirements. The results
for the interaction terms indicate that technological change has different effects depending on
the occupational structure within occupation–by–industry groups. For rapidly computerizing
blue–collar and personal service occupations the changes in analytical skill requirements was
particularly pronounced. In contrast, rapidly computerizing occupations with employees with
mainly medium levels of education witnessed smaller increases in analytical skills.
Changes in interactive task intensities: The estimation results indicate that nearly ten per
cent of changes in interactive task intensities are directly associated with changes in computer
utilization. The educational background within occupation–by–industry group as well as the
9The figures on the bottom of Table 11 show an average annual increase in analytical task intensities of 0.25
percentage points. Using the coefficient of 0.04 and the mean value of changes of computer utilization of 2.36
percentage points, this implies that around 20 per cent of changes in analytical tasks may be accounted for by
changes in IT usage.
20

level of work experience are important factors related to changes in the requirement of inter-
active skills. However, high tenure with the current employer seems to hamper changes in
interactive skills. The coefficients for the interaction terms reveal, that significant effects are
only found for clerical occupations. Rapidly computerizing clerical occupations are negatively
associated with changes in interactive task intensities. This may plead for the hypothesis that
the introduction of IT separated white–collar work into front– and back–office components.
Those working with IT are in the back–office and do not have much customer contact.
Changes in repetitive cognitive task intensities: In contradiction to the hypothesis, the results
indicate that changes in computer use are positively associated with changes in repetitive
cognitive tasks. However, it is found that educational background as well as the stock of work–
related knowledge is negatively related to changes in repetitive cognitive tasks. Moreover, in
professional occupations a substitutive relationship between IT and repetitive cognitive tasks
is found. This holds analogously for occupations with high shares of operatives and crafts as
well as for occupations with high shares of personal service workers.
21

Table 11: Changes in Within–Occupational Skill Requirements
Dep. Variables: 10 x (Annualized Changes in Task Intensities)
∆ analytic ∆ interactive ∆ repetitive ∆ repetitive ∆ computing
cognitive manual
∆ computer use * 10 0.04*** 0.10*** 0.06*** -0.18*** 0.09***
(0.01) (0.02) (0.01) (0.02) (0.00)
Vocational Education
Share highly educated 0.07*** 0.16*** -0.17*** 0.01 -0.03***
(0.03) (0.05) (0.03) (0.05) (0.01)
Share medium educated 0.07*** 0.13*** -0.08*** 0.01 -0.01
(0.02) (0.04) (0.02) (0.04) (0.01)
Work-based Learning
work experience 0.32*** 1.33*** -0.21** -0.50*** -0.04
(0.08) (0.16) (0.10) (0.17) (0.03)
tenure 0.03 -0.61*** -0.48*** 0.46** -0.07*
(0.10) (0.20) (0.12) (0.21) (0.04)
Interaction Terms
highly educ. * ∆ comp. use * (1/100) -0.06 -0.05 0.04 0.23** -0.01
(0.06) (0.11) (0.07) (0.12) (0.02)
medium educ. * ∆ comp. use * (1/100) -0.08** 0.04 -0.02 0.19** -0.02
(0.04) (0.09) (0.05) (0.09) (0.02)
professionals * ∆ comp. use * (1/100) 0.10 -0.03 -0.20** -0.00 -0.01
(0.09) (0.18) (0.10) (0.18) (0.04)
clericals * ∆ comp. use * (1/100) 0.02 -0.29* 0.04 -0.00 0.16***
(0.09) (0.18) (0.10) (0.18) (0.04)
sales * ∆ comp. use * (1/100) 0.14 -0.05 -0.09 0.06 -0.00
(0.09) (0.19) (0.11) (0.20) (0.04)
operatives/crafts * ∆ comp. use * (1/100) 0.19** 0.17 -0.20** -0.18 -0.02
(0.09) (0.17) (0.10) (0.18) (0.04)
laborers * ∆ comp. use * (1/100) 0.20* -0.28 -0.06 -0.29 0.11**
(0.12) (0.24) (0.14) (0.24) (0.05)
(personal) service * ∆ comp. use * (1/100) 0.22*** 0.13 -0.23** 0.02 -0.00
(0.09) (0.19) (0.11) (0.19) (0.04)
(unconditional) mean of depend. variable 2.52 28.22 -6.90 -3.10 2.21
Pseudo − R2 0.09 0.08 0.08 0.04 0.23
χ2 (2954 dof) 291.16 267.53 250.45 111.87 892.13
Number of observations: 2981
Control variables are: share of part–time employees, share of female employees, occupational structure of employees,
time–, and sector dummies. The share of farm workers and employees with low levels of education are the base
category. Standard errors are in parentheses; regressions are weighted by the number of individuals in occupation–
by–industry groups; ***,**,*–indicate significance on the 1, 5, 10 per cent level.
Changes in repetitive manual task intensities: The results indicate that IT substitutes for
repetitive manual tasks. Nearly 140 per cent of the changes in repetitive manual task intensities
can be accounted for by increases in computerization, or said differently, without computeri-
zation the within occupation–by–industry intensities in repetitive manual task ceteris paribus
22

would have had increased by around 40 per cent. Interestingly, computerization increases the
requirement for repetitive manual tasks in occupations with high shares of both highly educated
and medium educated employees.
Changes in computing task intensities: Nearly 100 per cent of changes in the requirement
of computing skills may be attributed to the pace of computer diffusion within occupation–
by–industry group. A high educational background as well as long tenure with the current
employer, however, seems to reduce the potential for changes in computing skill requirements.
Rapid computerization in clerical occupations as well as in occupations with mainly laborers is
positively associated with changes in computing skills.
Empirical research is usually concerned with the question whether associations found in
regression analysis are causal relationships. In this study, a strategy of temporal ordering is
used to infer to this question. Two specifications are tested: First, changes in task intensities are
regressed on lagged changes in computer use. Second, changes in task intensities are regressed
on lagged levels of computerization within occupation–by–industry groups. In addition to
pointing to causal effects, the strategy of temporal ordering may also reveal that for some of
the skill categories the adaption process to IT needs time. This may for example result from
organizational changes that have to be made or from the fact that employees have to be trained
to meet the new requirements.
Table 12 displays the estimation results. Panel A contains the results of the regression in
which lagged changes in computer usage are the main explanatory variable, Panel B contains the
results of the regression in which lagged shares of computer utilization are the main explanatory
variable. Although not reported, the regression specifications contain all the variables that were
used in the regressions depicted in Table 11, “adjusted” to the new computer variable. In order
to clarify the presentation of results, the analysis focuses on the IT variable. However, appendix
B, Table E and Table F, contain the complete regression results. As in the above regressions
weighted SUR–estimations are performed, with the number of individuals within occupation–
by–industry group c as weights.
The results displayed in panel A show that using lagged annualized changes in computer use
gives insignificant results for the coefficients concerning analytical and repetitive manual task
intensities. The coefficient for the interactive task equation only changes slightly compared to
the results in Table 11 both with respect to the size as well as with respect to the precision.
However, two coefficients change their sign. Both changes in repetitive cognitive skill require-
ments and changes in computing skill requirements are significant and negatively related to
lagged changes in computerization. In the case of repetitive cognitive tasks which was found
23
to be positively related to contemporaneous changes in computerization, the result may indi-
cate that the substitution process is associated with considerable adjustment costs resulting for
example from the necessity to reorganize the production process.
Surprisingly, it is found that occupation–by–industry groups that computerized rapidly in
the previous period are negatively related to changes in computing skills in the actual pe-
riod. However, the previous results indicated that the contemporaneous pace of technological
change accounts for around 100 per cent of the changes in the requirement for computing skills.
Assuming that the pace of IT diffusion declines over time, it seems plausible that occupation–
by–industry groups that had high pace of computerization in the previous period and thus high
increases in the requirement for computing skills, witness smaller increases in the successional
period.
As two of the computer coefficients are insignificant, lagged annualized changes in computer
utilization are suspected to be a weak signal for technological change that induces changes in
occupational skill requirements. There are six years between two successive waves which means
that the computer change variable is a six–year average of computerization. This fact may lead
the variable to pick up only a limited fraction of relevant information. Thus, regressions on
lagged shares of computer use are performed. It is assumed that this variable contains more
information concerning the technological condition prevailing within occupation–by–industry
groups. In addition, this also serves as a test of robustness.
Panel B displays the estimation results. Except for the repetitive manual equation, all of
the coefficients are significant at the one percent level. The signs of the coefficients support
the hypotheses of a substitutive relationship between IT and repetitive cognitive tasks and a
complementary relationship between IT and analytical as well as interactive tasks.
24

Table 12: Changes in Within–Occupational Skill Requirements
Dep. Variables: 10 x (Annualized Changes in Task Intensities)
∆ analytic ∆ interactive ∆ repetitive ∆ repetitive ∆ computing
cognitive manual
A
Lagged ∆ computer use * 10 0.01 0.12*** -0.09*** 0.02 -0.04***
(0.02) (0.04) (0.02) (0.03) (0.01)
Pseudo−R2 0.23 0.11 0.30 0.14 0.04
χ2 (1682 dof) 223.91 208.74 716.92 275.03 77.92
Number of observations: 1707
B
Lagged share of computer usage 0.12*** 0.19*** -0.46*** 0.03 -0.12***
(0.02) (0.04) (0.02) (0.05) (0.01)
Pseudo−R2 0.10 0.11 0.25 0.04 0.15
χ2 (2956 dof) 340.90 372.15 991.32 119.13 512.17
Number of observations: 2981
In Panel A all interaction terms are interacted with lagged ∆ computer use, in panel B they are
interacted with the lagged share of computer users within occupation–by–industry groups. Control
variables are: share of part–time employees, share of female employees, share of employees within
occupational groups, time–, and sector dummies. The share of farm workers and employees with
low levels of education are the base category. Standard errors are in parentheses; regressions
are weighted by the number of individuals in occupation–by–industry groups; ***,**,*–indicate
significance on the 1, 5, 10 per cent level.
5.2 Skill Requirements and Educational Upgrading
The aim of this paper is to contribute to the discussion on SBTC by analyzing the following
chain of economic arguments: It is argued that the steady price decline of IT capital is the
causal force underlying the rapid diffusion of IT capital at workplaces. This computerization
of occupations changes the skill requirements at workplaces which forces the firms to adjust
the qualification structure of their employees. As computer prices do not vary individually,
they do not provide any useful information for the analysis at hand. However, the analyses
reported in section 5.1 already investigated the relationship between IT and changing skill
requirements at workplaces. In this section, the analysis integrates the question, how changes
in occupational skill requirements are associated with changes in the demand for employees with
different educational attainment in the above analysis. The empirical approach is to estimate
25

two structural specifications simultaneously:
∆EDh,mct = α0j +
5∑j=1
∆Sjctα1j + Xc(t−1)α2j + υjct (1)
∆Sjct = f(PC, ED, PED, Z, X) (2)
h = share of employees with high educational attainment.
m = share of employees with medium educational attainment.
For the definition of the other variables and parameters see equation 1.
j = 1,...,6.
j =
1 : analytic tasks
2 : interactive tasks
3 : repetitive cognitive tasks
4 : repetitive manual tasks
5 : computing tasks
6 : non–repetitive manual tasks
The first equation explains changes in educational attainment (ED) within occupation–
by–industry group c by changes in occupational skill requirements (∆Sjct). Further control
variables such as the occupational structure of employees, the share of female employees, share
of part–time employees, 8 income classes, sector and time dummies are also considered. The
second equation explains changes in skill requirements within occupation–by–industry groups
based on the results reported in section 5.1. The equations are estimated using three–stage–
least square (3SLS) estimation techniques, thus the ∆Sjct in equation (1) are instrumented by
equations (2).
Under the light of the results of section 5.1, two specifications are used to generate the
instruments in equation (2). First, the specification with contemporaneous changes in comput-
erization within occupation–by–industry groups, second, the specification with lagged shares of
computer use. Table 13 displays the estimation results of the relationship between changes in
task intensities and changes in the demand for employees with different educational attainment.
26
In panel A, the instruments for the changes in occupational skill requirements are generated
using the specification with contemporaneous changes in computerization within occupation–
by–industry groups whereas in panel B, the specification with lagged levels of shares of computer
utilization is used.
The results indicate that occupation–by–industry groups with rapid increases in interactive
and computing skill requirements witness rapid increases in the share of employees with high
educational attainment. In contrast, increases in repetitive cognitive tasks as well as repetitive
manual tasks are negatively related to changes in the share of employees with high education.
Thus, as IT capital substitutes for repetitive cognitive and manual tasks, this results in an
increasing deployment of employees with high levels of education. With respect to analytical
tasks, only the coefficient in panel B is significant.
Concerning the development of the employment share of employees with medium levels of
education, there are two unambiguous results. First, a negative relationship between changes
in analytical skill requirements and changes in the share of employees with medium levels of
education. Second, occupation–by–industry groups that witnessed a reduction in the intensities
of repetitive manual tasks are associated with increases in the employment shares of employees
with medium levels of education. However, the remaining coefficients do not allow any clear
interpretation since they are only weakly significant or insignificant. In addition, they switch
their sign depending on the specification of the instruments.
27
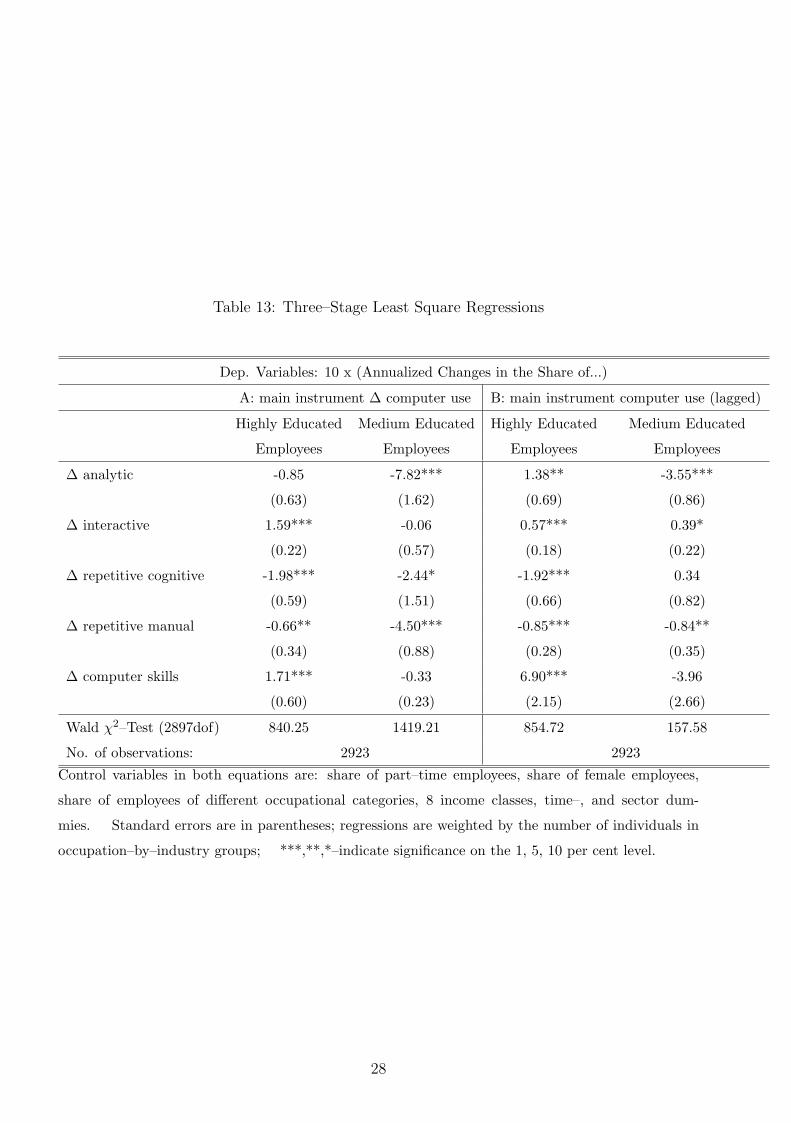
Table 13: Three–Stage Least Square Regressions
Dep. Variables: 10 x (Annualized Changes in the Share of...)
A: main instrument ∆ computer use B: main instrument computer use (lagged)
Highly Educated Medium Educated Highly Educated Medium Educated
Employees Employees Employees Employees
∆ analytic -0.85 -7.82*** 1.38** -3.55***
(0.63) (1.62) (0.69) (0.86)
∆ interactive 1.59*** -0.06 0.57*** 0.39*
(0.22) (0.57) (0.18) (0.22)
∆ repetitive cognitive -1.98*** -2.44* -1.92*** 0.34
(0.59) (1.51) (0.66) (0.82)
∆ repetitive manual -0.66** -4.50*** -0.85*** -0.84**
(0.34) (0.88) (0.28) (0.35)
∆ computer skills 1.71*** -0.33 6.90*** -3.96
(0.60) (0.23) (2.15) (2.66)
Wald χ2–Test (2897dof) 840.25 1419.21 854.72 157.58
No. of observations: 2923 2923
Control variables in both equations are: share of part–time employees, share of female employees,
share of employees of different occupational categories, 8 income classes, time–, and sector dum-
mies. Standard errors are in parentheses; regressions are weighted by the number of individuals in
occupation–by–industry groups; ***,**,*–indicate significance on the 1, 5, 10 per cent level.
28

6 Conclusion
The effect of technological change on the labor market has always been a major concern of
economic research. The interest intensified in the last two decades with the diffusion process
of personal computers at workplaces, and with the observation that workers with high levels of
education are more likely to use computer technology. This observation suggests that computer
technology is complementary with human capital, resulting in the skill–biased technological
change hypothesis (e.g. Acemoglu (2002), Chennells and van Reenen (1999), Krueger (1993),
Autor et al. (1998)).
The analyses in this study contributes to the widespread discussion on skill–biased techno-
logical change by using direct, multidimensional measures of occupational skill requirements.
It is argued that because of limited substitution (Bresnahan (1999)) between IT capital and
tasks that are required at workplaces, IT capital shifts the employment structure of employees
towards employees with higher levels of formal education.
The empirical findings support the hypotheses that IT capital substitutes for repetitive ac-
tivities, both cognitive and manual, and that IT capital complements analytical, interactive,
and computing skills. The analysis also demonstrates that changes in analytical and interactive
skills are positively related to changes in the share of employees with high levels of educational
attainment. In contrast, changes in the requirement for repetitive manual and repetitive cog-
nitive skills are negatively related to changes in the share of employees with high levels of
educational attainment.
These findings support the argument that IT capital increases the demand for higher ed-
ucated labor through shifting the task composition of occupations towards analytical and in-
teractive activities for which higher educated employees have comparative advantages. The
results are in line with the findings of Autor et al. (2001) who investigate how IT capital
changes the task composition on various aggregation levels. However, the analysis in this study
puts stronger emphasis on task changes within occupations. In particular, it is shown that the
impact of technological change on changes in skill requirements depends on the educational
structure within occupational groups.
29

References
Acemoglu, D. (1998). Why Do New Technologies Complement Skills? Directed Technical
Change and Wage Inequality, The Quarterly Journal of Economics pp. 1055–1089.
Acemoglu, D. (2002). Technical Change, Inequality, and the Labor Market, Journal of Eco-
nomic Literature 40: 7–72.
Altmann, N., Deiß, M., Dohl, V. and Sauer, D. (1986a). Ein ”Neuer Rationalisierungstyp” -
neue Anforderung an die Industriesoziologie, Soziale Welt 37: 191–207.
Altmann, N., Deiß, M., Dohl, V. and Sauer, D. (1986b). Ein“Neuer Rationalisierungstyp”–neue
Anforderungen an die Industriesoziologie, Soziale Welt 37: 191–207.
Autor, D., Katz, L. and Krueger, A. (1998). Computing Inequality: Have Computers Changed
the Labor Market?, The Quarterly Journal of Economics pp. 1169–1213.
Autor, D., Levy, F. and Murnane, R. (2001). The Skill Demand of Recent Technological
Change: An Empirical Exploration, Working Paper 8337, NBER.
Baethge, M. and Baethge–Kinsky, V. (1995). Okonomie, Technik, Organisation: Zur En-
twicklung von Qualifikationsstruktur und qualitativem Arbeitsvermogen, in Arnold and
Lipsmeier (eds), Handbuch der Berufsbildung, Opladen, pp. 142–156.
Barras, R. (1990). Interactive innovation in financial and business services: The vanguard of
the service revolution, Research Policy 19: 215–237.
Becker, G. (1964). Human Capital, National Bureau of Economic Research, New York.
Berman, E., Bound, J. and Griliches, Z. (1994). Changes In The Demand For Skilled Labor
Within U.S. Manufacturing: Evidence From The Annual Survey Of Manufactures, The
Quarterly Journal of Economics 109: 367–397.
Berndt, E. (1991). The Classics of Econometrics, Addison Wesley Publishing Company, Read-
ing, Massachusetts.
Berndt, E. R., Morrison, C. J. and Rosenblum, L. S. (1992). High-Tech Capital Formation and
Labor Composition in U.S. Manufacturing Industries: An Exploratory Analysis, Working
Paper 4010, NBER Working paper series.
30
Borghans, L. and de Grip, A. (2000). The Overeducated Worker? The Economics of Skill
Utilization, Edward Elgar Publishing Limited, Cheltenham and Northampton.
Bresnahan, T. (1999). Computerisation and Wage Dispersion: An Analytical Reinterpretation,
The Economic Journal 109: F390–F415.
Bund-Lander-Kommission (2001). Zukunft von Bildung und Arbeit: Perspektiven von Arbeit-
skraftebedarf und -Angebot bis 2015, Bund–Lander–Kommission, Bonn.
Chennells, L. and van Reenen, J. (1999). Has Technology Hurt Less Skilled Workers?, Working
paper, IFS.
Committee on Techniques for the Enhancement of Human Performance (1999). The Changing
Nature of Work, National Academy Press, Washington, D.C.
Falk, M. (2001). Diffusion of Information Technology, Internet Use and the Demand for Het-
erogenous Labor, Discussion Paper No. 01-48 01-48, ZEW.
Falk, M. and Koebel, B. (2001). A Dynamic Heterogeneous Labor Demand Model for German
Manufacturing, Applied Economics 33(3): 330–348.
Fitzenberger, B. (1999). Wages and Employment Across Skill Groups, Vol. 6 of ZEW economic
studies, Physica–Verlag, Heidelberg and New York.
Green, F., Ashton, D. and Felstead, A. (2001). Estimating the determinants of supply of com-
puting, problem-solving, communication, social, and teamworking skills, Oxford Economic
Papers 3: 406–433.
Hirschhorn, L. (1984). Beyond Mechanization: Work and Technology in a Postindustrial Age,
MIT Press, Cambridge, Massachusetts.
Howell, D. and Wolff, E. (1991). Trends in the Growth and Distribution of Skills in the U.S.
Workplace, 1960-1965, Industrial and Labor Relations Review 44: 486–502.
Kaiser, U. (2000). New Technologies and the Demand for Heterogeneoous Labor: Firm–Level
Evidence for the German Business–Related Service Sector, Economics of Innovation and
New Technology 9(5): 465–484.
Krueger, A. (1993). How computer have changed the wage structure: Evidence from microdata,
1984-1989, Quarterly Journal of Economics 108: 33–60.
31

Lex Borghans, F. G. and Mayhew, K. (2001). Skills measurement and economic analysis: an
introduction, Oxford Economic Papers 53(3): 375–384.
Osterman, P. (2000). Work Reorganization in an Era of Restructuring: Trends in Diffusion and
Effects on Employee Welfare, Industrial and Labour Relations Review 53: 179–196.
Rumberger, R. (1981). The Changing Skill Requirements of Jobs in the U.S. Economy, Indus-
trial and Labor Relations Review 34(4): 578–590.
Spenner, K. (1983). Deciphering Prometheus: Temporal Change in the Skill Level of Work,
American Sociological Review 48(6): 824–837.
Spenner, K. (1990). Skill: Meaning, Methods, and Measures, Work and Occupations 17(4): 399–
421.
Stasz, C. (1997). Do Employers Need the Skills They Want? Evidence from Technical Work,
Journal of Education and Work 10(3): 205–223.
Stasz, C. (2001). Assessing skills for work: two perspectives, Oxford Economic Papers 3: 385–
405.
Wolff, E. (2000). Technology and the Demand for Skills, in L. Borghans and A. de Grip (eds),
The Overeducated Worker? The Economics of Skill Utilization, Edward Elgar Publishing
Limited, Cheltenham, UK, pp. 27–55.
32
A The BIBB/IAB–Data Set and Definitions of Variables
The analysis is based on the so–called BIBB/IAB–data set which is a survey among employ-
ees. This data set contains four cross–sections of the Qualification and Career Survey car-
ried out by the German Federal Institute for Vocational Training (“Bundesinstitut fur Berufs-
bildung (BIBB)”) and the Research Institute of the Federal Employment Service (“Institut
fur Arbeitsmarkt- und Berufsforschung (IAB)”). The cross–sections were launched in 1979,
1985/86, 1991/92 and in 1998/99. The survey is designed to give detailed information on the
qualifications and occupational career trends of German employees. It is unique in the fact
that it contains detailed descriptions of the tasks performed on the job. Moreover, it contains
information on computer use. Each survey covers around 30,000 observations. The sample of
interviewed persons was drawn in a random route process.10
The target population is not uniform within the four waves. Due to this changing sample
design the sample used in this study has to be restricted to West–German residents with German
nationality, that is East–German residents and non–German employees are excluded from the
sample since these groups of employees were not interviewed in every wave.11 Moreover, the
sample does not contain self–employed and unemployed persons.
This reduces the selected sample for the estimation purposes of this study to 28,784 obser-
vations in 1979, 26,361 observations in 1985/86, 23,210 observations in 1991/92, and 26,246
observations in 1998/99. It contains German employees with residence in West–Germany. They
are between 15 and 65 years old. The firms employing these individuals cover a wide range
of industries, both services and manufacturing. Table A in appendix B displays the industries
that are contained in the sample.
Since the main interest of this study is the relationship between technology, job content, and
educational attainment, this data set on the individual level is aggregated to observation on
the occupational level. The individuals are classified according to the occupation they actually
work in. In order to aggregate individuals with as homogeneous tasks as possible, occupations
are furthermore distinct by their industry affiliation.
10The data sets as well as code books are publicly available through the Central Archive for Empirical Social
Research at the University of Cologne. The code books document the sample design and expansion factors in
detail.11The exclusion of East-German employees is due to the existence of the German Democratic Republic up to
1989. The exclusion of employees with foreign nationalities is less clear. But since the questionnaire is only in
German the results for Non–German employees is likely to be positively biased because knowing German is the
main prerequisite for answering it.
33

The resulting data set then contains observations based on the occupation–by–industry
means.
A.1 Skills Required by Occupations
As already set out in the main text, the demand side of skills is determined by the tasks
occupations require. In order to make the analysis feasible, the variety of activities that is
asked for in the survey questionnaire are pooled to 6 task categories: analytic, interactive,
repetitive cognitive, non–repetitive manual, repetitive manual, and computing tasks. Table B
in appendix B contains examples of tasks that are asked for in the survey questionnaire, and
shows how they are pooled to the 6 task categories.
On the level of employees, each task category represents the fraction of tasks an employee
has to perform within the particular category.
Taskj =#Taskj∑6
j=1 #Taskj
∗ 100 (3)
where
j =
1 : analytic tasks
2 : interactive tasks
3 : repetitive cognitive tasks
4 : repetitive manual tasks
5 : non–repetitive manual tasks
6 : computing tasks
For the purpose of this analysis, the task intensities at the individual level are aggregated
to the occupation–by–industry level by taking group means.
A.2 Formal Educational Attainment
The data set contains detailed information on the vocational attainment of employees. The
employees are classified into three qualification groups according to their vocational education
(school degrees are not considered):
• People with lower levels of education, that is people with no occupational training.
34

• People with medium level of education, that is people with an vocational qualification
who might have either completed an apprenticeship or have graduated from a vocational
college.
• People with high level of education, that is, people holding a degree from a university or
from a technical college.
These variables are dummy variables, taking on the value 1 if the employee falls within the
particular group of educational level.
The information on the individual level is aggregated to the occupation–by–industry level by
taking group means indicating the share of employees falling within the particular educational
level.
A.3 Measurement of Technology
The data set contains information on the tools and machines the employees work with, which
allows the researcher to get a detailed picture on the working realities and conditions at the
respective point in time.
The focus in this study is on computers, terminals, and electronic data processing (edp)
machines. “Computer use” is a dummy variable indicating whether the employee uses one of
the above devices or not.
As with the previous variables, the information on the individual level is aggregated to the
occupation–by–industry level by taking group means, thus indicating the share of computer
user within the group.
A.4 Broad Occupational Classifications
The classification of occupations to professionals, technical workers, managers, administrators,
clerical workers, sales, operatives, crafts, laborers and personal service workers are based on the
classification of occupational titles on the 3–digit–level according to the Federal Employment
Bureau, in the version of 1988.
Table C in Table Appendix gives an overview of the construction of the main variables on
the individual level and Table D displays summary statistics.
35

B Table Appendix
Table A: Industry Classification
Agriculture
Manufacturing incl. construction and mining
10 Mining
11 Chemical Industry, Rubber and Synthetic Material
12 Stone and Clay, Glas and Ceramics
13 Iron and Steel Production
14 Steel and Light Metal, Tracked Vehicles
15 Machine Construction
16 Car Industry
17 Shipbuilding, Aircraft and Aerospace Industry
18 Office and Data–Processing Machines
19 Electrical Engineering
20 Precision and Optical Instruments
21 Musical Instruments, Toys, and Jewellery
22 Construction
23 Wood Processing
24 Cellulose and Paper Industry
25 Printing
26 Leather and Shoe Industry
27 Textile Industry
28 Food, Beverages and Tobacco
Services
29 Laundry and Dry Cleaning
30 Hairdresser
40 Trade
52 Transport Services (including Carriage,
Travel Agency, Warehouse)
53 Credit Institutions
54 Insurance Companies
55 Catering and Hotels
57 Health and Veterinary
61 Radio, TV, Publishing House, Art, Theater, Museum
62 Other Private Services
Public and Quasi–Public Institutions
50 Postal Services
51 Railway Services
36

Table B: Assignment of Activities
Classification Tasks
non–repetitive analytic research, evaluation, and planning,
making plans, constructions, designing, sketching
working out laws/prescriptions
using and interpreting laws
non–repetitive interactive negotiating, lobbying coordinating,
organizing, caring, and supplying
to sell, to buy, to advise customers, advertise
repetitive cognitive calculate, bookkeeping
testing and controlling of goods and information
correcting of texts/data
calibration, weighting
measuring of length/weight/temperatur
chemical-physical analysis
medical-biological analysis
repetitive manual run a machine, machine set up
mining minerals, extracting, recovering and collecting
preparing, sorting, crushing of raw materials and plants
centrifuge, cracking melting, founding
non–repetitive manual repair houses, apartments, grow plants
construction of buildings
installing and connecting up cables
painting, sewing, cutting out
restoring of buildings/art/monuments
repairing of machines/vehicles
repairing of textiles, leather goods,
synthetic materials, or household goods
computing tasks programming, computer engineering,
using applications software
37

Table C: Definition of Variables on the Individual Level
Variable Definition
Taskj#Taskj∑5
j=1#Taskj
∗ 100, where
j = 1 : analytic
= 2 : interactive
= 3 : repetitive cognitive
= 4 : repetitive manual
= 5 : non–repetitive manual
= 6 : computing
computer use 1: use of computer technology on the job, 0: otherwise
high education 1: university or technical college degree, 0: otherwise
medium education 1: apprenticeship or degree from vocational school, 0: otherwise
low education 1: no further occupational training, 0: otherwise
work experience survey year-first year of employment
tenure survey year-first year with current employer
38

Table D: Summary Statistics
Variable Mean Std. Dev. Minimum Maximum
annualized (percentage point) changes in...
analytic task intensities 0.25 2.50 -16.67 16.67
interactive task intensities 2.82 4.59 -16.67 16.67
repetitive cognitive task intensities -0.69 2.58 -16.67 16.67
repetitive manual task intensities -0.31 4.54 -16.67 16.67
non–repetitive manual task intensities -2.13 5.07 -16.67 16.67
computing task intensities 0.22 1.09 -8.33 8.33
computer use 2.36 4.75 -16.67 16.67
share of ...
computer users 20.20 30.57 0.00 100.00
employees with high education 10.31 24.68 0.00 100.00
employees with medium education 67.38 32.65 0.00 100.00
female employees 28.41 34.86 0.00 100.00
part–time employees 11.11 21.52 0.00 100.00
farm workers, farm managers 1.67 12.75 0.00 100.00
personal service workers 9.03 28.60 0.00 100.00
laborers 3.95 18.92 0.00 100.00
operatives/crafts 44.68 49.51 0.00 100.00
sales personnel 3.49 18.35 0.00 100.00
clerical workers 11.64 32.08 0.00 100.00
administrators, managers etc. 25.52 43.53 0.00 100.00
average years of...
work experience 20.40 7.66 1.00 49.00
tenure 11.21 6.34 0.00 44.00
39

Table E: Changes in Within–Occupational Skill Requirements, Lagged ∆ Computer Use
Dep. Variables: 10 x (Annualized Changes in Task Intensities)
∆ analytic ∆ interactive ∆ repetitive ∆ repetitive ∆ computing
cognitive manual
Lagged ∆ computer use * 10 0.01 0.12*** -0.09*** 0.02 -0.04***
(0.01) (0.04) (0.01) (0.02) (0.01)
Vocational Education (lagged)
Share highly educated 0.12 -2.41*** -0.15 1.62*** -0.08
(0.33) (0.80) (0.36) (0.54) (0.01)
Share medium educated 0.57*** -0.87 -0.61*** 1.53*** -0.00
(0.23) (0.55) (0.25) (0.37) (0.11)
Work-based Learning (lagged)
work experience 0.27*** 0.81*** -0.44** -0.40*** -0.14***
(0.11) (0.26) (0.12) (0.17) (0.05)
tenure -0.41*** -1.58*** 0.51*** 0.52*** 0.19***
(0.14) (0.34) (0.15) (0.22) (0.07)
Interaction Terms (lagged)
highly educ. * ∆ comp. use * (1/100) 0.02 0.00 0.03 -0.22** 0.01
(0.07) (0.17) (0.08) (0.11) (0.04)
medium educ. * ∆ comp. use * (1/100) -0.04 0.02 0.06 -0.24*** 0.05*
(0.06) (0.14) (0.06) (0.09) (0.03)
professionals * ∆ comp. use * (1/100) -0.38*** 0.15 0.18 -0.03 0.08
(0.11) (0.26) (0.12) (0.18) (0.05)
clericals * ∆ comp. use * (1/100) -0.41*** 0.16 0.24** -0.03 0.10*
(0.11) (0.27) (0.12) (0.18) (0.05)
sales * ∆ comp. use * (1/100) -0.39*** 0.11 0.18 -0.00 0.09
(0.12) (0.28) (0.13) (0.19) (0.06)
operatives/crafts * ∆ comp. use * (1/100) -0.25** 0.11 0.15 -0.09 0.08
(0.11) (0.26) (0.12) (0.18) (0.05)
laborers * ∆ comp. use * (1/100) -0.32* 0.99 0.11 0.00 -0.07
(0.18) (0.43) (0.19) (0.29) (0.09)
(personal) service * ∆ comp. use * (1/100) -0.35*** 0.11 0.08 -0.03 -0.05
(0.12) (0.29) (0.13) (0.19) (0.06)
Pseudo − R2 0.23 0.11 0.30 0.14 0.04
χ2 223.91 208.74 716.92 275.03 77.92
Number of observations: 1707
Control variables are: share of part–time employees, share of female employees, occupational structure of employees,
time–, and sector dummies. The share of farm workers and employees with low levels of education are the base
category. Standard errors are in parentheses; regressions are weighted by the number of individuals in occupation–
by–industry groups; ***,**,*–indicate significance on the 1, 5, 10 per cent level.
40

Table F: Changes in Within–Occupational Skill Requirements, Computer Use (lagged)
Dep. Variables: 10 x (Annualized Changes in Task Intensities)
∆ analytic ∆ interactive ∆ repetitive ∆ repetitive ∆ computing
cognitive manual
Lagged share of computer use 0.12*** 0.19*** -0.46*** 0.03 -0.12***
(0.02) (0.04) (0.02) (0.04) (0.01)
Vocational Education (lagged)
Share highly educated 0.04 -2.41*** -0.04 0.03 0.01
(0.03) (0.80) (0.06) (0.06) (0.01)
Share medium educated 0.06*** -0.87 0.01 -0.05 0.02**
(0.02) (0.55) (0.02) (0.04) (0.01)
Work-based Learning (lagged)
work experience 0.26*** 1.12*** -0.14* -0.38*** -0.04
(0.08) (0.16) (0.09) (0.17) (0.04)
tenure 0.04 -0.42** -0.41*** 0.42** -0.04
(0.10) (0.20) (0.11) (0.21) (0.04)
Interaction Terms (lagged)
highly educ. * ∆ comp. use * (1/100) 0.03 0.54*** 0.54*** -0.36* 0.10***
(0.09) (0.18) (0.10) (0.19) (0.01)
medium educ. * ∆ comp. use * (1/100) 0.02 0.21 0.31*** -0.40*** 0.10***
(0.08) (0.15) (0.08) (0.16) (0.03)
professionals * ∆ comp. use * (1/100) -0.37*** 0.17 0.18 0.33 0.08
(0.14) (0.29) (0.15) (0.30) (0.06)
clericals * ∆ comp. use * (1/100) -0.13 0.39 -0.32** 0.54* -0.08
(0.14) (0.29) (0.16) (0.30) (0.06)
sales * ∆ comp. use * (1/100) -0.38*** 0.54* 0.05 0.37 0.07
(0.16) (0.32) (0.17) (0.33) (0.07)
operatives/crafts * ∆ comp. use * (1/100) -0.27** -0.06 -0.01 0.72*** 0.05
(0.14) (0.29) (0.15) (0.30) (0.06)
laborers * ∆ comp. use * (1/100) -0.25 0.19 -0.06 2.32*** 0.16
(0.23) (0.46) (0.25) (0.47) (0.10)
(personal) service * ∆ comp. use * (1/100) -0.37*** -0.34 0.22 -0.04 0.08
(0.15) (0.31) (0.17) (0.32) (0.07)
Pseudo − R2 0.10 0.11 0.25 0.04 0.15
χ2 340.90 372.15 991.32 119.13 512.17
Number of observations: 2981
Control variables are: share of part–time employees, share of female employees, occupational structure of employees,
time–, and sector dummies. The share of farm workers and employees with low levels of education are the base
category. Standard errors are in parentheses; regressions are weighted by the number of individuals in occupation–
by–industry groups; ***,**,*–indicate significance on the 1, 5, 10 per cent level.
41