alfred gatt - biomechanical assessment of ankle joint ...eprints.staffs.ac.uk/1991/1/gatt -...
TRANSCRIPT

Biomechanical Assessment of Passive
Ankle Joint Complex Dorsiflexion
Alfred Gatt
A thesis submitted in partial fulfilment of the requirement of Staffordshire University for the
degree of Doctor of Philosophy
March 2012

ii
Abstract
The measurement of ankle joint dorsiflexion is an important component of the clinical
examination of the foot and is also an outcome measure often employed in research.
Diagnosis of ankle equinus or limited ankle dorsiflexion is based solely on this measurement.
Although a great majority of research papers in this field utilise normal clinical goniometers
for obtaining the maximum ankle dorsiflexion angle (MADA) and important clinical
decisions are based on these findings, there is overwhelming evidence that this method is
highly unreliable. Thus this thesis aimed to investigate alternative methods of measuring
ankle dorsiflexion and various issues that affect the MADA in order to obtain a clear picture
of foot segment movement from which an Ankle Goniometer could be consequently designed
and validated.
Ten different techniques were identified that included various apparatuses designed
specifically for measuring ankle dorsiflexion. However, during validation, their
methodological quality would have benefitted from the use of an actual patient population
and comparison with a reference standard, which caused papers to score poorly on
methodological quality assessment. It was concluded that issues affecting this measurement
and that needed to be researched further include: foot posture, the amount of moment applied
and the stretching characteristics of the calf muscle tendon unit.
Experiments within this study indicated that in adults, the mean maximum pronated angles
were always higher than in other postures, with 8.27o difference between the pronated and
supinated postures (p=0.032) and 5.78o between pronated and neutral (p=0.000). However,
the reported difference between neutral and supinated (mean angle of 2.49o) is of little
clinical significance. It was observed that the forefoot always travels through a greater angle
than the hindfoot in all 3 foot postures, while the hindfoot to forefoot angle increases during
the application of a moment, indicating that the ‘midtarsal joint locking mechanism’ cannot
be applied to passive dorsiflexion of the foot. In adolescents, there are no significant
differences in the mean MADA between the 3 postures, implying that this measurement
technique may be performed in any of these postures. It was also concluded that there is no
need to control moment applied during this measurement procedure to produce consistent
results between raters and that the calf muscle tendon unit does not stretch significantly
following brief repetitive passive stretching.
iii
An ankle goniometer that measured purely hindfoot movement by eliminating forefoot
influence and that increased reliability by holding the foot in the chosen posture, was
consequently designed. This was validated by synchronizing with an electrogoniometer and
an optoelectronic motion capture system. Reliability testing, with the foot held in a supinated
posture as opposed to the traditional Rootian method of placing the foot at subtalar joint
neutral position, spanned a number of different trials, including intra-tester and inter-tester
reliability studies utilising both controlled and uncontrolled conditions, in convenience
samples of healthy participants and a random sample of patients. Reliability testing between 4
raters with little experience on the utilization of this device was finally conducted. It has been
shown that the Ankle Goniometer is a valid and reliable device for measuring ankle joint
complex dorsiflexion both in healthy adults and in a patient population.

iv
Acknowledgements
I would like to thank Professor Nachiappan Chockalingam for being the best supervisor any
student could ever wish for. His expert guidance was instrumental in seeing me through this
process. He has certainly turned this hard journey into a pleasant experience and his
continuous support never waned or lacked, even on Sundays. He has instilled in me a
voracious appetite for scientific investigation which caused me to change from a clinical to an
academic career during this PhD process. For this, I am forever grateful.
I would like to thank staff at the Faculty of Health, Staffordshire University, for always
putting aside their important work whenever I visited in order to help me with my research.
Thierry Larose Chevalier, for his brilliant expertise with the Vicon system, Roozbeh Naemi
for his continuous, timely advice, Aoife Healy for helping out with statistics and Robert
Needham for sharing his work with synchronizing the electrogoniometer with the Vicon, and
with the C3D kinematic model of the hindfoot.
Thanks also for Owen Falzon and Prof Kenneth Camilleri, from the Department of Systems
and Control Engineering at the University of Malta, for allowing and helping me use their
Gait Lab.
Thanks to my colleagues at work at the Podiatry Department, Faculty of Health Sciences,
University of Malta, for their constant support and timely advice when necessary.
My biggest thanks go to my family; my wife Nathalie and the girls, who had to bear with me
during the duration of this work, for their undying support and spending endless Sundays
inside while I sweated out on some incomprehensible statistical theory.

v
Contents
Abstract ..................................................................................................................................... ii
Acknowledgements ................................................................................................................... iv
Glossary....................................................................................................................................xv
Publications arising from this Dissertation ........... .................................................................xvii
Chapter 1 Introduction ............................................................................................................... 1
1.0 Introduction ................................................................................................................. 2
1.1 Background to the Thesis ............................................................................................ 2
1.1.1 Limited Ankle Dorsiflexion ................................................................................. 3
1.1.2 Effects of Ankle Equinus ..................................................................................... 3
1.1.3 Examination ......................................................................................................... 5
1.2 Rationale for the Study ................................................................................................ 6
1.3 Scope of the investigation ........................................................................................... 8
1.4 Need for the study ....................................................................................................... 9
1.5 Aims and Objectives ................................................................................................... 9
1.6 Ethical approval ......................................................................................................... 10
1.7 Structure of this Thesis .............................................................................................. 10
Chapter 2 Literature Review .................................................................................................... 14
2.0 Literature Review ...................................................................................................... 15
2.1 The Ankle Joint ......................................................................................................... 15
2.1.1 Muscular Control at the Ankle Joint .................................................................. 20
2.1.2 The ankle during Gait ........................................................................................ 23
2.2 Ankle vs Foot Dorsiflexion ....................................................................................... 25
2.2.1 Conclusions ...........................................................................................................30
2.3 Ankle Equinus ........................................................................................................... 31
2.3.1 Ankle dorsiflexion necessary for normal walking ............................................. 31
2.3.2 Ankle Equinus .................................................................................................... 33
2.3.3 Causes of Equinus .............................................................................................. 34
2.3.4 Diagnosis of Ankle Equinus .............................................................................. 35
2.3.5 Incidence of equinus .......................................................................................... 36
2.3.6 Effects of Equinus .............................................................................................. 36
2.3.7 Treatment of Equinus ......................................................................................... 38
2.3.8 Conclusions ........................................................................................................ 39
2.4 Clinical Examination for ankle dorsiflexion ............................................................. 40
2.4.1 Goniometric Procedure of Ankle Dorsiflexion Measurement: .......................... 40

vi
2.4.2 Un/Reliability of Goniometric Measurements ................................................... 41
2.4.3 Conclusions ........................................................................................................ 44
2.5 Kinematic Analysis ................................................................................................... 45
2.5.1 Kinematic analysis of the Ankle Joint complex ................................................ 48
Chapter 3 A Systematic Review of Ankle Joint Dorsiflexion Measurement Techniques in the Non-neurological patient ......................................................................................................... 50
3.0 Introduction ......................................................................................................................51
3.1 Systematic Reviews................................................................................................... 52
3.2 Quality Assessment ................................................................................................... 54
3.3 A Systematic Review of Ankle Dorsiflexion Measurement ..................................... 56
3.3.1 Aims and Objectives .......................................................................................... 56
3.3.2 Methodology: ..................................................................................................... 57
3.3.3 Data Extraction .................................................................................................. 58
3.3.4 Quality Assessment ............................................................................................ 59
3.3.5 Results ................................................................................................................ 60
3.3.6 Data Extraction .................................................................................................. 62
3.3.7 Data extraction form .......................................................................................... 65
3.3.8 Methodological Quality Assessment ................................................................. 68
3.3.9 Discussion .......................................................................................................... 73
3.3.10 Conclusions ....................................................................................................... 76
3.3.11 Recommendations .............................................................................................. 77
Chapter 4 Ankle Joint Dorsiflexion Measurement Techniques .............................................. 78
4.0 Introduction ............................................................................................................... 79
4.1 Traditional methods of measuring ankle joint complex dorsiflexion ........................... 79
4.2 Devices specifically designed to measure Ankle Dorsiflexion ..................................... 82
Chapter 5 .... General Experimental Methodology...................................................................99
5.0 Background .............................................................................................................100
5.1 Motion Capture.................................................................................................100
5.2 Hindfoot Model ...............................................................................................105
5.3 Analysis ...........................................................................................................107
5.4 Dorsiflexion Terminology................................................................................108
Chapter 6 A repeated measures study to explore the effect of foot posture on Sagittal Plane Kinematics of the Foot during Passive Ankle Dorsiflexion in Healthy Adults..... ................ 111
6. 0 Introduction ............................................................................................................. 112
6.1 Method .................................................................................................................... 114
6.2 Results ..................................................................................................................... 116
6.2.1 Maximum Foot Dorsiflexion Angle ................................................................. 116
vii
6.2.2 Hindfoot and Forefoot Movement ................................................................... 117
6.3 Statistical Analysis .................................................................................................. 117
6.3.1 Maximum Foot Dorsiflexion Angle ................................................................. 117
6.3.2 Hindfoot and Forefoot Movement ................................................................... 119
6.3.3 Forefoot to Hindfoot Angle ............................................................................. 120
6. 4 Discussion ............................................................................................................... 121
6.5 Limitations ..............................................................................................................123
6.6 Conclusions .............................................................................................................. 124
Chapter 7 A repeated measures study to explore the effect of foot posture on sagittal plane kinematics of passive dorsiflexion of the foot in adolescents ................................................ 125
7.0 Introduction ............................................................................................................. 126
7.1 Background ............................................................................................................. 126
7.1.1 Foot Dorsiflexion in Children .......................................................................... 126
7.1.2 Need for this study ........................................................................................... 128
7.2 Method .................................................................................................................... 129
7.3 Results and statistical analysis ................................................................................ 132
7.3.1 Maximum Foot Dorsiflexion Angle ................................................................. 132
7.3.2 Forefoot to Hindfoot Angle (FFHFA) ............................................................. 133
7.3.3 Hindfoot and Forefoot Movement ................................................................... 134
7.4 Discussion ............................................................................................................... 135
7.5 Conclusions ............................................................................................................. 136
Chapter 8 The effect of uncontrolled moment and short-term, repeated passive stretching
on Maximum Ankle Joint dorsiflexion angle .......................................................... 137
8.0 Introduction ............................................................................................................. 138
8.1 Background ............................................................................................................. 138
8.2 Method .................................................................................................................... 141
8.3 Results and Statistical Analysis: ............................................................................. 141
8.4 Discussion ............................................................................................................... 143
8.5 Conclusions ............................................................................................................. 144
Chapter 9 The Ankle Goniometer: Design and Manufacture ................................................ 145
9.0 Introduction ............................................................................................................. 146
9.1 Background: ............................................................................................................ 146
9.2 Alternative methods of measuring angular movement ........................................... 155
9.3 Some Ankle Goniometer Design iterations ............................................................. 157
Chapter 10 Reliability of a New Ankle Goniometer ............................................................ 169
10.0 Introduction ............................................................................................................. 170
10.1 Reliability ................................................................................................................ 171
viii
10.2 Method .................................................................................................................... 172
10.2.1 Validity Testing: .............................................................................................. 172
10.2.2 Method of Validation ....................................................................................... 173
10.3 Reliability Testing: .............................................................................................. 177
10.3.1 Trial 1: Inter-rater and intra-rater test-retest reliability using a known moment; a double-blind design ....................................................................................... 178
10.3.2 Trial 2: Inter-tester reliability with uncontrolled moment and variable knee position; a double-blind design ........................................................................ 181
10.3.3 Trial 3: Intra-tester reliability with uncontrolled force on a patient population; a double blind design..................................................................................... ...182
10.4 Conclusions ............................................................................................................. 184
Chapter 11 Establishing reliability of the Ankle Goniometer between multiple raters with uncontrolled moment ............................................................................................................. 185
11.0 Introduction ............................................................................................................. 186
11.1 Background .......................................................................................................... 187
11.2 Method ................................................................................................................. 188
11.3 Results and statistical analysis ............................................................................. 190
11.4 Discussion ............................................................................................................ 190
11.5 Conclusion: .......................................................................................................... 192
Chapter 12 Summative Discussion ....................................................................................... 193
12.0 Summative Discussion .......................................................................................... 194
12.1 Summary of results of various studies performed throughout this thesis.................196
12.2 Limitations .................................................................................................................198
Chapter 13 Conclusions ........................................................................................................ 199
Chapter 14 Recommendations and Directions For Further Study ......................................... 203
References .............................................................................................................................. 206
Appendix 1: Ethical Approvals and Participant Information Sheets
Appendix 2: Results and Statistical Analysis Tables
ix
List of Figures
Figure 2.1 Ankle Mortise .......................................................................................................16
Figure 2.2: Talus ......................................................................................................................16
Figure 2.3: MRI of ankle joint. A) Lateral view B) Posterior View………………...............17
Figure 2.4: The tibiotalar articular surface usually has a slight lateral tilt, averaging 3o. The
talocrural angle indicates the empirical axis which averages 83+/-4o. From Khazzam
et al (2008)….............................................................................…...............................18
Figure 2.5: Rotation of talus and ankle axis during loading response ………………............19
Figure 2.6: Ankle Dorsiflexor Muscle activity (from Perry, 1992) …………………............21
Figure 2.7: Ankle Plantarflexor Muscle activity (from Perry, 1992).......…..……….............22
Figure 2.8: Centre of Mass. From Kirtley (2006)…………………………………................23
Figure 2.9: Ankle Range of Motion (from Perrry, 1992)………………………….................24
Figure 2.10: A) Sagittal plane movement of tibia to foot. B) Sagittal plane movement of
calcaneus to tibia (from Richards and Thewlis, (2008) .............................................29
Figure 2.11: Marker placement for the Heidelberg Foot Model (from Simon et al, 2006) ... 46
Figure 2.12: marker placement used to define the rearfoot and leg segments
(from Moseley et al, 1996) ..........................................................................................47
Figure 2.13: Setup used to position hindfoot in neutral position
(from Liu, Siegler, Hillstrom and Whitney, 1997) .....................................................47
Figure 2.14: Recreating the stance phase of walking in cadaveric feet
(from Hamel et al, 2004)..............................................................................................49
Figure 4.1: The Lunge Test ………………………………………………………..............80
Figure 4.2: Modified Lunge Test (from Menz et al., 2003)…………………….....................81
Figure 4.3: Another modified Lunge Test; measurement
from wall to great toe (from Dennis et al, 2008)……..……………………................81
Figure 4.4: The Biplane Goniometer. (Donnery and Spencer 1988)………………...............82
Figure 4.5: The Original Lidcombe Template (from Moseley, 1997)…………..…...............84
Figure 4.6: The modified Lidcombe Template
(from Scharfbillig and Scutter, 2004)……………………………………………….84
Figure 4.7: TROM in use (Trevino et al. 2004)…………………………………………….86
Figure 4.8: The Equinometer (from Digiovanni et al, 2001)………….……………………88
Figure 4.9: The mechanical equinometer (from Meyer et al, 2006).
Note plastic goniometer used to measure angle…………………………………90-91
Figure 4.10: The Iowa Ankle Device (Rao et al. 2006).

x
Validated by Wilken et al. (2004)…………………………………………………..92
Figure 4.11: Demonstrating similarities between
a) Instrumented footplate (Moseley et al. 2001) and
b) The Iowa Ankle Device (Rao et al. 2006) ………………………………………94
Figure 4.12. A device designed to assess Gastrocnemius Contracture.
From Greisberg et al. (2002) …………………………………………….................96
Figure 5.1: Biomechanics Lab layout showing camera
Vicon placement and couch for participants ……………………………....……….100
Figure 5.2: Schematic of the three segment foot model with tibia: TB-Tibial segment (tibia
and fibula), HF-Hindfoot (calcaneus and talus), FF-Forefoot (five metatarsals), HX-
Hallux (hallux proximal phalanx). From Carson et al, 2001..................................... 102
Figure 5.3: Marker placement for the Oxford Foot Model ………………………………...103
Figure 5.4: FF/HF: Plantar/dorsiflexion about the mediolateral axis of the hindfoot, z, in b
(from Carson et al, 2001)...........................................................................................105
Figure 5.5: Oxford foot model implementation in Visual 3D .............................................106
Figure 5.6: Screenshot which highlights the local coordinate system for the tibia, hindfoot,
forefoot and hallux.....................................................................................................106
Figure 5.7: An example of Ankle Angle and Hindfoot to Tibia Angle..................................108
Figure 6.1: Maximum Foot Dorsiflexion vs Foot Posture.………………………………....116
Figure 6.2: Example of Foot Dorsiflexion graph in the pronated, neutral and supinated
positions as output by Polygon software (Vicon) ……………………................................ 117
Figure 6.3a,b: Foot segment vs Foot Posture ………...………………….…………………118
Figure 6.4: Example of Forefoot to Hindfoot movement graph. .........……………………..120
Figure 7.1: Oxford Foot Model Marker Set ………………………………………………..130
Figure 7.2: Camera placement in relation to subject position................................................131
Figure 7.3: Maximum Foot Dorsiflexion Angles in the 3 postures ……..…………………133
Figure 7.4 : Mean HFTA/FFTBA Angles in the 3 postures …………………..…………...134
Figure 8.1: Regression analysis of participant no9, showing increase in Maximum Ankle
Angle with each repetition of the test performed………………...............................143
Figure 9.1: First attempt at producing an ankle goniometer .………………………………148
Figure 9.2: A more sophisticated ankle goniometer design, with a large stable arm
and a footplate that could be rotated and locked in the sagittal
and frontal planes. As yet no actual measuring device was
incorporated into the design ……………………………………….....……..…148-149
Figure 9.3: High precision angle finders (potentiometers) ....................................................149

xi
Figure 9.4: An example on the use of a linear potentiometer to find the angle ………..…..150
Figure 9.5: This design incorporated a carbon-fibre foot-plate that could be
locked into inversion/eversion, a linear potentiometer into the aluminium housing
and a joint to enable the stable arm to be lined with the long axis
of the foot ……………............................................................................................. 150
Figure 9.6: Same features as above, with a transparent acrylic foot-plate,
but housing professionally-built on a lathe. End result, however, was considered too
bulky and the wiring to the display unit made the
unit (below) uncomfortable to work with …………………………….…………….151
Figure 9.7: Display units. Both units had zeroing capabilities. Unit below
provided the angle in real-time and the maximum ankle angle attained.
Could also be calibrated to various potentiometers
with different rotation angles ………………………………………….............151-152
Figure 9.8. The AS5040 Angle Encoder ………………………………………………….. 153
Figure 9.9: The AS5040 adaptorboard (left) and demoboard (right) including
power supply but excluding USB lead. The value on the LED is actually a graduation
representing the angle of rotation (1024 steps in 360o) …………………...............154
Figure 9.10: Digital Angle Finder ………………………………………………………….156
Figure 9.11: A) Rotating angle finder, complete with display. Initially was very
promising, however the mechanism that needed to be attached to the
Ankle Goniometer was too bulky. B) Inclinometer, also a very bulky device………………………………………………………………………………..156
Figure 9.12: Digital inclinometer, which however does not perform rotator
angular measurements ………………………………………………….…..............156
Figure 9.13: A goniometer design incorporating the digital angle finder in
Figure 9.10. The hooks in the left diagram are for attaching a
velco strap to hold the vertical arm in place.
The footplate could hold the foot in an inverted/everted position ………. ………..157
Figure 9.14: 3 iterations of another possible design …………………….………………… 157
Figure 9.15: Various iterations of a hindfoot design: On the left:
a simple design with a heel rest; Other designs: the possibility
of incorporating midtarsal joint measurement was contemplated for
some time, however in actual practice this proved impractical……………………158
Figure 9.16: Design of an Ankle Goniometer with a rest under the leg in order
to stabilize the whole device without the use of Velcro straps …………………….158
xii
Figure 9.17: From design to fabrication: Actual goniometer from the
designs in Figure 9.16, demonstrating various features of the
Ankle Goniometer which appeared to be the most promising ……………………..159
Figure 9.18: Commercially available miniature angle measuring device,
incorporating an LCD screen and battery. Ability to zero the device
at any angle, on off switch and auto power-on upon movement of the arms.
Accurate to within 0.1o ……………………………………………….…………….161
Figure 9.19 A-D: Exploded view of the various components of the
Ankle Goniometer from various angles …………………...…………………..162-164
Figure 9:20: The Ankle Goniometer………………………………………….…………….165
Figure 9:21: Top view of the device, showing the heelplate in
an inverted position ……………………………………………………….. ………165
Figure 9.22a: The proximal part of the goniometer from the lateral side,
showing tibial rest and adjusting arrangements …………………. ………………..166
Figure 8.22b: The proximal part of the goniometer, from a dorsal view……………….…. 166
Figure 9.22c: The digital display and rotational measurement mechanism. Also
showing adjusting arrangement for the heel ……………………………………… 167
Figure 9.22d: The adjustable heel cup, which widens and narrows by means
of two slots in the heel plate. Further Velcro straps hold the heel plate
in place ……………………………………………………………………………..167
Figure 9:23 a-d: The goniometer in position ……………………………...………. ………168
Figure 10.1: Alignment of the Ankle Goniometer with the Electrogoniometer ………..….173
Figure 10.2: a) Electrogoniometer, datalogger and laptop setup during trials.
b) actual setup with the Ankle Goniometer in place………………………………..174
Figure 10.3: Ankle Goniometer/electrogoniometer with marker setup.
a) Dorsal View b) medial view and c) Posterior View …...………………………. 175
Figure 10.4: Subject positioning.………………..……………………...…………………..176
Figure 10.5: Validity: Angles output by goniometer and vicon …………..………………..177
Figure `10.6: Test-retest results for each subject...................................................................184

xiii
List of Tables
Table 2.1: Ankle Dorsiflexor Torques………………………………......……………….......20
Table 2.2: Ankle Plantar Flexor Torques………………………………………......…..........21
Table 3.1: Systematic review process.......................... …….………………………….........54
Table 3.2: The Quadas Tool from Whiting et al., 2003………………………………...........55
Table 3.3: A Quality Assessment Tool derived from Quadas and Jull (2008)……………....60
Table 3.4: Various ankle dorsiflexion tools/techniques identified………...……………........61
Table 3.5: The utilization of the various techniques used to measure
Ankle Joint Complex Dorsiflexion in scientific literature ……..................................65
Table 3.6. Quality Assessment Scores……………………………………………………….69
Table 3.7: Quality assessment Score Totals per study ………………………………………70
Table 5.1: Names and positions of markers used in the Oxford foot model………………..102
Table 6.1: Variables used to denonte dorsiflexion terminology......………………………..115
Table 7.1: Participant demographics ……………………………………………………….132
Table 10.1: Participant Demographics ……………………………………………………..183
Table 10.1: Participant Demographics ……………………………………………………..190
Appendix 2:
Table 1: Mean Maximum Foot Dorsiflexion Angle Scores in the Pronated,
Neutral and Supinated Postures. …………………………………………………....…2
Table 2: Forefoot to Hindfoot Angle range of movement ……………………………….........3
Table 3: Descriptive Statistics: Mean differences:
pronated angle – neutral angle = 5.78o; pronated–supinated = 8.27;
neutral–supinated=2.49o …………………………………………………………....…3
Table 4: One way repeated Anova Results for
Maximum Foot Dorsiflexion Angle ………………………………………………......4
Table 5: Pairwise comparisons between the 3 foot postures …………………………….........4
Table 6: Descriptive Statistics (Angle Range) …………………………………………..........5
Table 7: Multiple Comparisons ………………………………………………………….........5
Table 8: Hindfoot to forefoot angles …………………………………………………….........6
Table 9: Descriptive Statistics.........................…………………………………………….......7
Table 10: SPSS output for Repeated Measures Anova.
Sphericity Assumed is the statistic to take into account……………………………....7

xiv
Table 11: Pairwise comparisons …………………………………………………………........7
Table 12: Forefoot to Hindfoot Range of Motion Angles
in the pronated, neutral and supinated postures ……………………………………....8
Table 13: Maximum Ankle Angle results
for the Neutral and Supinated Postures …………………………………………….....9
Table 14: Mauchly’s Test of Sphericity for Neutral Posture …………………………….....10
Table 15: Repeated Measures ANOVA, neutral position.
Greenhouse-Geisser test was taken into consideration
since Mauchly’s Test was significant ……..............………………………………....10
Table 16: Mauchly’s Test of Sphericity for the Supinated posture ……………………….....10
Table 17: Repeated Measures ANOVA, supinated position.
Sphericity Assumed was taken in consideration since
Mauchly’s test (above) was non-significant ………………………………………..11
Table 18: Regression analysis of all subjects at
Neutral and Supinated postures……………………………………………………....11
Table 19: Sample output of Goniometer/Vicon
at approximately 5o increments ……………………………………………………...12
Table 20: Descriptive statistics ……………………………………………………………....12
Table 21: Rater 1 (Test-Retest) and Rater 2
Maximum Ankle Dorsiflexion Angles ……………………………………………....12
Table 22: Reliability Statistics and Means ……………………………………………….....13
Table 23: ICC results for Test-Retest …………………………………………………….....13
Table 24: Reliability Statistics and Means ………………………………………………......13
Table 25: ICC of Rater1 vs Rater2; inter-rater reliability …………………………………...14
Table 26: Cronbach’s Alpha for Test-Retest with Knees extended and flexed ………..…....14
Table 27: Means of Test-Retest with the Knees Extended and Flexed ………………….......14
Table 28 : ICC (2,1) Test-Retest with the knees extended ……………..................................15
Table 29 ICC (2,1) Test-Retest with the knees flexed ………………....................................15
Table 30: Maximum Ankle Angles of Patient Population for the study ………………….....16
Table 31 a,b: Reliability statistics and means ………………………………………….....…16
Table 32: ICC (2,1) for patients population …………………………................................…17
Table 33: Means of results of the 4 raters ……………………………………………….......17
Table 34: Reliability results for multiple raters..…………………...........................…….......18

xv
Glossary
ANOVA Analysis of Variance Ankle Dorsiflexion Sagittal plane, upward movement of the foot
occurring only at the ankle joint. Dorsiflexion Upward movement of the foot in the sagittal
plane Foot Dorsiflexion Dorsiflexion of the foot occurring through
the ankle, subtalar and midtarsal joints Goniometer A device shaped like a protractor to measure
joint angles Greenhouse-Geisser Test Statistical test to be used when Sphericity has
been violated. Provides corrections for violations of sphericity
Mauchly’s Test of Sphericity A statistical test for testing the assumption of sphericity
Maximum Ankle Dorsiflexion Angle The maximum angle attained by the ankle during passive dorsiflexion
Maximum Foot Dorsiflexion Angle The maximum angle attained by the foot during passive dorsiflexion, with movement occurring at the ankle, subtalar and midtarsal joints. Kinematically, the foot is treated as a single segment.
Pronated Position A position in which the foot is abducted, everted and dorsiflexed.
Pronation Triplanar movement comprising abduction, eversion and dorsiflexion. Typically occurs in ‘flat feet’
ROM Range of Motion Root Theory of Biomechanics A highly-criticized theory of podiatric
biomechanics first put forth by Root, Orien and Weed in 1977 in their book “Normal and Abnormal Function of the Foot”.
Sphericity A condition where the variances of the differences between all combinations of related groups (levels) are equal. Sphericity can be likened to homogeneity of variances in a between-subjects ANOVA
Subtalar Joint Joint formed by the inferior aspect of the talus and superior aspect of the calcaneus. Principally responsible for pronation and supination of the foot
Subtalar Joint Neutral Position A position where the subtalar joint is neither pronated nor supinated.
Supinated Position A position in which the foot is adducted, inverted and plantarflexed
Supination Triplanar movement comprising adduction, inversion and plantarflexion. Typically

xvi
occurs in ‘high arched’ feet Vicon A proprietry brand of motion capture
systems comprising multiple infra-red emitting cameras. Vicon software include “Nexus” for capturing movement and “Polygon” for analysing movement.

xvii
Publications arising from this Dissertation
Gatt A, Chockalingam N. 2011. Clinical assessment of ankle joint dorsiflexion: A review of
measurement techniques. Journal of the American Podiatric Medical Association. 101(1): 59-
69.
Gatt A, Chockalingam N, Chevalier TL. 2011. Sagittal plane kinematics of the foot during
passive ankle dorsiflexion. Prosthetics and Orthotics International. 35(4). pp. 431 - 437.
Gatt, A, Chockalingam N. 2012. Assessment of Ankle Joint Dorsiflexion: An Overview.
Revista Internacional de Ciencias Podológicas. Vol. 6, Núm. 1, 25-29.
Gatt A, Chockalingam N. The effect of uncontrolled moment and short-term, repeated
passive stretching on maximum ankle joint dorsiflexion angle. Foot. (2012),
doi:10.1016/j.foot.2012.12.001 (In Press).
Gatt A, Chockalingam N. 2011. Sagittal Plane Kinematics of passive dorsiflexion of the foot
in adolescent athletes. Journal of the American Podiatric Medical Association (in Press).
Gatt A, Chockalingam N. 2012. Validity and Reliability of a New Ankle Dorsiflexion
Measurement Device. (Under review).

Chapter 1
Introduction
Aspects of this chapter have been published as follows:
Gatt A, Chockalingam N. 2012. Assessment of Ankle Joint Dorsiflexion: An Overview. Revista Internacional de Ciencias Podológicas. 6(1):25-29

2
1.0 Introduction
This introductory chapter provides an overview of a common condition affecting the foot,
referred to as “ankle equinus” or “limited ankle dorsiflexion” and its effects on the lower
extremities, then explores some of the important issues involved in the clinical measurement of
ankle dorsiflexion.
1.1 Background to the Thesis
The ankle joint is an important component of the musculoskeletal system necessary for normal
ambulation. It is formed by the articulation between the mortise of the lower tibia and fibula and
the trochlear surface of the talus. Actually composed of 3 joints - the tibiotalar, tibiofibular and
fibulotalar joints (Donatelli and Wolf 1990) - it plays an essential role during walking, and is of
great importance during physical activities (Leardini et al. 1999b). It is generally believed that
the upward and downward movement of the foot, referred to as dorsiflexion and plantarflexion
respectively, occurs mainly at this joint (Leardini et al. 1999b; Root et al. 1977). This Tibio-talar
movement involves the rotation of the talus within the ankle mortise (Hamel et al. 2004) with
unresisted mobility being obtained by the sliding of the articular surfaces upon each other
(Leardini et al. 1998).
The ankle moves through an average of 20 o to 40 o total range of motion during walking (Weir
and Chockalingam 2007). Whilst this is a triplanar joint, i.e. with movement occurring in all 3
body planes, the orientation of its axis, which runs from the medial to the lateral malleolus,
facilitates the majority of this motion to occur in the sagittal plane. It is claimed that during
normal locomotion, 10o of ankle dorsiflexion is required for the forward translation of the centre
of gravity of the body to occur during single limb support (Root et al. 1977), although this has
been challenged (Weir and Chockalingam 2007). This forward translation occurs in the sagittal
plane, and this is said to occur using a 3 rocker system to permit advancement (Perry 1992). This
sagittal plane movement at the ankle occurs during the 2nd rocker (Dananberg 2004).
Reduced range of movement at this joint has been termed as gastrocnemius contracture, limited
ankle dorsiflexion and ankle equinus. This condition has been related to various functional lower
extremity musculoskeletal conditions. Measurement of ankle dorsiflexion involves the use of a

3
measuring device called a “goniometer” (a protractor with a stable and a moving arm that
quantifies an angle), which has been criticized as being highly unreliable. Hence various other
measuring techniques have been developed.
1.1.1 Limited Ankle Dorsiflexion
Clinically, lack of ankle joint dorsiflexion is known by many terms, including equinus,
gastrocnaemius contracture and limited ankle dorsiflexion. The classical orthopaedic definition
of ankle equinus is a plantarflexed foot as is often seen in neurological conditions such as
cerebral palsy. Another definition is ‘<10o of dorsiflexion with the subtalar joint placed at
neutral position.’ It has been hypothesised that placing the foot at subtalar joint neutral position
with the midtarsal joint loaded will reduce any movement extraneous to the ankle joint (Root et
al. 1977). While Lavery et al. (2002) defined equinus as <0o of dorsiflexion, DiGiovanni et al.
(2002) defined this condition as <5° of ankle dorsiflexion with the knee extended or <10° with
the knee flexed and used the term ‘gastrocnaemius tightness’.
The most common cause of Equinus is tightening or shortening of the gastrocnaemius/soleus
group (collectively known as the triceps surae), causing premature activity of ankle
plantarflexors (Hill 1995). In fact, the term muscular ankle equinus has also been coined. This is
thought to result from modern lifestyle factors in the daily environment, which put patients at
risk of developing this condition. These factors include overtraining of muscles, sleeping with
the feet in a plantarflexed position for long hours and sitting for long hours at desks with the
knees flexed and the feet in an equinus position. Even during standing, the gastrocnaemius is
being used to maintain the centre of gravity anterior to the ankle joint axis (Kirby 2000; Kirtley
2006) and to oppose the dorsiflexing moment imposed on the foot (Kirtley 2006).
1.1.2 Effects of Ankle Equinus
Lack of ankle dorsiflexion is compensated for by altering gait, including early heel-off in mild
cases (bouncy gait) or even a total lack of heel strike in severe cases (such as in cerebral palsy);
triplanar rearfoot motion (pronation) and an adducted gait pattern (Root et al. 1977). Equinus can
be uncompensated, with the patient walking on the toes, or compensated by various methods,

4
including foot abduction, significant pronation of the mid foot and rearfoot, resulting in the loss
of the medial longitudinal arch and abduction of the forefoot (Sullivan 1997).
Once the ankle is restricted, the midtarsal joint is the next joint through which dorsiflexion may
occur. This is achieved by excessive pronation of the foot (Dananberg 2004), which turns it into
a mobile adaptor to facilitate dorsiflexion at this joint. Forces on the midtarsal joint may
eventually lead to the midfoot break and significant structural foot problems (Harrison et al.
2001).
Lack of ankle dorsiflexion is said to produce a sagittal plane blockage (Dananberg 2004). This
refers to a restriction of rotational motion of the foot or any part of it – such as the ankle and first
metatarsophalangeal joint - within the sagittal plane. As the forward movement of the foot occurs
mainly in the sagittal plane, anything that prevents this is likely to cause a change in gait and
produce compensatory patterns of walking. In fact, muscular ankle equinus, or gastrocnaemius
contracture, has been associated with various foot conditions. In a study of 209 consecutive
patients with musculoskeletal problems in the foot, a prevalence of 96.5% of this condition was
found and has been linked to foot problems including plantar fasciitis and metatarsalagia (Hill
1995).
Various authors claim that ankle equinus may be a significant causative factor of a variety of
lower extremity conditions, ranging from low back pain, hyperextended knees, hallux rigidus,
calcaneal spurs (Wrobel et al. 2004), chronic plantar heel pain (Irving et al. 2006), foot nerve
entrapment (Barrett and Jarvis 2005), Achilles tendinopathy, Posterior Tibial Tendon
Dysfunction, plantar fasciitis (Hill 1995), metatarsalgia (Subotnick 1971) and forefoot callus
(Sgarlato et al. 1975). It has been shown that diabetic patients with equinus have significantly
higher pressures in the forefoot than those without (Lavery et al. 2002).
Although highly evident equinus may be a presentation of neurological conditions, including toe
walking (Sobel et al. 1997) and cerebral palsy (Allington et al. 2002), the milder form of equinus
does not normally become apparent except through a thorough lower limb examination. This
form of equinus can affect anyone, from diabetics (Lavery et al. 2002; Pham et al. 2000),
adolescent athletes and children (Saxena and Kim 2003). In individuals with neurological
conditions, contracture of the triceps surae is well documented. The impact of contracture of the

5
gastrocnaemius in the normal patient needs to be researched more because it can have deleterious
effects such as pain in the forefoot and/or midfoot (Digiovanni et al. 2002).
1.1.3 Examination
Thus it is evident that ankle joint assessment, including the accurate measurement of the range of
motion of this joint, is an important aspect of any musculoskeletal examination. A biomechanical
evaluation of the foot normally starts with passive examination of the range of movement of this
joint. Ankle joint movement examination may be performed using various methods. The
procedures mostly used in clinics and research include goniometry (Gastwirth 1996; Root et al.
1977) and visual estimation. (Digiovanni et al. 2001). This may be because goniometers can be
found easily in clinics and are relatively inexpensive. During goniometric examination, one arm
of the goniometer is placed along a bisection of the lateral aspect of the lower leg, and the other
arm along the lateral margin of the foot (Gastwirth 1996; Root et al. 1977). The subtalar joint is
held in neutral position, with the midtarsal joint locked. An upward force is applied until the
maximum ankle joint range of motion is reached. This examination is initially done with the
knee extended and then with the knee flexed in order to differentiate between gastrocnaemius
(the former) and soleus tightening (Gastwirth 1996; Root et al. 1977; Silverskiold 1924).
However, there is ample evidence in literature that goniometer based measurements for ankle
joint movement are not reliable (Kim et al. 2011; Martin and Mcpoil 2005; Rome 1996; Van
Gheluwe et al. 2002; Wrobel and Armstrong 2008). Although hand-held goniometers have
introduced quantification (Woodburn et al. 2002) they have major drawbacks in measuring
ROM; goniometric reliability is unproven with reliability studies often having major flaws in
design or analysis (Jordan et al. 2001). In fact, goniometry has been shown to be unreliable for
rearfoot assessment (Ball and Johnson 1993; Buckley and Hunt 1997) and the responsiveness of
ankle range of motion measurements is uncertain (Martin and Mcpoil 2005).
These problems with reliability have spurred the design of a number of devices and procedures
aimed at measuring ankle dorsiflexion. These include, among others:
The Equinometer (Assal et al. 2003; Weaver et al. 2001) The Mechanical Equinometer (Meyer et al. 2006)

6
The Biplane Goniometer (Donnery and Spencer 1988) The Iowa Ankle Device (Wilken et al. 2004)
The Lunge Test (Bennell et al. 1998)
It is evident that there is still a paucity of information in quantifying Ankle Joint dorsiflexion. An
inappropriate measurement using an inappropriate technique could have important repercussions.
Wrong techniques for measurement and the use of poorly-validated instruments may provide a
mis-diagnosis from which wrong treatment modalities could ensue.
1.2 Rationale for the Study
The measurement of ankle joint dorsiflexion is an essential component of the orthopaedic
examination of the foot. This measurement procedure is normally done by dorsiflexing the foot
through the application of a force to the metatarsophalangeal joint area (the “ball” of the foot).
For many years, the normal standard for measuring this movement has been the goniometer,
which is cheap to buy and is easily found in the majority of musculoskeletal clinics. However, it
has been clearly demonstrated through various scientific papers (Elveru et al. 1988; Kim et al.
2011; Martin and Mcpoil 2005; Rome 1996; Wrobel and Armstrong 2008) that this goniometric
method is not reliable for various reasons, including: errors in placement, non-standardized
placement of the goniometer and various issues with establishing subtalar joint neutral position.
Perhaps because of this, various devices that claim to measure ankle dorsiflexion, have been
presented in literature (Assal et al. 2003; Meyer et al. 2006; Wilken et al. 2011); some of these
include very sophisticated and specialized equipment which makes them very expensive and thus
out of reach of many clinics (Mayhew et al. (1994) quoted their use of an isokinetic
dynamometer to assess ankle range of motion as costing $25,000).
It is quite alarming to note that, notwithstanding the evidence of high unreliability of the
traditional goniometer, there is still a large proportion of research being done to-date that relies
on goniometric ankle dorsiflexion measurement, making the results of, often, very valid research,
also unreliable and inconsistent (Johanson et al. 2006b; Wessling et al. 1987). This would have
been easily avoided if the respective researchers had used some type of validated ankle
goniometer which, however, to date, is not very easily found.

7
Another important issue that possibly influences the use of goniometers for research and clinical
practice is the lack of freely-available information regarding this issue. Indeed, the use of normal
goniometers is still being taught and presented in textbooks (Gastwirth 1996).
Although this clinical examination is routinely carried out, little is known as to what actually
occurs when the foot is dorsiflexed passively. Root Theory (Root et al. 1977) advocates the use
of subtalar joint neutral position and locking of the midtarsal joint by the application of a force
underneath the 4th and 5th metatarsophalangeal joints when measuring ankle dorsiflexion, so that
forefoot movement is eliminated and there remains only movement at the ankle. This claim of
over 30 years has never been thoroughly investigated. Nowadays, however, with accurate opto-
electronic motion capture systems and the use of kinematic foot models, it is possible to
investigate inter-segmental foot movement so that it can be determined where and how much
movement results from the application of a moment of force at the metatarsophalangeal joint
area.
This thesis will thus investigate foot kinematics and the effect on foot segment motion upon the
application of a force to dorsiflex the foot. The moment applied to the forefoot causes a
rotational movement around the ankle joint, thus it is an important element that has to be
explored. It has been noted that all goniometers that were designed specifically for measuring
ankle joint dorsiflexion make use of a force gauge to ensure that a constant moment is applied to
all subjects (Assal et al. 2003; Meyer et al. 2006; Scharfbillig and Scutter 2004; Wilken et al.
2011). Charles et al. (2010) insist that it is important that standardized torque be applied to the
ankle to achieve valid and reliable estimates of range of motion (ROM).
This thesis challenges this approach, postulating that when a known moment is applied to the
foot, high reliability results can be easily attained. It is hoped to prove that, since the nature of
this examination procedure involves range of motion measurement of the joint, the application of
a known moment is unnecessary as the only element that limits joint movement is the end of
motion, which depends either on the extensibility of the calf tendon muscle unit or a bony stop as
the talus wedges itself between the tibial and fibulalar mortise at the ankle joint.
The final results of this thesis will provide evidence that the ankle joint is not as simple to
measure as it may appear, but in fact various elements, including foot posture and moment, must

8
be looked at and that practitioners and researchers must be aware of issues regulating the
measurement of this joint.
1.3 Scope of the investigation
The boundaries of this investigation were:
1. To investigate maximum ankle dorsiflexion as would occur during a clinical examination
for range of movement of this joint and not to investigate ankle stiffness, which is
calculated by the dorsiflexing angle and the moment applied.
2. To design an Ankle Goniometer suitable for the investigation of the various issues
encountered during this thesis and for the completion of this thesis, and not for
commercial use. The resultant goniometer may require additional ergonomic design to
attain this stage.
3. To investigate foot and ankle dorsiflexion measurement in a non-neurological population.
This is mainly because:
Equinus secondary to neurological conditions (cerebral palsy, stroke, etc) is easily
diagnosed in the majority of instances since there is quite a distinct plantarflexion of the
foot, accompanied by signs and symptoms of neurological impairment such as spasticity.
Consequently there are no issues related to its diagnosis.
Ankle dorsiflexion in the neurological patient is being actively researched elsewhere.
The possibly high prevalence of limited ankle dorsiflexion (Hill 1995) and the condition
remaining undetected because of wrong diagnostic techniques, has a major impact on the
way foot conditions are being diagnosed and treated.
These forms of ‘milder’ equinus may be quite wide-ranging in the ‘normal’ population,
often remaining undiagnosed because of this ‘mild’ nature of the condition.
Notwithstanding this, equinus can have wide ranging effects on the patient, often being
overlooked during clinical examination because of the serious issues related to

9
goniometric measurement, which is the normal method of clinical assessment through
which a proper diagnosis is reached.
1.4 Need for the study
Due to the importance of ankle joint examination and various lacunae that exist in research
evidence in this area, there is a need to determine what exactly happens during this examination
procedure. The identification and consequent resolving of issues involved during ankle joint
measurement will enable us to provide more consistent results that are known to be reliable and
that can be compared directly even if not arising through the same practitioner/s.
1.5 Aims and Objectives
The main aims of this investigation were:
To investigate sagittal plane biomechanics of passive ankle joint dorsiflexion, as
occurs when a practitioner examines the ankle for maximum range of motion
To design and validate a new Ankle Goniometer for clinical and research purposes.
The objectives of this investigation include:
o To identify the various measurement techniques currently in use and any
difficulties related to ankle joint measurement through a structured systematic
review (Chapter 3).
o To measure sagittal maximum foot dorsiflexion and foot segment movement
during passive ankle dorsiflexion, both in adults (Chapter 6) and children
(Chapter 7).
o To quantify the effects of foot posture on maximum ankle angle during passive
ankle joint examination (Chapters 6 and 7).
o To determine variation in the hindfoot to forefoot angle (Chapters 6 and 7).
o To investigate the application of force on the maximum foot dorsiflexion angle
and maximum ankle angle during passive ankle joint examination (Chapter 8).
10
o To derive design criteria to enable the design of a suitable Ankle Goniometer
(Chapter 9).
o To establish validity and reliability of the Ankle Goniometer to enable it to be
used in clinical practice (Chapters 10 and 11).
o To devise an updated protocol for the measurement of ankle joint complex
dorsiflexion (Chapter 14).
1.6 Ethical approval
Appropriate ethical approval was sought, and granted by the University Ethics Committee,
depending where the study was held. All participants provided informed consent to participate in
the various experimental studies. In the case of minors, a parent provided the informed consent,
also with the approval of the child. Staffordshire University Research Ethics Committee
provided ethical approval for the study carried out at the Biomechanics Laboratory (Chapter 6).
Faculty of Health Sciences and University of Malta Research Ethics Committees provided
ethical approval for the other studies, which were all carried out in Malta.
Information regarding ethics concerning each trial will be outlined in the method section of the
corresponding chapter of this thesis and respective Ethical approvals, participant information
sheets and consent forms may be found in Appendix 1.
1.7 Structure of this Thesis
This dissertation is set out over 14 chapters.
Chapter 1 introduces the subject matter, providing an overview of the various issues involved,
i.e. the importance of ankle dorsiflexion during gait, the effect of ankle equinus on the feet and
the various issues relating to ankle dorsiflexion measurement, mainly the unreliability of current
goniometric techniques that may be providing wrong results, thus possibly wrong diagnosis and
treatment.

11
Chapter 2 provides a literature review which presents those topics related to the main subject of
this thesis, i.e. ankle dorsiflexion measurement. These topics introduce important background
information on which this thesis will be based.
A systematic review of ankle measurement techniques is provided in Chapter 3, the backbone of
information upon which this thesis was built and from which further scientific investigations
ensued. The systematic review enabled the investigator to identify those factors that mostly
influence ankle dorsiflexion measurement; i.e. foot posture and the moment applied to dorsiflex
the foot. This consequently led to a series of scientific experiments in order to arrive at important
conclusions that would provide the basis for a goniometric device and/or a measurement
protocol, which was later designed and validated during the course of this investigation.
Chapter 4 describes and criticises the currently available methods of measuring ankle
dorsiflexion in order to provide justification for the need of designing an innovative device for
measuring ankle dorsiflexion, i.e. an Ankle Goniometer.
Following this outline, Chapter 5 provides a background technical information and
methodological issues around the equipment and the analysis procedure used within this study.
Chapter 6 describes the investigation that provides a kinematic segmental analysis of adult
sagittal plane motion during passive ankle dorsiflexion. Two important factors affecting
dorsiflexion are analyzed: the effect of foot posture and moment on maximum ankle
dorsiflexion. From data collected, utilising a validated foot model, the forefoot to hindfoot angle,
tibia to hindfoot angle and tibia to forefoot angle are studied.
There is a paucity of information regarding children’s passive ankle dorsiflexion as most
research concentrates on neurologically-induced ankle equinus and its measurement. The second
investigation, presented in Chapter 7, replicated the previous trial, however on an adolescent
population, as it was hypothesised that young feet, due to increased flexibility, would behave
differently to adult feet during passive ankle joint dorsiflexion.
Chapter 8 investigates the effect of uncontrolled moment when it is applied to the forefoot
during passive ankle joint dorsiflexion measurement. The great majority of ankle dorsiflexion
techniques utilise a controlled moment to ensure reliability. However, it is hypothesised that

12
applying a known moment is quite unnecessary as the ankle dorsiflexes to the end of its range of
motion, which is determined mainly by the extensibility of the triceps surae. It has also been
hypothesised that, as this examination technique involves repetitive movements to the end of
travel of the ankle joint, there may be a stretching effect on the calf muscles which could affect
the results of reliability testing of the new Ankle Goniometer. Thus this chapter also investigates
whether repeated, short repetitive stretching causes a significant effect on the maximum ankle
dorsiflexion angle. Data acquired from the trial in Chapter 5 will be utilised to this effect.
The various design iterations of the Ankle Goniometer will be presented in Chapter 9 and the
validity and reliability of this Ankle Goniometer will be investigated thoroughly in Chapter 10.
Before any new diagnostic equipment is applied to patients, rigorous testing needs to be
performed. This testing differs from reliability testing of other equipment, in that
recommendations obtained from the Systematic Review will be employed for validity and
reliability testing.
Following validation and inter-rater reliability testing with a controlled moment and intra-rater
reliability, the Ankle Goniometer will be put to use to explore an important issue that has
constantly arisen during this investigation: whether it can be reliably used by multiple raters with
uncontrolled moment. This is considered to be an important issue because inability to produce
consistent results would hinder clinicians from assessing effectiveness of treatment, for example
in a pre- and post-intervention trial and would also prevent comparison of results between
clinicians. This is outlined in Chapter 11.
Chapter 12 provides a summative discussion. Each trial will have its own discussion, where the
various issues pertaining to the particular hypotheses under investigation will be considered. This
chapter will provide a summative discussion which ties together the various findings of the
whole investigation, outlining all the evidence resulting both from this thesis and other trials.
This will result in a summary of evidence regarding foot and ankle dorsiflexion measurement
that would be the basis for the synthesis of a protocol for the measurement of ankle joint
complex dorsiflexion.
Whilst Chapter 13 will summarize the various conclusions reached during the whole project and
summative discussion, Chapter 14 will synthesize findings and produce recommendations for

13
performing ankle joint dorsiflexion measurement and will provide directions for further study in
this challenging area.

14
Chapter 2
Literature Review

15
2.0 Literature Review
This chapter provides background information and a review of literature related to the various
methods of measuring ankle dorsiflexion together with a description of the anatomical structures
involved. This is necessary so as to present a complete picture of the subject matter.
The procedure of measuring ankle dorsiflexion is not as simple as it initially appears, so much so
that various researchers have devised different methods of obtaining ankle/foot dorsiflexion
angles. Indeed, few practitioners would consider the difference between an ‘ankle dorsiflexion
angle’ and a ‘foot dorsiflexion angle’ and that foot segmental movement could interfere with the
expected results. There exist various lacunae, some of which are obvious, and some of which are
not, such as the movement of the various foot segments during passive dorsiflexion. The
“midtarsal joint mechanism locking mechanism”, which has been hypothesised by Root et al
(1997) and accepted as standard so much so that it has been integrated into clinical practice, has
never been investigated before and thus few are aware that there are issues that would affect the
measured angle and, potentially, the resultant diagnosis and treatment given to the patient.
Thus this chapter aims to address and clarify these issues, some of which will later require to be
resolved by the research project covered throughout this thesis.
2.1 The Ankle Joint
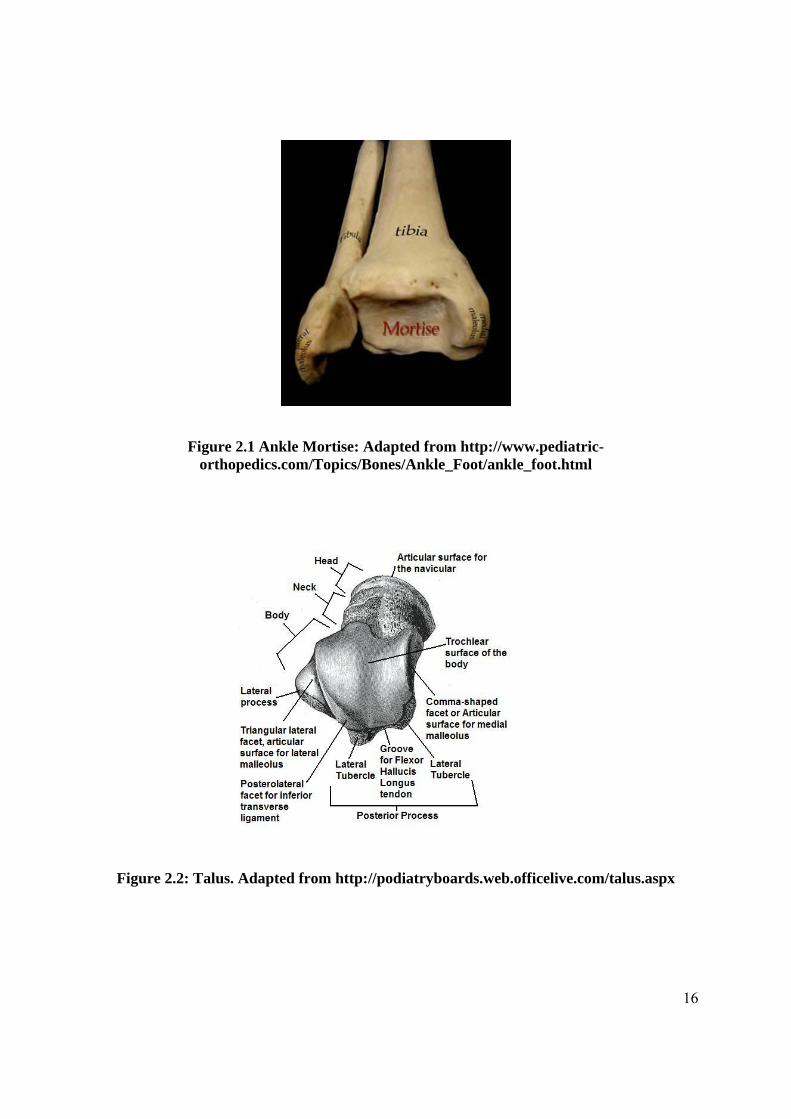
The ankle joint is formed by the articulation between the mortise of the lower tibia and fibula
and the trochlear surface of the talus (Figures 2.1 and 2.2). It is in fact 3 joints: the tibiotalar,
tibiofibular and fibulotalar joints (Donatelli and Wolf 1990). Referred to as the talocrural joint, it
is the main joint through which sagittal movement of the foot, i.e. dorsiflexion and
plantarflexion, occur.
16
Figure 2.1 Ankle Mortise: Adapted from http://www.pediatric-orthopedics.com/Topics/Bones/Ankle_Foot/ankle_foot.html
Figure 2.2: Talus. Adapted from http://podiatryboards.web.officelive.com/talus.aspx

17
The smooth trochlear surface of the talus is hemispherical in shape if viewed laterally. This
allows for the smooth movement of the talus inside the mortise. Viewed from above, the
trochlear surface is wider anteriorly. Thus with dorsiflexion, the anterior, wider part forms a
boney stop. This causes a slight widening of the tibia and fibula, a movement allowed by the
strong interosseous tibiofibular ligament and the anterior and posterior tibiofibular ligaments
which hold the tibia and fibula together (Moore et al. 2006). Plantarflexion is limited by the
posterior tubercle of the talus and tension applied to the anterior talofibular ligament (Wernick
and Volpe 1996). Passive movement of the ankle complex is determined by the articular surfaces
and ligaments (Leardini et al. 1999a).
A) B)
Figure 2.3: MRI of ankle joint. A) Lateral view B) Posterior View. From: http://www.med.nagasaki-u.ac.jp/radiolgy/MRI%20of%20the%20FOOT/MRI-
CDNUH/fig50.html
The medial malleolus is smaller and lies more proximal to the lateral malleolus. Because of its
orientation, which runs from the fibular to the tibial malleolus, movement around the axis of the
ankle joint is triplanar, with abduction and external rotation occurring with dorsiflexion, and
adduction and internal rotation occurring with plantarflexion (Castro 2002; Donatelli and Wolf
18
1990). Although it is reported to lie an average of 8 degrees from the transverse plane and 20 to
30 degrees from the frontal plane (Wernick and Volpe 1996), it varies considerably across the
population and changes continuously across the range of movement of the ankle joint (Lundberg
et al. 1989b).
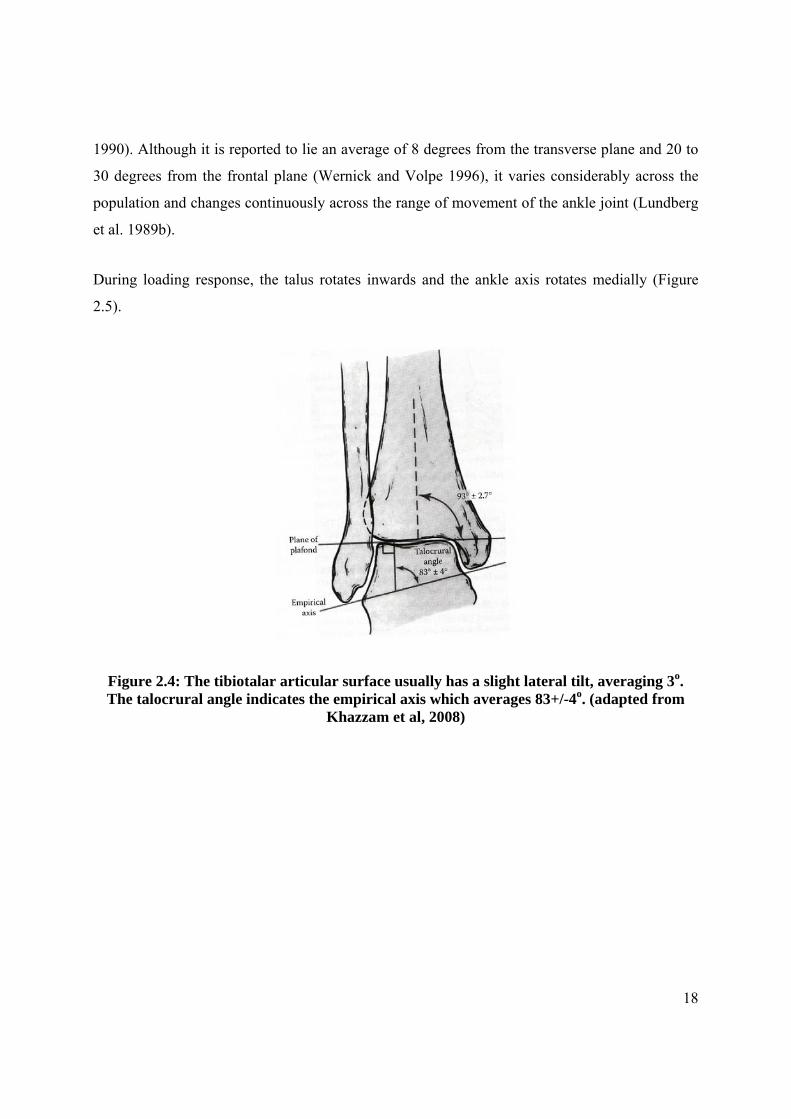
During loading response, the talus rotates inwards and the ankle axis rotates medially (Figure
2.5).
Figure 2.4: The tibiotalar articular surface usually has a slight lateral tilt, averaging 3o. The talocrural angle indicates the empirical axis which averages 83+/-4o. (adapted from
Khazzam et al, 2008)
19
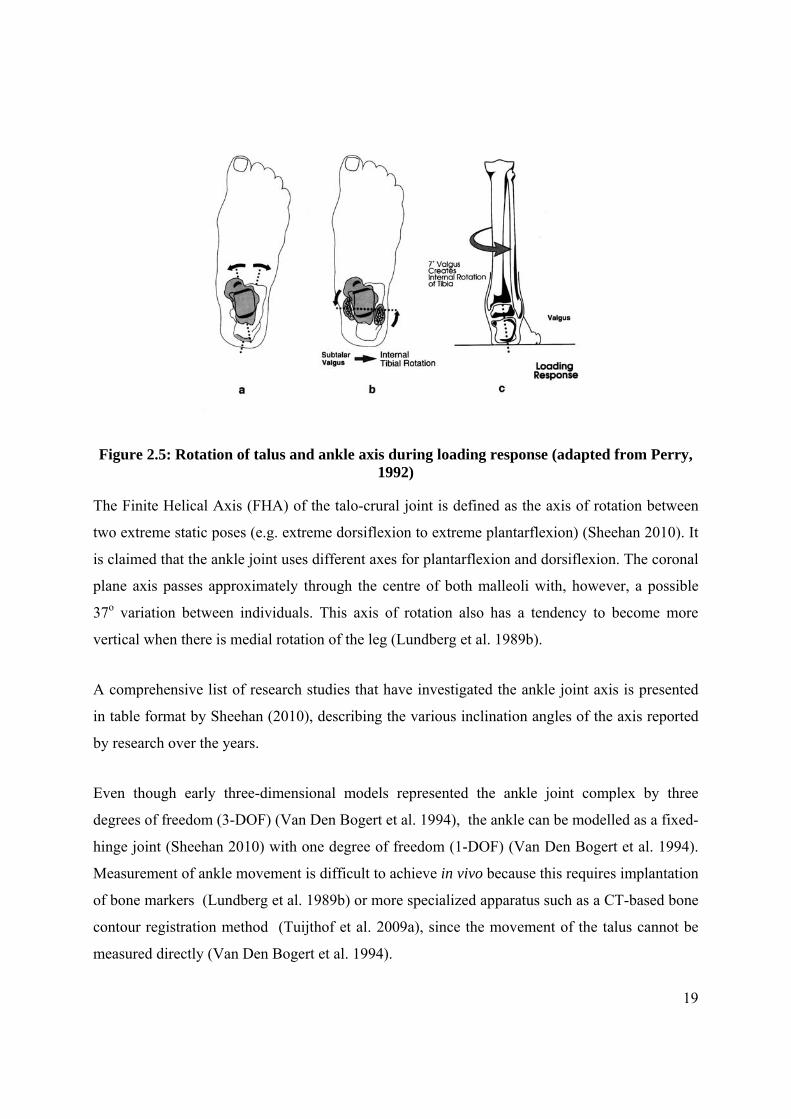
Figure 2.5: Rotation of talus and ankle axis during loading response (adapted from Perry, 1992)
The Finite Helical Axis (FHA) of the talo-crural joint is defined as the axis of rotation between
two extreme static poses (e.g. extreme dorsiflexion to extreme plantarflexion) (Sheehan 2010). It
is claimed that the ankle joint uses different axes for plantarflexion and dorsiflexion. The coronal
plane axis passes approximately through the centre of both malleoli with, however, a possible
37o variation between individuals. This axis of rotation also has a tendency to become more
vertical when there is medial rotation of the leg (Lundberg et al. 1989b).
A comprehensive list of research studies that have investigated the ankle joint axis is presented
in table format by Sheehan (2010), describing the various inclination angles of the axis reported
by research over the years.
Even though early three-dimensional models represented the ankle joint complex by three
degrees of freedom (3-DOF) (Van Den Bogert et al. 1994), the ankle can be modelled as a fixed-
hinge joint (Sheehan 2010) with one degree of freedom (1-DOF) (Van Den Bogert et al. 1994).
Measurement of ankle movement is difficult to achieve in vivo because this requires implantation
of bone markers (Lundberg et al. 1989b) or more specialized apparatus such as a CT-based bone
contour registration method (Tuijthof et al. 2009a), since the movement of the talus cannot be
measured directly (Van Den Bogert et al. 1994).
20
The ankle joint is held together by a number of ligaments, namely the deltoid ligament on the
medial aspect, which includes the anterior and posterior tibiotalar ligaments, the tibiocalcaneal
and tibiotalar ligaments. On the lateral aspect lies the lateral ligament of the ankle, which
consists of the anterior and posterior tibiofibular ligaments and the calcaneofibular ligament
(Moore et al. 2006).
2.1.1 Muscular Control at the Ankle Joint
Movement at the ankle joint is powered by the Dorsiflexor and Plantarflexor muscles.
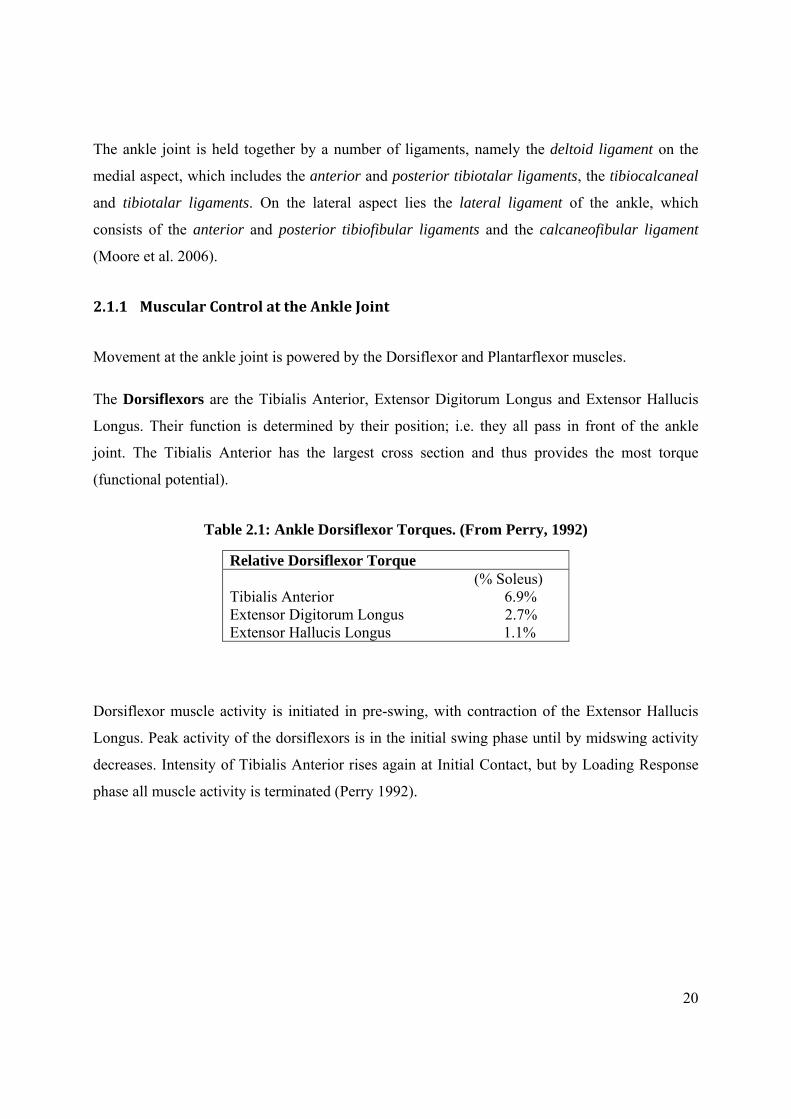
The Dorsiflexors are the Tibialis Anterior, Extensor Digitorum Longus and Extensor Hallucis
Longus. Their function is determined by their position; i.e. they all pass in front of the ankle
joint. The Tibialis Anterior has the largest cross section and thus provides the most torque
(functional potential).
Table 2.1: Ankle Dorsiflexor Torques. (From Perry, 1992)
Dorsiflexor muscle activity is initiated in pre-swing, with contraction of the Extensor Hallucis
Longus. Peak activity of the dorsiflexors is in the initial swing phase until by midswing activity
decreases. Intensity of Tibialis Anterior rises again at Initial Contact, but by Loading Response
phase all muscle activity is terminated (Perry 1992).
Relative Dorsiflexor Torque (% Soleus) Tibialis Anterior 6.9% Extensor Digitorum Longus 2.7% Extensor Hallucis Longus 1.1%

21
Figure 2.6: Ankle Dorsiflexor muscle activity (adapted from Perry, 1992)
The Plantarflexors include 7 muscles which pass posterior to the ankle. The main plantar flexor
torque, however, is supplied by the Soleus and Gastrocnaemius which account for 93%, with the
remainder supplying only 7% torque. These muscles include the Tibialis Posterior, Flexor
Hallucis Longus, Flexor Digitorum Longus, Peroneus Longus and Peroneus Brevis (Perry 1992).
Table 2.2: Ankle Plantar Flexor Torques (from Perry, 1992)
The torque (functional potential) of ankle muscles is proportional to their physiological cross
section and leverage. The Soleus, being the largest ankle muscle, provides the most torque
(Table 2.2).
Ankle Plantar Flexor Torques Soleus 100% Gastrocnaemius 68.0% Tibialis Posterior 1.8% Flexor Hallucis Longus 6.1% Flexor Digitorum Longus 1.8% Peroneus Longus 2.4% Peroneus Brevis 1.0%

22
The Soleus and Gastrocnaemius, collectively known as the Triceps Surae, account for 93% of the
total plantar flexor torque (Perry, 1992). Soleus action starts slightly before the Gastrocnaemius,
towards the end of the Loading Response Phase, then continues throughout midstance. During
Terminal stance, both muscles action increases, with Gastrocaemius action stopping before
Soleus (Figure 2.7).
Figure 2.7: Ankle Plantarflexor muscle activity (adapted from Perry, 1992)
Neptune et al. (2001) have quantified contributions of individual ankle plantar flexors to support,
forward progression and swing initiation during walking. The authors concluded that throughout
single-leg stance both Soleus and Gastrocnaemius provide vertical support, in mid single-leg
stance Soleus and Gastrocnaemius have opposite energetic effects on the leg and trunk to ensure
23
support and forward progression of both the leg and trunk, and in pre-swing only
Gastrocnaemius contributes to swing initiation.
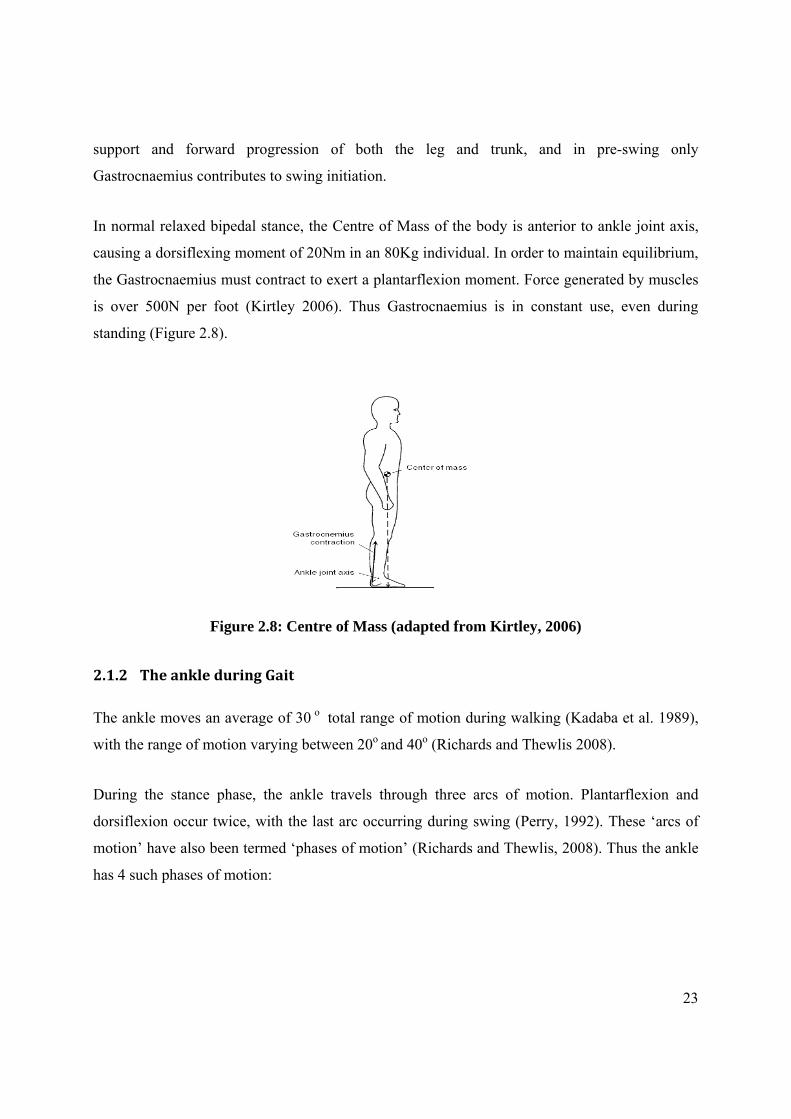
In normal relaxed bipedal stance, the Centre of Mass of the body is anterior to ankle joint axis,
causing a dorsiflexing moment of 20Nm in an 80Kg individual. In order to maintain equilibrium,
the Gastrocnaemius must contract to exert a plantarflexion moment. Force generated by muscles
is over 500N per foot (Kirtley 2006). Thus Gastrocnaemius is in constant use, even during
standing (Figure 2.8).
Figure 2.8: Centre of Mass (adapted from Kirtley, 2006)
2.1.2 The ankle during Gait
The ankle moves an average of 30 o total range of motion during walking (Kadaba et al. 1989),
with the range of motion varying between 20o and 40o (Richards and Thewlis 2008).
During the stance phase, the ankle travels through three arcs of motion. Plantarflexion and
dorsiflexion occur twice, with the last arc occurring during swing (Perry, 1992). These ‘arcs of
motion’ have also been termed ‘phases of motion’ (Richards and Thewlis, 2008). Thus the ankle
has 4 such phases of motion:

24
Figure 2.9: Ankle Range of Motion (adapted from Perrry, 1992)
Phase 1: At initial contact, the heel plantarflexes from neutral to 3o to 5 o until the whole
foot is in contact with the ground. This is also known as the ‘Heel Rocker”
Phase 2: Ankle begins to dorsiflex during the ‘second rocker’ until 10 o is reached
(Richards and Thelwis, 2008). Although this is the often-claimed required amount of
dorsiflexion for normal foot function, Weir and Chockalingam (2007) performed a study which
yielded ankle joint dorsiflexion value of between 12 and 22 degrees, with a wide variation
between subjects.
Phase 3: At the beginning of double support, the heel begins to lift and plantarflexes an
average of 20o, in the phase referred to as the ‘third rocker’, with the foot pivot being now under
the metatarsophalangeal joints. This is the period of active propulsion during which the
plantar flexors are actively contracting to push the foot into plantarflexion and thus propelling
the body forward.
Phase 4: During swing phase, dorsiflexion of the ankle allows the foot to clear the ground,
reaching a neutral position of 0o by mid swing (Richards and Thewlis, 2008).

25
2.2 Ankle vs Foot Dorsiflexion
The ankle plays an essential role during walking, being of strategic importance in human
physical activities (Leardini et al. 1999b). It is generally believed that dorsiflexion and
plantarflexion, occur mainly at this joint (Leardini et al. 1999b; Root et al. 1977). In fact,
practitioners refer to ‘Ankle joint flexibility’ (Nitz and Low Choy 2004), ‘limited ankle joint
dorsiflexion’, ‘ankle equinus’ and other analogous terms referring solely to ankle dorsiflexion.
The Degrees of Freedom (DOF) of the ankle joint has been debated for some time (Franci et al.
2009). Using 8 cadaveric feet in a jig with markers attached directly to the bones, it has been
shown that there is approximately 5o of movement between the talus and calcaneum during the
first 25% of the stance phase of gait (Hamel et al. 2004). During late stance, these two bones
rotate together and function as one unit. Leardini and colleagues have conducted extensive
studies on ankle joint modelling using a number of dissected limbs. Their conclusions indicate
that, during passive dorsiflexion, the ankle joint complex behaves as a single DOF system with
large sagittal motions occurring mostly at the tibiotalar joint, with very little sagittal plane
motion occurring at the subtalar joint (Leardini et al. 1999b; Leardini et al. 2001).
Work by Franci et al (2009) and Leardini et al. (1999a) supports further modelling of the human
ankle joint as a one-DOF spatial mechanism. Some of the acknowledged limitations of their
model were due to discrepancies caused by oversimplification of the articular surfaces and
modelling constraints (Franci et al. 2009).
Tuijthof et al. (2009b) analyzed the range of motion of the ankle using computed tomography.
Their findings also confirmed that nearly all dorsiflexion and plantarflexion occurs in the
talocrural joint, with increased inversion and axial rotation at this joint being prevalent only in
pathologic ankles. It was thus concluded that “Dorsiflexion/Plantarflexion is restricted to the
talocrural joint.”
One must, however, take into consideration that most of the above studies utilised a small
number of amputated limbs, with the limitations that result from these procedures. Leardini et al.
26
(1999b) (1999) and Leardini et al. (2001) utilised 7 dissected limbs, while Franci et al. (2009)
made use of “four skeleton-ligamentous lower leg preparations from lower limb amputation from
four different subjects.” These small sample sizes make it quite difficult to infer to larger
populations. Nonetheless, most work by this Italian group appears to strengthen the single DOF
hypothesis. Tuijthof et al (2009), on the other hand using in vivo techniques, used a larger
sample size of 10 males and 10 females, perhaps because of the relatively non-invasive
techniques employed. This group arrived more or less at the same conclusion as the Italian group
using different methodology.
It is important to differentiate between the Ankle Joint and hindfoot; the latter includes both
ankle and subtalar joint movements. Thus a 2-DOF model would include a hinge for each of the
two joints.
Although there is ample data to support the single DOF hypothesis, there is consensus that one
DOF kinematic models are inadequate for capturing the motion of the healthy hindfoot. It is
believed that 3 DOF or 2 DOF represent adequately the kinematics of the normal hindfoot during
walking (Liu et al. 1997). Van den Bogert et al. (1994) stress, however, that a 3DOF model
underestimates the loading of the tibia and fibula and overestimates the forces in the muscles.
On the other hand, besides ankle joint complex movement, Lundgren et al. (2008) have
demonstrated that, during gait, the medial column may actually produce more movement than
the ankle joint itself. In this study, which involved insertion of bone pins for more accurate
kinematic analysis utilising a 3D motion capture system, up to 17.6o of sagittal movement was
obtained in the medial column, as compared to ankle joint movement which was just 15.3o
(Lundgren et al. 2008). In an earlier study, although the talocrural joint was found to account for
most of the rotation around its axis occurring from 30o of plantar flexion to 30o of dorsiflexion,
there was a substantial contribution from the joints of the arch (Lundberg et al. 1989a).
Kitaoka et al. (1999) also obtained different results for the various foot segments. Maximum
normal calcaneal-tibial sagittal plane motion achieved was 19.3o ±1.6o, maximum normal
metatarsal-tibial sagittal plane motion 35.2 o ±4.5o, while maximum normal metatarsal-calcaneal
sagittal motion was 19.5o ±3.6o degrees. Others have reported significant sagittal range of
27
movement of various medial structures, including the 1st ray, talo-navicular joint, medial
cuneiform-navicular joint and first metatarsal-medial cuneiform joint. This latter accounted to as
much as 41% of total dorsiflexion of the foot (Roling et al. 2002).
Thus, because of the highly-segmented nature of the foot, which allows inter-segmental
movement, three models may thus explain dorsiflexion movement in the foot:
1. Pure ankle joint movement would mean the rotation of the talus within the ankle
mortise, with unresisted mobility being obtained by the sliding of the articular surfaces upon
each other (Leardini et al. 1998). Referred to as tibio-talar motion, this can be measured in vivo
using radiographic techniques or, as Leardini and co-workers have done, through dissection of
cadaveric feet. The talus rotates mostly in plantarflexion/dorsiflexion about the talocrural joint,
with an average range of 18◦ ± 4.7◦ (Hamel et al. 2004).
Radiographic techniques have the advantage that measurements can be done accurately and
subjects can be obtained more easily than amputated limbs. However, for routine clinical
assessment, exposure to X Rays makes this modality inappropriate except for very specific cases.
2. Hindfoot movement implies the combined movement of the ankle and subtalar joints.
This latter joint has a triplanar axis; consequently its movement must also be triplanar, i.e. in the
sagittal, transverse and frontal planes (Liu et al. 1997). The sagittal component of movement, i.e.
dorsiflexion/plantarflexion, would be combined with pure ankle joint dorsiflexion, resulting in
ankle joint complex dorsiflexion. This theory is rebutted by some authors, who concluded that the
ankle joint complex works as a single Degree of Freedom unit, thus meaning that subtalar joint
motion in the sagittal plane is almost negligible (Leardini et al. 1999; Leardini et al. 2001; Franci
et al. 2009; Tuijthof et al., 2009).
On the other hand, using 8 cadaveric feet in a jig with markers attached directly to the bones,
Hamel et al (2004) have shown that there is approximately 5o of movement between the talus and
calcaneus up to 25% of the stance phase of gait. During late stance, these two bones rotate
together and function as one unit.

28
3. Whole Foot Movement: The foot is made up of 26 bones with a synovial joint in
between each bone. The function of these joints is to facilitate adaptation to uneven terrain.
Along the medial column, besides the subtalar joint which is already mentioned above, there are
the first metatarso-cuneiform, the navicular-cuneiform and the talo-navicular joints, referred to
as the “Medial Pillar” (Roukis and Landsman 2003). Thus if just a little movement is allowed in
each of these joints, it is quite likely that their summation would be significant.
Among numerous studies that have published results regarding movement of the medial column,
Roling et al. (2002) have reported the following:
Sagittal 1st ray ROM: 6.4° (0.5°)
Sagittal talo-navicular joint ROM: 0.5°- 0.3° (9%);
Sagittal medial cuneiform-navicular joint ROM: 3.2°-1.2° (50%)
Sagittal first metatarsal-medial cuneiform joint ROM: 2.6°- 0.9° (41%)
As can be seen from these results, the movement of the Medial Pillar may be quite substantial.
More recently, Lundgren et al (2008) have demonstrated that the medial column may produce
more movement than the ankle joint itself. In this study, which involved insertion of bone pins
for more accurate kinematic analysis, up to 17.6o of movement was obtained in the medial
column, as compared to ankle joint movement which was just 15.3o. This supports an earlier
study in which, although the talocrural joint was found to account for most of the rotation around
its axis occurring from 30o of plantar flexion to 30o of dorsiflexion, there was a substantial
contribution from the joints of the arch (Lundberg et al. 1989a). It is important to state that in
these two studies, subjects were not controlled for hypermobility of the midtarsal joint, which is
a very frequent finding in flat feet.
Thus it is evident that foot dorsiflexion may consist of ankle (tibio-talar), subtalar (talo-
calcaneal [if the motion at this joint is significant at all]) together with the summation of all the
dorsiflexing movements of the joints distal to the tarsus, including the midtarsal joint, which is
composed of the talo-navicular and calcaneocuboid joints.

29
Sagittal plane foot-to-tibia movement (i.e. when the foot is described as a single segment) uses a
combination of calcaneal and metatarsal segments (Figure 2.11a). When analyzing Calcaneus-to-
tibia movement, the distal segment has been removed. The difference is notably in the amount of
plantarflexion; with whole foot movement there is more plantarflexion, implying movement in
the distal part of the foot (Figure 2.11b) (Richards and Thewlis, 2008).
Figure 2.10: A) Sagittal plane movement of tibia to foot. B) Sagittal plane movement of calcaneus to tibia (adapted from Richards and Thewlis, 2008)
Here one should note the significant work done by (Tiberio et al. 1989) and (Woodburn 1991)
who have demonstrated that ankle joint dorsiflexion measurement results vary significantly
between the various foot postures; in pronated feet an additional 10o are available during
dorsiflexion. These 10o cannot be accounted for as movement in the ankle joint; hence the joints
distal to the tarsus possibly account for this movement. Certainly, during measure ement
procedures, these 10o are likely to confound the issue. Placing the foot in neutral appears to
reduce these movements extraneous to the ankle joint complex, thus reducing this confounding
element and also supporting the podiatric theory that the midtarsal joint can be ‘locked’ and
‘unlocked’ by changing foot posture (Root et al. 1977).
In summary, it may be important to differentiate the 3 types of movements:
1. Ankle Joint Dorsiflexion
2. Ankle Joint Complex Dorsiflexion
3. Foot Dorsiflexion
This issue of ankle joint/foot dorsiflexion may actually be more complicated than this.

30
It is highly probable that the ankle joint behaves differently during non-weight bearing and
weight bearing activities. Using oblique lateral fluoroscopic images of non-weightbearing and
weightbearing dorsiflexion-plantarflexion activities, Yamaguchi et al. (2009) found that the
ankle joint was significantly more plantarflexed and adducted during the weightbearing activity
than the non-weightbearing activity. The ankle-subtalar joint complex was significantly more
everted, and the calcaneus showed significantly greater posterior position than the non-
weightbearing activity.
Thus, during the clinical measurement of ankle dorsiflexion, it is often unclear as to which of the
above 3 types of dorsiflexion is actually being measured.
At this stage, the act of measuring has not been assessed kinematically and thus during this
procedure what is actually being measured is not known and can only be assumed.
2.2.1 Conclusions
One should differentiate what kind of ankle dorsiflexion is under examination; whether
passive or weight-bearing dorsiflexion.
The type of ankle joint dorsiflexion appears to vary depending on function; in passive
motion, the ankle joint is reported to act as a single DOF joint, with very minimal sagittal
plane movement at the subtalar joint (Leardini, O’Connor, Catani, Giannini, 1999;
Leardini, Stagni, O’Connor, 2001; Franci, Parenti-Caselli, Belvedere and Leardini,2009;
Tuijthof et al., 2009).
important to differentiate the 3 types of movements:
o Ankle Joint Dorsiflexion
o Ankle Joint Complex Dorsiflexion
o Foot Dorsiflexion
Assessment of ankle joint dorsiflexion involves a different activity to dynamic motions
since it involves applying a force to a passive foot.
31
This procedure needs to be investigated further utilising kinematic analysis of foot
segment movement in order to determine exactly what is being measured.
2.3 Ankle Equinus
Definition:
Main Entry: talipes equi·nus1
Pronunciation: - ek-wi-n s
Function: noun: a congenital deformity of the foot in which the sole is permanently flexed so
that walking is done on the toes without touching the heel to the ground.
Ankle Equinus
Definition: Ankle equinus is a sagittal plane deformity in which there is less than 10° of available
dorsiflexion at the ankle joint, when the subtalar joint is in its neutral position and the midtarsal
joint is fully locked.2
2.3.1 Ankle dorsiflexion necessary for normal walking
It is claimed that during normal locomotion, 10o of ankle dorsiflexion is required for the forward
translation of the centre of gravity of the body to occur during single limb support (Root et al.
1977). At this time, during the stance phase of gait, the body passes over the weight bearing foot.
This forward translation occurs in the sagittal plane, which is said to occur using a 3 rocker
system to permit advancement (Perry 1992). This sagittal plane movement at the ankle occurs
during the 2nd rocker (Dananberg 2004).
According to Tiberio (1987), between 5o and 15o are necessary for walking. Sullivan (1997)
emphasizes that 15o are necessary, with anything less producing compensations and foot
adaptations leading to pain and deformity. A trial investigating kinematics of ankle dorsiflexion
1 Merriam-Webster Medical Dictionary 2 Root et al. 1977
32
during gait produced results between 12o and 22o (Weir and Chockalingam 2007). The authors
concluded that, during gait, ankle joint dorsiflexion in normal subjects is greater than the value
traditionally reported.
In an attempt to establish a normal range of ankle joint dorsiflexion, Baggett and Young (1993)
measured ankle dorsiflexion in the non-weight bearing and weight bearing positions; the former
using the normal goniometer and the latter utilising the Lunge Test, which involves the subject
leaning against a wall with the trailing foot held against the ground and the ankle angle (from the
ground to the tibia) measured with a goniometer. The normal ranges obtained were established as
0o to 16.5o non-weight bearing and 7.1o to 24.7o weight bearing. This study shows poor
correlation between the two measurements and the authors questioned the clinical relevance of
the standard non-weight bearing measurement. However, one should note that the Lunge Test
may not be representative of normal gait as the subject is leaning too far forward. The authors
did, however, conclude that, because of the population’s variability, instead of a single number
of required degrees, a range of normal should be considered.
Saxena and Kim (2003) studied a group of 40 adolescent athletes (16 girls and 24 boys) with a
mean age of 14.8 yrs +/- 0.8years. “0°” was defined as a 90° relationship between the lateral
border of the foot and the long axis of the leg. Ankle dorsiflexion was measured at subtalar joint
neutral position, using a goniometer aligned with the lateral border of the foot and the long axis
of the leg, with the subjects lying supine, first with the knees extended, then flexed. Dorsiflexion
of the right ankle was 0.35° ± 2.2° with the knee extended and 4.88° ± 3.23° with the knee
flexed. The values for the left ankle were –0.6° ± 2.09° and 4.68° ± 3.33°. There were no
statistically significant differences between the sexes. Conclusion was that average ankle
dorsiflexion in asymptomatic athletes was 0o with the knees extended and 5o with the knees
flexed. They concluded that some degree of equinus is “normal” in adolescent athletes. These
results show an influence of the gastrocnaemius since knee position affected the results; perhaps,
being athletes, their gastrocnaemius was more developed than the average.
In a study of 82 children with injured ankles, Tabrizi et al (2000) reported mean dorsiflexion
values of 5.7° with the knee extended and 11.2° with the knee flexed. In 85 controls, dorsiflexion

33
was 12.8° and 21.5°. However, to what extent the ankle injuries could have limited the amount
of dorsiflexion is unclear.
Using a flexible electrogoniometer, Moriguchi et al. (2007) obtained mean dorsiflexion angles of
24o for the left and 19o for the right foot during Toe-Off. The main difference between this and
the trials described above is that the former was taken dynamically, while the other trials
reported static, passive, non-weightbearing results.
Studying a population with an average age of 25 years, in which ankle dorsiflexion was
measured with the foot supinated, Grady and Saxena (1991), found values of 3° with the knee
extended and 9° with the knee flexed. This differs from the later study by Saxena and Kim
(2003); in the latter the foot was not kept in any specific position so other joints could have
dorsiflexed as well (Lundgren et al. 2008), making comparison difficult. Notwithstanding this,
the value of 3° and 9° compare quite well with that of 0° and 5° with knees extended, then flexed
respectively. The authors themselves admit that one of the limitations of the study was the
goniometric assessment, which is very subject to evaluator variability and thus raises questions
as to the validity of the measurement (Saxena and Kim 2003).
2.3.2 Ankle Equinus
If 10o of dorsiflexion are not available, Equinus is said to be present. This condition has also
been referred to as limited ankle dorsiflexion, gastrocnaemius equinus, equinus contracture,
functional equinus and ankle equinus. Although there appears to be no clear definition of
equinus, with opinions ranging from 0o (Lavery et al. 2002), < 5o of dorsiflexion (Johnson and
Christensen 2005), <10o (Rome 1996) and even <20o (Brantingham et al. 2006), there is
universal consensus that it is a reduction in the range of dorsiflexion movement of the ankle joint
(Charles et al. 2010; Digiovanni et al. 2001; Johnson and Christensen 2005). It is clear that there
is a lack of established baseline values in literature (Saxena and Kim 2003) and thus a need for
consensus regarding criteria for definition and diagnosis. This is further complicated by an
absence of a standardized method for measuring dorsiflexion range of motion at the ankle
(Charles et al. 2010).

34
DiGiovanni et al (2002) defined Equinus as <5° of ankle dorsiflexion with the knee extended or
<10° with the knee flexed and used the term ‘gastrocnaemius tightness’. Adhering to this
definition would mean that all the subjects in Tabrizi et al (2000), Grady and Saxena (1991), and
Saxena and Kim (2003), had Equinus. However, all subjects in the latter study were
asymptomatic young, health athletes.
Charles et al. (2010) argue that without any prospective studies to determine the effects of
different levels of restriction of dorsiflexion, it is difficult to define a particular range of motion
below which a definition of equinus can be justified. If a valid and reliable tool, which is
essential for diagnosis, is available, Charles et al. (2010) propose a two-stage definition:
Stage 1: <10o of dorsiflexion, indicating minor compensation and minor increased
forefoot pressure
Stage 2: <5o of dorsiflexion, indicating major compensation and major increased forefoot
pressure
Immediate shortcomings of these definitions become apparent: there is no scientific backing for
this definition and increased forefoot pressure may not necessarily result solely from ankle
equinus; for example, the forward migration of the fibro-fatty tissue underneath the
metatarsophalangeal joints could also account for such an increase in forefoot pressure. This also
implies that to arrive at a diagnosis of equinus, foot pressure mapping apparatus would have to
be available.
2.3.3 Causes of Equinus
The commonest cause of Equinus is tightening or shortening of the
gastrocnaemius/soleus/Achilles tendon group (the triceps surae), causing premature activity of
ankle plantarflexors (Perry 1992). In fact, the term muscular ankle equinus (Hill 1995) has been
coined. This is thought to result from modern lifestyle factors in the daily environment, which
put patients at risk of developing this condition. These factors include sleeping with the feet in a
plantarflexed position for 6-10 hours daily, sitting for long hours at desks with the knees flexed
and the feet in an equinus position and overtraining of muscles at the gym (Hill 1995). Even
during standing, the gastrocnaemius is being used to maintain the centre of gravity anterior to the

35
ankle joint axis (Kirby 2000; Kirtley 2006) and to oppose the dorsiflexing moment imposed on
the foot (Kirtley 2006).
Equinus may also be caused by a bony blockage of the trochlear surface of the talus as its
widened anterior part is trapped between the ankle mortise formed by the tibia and fibula. This
can be caused by osseous deformity or lack of widening of the mortise that receives the
dorsiflexing talus secondary to failure of translation of the fibula (Dananberg et al. 2000).
Equinus may be the result of neurophysiological impairments which result in clonus (which is an
abnormal pattern of neuromuscular activity, characterized by rapidly alternating involuntary
contraction and relaxation of skeletal muscle3) and hyperreflexia (increased reflex reactions1) of
the musculature crossing the ankle (Maurer et al. 1995). It is the commonest deformity in
cerebral palsy (Borton et al. 2001) and also commonly found in stroke (Fuller 1998).
The passive or active properties of the tissues that contribute to the moment around the ankle
provide the aetiological origins of this condition. The active components are clinically
manifested by voluntary movement, dynamic spasticity and/or hypertonicity, while the passive
components arise from the passive properties of soft tissues crossing the ankle joint, contracture,
or joint exostosis (Maurer et al. 1995).
2.3.4 Diagnosis of Ankle Equinus
Diagnostic criteria for ankle equinus are based on a non-functional static examination where the
foot is manipulated passively (Maurer et al. 1995). As initially outlined by Root et al. (1977), the
foot is placed at subtalar joint neutral position and the stable arm of a clinical goniometer is
aligned along a bisection of the lower lateral aspect of the leg. The other arm is placed along the
lateral border of the foot and a dorsiflexing force is applied to the forefoot until the foot is
maximally dorsiflexed.
This measurement is performed initially with the knees extended. If insufficient foot dorsiflexion
results, an adaptation of the original Silvferskiold (1924) technique is employed. The
3 Mosby's Medical Dictionary, 8th edition. 2009. Elsevier. 1 Merriam-Webster Medical Dictionary
36
measurement is repeated with the knees flexed in order to determine the muscular cause of the
condition, i.e. whether it is caused by gastrocnaemius or soleus tightening. Since the
gastrocnaemius inserts proximal to the knee joint, its effect on foot dorsiflexion is most when the
knee is extended and hence the muscle becomes tight. Flexion of the knee reduced this tightness
and thus the influence of the gastrocnaemius on foot dorsiflexion.
From literature, it emerges, that this method of assessment is highly unreliable as it introduces a
variety of potential sources of error (Charles et al. 2010). (Ref to Section 2.4.2: Un/Reliability of
Goniometric Measurements)
2.3.5 Incidence of equinus
It is difficult to estimate the true prevalence of ankle equinus (Charles et al. 2010; Digiovanni et
al. 2001) since there is no universally-accepted definition of this condition and no standardized
test for establishing the range of ankle joint dorsiflexion (Charles et al. 2010).
Most research concentrates on neurologically-induced equinus. However, the greatest incidence
appears to be that of mild equinus which appears to affect a large percentage of the population
(Hill 1995). There is very little literature on the impact of isolated gastrocnaemius contracture in
‘normal’ otherwise unaffected patients, which may be more subtle to detect (Digiovanni et al.
2002). 176 of 209 consecutive new patients were examined for the presence or absence of
equinus deformity over a 6 week period by Hill (1995). 96.5% exhibited restricted ankle
dorsiflexion requiring compensation during gait. Thus the effect of ‘mild’ equinus is not being
given the interest it deserves. Possibly being present in a large population, it may actually be the
most harmful form of the condition overall if numbers are taken into account, causing a
significant burden on patient health.
2.3.6 Effects of Equinus
Lack of ankle dorsiflexion is compensated for by altering gait, including early heel-off in mild
cases (bouncy gait) or even a total lack of heel strike in severe cases (such as in cerebral palsy)
(Maurer et al. 1995); triplanar rearfoot motion (pronation) and an adducted gait pattern (Harris
and Beath 1948; Root et al. 1977). Equinus can be uncompensated, with the patient walking on
37
the toes, or compensated by various methods, including foot abduction, significant pronation of
the mid foot and rearfoot, resulting in the loss of the medial longitudinal arch and abduction of
the forefoot (Sullivan, 1997).
Once the ankle is restricted, the midtarsal joint is the next joint through which dorsiflexion may
occur. This is achieved by excessive pronation of the foot (Dananberg, 2004), which turns it into
a mobile adaptor to facilitate dorsiflexion at this joint. Forces on the midtarsal joint may
eventually lead to the midfoot break and significant structural foot problems (Harrison, Carmont
and Walsh, 2001).
Slight-to-moderate limitation of ankle passive dorsiflexion range of motion has been reported to
significantly alter the timing, but not the magnitude, of frontal plane rearfoot motion during
walking (Cornwall and McPoil, 1999).
Equinus, which is a type of sagittal plane blockage, has been claimed as being a significant
causative factor of a variety of lower extremity conditions (Root et al. 1977). The deleterious
effect of equinus has been recognized throughout the years, with several old trials, cited by
Allinger and Engsberg (1993), implicating limited ankle joint complex motion as a possible
cause for injury.
Several overuse injuries of the lower extremities associated with limited ankle dorsiflexion
include:
o low back pain,
o hyperextended knees (and consequently various knee problems such as arthritis),
o hallux rigidus,
o calcaneal spurs (Wrobel et al. 2004)
o foot nerve entrapment (Barrett and Jarvis 2005)
o Achilles tendinopathy (Kaufman et al. 1999)
o Patellofemoral pain syndrome (Lun et al. 2004)
o Posterior Tibial Tendon Dysfunction (Hill 1995)
o plantar fasciitis (Riddle et al. 2003)
o metatarsalgia due to forefoot loading (Bardelli et al. 2003; Subotnick 1971)

38
o forefoot callus (Sgarlato et al. 1975b).
In a study of 1666 consecutive people with diabetes, Lavery et al (2002) found that those with
equinus had significantly higher peak plantar pressures than those without. Elevated plantar
pressure is considered a significant risk factor in the development of diabetic foot wounds (Pham
et al, 2000; Lavery et al. 1998). They defined equinus as 0o dorsiflexion or less. Had they used
the 10o criteria, they claim that they would certainly have found a higher percentage of affected
patients. Equinus is a significant condition in Type 2 diabetes, resulting from increased
glycation of proteins which may contribute to reduced range of motion (Muellenbach et al.
2008).
Although highly evident equinus may be a presentation of neurological conditions, including toe
walking (Sobel et al. 1997) and cerebral palsy (Allington et al. 2002) the milder form of equinus
is not normally evident except through a thorough lower limb examination. This form of equinus
can affect anyone, from diabetics (Pham et al, 2000), adolescent athletes (Saxena and Kim 2003)
to children (Evans and Scutter 2006).
Balance and gait is affected in neurological conditions (Borton et al. 2001).
2.3.7 Treatment of Equinus
Muscular ankle equinus (i.e. where posterior muscle group tightening is present) may be
managed by the use of stretching of the posterior group of muscles, surgical lengthening of the
Achilles tendon and release of the gastrocnaemius aponeurosis endoscopically (Downey and
Banks 1989; Saxena 2002). Botox A has been used successfully in the management of equinus in
Cerebral Palsy.
Gastrocnaemius stretching has been demonstrated to be quite effective in increasing ankle
dorsiflexion. Stretching exercises, casting and night bracing have been utilised to this effect.
Stretching has been shown to be safe in diabetic patients by the use of foot pressure
measurement, since the act of stretching itself may increase foot pressure and hence an increase
in the likelihood of developing diabetic ulceration. Meanwhile, Radford et al. (2006), in a meta-
39
analysis, showed that calf muscle stretching provides a small and statistically significant increase
in ankle dorsiflexion. However, it was unclear whether the change is clinically important or not.
Manipulation methods have been used to gain an increase in ankle dorsiflexion (Dananberg
2004; Dananberg et al. 2000). Although criticized by Menz (2001), Dananberg claims that this
increase in ankle dorsiflexion is instantaneous. The duration of this effect, however, is unknown,
with the likelihood that this manipulation method has to be repeated often.
Once there is failure of conservative treatment, which includes physiotherapy, ankle foot
orthoses, casting and Botulinum Toxin A, surgical intervention is indicated (Borton et al. 2001).
Tendo Achilles Lengthening (TAL) has been shown to be effective in the management of
forefoot ulceration in diabetic patients with an equinus deformity that failed to heal with total
contact casting alone. It reported the successful healing of the primary ulcer, a 19o increase in
ankle dorsiflexion and no recurrences (Lin et al. 1996). Another trial suggests that TAL causes a
temporary reduction in forefoot pressure primarily by reducing PF power during gait (Maluf et
al. 2004).
2.3.8 Conclusions
Definitions of ‘Equinus’ are rather conflicting.
The traditional ‘orthopaedic definition’ is of a plantarflexed foot with the patient
walking on the forefoot and the heel off the ground.
‘Other’ definitions of 0o, <5o, <10o and <20o have been made by various authors,
however with no clear consensus being reached
Standardization on the use of the term equinus is being proposed: the term equinus
should indicate the condition with the ‘orthopaedic definition’, while ‘limited ankle
dorsiflexion’ should reflect the ‘other definitions’ in milder conditions.
Reliability of current accepted clinical methods to measure ankle dorsiflexion is quite
poor, thus making diagnosis difficult.
This condition is quite important clinically, affecting a spectrum of pathologies
Equinus may go unnoticed by a number of practitioners.
40
Prevalence of the condition may be quite significant, however in the absence of
reliable measuring devices, this cannot be known.
It is this author’s contention that the term ‘equinus’ should be reserved for the foot
that does not reach 0o of dorsiflexion, i.e. it is in a plantarflexed position. There do
not appear to be any issues regarding this terminology in orthopaedic literature and
the dictionary definition is quite explicit in that in equinus “the sole is permanently
flexed”. The term ‘limited ankle dorsiflexion’ may be more appropriate when there is
<10o of dorsiflexion. This does not imply neurological disease and the condition is
most often structural, or biomechanical, in origin.
Thus, during this dissertation, the term ‘equinus’ or ‘limited ankle dorsiflexion’ will
imply the non-neurologically induced variety of this condition, referred to as ankle
equinus, functional equinus or limited ankle dorsiflexion, in which there is <10o of
foot dorsiflexion.
2.4 Clinical Examination for ankle dorsiflexion
Ankle joint movement examination may be performed using various methods. The procedures
mostly used in clinics and research include goniometry (Gastwirth 1996) and visual estimation
(Digiovanni et al. 2001). This may be because goniometers can be found easily in clinics and are
relatively inexpensive.
2.4.1 Goniometric Procedure of Ankle Dorsiflexion Measurement
During goniometric examination of ankle joint movement, one arm of the goniometer is placed
along a bisection of the lateral aspect of the lower leg, and the other arm along the lateral margin
of the foot (Gastwirth 1996; Root et al. 1977). The subtalar joint is held in neutral position, with
the midtarsal joint locked by application of force on the 4th and 5th metatarsophalangeal joints in
order to pronate the midtarsal joint. It is assumed that once the midtarsal joint is locked, the
remaining movement is only at the ankle joint (Root et al. 1977). An upward force is applied
until the maximum ankle joint range of motion is reached. This examination is initially done with
the knee extended and then with the knee flexed in order to differentiate between gastrocnaemius
(the former) and soleus tightening (Valmassy 1996).

41
This method of ankle range of motion assessment is generally accepted, so much so that there are
various textbooks outlining this procedure, and various research (including published papers) has
been carried out utilising this methodology (Johanson et al. 2006a; Johanson et al. 2006b;
Wessling et al. 1987). However, there is ample evidence in literature nowadays that goniometry
is not reliable as this method introduces a variety of potential sources of error which, according
to Charles et al. (2010) include:
Positioning of the knee affecting the range of motion of the ankle
Range of Motion affected by tension in the soleus muscle, bony limit or the end of range
of the ligaments
Patient position: whether the patient is sitting or lying down (Thoms and Rome 1997)
Subtalar joint position (Tiberio et al. 1989; Woodburn 1991)
Movement of the midfoot or rearfoot compromise measurements (Digiovanni et al. 2001)
There is a need for devices that produce reliable (i.e. reproducible) results (Charles et al. 2010).
Thus the need for various alternative methods has been felt, with specialized devices being
designed and manufactured specifically in order to measure ankle joint dorsiflexion. Such
devices include the Biplane Goniometer (Donnery and Spencer 1988), the Equinometer (Weaver
et al. 2001), and the Mechanical Equinometer (Meyer et al. 2006) among many others. (Chapters
3 and 4).
2.4.2 Un/Reliability of Goniometric Measurements
Although goniometric measurements by health care professionals have become common
practice, literature has challenged the reliability of these measurements for quite some time.
Even though the hand-held goniometer has introduced quantification (Woodburn et al. 2002) it
has major drawbacks in measuring ROM; goniometric reliability is unproven with reliability
studies often having major flaws in design or analysis (Jordan et al. 2001). In fact, goniometry
has also been shown to be unreliable for rearfoot assessment (Ball and Johnson 1993; Buckley
and Hunt 1997).
42
Nowadays there still exists confusion as to the correct maximal dorsiflexion values, resulting in a
lack of determination for the reliability of clinical examination for correctly identifying this
condition (Digiovanni et al. 2002). With ankle joint dorsiflexion being such an important issue
for both the clinician and researcher, a few studies aimed at investigating reliability issues with
these measurements have been published.
Digiovanni et al. (2001) have found that practitioners’ ability to diagnose ankle equinus
depended on whether equinus was defined as <5 degrees (75%) or <10 degrees (100%) in
equinus patients, while in non-equinus patients these values increased from 75% to 93.8% in <5
degrees, and decreased to 50% in <10 degrees. Thus reliability not only changed from how much
equinus was defined, but also varied depending whether equinus was actually present or not.
On the other hand, on the basis of a literature review, Martin and McPoil (2005) concluded that
the responsiveness of ankle range of motion measurements is uncertain and further studies using
actual patient populations are required.
There are no doubts that there are important questions that need to be raised regarding these
measurements. An obvious conclusion appears to be that reliability increases with training and
experience (Pierrynowsky et al. 1996), yet apparently no amount of training can make this
measurement accurate enough to warrant Van Gheluwe et al. (2002) to recommend it to be used
for clinical practice. In fact, they conclude that the differences between examiners (i.e. inter rater
reliability) “may be clinically unacceptable”. In fact, Kim et al. (2011) have researched the
relationship between experience and reliability and, in contrast with Pierrynowsky et al.,
surprisingly concluded that rater experience does not increase reliability.
In order to try to solve this reliability problem, using a modified Lidcombe Template,
Scharfbillig and Scutter (2004) claimed excellent reliability for both intrarater and interrater
reliability using Intraclass Correlation Coefficient (ICC) model (1,1) and Standard Error of
Measurement (SEM) calculations from their subject population.
As with any other clinical examination, it is clear that accuracy and reliability of ankle joint
dorsiflexion measurement is of paramount importance. This state of unreliability is unfortunate

43
for the researcher and clinician. Hence it could be possible that some patients may be treated for
a non-existent condition, or else not treated for this condition if the measurement error is too
large. Not only that, but apparent improvement in a treatment regime might not be anything more
than errors in measurement.
Goniometric reliability is also compromised by placement of the goniometer. The main
anatomical sites appear to be the lateral head of the fibula and the lateral malleolus for the stable
arm and the plantar aspect of the foot to the 5th metatarsophalangeal joint for the other arm. It is
very easy for any of the two arms to move when the foot is being placed at subtalar joint neutral
and a dorsiflexing force is applied, thus altering the result.
Another issue is the documental unreliability of obtaining subtalar joint neutral itself (Elveru et
al. 1988). This appears to be critical since Tiberio et al. (1989) and Woodburn (1991) have
shown that measuring ankle dorsiflexion with the subtalar joint in a pronated position increases
total dorsiflexion by as much as 10 degrees – enough to classify anyone with equinus as not
having this condition, and vice versa.
Besides establishing subtalar joint neutral position, patient position also appears to be an
important factor. Since ankle dorsiflexion may potentially be assessed by a number of different
researchers, the patient position may reflect on the resultant ankle dorsiflexion. This was
confirmed by Thoms and Rome (1997), whose paper demonstrates that, while a prone or supine
patient position does not affect the result, sitting does.
An significant factor for obtaining reliable ankle measurement appears to be the amount of
dorsiflexing force that is applied by the examiner. According to Assal et al. (2003) and Charles et
al. (2010), applying the correct torque is essential since the resultant angle is dependent on this.
The torque applied to the ankle joint complex might vary between one examiner and another, or
between one examination and another, thus exerting unequal forces on the gastrocnaemius. The
stretching characteristics of the triceps surae themselves may vary depending on other intrinsic
or extrinsic factors, such as heat (Knight et al., 2001).

44
It is clear that there are various things that can go wrong during ankle joint complex dorsiflexion
measurement, so much so that research in this area has criticized this measurement, claiming that
it is unreliable and clinically unacceptable (Van Gheluwe et al. 2002).
According to Maurer et al. (1995), it is unfortunate that diagnosis is based on a non-functional
static examination where the foot is manipulated passively. This emerges as clearly the foot is a
functional mechanism that needs to be assessed during gait, i.e. when it is functioning.
Clinically, it is often difficult to assess (Maurer et al. 1995) thus it is clear that this issue needs to
be tackled, for example by developing and validating a tool to confirm/disprove the clinician’s
physical assessment, which to date only includes goniometric measurements.
2.4.3 Conclusions
It becomes apparent, from the above literature on reliability, that
an alternative to goniometric measurement is necessary in order to increase reliability of
the examination of ankle dorsiflexion.
Although it has been pointed out that ideally ankle dorsiflexion should be measured
dynamically, the need for a clinical assessment will always be present, mainly because it
is impractical to examine each and every patient using expensive and time-consuming
gait analysis techniques.
45
2.5 Kinematic Analysis
Kinematics, which is the study of bodies in motion, is concerned with describing and quantifying
both the linear and angular positions of bodies and their time derivatives. Commonly, collecting
kinematic data involves the use of imaging or motion-capture systems that record the motion of
markers affixed to a moving body or segment. The position of these images are then digitized to
obtain the 3D coordinate (i.e. in X, Y and Z planes) of each marker. A mathematical model and a
graphical representation of the body under study would then be constructed using specialized
software and the output data used for various applications, such as measuring joint angles.
A variety of markers are available and their use is dependent on the system being utilised. Such
markers include passive reflective markers used by Vicon, APAS, Simi and active Infrared
Emitting markers such as used by Optotrak (Robertson and Caldwell, 2004). All systems have
their own advantages and disadvantages, with cost being a major consideration when deciding
which system to use.
Traditionally, kinematic analysis of the foot involved a single DOF model which represented the
foot as a rigid lever (Liu, Siegler, Hillstrom and Whitney, 1997; Davis, Ounpuu, Tyburski and
Gage, 1991). This has been generally accepted as being insufficient to capture 3D foot motion
and it is believed that 3 DOF or 2 DOF represent adequately the kinematics of the normal
hindfoot during walking (Liu et al. 1997).
The difficulty was due to problems with tracking small, closely clustered markers. Dynamic in
vivo measurement is quite difficult to achieve because of the foot’s complex structure (Carson,
Harrington, Thompson, O’Connor and Theologis, 2001).
A number of foot models were developed in order to understand foot function better during gait.
One such model was an anatomically based, five-segment shank-foot model which consisted of 5
rigidly-assumed segments that included the shank (tibia and fibula), the calcaneus, mid-foot
(navicular, lateral, middle and medial cuneiforms and the cuboid), 1st metatarsal and the
proximal phalanx of the hallux (Leardini et al. 1999).

46
Another foot model was the Oxford Foot Model (Carsonet al. 2001) which divides the foot into
tibial, hindfoot, forefoot and hallux segments. This is dealt with in more detail in Chapter 5 as it
has been utilized for research throughout this thesis.
The Heidelberg Foot Model is another foot model which was also developed to provide a
kinematic measurement method for the foot that could be applied clinically. This model did not
rely solely on rigid segment modeling, but described the angular orientations of anatomical
landmarks that sometimes spanned more than one anatomical joint (Simon et al. 2006).
Figure 2.11: Marker placement for the Heidelberg Foot Model (Adapted from Simon et al,
2006)
Mosely et al. (1996) used a much simpler approach. Utilising just 8, 1cm-diameter markers, they
modelled the rearfoot and leg as two rigid segments (Figure 2.14)

47
Figure 2.12: marker placement used to define the rearfoot and leg segments (Adapted from Moseley et al, 1996)
Liu et al. (1997) defined Neutral position of the ankle for plantarflexion/dorsiflexion as 90o
between the plantar aspect of the foot and the long axis of the fibula.
Figure 2.13: Setup used to position hindfoot in neutral position (Adapted from Liu et al, 1997)
When waveforms from different subjects were compared, only dorsiflexion/plantarflexion
showed a coefficient value above 0.7, indicating that in this direction the waveform has similar
trends between subjects (Liu et al. 1997)

48
2.5.1 Kinematic analysis of the Ankle Joint complex
The motion of the Ankle Joint Complex (AJC) occurs at both the talocrural and talocalcaneal
joints. Their combined motion has components in all three planes (Liu et al. 1997; Moseley et al.
1996). However, the general hypothesis is that the talo-crural joint contributes very little to
calcaneal inversion and eversion (Siegler et al. 1988). Assumptions are made that sagittal plane
movements, i.e plantarflexion/dorsiflexion occur largely through the talo-tibial joint (Woodburn
et al. 2002). These assumptions have been largely validated through the work of Leardini et al.
(1999b), Leardini et al. (2001) and Franci et al. (2009) who modelled the ankle joint as a one
Degree of Function mechanism.
The main problem associated with modelling the Ankle Joint Complex, i.e. the ankle and
subtalar joint, is the difficulty of measuring directly the motion of the joints separately because
bony landmarks are deep to other tissues and the complexity of the triplanar movements in these
joints (Moseley et al. 1996; Youberg et al. 2005). The rearfoot is considered to be composed of a
single articulation because of the absence of a specific landmark on the talus (Scott and Winter
1991)). Using conventional movement analysis techniques, it is difficult to distinguish
movement at the two articulations (Moseley et al. 1996).
Using separate segments to model a foot, it is assumed that the individual bones within that
segment do not move relative to each other, which appears to be unlikely (Nester et al. 2007).
This could result in incomplete description of foot kinematics because certain foot bones are
excluded during the measurements. Of particular interest is the talus which is not accessible
except through an invasive approach (Lundgren et al. 2008).
Further issues continue to complicate the matter. These involve skin movement artefacts which
possibly may reduce the validity of kinematic data (Cappozzo et al. 1996; Reinschmidt et al.
1997). To overcome this problem, bone markers are sometimes used. These are inserted directly
into the bones under local anaesthesia so that they reflect purely skeletal movement and
eliminate any skin movement (Lundgren et al. 2008). However, this would naturally raise
significant ethical issues in many European countries. Furthermore, the use of an invasive
approach for kinematic analysis for clinical reasons would be highly debatable. In order to
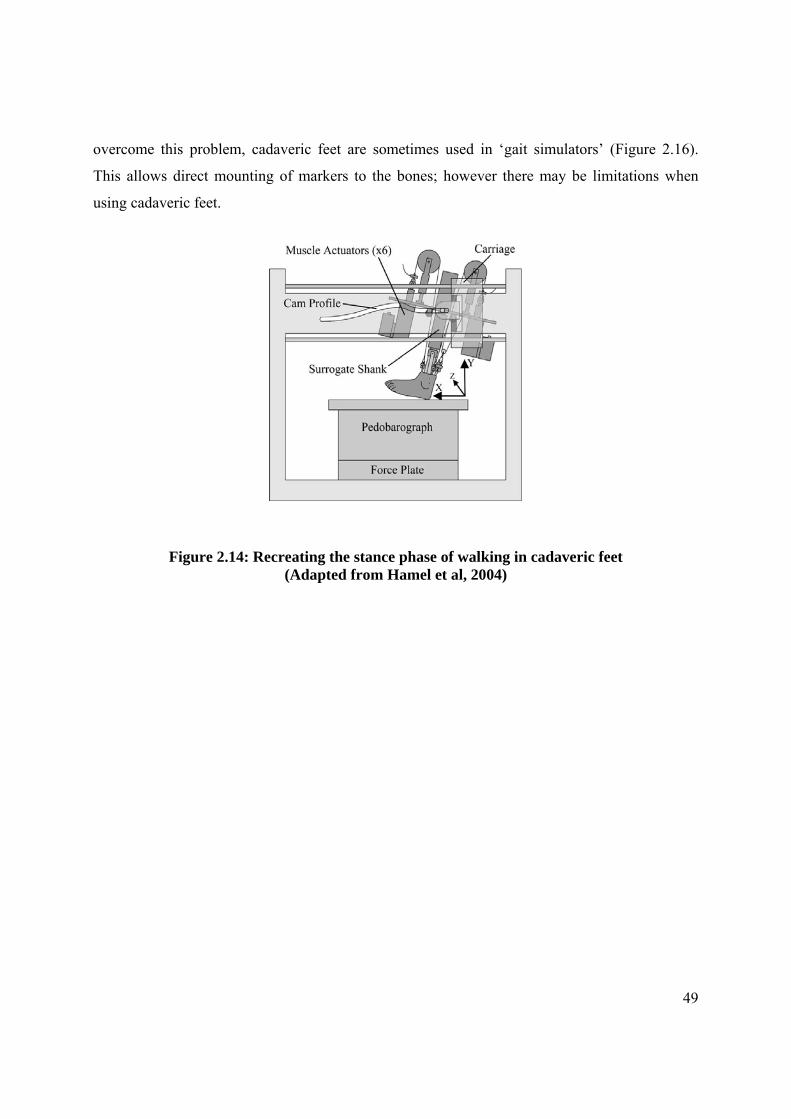
49
overcome this problem, cadaveric feet are sometimes used in ‘gait simulators’ (Figure 2.16).
This allows direct mounting of markers to the bones; however there may be limitations when
using cadaveric feet.
Figure 2.14: Recreating the stance phase of walking in cadaveric feet
(Adapted from Hamel et al, 2004)

Chapter 3
A Systematic Review of Ankle Joint Dorsiflexion Measurement
Techniques in the Nonneurological patient
Aspects of this chapter have been published:
Gatt A, Chockalingam N. 2011. Clinical assessment of ankle joint dorsiflexion: A review of measurement techniques. Journal of the American Podiatric Medical Association. 101(1): 59-69
51
3.0 Introduction
This chapter will present the methodology and findings of a systematic review on ankle joint
measurement techniques. This was an essential primary requirement aimed at acquiring a deeper
understanding of these techniques, finding common grounds and identifying issues that govern
the subject matter.
Diagnosis of Ankle Equinus is based solely on measurement, which is often made by
goniometric examination of the ankle range of motion (Gastwirth 1996; Root et al. 1977). It thus
becomes immediately obvious that accuracy and reliability of ankle joint dorsiflexion
measurement is of paramount importance. Unfortunately for the researcher and clinician, the
unreliability of these goniometric measurements has been established by various authors (Martin
and Mcpoil 2005; Rome 1996; Van Gheluwe et al. 2002). As a consequence of possible mis-
diagnosis through unreliable goniometric techniques, some patients may be treated for a non-
existent condition, or else not treated for this condition if the measurement error is too large.
Apparent improvement in a treatment regime might not be anything more than errors in
measurement.
This unreliability may arise due to several factors mostly based on wrong techniques, as
discussed in section 2.4.1.
Since there is a plethora of studies utilising ankle dorsiflexion assessment as an outcome
measure, it is extremely important to establish to what extent factors affecting reliability also
influence available results. It is evident that these issues are central to good research and clinical
practices.
Prior to embarking on a comprehensive research programme, it is essential that available
information is collated in order to bring the investigators up to date with research carried out in
the field. As one of the principal aims of this project was to produce a valid and reliable Ankle
Goniometer, similar devices had to be investigated in order to assess their strengths and
weaknesses, thus determining whether such an alternative apparatus is in fact necessary. It is
currently known that besides the goniometer technique, there are other techniques to measure
52
ankle dorsiflexion, such as the equinometer (Assal et al. 2003; Digiovanni et al. 2001; Weaver et
al. 2001) and various variations of the Lunge Test (Bennell et al. 1998; Menz et al. 2003).
In view of this, a systematic review was performed in October 2008 to, mainly, establish the
various ankle dorsiflexion techniques in existence to date.
3.1 Systematic Reviews
Systematic reviews are increasingly being used to summarize research evidence. As opposed to
narrative reviews, which are known to suffer from a lack of rigor in their creation (Hemingway
and Breretron 2009), systematic reviews are performed through a comprehensive search for
primary studies with a well-defined clinical question. This method of reviewing has a
reproducible protocol, with an established process for searching studies, their critical appraisal
for quality and the production of results (Pai et al. 2004). Statistical methods (meta-analysis)
then may or may not be used to analyze and summarize the results of the included studies
(Torgerson 2003).
With the increased shift towards Evidence Based Medicine, systematic reviews provide the
highest level of evidence for medical decision making (Editors 2007 ) (PLOS medicine editors,
2007), making them a cornerstone for Evidence Based Medicine (Whiting et al. 2003). An
increased need for wide-ranging information by the various health professionals causes a
resultant need for good quality information on the effectiveness, meaningfulness, feasibility and
appropriateness of a large number of interventions (Hemingway and Breretron 2009).
Since the production of a systematic review is a research project in itself (Wieseler and
Mcgauran 2010), there appears to be a consensus about the various steps necessary to produce
consistent results (Pai et al. 2004; Wieseler and Mcgauran 2010).

53
These include:
1. Formulate the research question and develop the protocol. Protocol should specify (PICOS):
o Patient population
o Intervention being evaluated
o Comparison intervention (if applicable)
o Outcome (Pai et al. 2004)
o Search for evidence.
Electronic databases are the most efficient method of retrieval (Dissemination 2002) but they are
by no means the only sources available. The search might include:
o General databases, such as PubMed
o subject-specific databases
o Screening of bibliographies of included studies
o Search of relevant journals (Dissemination 2002)
o Hand-searching of relevant journals
2. Select the studies. Selection of studies should conform with the inclusion/exclusion criteria
determined during the design of the protocol.
3. Extract the data and other information. Once studies are selected, relevant data should be
extracted onto a standardized form (Torgerson 2003).
4. Appraise the risk of bias in individual studies and cross studies
5. Analyze and present the data
6. Interpret the findings (Pai et al. 2004; Wieseler and Mcgauran 2010)
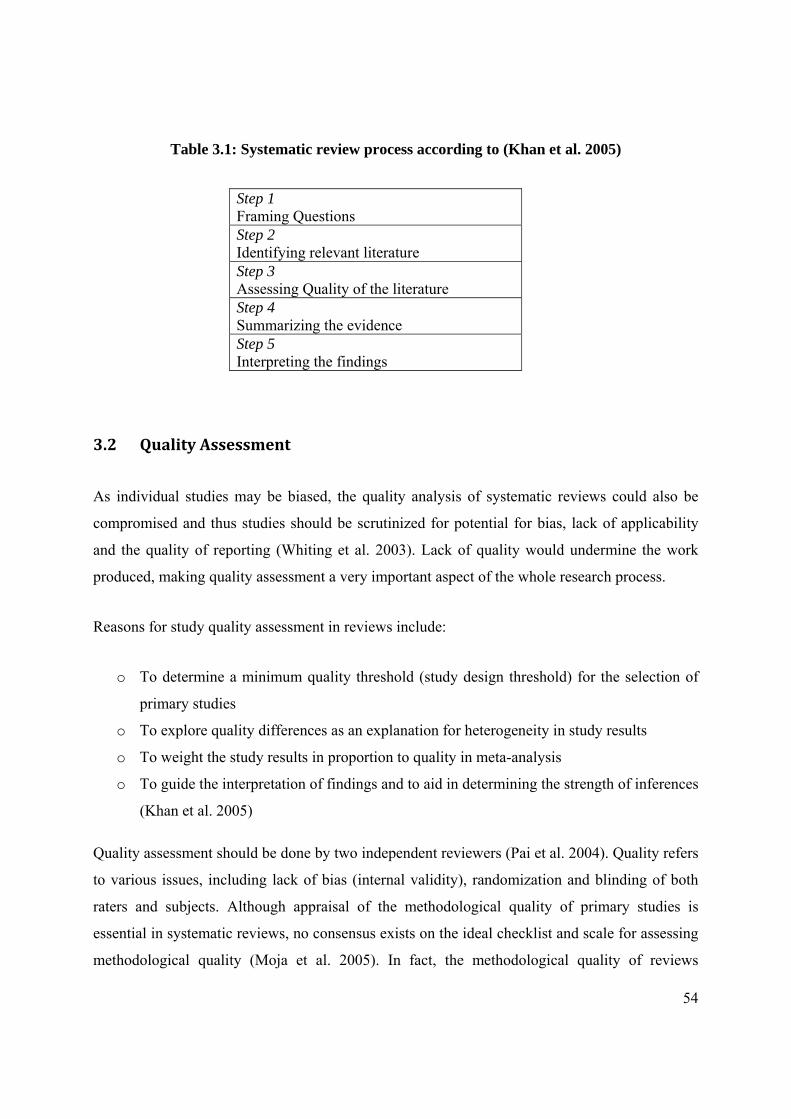
54
Table 3.1: Systematic review process according to (Khan et al. 2005)
3.2 Quality Assessment
As individual studies may be biased, the quality analysis of systematic reviews could also be
compromised and thus studies should be scrutinized for potential for bias, lack of applicability
and the quality of reporting (Whiting et al. 2003). Lack of quality would undermine the work
produced, making quality assessment a very important aspect of the whole research process.
Reasons for study quality assessment in reviews include:
o To determine a minimum quality threshold (study design threshold) for the selection of
primary studies
o To explore quality differences as an explanation for heterogeneity in study results
o To weight the study results in proportion to quality in meta-analysis
o To guide the interpretation of findings and to aid in determining the strength of inferences
(Khan et al. 2005)
Quality assessment should be done by two independent reviewers (Pai et al. 2004). Quality refers
to various issues, including lack of bias (internal validity), randomization and blinding of both
raters and subjects. Although appraisal of the methodological quality of primary studies is
essential in systematic reviews, no consensus exists on the ideal checklist and scale for assessing
methodological quality (Moja et al. 2005). In fact, the methodological quality of reviews
Step 1 Framing Questions Step 2 Identifying relevant literature Step 3 Assessing Quality of the literature Step 4 Summarizing the evidence Step 5 Interpreting the findings

55
assessing diagnostic tests is generally poor (Reid et al. 1995). Furthermore, quality assessment
for diagnostic test evaluations differ from those needed to assess evaluations of therapeutic
interventions as they have unique design features (Deeks 2001). These unique features include
referencing the test to a ‘reference standard’. The test, also known as the “index test” has been
defined as “any procedure used to gather information on the health status of an individual…
including laboratory tests, questionnaires and pathology” (Whiting et al. 2003). On the other
hand, the reference standard should be the best available method to determine whether the
patient has the condition being studied.
A quality assessment tool - QUADAS - was designed, keeping with the above criteria (Whiting et al. 2003).
Table 3.2: The Quadas Tool from Whiting et al., 2003 Yes No Unclear
1 Was the spectrum of patients representative of the patients who will receive the test in practice?
2 Were selection criteria clearly described? 3 Is the reference standard likely to correctly classify the target
condition?
4 Is the time period between reference standard and index test short enough to be reasonably sure that the target condition did not change between the two tests?
5 Did the whole sample or a random selection of the sample, receive verification using a reference standard of diagnosis?
6 Did patients receive the same reference standard regardless of the index test result?
7 Was the reference standard independent of the index test (i.e. the index test did not form part of the reference standard)?
8 Was the execution of the index test described in sufficient detail to permit replication of the test?
9 Was the execution of the reference standard described in sufficient detail to permit its replication?
10 Were the index test results interpreted without knowledge of the results of the reference standard?
11 Were the reference standard results interpreted without knowledge of the results of the index test?
12 Were the same clinical data available when test results were interpreted as would be available when the test is used in practice?
13 Were uninterpretable/ intermediate test results reported? 14 Were withdrawals from the study explained?

56
3.3 A Systematic Review of Ankle Dorsiflexion Measurement
In view of the various methodologies available to measure ankle dorsiflexion and the various
queries that arise thereof, a systematic review was held during October 2008; this was, however,
kept updated during the process of this thesis. As can be seen from the above section, the validity
of the review findings depended on various factors, including how comprehensive the search was
(Glanville, n.d.), proper data extraction, quality assessment of studies found and the accurate
synthesis of results and their reporting.
3.3.1 Aims and Objectives
Aims:
1. To identify the various measurement techniques used in research and clinical practice to
measure ankle joint complex dorsiflexion in the non-neurological patient.
2. To explore the various issues related to these methods, possibly finding common grounds
that have been standardized, with a view of applying these to an Ankle Goniometer
design.
Objectives:
1. To perform a rigorous scientific search to identify studies that utilised ankle joint
complex dorsiflexion measurements as one of the outcomes
2. To obtain information from the various studies that would enable standardization
between various factors, including:
Apparatus/techniques used
Anatomical Landmarks used
Amount of force/torque applied

57
3. To apply methodological quality assessment so as to determine the reliability and validity
assessment methods of the various techniques identified.
3.3.2 Methodology:
Search Strategy
An electronic search of Pubmed, EDBSCO HOST, which includes CINAHL, SPORTSdiscus,
DynaMed and Academic Search Complete, was performed. However, this alone was not deemed
to be sufficient and further searches were performed on the internet and other electronic
bibliographic databases (Glanville). In particular, the Journal of the American Podiatric Medical
Association was searched individually to ensure that no studies may have been overlooked.
Furthermore, hand searching reference lists of studies found was also another source of
references.
The search was limited to:
Clinical trials
Meta-analysis
Randomized Controlled Trials
Reviews
Editorials
Humans
Inclusion Criteria
Published journal articles/studies that dealt mainly with the diagnosis of ankle equinus in
non-neurological subjects.
Studies that evaluated ankle equinus using any means
Studies that evaluated reliability of diagnostic measures relative to this condition
Studies that included a definition of equinus
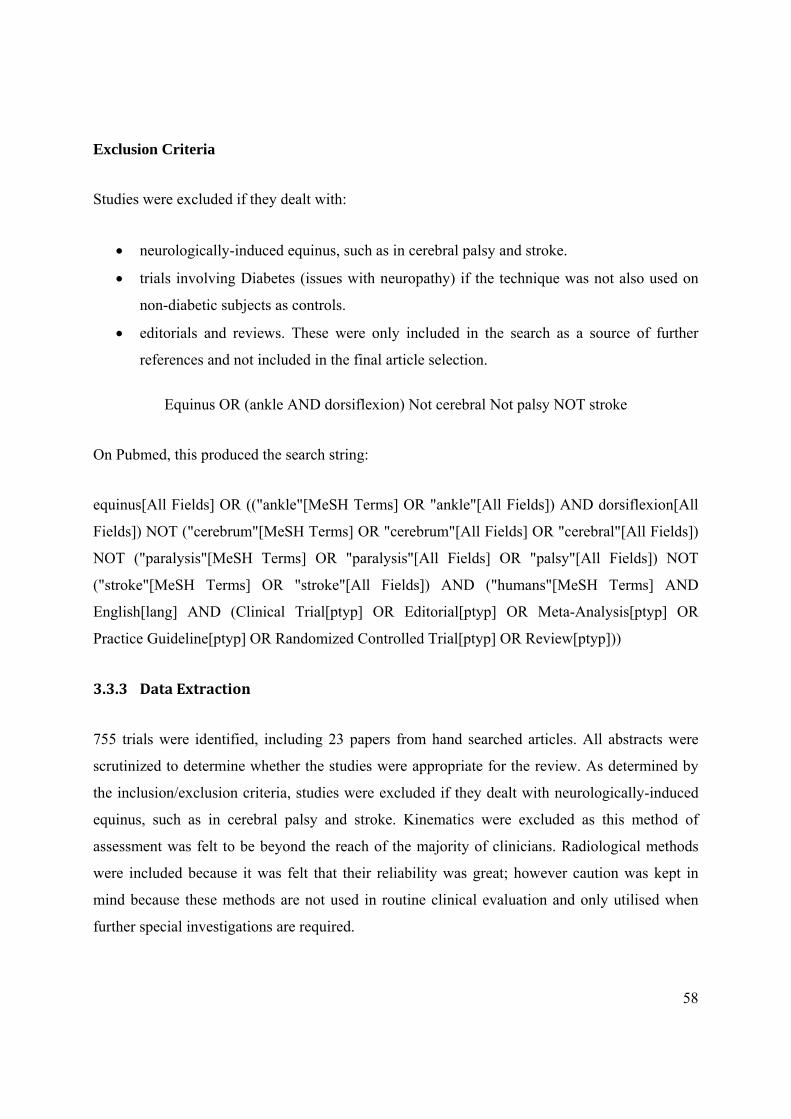
58
Exclusion Criteria
Studies were excluded if they dealt with:
neurologically-induced equinus, such as in cerebral palsy and stroke.
trials involving Diabetes (issues with neuropathy) if the technique was not also used on
non-diabetic subjects as controls.
editorials and reviews. These were only included in the search as a source of further
references and not included in the final article selection.
Equinus OR (ankle AND dorsiflexion) Not cerebral Not palsy NOT stroke
On Pubmed, this produced the search string:
equinus[All Fields] OR (("ankle"[MeSH Terms] OR "ankle"[All Fields]) AND dorsiflexion[All
Fields]) NOT ("cerebrum"[MeSH Terms] OR "cerebrum"[All Fields] OR "cerebral"[All Fields])
NOT ("paralysis"[MeSH Terms] OR "paralysis"[All Fields] OR "palsy"[All Fields]) NOT
("stroke"[MeSH Terms] OR "stroke"[All Fields]) AND ("humans"[MeSH Terms] AND
English[lang] AND (Clinical Trial[ptyp] OR Editorial[ptyp] OR Meta-Analysis[ptyp] OR
Practice Guideline[ptyp] OR Randomized Controlled Trial[ptyp] OR Review[ptyp]))
3.3.3 Data Extraction
755 trials were identified, including 23 papers from hand searched articles. All abstracts were
scrutinized to determine whether the studies were appropriate for the review. As determined by
the inclusion/exclusion criteria, studies were excluded if they dealt with neurologically-induced
equinus, such as in cerebral palsy and stroke. Kinematics were excluded as this method of
assessment was felt to be beyond the reach of the majority of clinicians. Radiological methods
were included because it was felt that their reliability was great; however caution was kept in
mind because these methods are not used in routine clinical evaluation and only utilised when
further special investigations are required.

59
Studies were included if they utilised ankle dorsiflexion measurement as one of their main
outcome measures. From some of these papers, innovative methods were identified (Table 3.4)
and the validating studies also determined; for example although the Lunge Test was used in
various papers, the original validating study was by Bennell et al. (1998).
It was clear that at this stage, studies had to be divided into two groups:
Primary Studies: Those that dealt mainly with the evaluation of a particular measurement
technique or device; e.g. in the case of the Lunge Test, Bennell et al. (1998), and Meyer et al.
(2006) for the Mechanical Equinometer
Secondary Studies: Those that used ankle dorsiflexion measurement as an outcome measure.
Secondary studies were important because they were the means of identifying the Primary
Studies.
3.3.4 Quality Assessment
A ten-item quality assessment tool (Table 3.3) was derived from QUADAS (Whiting et al. 2003)
and (Jull 2002). Two experienced podiatrists, both of whom were university lecturers with over
10 years’ clinical experience, evaluated the studies on their own to ensure blinding and the
presented results are the agreed-on scores (Table 3.6).

60
Table 3.3: A Quality Assessment Tool derived from Quadas and Jull (2008)
Yes No Unclear 1 Were subjects actual patients? 2 Was the number of subjects sufficiently high
to be statistically significant?
3 Were selection criteria clearly described? 4 Were subjects randomly selected? 5 Has the test been compared with a reference
standard?
6 Is the period between consecutive tests short enough to ensure that subject characteristics have not changed?
7 Were subjects blinded 8 Were examiners blinded effectively? 9 Was statistical analysis sound and clearly
explained?
10 Was the execution of the test described in sufficient detail to permit replication of the test?
Total
3.3.5 Results
Primary Studies
12 Primary Studies were identified (Table 3.4). Data extraction was performed using the
assessment tool (Table 3.3).

61
Table 3.4: Various ankle dorsiflexion tools/techniques identified
Device Reliability Study
Moment applied (Nm)
Subject Posn? Neutral posn?
1 Goniometer Elveru et al, 1988
NA As determined by therapist
Yes
2 Dynamometer with foot attachment
3 Visual DiGiovanni et al, 2001
10 Seated Yes
4 Lunge Test/ Inclinometer Testing Modified Lunge Test
Bennell et al, 1998
Menz et al,
2003
NA
Leaning against wall
No
5 Torque Range of Motion Device
Hume et al, 2000
NA NA NA
6 Biplane Goniometer Donnery and Spencer, 1988
Unclear Supine Yes
7 Modified Lidcombe Template
Scharfbillig and Scutter,
2004
16.1 (8.2 kg)
Seated, knees extended
Yes
8 A Manually controlled instrumented footplate
Moseley et al, 2001
12 Supine, knees extended
no
9 Equinometer Weaver et al 2001
Assal et al,
10Nm Sitting with knees fully extended
Yes
10 A Mechanical Equinometer
from Meyer et al, 2006
10Nm applied;
Supine with knees bent; prone with
knees straight
Forefoot in neutral rotation/n
eutral pronation
and supinatio
n 11 Iowa Ankle Device Wilken et al,
2004 10,15,20,
25 Unclear No
12 Device to assess Gastrocnemus Contracture
Greisberg et, 2002
20Nm Knees flexed and extended
Hindfoot neutral

62
3.3.6 Data Extraction
Techniques for measuring ankle joint complex dorsiflexion have been categorized into 3 broad
categories:
1. ‘Conventional’ methods which include the Goniometer, Lunge Test and Visual
Estimation. These do not require any specialized instruments designed specifically for this
purpose.
The Lunge Test has 5 variations:
with inclinometer attached to tibia (Bennell et al. 1998) with Gravity Goniometer (Nitz and Low Choy 2004)
measuring distance from wall to the big toe (Bennell et al. 1998)
with Goniometer (Bagget and Young 1993)
with a transparent scale on the lateral side of the leg (Menz et al. 2003)
2. More sophisticated methods utilising readily-available equipment, which include
the Electrogoniometer and Potentiometer (Tesio et al. 1995),
Inclinometer/Gravity Goniometer (Nyanzi et al. 1999),
lateral radiographs (Backer and Kofoed 1989),
2D Video (Woodburn 1991)
photography (Moseley 1997) .
3. Specifically designed apparatus and methods. There is a surprisingly large number of
apparatus designed specifically for measuring ankle joint complex dorsiflexion. These include:
Dynamometer with foot attachment (Muir et al. 1999)
Torque Range of Motion Device (Hume et al. 2000)
Lidcombe Template (Moseley and Adams, 1991)/Modified Lidcombe
Template (Scharfbillig and Scutter 2004)
Biplane Goniometer (Donnery and Spencer 1988)

63
A Manually Controlled Instrumented Footplate (Moseley et al. 2001)
Equinometer (Weaver et al. 2001; Assal et al. 2003)
Mechanical Equinometer (Meyer et al. 2006)
Iowa Ankle Device (Wilken et al. 2004)
Device to Assess Gastrocnaemius Contracture (Greisberg et al. 2002)
A custom apparatus fixed to the leg and foot for measuring the isometric force
of ankle dorsiflexion at ankle angles (Bobet et al. 2005)
Some common features found in these designs include:
a. Composed, or a variation, of a vertical arm and a plate for the sole of the foot
(Scharfbillig and Scutter 2004; Donnery and Spencer 1998; Moseley et al. 2001; Weaver
et al. 2001; Wilken et al. 2004; Greisberg et al. 2002)
b. The head of the fibula and the midline of the lateral malleolus appear to be accepted
markings for lateral alignment (Menz et al. 2003; Moseley et al. 2001; Assal et al. 2003;
Weaver et al. 2001; Wilken et al. 2004). Exceptions are the Mechanical Equinometer,
which uses the anterior aspect of the tibia for alignment purposes (Meyer et al, 2006), the
Lidcombe Template, which uses the posterior aspect of the lower leg for this purpose
(Scharfbillig and Scutter 2004) and the Device to Assess Gastrocnaemius Contracture
uses the axis of the second Ray instead of the plate (Greisberg et al. 2002)
c. Axis of device is oriented to the axis of the ankle joint in the transverse plane (Moseley et
al. 2001; Wilken et al. 2004).
d. Axis may be in line with ankle axis (Moseley et al. 2001; Assal et al. 2003; Weaver et al.
2001; Wilken et al. 2004) However, axis below the lateral malleolus as per Rootian
model was not utilised in any of these specially designed apparatus, except for the
Biplane Goniometer (Donnery and Spencer, 1988). The Lidcombe Template axis
approximates this by being placed at the rearmost part of the base board and foot plate “to
simulate attachment of the Achilles tendon to the calcaneum and to provide a constant
axis from which the force of the foot was applied” (Scharfbillig and Scutter 2004).

64
e. An average reading is taken from a number of measurements (DiGiovanni et al. 2001;
Greisberg et al. 2002)
Secondary Studies:
85 trials that somehow assessed ankle joint complex dorsiflexion were identified. Consequently,
these revealed a variety of methods that have been utilised for ankle joint dorsiflexion research.
The most common technique used was that of the traditional Goniometer. The angle readings
were taken both at subtalar neutral and not. A number of authors did not define the foot posture
at which readings were made. Position also varied, with the subjects lying prone, supine or
seated.
Various dynamometers with ankle attachments were also used, with Biodex and Cin-com being
the most common. These accounted for 20 out of the 85 studies, which makes this the next
commonest technique used. No primary studies, i.e. validating this technique, were found. Also
there was no mentioning of placing the foot at subtalar neutral and subjects appear to be seated.
The Lunge Test (9/85) had 5 variations: the test performed with an inclinometer attached to the
tibia, which appears to be the commonest variant; the test with a gravity Goniometer, which
more or less would be similar to the previous variant; the test measuring the distance from the
wall to the big toe, the test with a large transparent scale on the side of the foot and the test with
the angle between the lateral fibula and the ground measured by a Goniometer. In this last
variant, a wedge was placed under the first metatarsophalangeal joint to stop the foot from
pronating.
An inclinometer was also used in 3 studies. Other minor studies include 2d video, photographs,
lateral XRays. Electrogoniometers and potentiometers played a surprisingly minor role in the
studies that were found.
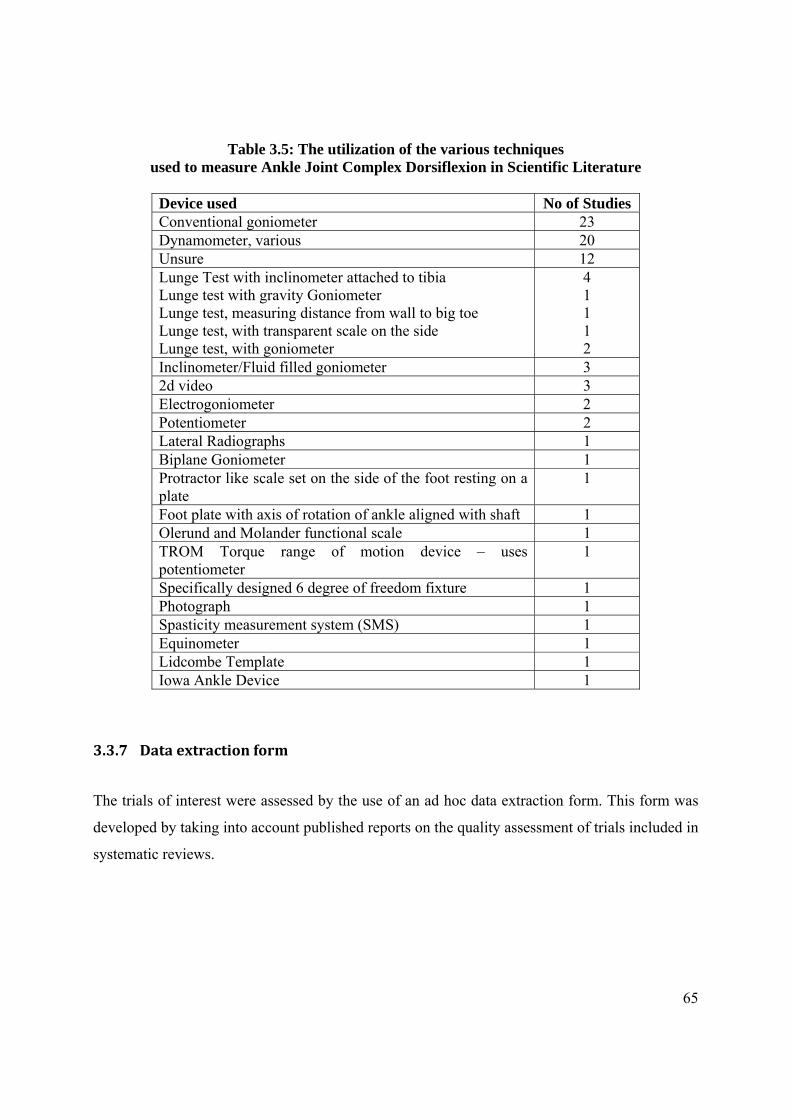
65
Table 3.5: The utilization of the various techniques used to measure Ankle Joint Complex Dorsiflexion in Scientific Literature
Device used No of Studies Conventional goniometer 23 Dynamometer, various 20 Unsure 12 Lunge Test with inclinometer attached to tibia Lunge test with gravity Goniometer Lunge test, measuring distance from wall to big toe Lunge test, with transparent scale on the side Lunge test, with goniometer
4 1 1 1 2
Inclinometer/Fluid filled goniometer 3 2d video 3 Electrogoniometer 2 Potentiometer 2 Lateral Radiographs 1 Biplane Goniometer 1 Protractor like scale set on the side of the foot resting on a plate
1
Foot plate with axis of rotation of ankle aligned with shaft 1 Olerund and Molander functional scale 1 TROM Torque range of motion device – uses potentiometer
1
Specifically designed 6 degree of freedom fixture 1 Photograph 1 Spasticity measurement system (SMS) 1 Equinometer 1 Lidcombe Template 1 Iowa Ankle Device 1
3.3.7 Data extraction form
The trials of interest were assessed by the use of an ad hoc data extraction form. This form was
developed by taking into account published reports on the quality assessment of trials included in
systematic reviews.

66
From the selected studies, various issues were identified. These include:
3.3.7.1 Subject Positioning
Because ankle dorsiflexion may be assessed in a variety of different clinical situations, patient
position may affect the resultant ankle dorsiflexion angle. A patient may be assessed lying down
in a supine (Moseley et al. 2001) or prone position or in the more conventional clinical position
of sitting. Patients may also be assessed with knees extended and/or flexed. Subject position is
known to affect the resultant amount of ankle joint dorsiflexion. Thoms and Rome (1997)
confirmed that although a prone or supine patient position does not affect this result, sitting does
influence this.
3.3.7.2. Foot Position
Whether the foot is held at subtalar joint neutral or not seems to be quite an important issue
which, however, is not addressed by a large number of retrieved trials. Rootian theory suggests
that a pronated foot allows increased sagittal plane motion, making this an unwanted situation if
only ankle joint complex dorsiflexion measurement is desired. In fact, Tiberio et al (1989) have
shown a variation of 10o between pronated and non-pronated feet. This is in accord with
Woodburn (1991) who has demonstrated a marked difference between the pronated, neutral and
supinated foot types. This consequently implies that in order to standardize measurements, it
must be decided which foot position to use, the pronated, neutral or supinated posture? A 10o
error is certainly unacceptable. It is hypothesised that holding the subtalar joint at neutral
position prevents dorsiflexion through the midfoot (Mueller et al. 1989; Woodburn, 1991). A
pronated foot may hide a true diagnosis of limited ankle dorsiflexion, while a supinated foot may
produce a result of equinus with resultant important clinical consequences (Woodburn 1991)
Naturally, issues of subtalar joint neutral position reliability would arise at this time (Weaver et
al. 2001) – it is well known that untrained therapists do not consistently find subtalar joint
neutral (Elveru et al. 1988; Pierrynowsky, 1996) however, it is claimed that training increases
reliability (Diamond et al. 1989) although there is room for improvement (Pierrynowsky et al.
67
1996). On the other hand, this is totally refuted by Kim et al (2011) who demonstrated that
experience does not increase reliability when measuring ankle dorsiflexion.
Trials that performed the measurement at subtalar joint neutral include DiGiovanni et al. (2001),
Scharfbillig and Scutter (2004), Donnery and Spencer (1989), Assal et al. (2003); and Weaver
et al. (2001).
3.3.7.3 Force Applied
According to (Assal et al. 2003), when the amount of dorsiflexing force that is applied by the
examiner varies, the resultant angle will also vary. The product of the applied force and the
distance between the axis of movement, i.e. ankle axis, and the point of application of the force,
gives the moment, which is synonymous with torque. Using moment measurement as well as
angular displacement, passive versus angular displacement curves can be produced as opposed to
simpler systems where only a single point is recorded (Moseley et al. 2001). The moment
applied to the ankle joint complex might fluctuate between one examiner and another, or
between one examination and another, thus exerting unequal forces on the gastrocnaemius. The
stretching characteristics of the triceps surae themselves may vary depending on other intrinsic
or extrinsic factors, such as temperature (Knight et al. 2001; Robertson et al. 2005). The amount
of force, or moment, applied to the ankle joint, normally to the metatarsophalangeal joint area,
was reported in 75% of assessed studies. This was not applicable to those studies that assessed a
type of lunge test, e.g. Bennell et al. (1998) and Menz et al. (2003). The moment applied varied:
10Nm (DiGiovanni et al. 2001; Weaver et al. 2001; Meyer et al. 2006), 12Nm, (Moseley et al.
2001), 15Nm, (Assal et al. 2003), 16.1Nm (Scharfbillig and Scutter, 2004) and 20Nm
(Greisberg et al. 2002). Wilken et al. (2004) assessed angular displacement over a range of forces
at 10, 15, 20 and 25Nm. Different amounts of force appear to have been arbitrary, except for
DiGiovanni et al. (2001) who justified their 10Nm moment as having been chosen following
previous work.
Applying the same amount of force to all subjects reduces the variability of subsequent readings
between the same patients, making the test appear more reliable than if the force were not
controlled. This is because the magnitude of force applied determines the applied torque, directly

68
influencing the ankle dorsiflexion angle (Assal et al. 2003). If a known torque is applied to
dorsiflex the ankle, reliability is thus increased (Moseley and Adams 1991).
This may be one way of standardizing one of the variables (Weaver et al. 2001) thus increasing
the possibility of comparing results between trials. Additional apparatus may be required to do
this, although a simple spring balance has been used to good effect to attain this goal (Moseley
and Adams, 1991).
3.3.8 Methodological Quality Assessment
Appraisal of the methodological quality of primary studies is essential in systematic reviews.
However, no consensus exists on the ideal checklist and scale for assessing methodological
quality (Moja et al, 2005). Quality assessment was felt to be important because of the quoted
poor reporting of tests carried out (Reid et al. 1995).
As mentioned earlier, two experienced clinicians evaluated each Primary Study and filled out the
Quality Assessment forms. These were then compared and the presented data are the agreed
results.
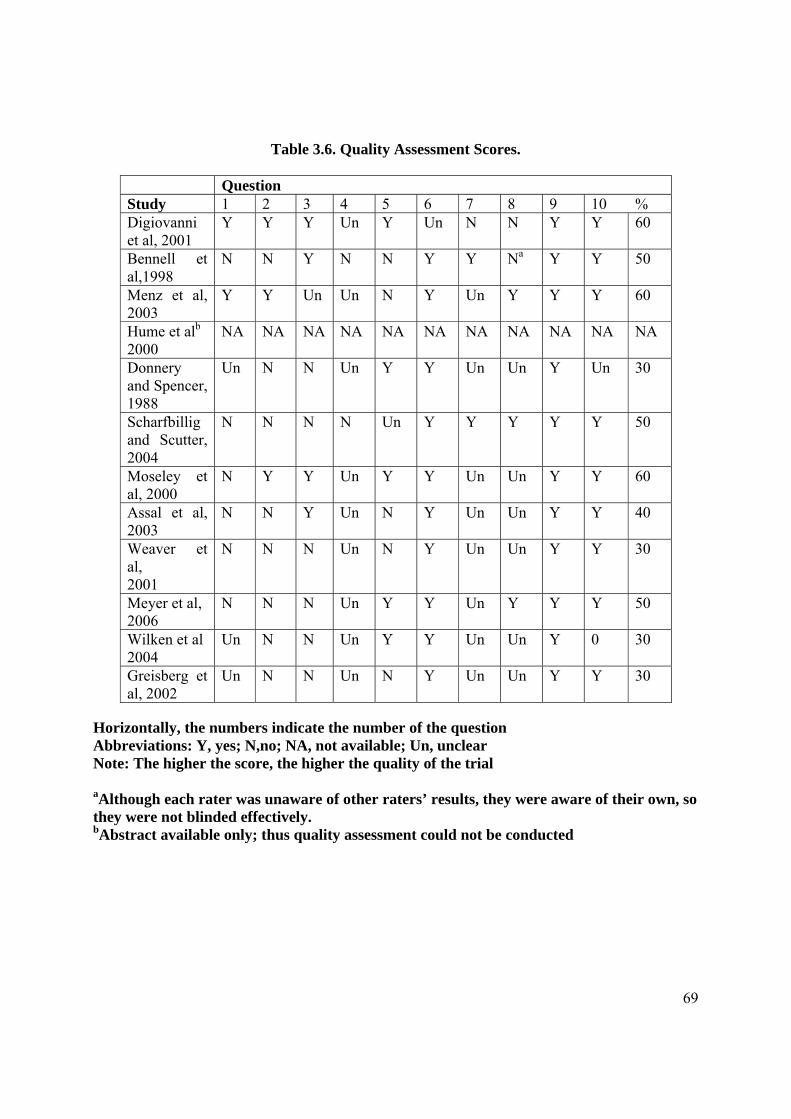
69
Table 3.6. Quality Assessment Scores.
Question Study 1 2 3 4 5 6 7 8 9 10 % Digiovanni et al, 2001
Y Y Y Un Y Un N N Y Y 60
Bennell et al,1998
N N Y N N Y Y Na Y Y 50
Menz et al, 2003
Y Y Un Un N Y Un Y Y Y 60
Hume et alb 2000
NA NA NA NA NA NA NA NA NA NA NA
Donnery and Spencer, 1988
Un N N Un Y Y Un Un Y Un 30
Scharfbillig and Scutter, 2004
N N N N Un Y Y Y Y Y 50
Moseley et al, 2000
N Y Y Un Y Y Un Un Y Y 60
Assal et al, 2003
N N Y Un N Y Un Un Y Y 40
Weaver et al, 2001
N N N Un N Y Un Un Y Y 30
Meyer et al, 2006
N N N Un Y Y Un Y Y Y 50
Wilken et al 2004
Un N N Un Y Y Un Un Y 0 30
Greisberg et al, 2002
Un N N Un N Y Un Un Y Y 30
Horizontally, the numbers indicate the number of the question Abbreviations: Y, yes; N,no; NA, not available; Un, unclear Note: The higher the score, the higher the quality of the trial
aAlthough each rater was unaware of other raters’ results, they were aware of their own, so they were not blinded effectively. bAbstract available only; thus quality assessment could not be conducted

70
Table 3.7: Quality assessment Score Totals per study Trial Technique Quality Score Digiovanni, Holt, Czerniecki, Ledoux, Sangeorzan. 2001
Visual estimation of dorsiflexing angle
60%
Bennell, Talbot, wajswelner et al. 1998
Lunge Test 50%
Menz, Tiedemann, Mun-San Kwan, Latt, Sherrington, Lord. 2003
Modified Lunge Test
60%
Hume, Nakamura, Buford, Trevino, Patterson. 2000
Torque Range of Motion Device
NA
Donnery and Spencer 1988
Biplane Goniometer
30%
Scharfbillig and Scutter. 2004
Modified Lidcombe Template
50%
Moseley, Crosbie and Adams. 2000
A Manually controlled instrumented footplate
60%
Assal, Shofer, Rohr, Price, Czerniecki, Sangeorzan. 2003
Equinometer
40%
Weaver, Price, Czerniecki, Sangeorzan. 2001
Equinometer
30%
Meyer, Werner, Wyss, Vienne. 2006
A Mechanical Equinometer
50%
Wilken, Saltzam, Yack. 2004
Iowa Ankle Device 30%*
Greisberg, Drake, Crisco, DiGiovanni. 2002
Device to assess Gastrocnaemius Contracture
30%
*Note: Since this Systematic Review was published in the January-February edition of JAPMA, 2011, Wilken et al have published a detailed validation/reliability paper which, if included in the systematic review, would have scored highly (Wilken et al. 2011).
Although 12 papers that reported reliability were identified for quality assessment full text of two
papers (Hume et al. 2000; Bobet et al. 2005) could not be obtained at the time of writing, which
reduced the list to 10.

71
3.3.8.1 Participants in Ankle dorsiflexion Reliability Assessment
The majority of assessed studies used small, convenience samples of healthy volunteers (Table
3.6). Only 3 of the trials utilised real patients (Digiovanni et al. 2001; Menz et al. 2003; Wilken
et al. 2004). “Evaluations of new tests often omit the essential developmental stage of evaluation
in a real clinical population” (Jull 2002). The use of a suitable spectrum of patients is required
when evaluating the validity and reliability of new diagnostic tests, otherwise spectrum bias may
occur. This is because differences in clinical features between patients may produce considerable
variations in results (Whiting et al. 2003).
As regards sample size, only DiGiovanni et al (2001), Menz et al. (2003) and Moseley et al.
(2001) had a significant number of subjects. The ability to infer to larger populations in all the
other cases is consequently debatable.
3.3.8.2 Randomization
Selection bias can be present when subject selection is not random (Lijmer 1999). Although only
3 trials selected actual patients (DiGiovanni et al. 2001; Menz et al. 2003; Wilken et al. 2004) the
reporting of whether they were randomly selected is not clear.
3.3.8.3 Comparison to a Reference Standard
“Was there an independent blind comparison with a reference (gold) standard of diagnosis?” is
an important question which should be asked to assess diagnostic tests (Jull 2002).
This mostly refers to the validity of the instrument. In simple words, are the reported results
actual results, or is there the possibility of any confounding elements present? If a measure is
reporting 0o of ankle joint complex dorsiflexion, is it actually 0o? Is there only ankle joint
complex dorsiflexion, or does the result incorporate midtarsal joint dorsiflexion as well? This can
only be ascertained by cross-checking this result with another measure that is known to produce
good results. In this context, this may be quite difficult to achieve, because it is already known
that there is a problem with achieving true dorsiflexion angles.

72
5 studies validated their results by cross-referencing with a known measurement technique:
DiGiovanni et al (2001) checked visual estimation of ankle dorsiflexion with an equinometer,
although, as the authors themselves point out, there is a lack of a “gold standard” test. While
Moseley et al. (2001) referenced their results with photography, Donnery and Spencer (1988)
and Meyer et al. (2006) compared their results with a Goniometer, even when this method is
known to have high reliability problems. Wilken et al. (2004 and 2011) assessed their
dorsiflexion results with an Optotrak motion analysis system.
When measuring ankle dorsiflexion, true tibio-talar motion can be measured accurately using
radiographic techniques. The vertical midline of the fibula can be compared to a line dividing the
talar trochlea (Backer and Kofoed 1989). Thus this type of modality may be indicated as a true
Reference Standard when comparing new techniques/equipment. Notwithstanding this, it is clear
that some authors may run into ethical difficulties when proposing this modality because of
radiation issues.
3.3.8.4 Statistical Analysis
Test-retest designs appear to be the preferred method of assessment, with Intraclass Correlation
being the statistical test of choice (Bennell et al. 1998; Menz et al. 2003; Scharfbillig and Scutter
2004; Moseley et al. 2001; Weaver et al. 2001; Meyer et al. 2006; Wilken et al. 2004; Greisberg
et al. 2002). They follow a trend in reliability trials. “The consistency or the repeatability of the
ROM measurement - whether the application of the instrument and the procedures produce the
same measurements consistently under the same conditions” (Gajdosik and Bohannon 1987).
Currier (1984), cited by Gajdosik and Bohannon (1987), continues to add that the validity of a
measurement “constitutes the degree to which an instrument measures what it is purported to
measure; the extent to which it fulfils its purposes.” Measures of validity tell us whether an item
measures what it is supposed to—that is, whether a measurement is true.

73
3.3.9 Discussion
When embarking on new research projects, it is normal practice to assess the validity and
reliability of any outcome measures used. Thus it is perplexing why, with the current evidence
regarding the unreliability of goniometric measurements, so many trials utilised this type of
assessment as their main outcome measure. This not only raises questions as to the reliability
and validity of their results, but also as to their clinical value.
It is evident that researchers always felt unhappy with goniometric measurements. The number
of systematic reviews regarding this issue, and the number of different apparatuses that have
been developed in order to improve on ankle dorsiflexion measurement techniques attest to this.
A great number of these specifically designed apparatuses mainly aim to reduce errors of
placement by securing the vertical arm to the leg. The accepted method of alignment appears to
be from the lateral head of the fibula to the middle of the lateral malleolus for the vertical arm,
and a plate to cover the plantar aspect of the foot for the other arm. For the former, a number of
researchers have drawn a vertical line from the lateral head of the fibula to the malleolus to
maintain alignment; if this practice is not maintained during clinical goniometric measurements,
this may provide a significant error of placement which can be reduced by having the vertical,
stable arm, long enough to reach up to the head of the fibula.
It is acceptable that, as the forefoot is pushed upwards to dorsiflex, kinematic changes occur in
all the joints distal to the ankle joint. Although the study by Lundgren et al. (2008) was limited to
just 6 subjects, who apparently were not controlled for hypermobility (i.e. whether there was an
excessive amount of rotation around the axes) of the midtarsal joint, it confirms that motion of
the foot is not solely at the ankle joint complex and the other foot joints contribute a significant
amount of dorsiflexion.
At this stage, pending further analysis, it appears that, after all, Root et al (1977) may have had a
very valid point in proposing that the ankle dorsiflexion angle be measured at subtalar joint
neutral position. Woodburn (1991) and Tiberio et al.(1989) observed a very significant
difference between pronated and non-pronated feet. In view of this, it is surprising why

74
Lundgren et al. (2008) did not control for subtalar joint position, which could have affected
results.
This means that those trials which compared ankle dorsiflexion measurements taken at subtalar
joint neutral and those which did not maintain this position, cannot be compared directly,
because in the latter there may be the possibility of having increased angles due to joint motion
extraneous to the ankle. With this regard, it follows that subjects with pronated, or flat, feet
would exhibit increased ankle dorsiflexion measurements derived from additional midtarsal joint
motion. In such cases the presence, or otherwise, of ankle equinus would be masked by false
results, since these would include both ankle and midtarsal joint motion.
Whether subtalar joint neutral position can be consistently established by clinicians is debatable;
Diamond et al. (1989) believe that reliability may be increased by training. However, its use may
in fact increase measurement error (Lundgren et al. 2008). Currently there is a paucity of
information that compares pronated and non-pronated feet dorsiflexion values to those of
supinated feet (Woodburn 1991). Finding a way around the subtalar joint neutral position issue
would eliminate one important factor that significantly affects this type of measurement (Meyer
et al. 2006).
With reference to subject positioning, from the Thoms and Rome trial (1997), it can be
concluded that this should be either prone or supine. Subject positioning is one of the factors that
should be standardized in order to obtain consistent results in ankle joint measurement trials.
However, even here, more research is required since the Thoms and Rome trial only assessed
prone and supine positions with knee extended and sitting position with knee flexed. This could
be because it is known that there is poor correlation between knees extended and knees flexed
(Meyer et al. 2006). It is still puzzling, however, why sitting position with knees extended were
not included in this trial.
While most of the papers reviewed used the term “torque” (DiGiovanni et al. 2001; Scharfbillig
and Scutter 2004; Moseley et al. 2001; Assal et al. 2003; Weaver et al. 2001; Meyer et al. 2006;
Wilken et al. 2004; Greisberg et al. 2002). “Moment” may be more appropriate and is accepted
terminology within the biomechanics community. As to the amount of force applied, it emerges
75
that consistency can only be attained by applying the same moment, which directly influences
the ankle dorsiflexion angle (Assal et al. 2003). This may be one way of standardizing one of the
variables, thus increasing the possibility of comparing results between trials. Additional
apparatus may be required to do this, although a simple spring balance has been used to good
effect to attain this goal (Moseley et al. 1991). Another interesting point to note is that the
amount of force being quoted (DiGiovanni et al 2001; Scharfbillig and Scutter 2004; Moseley et
al. 2001; Assal et al. 2003; Weaver et al. 2001; Meyer et al. 2006; Wilken et al. 2004; Greisberg
et al. 2002) is generally a small percentage of the actual forces being applied to the foot during
locomotion.
Although all studies report high Intraclass Correlation Coefficient (ICC) values for reliability,
methodologies used to assess the various tools appear to be weak. It has been pointed out that
although the number of diagnostic test evaluations is increasing, their methodological quality is
on average poor (Lijmer et al 1999). Very few studies utilise actual patient populations. Most
lack reference to a ‘reference standard’, such as X-Rays. Consequently one cannot discern if the
reported angles are, in fact, the true angles of foot dorsiflexion.
It is also clear that the term ‘reliability’ and ‘repeatability’ are being used interchangeably.
According to Gajdosick and Bohannon (1987) “Reliability in goniometry simply means the
consistency or the repeatability of the ROM measurements, that is, whether the application of the
instrument and the procedures produce the same measurements consistently under the same
conditions.” This definition, however, does not take into consideration validity, i.e. is the
instrument actually measuring the correct angle? This is one of the main reasons why any such
procedure must be compared to the Reference Standard. In the case of ankle joint complex
measurement, following Tiberio et al. (1989) revelation that in a pronated foot there are 10o
degrees more dorsiflexion, the instrument under review might actually be measuring both ankle
joint complex and midtarsal joint complex dorsiflexion. To complicate this further, it might be
actually measuring also the summation of all dorsiflexion movements of joints distal to the ankle
(Lundgren et al. 2008). Thus this Reference Standard may be Radiological, where the movement
between the actual bones themselves may be measured more accurately.

76
Finally, in view of the evidence regarding goniometric unreliability, serious doubts arise as to the
value of all research done utilising this method. A method/technique of assessing pure ankle joint
complex dorsiflexion needs to be validated fully and, possibly, most of the research mentioned
above repeated using this method to ensure that all the results are, in fact, true foot dorsiflexion
results.
3.3.10 Conclusions
From this review, it can thus be deduced that:
The majority of devised instruments consistently produced the same results in healthy
populations. Utilization of a patient population is lacking in these studies.
Most of the studies are characterized by small sample sizes.
There is still no total agreement as to how the foot dorsiflexion angle can be
measured. At the moment, the various techniques are inconsistent, thus causing a
deficit in this particular area of research.
Lack of standardization makes direct comparisons between trials impossible.
It is not clear what is being measured, whether it is tibio-talar joint motion, ankle joint
complex motion or the summation of all the movement of the joints of the foot. It
appears that the latter may be the most likely, thus the term foot dorsiflexion may be
more appropriate.
It is being proposed that the following be standardized:
Placement of the vertical arm
Should the other arm take the form of a plate?
The amount of force applied to dorsiflex the foot (currently between 10Nm to 20Nm)
Further research is required into the following aspects of this field:

77
o Subject position: does it influence the final result?
o Foot position: can subtalar joint neutral be consistently applied? If not, can a way
around this problem be found?
o Placement of the axis, whether in line with the ankle joint axis, or below the
lateral malleolus as described by Root et al.
o What is the amount of force needed to be applied to the plantar forefoot. Should it
try to simulate normal kinetics during gait?
Unless true standardization of measurement is achieved, the accuracy of communication between
clinicians, the act of measuring ankle joint dorsiflexion and the accuracy of the measurement
itself, which is so important in determining therapeutic options, will be sorely lacking.
Furthermore, the research that is going on cannot be responsibly utilised.
It appears that, even at this day and age, ankle joint complex dorsiflexion measurement is still a
grey area.
3.3.11 Recommendations
Investigate what is actually happening during passive ankle joint dorsiflexion. Is it true that only
tibio-talar movement occurs when the foot is placed in neutral position and the midtarsal joint
locked?
Does the above also apply to children? Since children’s feet are more flexible, if there is
movement extraneous to the ankle joint, this is bound to be more pronounced than in adults.
Hence it is essential to investigate paediatric foot segment movements since error of
measurement may actually be larger than in adult feet.

Chapter 4
Ankle Joint Dorsiflexion Measurement Techniques

79
4.0 Introduction
This chapter will present the various methods/apparatuses for measuring ankle joint dorsiflexion
presented in the systematic review, highlighting important unique feature of each device and
identifying their strong and/or weak points in order to assemble design criteria for a possible
ankle goniometer device that amalgamates and, possibly, improves on their weak points. A
critical analysis of these devices will be carried out.
4.1 Traditional methods of measuring ankle joint complex dorsiflexion
Goniometry
The Root method is the most common method of goniometric measurement. In actual fact, this is
derived from the Silverskiold method with the knees flexed and the knees extended to diagnose
whether contracture is due to gastrocnaemius or soleus (Silverskiold 1924).
In this method the flexible arm of the Goniometer is aligned with the lateral head of the fibula
and the lateral malleolus, while the other arm parallels the lateral aspect of the foot to the 5th
metatarsophalangeal joint. The foot is held in neutral position and a dorsiflexing force is applied
to the forefoot (Gastwirth 1996; Root et al. 1977).
The reliability of this method has been often criticized, with various authors having published
various trials (Kim et al. 2011; Martin and Mcpoil 2005; Rome 1996; Van Gheluwe et al. 2002).
Visual Testing:
The ability to visually measure ankle joint dorsiflexion was investigated by DiGiovanni et al
(Digiovanni et al. 2001). 68 people were examined first visually then by an equinometer to
determine if the two methods correlated. An orthopaedic surgeon performed the clinical
evaluation of each subject, who was sitting with the knees extended. The talonavicular joint was
held in neutral position and a dorsiflexing torque was applied until there was no more movement.
The angle was then estimated visually.

80
Strong Points Weak Points
Cheap and readily available Very subjective, depending on practitioner’s eye judgment
No apparatus necessary No objective measurement; thus it is very hard to replicate and/or prove result
The Lunge Test:
Most studies utilising the Lunge Test refer to Bennell et al. (1998) for validation purposes.
Figure 4.1: The Lunge Test

81
Modifications of the Lunge Test
Figure 4.2: Modified Lunge Test (from Menz et al., 2003)
Figure 4.3: Another modified Lunge Test; measurement form wall to great toe (from Dennis et al, 2008)

82
Design features:
Most Lunge tests use simple, readily available accessory equipment, such as an inch tape to
measure the distance from the wall to the great toe, or a goniometer or an inclinometer to
measure the leg angle to the ground.
Design criticism:
This method is not suitable for patients who cannot bear weight due to contracture, recent
surgery or other impairments (Moseley 1997).
4.2 Devices specifically designed to measure Ankle Dorsiflexion
A number of devices made specifically for measuring ankle dorsiflexion have been identified.
Although they have been assessed as Primary Studies, there were other studies that utilised these
apparatus.
These devices include:
The Biplane Goniometer
Figure 4.4: The Biplane Goniometer. (Donnery and Spencer 1988)

83
The Biplane goniometer, as opposed to a normal goniometer which has two moving arms,
appears to be the first of its kind to include a footplate instead of the moving arm. Although this
idea was innovative at its time, now it appears that there are various issues with this design.
Device design features:
Vertical transparent arm aligned with lateral aspect of leg
Footplate replaces the traditional moving arm of the goniometer.
Flexibility of vertical arm allows the user to invert/evert the heel in order to place the foot
at subtalar neutral position
Design criticism:
Vertical arm is not held in place, thus operator must keep it aligned during the
dorsiflexing process
Foot position must be controlled and held by the operator
The use of a foot plate raises issues as it has been shown that forefoot movement also
accompanies hindfoot movement during passive dorsiflexion when a force is applied on
the forefoot (Ref to Chapter 6).
Axis of rotation does not approximate axis of rotation of the ankle joint; hence although it
is closest to the Rootian method of measurement, one does not really know what is
actually being measured. Certainly not ankle dorsiflexion by itself

84
The Lidcombe Template
Figure 4.5: The Original Lidcombe Template (from Moseley, 1997)
Figure 4.6: The modified Lidcombe Template (from Scharfbillig and Scutter, 2004)
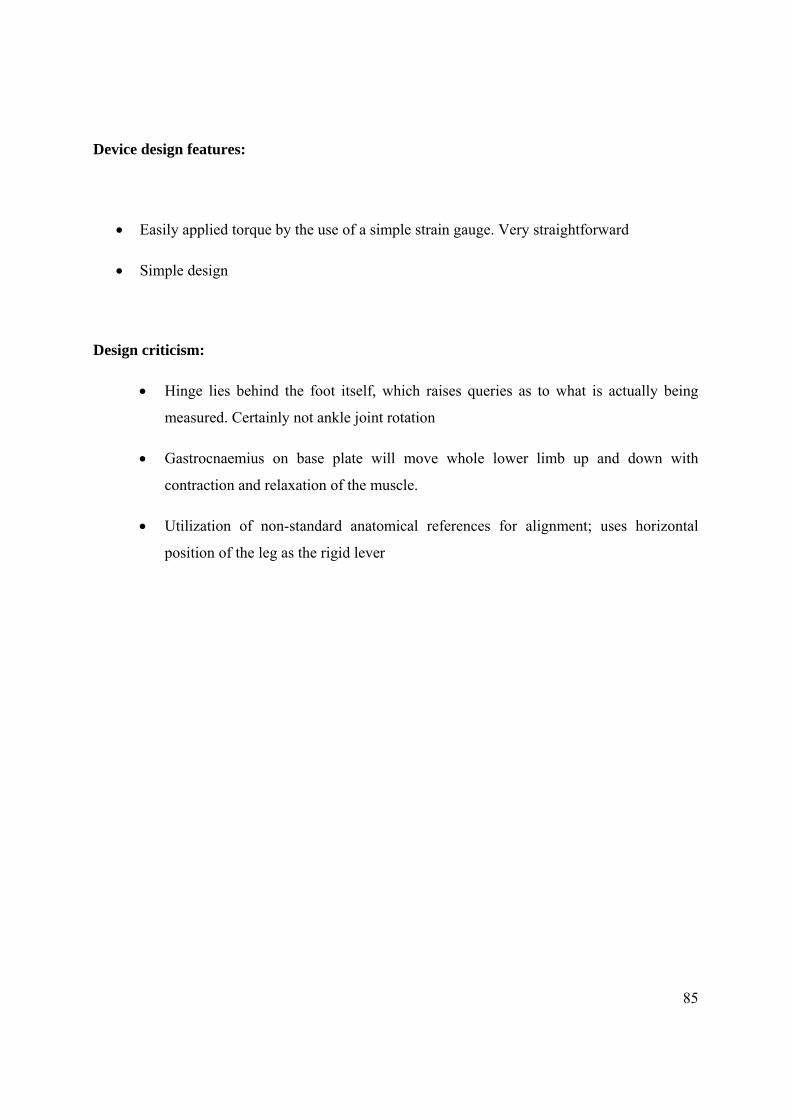
85
Device design features:
Easily applied torque by the use of a simple strain gauge. Very straightforward
Simple design
Design criticism:
Hinge lies behind the foot itself, which raises queries as to what is actually being
measured. Certainly not ankle joint rotation
Gastrocnaemius on base plate will move whole lower limb up and down with
contraction and relaxation of the muscle.
Utilization of non-standard anatomical references for alignment; uses horizontal
position of the leg as the rigid lever

86
Torque Range of Motion Device
This is a single hinged device with a potentiometer to measure ankle angle and a strain gauge to
measure ankle torque.
Figure 4.7: TROM in use (Trevino et al. 2004)
Device design features:
Two-piece lower-leg splint for the foot and ankle, constructed of a flexible but resilient
plastic.
The two pieces of the splint hinged with a half-inch diameter, single-turn precision
potentiometer at the ankle to allow passive plantarflexion and dorsiflexion.
The foot part of the mold reinforced with a steel bar extending the full length of the cast
to make it rigid.
At a designated point on this bar, a cantilever beam load cell was mounted in the
aluminium handle.
The device was a single-degree-of-freedom hinge connected to molded thermoplastic
splints strapped to the calf and foot

87
Two amplifiers designed to condition the potentiometer angle signal and to amplify the
load cell torque signal, which fed into a two-channel data acquisition system. The output
from the data acquisition system was transmitted to a portable PC running custom
designed software to acquire and display the TROM data in real-time.
The centre of motion was adjusted to align with the tibio-talar joint axis just below the
malleoli. The instrument was calibrated
Patient sitting with knee flexed 20o.
Design criticism:
No control for foot posture
Use of a plate under the foot raises issues as to what is actually being measured
Use of wires from device to personal computer

88
The Equinometer
Developed by Weaver et al. (2001), this device consists of a potentiometer to measure ankle
angles and a load cell to control the amount of torque applied to the foot. At initial examinations,
this appears to be one of the most valid devices as it has a number of strong points:
Fibula serves as a very reproducible anatomical landmark
Tip of lateral malleolus approximates the centre of rotation of the ankle joint
Footplate with stiff plastic heel designed to eliminate hindfoot movement and holds the
foot at neutral position since hindfoot position can be influenced by subtalar joint axis
(Weaver et al. 2001)
Electromyograph (EMG) is used to ensure that patient is relaxed
Connection to a computer calculates torque and gives and audible indication when the
required torque is reached and when the test is over
Velcro straps hold the device in place
Figure 4.8: The Equinometer (from Digiovanni et al, 2001)

89
However, after carefully noting the text of the various studies found (Assal et al. 2003;
Digiovanni et al. 2002; Weaver et al. 2001) it should be noted that:
It is not clear how the heel cup holds the hindfoot in neutral position; it appears to be
simply fixed to the footplate. Thus probably it is the operator that has to hold the whole
assembly in the required position.
Width and size of hindfeet will obviously vary. There appear to be no facility to adjust
the heel cup to the width of the patient’s heel. Thus if the heel is actually smaller than the
heel cup, it cannot be held so securely and heel rotation inside the cup can occur.
A whole foot plate may invalidate the reading, since during passive dorsiflexion, by the
application of a force on the forefoot, it has been established that forefoot movement
occurs as well (refer to Chapter 6). This movement cannot be completely eliminated, as
previously advocated by the Rootian method (Root et al. 1977).
There appear to be a lot of wires going to and from the device to the personal computer.
These include a power supply and signal conditioner unit that powers and amplifies the
potentiometer and load cell, together with a wire for the two channel EMG (Weaver et al.
2001) (pp 472) and another wire running from the load cell to the bundle of wires at the
lateral side of the device. From this investigator’s previous experience, wires running
from the device can make it more cumbersome and can increase unreliability.
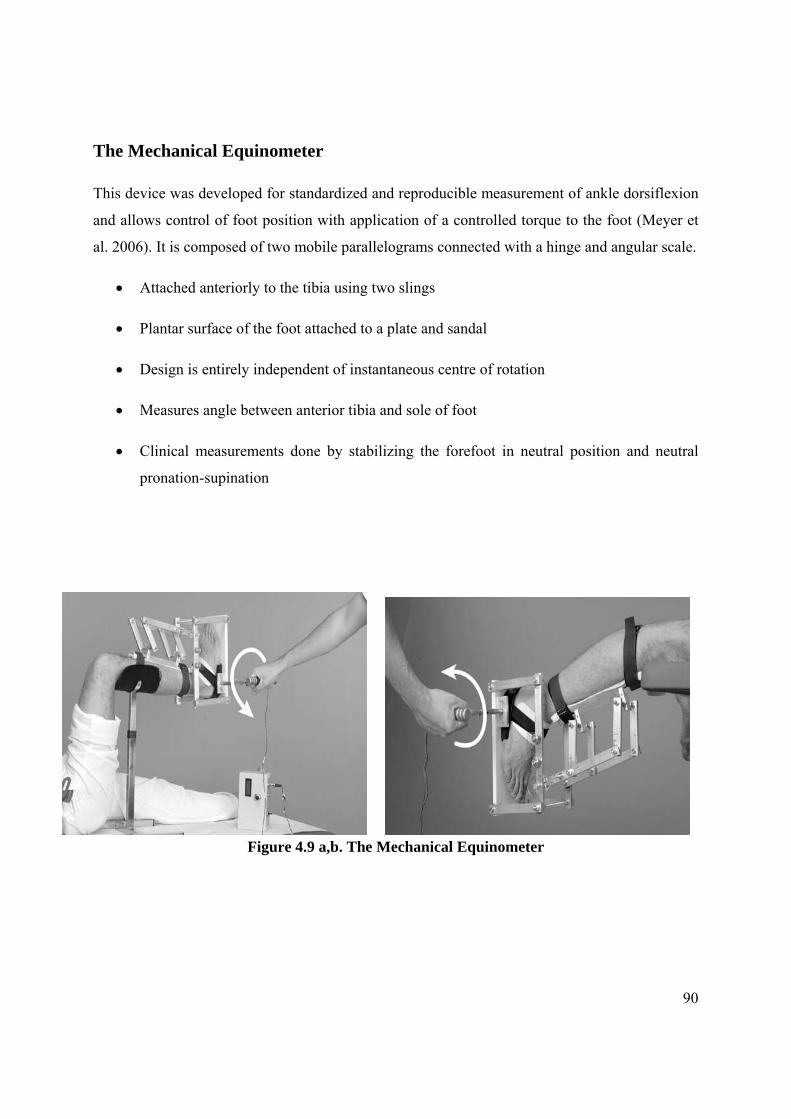
90
The Mechanical Equinometer
This device was developed for standardized and reproducible measurement of ankle dorsiflexion
and allows control of foot position with application of a controlled torque to the foot (Meyer et
al. 2006). It is composed of two mobile parallelograms connected with a hinge and angular scale.
Attached anteriorly to the tibia using two slings
Plantar surface of the foot attached to a plate and sandal
Design is entirely independent of instantaneous centre of rotation
Measures angle between anterior tibia and sole of foot
Clinical measurements done by stabilizing the forefoot in neutral position and neutral
pronation-supination
Figure 4.9 a,b. The Mechanical Equinometer

91
Figure 4.9c: The mechanical equinometer (from Meyer et al, 2006). Note plastic goniometer used to measure angle
The only device using the anterior aspect of tibia; non-standardized alignment
Plastic goniometer may be difficult to assess (small scale, with graduations very near to
each other)
Quite bulky
How subtalar neutral was achieved is not very clear as what mechanism there is
incorporated in the device for allowing this are not discernable from the text or
photographs (operator appears to be only turning handle without holding the foot at
neutral position)
The use of a whole foot plate may invalidate the reading, since during passive
dorsiflexion, by the application of a force on the forefoot, it has been established that
forefoot movement occurs as well (refer to Chapter 6). This movement cannot be
completely eliminated, as previously advocated by the Rootian method (Root et al. 1977).
As this device measures angle of front of tibia to sole of foot, it cannot be said to be
measuring ankle dorsiflexion, but foot dorsiflexion incorporating a potentially substantial
amount of forefoot dorsiflexion.

92
The Iowa Ankle Device
Figure 4.10: The Iowa Ankle Device (Rao et al. 2006).Validated by Wilken et al. (2004).
Device Design Features:
Patients supine with knee extended, then flexed
Long axis of foot aligned with clear acrylic footplate and tibia secured to the base plate
by Velcro straps
Device axis of rotation approximates ankle axis of rotation
Angular measurement with a digital inclinometer which was referenced to the tibial crest
and then mounted on the foot plate which was parallel to the sole of the foot.
Torque controlled with hand-held force gauge

93
Design criticism:
Device does not take into consideration foot position (neutral, supinated, pronated) and
hence possible alteration in ankle/foot dorsiflexion
The use of a plate across the sole of the foot makes this device a “foot dorsiflexion”
measurement device, not an ankle device.
From this investigator’s experience during the design of an ankle goniometer, the bulk of
the gastrocnaemius muscle changes with dorsiflexion/plantarflexion, thus changing the
alignment of the hinge at the lateral malleolus level.

94
A Manually controlled instrumented footplate
Figure 4.11: Demonstrating similarities between a) Instrumented footplate (Moseley et al. 2001) and b) The Iowa Ankle Device (Rao et al. 2006), validated by Wilken et al. (2004). The use of a pyramid shape in Moseley et al. has eliminated the possible interference by
contraction of gastrocnaemius, however pressure on the Achilles Tendon may be painful in instances of Achilles Tendinitis
Subjects supine with knees extended
Shank placed horizontal
Use of a footplate
Lateral malleolus aligned with axis of rotation of footplate
Footplate mounted on pylons using nylon sleeves
Torque measured using a 250N load cell located 0.22m from axis of rotation of footplate
Rotary displacement measured with a potentiometer mounted on the axis
Design criticism:
No provision for controlling foot posture
Use of footplate raises issues as discussed previously

95
A Device Designed To Assess Gastrocnemius Contracture
This device uses “Flock of Birds”, which is a pulsed DC magnetic tracking device for motion
analysis by Ascension Technology Corporation (2010).
Tracking sensor on long axis of the leg, with another on the sole of the foot along the axis
of the second ray. Centre of head of fibula and centre of lateral malleolus were marked,
and a line drawn between markings to delineate the long axis of the leg.
Leg sensor strapped to leg aligned with long axis
Foot component placed orthogonally to the leg piece and device is zeroed
The angle formed by the projections of the two sensors in a two dimensional plane
defined by these sensors is the measured angle of dorsiflexion.
Software measures sagittal plane dorsiflexion
Software measures coronal plane motion (hindfoot eversion) so that the foot can be
placed in a consistently neutral position for measurements to prevent inversion or
eversion at the hindfoot from contributing to the measurement of ankle dorsiflexion
(Greisberg et al. 2002)
Subjects with knees flexed and extended
Foot component separate from leg component to allow ankle and hindfoot to move
through their normal axes.
Foot component consists of a heel cup and a forefoot pad connected on a sliding rail in
order to accommodate various foot sizes
Examiner holds heel in the heel cup and other hand controls the forefoot
Design Criticism:
3-Dimensional tracking technology, while acceptable for laboratory research purposes, is
possibly at present too expensive for everyday clinical use.
Although variation in foot length is addressed by a sliding rail, the size of heel cup does
not appear to make allowances for variability in heel girth.
Like with the use of a plantar plate, the sliding rail from the heel to the forefoot raises
issues with hindfoot to forefoot angles as discussed elsewhere (Chapter 6).
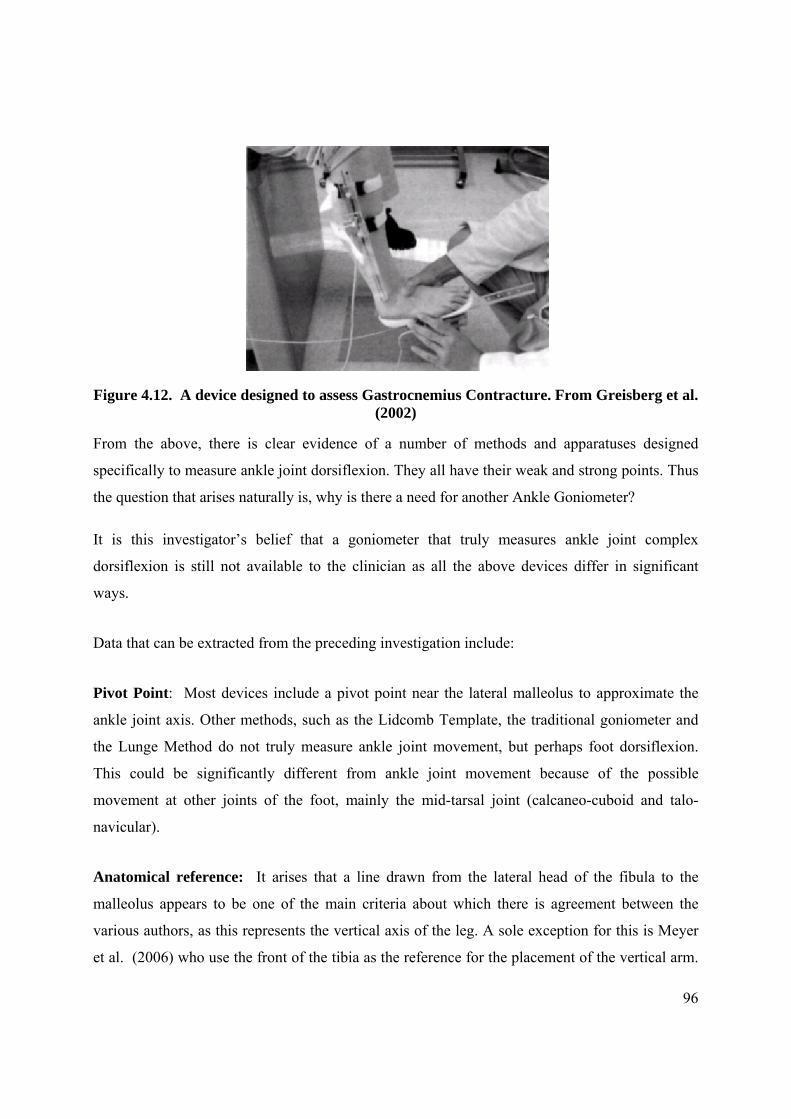
96
Figure 4.12. A device designed to assess Gastrocnemius Contracture. From Greisberg et al. (2002)
From the above, there is clear evidence of a number of methods and apparatuses designed
specifically to measure ankle joint dorsiflexion. They all have their weak and strong points. Thus
the question that arises naturally is, why is there a need for another Ankle Goniometer?
It is this investigator’s belief that a goniometer that truly measures ankle joint complex
dorsiflexion is still not available to the clinician as all the above devices differ in significant
ways.
Data that can be extracted from the preceding investigation include:
Pivot Point: Most devices include a pivot point near the lateral malleolus to approximate the
ankle joint axis. Other methods, such as the Lidcomb Template, the traditional goniometer and
the Lunge Method do not truly measure ankle joint movement, but perhaps foot dorsiflexion.
This could be significantly different from ankle joint movement because of the possible
movement at other joints of the foot, mainly the mid-tarsal joint (calcaneo-cuboid and talo-
navicular).
Anatomical reference: It arises that a line drawn from the lateral head of the fibula to the
malleolus appears to be one of the main criteria about which there is agreement between the
various authors, as this represents the vertical axis of the leg. A sole exception for this is Meyer
et al. (2006) who use the front of the tibia as the reference for the placement of the vertical arm.
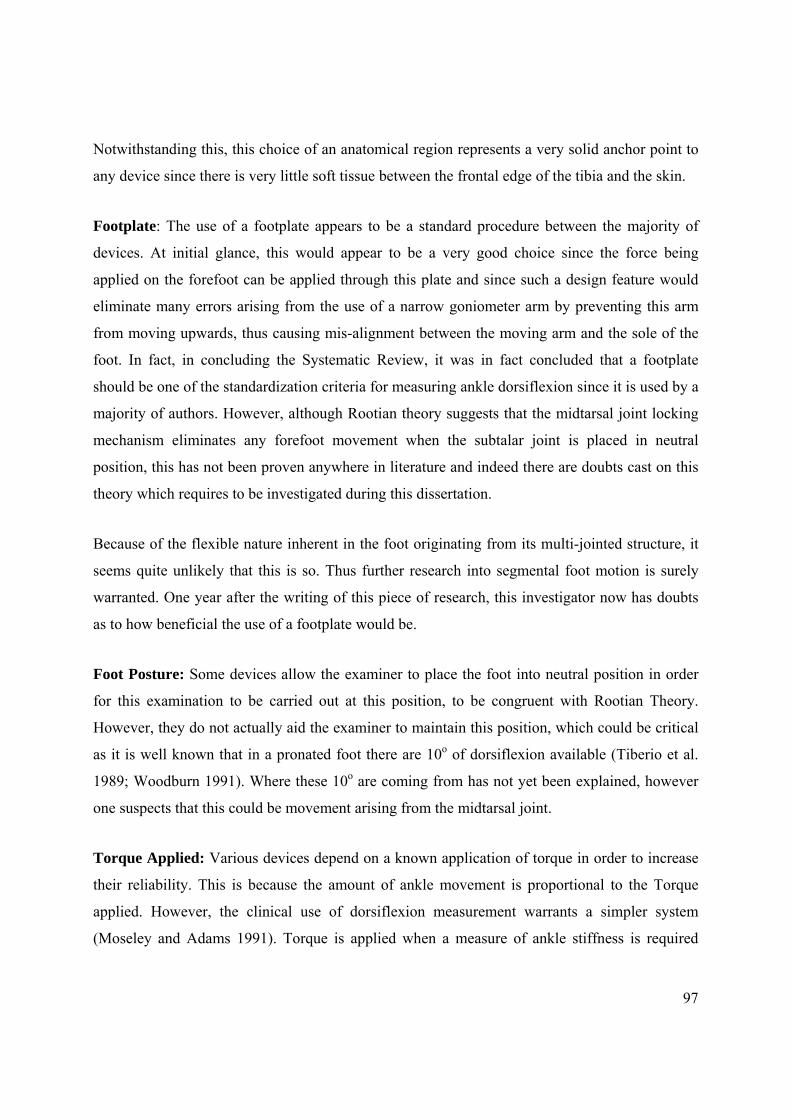
97
Notwithstanding this, this choice of an anatomical region represents a very solid anchor point to
any device since there is very little soft tissue between the frontal edge of the tibia and the skin.
Footplate: The use of a footplate appears to be a standard procedure between the majority of
devices. At initial glance, this would appear to be a very good choice since the force being
applied on the forefoot can be applied through this plate and since such a design feature would
eliminate many errors arising from the use of a narrow goniometer arm by preventing this arm
from moving upwards, thus causing mis-alignment between the moving arm and the sole of the
foot. In fact, in concluding the Systematic Review, it was in fact concluded that a footplate
should be one of the standardization criteria for measuring ankle dorsiflexion since it is used by a
majority of authors. However, although Rootian theory suggests that the midtarsal joint locking
mechanism eliminates any forefoot movement when the subtalar joint is placed in neutral
position, this has not been proven anywhere in literature and indeed there are doubts cast on this
theory which requires to be investigated during this dissertation.
Because of the flexible nature inherent in the foot originating from its multi-jointed structure, it
seems quite unlikely that this is so. Thus further research into segmental foot motion is surely
warranted. One year after the writing of this piece of research, this investigator now has doubts
as to how beneficial the use of a footplate would be.
Foot Posture: Some devices allow the examiner to place the foot into neutral position in order
for this examination to be carried out at this position, to be congruent with Rootian Theory.
However, they do not actually aid the examiner to maintain this position, which could be critical
as it is well known that in a pronated foot there are 10o of dorsiflexion available (Tiberio et al.
1989; Woodburn 1991). Where these 10o are coming from has not yet been explained, however
one suspects that this could be movement arising from the midtarsal joint.
Torque Applied: Various devices depend on a known application of torque in order to increase
their reliability. This is because the amount of ankle movement is proportional to the Torque
applied. However, the clinical use of dorsiflexion measurement warrants a simpler system
(Moseley and Adams 1991). Torque is applied when a measure of ankle stiffness is required
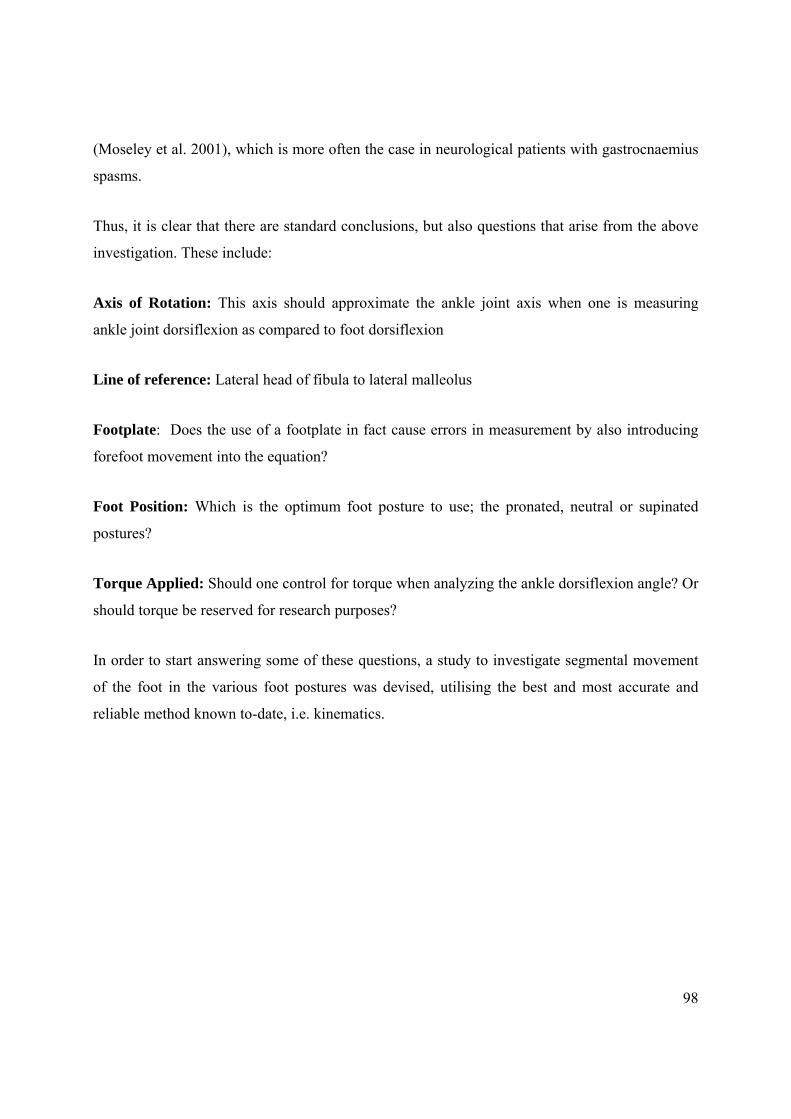
98
(Moseley et al. 2001), which is more often the case in neurological patients with gastrocnaemius
spasms.
Thus, it is clear that there are standard conclusions, but also questions that arise from the above
investigation. These include:
Axis of Rotation: This axis should approximate the ankle joint axis when one is measuring
ankle joint dorsiflexion as compared to foot dorsiflexion
Line of reference: Lateral head of fibula to lateral malleolus
Footplate: Does the use of a footplate in fact cause errors in measurement by also introducing
forefoot movement into the equation?
Foot Position: Which is the optimum foot posture to use; the pronated, neutral or supinated
postures?
Torque Applied: Should one control for torque when analyzing the ankle dorsiflexion angle? Or
should torque be reserved for research purposes?
In order to start answering some of these questions, a study to investigate segmental movement
of the foot in the various foot postures was devised, utilising the best and most accurate and
reliable method known to-date, i.e. kinematics.

Chapter 5
General Experimental Methodology

100
5.0 Background
This chapter outlines the methodology employed during the various trials in order to illustrate the
various equipment, reference systems and the kinematic foot model. All subsequent experimental
chapters will consequently refer to this section.
5.1 Motion Capture
Motion capture and analyses carried out throughout this thesis involved the use of a VICON MX
Motion Analysis System (Vicon, OMG, Oxford, UK) employing 8 MX6 cameras at the
Staffordshire University Gait Laboratory and a similar 6 camera system at the Faculty of
Engineering, University of Malta. Since these two systems were directly compatible, including
the same software version and laboratory layout, this allowed the research to be performed at the
two Labs, utilising the same software and computer hardware.
Figure 5.1 : Biomechanics Lab layout showing camera Vicon placement and couch for participants

101
Nexus, a proprietary software by Vicon, was employed for motion capture while the data was
analyzed using Polygon. The Oxford Foot Model has been chosen to model foot segment motion
of both adult and adolescent participants since this model has been previously validated by
Carson et al (2001) in adults and by Stebbins et al (2006) in children. It has been implemented in
Vicon Nexus software utilising BodyBuilder Software as a standard plug-in, enabling it to be
used by Vicon users in a standardized format. Thus since the marker set has been applied
consistently by the same researcher and both equipment and software are the same, repeatability
of the model is not affected and the results obtained by the two Labs are consistent. Furthermore,
since this is a standard model, the same Joint Co-ordinate System was employed, otherwise the
model would not run. This model is very well described by Stebbins et al (2006), including
anatomical, technical and marker definitions which were adhered to during the implementation
of this model for this research.
The Oxford Foot Model divides the foot into various segments (Figure 5.2) and analyzes:
o the Tibia with respect to the floor
o hindfoot with respect to the tibia
o forefoot with respect to the hindfoot
o hallux with respect to the forefoot

102
Figure 5.2: Schematic of the three segment foot model with tibia: TBTibial segment (tibia and fibula), HF-Hindfoot (calcaneus and talus), FF-Forefoot (five metatarsals),
HX-Hallux (hallux proximal phalanx). (Adapted from Carson et al, 2001)
Table 5.1: Names and positions of markers used in the Oxford foot model (from Stebbins et al, 2006)
Marker name
Position Segment
KNE TTUB HFIB LMAL MMAL SHN1 CAL1 CAL2 CPEG LCAL STAL P1MT P5MT D1MT D5MT TOE HLX
Femoral condyle Tibial tuberosity Head of fibular Lateral malleolus Medial malleolus Anterior aspect of shin Posterior distal aspect of heel Posterior medial aspect of heel Wand marker on posterior calcaneus aligned with transverse orientation Lateral calcaneus Sustentaculum tali Base of first metatarsal Base of fifth metatarsal Head of first metatarsal Head of fifth metatarsal Between second and third metatarsal heads Base of hallux
Femur Tibia Tibia Tibia Tibia Tibia Hindfoot Hindfoot Hindfoot Hindfoot Hindfoot Forefoot Forefoot Forefoot Forefoot Forefoot Hallux
Names in italics are used in the static trial only and are removed for dynamic trials.

103
Figure 5.3 a-d: Marker placement for the Oxford Foot Model
Table 5.1 and Figures 5.3 a-d illustrate markers used in the Oxford Foot Model.
Reproduced from Stebbins et al (2006), segments are defined as follows:
Tibia Segment: assumed to be a rigid body composed of the tibia and fibula. Segment is based
on the plane defined by the line from the knee joint centre to the ankle joint centre and the trans-
malleolar axis. Longitudinal axis is from the ankle joint centre to the knee joint centre. Anterior

104
axis is perpendicular to the plane defined by the longitudinal axis and the trans-malleolar axis.
Transverse axis is mutually perpendicular.
Hindfoot Segment: The calcaneus defines the hindfoot. Motion at the talocrural and sub-talar
joints are considered to contribute jointly to motion of the hindfoot relative to the tibia. Segment
is based on orientation of the mid-sagittal plane of the calcaneus in standing posture (defined by
the line which passes along posterior surface of the calcaneus, which is equidistant from both
lateral and medial borders of this surface, and the point mid-way between the sustentaculum tali
and the lateral border of the calcaneus). Anterior axis from the most posterior aspect of the
calcaneal tuberosity, in the plane defined above and parallel to the plantar surface of the
hindfoot. Lateral axis perpendicular to this plane.
Forefoot Segment: Comprised of the five metatarsals, and assumed to move as a single rigid
body. Segment is based on the plane defined by the centre of distal heads of the first and fifth
metatarsals and the proximal head of the fifth metatarsal. Superior axis is perpendicular to this
plane.
Hallux Segment: Comprised of the proximal phalanx of the hallux. Based on a longitudinal line
along the proximal phalanx.
Dorsiflexion/Plantarflexion of segments:
For the hindfoot relative to the tibia (HINDFOOT/TIBIA): Plantar/dorsiflexion: about the
transverse axis of the tibia.
For the forefoot relative to the hindfoot (FOREFOOT/HINDFOOT): Plantar/dorsiflexion: about
the transverse axis of the hindfoot.

105
Rotations of the forefoot relative to the tibia (FOREFOOT/TIBIA): Plantar/dorsiflexion: about
the transverse axis of the tibia.
Figure 5.4: FF/HF: Plantar/dorsiflexion about the mediolateral axis of the hindfoot, z, in b (adapted from Carson et al, 2001)
5.2 Hindfoot Model
For validation of the Ankle Goniometer, it was necessary to synchronize the goniometer with a
hindfoot model. This model, which had been in use at the Staffordshsire Gait Lab, is based on
the Oxford Foot Model and was constructed using Visual 3D (C-Motion, Germantown, USA).
(http://www.c-motion.com/v3dwiki/index.php?title=Oxford_Foot_ Model). This model was built
in reference to Carson (2001) and Stebbins (2006) who provide very detailed information about
the model.
106
Figure 5.5: Oxford foot model implementation in Visual 3D (https://www.c-motion.com/v3dwiki/index.php?title=Tutorial:_Oxford_Foot_Model#Part_2._Defining_the_tibia_segment )
Figure 5.6 : screenshot which highlights the local coordinate system for the tibia, hindfoot, forefoot and hallux.

107
Laboratory coordinate system
Anterior/posterior Axis – X (Red)
Medial/lateral Axis – Y (Green)
Vertical Axis – Z (Blue)
Cardan sequence
Y (Sagittal), X (Frontal), Z (Transverse)
Filter
Butterworth filter with a low-pass cutoff frequency of 6Hz
5.3 Analysis
The data generated by the Vicon Nexus software was consequently analyzed in Vicon Polygon,
which is the Vicon proprietary software for reporting. This has the Oxford Foot Model
implemented as a plugin, which means that the model can be run seamlessly within this software.
A report was created for each participant, where the required angles were graphed and the angles
measured for:
Maximum Ankle Angle (MaxAnkleAngle)
Maximum Hindfoot to Tibia Angle (MaxHFTBA)
Maximum Forefoot to Tibia Angle (MaxFFTBA)
Hindfoot to Forefoot Angle Range (HFFFA)

108
0 10 20 30 40 50 60 70 80 90 100
-15.0
-10.0
-5.0
0.0
5.0
Normalized (percent)
An
gle
(d
eg
ree
s)
RHFTBA(1)
(L,R)AnkleAngles(1) RHFTBA(1)
0 10 20 30 40 50 60 70 80 90 100
-20.0
-15.0
-10.0
-5.0
0.0
5.0
10.0
Normalized (percent)
An
gle
(d
eg
ree
s)
(L,R)AnkleAngles(1)
(L,R)AnkleAngles(1) RHFTBA(1)
Neutral
0.502, 12.274
Figure 5.7: An example of Ankle Angle (on the left) and Hindfoot to Tibia Angle (on the right) output by Polygon Software, for the same trial. “Dorsiflexion” in both instances is the angle above 0o, whilst Maximum Angle was determined by the maximum height of the
graph. This was performed in the neutral, pronated and supinated postures
In the hindfoot model and electrognoniometer experiment as described in Chapter 10, results of
the synchronized angles were exported to MS Excel as ASCII, for further analysis. Values were
consequently plotted for both the ankle dorsiflexion angles ouput by the Ankle Goniometer and
the Vicon software (Figure 10.5).
5.4 Dorsiflexion Terminology:
According to Siegler et al (2002), definitions of the hindfoot include:
The ankle (talocrural) joint: The articulation formed between the talus and the tibia/fibula.

109
The subtalar (talocalcaneal) joint: The articulation between the talus and the calcaneus.
The ankle joint complex: The structure composed of the ankle and the subtalar joints.
As regards “foot dorsiflexion”, there is an increase in complexity as the other foot joints must be
taken in consideration, keeping in mind that the foot is multi-segmental and often with large
ranges of motion at these joints, e.g. the midtarsal joint.
Thus it is important to maintain a standardized definition of the various dorsiflexion movements
available at the foot and ankle since there are distinct differences in the various forms of this
sagittal plane motion. As outlined in Section 2.2, three types of dorsiflexion movements are
referred to throughout this thesis. These include:
Foot Dorsiflexion: Sagittal plane movement of the whole foot with the dorsum of the foot raised
towards the lower leg. This implies that this upward movement can occur at all the joints capable
of allowing this type of movement, which include the ankle, subtalar and midtarsal joints. Thus
this movement is a summation of all the dorsiflexion movement, as represented in traditional
Kinematic analysis using a single segment model of the foot.
Ankle Dorsiflexion: Sagittal plane movement of the whole foot with the dorsum of the foot
raised towards the lower leg occurring only at the ankle joint. This type of motion, according to
the Rootian Theory, is said to occur when the subtalar joint is placed at neutral position, the
midtarsal joint is ‘locked’ and a dorsiflexing moment applied to the ball of the foot.
Hindfoot dorsiflexion: Ankle joint complex dorsiflexion, which includes dorsiflexion at the
ankle (talo-crural) and subtalar joint.

110
Hence, this convention will be adhered to throughout this thesis. The term “Maximum Foot
Dorsiflexion” refers to the upward, sagittal plane movement of the whole foot, which includes
movement in all available foot joints, until the end of available motion. This can also be termed
‘Tibia to Foot’ angle, with an example output of ‘Tibia to foot angle’ being shown in Figure
2.10.
The term “Maximum Ankle Dorsiflexion” refers to the upward, sagittal plane movement of the
ankle joint until the end of available motion. In the Oxford Foot Model, this is calculated by the
angle formed between the ‘tibia and hindfoot’ segment; an example of this movement is
demonstrated in Figure 2.10.

111
Chapter 6
A repeated measures study to explore the effect of foot posture
on Sagittal Plane Kinematics of the Foot during Passive Ankle
Dorsiflexion in Healthy Adults
Aspects of this chapter have been published:
Gatt A, Chockalingam N, Chevalier TL. 2011. Sagittal plane kinematics of the foot during passive ankle dorsiflexion. Prosthetics and Orthotics International. 35(4). pp. 431 - 437.
112
6. 0 Introduction
Examination of the range of motion of the ankle joint is a routine clinical procedure for the static
diagnosis of ankle equinus (Rome 1996) and to assess the influence of disease and joint surgery
(Backer and Kofoed 1989). This examination involves the dorsiflexion of the foot through the
application of force at the metatarsophalangeal joint area. As has already been established, the
maximum ankle dorsiflexion angle may be assessed through a variety of techniques, such as
visual estimation (Digiovanni et al. 2001), goniometry (Gajdosik and Bohannon 1987; Gastwirth
1996; Root et al. 1977) or with the use of one of the various ankle measuring devices (Assal et
al. 2003; Donnery and Spencer 1988; Hume et al. 2000; Wilken et al. 2004). The goniometric
measurement of maximum dorsiflexion is a clinical procedure during which the stable arm of the
goniometer is aligned between the lateral head of the fibula and the lateral malleolus, while the
moving arm is held along the lateral border of the foot up to the 5th metatarsal head. The subtalar
joint is placed in neutral position and a dorsiflexing force is applied to the fourth and fifth
metatarsophalangeal joints (Gastwirth 1996; Root et al. 1977). Reliability of this technique,
however, has been criticized by various authors (Martin and Mcpoil 2005; Rome 1996; Van
Gheluwe et al. 2002; Wrobel and Armstrong 2008), which casts serious doubts as to whether this
technique should be used at all. Moreover, even in research, this technique is also used routinely
(Kilgour et al. 2003; Mecagni et al. 2000).
While ankle and foot dorsiflexion during gait has been studied extensively, there is little
information regarding passive dorsiflexion, such as manual dorsiflexion of the foot. This manual
dorsiflexion forms an important part of any clinical assessment related to foot pathologies.
Furthermore, the resultant angle determines diagnosis of equinus-related conditions and it may
influence treatment given to the patient. Thus it is essential to understand foot mechanics when
force is applied to the forefoot and the foot is dorsiflexed.
An important aspect of clinical ankle dorsiflexion measurement is foot posture, i.e. the effect of
pronation and supination on the maximum foot dorsiflexion angle. In one study, in which
maximum ankle dorsiflexion was measured on a projection of a 35mm slide, a significant
difference between the neutral position and the pronated position was found (Tiberio et al. 1989).
Two-dimensional video analysis was also used to measure ankle dorsiflexion in 30 healthy

113
females. In this study, an increase of 10o of dorsiflexion was noted in pronated feet (Woodburn
1991). Both studies concluded that the measurement of ankle dorsiflexion should be performed
with the subtalar joint at neutral position.
The procedure behind clinical examination of ankle dorsiflexion has an important assumption
that has never been clinically proven: that when the foot is placed in neutral position and the foot
is dorsiflexed by applying a force on the metatarsophalangeal joints, movement occurs only at
the ankle joint (Root et al. 1977). However, the foot is composed of several segments, with
movement occurring between the various joints. Research has shown that the movement between
these foot joints may be quite extensive during gait. Hypermobility of the forefoot, for example,
is a very common finding during clinical examination. This forefoot movement may, in fact, be
providing false results; ankle equinus may not be diagnosed because the foot has bypassed the 0o
mark or, according to some clinical theories, has exceeded 10o of dorsiflexion. These 10o may, in
fact, be mostly attained by the upward movement of the forefoot at the midtarsal joint, and not at
the ankle joint itself. This would be a clear case of misdiagnosis and a patient with ankle equinus
may not get the required treatment because of an apparent ‘normal’ amount of dorsiflexion. This
may result in a midtarsal joint break, which is noted as a characteristic of equinus feet.
While hypothesizing that foot postures alter sagittal foot and foot segment motion, this study
aimed to investigate ankle dorsiflexion in various foot postures. Furthermore, this study
examined the intrinsic sagittal foot segment motion during passive ankle joint dorsiflexion, as
would happen during normal clinical examination of ankle range of motion through goniometry
as outlined by Root et al (Gajdosik and Bohannon 1987; Gastwirth 1996; Root et al. 1977).
Aim:
To investigate the effect of foot posture on sagittal plane foot segment kinematics during
the clinical assessment of passive maximum ankle joint dorsiflexion and maximum foot
dorsiflexion.
114
Objectives:
o To kinematically quantify maximum foot and ankle joint dorsiflexion angles at the
pronated, neutral and supinated postures.
o To determine whether the Forefoot to Rearfoot Angle remains constant during
passive dorsiflexion as force is applied to the forefoot
o To assess whether the hindfoot to tibia angle is proportional to the forefoot and tibia
angle
6.1 Method
16 healthy subjects (4 females, 12 males) with a mean age of 35.5 yrs (range 20-56yrs) were
invited to participate in this study. Ethical approval was sought from and granted by
Staffordshire University Ethics Committee. The experimental process was explained both
verbally and through the use of an information sheet (Appendix 1) to all participants, who signed
informed consent. Exclusion criteria included neurological disease, history of foot surgery and
obvious foot deformity.
Height and weight, leg length, knee and ankle width was recorded for each subject to create their
corresponding lower-limb kinematic model. An 8-camera optoelectronic system (Vicon, OMG,
Oxford, UK) was employed to collect the kinematic data at 100Hz (Ref to Chapter 5). Reflective
markers were placed by the primary researcher (a clinician), using the Oxford Foot Model
marker set, then cross-checked by an experienced researcher. After a standing static calibration,
the markers were checked again and another static calibration was carried out with the subject
sitting on the couch. This position was necessary so that the Posterior Superior Iliac Spine
markers were visible to the rearmost cameras.
Each subject’s right foot was held in one of the 3 possible postures by the primary researcher
(i.e. maximally pronated, subtalar neutral or maximally supinated), using the talonavicular
congruency method (Root et al. 1977). The sequence of these foot postures was determined
randomly by the other researcher to avoid any bias that could affect the results. The foot was
dorsiflexed slightly to minimum resistance, then to its limit by the application of a force on the

115
forefoot, at the metatarsophalangeal joint area. It was held in that position for three seconds
before being released.
The primary focus of the methodology was to keep in line with normal clinical assessment. To
ensure neutral subtalar joint position, the talar head was palpated until it was felt equally on the
lateral and medial aspects, then maintained while the foot was dorsiflexed. The pronated position
was maintained by directing the force laterally and ensuring that only the medial head of talus
was palpable, while the supinated position was maintained by palpation of the talar head on the
lateral side. Ten repetitions for each posture were done, for a total of 30 trials per subject. The
following variables were recorded in three different foot positions (supinated, neutral and
pronated):
Table 6.1: Variables used to denote dorsiflexion terminology throughout the thesis
Symbol Variable Name Explanation dorsi, max Maximum Foot
dorsiflexion Maximal passive dorsiflexion measured in the sagittal plane
hindfoot, ROM Hindfoot range of movement
Range of movement of the hindfoot with regards to the tibia
forefoot, ROM Forefoot range of movement
Range of movement of the forefoot with regards to the tibia
forefoot Forefoot movement Forefoot movement with regards to the hindfoot
Each subject’s data were normalized and then averaged for each condition. Further statistical
analyses were performed using SPSS 17.0, with the level of significance set at p=<0.005
throughout all statistical analysis. Data were analyzed with the Kolmogrov-Smirnov test, which
returned a non-significant p-value of 0.200 for all three postures, thus demonstrating a normal
distribution.
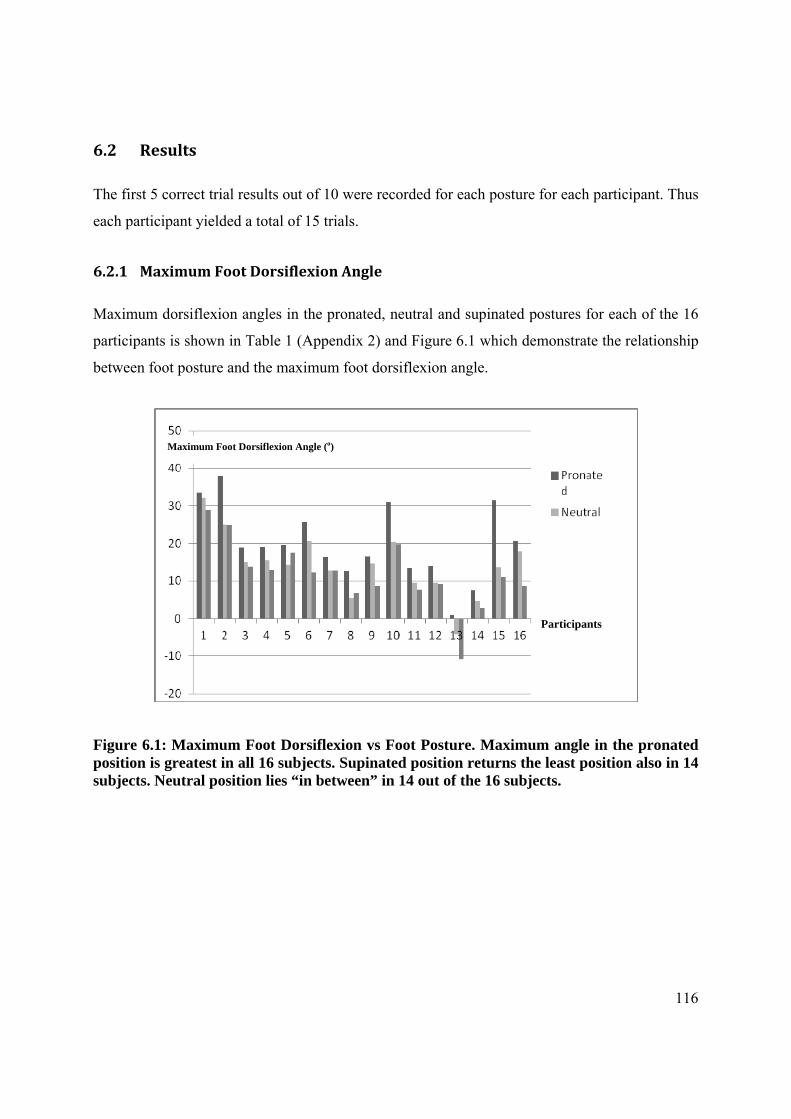
116
6.2 Results
The first 5 correct trial results out of 10 were recorded for each posture for each participant. Thus
each participant yielded a total of 15 trials.
6.2.1 Maximum Foot Dorsiflexion Angle
Maximum dorsiflexion angles in the pronated, neutral and supinated postures for each of the 16
participants is shown in Table 1 (Appendix 2) and Figure 6.1 which demonstrate the relationship
between foot posture and the maximum foot dorsiflexion angle.
Figure 6.1: Maximum Foot Dorsiflexion vs Foot Posture. Maximum angle in the pronated position is greatest in all 16 subjects. Supinated position returns the least position also in 14 subjects. Neutral position lies “in between” in 14 out of the 16 subjects.
Participants
Maximum Foot Dorsiflexion Angle (o)

117
Figure 6.2: Example of Foot Dorsiflexion Graph in the pronated, neutral and supinated positions as output by Polygon software (Vicon)
6.2.2 Hindfoot and Forefoot Movement
Table 2 (Appendix 2) shows the forefoot to hindfoot angle range of movement in the pronated,
neutral and supinated postures.
6.3 Statistical Analysis
6.3.1 Maximum Foot Dorsiflexion Angle
A One way repeated measures Analysis of Variance (Anova) was conducted to compare the
mean Maximum Foot Dorsiflexion Angle between the 3 foot postures, which indicated a
significant difference between groups (p=0.000) (Table 4, Appendix 2). As shown in Table 5
(Appendix 2), the mean maximum foot dorsiflexion angle is significantly different in both the
pronated to neutral postures and pronated to supinated postures (p=0.000). Likewise, there is also

118
a significant difference in maximum foot dorsiflexion between the neutral and supinated postures
(p=0.032).
Figure 6.3a: Foot segment vs Foot Posture
Figure 6.3b: Foot segment Ankle Range of Motion vs Foot Posture
Figures 6.3 a and b demonstrate increased forefoot movement relative to hindfoot movement in the pronated, neutral and supinated postures.

119
The difference between the mean maximum foot dorsiflexion angle between pronated and
neutral is 5.78o; between pronated and supinated is 8.27o, while between supinated and neutral it
is only 2.49o (Table 3, Appendix 2).
As shown in Figure 6.3, the mean Maximum Foot Dorsiflexion Angle in the Pronated posture is
higher than the corresponding mean angles in the Neutral and the Supinated positions for all
participants. The general trend indicates that the maximum foot dorsiflexion angle is reached in
the pronated posture, reduced in the neutral posture, further reduced in the supinated posture.
This is true in 14 out of the 16 participants: 87.5% of subjects. A typical subject results are
illustrated in Figure 6.2.
6.3.2 Hindfoot and Forefoot Movement
A two-way Anova was used to compare the Mean Angle Range of Movement of the hindfoot
and forefoot at each of the Foot Postures.
The mean dorsiflexion range of motion differ significantly between the 3 foot types for both
hindfoot and forefoot (p=0.008). As indicated in Figures 6.3a and b, the mean angle range for the
pronated foot posture is significantly higher than the other foot postures both for the forefoot and
hindfoot segments (Mean angles recorded for forefoot and hindfoot in Pronated, Neutral and
Supinated foot types were, 38.24(SD 12.44) and 26.42 (SD 6.83), 32.67(SD7.47) and 21.26
(6.71) and 32.875(SD8.66) and 20.08 (SD4.83) respectively) (Table 6, Appendix 2).
Pronated to Neutral Posture returns a p-value of 0.027, while Pronated to Supinated Posture is
also significant, with a p-value of 0.014. On the other hand, there is no significant difference
between the Neutral and Supinated Postures, with a p-value of 0.969 (Table 7, Appendix 2).
The p-value for the Interaction Term (p=0.942) exceeds the 0.05 level of significance, indicating
that the line graphs for the forefoot and hindfoot are fairly parallel, i.e. what is happening in the
forefoot is also happening in the hindfoot. However forefoot scores are significantly higher
(Figure 6.3). Thus the forefoot range of motion is greater than the hindfoot range of motion

120
throughout the three foot postures: there is always more forefoot range of motion than the
hindfoot in all foot postures.
6.3.3 Forefoot to Hindfoot Angle
According to the way that the Oxford Foot Model estimates the forefoot to hindfoot angle, if
there is only hindfoot movement with no forefoot movement relative to the hindfoot, during
ankle dorsiflexion, this angle would remain constant during the dorsiflexing procedure.
However, as shown in Figure 6.4, with the application of force during dorsiflexion, the angle
increased, then remained at the same position during the period of time when the foot was held at
a dorsiflexed position. This then decreased again as the foot was released.
One way repeated measures Anova indicated a significant difference for the forefoot to hindfoot
ankle range of motion (p=0.007). Pairwise comparisons demonstrated a non-significant
difference between the pronated and supinated postures (p=0.139) and neutral and supinated
(p=0.147) but a significant difference between pronated and supinated postures (p=0.005) (Table
8, Appendix 2).
Figure 6.4: Example of Forefoot to Hindfoot movement graph. 1st sector is the dorsiflexing part; 2nd sector is the foot being held in the dorsiflexed position; 3rd sector is release of the
foot back to its original position
121
6. 4 Discussion
Little is known about what actually happens to the various foot segments when a dorsiflexing
force is applied to the forefoot during the clinical examination for ankle dorsiflexion. Thus this
research was carried out to investigate sagittal plane kinematics of passive ankle joint
dorsiflexion, such as would occur during the measurement of the maximum ankle dorsiflexion
angle, using a 3D motion capture system. As the foot is multi-segmental, it is important to
determine whether there is pure ankle joint movement or whether there is forefoot movement as
well during this process. Root Theory advocates the use of subtalar joint neutral position in order
to lock forefoot movement at the midtarsal joint. Issues regarding both the neutral position
(Elveru et al. 1988) and the midtarsal joint locking mechanism have been amply discussed
elsewhere.
This procedure has thus never been investigated using a structured method such as the Oxford
Foot Model. Whereas in traditional 3D motion capture systems the foot is treated as a single
rigid lever, this model can measure segmental motion within the foot.
Two previous studies (Tiberio et al. 1989; Woodburn 1991), using measurements obtained from
projections of 35mm slides (Tiberio et al. 1989) and video (Woodburn 1991) that investigated
the effect of foot posture on maximum ankle dorsiflexion, both concluded that the pronated foot
posture produces significantly more dorsiflexion than the other postures. Although these studies
also concluded that ideally ankle angle assessment should be carried out at subtalar joint neutral,
Woodburn advocated reverting to a ‘slightly supinated position’ when there is uncertainty in
establishing a neutral position, a conclusion confirmed by the results of this trial. Furthermore,
the study by Woodburn established a difference of 3.5 o between the neutral and supinated
posture, which is also supported by this trial since the difference amounted to 2.49o
Not only is the effect of foot posture on maximum foot dorsiflexion important because of issues
of unreliability in placing the subtalar joint at neutral position (Elveru et al. 1988) but
movement within the foot itself must be investigated to verify whether, after “locking” the
midtarsal joint, by placing the foot at neutral, the only movement left during manual dorsiflexion
of the foot is indeed pure ankle joint movement (Root et al. 1977).
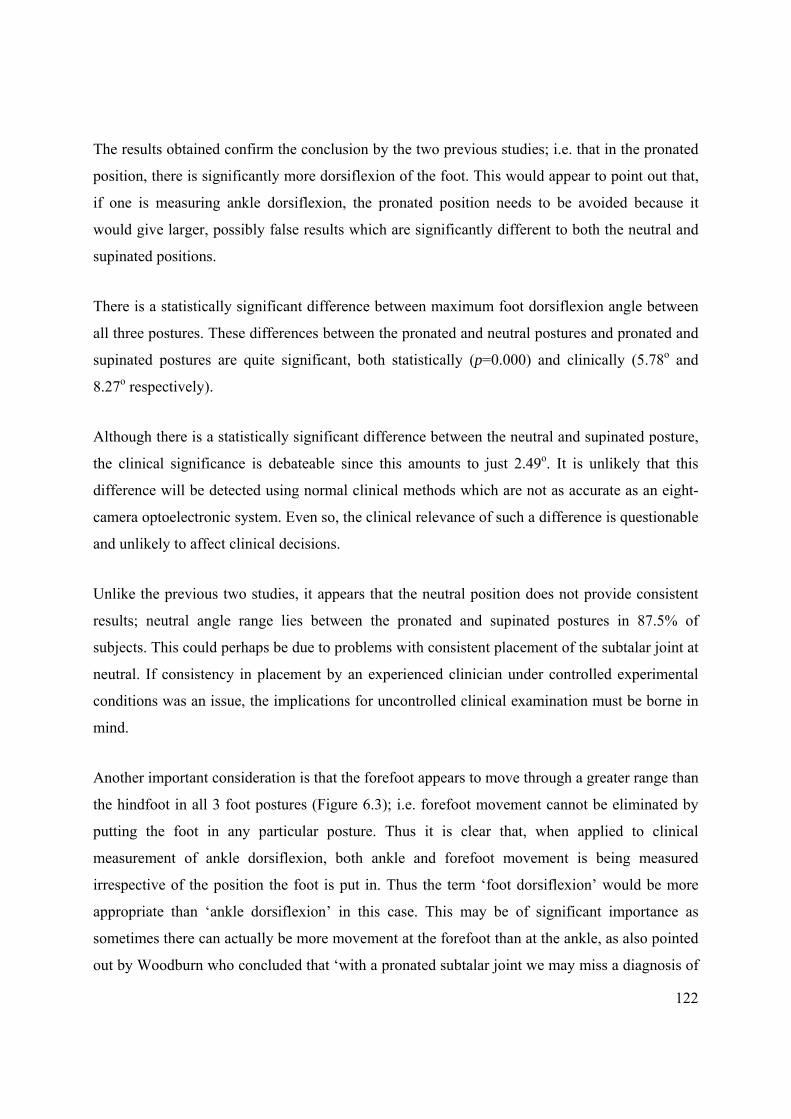
122
The results obtained confirm the conclusion by the two previous studies; i.e. that in the pronated
position, there is significantly more dorsiflexion of the foot. This would appear to point out that,
if one is measuring ankle dorsiflexion, the pronated position needs to be avoided because it
would give larger, possibly false results which are significantly different to both the neutral and
supinated positions.
There is a statistically significant difference between maximum foot dorsiflexion angle between
all three postures. These differences between the pronated and neutral postures and pronated and
supinated postures are quite significant, both statistically (p=0.000) and clinically (5.78o and
8.27o respectively).
Although there is a statistically significant difference between the neutral and supinated posture,
the clinical significance is debateable since this amounts to just 2.49o. It is unlikely that this
difference will be detected using normal clinical methods which are not as accurate as an eight-
camera optoelectronic system. Even so, the clinical relevance of such a difference is questionable
and unlikely to affect clinical decisions.
Unlike the previous two studies, it appears that the neutral position does not provide consistent
results; neutral angle range lies between the pronated and supinated postures in 87.5% of
subjects. This could perhaps be due to problems with consistent placement of the subtalar joint at
neutral. If consistency in placement by an experienced clinician under controlled experimental
conditions was an issue, the implications for uncontrolled clinical examination must be borne in
mind.
Another important consideration is that the forefoot appears to move through a greater range than
the hindfoot in all 3 foot postures (Figure 6.3); i.e. forefoot movement cannot be eliminated by
putting the foot in any particular posture. Thus it is clear that, when applied to clinical
measurement of ankle dorsiflexion, both ankle and forefoot movement is being measured
irrespective of the position the foot is put in. Thus the term ‘foot dorsiflexion’ would be more
appropriate than ‘ankle dorsiflexion’ in this case. This may be of significant importance as
sometimes there can actually be more movement at the forefoot than at the ankle, as also pointed
out by Woodburn who concluded that ‘with a pronated subtalar joint we may miss a diagnosis of

123
true limitation’. On the other hand, our results show that there is little clinical difference between
the neutral and maximally supinated postures, which is not in agreement with the statement that
‘with a supinated subtalar joint we falsely diagnose ankle equinus’.
Using a different, yet clinically relevant methodology to previously published papers, the current
study has obtained different results for hindfoot movement. Surprisingly, hindfoot movement is
not constant as reported elsewhere and appears to vary with posture as well. As the amount of
movement at the ankle joint should not be affected by changing foot posture, this can only
happen at the subtalar joint; namely the sagittal plane component of movement of this
articulation. This is in total disagreement with other studies which had concluded that there is no
sagittal plane movement at this joint in a non-weightbearing situation (Leardini et al. 1999b;
Leardini et al. 2001).
6.5 Limitations
There were some limitations to this study, including the small sample size, which consequently
points to a need for another similar study on a larger scale. Time constraints, together with the
fact that the trial week coincided with the first week of semester, prevented us from finding more
subjects in the week’s time that was available.
The exclusion of subjects with specific foot conditions, and patient populations, imply that the
results of this study cannot be inferred to actual patients, but only to healthy subjects. Children
would also have possibly produced a different outcome due to their increased foot flexibility.
Subject 13 had an obvious limitation of dorsiflexion and perhaps should have been excluded
from the study in order to obtain a more homogenous result.
The fact that we opted not to control for force applied to the forefoot, as some other studies,
could be an important limitation of the study. However, we were mostly interested in the clinical
application of this technique and clinicians do not normally apply a known force, but dorsiflex to
the end of the range of motion.

124
Foot starting position could also be another important limitation. However, whatever the starting
position, the tibia to hindfoot and tibia to forefoot angles would still have travelled through the
same angle should dorsiflexion have occurred only at the ankle joint.
6.6 Conclusions
1. The amount of sagittal foot movement, including the range of forefoot and hindfoot
movement, varies depending on foot posture.
2. Foot dorsiflexion was maximum at the pronated posture in all participants; it was least in
the supinated posture in 87.5% of subjects. Changing posture does not totally eliminate
forefoot movement.
3. When dorsiflexing the foot using a manual force on the plantar metatarsophalangeal joint
area, the forefoot moved through a greater angle than the hindfoot in all the investigated
foot postures. This was also confirmed by the forefoot to hindfoot angle, which increased
with the application of force during dorsiflexion. This implies that the mid-tarsal joint
locking mechanism does not function at neutral position, that pure ankle dorsiflexion
cannot be obtained in this manner and thus any apparatus, such as the traditional
goniometric method, that measures foot dorsiflexion across the forefoot and hindfoot may
actually be measuring the summation of the movement of both foot segments.
4. Thus foot posture is an important element that must be borne in mind when conducting
foot dorsiflexion measurements.

Chapter 7
A repeated measures study to explore the effect
of foot posture on Sagittal Plane Kinematics
Of passive dorsiflexion of the foot
In Adolescents
Aspects of this work have been accepted for publication:
Gatt A, Chockalingam N. 2012. Sagittal Plane kinematics of passive dorsiflexion of the foot in adolescent athletes. Journal of the American Podiatric Medical Association (In Press).

126
7.0 Introduction
Although assessment of the passive maximum foot dorsiflexion angle is performed routinely,
there is a paucity of information regarding adolescents’ foot and foot segment motion during this
procedure. There are currently no trials investigating kinematics of the adolescent foot during
passive foot dorsiflexion to determine what occurs during this clinical manoeuvre. Hence this
chapter will investigate the effect of foot posture on maximum foot dorsiflexion and segmental
motion during passive dorsiflexion in adolescents in order to inform the prospective
clinician/researcher as to foot and foot segment movement of adolescent feet during this
procedure.
7.1 Background
Various authors have proposed different normative angular values for ankle dorsiflexion during
gait. Unfortunately it is not always differentiated whether “ankle” or “foot” dorsiflexion is being
reported in a paper; as already pointed out throughout this thesis, there is a significant difference
between the two terms. It is claimed that during normal locomotion, 10o of ankle dorsiflexion is
required for the forward translation of the centre of gravity of the body to occur during single
limb support (Root et al. 1977). According to Tiberio (1987), between 5o and 15o is necessary for
walking. However, Sullivan (1997) emphasizes that 15o are necessary, with anything less
producing compensations and foot adaptations leading to pain and deformity. Another trial
investigating kinematics of ankle dorsiflexion during gait reported results between 12o and 22o
(Weir and Chockalingam 2007). The authors concluded that, during gait, ankle joint dorsiflexion
in normal subjects is greater than the value traditionally reported.
7.1.1 Foot Dorsiflexion in Children
While this applies to adult foot dorsiflexion, there is certainly a paucity of scientific information
regarding passive dorsiflexion in children. The majority of scientific literature appears to
concentrate on the effect of neurological disorders on ankle dorsiflexion, with little attention
being given to normative data in healthy children.

127
Saxena and Kim (2003) studied a group of 40 adolescent athletes (16 girls and 24 boys) with a
mean age of 14.8 yrs +/- 0.8years. “0°” was defined as a 90° relationship between the lateral
border of the foot and the long axis of the leg. Ankle dorsiflexion was measured at subtalar joint
neutral position, using a goniometer aligned with the lateral border of the foot and the long axis
of the leg, with the subjects lying supine, first with the knees extended, then flexed. Dorsiflexion
of the right ankle was 0.35° ± 2.2° with the knee extended and 4.88° ± 3.23° with the knee
flexed. The values for the left ankle were –0.6° ± 2.09° and 4.68° ± 3.33°. There were no
statistically significant differences between the sexes. The authors concluded that the average
ankle dorsiflexion in asymptomatic athletes was 0o with the knees extended and 5o with the
knees flexed. They also concluded that some degree of equinus is “normal” in adolescent
athletes. These results show an influence of the gastrocnaemius since knee position affected the
results; perhaps, being athletes, their gastrocnaemius was more developed than the average.
However, the overwhelming evidence of unreliability of goniometric measurement (Elveru et al.
1988; Kim et al. 2011; Martin and Mcpoil 2005; Rome 1996; Wrobel and Armstrong 2008) casts
doubt as to the validity of these results.
In a study of 82 children with injured ankles, Tabrizi et al (2000) found mean dorsiflexion values
of 5.7° with the knee extended and 11.2° with the knee flexed. In 85 controls, dorsiflexion was
12.8° and 21.5° respectively. However, to what extent the ankle injuries could have limited the
amount of dorsiflexion is unclear.
Studying a population with an average age of 25 years, in which ankle dorsiflexion was
measured with a supinated foot, Grady and Saxena (1991), found values of 3° with the knee
extended and 9° with the knee flexed. This differs from other later studies by the same authors
(2003) where the foot was not kept in any specific position, so other joints could have
dorsiflexed as well (Lundgren et al. 2008), making comparison difficult. Notwithstanding this,
the value of 3° and 9° compare quite well with that of 0° and 5° with knees extended, then flexed
respectively. The authors themselves admit that one of the limitations of the study was the
goniometric assessment, which is subject to evaluator variability and thus raises questions as to
the validity of the measurement (Saxena and Kim 2003).

128
The study of intrinsic foot movement is nowadays possible with the use of kinematic foot
models, such as the Oxford Foot Model. This model, which has been shown to be reliable both in
adults and children (Carson et al. 2001; Stebbins et al. 2006; Wright et al. 2011), divides the foot
into tibia, hindfoot, forefoot and hallux segments. It has been employed in the previous trial
investigating foot segment analysis of passive foot dorsiflexion in adults (Chapter 5).
7.1.2 Need for this study
Since children’s feet are inherently more flexible than adult feet, it is being postulated that these
will function differently during passive ankle dorsiflexion. Hence it was hypothesised that foot
posture would affect the maximum ankle angle and the range of movement of the tibia to
hindfoot and tibia to forefoot angles, with adolescent feet acting in a different manner to adult
feet
Aim:
To investigate the effect of foot posture on maximum foot dorsiflexion in
adolescents during passive foot dorsiflexion.
Objectives:
o To measure passive maximum foot dorsiflexion utilising an optoelectronic motion
capture system in the pronated, neutral and supinated foot postures.
o To measure forefoot to rearfoot angle in the sagittal plane within the 3 foot
postures.
o To determine the effect of foot posture in adolescents along with inter-segmental
kinematics of the foot in adolescents.
129
7.2 Method
Ethical permission was sought from and granted by the Faculty of Health Sciences Ethics Board
and consequently by the University of Malta Research Ethics Committee. As all participants
were minors, informed consent was obtained both from parents and participants following an
explanation of the research process both verbally and through an information sheet. Relevant
application form together with approval, information sheets and consent sheets may be found in
Appendix 1. Although an attempt was made to recruit mixed-gender participants, only a number
of females attended on the day of data collection. Unfortunately, due to Lab utilization, it was
not possible to replicate the exact equipment and laboratory setup on another day so that a
number of male participants could be enrolled, hence the available participants had to suffice. As
it turned out, all respondents attended a gymnastics club which, in retrospect, enabled this trial to
compare adolescent athletes’ dorsiflexion with the values obtained by Saxena and Kim (2003),
but utilising a much more accurate and validated method. It was thought that, since all
participants trained in gymnastics on an amateur basis, they would also be representative of other
adolescents as many such-aged children would still be engaged in active physical activities.
A convenience sample of 8 females with a mean age of 13.2years (range 11-16 (SD 1.7)) and a
mean height of 1.53m (SD 0.09m) were recruited from a local gymnastics club. Participants
trained in this sport on an amateur basis, attending two to three, 3 hour sessions per week.
Exclusion criteria included any recent foot injury, pain, presence of neurological or systemic
conditions and musculoskeletal deformities. Data collection took place at the Gait Laboratory at
the Faculty of Engineering, University of Malta.
Markers, as required by the Oxford Foot Model protocol (Fig 7.1), were applied to each
participant’s lower extremities, with the full marker set on the right foot. A 6-camera
optoelectronic system (Vicon, OMG, Oxford, UK), sampling at 100Hz, was employed to capture
motion. Each participant was seated on a flat examination couch, with the arms gripping the
sides of the couch for support, to ensure that all markers, especially the right and left posterior
superior iliac spine markers (LPSI and RPSI) were visible to at least 2 cameras. Camera
placement is shown in Figure 7.2. Although 6 cameras provided a challenge for data collection,

130
the fact that only passive foot movement was collected enabled this process to be performed
quite consistently.
Figure 7.1: Oxford Foot Model Marker Set

131
Figure 7.2: Camera placement in relation to subject position
The principal investigator (AG), who has over 20 years’ of clinical experience in finding subtalar
joint neutral position, was responsible for maintaining the foot in the 3 required postures: i.e.
pronated, neutral and supinated. Each posture was determined randomly by the biomedical
engineer responsible for the gait laboratory, who was also responsible for data capture. Foot
posture was determined by the talo-navicular congruency method: neutral position was
determined by equally palpating the head of talus on the medial and lateral aspect; the pronated
position was determined when the head of talus was only palpable on the medial aspect, while
the supinated position was determined when the head of talus was only palpable on the lateral
aspect. Although finding subtalar joint neutral has been shown to be notoriously difficult for
less-experienced raters (Elveru et al. 1988; Pierrynowsky et al. 1996), an Intraclass Correlation
Coefficient of 0.88 has been demonstrated in experienced clincians (Elveru et al. 1988) who are
claimed to be within +/- 3o of subtalar neutral position 90% of the time (Pierrynowsky et al.
1996).
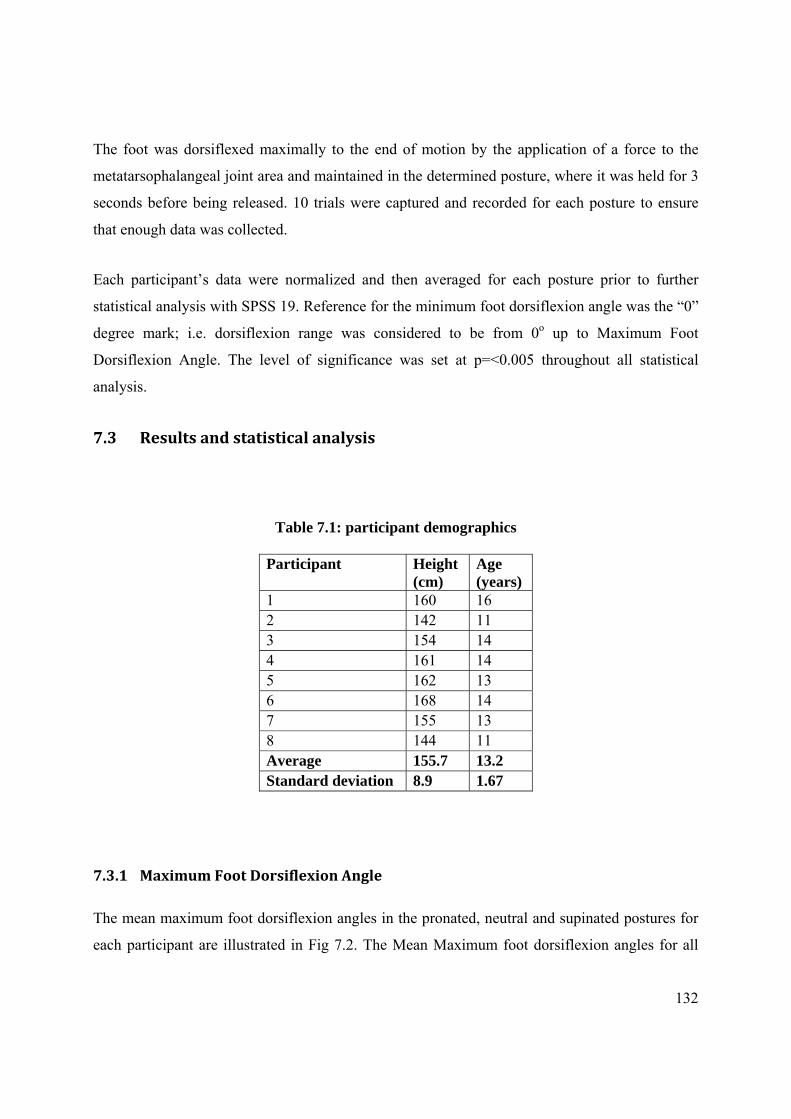
132
The foot was dorsiflexed maximally to the end of motion by the application of a force to the
metatarsophalangeal joint area and maintained in the determined posture, where it was held for 3
seconds before being released. 10 trials were captured and recorded for each posture to ensure
that enough data was collected.
Each participant’s data were normalized and then averaged for each posture prior to further
statistical analysis with SPSS 19. Reference for the minimum foot dorsiflexion angle was the “0”
degree mark; i.e. dorsiflexion range was considered to be from 0o up to Maximum Foot
Dorsiflexion Angle. The level of significance was set at p=<0.005 throughout all statistical
analysis.
7.3 Results and statistical analysis
Table 7.1: participant demographics
Participant Height (cm)
Age (years)
1 160 16 2 142 11 3 154 14 4 161 14 5 162 13 6 168 14 7 155 13 8 144 11 Average 155.7 13.2 Standard deviation 8.9 1.67
7.3.1 Maximum Foot Dorsiflexion Angle
The mean maximum foot dorsiflexion angles in the pronated, neutral and supinated postures for
each participant are illustrated in Fig 7.2. The Mean Maximum foot dorsiflexion angles for all

133
participants were 36.3o (SD 7.2 o) for pronated, 36.9o (SD 4.0o) for neutral and 33o (SD 4.9 o) for
supinated posture (Table 9, Appendix 2).
Figure 7.3: Maximum Foot Dorsiflexion Angles in the 3 postures. When compared to the similar graph in adults (Figure 5.3), it may be seen that the pronated posture did was not
greatest in all participants.
One-way repeated measures ANOVA was employed for statistical analysis of the Maximum
Foot Dorsiflexion Angle. There was no significant difference between this angle in the pronated,
neutral and supinated postures (p=0.70) (Table 10, Appendix 2). Post hoc analysis also revealed
similar results when comparing one posture to the other, with pronated to neutral (p=1.00),
pronated to supinated (p=0.299) and neutral to supinated (p= 0.039) (Table 11, Appendix 2).
7.3.2 Forefoot to Hindfoot Angle (FFHFA)
The ranges of variation in the Forefoot to Hindfoot Angle, taken from 0o of foot dorsiflexion to
the maximum dorsiflexion angle, are presented in Table 12 (Appendix 2), from which it may be
seen that the FFHFA variation was positive in all participants; i.e. the FFHFA increased with the
application of force when compared to the starting position at 0o dorsiflexion of the foot.
However, a one-way repeated measures ANOVA indicated a non-significant difference for the
forefoot to hindfoot angle variation between groups (p=0.346). Pairwise comparisons
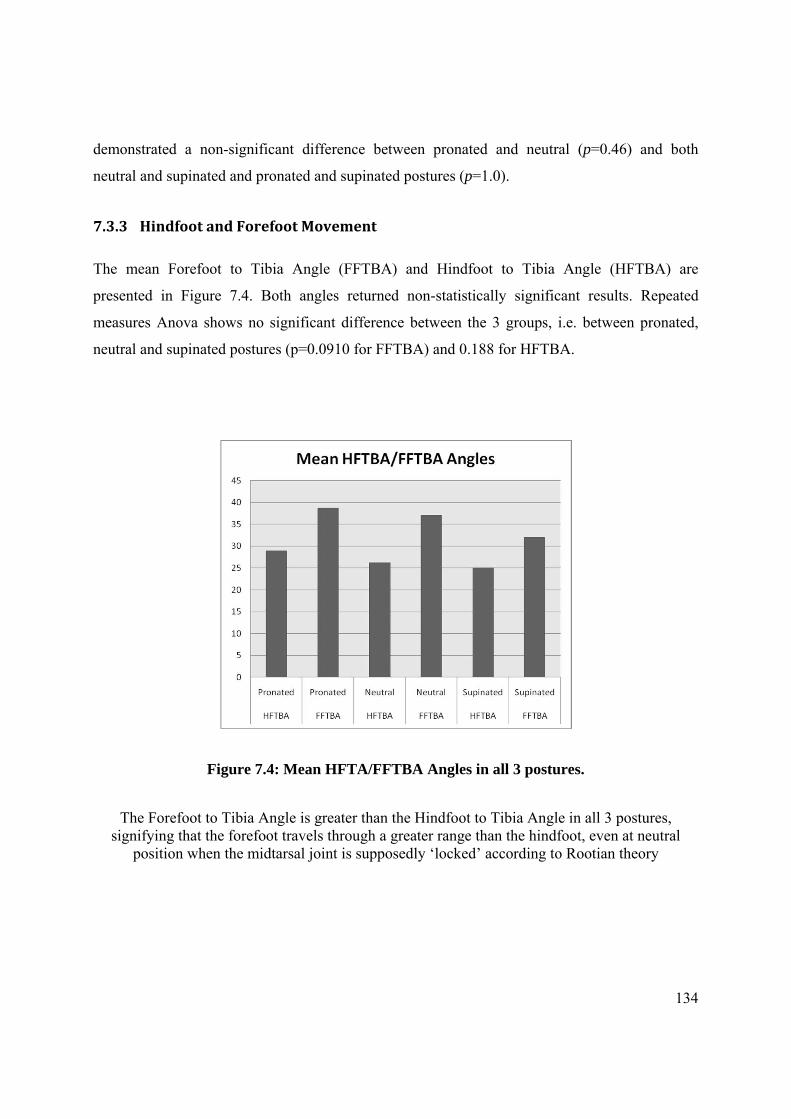
134
demonstrated a non-significant difference between pronated and neutral (p=0.46) and both
neutral and supinated and pronated and supinated postures (p=1.0).
7.3.3 Hindfoot and Forefoot Movement
The mean Forefoot to Tibia Angle (FFTBA) and Hindfoot to Tibia Angle (HFTBA) are
presented in Figure 7.4. Both angles returned non-statistically significant results. Repeated
measures Anova shows no significant difference between the 3 groups, i.e. between pronated,
neutral and supinated postures (p=0.0910 for FFTBA) and 0.188 for HFTBA.
Figure 7.4: Mean HFTA/FFTBA Angles in all 3 postures.
The Forefoot to Tibia Angle is greater than the Hindfoot to Tibia Angle in all 3 postures, signifying that the forefoot travels through a greater range than the hindfoot, even at neutral
position when the midtarsal joint is supposedly ‘locked’ according to Rootian theory
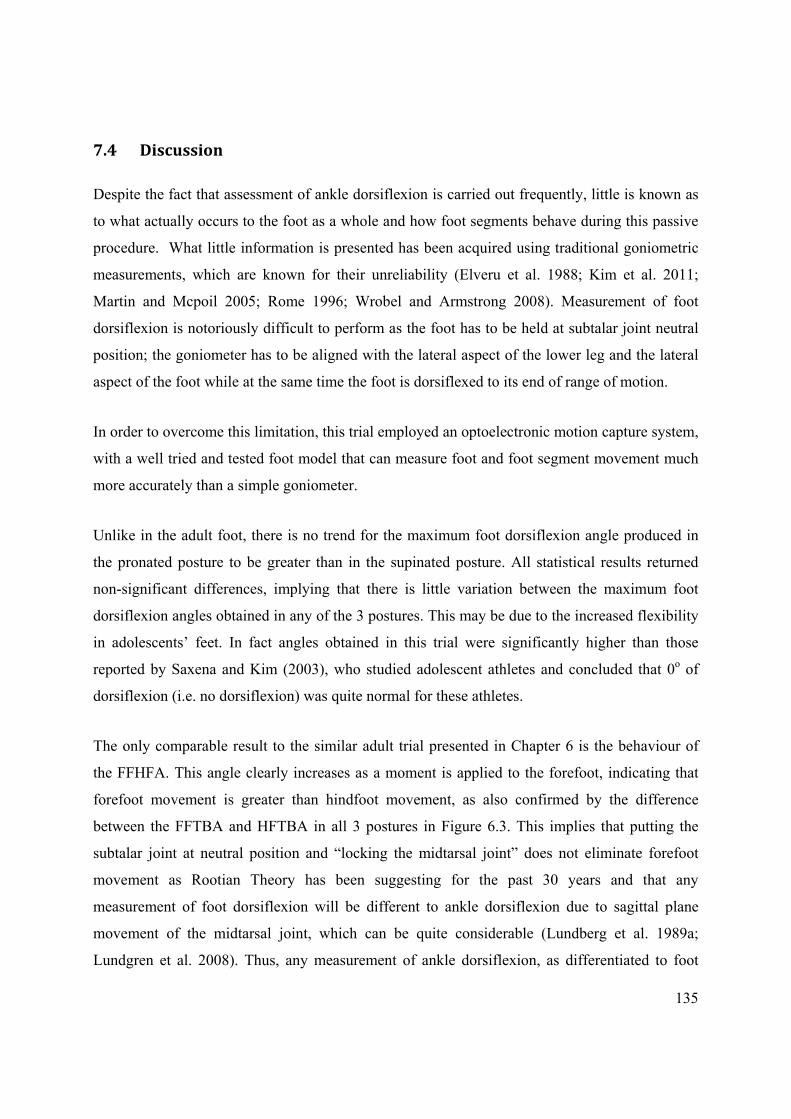
135
7.4 Discussion
Despite the fact that assessment of ankle dorsiflexion is carried out frequently, little is known as
to what actually occurs to the foot as a whole and how foot segments behave during this passive
procedure. What little information is presented has been acquired using traditional goniometric
measurements, which are known for their unreliability (Elveru et al. 1988; Kim et al. 2011;
Martin and Mcpoil 2005; Rome 1996; Wrobel and Armstrong 2008). Measurement of foot
dorsiflexion is notoriously difficult to perform as the foot has to be held at subtalar joint neutral
position; the goniometer has to be aligned with the lateral aspect of the lower leg and the lateral
aspect of the foot while at the same time the foot is dorsiflexed to its end of range of motion.
In order to overcome this limitation, this trial employed an optoelectronic motion capture system,
with a well tried and tested foot model that can measure foot and foot segment movement much
more accurately than a simple goniometer.
Unlike in the adult foot, there is no trend for the maximum foot dorsiflexion angle produced in
the pronated posture to be greater than in the supinated posture. All statistical results returned
non-significant differences, implying that there is little variation between the maximum foot
dorsiflexion angles obtained in any of the 3 postures. This may be due to the increased flexibility
in adolescents’ feet. In fact angles obtained in this trial were significantly higher than those
reported by Saxena and Kim (2003), who studied adolescent athletes and concluded that 0o of
dorsiflexion (i.e. no dorsiflexion) was quite normal for these athletes.
The only comparable result to the similar adult trial presented in Chapter 6 is the behaviour of
the FFHFA. This angle clearly increases as a moment is applied to the forefoot, indicating that
forefoot movement is greater than hindfoot movement, as also confirmed by the difference
between the FFTBA and HFTBA in all 3 postures in Figure 6.3. This implies that putting the
subtalar joint at neutral position and “locking the midtarsal joint” does not eliminate forefoot
movement as Rootian Theory has been suggesting for the past 30 years and that any
measurement of foot dorsiflexion will be different to ankle dorsiflexion due to sagittal plane
movement of the midtarsal joint, which can be quite considerable (Lundberg et al. 1989a;
Lundgren et al. 2008). Thus, any measurement of ankle dorsiflexion, as differentiated to foot

136
dorsiflexion, must not involve the forefoot, otherwise larger angles may result, possibly giving
false results that could give rise to a wrong diagnosis and treatment.
It could be hypothesised that this high flexibility may be due to the nature of the sport itself; this
clearly demonstrates that the amount of foot dorsiflexion will have to be investigated in different
athletic populations since results cannot be generalized over the whole adolescent population.
An obvious limitation of this trial is the small number of participants. However, trends are quite
clear from the several trials of data, although another trial with a much larger participant
population could confirm these clinically important results.
7.5 Conclusions
Results indicate high flexibility in female adolescent gymnasts’ feet, unlike
results obtained in another study using alternative, less accurate methods (clinical
goniometry).
The measurement of maximum foot dorsiflexion angle in this population may be
performed at any posture as the range of this angle will not be affected, contrary
to what occurs in adults. This is possibly due to the high flexibility reported.
During passive foot dorsiflexion, the Forefoot to Hindfoot Angle increases
gradually with the application of a moment, disputing earlier Rootian theory of
the midtarsal joint locking mechanism.
Any measurement of ankle dorsiflexion should not involve the forefoot if
unrealistically large angles are to be avoided.

Chapter 8
The effect of uncontrolled moment and
shortterm, repeated passive stretching
on Maximum Ankle Joint dorsiflexion angle
Aspects of this chapter have been accepted for publication:
Gatt A, Chockalingam N. 2012. The effect of uncontrolled moment and short-term repeated
passive stretching on maximum ankle joint dorsiflexion angle. The Foot. (In Press)
138
8.0 Introduction
This chapter investigates whether it is possible to carry out a passive dorsiflexion analysis
without applying a known moment. To-date, a typical scenario in various physical therapy
researches is to control the dorsiflexing moment, unlike during podiatric examinations which do
not involve the controlled application of force for measuring maximum ankle dorsiflexion (Root
et al, 1977; Gastwirth, 1996). It is thought that eliminating the complication of controlling
moment is a way of increasing reliability of ankle goniometric devices by making them easier to
use. Measurements taken are of end of the range of motion of the joint, i.e. at that point at
which there is no more possible movement without incurring damage to the patient. Thus
controlling the force applied is deemed superfluous. However this type of investigation has never
been conducted before as far as this investigator is aware.
8.1 Background
The clinical measurement of the Maximum ankle dorsiflexion angle is a common and important
clinical examination (Gastwirth 1996), routinely performed in order to establish whether there is
sufficient ankle movement (Rome 1996; Woodburn 1991) to allow for normal ambulation (Root
et al. 1977) and for the diagnosis of various pathological conditions of the foot and ankle (Meyer
et al. 2006). This examination is carried out by placing the foot at subtalar joint neutral position,
applying a force to the forefoot until there is maximum dorsiflexion at the ankle joint (Root et al.
1977). Then a measurement is taken using one of various methods, such as a goniometer
(Gastwirth 1996; Rome 1996) or a specifically-designed device such as the mechanical
equinometer (Meyer et al. 2006), the Iowa Ankle Device (Wilken et al. 2004) or the Biplane
Goniometer (Donnery and Spencer 1988), among others.
The calf Muscle-Tendon Unit (MTU), which is composed of the Gastrocnaemius, Soleus and
Achilles Tendon, originates above the knee (lateral and medial condyles on the posterior aspect
of the femur) and inserts in the posterior aspect of the calcaneus. This consequently determines
the amount of flexion at the ankle joint (Gajdosik 2001) as it stretches to its extensible limit.
Thus the maximal passive dorsiflexion ankle angle is directly related to maximal muscle length
(Gajdosik et al. 2004).
139
During ankle angle measurement, there is stretching of the calf MTU. The point of initial
resistance, termed the initial passive resistance, is overcome by the application of more force
until maximum passive resistance is reached, corresponding to maximum muscle length.
Stretching beyond this could result in damage to the tendino-muscular junction (Gajdosik 2001).
As has already been established, two factors that could influence the maximum ankle angle
include foot posture and the amount of force, or moment, applied.
A pronated foot posture increases the maximum ankle angle by as much as 10o (Tiberio et al.
1989; Woodburn 1991). This was confirmed by the study that investigated foot segment
movement during passive dorsiflexion (Chapter 6). Root et al (1977) maintain that performing
this examination at subtalar joint neutral position “locks” the midtarsal joint and the resultant
dorsiflexion occurs only at the ankle joint. This previous trial disproves the theory presented by
Root et al., at least during passive dorsiflexion, and results show that there is always more
forefoot movement than hindfoot movement irrespective of the posture that the foot is placed in.
Results also confirm that there is no significant difference in the maximum ankle angle between
the neutral and supinated foot postures (Chapter 6). Evidence hence suggests that the pronated
posture should be avoided during passive ankle angle measurement since there is excessive foot
segment movement extraneous to the ankle joint.
The amount of moment applied has also been identified as a significant factor when performing
this examination. Recommended moments in various studies and clinical trials range between
10Nm (Digiovanni et al. 2001; Meyer et al. 2006; Weaver et al. 2001), 12Nm (Moseley et al.
2001), 15Nm (Assal et al. 2003), 16.1Nm (Scharfbillig and Scutter 2004),20Nm (Greisberg et al.
2002) and 25Nm (Wilken et al. 2011). Although it is claimed that the amount of moment
applied influences the ankle angle (Assal et al. 2003), this appears to be anecdotal as no scientific
basis to this statement has been presented in literature. Although there is no universally accepted
amount of moment recommended to be applied to the foot during this examination procedure,
these trials were very careful in applying a moment which was constant in all subjects and the
resultant measurement angles were consequently consistent, returning high Intraclass
Correlational Coefficient (ICC) results.
As the ankle joint is dorsiflexed to its maximum, the calf MTU reaches its maximum passive
resistance, and thus its maximum muscle length, implying that differing amounts of moment

140
should have no - or minimal - effect on maximal ankle dorsiflexion once this angle is reached,
since the amount of moment applied beyond this point would be damaging to the MTU.
The ankle dorsiflexion assessment routine may be required to be performed a number of times
(with the calf MTU being repeatedly stretched to its maximal passive resistance limit) since it is
normal practice to obtain an average reading. During reliability testing of any ankle measuring
device, for example, this may be repeated over and over again (Donnery and Spencer 1988;
Meyer et al. 2006). A question that would arise out of this is whether this brief repetitive
stretching of the calf MTU could increase its length and thus alter the maximum ankle angle.
Thus one could hypothesise that this repetitive stretching could change the result of the
measurement itself since muscle length and consequently maximal angle may be increased.
If the calf MTU stretches significantly following the application of a moment to the forefoot, the
maximum ankle angle would get progressively bigger. A significant difference between the
results would consequently imply a stretching effect, while a non-significant difference would
imply that a consistent result was obtained without a known moment being applied.
Thus this study aimed to investigate primarily whether performing this examination procedure
without applying the same moment to all subjects would provide reliable and consistent results.
If in the positive, the important clinical outcomes of this investigation would imply that there is
no need for a force gauge, which is rarely available to the clinician and which would complicate
the examination procedure. Furthermore, the effect of short repeated passive stretching on the
maximum ankle angle was also investigated.
Aim:
To establish whether it is possible to obtain consistent maximum foot dorsiflexion angle
with the use of uncontrolled moment during passive foot dorsiflexion.
Objectives:
o To kinematically assess the maximum foot dorsiflexion angle when moment is not
controlled during passive dorsiflexion..

141
o To compare homogeneity of the maximum foot dorsiflexion angles; i.e. whether they are
the same.
8.2 Method
This investigation uses the same method/data presented in Chapter 6, A repeated measures study
to explore the effect of foot posture on Sagittal Plane Kinematics of passive dorsiflexion in
healthy adults.
8.3 Results and Statistical Analysis
Table 13 (Appendix 2) shows the results from 5 trials, demonstrating successive maximum ankle
dorsiflexion angles following the repeated application of a dorsiflexing moment which has not
been controlled with a force gauge. Since three previous studies have already established that the
pronated foot posture produces significantly larger dorsiflexion angles (Chapter 6 results
together with Tiberio et al. 1989; Woodburn 1991), only the results of the neutral and supinated
postures are being presented here. Moreover, two of these studies also demonstrated that there is
only a minor clinical differences between the neutral and supinated postures, ranging from 2.5o
(Chapter6) to 3.5o (Woodburn 1991). Data presented are the maximum Ankle Angles as output
by the Oxford Foot Model.
As shown in the table, one of the participant’s (No 13) data indicates a negative value. This
implies that at maximum force, the foot remained plantarflexed and not dorsiflexed (i.e. the
participant had reduced range of motion). As the aim of this investigation was to compare
consistency (within subject), this participant was not excluded from analysis. Repeated measure
ANOVAs were carried out separately on the neutral and supinated posture data to assess the
effect of repeated passive stretching on the maximum ankle angle.
The results indicated that there were no differences in the maximum ankle angles both at neutral
position, (F(2.26, 29.4) = 0.555, p = 0.601) (Table 15, Appendix 2), and at supinated position
(F(4, 52) = 0.664, p = 0.620) (Table 17, Appendix 2).

142
The p-values obtained were dependent on Mauchly’s Test of Sphericity, whose results indicate
that at the neutral position sphericity was violated (p=0.002) (Table 14, Appendix 2) while at a
supinated position they were not (p=0.121) (Table 16, Appendix 2).
Sphericity relates to the equality of the variances of the differences between levels of the
repeated measures factor, which is an assumption of an ANOVA with a repeated measures
factor. The null hypothesis for this test is that sphericity holds and a significant result indicates
that sphericity cannot be assumed. When this happens, a statistical test that provides for
correction of violations of sphericity, such as Greenhouse-Geisser, should be employed, while a
‘Sphericity Assumed’ test should be employed when sphericity has not been violated.
Whilst it was assumed that a stretching effect would exhibit an increase in the angle, only one
subject (no 9), exhibited a significant increase in maximum ankle angle by 2.88o with every
repetition (at the Neutral Position) and the other didn’t exhibit any significant increase or
decrease.
Maximum Ankle Angles:
Regression Analysis, which is used to ascertain the causal effect of one variable upon another,
was utilised to determine if the maximum Ankle Angle increased progressively after each test. A
stretching effect would exhibit an increase in the angle and a positive gradient in the Max Angle
vs Repetition Graph, such as that depicted in Figure 8.1. All resultant angles are presented in
Table 18 (Appendix 2). Only one subject, no 9, exhibited a significant increase in maximum
ankle angle by 2.88o with every repetition, at the Neutral Position.

143
Figure 8.1: Regression analysis of participant no9, showing increase in Maximum Ankle Angle with each repetition of the test performed.
8.4 Discussion
There are various factors affecting the apparently straight forward clinical procedure of
measuring ankle dorsiflexion (Rome 1996). These include, amongst others, foot posture and the
amount of moment applied (Chapters 3, 6 and 8). However, there is no consensus in literature as
to how much this moment should be or indeed whether this should be controlled at all. There
appear to be no trials at present that investigate whether or not controlling for torque would in
fact affect the results. Thus this study sought to investigate whether it is necessary at all to
control the amount of moment since it was hypothesised that the elasticity and stretching limit of
the calf MTU itself would serve to limit ankle dorsiflexion. A second important hypothesis was
whether brief repetitive stretching would affect the calf MTU itself, thus increasing its length
with subsequent dorsiflexions, consequently increasing maximum ankle angles.
These issues need to be investigated if the reliability of clinical measurement of ankle
dorsiflexion is to be improved or maintained. One simple fact is that clinically, moment is not
usually controlled. Since having a known moment is impractical in a real clinical situation,
alternatives need to be found in order to avoid the complication of having to use a force gauge,
so that practitioners in different clinical settings can examine patients according to a standardised
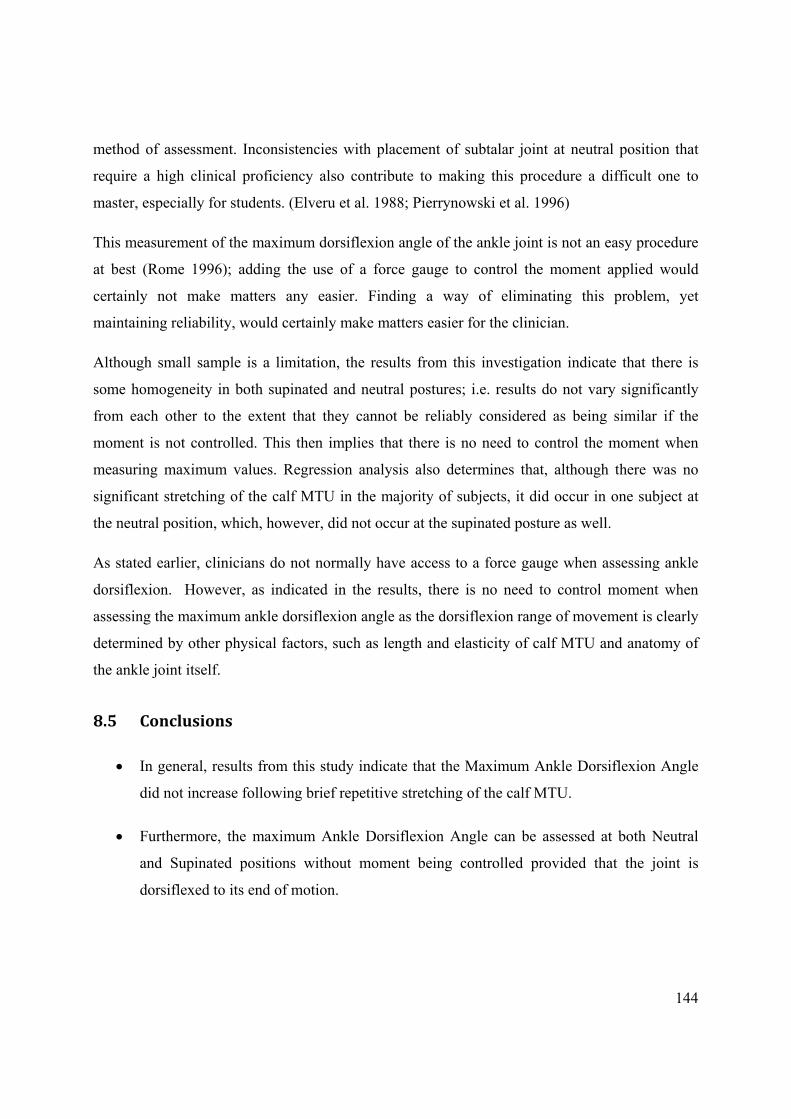
144
method of assessment. Inconsistencies with placement of subtalar joint at neutral position that
require a high clinical proficiency also contribute to making this procedure a difficult one to
master, especially for students. (Elveru et al. 1988; Pierrynowski et al. 1996)
This measurement of the maximum dorsiflexion angle of the ankle joint is not an easy procedure
at best (Rome 1996); adding the use of a force gauge to control the moment applied would
certainly not make matters any easier. Finding a way of eliminating this problem, yet
maintaining reliability, would certainly make matters easier for the clinician.
Although small sample is a limitation, the results from this investigation indicate that there is
some homogeneity in both supinated and neutral postures; i.e. results do not vary significantly
from each other to the extent that they cannot be reliably considered as being similar if the
moment is not controlled. This then implies that there is no need to control the moment when
measuring maximum values. Regression analysis also determines that, although there was no
significant stretching of the calf MTU in the majority of subjects, it did occur in one subject at
the neutral position, which, however, did not occur at the supinated posture as well.
As stated earlier, clinicians do not normally have access to a force gauge when assessing ankle
dorsiflexion. However, as indicated in the results, there is no need to control moment when
assessing the maximum ankle dorsiflexion angle as the dorsiflexion range of movement is clearly
determined by other physical factors, such as length and elasticity of calf MTU and anatomy of
the ankle joint itself.
8.5 Conclusions
In general, results from this study indicate that the Maximum Ankle Dorsiflexion Angle
did not increase following brief repetitive stretching of the calf MTU.
Furthermore, the maximum Ankle Dorsiflexion Angle can be assessed at both Neutral
and Supinated positions without moment being controlled provided that the joint is
dorsiflexed to its end of motion.

Chapter 9
The Ankle Goniometer: Design and Manufacture

146
9.0 Introduction
The aims of this chapter are to describe the circumstances leading to the awareness that there is a
need for a novel design of an ankle goniometer, to discuss research findings arising from the
Systematic Review and the Sagittal Plane movement investigation in adults and children
(Chapters 6 and 7) and the Uncontrolled Moment trial (Chapter 8), their implications on the
design and the evolution of the design itself following these research findings.
9.1 Background
Initial suspicions that there could be a significant problem with goniometric measurement of
ankle dorsiflexion arose during the practical sessions of an Applied Podiatric Biomechanics
module that this investigator delivers during the first year of the Podiatry Course at the
University of Malta, in which the traditional Rootian method of ankle assessment was taught.
Over the years, after many practical sessions and different student cohorts, it became clear that
students were struggling with alignment of both arms of the goniometer and, without their
realizing it, they were constantly producing incorrect results. This trend continued even during
the second and third year of each course, even though emphasis was placed on this technique and
these wrong methods were discussed on various occasions. As this investigator feels that ankle
equinus is a important foot condition that has significant repercussions both on gait and integrity
of the foot itself, leading to various, sometimes major, conditions such as metatarsalgia and
diabetic ulceration, this was felt to be an important aspect of biomechanical evaluation that
needed further investigation.
Goniometric unreliability was further confirmed following a literature review which identified
several papers dealing specifically with this problem (Refer to Section 2.4.2).
Thus initial sources of errors identified were:
The correct bisection of the lateral aspect of the lower leg
Holding the stable arm in alignment with the lateral bisection

147
Holding the moving arm in alignment with the lateral border of the foot, from the area of
the heel to the area of the 5th metatarsophalangeal joint
Holding the foot in subtalar joint neutral position while it is passively dorsiflexed.
Reading the goniometric output (normally small scales) which involves leaning to the
side whilst holding the foot in the ‘correct’ position.
Thus the first thought was whether it was possible to produce an ankle goniometer that replicated
the traditional goniometer, but possibly eliminated these alignment problems. The first device
produced (Figure 8.1) was aimed at:
1. holding the stable arm in place, in a position aligned with the lateral head of the fibula
and the lateral malleolus, by the use of velcro straps
2. eliminating alignment errors in the moving arm by the use of a footplate
3. placing the point of rotation below the lateral malleolus to replicate a traditional
goniometer.
To note is that at this time, it was thought that there were no issues involving the use of a
footplate. In fact, like other investigators, our conclusion was that a footplate would actually aid
in maintaining correct alignment. However, following the trial in Chapter 5, it was realized that a
goniometer should, ideally, only involve the hindfoot since if the forefoot is involved, the
resultant angle could be the summation of both hindfoot and forefoot dorsiflexion.

148
A. B.
Figure 9.1: First attempt at producing an ankle goniometer. A) Features included an extendible vertical arm, a pivot to duplicate the Rootian method and a foot plate. B) a
spring-loaded mechanism held the foot in an everted/inverted position.
Another important aspect that was causing errors was placement of the foot at subtalar joint
neutral position. Various methods where tried on this rather crude device, which was later
replaced by another device that locked the footplate in an everted or inverted position in order to
reduce this function which has to be performed by the practitioner (Figure 8.2).
A. B.
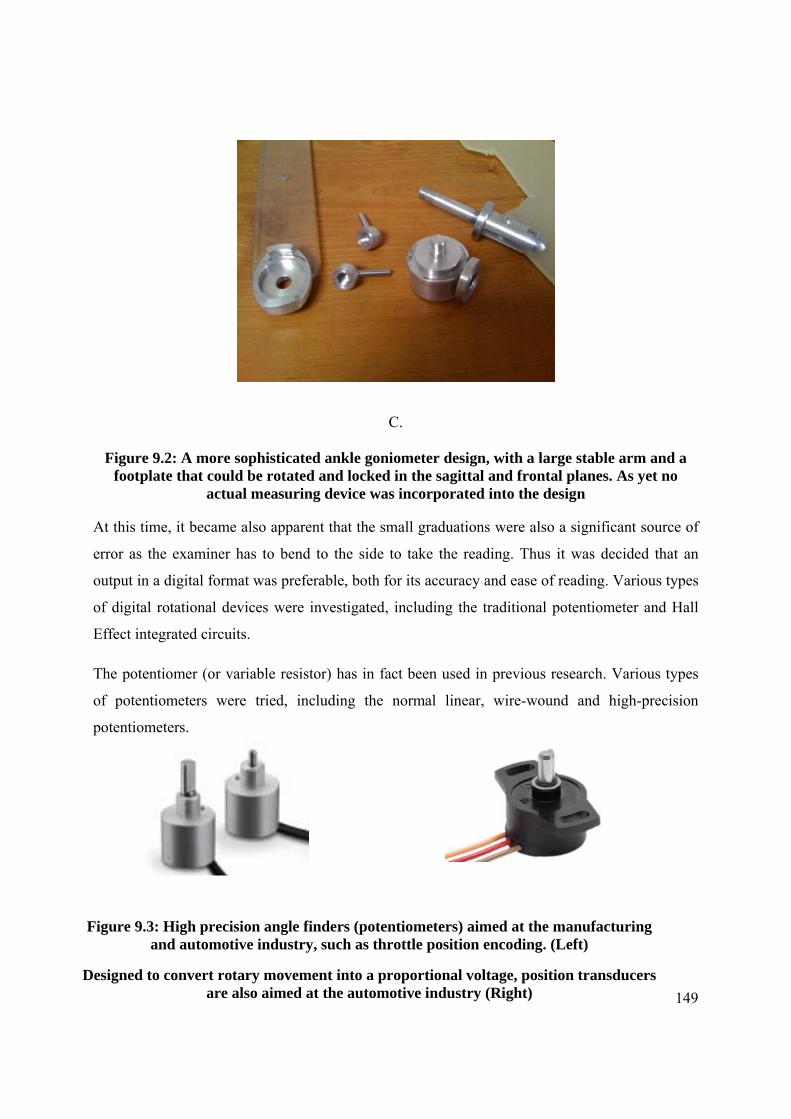
149
C.
Figure 9.2: A more sophisticated ankle goniometer design, with a large stable arm and a footplate that could be rotated and locked in the sagittal and frontal planes. As yet no
actual measuring device was incorporated into the design
At this time, it became also apparent that the small graduations were also a significant source of
error as the examiner has to bend to the side to take the reading. Thus it was decided that an
output in a digital format was preferable, both for its accuracy and ease of reading. Various types
of digital rotational devices were investigated, including the traditional potentiometer and Hall
Effect integrated circuits.
The potentiomer (or variable resistor) has in fact been used in previous research. Various types
of potentiometers were tried, including the normal linear, wire-wound and high-precision
potentiometers.
Figure 9.3: High precision angle finders (potentiometers) aimed at the manufacturing
and automotive industry, such as throttle position encoding. (Left)
Designed to convert rotary movement into a proportional voltage, position transducers are also aimed at the automotive industry (Right)

150
Figure 9.4: An example on the use of a linear potentiometer to find the angle. If resistance R vs Angle (degrees) is mapped, angle can be calculated with the formula on the right.
Using a PIC (Programmable Integrated Circuit) it is possible to divide the rotation available at
the potentiometer by the resolution of this circuitry, which in theory produced quite a reasonably
accurate device with about 1o of accuracy, which was thought to be more than ample for the
required application. The output of this circuitry was fed into an LCD (Liquid Crystal Display) in
order to produce a readout of the angle. Circuitry also had a zeroing and maximum value
features.
Figure 9.5: This design incorporated a carbon-fibre foot-plate that could be locked into inversion/eversion, a linear potentiometer into the aluminium housing and a joint to enable
the stable arm to be lined with the long axis of the foot

151
Figure 9.6: Same features as above, with a transparent acrylic foot-plate, but housing professionally-built on a lathe. End result, however, was considered too bulky and the
wiring to the display unit made the unit (below) uncomfortable to work with
A.

152
B.
Figure 9.7: Display units, A and B. Both units had zeroing capabilities. Unit below provided the angle in real-time and the maximum ankle angle attained. Could also be
calibrated to various potentiometers with different rotation angles Another type of rotational angle finder tried was the Hall Effect Rotary Encoder. This type of
sensors rely on a magnetic field in order to sense motion. The principle is based on the Hall
Effect, discovered more than 100 years ago by Edwin Herbert Hall. This effect is the small
electrical potential created when a stationary magnetic field is placed perpendicular to a current-
carrying conductor.
A Hall Effect sensor consists of an integrated circuit with a small magnet (diametral magnetised -
two poles on the working face) rotating above it. The variations in the magnetic field are picked
up by the sensor, encoded into an angle by the integrated electronics and displayed in a
convenient manner if required.
The AS5040 Rotary Encoder IC, 10-bit Absolute Programmable Magnetic Rotary Encoder with
Incremental, SSI, and PWM Output, manufactured by Austrian MicroSystems
(http://www.austriamicrosystems.com/eng/Products/Magnetic‐Encoders) was identified as a
potential source of providing a digital readout. There appeared to be many advantages to using
such a system, including:
Small integrated circuit should have facilitated its integration into the device
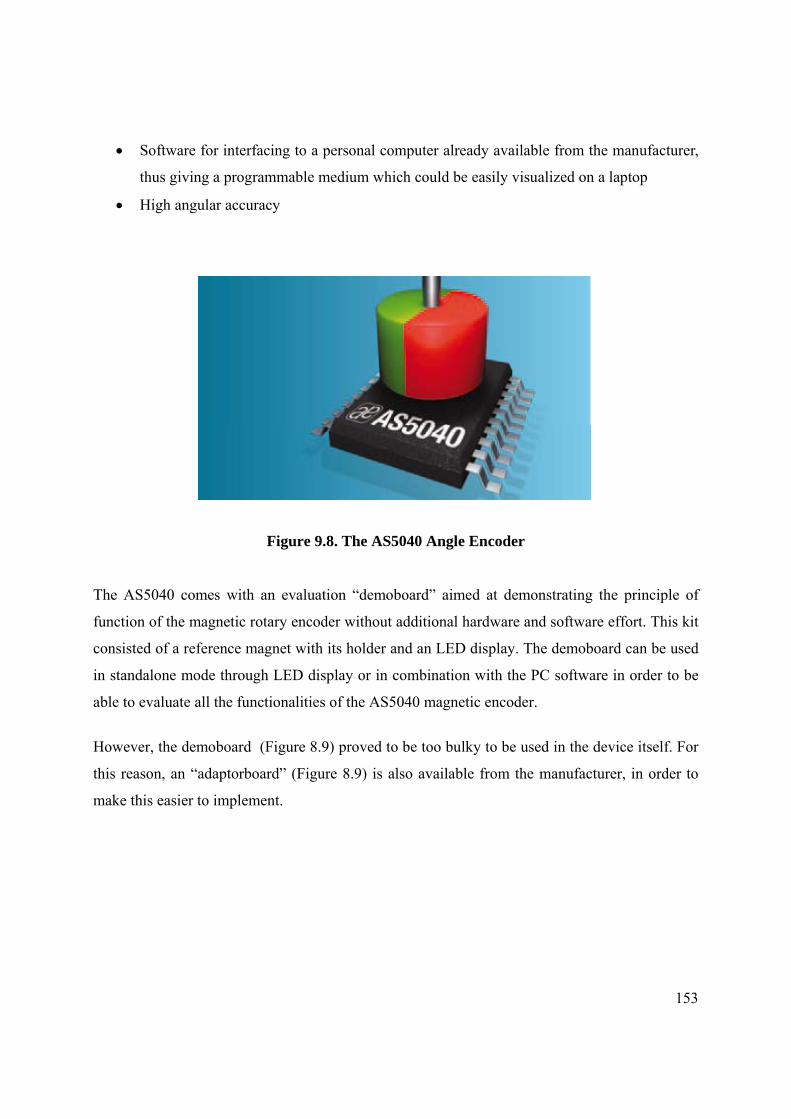
153
Software for interfacing to a personal computer already available from the manufacturer,
thus giving a programmable medium which could be easily visualized on a laptop
High angular accuracy
Figure 9.8. The AS5040 Angle Encoder
The AS5040 comes with an evaluation “demoboard” aimed at demonstrating the principle of
function of the magnetic rotary encoder without additional hardware and software effort. This kit
consisted of a reference magnet with its holder and an LED display. The demoboard can be used
in standalone mode through LED display or in combination with the PC software in order to be
able to evaluate all the functionalities of the AS5040 magnetic encoder.
However, the demoboard (Figure 8.9) proved to be too bulky to be used in the device itself. For
this reason, an “adaptorboard” (Figure 8.9) is also available from the manufacturer, in order to
make this easier to implement.

154
Figure 9.9: The AS5040 adaptorboard (left) and demoboard (right) including power supply but excluding USB lead. The value on the LED is actually a graduation representing the
angle of rotation (1024 steps in 360o). The actual rotary sensor is the small integrated circuit on the right of the adaptorboard.
The whole configuration would thus consist of the adaptorboard integrated within the device
itself, together with the demoboard to provide the angular readout. This could then be read out by
optionally connected to a PC through USB. This latter option was, in actual fact, mandatory as
the readout from the demoboard was not an angle itself, but a mathematical representation of the
angle; i.e. the 360 degree angle divided into 1024 steps (since Integrated Circuit is 10-bit). The
actual final angle in degrees could only be visualized by the software.
Following experimentation with this device, however, various issues arose, including:
Bulkiness of the whole system
Use of PC mandatory
Distance between IC and magnet critical
Too many wiring and components leading to an inherently complex and unstable system.

155
Thus this system was finally rejected, even though a huge amount of effort had been invested,
both in trying out the system and in designing an appropriate housing and mounting method
within the device.
9.2 Alternative methods of measuring angular movement
Various alternative methods of measuring rotational angle movement were investigated. The
following list is by no means comprehensive, and only relevant apparatus is presented here.
These alternative methods, however, almost all invariably required the involvement of a
professional electronics engineer, which was considered a disadvantage by the investigator
following experience by two different technicians who designed and manufactured the two
different systems using potentiometers. It was consequently decided that a commercially-
available device would be preferable. Features sought in these devices were:
Size
Ease of availability
Possibility of use without complex engineering knowhow
Price
Thus a period of intensive internet searches ensued, with a few stand-alone devices being
identified, purchased and evaluated by the investigator. Most of these devices were
disappointingly bulky as they were actually designed for the construction industry. These
included various types of inclinometers, rotary angle finders and electronic rulers (Figures
below).
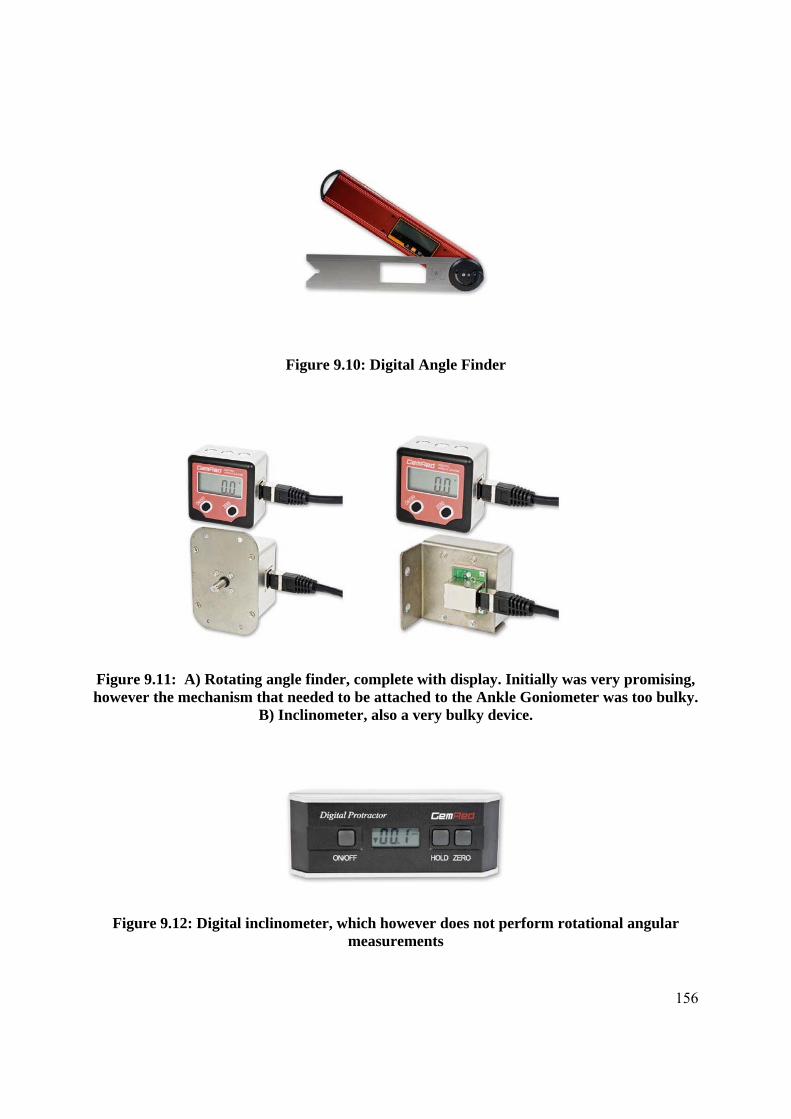
156
Figure 9.10: Digital Angle Finder
Figure 9.11: A) Rotating angle finder, complete with display. Initially was very promising, however the mechanism that needed to be attached to the Ankle Goniometer was too bulky.
B) Inclinometer, also a very bulky device.
Figure 9.12: Digital inclinometer, which however does not perform rotational angular measurements

157
9.3 Some Ankle Goniometer Design iterations
Various designs incorporating some of these devices were also done, most of which were
actually constructed.
Figure 9.13: A goniometer design incorporating the digital angle finder in Figure 9.10. The hooks in the left diagram are for attaching a velco strap to hold the vertical arm in place.
The footplate could hold the foot in an inverted/everted position
Figure 9.14: 3 iterations of another possible design
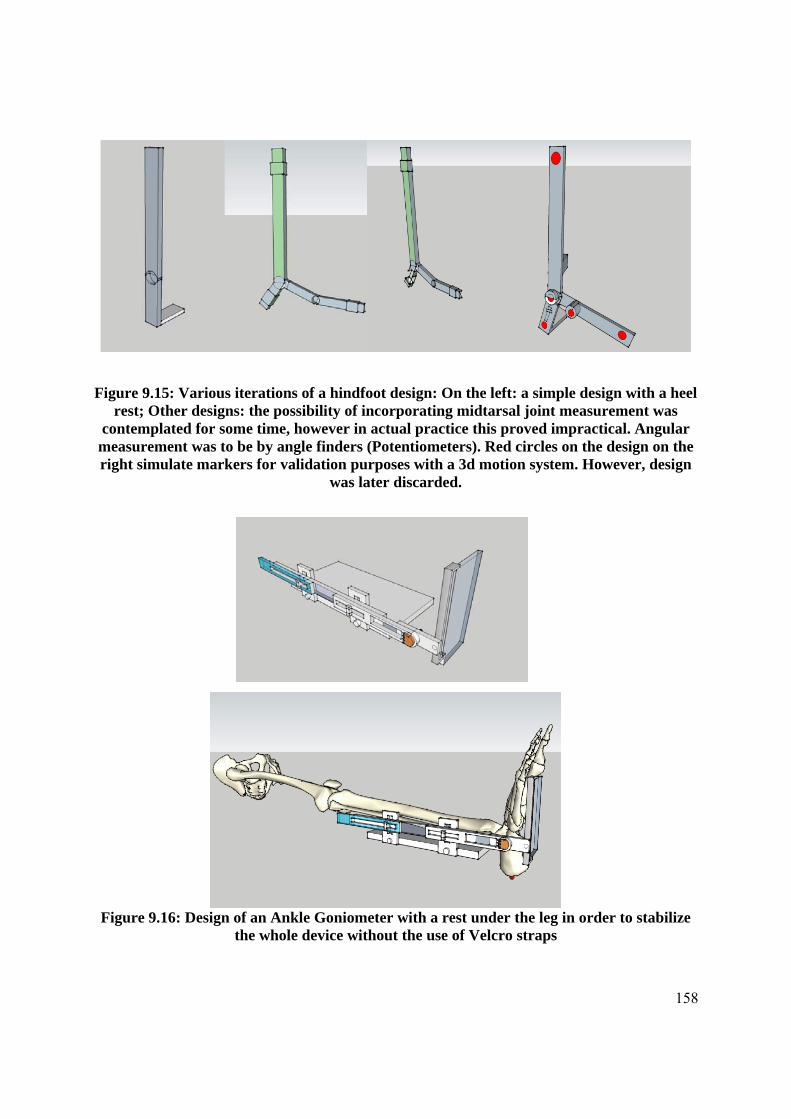
158
Figure 9.15: Various iterations of a hindfoot design: On the left: a simple design with a heel rest; Other designs: the possibility of incorporating midtarsal joint measurement was
contemplated for some time, however in actual practice this proved impractical. Angular measurement was to be by angle finders (Potentiometers). Red circles on the design on the right simulate markers for validation purposes with a 3d motion system. However, design
was later discarded.
Figure 9.16: Design of an Ankle Goniometer with a rest under the leg in order to stabilize the whole device without the use of Velcro straps

159
Figure 9.17: From design to fabrication: Actual goniometer from the designs in Figure 8.16, demonstrating various features of the Ankle Goniometer which appeared to be the
most promising
At this stage, a design incorporating several features was arrived at. These features included:
A Footplate
Alignment of the stable arm on the lateral side (sagittal plane) by individual butterfly
screws
Ability to place pivot where required, i.e. either in line with medial malleolus or further
down (to simulate Rootian method) by means of an adjustable arm
Footplate adjustable up and down (along sagittal plane) to help placement as above
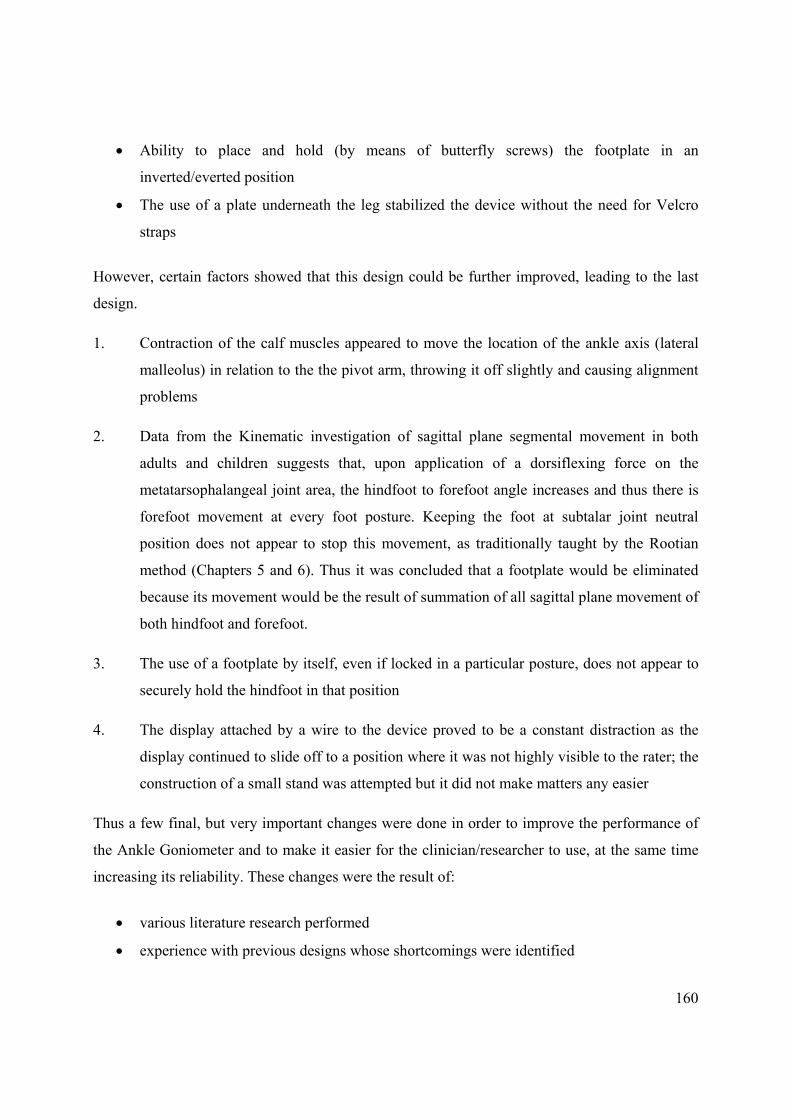
160
Ability to place and hold (by means of butterfly screws) the footplate in an
inverted/everted position
The use of a plate underneath the leg stabilized the device without the need for Velcro
straps
However, certain factors showed that this design could be further improved, leading to the last
design.
1. Contraction of the calf muscles appeared to move the location of the ankle axis (lateral
malleolus) in relation to the the pivot arm, throwing it off slightly and causing alignment
problems
2. Data from the Kinematic investigation of sagittal plane segmental movement in both
adults and children suggests that, upon application of a dorsiflexing force on the
metatarsophalangeal joint area, the hindfoot to forefoot angle increases and thus there is
forefoot movement at every foot posture. Keeping the foot at subtalar joint neutral
position does not appear to stop this movement, as traditionally taught by the Rootian
method (Chapters 5 and 6). Thus it was concluded that a footplate would be eliminated
because its movement would be the result of summation of all sagittal plane movement of
both hindfoot and forefoot.
3. The use of a footplate by itself, even if locked in a particular posture, does not appear to
securely hold the hindfoot in that position
4. The display attached by a wire to the device proved to be a constant distraction as the
display continued to slide off to a position where it was not highly visible to the rater; the
construction of a small stand was attempted but it did not make matters any easier
Thus a few final, but very important changes were done in order to improve the performance of
the Ankle Goniometer and to make it easier for the clinician/researcher to use, at the same time
increasing its reliability. These changes were the result of:
various literature research performed
experience with previous designs whose shortcomings were identified

161
critical analysis of devices attesting to perform a similar function
original research aimed at determining what occurs during passive dorsiflexion
The final design criteria for the Ankle Goniometer were:
1. The entire footplate was shortened to cover just the heel area so that, even though there is
forefoot movement upon the dorsiflexing force, forefoot movement would not affect the final
angle. This was considered to be a very important criteria, derived from the Sagittal Plane
Kinematic analysis of adults and children (Chapters 5 and 6), from which it was concluded that
during passive dorsiflexion, there is always an “accessory” movement, i.e. that of the forefoot
relative to the hindfoot. It has been shown that this angle increases during the application of
force, thus the resultant angle is not purely ankle or rearfoot motion, but is a summation of the
hindfoot and forefoot angles. This was noted in all 3 foot postures; thus putting the foot in
subtalar joint neutral position does not in reality eliminate midtarsal joint and hence forefoot
movement. Thus the term “footplate” has been changed to “heelplate”.
2. Removal of accessory wiring and display. Putting the display onto the display unit into
the device itself would make handling much easier.
Figure 9.18: Commercially available miniature angle measuring device, incorporating an LCD screen and battery. Ability to zero the device at any angle, on off switch and auto
power-on upon movement of the arms. Accurate to within 0.1o

162
3. An adjustable heel, composed of two pieces of acrylic padded with ethylene vinyl
acetate, to hold the heel in a secured position.
4. Use of the anterior aspect of the tibia as an anchor point to hold the device in position,
instead of a base plate, called a ‘Tibial rest’.
5. Adjustable on the frontal plane, to follow the lateral contours of the leg.
6. Adjustable on the sagittal plane, to align the device from the lateral head of the fibula to
the lateral malleolus.
7. Adjustable axis, to align axis either to lateral malleolus or distal to the ankle, as per
Rootian method, according to the wish of the examiner. Also adjustable distance from lateral
malleolus to the footplate to accommodate various foot sizes.
8. Adjustable heel-plate in the frontal plane; ability to lock the plate into the required
position.
A
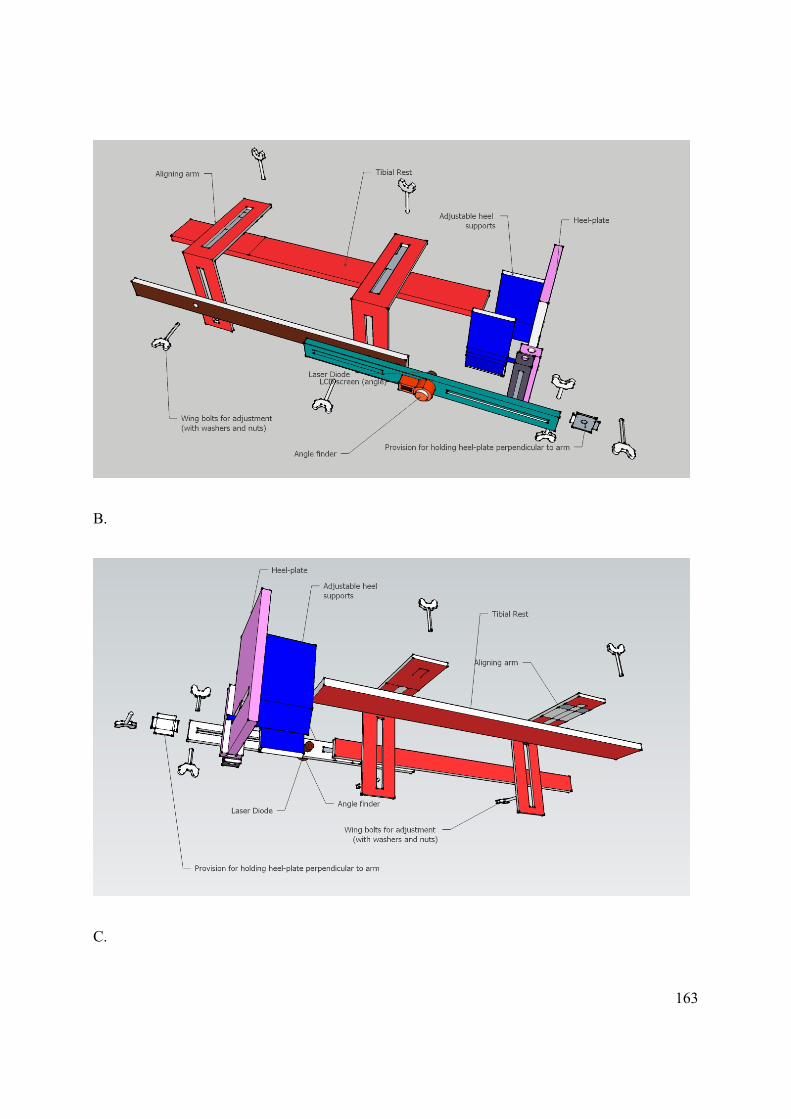
163
B.
C.
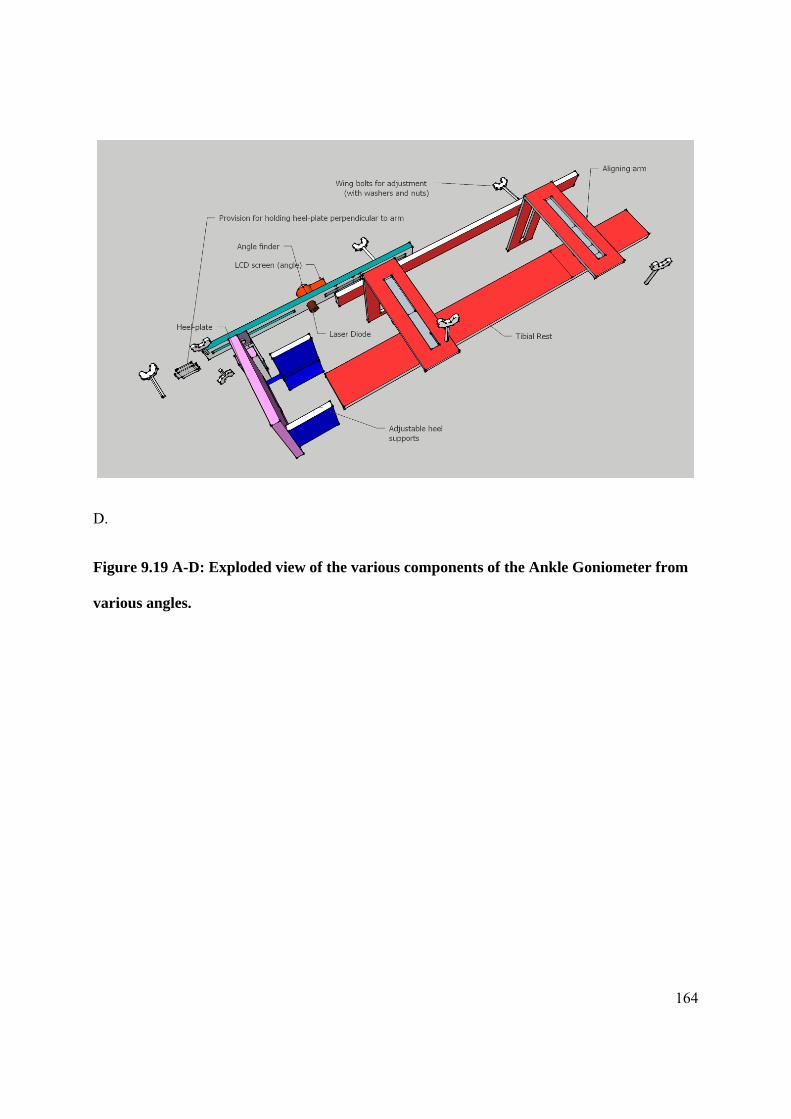
164
D.
Figure 9.19 A-D: Exploded view of the various components of the Ankle Goniometer from
various angles.
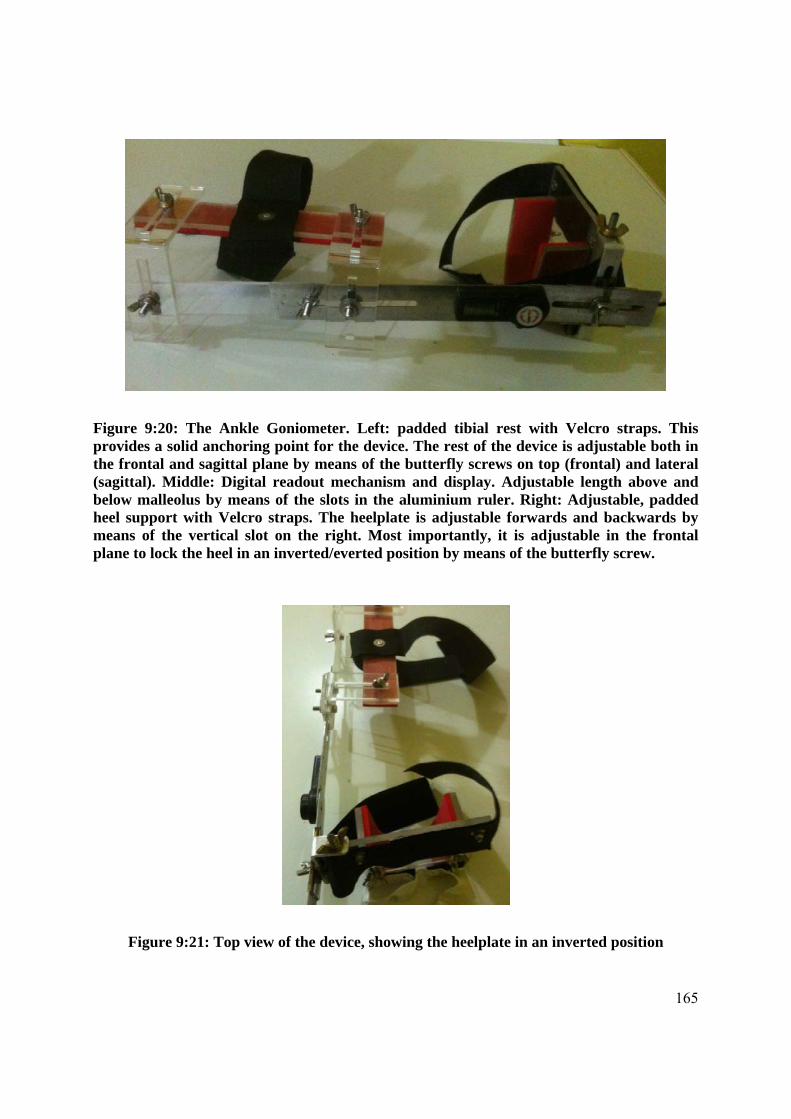
165
Figure 9:20: The Ankle Goniometer. Left: padded tibial rest with Velcro straps. This provides a solid anchoring point for the device. The rest of the device is adjustable both in the frontal and sagittal plane by means of the butterfly screws on top (frontal) and lateral (sagittal). Middle: Digital readout mechanism and display. Adjustable length above and below malleolus by means of the slots in the aluminium ruler. Right: Adjustable, padded heel support with Velcro straps. The heelplate is adjustable forwards and backwards by means of the vertical slot on the right. Most importantly, it is adjustable in the frontal plane to lock the heel in an inverted/everted position by means of the butterfly screw.
Figure 9:21: Top view of the device, showing the heelplate in an inverted position

166
Figure 9.22a: The proximal part of the goniometer from the lateral side, showing tibial rest and adjusting arrangements
Figure 9.22b: The proximal part of the goniometer, from a dorsal view.

167
Figure 9.22c: The digital display and rotational measurement mechanism. Also showing adjusting arrangement for the heel
Figure 9.22d: The adjustable heel cup, which widens and narrows by means of two slots in the heel plate. Further Velcro straps hold the heel plate in plate
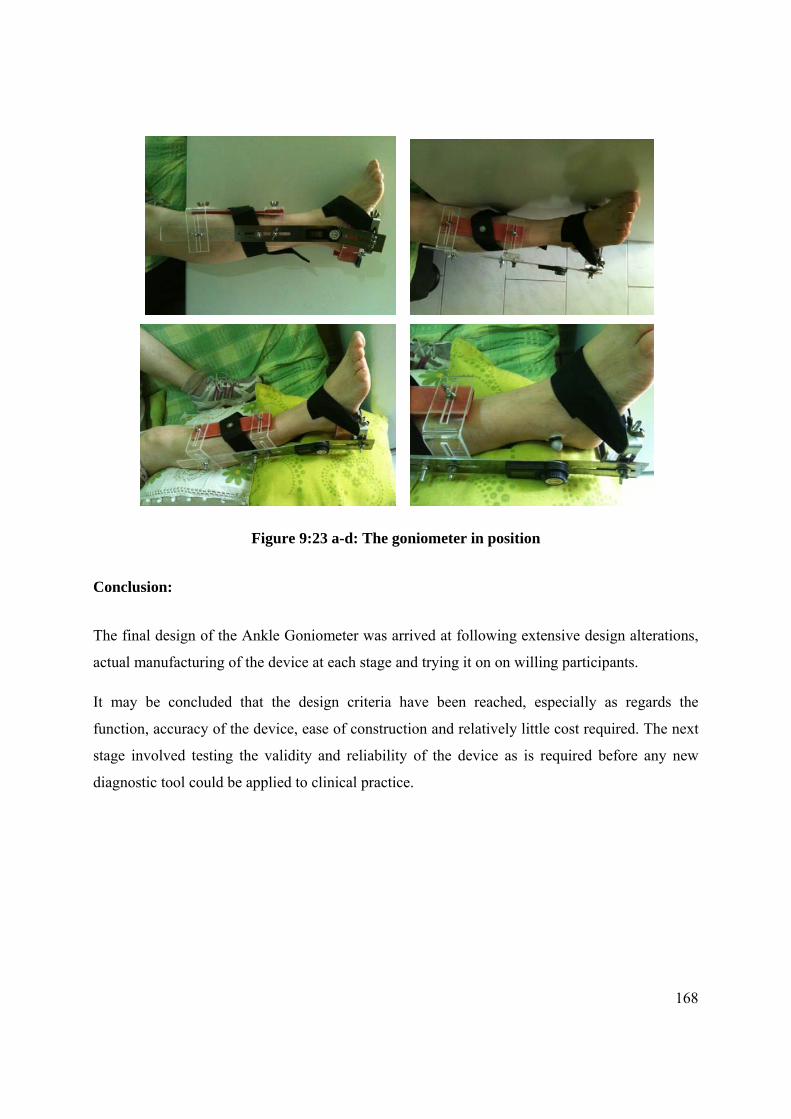
168
Figure 9:23 a-d: The goniometer in position
Conclusion:
The final design of the Ankle Goniometer was arrived at following extensive design alterations,
actual manufacturing of the device at each stage and trying it on on willing participants.
It may be concluded that the design criteria have been reached, especially as regards the
function, accuracy of the device, ease of construction and relatively little cost required. The next
stage involved testing the validity and reliability of the device as is required before any new
diagnostic tool could be applied to clinical practice.

Chapter 10
Reliability of a New Ankle Goniometer
Aspects of this chapter have been communicated as:
Gatt A, Chockalingam N. 2012. Validity and Reliability of a New Ankle Dorsiflexion
Measurement Device. (Under review)
170
10.0 Introduction
Before any new diagnostic device can be put to clinical and/or research use, it must first be
validated to ensure that the output is, in actual fact, the true, expected result, i.e. that the
instrument is actually measuring what it purports to measure. Then test-retest reliability testing is
performed to ensure that raters will produce consistent results utilising the said method,
technique or equipment. Hence this chapter will investigate validity and reliability of the Ankle
Goniometer.
According to Gajdosik and Bohannon (1987, pg 1867), ‘‘reliability in goniometry simply means
the consistency or the repeatability of the [range-of-motion] measurements, that is, whether the
application of the instrument and the procedures produce the same measurements consistently
under the same conditions’’. This definition, however, does not consider validity, ie, whether the
instrument is actually measuring the correct angle. This is one of the main reasons why any such
procedure must be compared with the reference standard. In the case of ankle joint complex
measurement, following the revelation of Tiberio et al (1981) and Woodburn (1991) that in a
pronated foot there is 10o more dorsiflexion, the instrument under review might actually be
measuring both ankle joint complex and midtarsal joint complex dorsiflexion.
To complicate this further, it might also be actually measuring the summation of all of the
dorsiflexion movements of joints distal to the ankle.
A diagnosis of ankle equinus or limited ankle dorsiflexion is arrived at after measuring the
dorsiflexion angle. From this, important clinical decisions, including whether to intervene
surgically, are reached. Notwithstanding this, however, as has been demonstrated previously,
there are clear issues regarding the reliability of techniques used to measure ankle dorsiflexion.
Although, traditionally, a goniometer is used to measure ankle dorsiflexion, there is
overwhelming evidence that its inter-rater and intra-rater reliability is very poor (Elveru et al.
1988; Martin and Mcpoil 2005; Van Gheluwe et al. 2002). Rater experience does not overcome
this limitation (Kim et al, 2011), implying that even “highly experienced experts” do not
necessarily get the measurement right every time. Consequently, various types of goniometers
have been designed to overcome the range of problems associated with this measurement, as
shown in Chapter 4. A number of factors that may affect the ankle dorsiflexion angle
171
measurement have been identified (Chapter 3). Hence it must be determined whether these
factors have been addressed by these devices as these form the basis for the design criteria of an
ankle goniometer.
One has to differentiate between “ankle dorsiflexion” and “foot dorsiflexion”, as the latter
involves the dorsiflexion at ankle, subtalar joint and midtarsal joint (Chapter 3). Midtarsal joint
movement has been shown to be quite significant, often ranging more than ankle joint movement
itself (Lundgren et al. 2008); measurement results arising from this situation would clearly lead
to a mis-diagnosis in which limited ankle dorsiflexion would be masked by midtarsal joint
movement.
The application of a known moment is another important factor. All goniometers designed to
measure ankle dorsiflexion have controlled the amount of moment applied to the forefoot, which
ranged from 10Nm to 25Nm. This has in fact made it easier for the goniometers to produce
similar results when repeatability was investigated. However, during clinical measurement, it is
doubtful how many practitioners carry a force gauge with them, so this solution is clearly
impractical. Research carried out in Chapter 8 has demonstrated that it is possible to get results
that are significantly homogenous without using a force gauge at both the neutral and supinated
positions.
It has been postulated that, since there is no clinical significant difference between the neutral
and supinated posture, with the difference amounting to just 2.5o, this test can be performed at
the supinated position, thus circumventing issues with reliability of establishing a neutral
position which is notoriously difficult to achieve for many clinicians, especially those of little
experience.
10.1 Reliability
Any new diagnostic device requires reliability testing to be performed. Reliability has been
defined as “the consistency or reproducibility of a measure” (Martin and Mcpoil 2005). Test-
retest, inter-rater and intra-rater reliability testing is required when evaluating new apparatuses
designed to measure ankle dorsiflexion. The majority of trials assessing reliability of ankle
dorsiflexion devices have used this type of testing, with test-retest designs being the preferred

172
method of assessment, further analysed statistically through the use of Intraclass Correlation
Coefficient (Chapter 3).
A quality methodological assessment on discovered devices designed to measure ankle
dorsiflexion has reported quite poor scoring because of a number of factors, including: small
convenience samples, lack of use of actual patient populations to test out the devices, lack of
randomization reporting, lack of comparison to a “Gold Standard”, i.e. comparison to a test that
is known to produce valid results. It is, however, recognized that this gold standard may be x-
rays and authors may encounter problems obtaining ethical approval purely for research
purposes. Wilken et al (2011) have circumvented this problem by using an optoelectronic motion
analysis system to simultaneously evaluate 12 participants together with their IAROM device
(Wilken et al. 2011).
10.2 Method
Validity and reliability testing for the Ankle Goniometer spanned a number of different phases.
Ethical approval was sought from and granted first by the Faculty of Health Sciences Ethics
Board and consequently by the University of Malta Ethics Research Committee. All participants
were adults and signed an informed consent after being provided with an information sheet.
Relevant approval and documentation may be found in Appendix 1.
10.2.1 Validity Testing:
Validity testing presented significant technical hurdles. As mentioned previously, a ‘Gold
Standard’ would have been x-raying the foot with the ankle goniometer in place, then comparing
the angles from the X-ray viewing software and that output by the goniometer. The vertical
midline of the fibula can be compared with a line dividing the talar trochlear (Backer and Kofoed
1989). However, because of obvious ethical issues, this could not be done, thus an alternative
method had to be employed. It was consequently decided that convergent validity would be
confirmed by comparison of ankle dorsiflexion angles measured simultaneously with the Ankle
Goniometer and an optoelectronic motion analysis system as in (Wilken et al. 2011). However,
unlike Wilken et al, the front of the tibia was not used as a reference point and it was decided to

173
build a 3D model of hindfoot dorsiflexion utilising the lateral bisection of the lower leg, which is
more conversant with the actual technique used by the Ankle Goniometer.
10.2.2 Method of Validation
Since the Ankle Goniometer had only a visual output and could not be synchronized
electronically to another electronic device, an electrogoniometer (MIE Medical Research Ltd)
was placed on the inner aspect of the Ankle Goniometer, crossing the joint that is placed in line
with the lateral malleolus (Figure 9.0). The electrogoniometer was previously interfaced with its
own data logger and its angles ouput to a laptop using proprietary software. This goniometer had
been undergoing testing at the Staffordshire Biomechanics Lab and had been synchronized with
the 8-camera Vicon system (OMG, Oxford, UK) in use at that laboratory. Validation of the two
angles produced was carried out until it was confirmed that both goniometers were, in fact,
outputting the same angles.
Figure 10.1: Alignment of the Ankle Goniometer with the Electrogoniometer

174
Figure 10.2: a) Electrogoniometer, datalogger and laptop setup during trials. b) actual setup with the Ankle Goniometer in place. This was a first trial in which the goniometer
was adhered to the foot itself; this was consequently found to produce a number of errors and the output was very dependent on where the two ends of the goniometer were put. In
fact, it was later decided to adhere the device to the ankle goniometer itself.
As outlined in Chapter 5, a hindfoot model, based on the Oxford Foot Model, was constructed using Visual 3D (C-Motion, Germantown, USA). (http://www.c-motion.com/v3dwiki/index.php?title=Oxford_Foot_Model ). This uses the same axes and co-ordinate system as the original model, as initially outlined by Carson et al (2001).

175
Markers were placed over bony areas, where movement of underlying soft tissue could be
minimized, to provide accurate measures of ankle ROM. It was possible to add markers with the
ankle goniometer/electrogoniometer combination in place (Figure 10.3, a-c ).
A B
C
Figure 10.3: Ankle Goniometer/electrogoniometer with marker setup. a) Dorsal View b) medial view and C Posterior View
Subject was placed sitting on a table, with the apparatus in situ, and with his feet suspended.
Since passive dorsiflexion by an operator could not be performed because the operator would
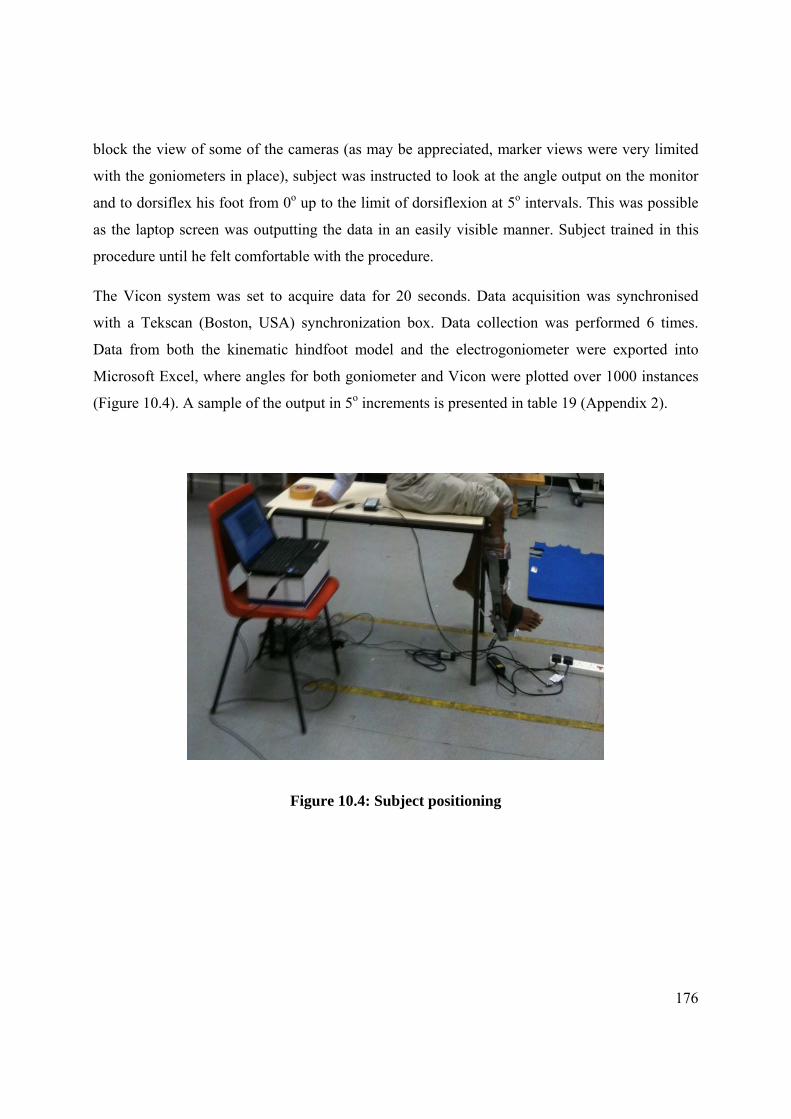
176
block the view of some of the cameras (as may be appreciated, marker views were very limited
with the goniometers in place), subject was instructed to look at the angle output on the monitor
and to dorsiflex his foot from 0o up to the limit of dorsiflexion at 5o intervals. This was possible
as the laptop screen was outputting the data in an easily visible manner. Subject trained in this
procedure until he felt comfortable with the procedure.
The Vicon system was set to acquire data for 20 seconds. Data acquisition was synchronised
with a Tekscan (Boston, USA) synchronization box. Data collection was performed 6 times.
Data from both the kinematic hindfoot model and the electrogoniometer were exported into
Microsoft Excel, where angles for both goniometer and Vicon were plotted over 1000 instances
(Figure 10.4). A sample of the output in 5o increments is presented in table 19 (Appendix 2).
Figure 10.4: Subject positioning

177
Figure 10.5: Validity: Angles output by goniometer and vicon
Pearson’s correlation was employed to investigate correlations between the two results, utilising
all 1000 data points for each. Correlation coefficient obtained was 0.996, with a p-value of .000.
As can be seen from the data, including the descriptive statistics in Table 20 (Appendix 2), the
Ankle Goniometer correlated extremely well with the Vicon system. This is further evidenced by
Figure 10.5 and Table 19 (Appendix 2), where the similarity between the angles produced by the
two devices can be visualized.
Whilst the goniometer cost in the region of €100, a Vicon system costs x1000 as much, besides
requiring extensive work by an expert person to perform any testing at all. Once validity of the
Ankle Goniometer is established, its advantages over the Vicon system are obvious when
investigating passive ankle dorsiflexion range of motion.
10.3 Reliability Testing:
Reliability testing normally takes the form of inter-tester and intra-tester studies in order to
assess whether the same practitioner can obtain the same results over a period of time, and
whether two or more practitioners can obtain comparable results. All the specifically-designed
ankle goniometers employed this type of testing, however the Systematic Review performed has
degrees

178
identified various shortcomings, thus making reliability testing results of these devices quite
dubious.
These shortcomings include:
The use of healthy populations (normally convenience samples of students)
Many testing protocols did not employ an actual patient population, which is odd
considering that these devices are meant to be used on patients.
The use of a known moment, which makes the testing artificially appear to be correct.
Once the applied force is the same for all subjects, it is this force which is controlling the
resultant angle, which has to be consistent, even between different raters.
The series of trials that ensue attempted to address these shortcomings. It was decided to divide
this trial into 3 different trials, each addressing a different research question.
10.3.1 Trial 1: Interrater and intrarater testretest reliability using a known
moment; a doubleblind design
Aim:
To establish reliability (repeatability) of the Ankle Goniometer with controlled moment
during passive ankle dorsiflexion
Objectives:
o To measure the passive maximum ankle angle repeatedly between the same rater
(inter-rater reliability) with controlled moment in a healthy population
o To measure the passive maximum ankle angle repeatedly between two raters (inter-
rater reliability) with controlled moment in a healthy population.
o To establish consistency between the maximum ankle angles obtained.

179
10.3.1.1 Method
A convenience sample of 10 young healthy adults (mean age 18.9 years (range 18-20 years)),
were assessed by two raters. None of the participants had any foot or lower limb problems or
systemic conditions. Both raters were experienced clinicians, however with very little clinical
experience in the use of the specific Ankle Goniometer. Rater 2 had just 15 minutes
acclimatization with the instrument after its layout was explained by Rater 1.
All measurements were performed with the subjects supine. Rater 1 applied the goniometer to
the subject, aligning the lateral arm with the tibial condyle and lateral malleolus, the pivot point
of the instrument in line with the malleolus and firmly clasped the heel in the adjustable heel
portion of the device. The foot was then placed in a slightly supinated position using the talo-
navicular congruency method. The talar head was palpated with index finger and thumb of the
rater’s right hand until subtalar joint neutral position was identified by equally feeling the medial
and lateral heads, then supinating slightly so that only the lateral aspect of the talar head was
palpable. This position, also previously recommended by Woodburn (Woodburn 1991) was
chosen as previous research (Chapter 6) had indicated a non-clinical difference between the
neutral and supinated positions of only 2.5o (and 3.5o by Woodburn, 1991) thus bypassing issues
regarding consistent finding of subtalar joint neutral. The rater then applied 20Nm of force to the
forefoot through a calibrated force gauge to dorsiflex the foot maximally for 3 seconds, then
released the applied force. A reporter recorded the maximum ankle angle when the Rater
announced that 20Nm were applied. All raters and subjects were blinded.
This procedure was repeated for 5 times, for all subjects, by both raters (inter-rater reliability
assessment). Rater 1 then repeated the whole performance after 1 hour (intra-tester reliability).
Same day repeatability was chosen in order to exclude any factors that could influence the
maximum dorsiflexion angle, such as soft tissue stretching characteristics. Since raters were
blinded, it was decided that this same-day reliability testing would suffice.
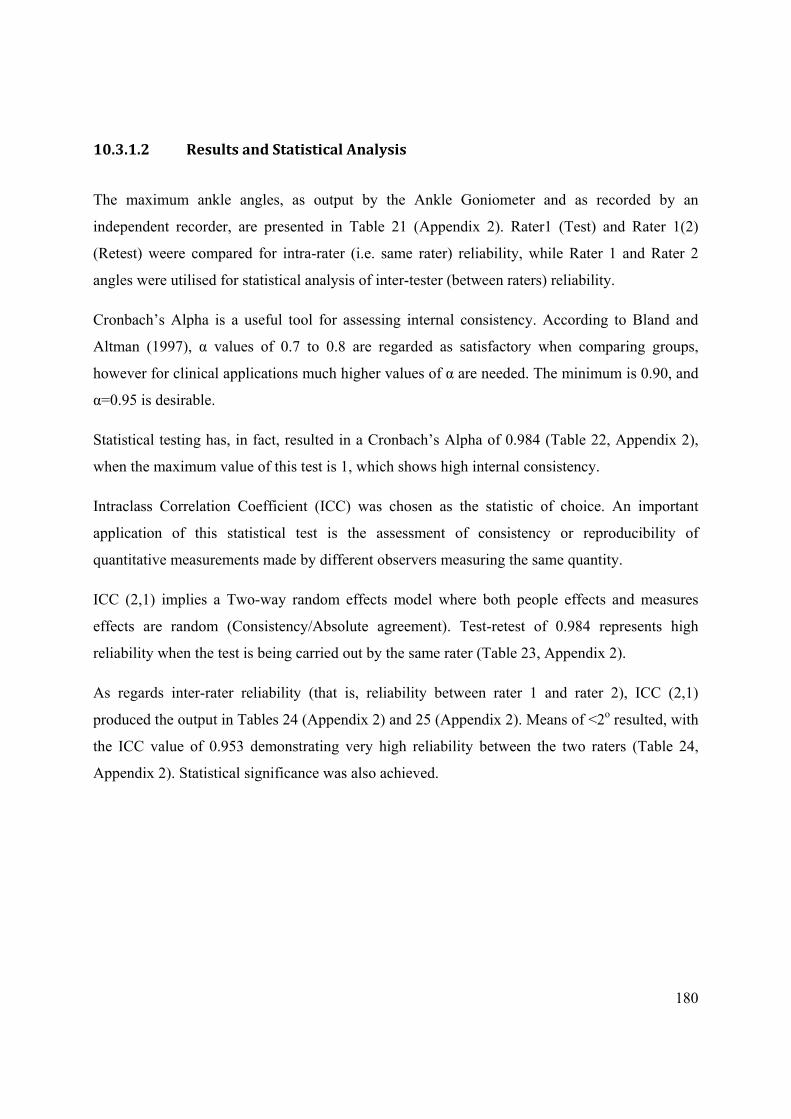
180
10.3.1.2 Results and Statistical Analysis
The maximum ankle angles, as output by the Ankle Goniometer and as recorded by an
independent recorder, are presented in Table 21 (Appendix 2). Rater1 (Test) and Rater 1(2)
(Retest) weere compared for intra-rater (i.e. same rater) reliability, while Rater 1 and Rater 2
angles were utilised for statistical analysis of inter-tester (between raters) reliability.
Cronbach’s Alpha is a useful tool for assessing internal consistency. According to Bland and
Altman (1997), α values of 0.7 to 0.8 are regarded as satisfactory when comparing groups,
however for clinical applications much higher values of α are needed. The minimum is 0.90, and
α=0.95 is desirable.
Statistical testing has, in fact, resulted in a Cronbach’s Alpha of 0.984 (Table 22, Appendix 2),
when the maximum value of this test is 1, which shows high internal consistency.
Intraclass Correlation Coefficient (ICC) was chosen as the statistic of choice. An important
application of this statistical test is the assessment of consistency or reproducibility of
quantitative measurements made by different observers measuring the same quantity.
ICC (2,1) implies a Two-way random effects model where both people effects and measures
effects are random (Consistency/Absolute agreement). Test-retest of 0.984 represents high
reliability when the test is being carried out by the same rater (Table 23, Appendix 2).
As regards inter-rater reliability (that is, reliability between rater 1 and rater 2), ICC (2,1)
produced the output in Tables 24 (Appendix 2) and 25 (Appendix 2). Means of <2o resulted, with
the ICC value of 0.953 demonstrating very high reliability between the two raters (Table 24,
Appendix 2). Statistical significance was also achieved.

181
10.3.2 Trial 2: Intratester reliability with uncontrolled moment and variable
knee position; a doubleblind design
Aim:
To establish reliability (repeatability) of the Ankle Goniometer with uncontrolled
moment
Objectives:
o To measure the passive maximum ankle angle repeatedly between the same rater
(inter-rater reliability) with uncontrolled moment in a healthy population
o To establish consistency between the maximum ankle angles obtained.
10.3.2.1 Method
10 healthy adults (5 males, 5 females, mean age 40.3yrs (33-48years)); mean weight 77.8kg,
mean height 167.9cm) were randomly recruited in order to undergo intra-rater reliability testing
without the use of an applied controlled moment. Rater 1 assessed all subjects, who were lying
supine. As previously done, a dorsiflexing force was applied to the forefoot until the maximum
dorsiflexion angle was attained, at which point the angle was recorded by an independent
observer, keeping both rater and subject blinded. Following 5 dorsiflexion measurements, the
knee was flexed by approximately 20o, to investigate the effect of the gastrocnaemius muscle,
then the routine was repeated. For test-retest reliability purposes, the whole procedure was
repeated after 1 hour.
10.3.2.2 Results and Statistical Analysis
As may be seen from the series of statistical tests in Appendix A, there is very high reliability for
intra- and inter-tester, even though the moment is not controlled (p=0.000) (Table 28, Appendix
2). This confirms earlier findings arrived at in Chapter 8 utilising the Vicon System, however
this time through the use of the Ankle Goniometer: that there is no need to control for moment

182
when conducting ankle end of range of motion measurement. These findings also imply that the
Ankle Goniometer can be used with no difference in reliability, which in turn is not effected by
knee position (whether extended (ICC 0.94) or flexed (ICC=0.95), when ICC scores >8.0 are
considered reliable (Tables 28 and 29, Appendix 2).
10.3.3 Trial 3: Intratester reliability with uncontrolled force on a patient
population; a double blind design.
Aim:
To establish reliability (repeatability) of the Ankle Goniometer with uncontrolled
moment in a patient population
Objectives:
o To measure the passive maximum ankle angle repeatedly between the same rater
(inter-rater reliability) with uncontrolled moment in a patient population
o To establish consistency between the maximum ankle angles obtained.
10.3.3.1 Method
The first 15 patients attending a foot clinic were invited to participate. The main criteria was a
foot condition that could be possibly related to altered ankle function or that could possibly alter
ankle function (Table 9.6 for subject demographics). All participants, as in all trials, signed
informed consent. Following the previous protocol, a single rater assessed maximum ankle
dorsiflexion on all participants. This time, however, the number of repetitions were reduced to
just 2 instead of 5 so as not to cause any undue pain to the participants. The second ratings were
done after one hour. As in all the previous reliability testing, the rater was blinded and an
independent recorder documented the maximum ankle angle as output by the LCD screen of the
Ankle Goniometer.
At the end of the whole trial, the independent observer handed in the final readings in an Excel
spreadsheet. Data was then analyzed in SPSS 19.0.
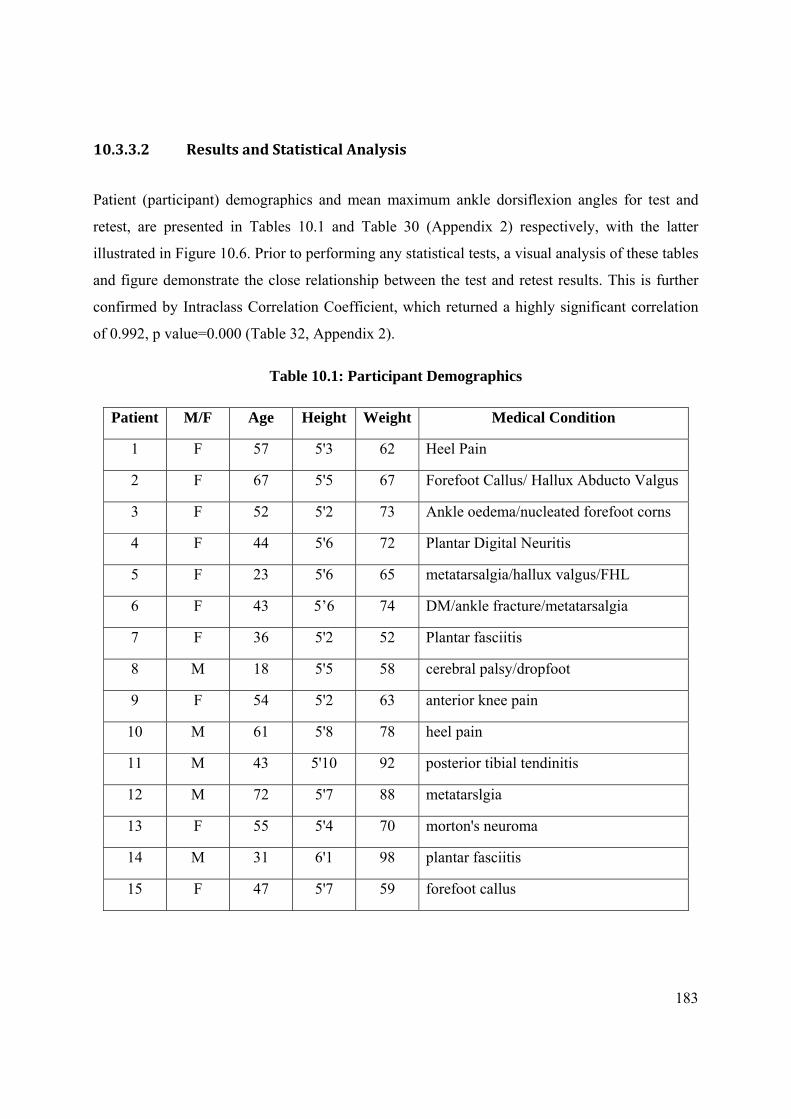
183
10.3.3.2 Results and Statistical Analysis
Patient (participant) demographics and mean maximum ankle dorsiflexion angles for test and
retest, are presented in Tables 10.1 and Table 30 (Appendix 2) respectively, with the latter
illustrated in Figure 10.6. Prior to performing any statistical tests, a visual analysis of these tables
and figure demonstrate the close relationship between the test and retest results. This is further
confirmed by Intraclass Correlation Coefficient, which returned a highly significant correlation
of 0.992, p value=0.000 (Table 32, Appendix 2).
Table 10.1: Participant Demographics
Patient M/F Age Height Weight Medical Condition
1 F 57 5'3 62 Heel Pain
2 F 67 5'5 67 Forefoot Callus/ Hallux Abducto Valgus
3 F 52 5'2 73 Ankle oedema/nucleated forefoot corns
4 F 44 5'6 72 Plantar Digital Neuritis
5 F 23 5'6 65 metatarsalgia/hallux valgus/FHL
6 F 43 5’6 74 DM/ankle fracture/metatarsalgia
7 F 36 5'2 52 Plantar fasciitis
8 M 18 5'5 58 cerebral palsy/dropfoot
9 F 54 5'2 63 anterior knee pain
10 M 61 5'8 78 heel pain
11 M 43 5'10 92 posterior tibial tendinitis
12 M 72 5'7 88 metatarslgia
13 F 55 5'4 70 morton's neuroma
14 M 31 6'1 98 plantar fasciitis
15 F 47 5'7 59 forefoot callus
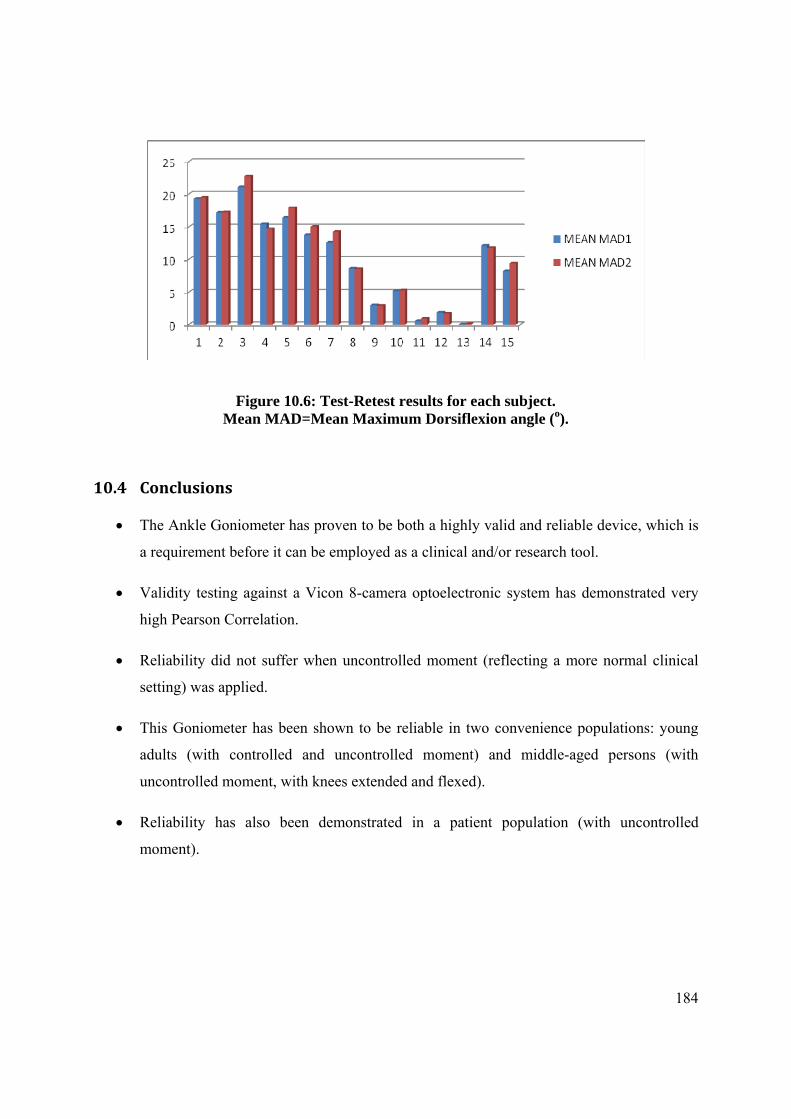
184
Figure 10.6: Test-Retest results for each subject. Mean MAD=Mean Maximum Dorsiflexion angle (o).
10.4 Conclusions
The Ankle Goniometer has proven to be both a highly valid and reliable device, which is
a requirement before it can be employed as a clinical and/or research tool.
Validity testing against a Vicon 8-camera optoelectronic system has demonstrated very
high Pearson Correlation.
Reliability did not suffer when uncontrolled moment (reflecting a more normal clinical
setting) was applied.
This Goniometer has been shown to be reliable in two convenience populations: young
adults (with controlled and uncontrolled moment) and middle-aged persons (with
uncontrolled moment, with knees extended and flexed).
Reliability has also been demonstrated in a patient population (with uncontrolled
moment).

Chapter 11
Establishing reliability of the Ankle Goniometer between
multiple raters with uncontrolled moment

186
11.0 Introduction
In previous chapters, it has already been established that there is high reliability of the Ankle
Goniometer (ICC >0.9) in various examination scenarios. These included:
o Reliability between 2 raters, using controlled moment (inter-rater reliability)
o Reliability between the same rater (intra-rater reliability, i.e. repeated measures),
in various situations, namely using:
Controlled moment in a healthy young adult population
Uncontrolled moment in a healthy adult population
Uncontrolled moment in a patient population
In order to ensure that the Ankle Goniometer can be employed as a valid and reliable clinical
tool, the next step is to investigate reliability by a number of different raters. Thus in this chapter
a trial will be conducted in which 4 clinicians with varying experience with the Ankle
Goniometer will be assessed in their use of the device.
Summarizing two important findings of previous research (Chapters 5 and 7) that need to be
considered when designing this trial and which will thus be utilised:
1. In adults, there is no clinical difference between utilising either the neutral or supinated
position when assessing maximum ankle dorsiflexion.
2. It is possible to achieve homogenous results when measuring ankle dorsiflexion both in
the neutral and supinated postures when moment is not controlled.
Once it has been established that it is possible to achieve homogenous results using uncontrolled
moment (intra-rater) utilising a Vicon optoelectronic motion capture system (Chapter 8) and also
achieve a high inter-rater reliability between two raters making use of the Ankle Goniometer
(Chapter 10, under different scenarios), it would be much easier to employ the latter device for
examination of ankle dorsiflexion for various reasons, including:

187
Availability of the equipment: a Vicon or alternate system is not readily available
to clinics because of the high costs involved
Expertise required: with an optoelectronic motion capture system, high expertise
is required for the setup, marker placement, data capture and analysis, thus
increasing room for errors if less experienced practitioners make use of the
system, leading to inaccuracies in the results.
Time constraints: clearly, the time-frame required to use the Ankle Goniometer is
a fraction of that required for a motion capture system
11.1 Background
As has been established, although foot posture affects the Maximum Ankle Dorsiflexion Angle,
the amount of force applied to dorsiflex the foot does not, provided that end of range of motion is
achieved. Notwithstanding this, in various trials that investigate maximum ankle dorsiflexion, the
applied moment is given more attention than foot posture.
It is claimed that the Maximum Ankle Dorsiflexion Angle is also directly influenced by the
applied torque (Assal et al. 2003). The torque, or moment, is the product of the force applied and
the distance from the centre of rotation to the point of application of the force. When assessing
reliability of ankle goniometric devices, authors have elected to maintain a constant moment
between subjects in order to produce the same angles. This moment varies between studies, from
10 Nm, 12, 15, 16.1, 20 and 25Nm.
If, as quoted, the amount of force applied is such a determinant factor on the ankle angle
produced, this assessment procedure would have poor inter-tester reliability since different
practitioners are likely to induce different amounts of force during this procedure. It would thus
be quite difficult to investigate treatment effectiveness in a pre- and post-intervention scenario,
for example, or to compare results between different practitioners since, as has already been
pointed out, a force gauge is not an instrument traditionally found in a practitioner’s clinic. Using
an optoelectronic motion analysis system, it has been demonstrated that the maximum ankle

188
angle can be quite reliably assessed by the same practitioner (intra-tester reliability). Although
the application of a known moment produced reliable inter-rater results, it has also been shown
that the same rater can produce reliable results when not controlling for moment (Chapter 9). At
this stage, all that remains is to determine whether the device would still produce reliable results
with multiple raters and uncontrolled moment.
Although moment is important for the calculation of a passive torque versus angular
displacement curve (Moseley et al. 2001), it has been postulated that, since maximum ankle
dorsiflexion is an end of range of motion assessment determined by the stretching characteristics
of the triceps surae, applying more force beyond the stretching limit would cause tendon damage.
Consequently, further application of force beyond this limit should be avoided.
Thus the scope of this study was to investigate Ankle Goniometer reliability between different
practitioners when the ankle joint was dorsiflexed to its end of range of dorsiflexion motion
without controlling for applied moment. It was hypothesised that, since this measurement is an
end of range of motion type of assessment, the maximum ankle dorsiflexion angle would be the
same between practitioners even when the moment applied is not controlled.
Aim:
To investigate whether it is possible to achieve reliable results between various raters of
varying abilities utilising the Ankle Goniometer without controlling for moment.
Objective:
o To determine if maximum ankle dorsiflexion is consistent between multiple raters of
varying experience without controlling for moment (using end of motion)
11.2 Method
Following University of Malta Research Committee approval, four practitioners with varying
experience in the use of the Ankle Goniometer assessed a convenience sample of 10 adults (5
males, 5 females mean age 36.4yrs (SD 9.5yrs); Table 11.1) using the previously validated ankle
goniometer.

189
There were no inclusion or exclusion criteria, since this device is meant to be utilised as a
diagnostic tool. However, all participants, who signed informed consent, were healthy
consenting adults with no systemic disease and no apparent deformities of the feet.
Two male and two female raters (clinicians) were randomly asked to participate (Raters 1 and 2
were male, while Raters 3 and 4 were female practitioners). The aim of this was to eliminate any
possible bias related to gender as it could be claimed that males may exert a larger moment than
females. Two of the practitioners had never used this type of goniometer before and were
instructed about its various characteristics and usage by the first practitioner. Each participant lay
supine and told to relax, following which the goniometer was applied to the right foot, which was
established in a slightly supine posture using the talo-navicular congruency method. At this
position, the head of the talus on the lateral aspect could be palpated while the medial head could
not. A force was applied at the ball of the foot until the foot was dorsiflexed maximally. An
observer noted the angle on the digital scale of the goniometer. All raters and participants were
blinded to the resultant angle. 5 repetitions were performed by each practitioner, with a 30
second pause in between. Subjects were not removed from the goniometer (Salsich et al. 2000;
pg 357, since the aim was to assess the consistency of the angle produced. Each participant was
then rated by a different rater until all raters had performed the required measurements. The
order of raters was determined randomly so that the practitioner sequence differed with each
participant.
Angular results were input in an Excel spreadsheet by the observer and then analyzed in SPSS
version 19.0.
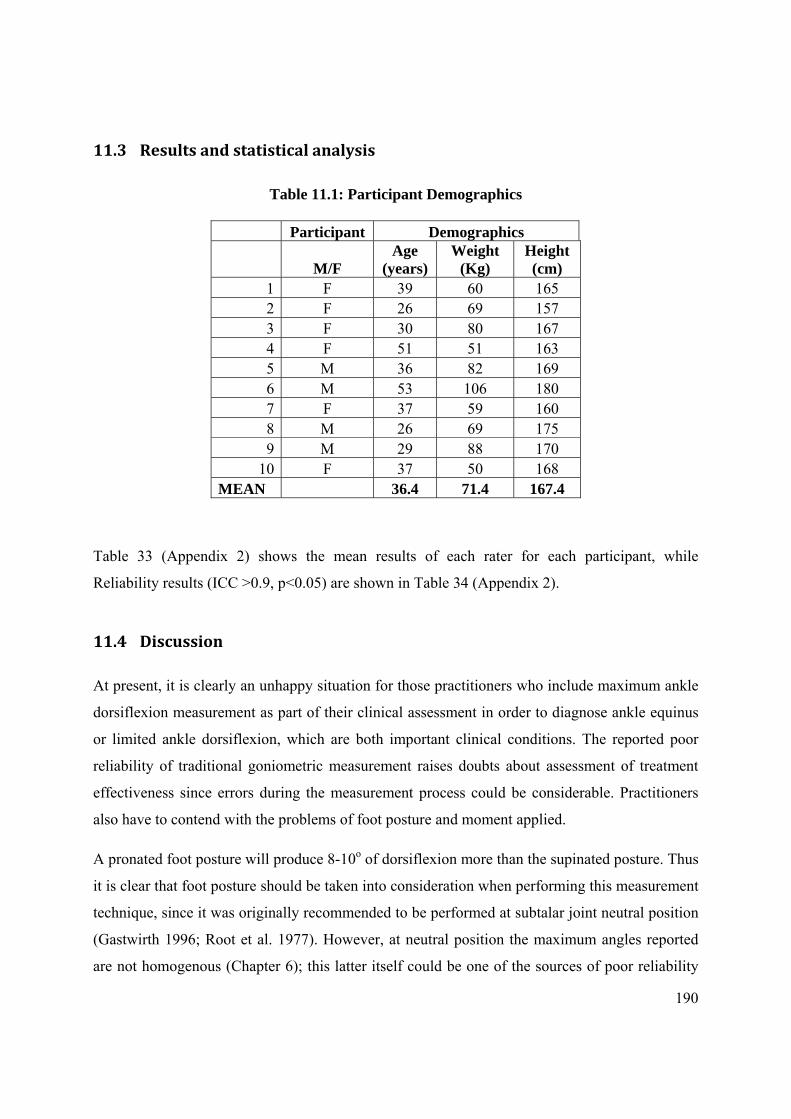
190
11.3 Results and statistical analysis
Table 11.1: Participant Demographics
Participant Demographics
M/F Age
(years) Weight
(Kg) Height (cm)
1 F 39 60 165 2 F 26 69 157 3 F 30 80 167 4 F 51 51 163 5 M 36 82 169 6 M 53 106 180 7 F 37 59 160 8 M 26 69 175 9 M 29 88 170
10 F 37 50 168 MEAN 36.4 71.4 167.4
Table 33 (Appendix 2) shows the mean results of each rater for each participant, while
Reliability results (ICC >0.9, p<0.05) are shown in Table 34 (Appendix 2).
11.4 Discussion
At present, it is clearly an unhappy situation for those practitioners who include maximum ankle
dorsiflexion measurement as part of their clinical assessment in order to diagnose ankle equinus
or limited ankle dorsiflexion, which are both important clinical conditions. The reported poor
reliability of traditional goniometric measurement raises doubts about assessment of treatment
effectiveness since errors during the measurement process could be considerable. Practitioners
also have to contend with the problems of foot posture and moment applied.
A pronated foot posture will produce 8-10o of dorsiflexion more than the supinated posture. Thus
it is clear that foot posture should be taken into consideration when performing this measurement
technique, since it was originally recommended to be performed at subtalar joint neutral position
(Gastwirth 1996; Root et al. 1977). However, at neutral position the maximum angles reported
are not homogenous (Chapter 6); this latter itself could be one of the sources of poor reliability

191
of goniometric measurement. During this thesis, the issue of foot posture has been settled since it
has been established that, although there is a statistically significant difference in the maximum
ankle angle produced in the 3 postures, there is a negligible clinical difference of only 2.49o
between the supinated and neutral postures. Thus since the maximum angles are not homogenous
at neutral posture and there is little difference between neutral and supinated, it is being
recommended that the supinated posture should be assumed instead of the neutral posture.
The third factor that has been quoted as affecting the maximum ankle angle is the use of a
constant force applied to the ball of the foot. The maximum angle is said to be dependent on the
force applied. In fact, all reliability testing of specially designed ankle goniometers are
performed with a constant moment applied (Assal et al. 2003; Meyer et al. 2006; Wilken et al.
2011). When translated into actual clinical use, it is evident that the whole procedure would
become impractical. Thus an alternative method of measuring ankle dorsiflexion without
controlling force had to be found in order to make the measurement a practical, yet reliable,
procedure.
Reliability in various single-rater and two-rater situations for the Ankle Goniometer has already
been established in the previous Chapter. All that remained was to establish whether different
raters, without using force gauges, would repeatedly produce consistent results that can be
comparable, thus establishing reliability of this tool that could be inferred to a larger population
of raters.
This has been clearly achieved, as with an ICC (2,1) >0.9 the results are unambiguous. This high
reliability is a result of the various features embedded into the design of the Ankle Goniometer,
which reduce movement of the device during the measurement procedure itself, the holding of
the heel in the assumed position and possibly also because the forefoot has been completely
eliminated from the equation, since midtarsal joint dorsiflexion could be a significant component
of induced errors.

192
11.5 Conclusion
The Ankle Goniometer is a reliable device for measuring ankle dorsiflexion even by
multiple raters of varying experience when the foot is dorsiflexed to its end of range of
motion.

Chapter 12
Summative Discussion

194
12.0 Summative Discussion
This thesis set out to investigate, using various scientific methods, the important clinical issue of
measuring ankle dorsiflexion. One of the principal aims was, indeed, to attempt to rectify an
anomalous situation in which today’s clinicians and researchers are faced with: that of having to
utilise unreliable methods for quantifying ankle dorsiflexion notwithstanding the fact that
nowadays technology is so highly advanced.
This thesis produced specific findings from which various important points were extracted,
which conclusions should affect the way that clinicians/researchers examine ankle dorsiflexion
and from which an Ankle Goniometer was devised.
It has been demonstrated that the unreliability of traditional goniometric measurements is well
documented. New scientific papers in this respect keep being published as various authors tackle
this problem from various angles. At the time of writing this thesis, the latest published paper,
unlike Pierrynowsky et al. (1996), has shown that investigator experience does not increase
reliability when this technique is used to measure ankle dorsiflexion (Kim et al. 2011). This is
indeed an important revelation, as rater experience has always been a standard upon which this
type of investigation was based. This paper has shown that a rater with little experience will
produce similarly-unreliable results as an experienced rater. These conclusions add to the
evidence base that this important field of clinical examination is still a grey area and that further
study is required.
Two important questions invariably arise out of this bleak scenario regarding unreliability of
goniometric measurements:
1. Where does this leave the plethora of research studies, involving ankle dorsiflexion
measurement as an outcome measure, that have been, and are still being, performed throughout
the scientific community? How dependable are the results, especially now that it is confirmed
that rater experience does not increase reliability?
2. What about the important surgical and clinical decisions that are taken based on this
measurement? Is this, perhaps, one of the reasons why, following Achilles Tendon lengthening,
an apropulsive gait is one of the quoted side-effects? Could it be that this may result from the

195
unreliability of the measurements themselves, which could indicate that a person has a much
more serious equinus condition, that what s/he in fact has, or vice versa?
Indeed, this unreliability of ankle dorsiflexion measurement has been a source of research over
the years, with various research groups addressing various aspects of this problem and coming
up with different designs of ankle goniometers (Chapters 3). As an example, at the time of
writing this discussion, a new device to measure ankle joint range of motion has been published
(Kobayashi et al. 2011). Some of these devices indeed would not be suitable for regular clinical
use due to their cumbersome and complicated nature.
In order for the different lacunae to be addressed, various stages during the preparation of this
thesis were designed. This enabled the analysis and synthesis of information necessary to make
ankle dorsiflexion measurement as reliable as possible. Each section of this thesis was thus
devised to address specific research questions which arose out of the literature and systematic
reviews (Chapters 2 and 3).
From the onset, it was clear that the multi-segmental nature of the human foot was a prime
causative factor that contributed to this unreliability. The results of the systematic review
(Chapter 3) identified the pathway which this thesis had to follow, i.e.:
o Differentiate between ankle and foot dorsiflexion
o Analyse the large number of devices designed specifically to measure ankle (or
foot?) dorsiflexion that have been presented in literature.
o Investigate how foot posture can affect the maximum ankle dorsiflexion angle.
o Investigate whether the amount of applied force actually affects the maximum
ankle dorsiflexion angle.
o Explore how foot segment kinematics may also affect ankle dorsiflexion results
o Reliability testing of ankle goniometers scored poorly on quality controls, with
devices giving the same results on small, healthy populations of subjects. Thus
any new device had to be properly validated and reliability established, learning
from the omissions of other research.

196
At the end of the systematic review, it was even suggested that a foot-plate be utilised, based on
the fact that the majority of authors investigating foot dorsiflexion were using such plates. It later
transpired, however, that this could contribute to produce erroneous results, as the forefoot
should be eliminated from the equation due to midtarsal joint dorsiflexion.
The above points were then investigated independently, with results revealing interesting
outcomes that contributed to make ankle dorsiflexion measurement a more reliable procedure, as
has been proven in the various chapters of this thesis.
12.1 Summary of Results of various studies performed throughout this thesis
Foot Posture: It has been demonstrated that foot posture has a profound effect on the maximum
ankle angle. A study carried out on kinematics of passive dorsiflexion in adults (Chapter 6) has
confirmed two earlier studies that utilised much more rudimentary methods (Tiberio et al. 1989;
Woodburn 1991). These studies reported an increase of 10o when the foot is held in the pronated
posture; likewise the trial (chapter 6) found a difference of 8.27o between the pronated and
supinated postures.
In conformity with the study by Woodburn (1991), this trial found no clinical difference between
the neutral and supinated postures. Although there is a statistically significant difference, it has
been concluded that 2.5o would not affect any clinical decisions, rendering these as clinically
unimportant. Thus adopting a supinated posture for measuring ankle dorsiflexion would be much
simpler for those practitioners who do not have the required expertise in holding the foot at
subtalar joint neutral position. Even the ‘experts’ would benefit from holding the foot at this
position, as it has been shown that “expertise” does not increase reliability in the traditional
goniometric methods.
In contrast, foot posture does not make any difference when assessing adolescents’ feet,
implying that any posture can be adopted for this measurement (Chapter 7). This may have been
due to the highly flexible nature of adolescents’ feet investigated. Certainly investigating a much
larger population would provide more normative and more reliable data in this population.
Forefoot to hindfoot angle: Another important consideration is that there is always more
forefoot than hindfoot movement, i.e. the forefoot travels through a greater angle than the
197
hindfoot. This is confirmed by the forefoot to hindfoot angle, which increases with the
application of a force at the metatarsophalangeal joint area. This means that there is sagittal plane
movement at the midtarsal joint, disputing the traditional Rootian Theory that “locking the
midtarsal joint” would eliminate forefoot movement.
Moment applied: During this thesis, it has been hypothesised that the amount of force applied
should not be a critical factor determining the resultant maximum ankle dorsiflexion angle since
this angle is dependent on the range of motion available, which in turn is dependable on the
stretching characteristics of the calf muscle-tendon unit and the osseous structure of the ankle
joint itself. It became clearly evident during reliability testing of the Ankle Goniometer that,
keeping a constant moment makes inter-rater reliability testing much simpler especially when
multiple raters are performing the assessment. However, controlling for moment makes this
measurement technique clinically impractical as few clinicians have a force gauge handy in their
domiciliary bag.
Passive calf muscle tendon unit stretching: Results show that, in the supinated position, there
is no measureable increase in the maximum ankle dorsiflexion angle due to stretching of the calf
MTU (Chapter 8). There was, however, one subject whose maximum ankle increased by 2.88o
with every stretch at neutral position. This evidence continues to build on the theory that
maximum ankle angle measurement should, in fact, be conducted at a supinated posture, as
opposed to the traditionally-advised neutral position.
Reliability of measurement: It has been proven, utilising both a motion capture system
(Chapter 6) and the Ankle Goniometer (Chapters 10 and 11) that reliable results can be obtained
using an end of range of motion technique with the foot held in a slightly supinated posture.
Implications for the Management of Professional and Patient Knowledge
The findings from the various research carried out during this project, and evidence from
existing literature, have significant implications for both clinical practice and research. Important
issues have been identified and investigated, some ‘traditionally accepted’ theories, like the
midtarsal-joint locking mechanism, have been disputed and shown to be erroneous. Certainly,
following scientific findings, it is the responsibility of the investigator to disseminate the relevant
findings, for example in peer-reviewed journals and conferences, in order to ensure that correct
198
clinical and research techniques are utilised during investigations of passive ankle dorsiflexion. It
has been demonstrated, through literature, that current methods of measuring ankle dorsiflexion
are highly unreliable, thus their results cannot be responsibly used to diagnose or treat a patient
or as an outcome measure during scientific investigation. However, adopting the correct foot
posture and the right technique and utilising a validated instrument such as the Ankle
Goniometer, it is now possible to reliably measure passive dorsiflexion.
Thus the implications for clinical use are clear: there should be discontinuity of usage of the
‘normal’ clinical goniometer and an Ankle Goniometer should be adopted.
12.2 Limitations
The present work has some limitations that should be acknowledged.
All trials would benefit from a large number of participants, however this is not always possible
due to various technical, human and financial difficulties. The trials performed during this
project, except for those that investigated validity and reliability of the Ankle Goniometer, would
ideally have required a power calculation to establish the number of participants necessary. This,
however, was not possible because there is no baseline data available. It is hoped that results
from this work will inform power calculations for future studies. It was not possible to increase
the number of participants in both adult and adolescent studies. Notwithstanding this, it is
common practice, when performing biomechanical trials, to have small sample sizes, as can be
attested by a great number of published papers. Although it is certain that a greater sample size
would have provided stronger conclusions, the results and conclusions throughout this thesis are
supported by two previous studies which reported similar results, where the maximum foot
dorsiflexion angle is concerned.
The adolescent study would have benefitted from some male participants; although various
young gentlemen promised to attend, they did not turn up for the actual data collection.

Chapter 13
Conclusions
200
The main objective of this research was to study passive ankle joint complex dorsiflexion in
order to produce a reliable ankle dorsiflexion measuring device, which to this investigator’s
knowledge, has never been done to date using sophisticated, motion analysis equipment. Various
important factors that could impact this important clinical procedure, have been identified and
investigated.
Following the systematic review and various trials carried out during this project, it can be
concluded that:
Ankle equinus, or limited ankle dorsiflexion, is an important clinical condition that
needs to be investigated and possibly managed
Traditional methods of measuring ankle dorsiflexion using a goniometer are highly
unreliable, and should not be thought in schools or textbooks as no amount of training
can make these more reliable.
Ankle joint dorsiflexion measurement should be performed with the subject lying
prone or supine.
When placing the foot at subtalar joint neutral position, there is no ‘locking’ of the
midtarsal joint, at least during passive dorsiflexion, and when the foot is dorsiflexed
by applying a moment to the metatarsophalangeal joint, there is always sagittal plane
movement in the midtarsal joint since the forefoot to hindfoot angle increases with
the application of this moment. Conversely, the forefoot also travels through a larger
angle than the hindfoot.
Foot posture – i.e. placing the foot at subtalar joint neutral, supinated or pronated
position – always has the most profound effect on the maximum foot dorsiflexion
angle. The greatest angular difference of 8o lies between the pronated and supinated
201
postures. Although there is a statistically significant difference of 2.49o between the
neutral and supinated posture, this is clinically insignificant and will certainly not
affect clinical decisions taken when treating a patient.
For various reasons, in adults, it is recommended to hold the foot in a slightly
supinated posture and not as traditionally recommended at subtalar joint neutral
position. These reasons include:
o Ease of establishing required posture: it is much easier for the rater to hold the
foot in a supinated posture than at a neutral position
o There is no clinical difference between the two postures
o There was no stretching of the calf muscle tendon unit in all subjects in the
supinated posture, while there may be the possibility of stretching at neutral
position (one subject did in fact stretch by 2.88o).
There is no stretching of the calf muscle tendon unit when passively dorsiflexing the
foot at a supinated position.
There is no need to control moment applied to the forefoot when dorsiflexing the
foot, provided that the foot is dorsiflexed maximally to the end of its motion.
An Ankle Goniometer should have the following design features:
o It should enable itself to be held steadily without moving during the
measurement process
o It should be anchored securely; in the lower limb this appears to be the
anterior part of the tibia
o It should enable the hindfoot to be held securely
o A footplate should not be used; rather a ‘heel plate’ should be employed.
202
o Should be able to be adjusted wherever necessary in order to align the
instrument as required by the rater
o The axis of motion should parallel the ankle axis, i.e. in line with the
malleolus
o The goniometer should be able to hold the foot in the desired posture
o The readout should be clearly visible
When assessing maximum ankle dorsiflexion, the Ankle Goniometer provides similar
output data as an optoelectronic motion capture system, however at a much cheaper
cost, which should make it more readily available to clinics and research. This makes
it a very valid instrument for measuring ankle dorsiflexion
A properly designed and utilised Ankle goniometer is highly reliable between the
same rater and two or more raters.

203
Chapter 14
Recommendations and Directions for Further Study

204
The following recommendations are based on the findings of this thesis. It is hoped that these
recommendations are helpful both to practitioners and researchers alike, in order to improve
clinical practices and research validity, respectively.
Recommendation for performing maximum ankle dorsiflexion angle measurement
A normal clinical goniometer should never be used as there is overwhelming evidence
that it is highly unreliable. Experience does not increase reliability (Kim et al. 2011).
Examination should be performed supine or prone as sitting affects the maximum ankle
angle (Thoms and Rome 1997).
If subtalar joint neutral position or a supinated position is adopted for this measurement
technique, the amount of force applied does not need to be controlled (Chapter 8).
There is no resultant stretching of the calf muscles when performing short repetitive
passive dorsiflexion movements at the supinated posture, such as required during
multiple measurements of ankle dorsiflexion.
There is little clinical difference of 2.49o between the maximum angle measured with the
foot at neutral and supinated posture. This angle is often unmeasureable using a normal
goniometer. Thus it is recommended that a supinated posture be adopted (Chapter 6).
In adolescents, foot posture may not be taken into consideration as there are no
significant differences between the two postures due to the high flexibility of young feet
(Chapter 7). However, caution is advised as we have not had, unfortunately, the
opportunity to investigate the effect of foot posture on maximum ankle angle in
adolescents with non-flexible feet.
An ankle goniometer should only measure hindfoot movement and the forefoot should
not be included in the examination procedure except as a lever to which a moment is
applied. When the goniometer spans across hindfoot and forefoot (such as the traditional
goniometer or those devices employing a plantar foot plate), a summation of hindfoot and
forefoot angles is being measured.
It has been demonstrated that an Ankle Goniometer with the design criteria as outlined in
Chapter 9, is a reliable clinical tool that can be used by multiple raters even when
moment is not controlled, thus making it easier for this device to be employed in pre- and
post-intervention procedures and for comparative reasons between practitioners.

205
Recommendations for further study:
There arises a need for re-assessing research done, in which ankle dorsiflexion measurement is a
main outcome measurement, to decide how relevant the results of such research remain relevant
following the important revelations on unreliability that arose out of this thesis.
Trials should be replicated with more participants.
Now that a reliable Ankle Goniometer is available, ankle dorsiflexion should be investigated in
specific patient populations, such as diabetics and those suffering from rheumatoid arthritis,
since the effect of ankle equinus on forefoot pressure is well documented. However, once again,
how valid are these results?
Although ankle dorsiflexion measurement in neurologically-impaired patients was outside the
scope of this thesis, it is recognized that this area is an extremely important aspect of clinical
practice to which the Ankle Goniometer may provide a significant contribution. Further study is
in this area is certainly indicated.
The Ankle Goniometer could also be an important measurement instrument for the prescription
of Ankle Foot Orthoses (AFOs). Further study in this area is warranted.

206
References
Allinger, T. L., and Engsberg, J. R., 1993. A method to determine the range of motion of the ankle joint complex, in vivo. Journal of Biomechanics, 26 (1), 69-76.
Allington, N. J., Leroy, N., and Doneux, C., 2002. Ankle joint range of motion measurements in spastic cerebral palsy children: Intraobserver and interobserver reliability and reproducibility of goniometry and visual estimation. Journal of Pediatric Orthopaedics (Br), 11 (3), 236-239.
Assal, M., Shofer, J. B., Rohr, E., Price, R., Czerniecki, J., and Sangeorzan, B. J., 2003. Assessment of an electronic goniometer designed to measure equinus contracture. Journal of Rehabilitation Research and Development, 40 (3), 235-239.
Backer, M., and Kofoed, H., 1989. Passive ankle mobility. Clinical measurement compared with radiography. Journal of Bone and Joint Surgery (Br), 71 (4), 696-698.
Baggett, B. D., and Young, G., 1993. Ankle joint dorsiflexion. Establishment of a normal range. Journal of the American Podiatric Medical Association, 83 (5), 251-254.
Ball, P., and Johnson, G. R., 1993. Reliability of hindfoot goniometry when using a flexible electrogoniometer. Clinical Biomechanics, 8 (1), 13-19.
Bardelli, M., Turelli, L., and Scocciant, G., 2003. Definition and classification of metatarsalagia. Foot and Ankle Surgery, 9, 79-85.
Barrett, S. L., and Jarvis, J., 2005. Equinus deformity as a factor in forefoot nerve entrapment: Treatment with endoscopic gastrocnemius recession. Journal of the American Podiatric Medical Association, 95 (5), 464-468.
Bennell, K. L., Talbot, R. C., Wajswelner, H., Techovanich, W., Kelly, D. H., and Hall, A. J., 1998. Intra-rater and inter-rater reliability of a weight-bearing lunge measure of ankle dorsiflexion. Australian Journal of Physiotherapy, 44 (3), 175-180.
Bland, J. M., and Altman, D. G., 1997. Statistics notes: Cronbach's alpha. BMJ ;314:572., 314. Borton, D., Walker, K., Pirpiris, M., Nattrass, G., and Graham, H., 2001. Isolated calf
lengthening in cerebral palsy: Outcome analysis of risk factors. Journal of Bone and Joint Surg (Br) (83-B), 364-370.
Brantingham, J. W., Lee Gilbert, J., Shaik, J., and Globe, G., 2006. Sagittal plane blockage of the foot, ankle and hallux and foot alignment-prevalence and association with low back pain. Journal of Chiropractic Medicine, 5 (4), 123-127.
Buckley, R. E., and Hunt, D. V., 1997. Reliability of clinical measurement of subtalar joint movement. Foot and Ankle International, 18 (4), 229-232.
Cappozzo, A., Catani, F., Leardini, A., Benedetti, M. G., and Della Croce, U., 1996. Position and orientation in space of bones during movement: Experimental artefacts. Clinical Biomechanics, 11 (2), 90-100.
Carson, M. C., Harrington, M. E., Thompson, N., O'connor, J. J., and Theologis, T. N., 2001. Kinematic analysis of a multi-segment foot model for research and clinical applications: A repeatability analysis. Journal of Biomechanics, 34 (10), 1299-1307.
Castro, M. D., 2002. Ankle biomechanics. In: Foot and ankle clinics, 679-693.
207
Charles, J., Scutter, S. D., and Buckley, J., 2010. Static ankle joint equinus: Toward a standard definition and diagnosis. Journal of the American Podiatric Medical Association, 100 (3), 195-203.
Corporation, A. T. Flock of birds Available from: http://www.ascension-tech.com/realtime/RTflockofBIRDS.php [Accessed: 10th November 2010].
Currier, D. P., 1984. Elements of research in physical therapy. 2nd ed. ed. Baltimore ; London: Williams & Wilkins.
Dananberg, H. J., 2004. Manipulation of the ankle as a method of treatment for ankle and foot pain. Journal of the American Podiatric Medical Association, 94 (4), 395-399.
Dananberg, H. J., Shearstone, J., and Guillano, M., 2000. Manipulation method for the treatment of ankle equinus. Journal of the American Podiatric Medical Association, 90 (8), 385-389.
Deeks, J., 2001. Systematic reviews of evaluations of diagnostic and screening tests. In: Egger, M., G, D. S., and Altman, D. eds. Systematic reviews in health care: Meta-analysis in context. 2nd Edition ed.: BMJ Publishing Group: London.
Diamond, J. E., Mueller, M. J., Delitto, A., and Sinacore, D. R., 1989. Reliability of a diabetic foot evaluation. Physical Therapy, 69 (10), 797-802.
Digiovanni, C. W., Holt, S., Czerniecki, J. M., Ledoux, W. R., and Sangeorzan, B. J., 2001. Can the presence of equinus contracture be established by physical exam alone? Journal of Rehabilitation Research and Development, 38 (3), 335-340.
Digiovanni, C. W., Kuo, R., Tejwani, N., Price, R., Hansen, S. T., Jr., Cziernecki, J., and Sangeorzan, B. J., 2002. Isolated gastrocnemius tightness. Journal of Bone and Joint Surgery (Am), 84-A (6), 962-970.
Dissemination, N. C. F. R. A. 2002. Finding studies for systematic reviews: A basic checklist for researchers. University of york. .
Donatelli, R., and Wolf, S. L., 1990. Normal biomechanics. In: The biomechanics of the foot and ankle: F.A. Davis, xv,284p.
Donnery, J., and Spencer, R. B., 1988. The biplane goniometer. A new device for measurement of ankle dorsiflexion. Journal of the American Podiatric Medical Association, 78 (7), 348-351.
Downey, M. S., and Banks, A. S., 1989. Gastrocnemius recession in the treatment of nonspastic ankle equinus. A retrospective study. Journal of the American Podiatric Medical Association, 79 (4), 159-174.
Editors, P. M., 2007 Many reviews are systematic but some are more transparent and completely reported than others. (3).
Elveru, R. A., Rothstein, J. M., and Lamb, R. L., 1988. Goniometric reliability in a clinical setting. Subtalar and ankle joint measurements. Physical Therapy, 68 (5), 672-677.
Evans, A. M., and Scutter, S. D., 2006. Sagittal plane range of motion of the pediatric ankle joint: A reliability study. Journal of the Amerian Podiatric Medical Association, 96 (5), 418-422.
Franci, R., Parenti-Castelli, V., Belvedere, C., and Leardini, A., 2009. A new one-dof fully parallel mechanism for modelling passive motion at the human tibiotalar joint. Journal of Biomechanics, 42 (10), 1403-1408.
Fuller, K. S., 1998. Stroke. In: Pathology: Implications for the physical therapist. Philadelphia: WB Saunders, 748–762.
208
Gajdosik, R. L., 2001. Passive extensibility of skeletal muscle: Review of the literature with clinical implications. Clinical Biomechanics, 16 (2), 87-101.
Gajdosik, R. L., and Bohannon, R. W., 1987. Clinical measurement of range of motion. Review of goniometry emphasizing reliability and validity. Physical Therapy, 67 (12), 1867-1872.
Gajdosik, R. L., Vander Linden, D. W., Mcnair, P. J., Riggin, T. J., Albertson, J. S., Mattick, D. J., and Wegley, J. C., 2004. Slow passive stretch and release characteristics of the calf muscles of older women with limited dorsiflexion range of motion. Clinical Biomechanics, 19 (4), 398-406.
Gastwirth, B. W., 1996. Biomechanical examination of the foot and lower extremity. In: Clinical biomechanics of the lower extremities: R.L. Mosby. Missouri.
Glanville, J., Phase 3. Identification of research. Centre for Reviews and Dissemination. York. www.crd.york.ac.uk/crdweb/ . accessed 5th April, 2008. Grady, J. F., and Saxena, A., 1991. Effects of stretching the gastrocnemius muscle. J Foot Surg,
30 (5), 465-469. Greisberg, J., Drake, J., Crisco, J., and Digiovanni, C., 2002. The reliability of a new device
designed to assess gastrocnemius contracture. Foot Ankle International, 23 (7), 655-660. Hamel, A. J., Sharkey, N. A., Buczek, F. L., and Michelson, J., 2004. Relative motions of the
tibia, talus, and calcaneus during the stance phase of gait: A cadaver study. Gait Posture, 20 (2), 147-153.
Harris, R. I., and Beath, T., 1948. Hypermobile flatfoot with short tendo achilles. Journal of Bone and Joint Surggery [Am], 30, 116-150.
Harrison, J. W. K., Carmont, M. R., and Walsh, H. P. J., 2001. The `missed' tight tendon achilles? Foot and Ankle Surgery, 7, 245-246.
Hemingway, P., and Breretron, N., 2009. <[hemingway et] what is a systematic review.Pdf>. Evidence-Based Medicine: What is ? series.
Hill, R. S., 1995. Ankle equinus. Prevalence and linkage to common foot pathology. Journal of the American Podiatric Medical Association, 85 (6), 295-300.
Hume, P., Nakamura, T., and Buford, W. E. A., 2000. Analysis of torque-range-of-motion for the passive viscoelastic properties of the foot/ankle complex. 18th Annual conference on Biomedical Engineering Research, Houston Texas.
Irving, D. B., Cook, J. L., and Menz, H. B., 2006. Factors associated with chronic plantar heel pain: A systematic review. Journal of Science and Medicine in Sport, 9 (1-2), 11-22.
Johanson, M. A., Cooksey, A., Hillier, C., Kobbeman, H., and Stambaugh, A., 2006a. Heel lifts and the stance phase of gait in subjects with limited ankle dorsiflexion. Journal of Athletic Training, 41 (2), 159-165.
Johanson, M. A., Wooden, M., Catlin, P. A., Hemard, L., Lott, K., Romalino, R., and Stillman, T., 2006b. Effects of gastrocnemius stretching on ankle dorsiflexion and time-to heel-off during the stance phase of gait. Physical Therapy in Sport, 7 (2), 93-100.
Johnson, C. H., and Christensen, J. C., 2005. Biomechanics of the first ray part v: The effect of equinus deformity. A 3-dimensional kinematic study on a cadaver model. Journal of Foot andAnkle Surgery, 44 (2), 114-120.
Jordan, K., Dziedzic, K., Mullis, R., Dawes, P. T., and Jones, P. W., 2001. The development of three-dimensional range of motion measurement systems for clinical practice. Rheumatology (Oxford), 40 (10), 1081-1084.
209
Jull, A., 2002. Evaluation of studies of assessment and screening tools, and diagnostic tests. Evidence-Based Nursing, 5 (3), 68-72.
Kadaba, M. P., Ramakrishnan, H. K., Wootten, M. E., Gainey, J., Gorton, G., and Cochran, G. V., 1989. Repeatability of kinematic, kinetic, and electromyographic data in normal adult gait. Journal of Orthopaedic Research, 7 (6), 849-860.
Kaufman, K. R., Brodine, S. K., Shaffer, R. A., Johnson, C. W., and Cullison, T. R., 1999. The effect of foot structure and range of motion on musculoskeletal overuse injuries. American Journal of Sports Medicine, 27 (5), 585-593.
Khan, K., Kunz, R., Kleijen, J., and G, A., 2005. Systematic reviews to support evidence-based medicine: How to review and apply findings of healthcare research. The Royal Society of Medicine Press.
Khazzam, M., Long, S.T., Marks, M.M. and Harris, G.F. 2008. Foot and ankle motion analysis of patients with ankle arthritis. In: Foot and Ankle Motion Analysis. Eds. Marks, R.M., Harris, F.F. and Smith, P.A. CRC Press: London
Kilgour, G., Mcnair, P., and Stott, N. S., 2003. Intrarater reliability of lower limb sagittal range-of-motion measures in children with spastic diplegia. Developmental Medicine and Child Neurology, 45 (6), 391-399.
Kim, P. J., Peace, R., Mieras, J., Thoms, T., Freeman, D., and Page, J., 2011. Interrater and intrarater reliability in the measurement of ankle joint dorsiflexion is independent of examiner experience and technique used. Journal of the American Podiatric Medical Association, 101 (5), 407-414.
Kirby, K. A., 2000. Biomechanics of the normal and abnormal foot. Journal of the American Podiatric Medical Association, 90 (1), 30-34.
Kirtley, C., 2006. Biomechanics of standing. In: Clinical gait analysis theory and practice: Elsevier: Edinburgh.
Kitaoka, H. B., Luo, Z. P., Uchiyama, E., Kim, K.-J., Berglund, L. J., and An, K. N., 1999. Analysis of ankle and foot motion with a dynamic ankle simulator: A cadaver mode. Paper presented at the 45th Annual Meeting, Orthopaedic Research Society, February 1-4, Anaheim, California.
Knight, C. A., Rutledge, C. R., Cox, M. E., Acosta, M., and Hall, S. J., 2001. Effect of superficial heat, deep heat, and active exercise warm-up on the extensibility of the plantar flexors. Physical Therapy, 81 (6), 1206-1214.
Kobayashi, T., Leung, A. K., and Hutchins, S. W., 2011. Design of a manual device to measure ankle joint stiffness and range of motion. Prosthetics and Orthotics International, 35 (4), 478-481.
Lavery, L. A., Armstrong, D. G., and Boulton, A. J., 2002. Ankle equinus deformity and its relationship to high plantar pressure in a large population with diabetes mellitus. Journal of the American Podiatric Medical Association, 92 (9), 479-482.
Leardini, A., O'connor, J. J., Catani, F., and Giannini, S., 1999a. A geometric model of the human ankle joint. Journal of Biomechanics, 32 (6), 585-591.
Leardini, A., O'connor, J. J., Catani, F., and Giannini, S., 1999b. Kinematics of the human ankle complex in passive flexion; a single degree of freedom system. Journal of Biomechanics, 32 (2), 111-118.
Leardini, A., O'connor, J. J., Catani, F., Martelli, S., and Giannini, S., 1998. The kinematics of the ankle in the sagittal plane. Paper presented at the Conference of the ESB, Toulouse, France.

210
Leardini, A., Stagni, R., and O'connor, J. J., 2001. Mobility of the subtalar joint in the intact ankle complex. Journal of Biomechanics, 34 (6), 805-809.
Lijmer, J. G., 1999. Empirical evidence of design-related bias in studies of diagnostic tests. JAMA: The Journal of the American Medical Association, 282 (11), 1061-1066.
Lin, S. S., Lee, T. H., and Wapner, K. L., 1996. Plantar forefoot ulceration with equinus deformity of the ankle in diabetic patients: The effect of tendo-achilles lengthening and total contact casting. Orthopedics, 19 (5), 465-475.
Liu, W., Siegler, S., Hillstrom, H., and Whitney, K., 1997. Three-dimensional, six-degrees-of-freedom kinematics of the human hindfoot during the stance phase of level walking. Human Movement Science, 16, 283-298.
Lun, V., Meeuwisse, W. H., Stergiou, P., and Stefanyshyn, D., 2004. Relation between running injury and static lower limb alignment in recreational runners. British Journal of Sports Medicine, 38 (5), 576-580.
Lundberg, A., Goldie, I., Kalin, B., and Selvik, G., 1989a. Kinematics of the ankle/foot complex: Plantarflexion and dorsiflexion. Foot Ankle, 9 (4), 194-200.
Lundberg, A., Svensson, O. K., Nemeth, G., and Selvik, G., 1989b. The axis of rotation of the ankle joint. Journal of Bone and Joint Surgery (Br), 71 (1), 94-99.
Lundgren, P., Nester, C., Liu, A., Arndt, A., Jones, R., Stacoff, A., Wolf, P., and Lundberg, A., 2008. Invasive in vivo measurement of rear-, mid- and forefoot motion during walking. Gait Posture, 28 (1), 93-100.
Maluf, K. S., Mueller, M. J., Strube, M. J., Engsberg, J. R., and Johnson, J. E., 2004. Tendon achilles lengthening for the treatment of neuropathic ulcers causes a temporary reduction in forefoot pressure associated with changes in plantar flexor power rather than ankle motion during gait. Journal of Biomechanics, 37 (6), 897-906.
Martin, R. L., and Mcpoil, T. G., 2005. Reliability of ankle goniometric measurements: A literature review. Journal of the American Podiatric Medical Association, 95 (6), 564-572.
Maurer, B. T., Siegler, S., Hillstrom, H. J., Selby-Silverstein, L., Farrett, W. D., and Downey, M. S., 1995. Quantitative identification of ankle equinus with applications for treatment assessment. Gait & Posture, 3 (1), 19-28.
Mayhew, T. P., Rothstein, J. M., Finucane, S. D., and Lamb, R. L., 1994. Performance characteristics of the kin-com dynamometer. Physical Therapy, 74 (11), 1047-1054.
Mecagni, C., Smith, J. P., Roberts, K. E., and O'sullivan, S. B., 2000. Balance and ankle range of motion in community-dwelling women aged 64 to 87 years: A correlational study. Physical Therapy, 80 (10), 1004-1011.
Menz, H. B., 2001. Manipulation method for the treatment of ankle equinus. Leter to the editor. . Journal of the American Podiatric Medical Association., 91 (2).
Menz, H. B., Tiedemann, A., Kwan, M. M., Latt, M. D., Sherrington, C., and Lord, S. R., 2003. Reliability of clinical tests of foot and ankle characteristics in older people. Journal of the American Podiatric Medical Association, 93 (5), 380-387.
Meyer, D. C., Werner, C. M., Wyss, T., and Vienne, P., 2006. A mechanical equinometer to measure the range of motion of the ankle joint: Interobserver and intraobserver reliability. Foot Ankle International, 27 (3), 202-205.
Moja, L. P., Telaro, E., and D'amico, R. E. A., 2005. Assessment of methodological quality primary studies by systematic reviews: Results of the metaquality cross sectional study. British Medical Journal, 330, 1053.
211
Moore, K. L., Dalley, A. F., and Agur, A. M. R., 2006. Lower limb. In: Clinically oriented anatomy 5th ed. ed. Philadelphia, Pa. ; London: Lippincott Williams & Wilkins, 702-706.
Moriguchi, C., Sato, T., and Hjc, G. C., 2007. Ankle movements during normal gait evaluated by flexible electrogoniometer. Revista Brasileira de Fisioterapia, 11 (3), 205-211.
Moseley, A., and Adams, R., 1991. Measure of passive ankle dorsiflexion: Procedure and reliability. Australian Physiotherapy, 37 (3), 175-181.
Moseley, A. M., 1997. The effect of casting combined with stretching on passive ankle dorsiflexion in adults with traumatic head injuries. Physical Therapy, 77 (3), 240-247; discussion 248-259.
Moseley, A. M., Crosbie, J., and Adams, R., 2001. Normative data for passive ankle plantarflexion--dorsiflexion flexibility. Clinical Biomechanics, 16 (6), 514-521.
Moseley, L., Smith, R., Hunt, A., and R., G., 1996. Three dimensional kinematics of the rearfoot during the stance phase of walking in normal young adult males. Clinical Biomechanics, 11 (1), 39-45.
Muellenbach, E. A., Diehl, C. J., Teachey, M. K., Lindborg, K. A., Archuleta, T. L., Harrell, N. B., Andersen, G., Somoza, V., Hasselwander, O., Matuschek, M., and Henriksen, E. J., 2008. Interactions of the advanced glycation end product inhibitor pyridoxamine and the antioxidant alpha-lipoic acid on insulin resistance in the obese zucker rat. Metabolism, 57 (10), 1465-1472.
Neptune, R. R., Kautz, S. A., and Zajac, F. E., 2001. Contributions of the individual ankle plantar flexors to support, forward progression and swing initiation during walking. Journal of Biomechanics, 34 (11), 1387-1398.
Nester, C. J., Liu, A. M., Ward, E., Howard, D., Cocheba, J., Derrick, T., and Patterson, P., 2007. In vitro study of foot kinematics using a dynamic walking cadaver model. Journal of Biomechanics, 40 (9), 1927-1937.
Nitz, J., and Low Choy, N., 2004. The relationship between ankle dorsiflexion range, falls and activity level in women aged 40 to 80 years. New Zealand Journal of Physiotherapy, 32 (3), 121-125.
Nyanzi, C. S., Langridge, J., Heyworth, J. R., and Mani, R., 1999. Randomized controlled study of ultrasound therapy in the management of acute lateral ligament sprains of the ankle joint. Clinical Rehabilitation, 13 (1), 16-22.
Pai, M., Mcculloch, M., Gorman, J. D., Pai, N., Enanoria, W., Kennedy, G., Tharyan, P., and Colford, J. M., 2004. Systematic reviews and meta-analysis an illustrated step by step guide. The National Medical Journal Of India, 17 (2), 86-95.
Perry, J., 1992. Gait analysis : Normal and pathological function. Thorofare, N.J.: SLACK. Pham, H., Armstrong, D. G., Harvey, C., Harkless, L. B., Giurini, J. M., and Veves, A., 2000.
Screening techniques to identify people at high risk for diabetic foot ulceration: A prospective multicenter trial. Diabetes Care, 23 (5), 606-611.
Pierrynowski, M. R., Smith, S. B., and Mlynarczyk, J. H., 1996. Proficiency of foot care specialists to place the rearfoot at subtalar neutral. J Am Podiatr Med Assoc, 86 (5), 217-223.
Pierrynowsky, M., Smith, S., and Mlynarczyk, J., 1996. Proficiency of foot care specialists to place the rearfoot at subtalar neutral. . Journal of the American Medical Podiatric Association., 86 (5), 217-223.

212
Radford, J. A., Burns, J., Buchbinder, R., Landorf, K. B., Cook, C., and Rome, K., 2006. Does stretching increase ankle dorsiflexion range of motion? A systematic review * commentary. British Journal of Sports Medicine, 40 (10), 870-875.
Rao, S., Saltzman, C., and Yack, H., 2006. Ankle rom and stiffness measured at rest and during gait in individuals with and without diabetic sensory neuropathy. Gait & Posture, 24 (3), 295-301.
Reid, M. C., Lachs, M. S., and Feinstein, A. R., 1995. Use of methodological standards in diagnostic test research. Getting better but still not good. Journal of the American Medical Association, 274 (8), 645-651.
Reinschmidt, C., Van Den Bogert, A. J., Murphy, N., Lundberg, A., and Nigg, B. M., 1997. Tibiocalcaneal motion during running, measured with external and bone markers. Clinical Biomechanics, 12 (1), 8-16.
Richards, J., and Thewlis, D., 2008. Motion and joint motion. In: Biomechanics in clinic and research : An interactive teaching and learning course. Edinburgh: Churchill Livingstone, xvii, 207 p.
Riddle, D. L., Pulisic, M., Pidcoe, P., and Johnson, R. E., 2003. Risk factors for plantar fasciitis: A matched case-control study. Journal of Bone and Joint Surg (Am), 85-A (5), 872-877.
Robertson, V., Ward, A., and Jung, P., 2005. The effect of heat on tissue extensibility: A comparison of deep and superficial heating. Archives of Physical Medicine and Rehabilitation, 86 (4), 819-825.
Roling, B. A., Christensen, J. C., and Johnson, C. H., 2002. Biomechanics of the first ray. Part iv: The effect of selected medial column arthrodeses. A three-dimensional kinematic analysis in a cadaver model. Journal of Foot and Ankle Surgery, 41 (5), 278-285.
Rome, K., 1996. Ankle joint dorsiflexion measurement studies. A review of the literature. Journal of the American Podiatric Medical Association, 86 (5), 205-211.
Root, M. L., Orien, W. P., and Weed, J. H., 1977. Normal and abnormal function of the foot. Los Angeles: Clinical Biomechanics Corp.
Roukis, T. S., and Landsman, A. S., 2003. Hypermobility of the first ray: A critical review of the literature. Journal of Foot and Ankle Surgery, 42 (6), 377-390.
Salsich, G. B., Mueller, M. J., and Sahrmann, S. A., 2000. Passive ankle stiffness in subjects with diabetes and peripheral neuropathy versus an age-matched comparison group. Physical Therapy, 80 (4), 352-362.
Saxena, A., 2002. Endoscopic gastrocnemius tenotomy. Journal of Foot and Ankle Surgery, 41 (1), 57-58.
Saxena, A., and Kim, W., 2003. Ankle dorsiflexion in adolescent athletes. Journal of the American Podiatric Medical Association, 93 (4), 312-314.
Scharfbillig, R., and Scutter, S. D., 2004. Measurement of foot dorsiflexion: A modified lidcombe template. Journal of the American Podiatric Medical Association, 94 (6), 573-577.
Scott, S. H., and Winter, D. A., 1991. Talocrural and talocalcaneal joint kinematics and kinetics during the stance phase of walking. Journal of Biomechanics, 24 (8), 743-752.
Sgarlato, T. E., Morgan, J., Shane, H. S., and Frenkenberg, A., 1975. Tendo achillis lengthening and its effect on foot disorders. Journal of the American Podiatric Medical Association, 65 (9), 849-871.
Sheehan, F. T., 2010. The instantaneous helical axis of the subtalar and talocrural joints: A non-invasive in vivo dynamic study. Journal of Foot and Ankle Research, 3 (13).
213
Siegler, S., Chen, J., and Schneck, C. D., 1988. The three-dimensional kinematics and flexibility characteristics of the human ankle and subtalar joints--part i: Kinematics. Journal of Biomechanical Engineering, 110 (4), 364-373.
Siegler, S., Allard, P., Kirtly, C., Leardini A. et al. Letter to the editor. ISB recommendation on definitions of joint coordinate system of various joints for the reporting of human joint motion—part I: ankle, hip, and spine. Journal of Biomechanics 35: 543–548
Silfverskiold, N., 1924. Reduction of the uncrossed two-joint muscles of the leg to one-joint muscles in spastic conditions. . Acta Chir Scand, 56 (315).
Silverskiold, N., 1924. Reduction of the uncrossed two-joint muscles of the leg to one-joint muscles in spastic conditions. Acta Chirurgica Scandinavica, 56, 315.
Simon, J., Doederlein, L., Mcintosh, A., Metatoxiotis, D., Bock, H., and Wolf, S., 2006. The heidelberg foot measurement method: Development, description and assessment. Gait Posture, 23 (4), 399-400.
Sobel, E., Caselli, M. A., and Velez, Z., 1997. Effect of persistent toe walking on ankle equinus. Analysis of 60 idiopathic toe walkers. Journal of the American Podiatric Medical Association, 87 (1), 17-22.
Stebbins, J., Harrington, M., Thompson, N., Zavatsky, A., and Theologis, T., 2006. Repeatability of a model for measuring multi-segment foot kinematics in children. Gait Posture, 23 (4), 401-410.
Subotnick, S. I., 1971. Equinus deformity as it affects the forefoot. Journal of the American Podiatric Medical Association, 61 (11), 423-427.
Sullivan, R. W., 1997. The role of gait analysis in planning reconstructive surgery. Operative Techniques in Plastic and Reconstructive Surgery, 4 (4), 165-171.
Tabrizi, P., Mcintyre, W. M., Quesnel, M. B., and Howard, A. W., 2000. Limited dorsiflexion predisposes to injuries of the ankle in children. Journal of Bone and Joint Surgery (Br), 82 (8), 1103-1106.
Tesio, L., Monzani, M., Gatti, R., and Franchignoni, F., 1995. Flexible electrogoniometers: Kinesiological advantages with respect to potentiometric goniometers. Clinical Biomechanics, 10 (5), 275-277.
Thoms, V., and Rome, K., 1997. Effect of subject position on the reliability of measurement of active ankle joint dorsiflexion. The Foot, 7 (153-158).
Tiberio, D., 1987. Evaluation of functional ankle dorsiflexion using subtalar neutral position. A clinical report. Physical Therapy, 67 (6), 955-957.
Tiberio, D., Bohannon, R. W., and Zito, M. A., 1989. Effect of subtalar joint position on the measurement of maximum ankle dorsiflexion. Clinical Biomechanics, 4 (3), 189-191.
Torgerson, C., 2003. Data extraction. In: Systematic reviews. London: Continuum ;, x, 102 p. Trevino, S. G., Buford, W. L., Jr., Nakamura, T., John Wright, A., and Patterson, R. M., 2004.
Use of a torque-range-of-motion device for objective differentiation of diabetic from normal feet in adults. Foot Ankle International, 25 (8), 561-567.
Tuijthof, G. J. M., Beimers, L., Jonges, R., Valstar, E. R., and Blankevoort, L., 2009a. Accuracy of a ct-based bone contour registration method to measure relative bone motions in the hindfoot. Journal of Biomechanics, 42 (6), 686-691.
Tuijthof, G. J. M., Zengerink, M., Beimers, L., Jonges, R., Maas, M., Van Dijk, C. N., and Blankevoort, L., 2009b. Determination of consistent patterns of range of motion in the ankle joint with a computed tomography stress-test. Clinical Biomechanics, 24 (6), 517-523.

214
Valmassy, R., 1996. Biomechanical evaluation of the child In: Clinical biomechanics of the lower extremity. Missouri: Mosby.
Van Den Bogert, A. J., Smith, G. D., and Nigg, B. M., 1994. In vivo determination of the anatomical axes of the ankle joint complex: An optimization approach. Journal of Biomechanics, 27 (12), 1477-1488.
Van Gheluwe, B., Kirby, K. A., Roosen, P., and Phillips, R. D., 2002. Reliability and accuracy of biomechanical measurements of the lower extremity. Journal of the American Medical Podiatric Association., 92 (6), 317-326.
Weaver, K., Price, R., Czerniecki, J., and Sangeorzan, B., 2001. Design and validation of an instrument package designed to increase the reliability of ankle range of motion measurements. Journal of Rehabitationl Research and Development, 38 (5), 471-475.
Weir, J., and Chockalingam, N., 2007. Ankle joint dorsiflexion: Assessment of true values necessary for normal gait. International Journal of Therapy and Rehabilitation, 14 (2).
Wernick, J., and Volpe, R. G., 1996. Lower extrenity function and normal mechanics. In: Valmassy, R. L. ed. Clinical biomechanics of the lower extremities. St. Louis, Mo. ; London: Mosby, xviii, 510 p.
Wessling, K. C., Devane, D. A., and Hylton, C. R., 1987. Effects of static stretch versus static stretch and ultrasound combined on triceps surae muscle extensibility in healthy women. Physical Therapy, 67 (5), 674-679.
Whiting, P., Rutjes, A. W., Reitsma, J. B., Bossuyt, P. M., and Kleijnen, J., 2003. The development of quadas: A tool for the quality assessment of studies of diagnostic accuracy included in systematic reviews. BMC Medical Research Methodology, 3, 25.
Wieseler, B., and Mcgauran, N., 2010. Reporting a systematic review. Chest, 137 (5), 1240-1246.
Wilken, J., Rao, S., Estin, M., Saltzman, C. L., and Yack, H. J., 2011. A new device for assessing ankle dorsiflexion motion: Reliability and validity. Journal of Orthopedic Sport Physical Thererapy, 41 (4), 274-280.
Wilken, J., Saltzman, C., and Yack, H. 2004. Reliability and validity of iowa ankle range-of-motion device. Journal of Orthopedic Sport Physical Therapy, 34 (A), 17-18.
Woodburn, J., 1991. Video joint angle position analysis of the subtalar joint position on maximum ankle joint dorsiflexion. Journal of British Podiatric Medicine, 46, 19-22.
Woodburn, J., Helliwell, P. S., and Barker, S., 2002. Three-dimensional kinematics at the ankle joint complex in rheumatoid arthritis patients with painful valgus deformity of the rearfoot. Rheumatology (Oxford), 41 (12), 1406-1412.
Wright, C. J., Arnold, B. L., Coffey, T. G., and Pidcoe, P. E., 2011. Repeatability of the modified oxford foot model during gait in healthy adults. Gait Posture, 33 (1), 108-112.
Wrobel, J. S., and Armstrong, D. G., 2008. Reliability and validity of current physical examination techniques of the foot and ankle. Journal of the American Podiatric Medical Association, 98 (3), 197-206.
Wrobel, J. S., Connolly, J. E., and Beach, M. L., 2004. Associations between static and functional measures of joint function in the foot and ankle. Journal of the American Podiatric Medical Association, 94 (6), 535-541.
Yamaguchi, S., Sasho, T., Kato, H., Kuroyanagi, Y., and Banks, S. A., 2009. Ankle and subtalar kinematics during dorsiflexion-plantarflexion activities. Foot Ankle International, 30 (4), 361-366.
215
Youberg, L. D., Cornwall, M. W., Mcpoil, T. G., and Hannon, P. R., 2005. The amount of rearfoot motion used during the stance phase of walking. Journal of the American Podiatric Mededical Association, 95 (4), 376-382.

Appendix 1
Ethical Approvals and Participant Information Sheets

2
Trial:
Sagittal Plane Kinematics of passive ankle joint complex dorsiflexion in
healthy adults

3
Please seek guidance from the Chair of your Faculty Ethics Committee if you are uncertain about any ethical issue arising from this application.
If you have ticked No to any of Q1-8, you should complete and submit the Full Ethics Approval Form
If you have ticked Yes to 9, 10 or 11 you should complete the Full Ethics Approval Form. In relation to question10 this should include details of what you will tell participants to do if they should experience any problems (e.g. who they can contact for help). You may also need to consider risk assessment issues.
YES NO N/A 1 Will you describe the main procedures to participants in advance, so
that they are informed about what to expect? X
2 Will you tell participants that their participation is voluntary?
X
3 Will you obtain written consent for participation?
X
4 If the research is observational, will you ask participants for their consent to being observed?
X
5 Will you tell participants that they may withdraw from the research at any time and for any reason?
X
6 With questionnaires and interviews, will you give participants the option of omitting questions they do not want to answer?
X
7 Will you tell participants that their data will be treated with full confidentiality and that, if published, it will not be identifiable as theirs?
X
8 Will you give participants the opportunity to be debriefed i.e. to find out more about the study and its results?
X
YES NO N/A 9 Will your project deliberately mislead participants in any way? X 10 Is there any realistic risk of any participants experiencing either
physical or psychological distress or discomfort? X
11 Is the nature of the research such that contentious or sensitive issues might be involved?
X
YES NO N/A 12 Does your project involve work with animals? X 13 Do participants fall into any of the
following special groups? Note that you may also need to obtain satisfactory CRB clearance (or equivalent for overseas students).
Children (under 18 years of age) X X X X
People with communication or learning difficulties Patients People in custody People who could be regarded as vulnerable
STAFFORDSHIRE UNIVERSITY
Title of project: Determining the validity and reliability of a specifically-designed Ankle Goniometer for the measurement of ankle joint complex dorsiflexion. Name of researcher(s): _________ Nachiappan Chockalingam, Alfred Gatt, Roozbeh Naemi, Helen Branthwaite, Thierry Chevalier___ Date: _______ 30 August 09____________________________________

4
If you have ticked Yes to 12, 13 or 14 you should complete and submit the Full Ethics Approval Form There is an obligation to bring to the attention of the Faculty Ethics Committee any issues with ethical implications not clearly covered by the above checklist. If you have ticked Yes to 13 and your participants are patients you should follow the Guidelines for Ethical Approval of NHS Projects PLEASE PROVIDE THE DETAILS REQUIRED IN SUPPORT OF YOUR APPLICATION. THEN SIGN THE FORM. Please tick
People engaged in illegal activities (e.g. drug-taking)
X X
14 Does the project involve external funding or external collaboration where the funding body or external collaborative partner requires the University to provide evidence that the project had been subject to ethical scrutiny?
X
I consider that this project has no significant ethical implications requiring a full ethics submission to the Faculty Ethics Panel
X
Give a brief description of participants and procedure (methods, tests used etc) in up to 150 words. Goniometric measurement of ankle joint dorsiflexion is performed using a goniometer (an angle measuring device - a protractor with 2 moving arms). One arm of this goniometer is placed along the lateral side of the lower leg and the other, horizontal, arm is placed along the lateral border of the foot. The foot is then put into subtalar joint neutral position, thus enabling movement to occur only through the ankle joint, and an upward force is applied on the forefoot. This procedure creates a need for coordinating many actions at the same time, such as ensuring that the arms of the goniometer are placed exactly, that they do not move, that the midtarsal joint remains locked while the angle is read. To further complicate matters, this procedure is performed with the knees straight and flexed. It is clear that there are various things that can go wrong (Rome, 1996), so much so that research in this area has criticized this measurement technique, claiming that it is unreliable and clinically unacceptable (Van Gheluwe, Kirby, Roosen and Phillips, 2002). Various other authors have cast significant doubts as to whether the current method of measuring ankle joint dorsiflexion is reliable and valid. In fact, there appears to be consensus that this is not. With this in mind, an Ankle Goniometer was designed to overcome the various issues. The main aim of this project is to determine whether this specifically-designed Ankle Goniometer, which differs from any other such instrument in use nowadays, is a valid and reliable instrument that can be used for clinical and research use. This observational study will involve 15 – 20 subjects from both genders. After making some anthropometric measurements and joint range of movement measurements, the subjects will be required to walk on the lab surface with reflective markers placed in predetermined anatomical landmarks. Kinematic and Kinetic (movement and force) analysis will be conducted using a opto-electronic motion analysis system (Vicon), a set of strain gauge based force plates (AMTI Inc).
5
6
Information Sheet
Study Title: Sagittal Plane Kinematics of Passive Ankle Joint Dorsiflexion in Healthy Adults.
Please read this information carefully. If there is anything that is not clear from the information provided please do not hesitate to ask. After you have read the information you can decide if you wish to take part in this study.
Why are we doing this study?
As a part of an ongoing research program we have developed a new type of joint angle measuring device. We are in the process of refining and validating this method. Once this method is validated, this can be employed both in clinical assessment and further research.
We propose to conduct some non-invasive movement analysis as a part of this validation process. The use of kinematic and kinetic analysis (movement and forces) will assist in gaining some baseline data
What is involved in the study?
A few basic questions such as age and date of birth will be asked and we will measure your height, weight and limb length to help our analysis. We will also measure some joint angles. We will then place small spherical reflective balls (markers) on predetermined landmarks on your body. These markers will be secured with double sided adhesive tape. You are required to wear tight clothing such as cycling shorts in case of men and cycling shorts and sports bra in case of women to avoid interference with these markers. Movement of these markers will be tracked by high speed cameras mounted on the lab walls or on the tripods.

7
Your foot will be passively flexed a number of times in order to determine whether changing the posture of the foot will affect the maximum angle, which is important information that will be used in order to investigate a clinical examination procedure. This procedure will be repeated a few times until we record a set of error free data.
What are the risks?
The testing procedures are non invasive and totally safe. There are no known risks involved. What will happen to the results?
Your personal details such as name and age will be kept confidential and will not be shared with anyone at anytime. The data will be looked at as a group of people and patterns will be identified. You will not have the results of the study and will not benefit from taking part. The data will be used only for research purposes.
Do I have to take part?
It is up to you to decide if you would like to take part or not. If you do, you will be given this information sheet and be asked to sign a consent form. You can still stop taking part at any time without giving a reason.
Where can I get further information from?
If you have any questions about this study you can contact the principal investigator on the address below: Name: Professor Nachi Chockalingam Address: Faculty of Health
Staffordshire University Leek Road Stoke on Trent ST4 2DF
Telephone: 01782 295853 Email: [email protected]

8
Consent form
Subject identification number:
Study Title: Sagittal Plane Kinematics of Passive Ankle Joint Dorsiflexion in Healthy
Adults.
Name of Researcher: Nachiappan Chockalingam, Alfred Gatt, Roozbeh Naemi, Helen
Branthwaite, Thierry Chevalier Please initial box
1. I confirm that I have read and understand the information sheet for the above study and have had the opportunity to ask questions.
2. I understand that my participation is voluntary and that I am free to withdraw at any time without giving any reason.
3. I agree to take part in the above study
Name of Subject Signature Date
Name of Person taking consent Signature Date
(if different from researcher)
Researcher Signature Date
9
Trial:
Investigating sagittal segment motion in Adolescents during passive ankle
joint complex dorsiflexion

10

11
UNIVERSITY OF MALTA
Request for Approval of Human Subjects Research
Please type. Handwritten forms will not be accepted
You may follow this format on separate sheets or use additional pages if necessary.
FROM: (name, address for correspondence) Alfred Gatt 69, “Ir-Ragg”, Triq il-Port Ruman Marsaxlokk MXK 1535
PROJECT TITLE: Sagittal Plane Kinematic analysis of passive ankle joint complex dorsiflexion in adolescents TELEPHONE: 23401157/99497886
E-MAIL [email protected]
COURSE AND YEAR: PhD in Clinical Biomechanics, Staffordshire University: A Biomechanical Investigation of Passive Ankle Joint Complex Dorsiflexion 2nd year DURATION OF ENTIRE PROJECT: from _March2011___ to _December 2011______
FACULTY SUPERVISOR'S NAME: Professor Nachiappan Chockalingam Faculty of Health Staffordshire University, Stoke on Trent England
ANTICIPATED FUNDING SOURCE:
(include grant or contract number if known)
SELF

12
1. Please give a brief summary of the purpose of the research, in non-technical language. Goniometric measurement of ankle joint dorsiflexion is performed using a goniometer (an angle measuring device - a protractor with 2 moving arms). One arm of this goniometer is placed along the lateral side of the lower leg and the other, horizontal, arm is placed along the lateral border of the foot. The foot is then put into subtalar joint neutral position, thus (it is claimed by Root et al, 1977), enabling movement to occur only through the ankle joint, and an upward force is applied on the forefoot. This procedure creates a need for coordinating many actions at the same time, such as ensuring that the arms of the goniometer are placed exactly, that they do not move, that the midtarsal joint remains locked while the angle is read. To further complicate matters, this procedure is performed with the knees straight and flexed. It is clear that there are various things that can go wrong (Rome, 1996), so much so that research in this area has criticized this measurement technique, claiming that it is unreliable and clinically unacceptable (Van Gheluwe, Kirby, Roosen and Phillips, 2002). Various other authors have cast significant doubts as to whether the current method of measuring ankle joint dorsiflexion is reliable and valid. In fact, there appears to be consensus that this is not. As part of a larger PhD project, this investigator is designing a goniometer to assess ankle joint function in a valid and reliable manner. As an essential aspect of research relating to this, the foot movements that occur when this measurement is taken was done in a biomechanics laboratory at Staffordshire University, utilising a highly-accurate system known as a Vicon 3d motion capture system. This is a non-invasive, 8-camera system that uses infra-red to measure and track motion. This research has revealed a number of inconsistencies that cast doubt upon the reliability of the whole measurement technique and some fundamental issues regarding podiatric biomechanical theory; namely the mid-tarsal joint mechanism and its relationship to foot posture. It has been shown that, unlike traditionalistic theorists of Rootian Theory have pointed out (Root et al, 1977), placing the foot at subtalar joint neutral position does not lock the midtarsal joint to completely eliminate movement extraneous to the ankle and that the hindfoot to forefoot angle always increases when a dorsiflexing force is applied to the forefoot. These finding have been written in a paper which has been submitted for publication in a peer-reviewed journal. It is now necessary to repeat this research with adolescents because their feet have more flexibility, thus there is the possibility that during the clinical measurement of ankle dorsiflexion, foot segment motion is much greater than that in adults, which would imply that most currently-available measurement methods are quite unsuitable. 2. Give details of procedures that relate to subjects' participation (a) How are subjects recruited? What inducement is offered? (Append copy of letter or advertisement or poster, if any.) Subjects will be recruited from the International Sports Club. The Head of this club has been contacted and permission obtained (relevant letter attached). 20 adolescent subjects will be invited to participate and an information letter in Maltese and English together with a Consent Form will be provided to their parents. The data collection process will be explained to the children as well. Parental informed consent will be essential for subject participation as they will all be minors. No inducements will be offered.

13
(b) Salient characteristics of subjects—number who will participate, age range, sex, institutional affiliation, other special criteria: 20 healthy subjects with no systemic disease will be recruited, with the following Inclusion criteria: Age group: 12 to 16 year old No significant foot deformities No history of foot surgery (c) Describe how permission has been obtained from cooperating institution(s)—school, hospital, organization, prison, or other relevant organization. (Append letters.) Is the approval of another Research Ethics Committee required? Permission from Professor Kenneth Camilleri, Head of Engineering, who is responsible for the running of the Biomechanics Laboratory at the Engineering Department Mr Albert Chun, Head of the International Sports Club, where subject recruitment will take place No approval of another Research Ethics Committee is required (d) What do subjects do, or what is done to them, or what information is gathered? (Append copies of instructions or tests or questionnaires.) How many times will observations, tests, etc., be conducted? How long will their participation take? A number of reflective markers will be attached to the participants’ lower extremities using double sided tape as per established protocol for the Oxford Foot Model (Carson et al., 2001). A standing calibration of the cameras will be performed by the operator, then the participant will be asked to sit on a couch with relaxed feet. The rater will dorsiflex the foot ten times in 3 postures; neutral, pronated and supinated. The order of foot postures will be determined randomly. During this time, movement will be captured non-invasively with a six-camera Vicon system. This system builds up a computerized model of the lower extremity and the movements performed, so that the required inter-segment analysis can take place. At no time would an actual picture or video of the participant be taken. Participation time should not exceed 1 hour.
14
(e) Which of the following data categories are collected? Data that reveals – race or ethnic origin YES / NO political opinions YES / NO religious or philosophical beliefs YES / NO trade union memberships YES / NO health YES / NO sex life YES / NO genetic information YES / NO
3. How do you explain the research to subjects and obtain their informed consent to participate? (If in writing, append a copy of consent form.) If subjects are minors, mentally infirm, or otherwise not legally competent to consent to participation, how is their assent obtained and from whom is proxy consent obtained? How is it made clear to subjects that they can quit the study at any time? The study, including the aims and methodology, will initially be explained verbally to both the prospective participants and their parents. An information sheet and a Consent Form for Minors in the language of choice (Maltese or English) will be presented and parents/adolescents left on their own to discuss the matter in private. Consent will be obtained from both the minor participants and their parents/legal guardians. Even if parents do consent for participation, if the adolescent does not agree s/he will not be included. Both the information sheets and the Consent Form clearly state that the participant can quit the study at any time without giving any reasons. This would be emphasized verbally during recruitment. The consent form will be collected after a few days when the parents and prospective participants would have had enough time to consider any issues and come to a decision in private. 4 .Do subjects risk any harm—physical, psychological, legal, social—by participating in the research? Are the risks necessary? What safeguards do you take to minimize the risks? Subjects do not risk any harm at all. All they are required to do is sit on a couch while their feet are moved in an upward motion, a method which is done daily with every podiatric patient in the clinic. The Vicon system is totally non-invasive and it is used extensively in Biomechanical Research worldwide. It is also used in 3D graphic animation for cinema, thus its use clearly cannot harm the subjects. A risk assessment of the laboratory will be made prior to data collection to ensure that there are no potential hazards, such as loose wires on the floor, on which subjects can trip.
15
5. Are subjects deliberately deceived in any way? If so, what is the nature of the deception? Is it likely to be significant to subjects? Is there any other way to conduct the research that would not involve deception, and, if so, why have you not chosen that alternative? What explanation for the deception do you give to subjects following their participation? Subjects will not be deceived in any way.
6. How will participation in this research benefit subjects? If subjects will be “debriefed” or receive information about the research project following its conclusion, how do you ensure the educational value of the process? (Include copies of any debriefing or educational materials) Participants will not benefit directly from this research, which has been made clear in the information sheet. However, they will benefit indirectly because nowadays, even though ankle dorsiflexion measurement is used to diagnose certain ankle conditions, there is still a lot of uncertainty and procedures are likely to produce wrong results, thus providing the wrong diagnosis which would, naturally, affect treatment. The educational aspect of this whole research would then be aimed at the practitioner through scientific papers and conferences, from which ultimately it would be the patient who benefits

16
TERMS AND CONDITIONS FOR APPROVAL IN TERMS OF THE DATA PROTECTION ACT
Personal data shall only be collected and processed for the specific research purpose. The data shall be adequate, relevant and not excessive in relation to the processing purpose. All reasonable measures shall be taken to ensure the correctness of personal data. Personal data shall not be disclosed to third parties and may only be required by the University or the
supervisor for verification purposes. All necessary measures shall be implemented to ensure confidentiality and, where possible, data shall be anonymised.
Unless otherwise authorised by the University Research Ethics Committee, the researcher shall obtain the consent from the data subject (respondent) and provide him with the following information: The researcher’s identity and habitual residence, the purpose of processing and the recipients to whom personal data may be disclosed. The data subject shall also be informed about his rights to access, rectify, and where applicable erase the data concerning him. I, the undersigned hereby undertake to abide by the terms and conditions for approval as attached to this application. I, the undersigned, also give my consent to the University of Malta’s Research Ethics Committee to process my personal data for the purpose of evaluating my request and other matters related to this application. I also understand that, I can request in writing a copy of my personal information. I shall also request rectification, blocking or erasure of such personal data that has not been processed in accordance with the Act. Signature:
APPLICANT'S SIGNATURE: I hereby declare that I will not start my research on human subjects before UREC approval DATE 21/01/2011
FACULTY SUPERVISOR’S SIGNATURE I have reviewed this completed application and I am satisfied with the adequacy of the proposed research design and the measures proposed for the protection of human subjects.
DATE 12/01/2011
MAKE SURE YOU ATTACH THE FOLLOWING TO YOUR APPLICATION: . * Recruitment letter, poster * Other institutional approval * Subject instructions * Tests or questionnaires * Information sheets or debriefing materials * Written consent form (or script) *Other Return the completed application to your faculty Research Ethics Committee

17

18
Information Sheet Study Title: Sagittal Plane kinematic analysis of Passive Ankle Joint Complex Dorsiflexion in Healthy Adolescents Dear Parent/Guardian, Please read this information carefully. If there is anything that is not clear from the information provided please do not hesitate to ask. After you have read the information you can decide if you wish to give permission to your son/daughter to take part in this study. Why are we doing this study? As part of the clinical examination of the foot, it is necessary to measure the movement of the foot at the ankle joint. We know that present methods are very unreliable and may produce misleading results. Consequently, we are designing a new kind of Ankle Goniometer (a device for measuring ankle joint movement). Before doing this, however, we need to investigate what happens to the various foot segments as this clinical investigation is carried out. We would like to investigate how adolescents’ feet function during clinical examination by measuring the amount of movement of the ankles and other foot segments. What is involved in the study? Your child’s foot will be examined for the amount of upward movement using a Vicon 6-camera system. These cameras use infra-red light to accurately measure distances from the camera to reflective markers attached to the foot and leg using double-sided tape. The participant will be seated on a couch and the movement produced as the foot is moved upwards will be captured by the camera system. This experiment has already been carried out with adults and thus it is not the first time that this procedure will be carried out. The examination will be performed by a qualified, experienced podiatrist and should last for only than a few minutes. Naturally, you are invited to attend for the session in which your child’s foot will be assessed. What are the risks? The testing procedures are non invasive and totally safe. There are no known risks involved.

19
What will happen to the results? Each participant will be assigned a code number which will be the only method of identification. Personal details such as name and age will be kept confidential and will not be shared with anyone at any time. The data will be looked at as a group of people. At no time will participants’ name or personal details be recorded or kept on file. If the results of these studies are published, your child’s name will never be disclosed and the information given will be on a collective basis. After the study, all data of a personal nature will be destroyed. You will not have the results of the study and will not benefit from taking part. The data will be used only for research purposes. However, it is hoped that a lot of patients will benefit directly from this research. Do I have to take part? It is up to you to decide if you would like to allow your son/daughter to take part or not. If you do, you will be given this information sheet and will be asked to sign a consent form. You can withdraw from this study at any time you wish. Should you decide not to participate, or to stop your participation at any time, any treatment that you will be undergoing at the Podiatry department will certainly not be affected. Where can I get further information from? If you have any questions about this study you can contact the principal investigator or the supervisor on the addresses below: Researcher Supervisor
_____________________________ Alfred Gatt
Name: Alfred Gatt Address: Faculty of Health Sciences University of Malta Telephone: 23401153/99497886 Email: [email protected]
Name: Prof Nachi Chockalingam Address: Faculty of Health Staffordshire University Leek Road Stoke on Trent ST4 2DF Telephone: +441782 295853 Email: [email protected]

20
CONSENT FORM Title of Project: Sagittal Plane kinematic analysis of Passive Ankle Joint Complex Dorsiflexion in Healthy Adolescents The aims and details of the project have been explained to me by the researcher. I have also explained to my child what this study entails. I know that the information collected will remain confidential and that it will be used only for scientific purposes. I also know that a written report of the study will be drawn up and that myself/my child will not be identified in any way in this report. I know that data will be password protected and will be destroyed once the study is completed. There will be no video/audio recordings. I may attend the session together with my child. I therefore give my consent to the person responsible for the research to make the necessary observations to my child. I am aware that I am under no obligation to do so, and that I can withdraw my consent at any moment without giving any reason. I case of any difficulty during the study, I can contact the researcher or supervisor. ________________________ ________________ ____________________ Name of Participant Name and Signature of Parent/Guardian Tel: no: __________________ Email:________________ _________________________ ________________ ____________________ Alfred Gatt Date Signature Researcher: 99497886/[email protected]
Supervisor Date [email protected]

21
Trial:
Investigating Reliability of Ankle Goniometer

22

23
UNIVERSITY OF MALTA Request for Approval of Human Subjects Research Please type. Handwritten forms will not be accepted You may follow this format on separate sheets or use additional pages if necessary. FROM: (name, address for correspondence) Alfred Gatt 69, Ir-Ragg, Triq il-Port Ruman Marsaxlokk MXK 1535
PROJECT TITLE:
Determining the reliability of a specifically-designed Ankle Goniometer for the measurement of ankle joint complex dorsiflexion TELEPHONE: +356 21652985
+356 99497886 E-MAIL [email protected]
COURSE AND YEAR: Ph.D 1st year
DURATION OF ENTIRE PROJECT: from January 2010 to March 2009
FACULTY SUPERVISOR'S NAME: Professor Nachiappan Chockalingam Faculty of Health Staffordshire University, Stoke on Trent England
ANTICIPATED FUNDING SOURCE: (include grant or contract number if known) Self

24
1. Please give a brief summary of the purpose of the research, in non-technical language. Goniometric measurement of ankle joint dorsiflexion is performed using a goniometer (an angle measuring device - a protractor with 2 moving arms). One arm of this goniometer is placed along the lateral side of the lower leg and the other, horizontal, arm is placed along the lateral border of the foot. The foot is then put into subtalar joint neutral position, thus enabling movement to occur only through the ankle joint, and an upward force is applied on the forefoot. This procedure creates a need for coordinating many actions at the same time, such as ensuring that the arms of the goniometer are placed exactly, that they do not move, that the midtarsal joint remains locked while the angle is read. To further complicate matters, this procedure is performed with the knees straight, then flexed. It is clear that there are various things that can go wrong (Rome, 1996), so much so that research in this area has criticized this measurement technique, claiming that it is unreliable and clinically unacceptable (Van Gheluwe, Kirby, Roosen and Phillips, 2002). Various other authors have cast significant doubts as to whether the current method of measuring ankle joint dorsiflexion is reliable and valid. In fact, there appears to be consensus that this is not. This investigator has analyzed the podiatric method of assessing foot dorsiflexion at the ankle joint and the theory behind it appears to be sound. However, the practical aspects of measurement are causing this reliability and validity problems. Main issues involve the actual placement of the goniometer, holding the subtalar joint at neutral position and performing the test with knees extended and then flexed at the same time (Rome, 1996). With this in mind, an Ankle Goniometer was designed to overcome the various issues. The main aim of this project is to determine whether this specifically-designed Ankle Goniometer, which differs from any other such instrument in use nowadays, is a valid and reliable instrument that can be used for clinical and research use. 2. Give details of procedures that relate to subjects' participation (a) How are subjects recruited? What inducement is offered? (Append copy of letter or advertisement or poster, if any.) Subjects will be recruited randomly from patients attending podiatry clinics in Malta, healthy volunteers and a convenience sample from podiatry staff so as to ensure a good mix of patients and healthy participants. No inducement will be offered, except for an explanation as to the value of this research as related to musculoskeletal problems.

25
(b) Salient characteristics of subjects—number who will participate, age range, sex, institutional affiliation, other special criteria: Patients attending Podiatry Clinics and healthy volunteers will be invited to participate. They will be picked at random so as to avoid selection bias and spectrum bias. Participants’ agreement to take part in the study will be the only inclusion/exclusion criteria necessary, as the pure angle of ankle dorsiflexion (that is, foot dorsiflexion) is to be measured, irrespective whether there is disease, limited mobility or not. Thus a good mix of subjects will be ensured. (c) Describe how permission has been obtained from cooperating institution(s)—school, hospital, organization, prison, or other relevant organization. (Append letters.) Is the approval of another Research Ethics Committee required? As data collection will be taking place at the Podiatry Department at B’Kara Civic Centre, permission from the Data Protection Officer within the Primary Health Care Department will be sought. This research is being done with Staffordshire University, however as data collection will be performed in Malta, no other Research Ethics Committee approval should be required. (d) What do subjects do, or what is done to them, or what information is gathered? (Append copies of instructions or tests or questionnaires.) How many times will observations, tests, etc., be conducted? How long will their participation take? A study to determine the Reliability of the Ankle Goniometer: a repeated measures design A repeated-measures (test-retest) design on two separate days will be utilized for this study, using a sample of 35 participants, some of whom will be healthy participants and some of whom will be patients attending a podiatry clinic. Each participant will be asked to relax in a supine position and the ankle joint dorsiflexion measurement will be taken on the lateral aspect of the leg and foot, using the Ankle Goniometer. At the same time, a video recording of the movement will be done in order to capture the movement using a 3D motion capture system. The cameras will be aimed only at the lower limbs and at no time can the subject be identified. Two experienced podiatric clinicians will be using the Ankle Goniometer to measure participants’ ankle dorsiflexion. Each subject will be assigned a code number, then will be examined by each clinician with the same procedure outlined above. Each reading will be taken 3 times, and an average recorded against the participant code number. The procedure will be performed with the knees extended, then flexed. After Examiner 1 has finished with the procedure, then Examiner 2 repeats the procedure. This whole procedure will be performed again, by each examiner, both after one hour and then on another day. This procedure will be repeated again by two more podiatrists. Examiners will be blinded to the other’s results and the recorder files the results. Each Examiner will not have access to his/hers, and the other examiners’, results Subject participation for this study should not last for more than 30 minutes during each session.

26
(e) Which of the following data categories are collected? Data that reveals – race or ethnic origin YES / NO political opinions YES / NO religious or philosophical beliefs YES / NO trade union memberships YES / NO health YES / NO sex life YES / NO genetic information YES / NO
3. How do you explain the research to subjects and obtain their informed consent to participate? (If in writing, append a copy of consent form.) If subjects are minors, mentally infirm, or otherwise not legally competent to consent to participation, how is their assent obtained and from whom is proxy consent obtained? How is it made clear to subjects that they can quit the study at any time? All subjects will be adults over 18 years of age. The research will be explained verbally to each participant and an information sheet, in Maltese and in English, will be given. Participants will be given a code number so that they cannot be identified. Any records will be kept in the investigator’s computer, which is password protected. At the end of the study, all data pertaining to participants will be erased from this computer, including any images. Informed consent will be obtained, with the participant signing a consent form in his/her preferred language. Participants will be informed, both verbally and in writing, that they can withdraw at any time and their rights to be treated at any podiatry clinic will not be affected in any way. 4 .Do subjects risk any harm—physical, psychological, legal, social—by participating in the research? Are the risks necessary? What safeguards do you take to minimize the risks? No risk whatsoever to participants, as the procedure involves merely the measurement of ankle dorsiflexion. No participant will be at risk at any time. No interventions will take place.
5. Are subjects deliberately deceived in any way? If so, what is the nature of the deception? Is it likely to be significant to subjects? Is there any other way to conduct the research that would not involve deception, and, if so, why have you not chosen that alternative? What explanation for the deception do you give to subjects following their participation? Participants will not be deceived in any way.

27
6. How will participation in this research benefit subjects? If subjects will be “debriefed” or receive information about the research project following its conclusion, how do you ensure the educational value of the process? (Include copies of any debriefing or educational materials) There will be no direct benefit to participants. However, they will benefit indirectly from this research because nowadays, even though ankle dorsiflexion measurement is used to diagnose ankle equinus, which is a potentially harmful condition, there is still a lot of uncertainty and procedures are likely to result in wrong angles. This will have the undesirable effect that patients without limited ankle dorsiflexion may be diagnosed as having equinus, while those with equinus may be diagnosed as having normal ankle motion. This would, naturally, affect treatment; i.e. patients not requiring treatment may be getting it, while those requiring it, may not be receiving treatment they need. The educational aspect of this whole research would then be aimed at the practitioner through scientific papers and conferences, from which ultimately it would be the patient who benefits.
TERMS AND CONDITIONS FOR APPROVAL IN TERMS OF THE DATA PROTECTION ACT
Personal data shall only be collected and processed for the specific research purpose. The data shall be adequate, relevant and not excessive in relation to the processing purpose. All reasonable measures shall be taken to ensure the correctness of personal data. Personal data shall not be disclosed to third parties and may only be required by the University
or the supervisor for verification purposes. All necessary measures shall be implemented to ensure confidentiality and, where possible, data shall be anonymised.
Unless otherwise authorised by the University Research Ethics Committee, the researcher shall obtain the consent from the data subject (respondent) and provide him with the following information: The researcher’s identity and habitual residence, the purpose of processing and the recipients to whom personal data may be disclosed. The data subject shall also be informed about his rights to access, rectify, and where applicable erase the data concerning him.
I, the undersigned hereby undertake to abide by the terms and conditions for approval as attached to this application. I, the undersigned, also give my consent to the University of Malta’s Research Ethics Committee to process my personal data for the purpose of evaluating my request and other matters related to this application. I also understand that, I can request in writing a copy of my personal information. I shall also request rectification, blocking or erasure of such personal data that has not been processed in accordance with the Act. Signature: APPLICANT'S SIGNATURE: I hereby declare that I will not start my research on human subjects before UREC approval DATE 29/9/09
FACULTY SUPERVISOR’S SIGNATURE I have reviewed this completed application and I am satisfied with the adequacy of the proposed research design and the measures proposed for the protection of human subjects.
DATE 19 April 2009

28
MAKE SURE YOU ATTACH THE FOLLOWING TO YOUR APPLICATION: . * Recruitment letter, poster * Other institutional approval * Subject instructions * Tests or questionnaires * Information sheets or debriefing materials * Written consent form (or script) *Other Return the completed application to your faculty Research Ethics Committee

29
Information Sheet Study Title: Determining the reliability of a specifically-designed ankle
goniometer for the measurement of ankle joint complex dorsiflexion.
Please read this information carefully. If there is anything that is not clear from the information provided please do not hesitate to ask. After you have read the information you can decide if you wish to take part in this study. Why are we doing this study? As a part of an ongoing research program we have developed a new type of joint angle measuring device. We are in the process of refining and validating this method. Once this method is validated, this can be employed both in clinical assessment and further research. We propose to conduct some non-invasive movement analysis as a part of this validation process. The use of kinematic and kinetic analysis (movement and forces) will assist in gaining some baseline data What is involved in the study? A few basic questions such as age and date of birth will be asked and we will measure your height, weight and limb length to help our analysis. We will also measure some joint angles. We will then place small spherical reflective balls (markers) on predetermined landmarks on your body. These markers will be secured with double sided adhesive tape. You are required to wear tight clothing such as cycling shorts in case of men and cycling shorts and sports bra in case of women to avoid interference with these markers. Movement of these markers will be tracked by high speed cameras mounted on the lab walls or on the tripods. Your foot will be assessed by podiatrists who will measure your ankle flexion using a specifically designed Ankle Goniometer in order to assess whether they will able to obtain the same results, thus confirming that this device is reliable. What are the risks? The testing procedures are non invasive and totally safe. There are no known risks involved. What will happen to the results? Your personal details such as name and age will be kept confidential and will not be shared with anyone at anytime. The data will be looked at as a group of people and patterns will be identified.

30
You will not have the results of the study and will not benefit from taking part. The data will be used only for research purposes. Do I have to take part? It is up to you to decide if you would like to take part or not. If you do, you will be given this information sheet and be asked to sign a consent form. You can still stop taking part at any time without giving a reason. Where can I get further information from? If you have any questions about this study you can contact the principal investigator on the address below: Name: Professor Nachi Chockalingam Address: Faculty of Health
Staffordshire University Leek Road Stoke on Trent ST4 2DF
Telephone: 01782 295853 Email: [email protected]
31
Consent form Subject identification number: Study Title: Determining the reliability of a specifically-designed
ankle goniometer for the measurement of ankle joint complex dorsiflexion
Name of Researcher: Nachiappan Chockalingam, Alfred Gatt, Roozbeh Naemi,
Helen Branthwaite, Thierry ChevalierPlease initial box I confirm that I have read and understand the information sheet for the above study and have had the opportunity to ask questions. I understand that my participation is voluntary and that I am free to withdraw at any time without giving any reason. I agree to take part in the above study Name of Subject Signature Date Name of Person taking consent Signature Date (if different from researcher) Researcher Signature Date

Appendix 2
Results and Statistical Analysis Tables

2
Chapter 6: A repeated measures study to explore the effect of foot posture on Sagittal Plane Kinematics Of passive dorsiflexion of the foot In Healthy Adults
6.3.1 Maximum Foot Dorsiflexion Angle
Table 1: Mean Maximum Foot Dorsiflexion Angle Scores in the Pronated, Neutral and Supinated Postures
Subject Mean Maximum Foot Dorsiflexion Angle Scores
(Degrees) Pronated Neutral Supinated
1 33.58 32.18 28.9 2 37.88 24.9 24.74 3 19.04 14.96 13.84 4 19.22 15.48 13.1 5 19.6 14.34 17.44 6 25.66 20.6 12.36 7 16.36 12.9 12.8 8 12.66 5.56 6.88 9 16.44 14.64 8.7 10 30.94 20.56 19.84 11 13.46 9.6 7.7812 14.1 9.5 9.18 13 0.92 -4.26 -10.82 14 7.64 4.62 2.84 15 31.5 13.66 11.02 16 20.6 17.84 8.68

3
Table 2: Forefoot to Hindfoot Angle range of movement in the pronated, neutral and supinated postures.
Subject Mean Forefoot to Hindfoot Range of Movement (Degrees)
PronatedRange
NeutralRange
Supinated Range
1 6.1 11.4 12.2 2 15.4 11.8 14.8 3 15.5 13.4 15.2 4 10.4 13.4 11.3 5 10.2 10.1 11.8 6 17.8 16.5 14.3 7 9 10.5 13.1 8 9 9.6 10.8 9 6.1 11.5 12.5 10 6.1 6 12.5 11 6.4 11.2 12 12 6.5 7.8 8.8 13 5 11.9 9.2 14 10.6 9.6 11 15 11.1 13.8 16.2 16 6 8.6 10.4
Table 3: Descriptive Statistics: Mean differences: pronated angle – neutral angle = 5.78o; pronated–supinated = 8.27; neutral–supinated=2.49o
Descriptive Statistics of the 16 participants
Mean Std. Deviation Pronated 19.97 9.88 Neutral 14.19 8.51 Supinated 11.70 9.03

4
Table 4: One way repeated Anova Results for Maximum Foot Dorsiflexion Angle Table shows that both statistical results for this angle return a significant p-value < 0.005
Post Hoc Tests
Table 5: Pairwise comparisons between the Pronated, Neutral and Supinated postures
Pairwise Comparisons
(I) Position (J) Position
Mean Difference (I-J) Std. Error Sig.a
95% Confidence Interval for Differencea Lower Bound Upper Bound
Pronated Neutral 5.783* 1.100 .000 2.818 8.747 Supinated 8.270* 1.215 .000 4.997 11.543
Neutral Supinated 2.487* .852 .032 .192 4.783
Based on estimated marginal means *. The mean difference is significant at the .05 level. a. Adjustment for multiple comparisons: Bonferroni.
Table showing significance when foot postures are compared between them. One should also
note the mean difference, which amounts to 8.3o between pronated and supinated, 5.8o between pronated and neutral and 2.49o between neutral and supinated.
Tests of Within-Subjects Effects Measure:MEASURE_1
Source Type III Sum
of Squares df Mean Square F Sig. Partial Eta Squared
Position Sphericity Assumed
576.095 2 288.048 31.644 .000 .678
Greenhouse-Geisser
576.095 1.740 331.008 31.644 .000 .678

5
Table 6: Descriptive Statistics (Angle Range of Motion) of the Hindfoot and Forefoot in the Pronated, Neutral and Supinated postures
6.3.2 Hindfoot and Forefoot Movement
Table 7: Multiple Comparisons of angle range of motion at the pronated, neutral and supinated postures.
(I) Foot Posture
(J) Foot Posture
Mean Difference (I-J) Std. Error P-value
95% Confidence Interval
Lower Bound
Upper Bound
Pronated Neutral 5.362* 2.0439 .027 .492 10.233
Supinated 5.850* 2.0439 .014 .979 10.721
Neutral Supinated .488 2.0439 .969 -4.383 5.358
Table showing multiple comparisons of the angle range of motion at the various foot postures. There is a significant difference between the pronated and both neutral and supinated postures
and a non-significant difference between the neutral and supinated postures.
Foot Posture Foot Mean Std. Deviation
Sample Size
Pronated Forefoot 38.244 12.4417 16 Hind foot 26.419 6.8388 16
Neutral Forefoot 32.675 7.4769 16 Hind foot 21.263 6.7179 16
Supinated Forefoot 32.875 8.6617 16 Hind foot 20.088 4.8387 16

6
6.3.3 Forefoot to Hindfoot Angle
Table 8: Hindfoot to forefoot angles in the pronated, neutral and supinated postures.
Pairwise Comparisons
(I) Posture (J) Posture
Mean Difference (I-J) Std. Error Sig.a
95% Confidence Interval for Differencea Lower Bound Upper Bound
(Pronated) Neutral -1.619 .746 .139 -3.627 .390 Supinated -2.806* .733 .005 -4.782 -.831
(Neutral) Supinated -1.188 .555 .147 -2.681 .306
Based on estimated marginal means a. Adjustment for multiple comparisons: Bonferroni. *. The mean difference is significant at the .05 level.
Table showing significance between pronated to supinated postures, but non-significance in the
other foot postures

7
Chapter 7: A repeated measures study to explore the effect of foot posture on Sagittal
Plane KinematicsOf passive dorsiflexion of the foot In Adolescents
7.3.1 Maximum Foot Dorsiflexion Angle
Table 9: Descriptive Statistics for Maximum Foot Dorsiflexion Angles at the 3 postures for the 8 participants
Descriptive Statistics
Mean Maximum Foot Dorsiflexion Angles (o)
Std. Deviation
Pronated 36.3125 7.22781 Neutral 36.9500 4.00571 Supinated 32.9875 4.88246
Table 10: Repeated Measures Anova. “Sphericity Assumed” is the statistic to take into account, although it is clear that all tests are non-significant.
Tests of Within-Subjects Effects
Source
Type II Sum of Squares
df
Mean
Square
Sig.
Partial Eta Squared
Posture Sphericity Assumed 72.43 2 36.218 3.237 0.70 .316 Greenhouse-Geisser 72.43 1.583 45.764 3.237 0.86 .315
Table 11: Pairwise comparisons of the Maximum Foot Dorsiflexion Angles between the 3 postures
Pairwise Comparisons Measure:MEASURE_1
(I) Posture (J) Posture
Mean Difference (I-J) Std. Error Sig.a
95% Confidence Interval for Differencea Lower Bound Upper Bound
Pronated Neutral -.638 1.970 1.000 -6.800 5.525 Supinated 3.325 1.752 .299 -2.154 8.804
Neutral Supinated 3.962* 1.200 .039 .209 7.716
Based on estimated marginal means a. Adjustment for multiple comparisons: Bonferroni. *. The mean difference is significant at the .05 level.

8
7.3.2 Forefoot to Hindfoot Angle (FFHFA)
Table 12: Forefoot to Hindfoot Range of Motion Angles in the pronated, neutral and supinated postures
FFHFA ROM (degrees) ROM (degrees) ROM (degrees)
Pronated Neutral Supinated 1 10.7 8 7.8 2 9.7 13.2 14.3 3 7.9 12.85 3.55 4 5.7 9.6 8.5 5 8.2 4.2 9.1 6 7.9 11.2 7.7 7 9.66 11.3 13.6 8 6.2 11.3 6.8

9
Chapter 8: The effect of uncontrolled moment and shortterm, repeated passive
stretching on Maximum Ankle Joint dorsiflexion angle
Table 13: Maximum Ankle Angle results for the Neutral and Supinated Postures This table shows the successive results of 5 successive angles per participant from which it was
possible to determine whether stretching had occurred
MaxAnkle Angles
(degrees) MaxAnkle Angles
(degrees)
Subject Neutral Supinated Subject Neutral Supinated No1 8.96 7.82 No8 25.33 22.7 11.22 8.41 26.62 22.17 10.24 7.95 24.2 25.89 9.46 6.47 26.05 24.1 8.8 4.88 22.43 29 No2 0.73 2.86 N9 10.9 12.75 3.56 3.23 10.6 10.13 1.96 1.26 13.55 17.11 2.02 1.77 18.2 11.54 0.2 1.57 21.5 14.1 No3 11.9 11.82 No10 16.72 6.1 13.6 14.06 18.43 10.24 13.12 13.23 18.73 9.71 13.42 12.44 17.78 7.86 12.29 12.18 17.6 9.54 No4 16.91 17.56 No11 19.31 19.15 14.68 19.06 21.41 20.28 14.52 16.41 18.85 21.33 12.5 17.28 20.56 16.88 13.91 17.03 22.79 21.5 No5 12.56 10.09 No12 15.15 13.71 15.48 10.62 21.75 11.73 13.64 10.28 25.67 11.41 14.64 11.87 19.98 14.5 11.67 11.28 16.89 13.34 No6 14.87 10.37 No13 -3.29 -11.94 15.77 8.17 -4.76 -12.78 14.29 8.67 -6.04 -10.74 16.08 8.33 -4.59 -10.79 14.16 7.91 -2.51 -7.73

10
No7 6 6.89 No14 16.8 14.91 5.88 9.48 13.58 13.41 5.81 4.37 13.61 12.19 5.47 7.39 14.49 14.33 4.53 6.21 16.42 16.04
Table 14: Mauchly’s Test of Sphericity for Neutral Posture
Mauchly's Test of Sphericityb Measure:MEASURE_1
Within Subjects Effect Mauchly's W
Approx. Chi-Square df Sig.
Epsilon Greenhouse-
Geisser Huynh-Feldt
Lower-bound
MaxAngle .097 26.601 9 .002 .565 .690 .250
Table 15: Repeated Measures ANOVA, neutral position. Greenhouse-Geisser test was taken into consideration since Mauchly’s Test (above) was significant
Tests of Within-Subjects Effects Measure:MEASURE_1
Source
Type III Sum of Squares df Mean Square F Sig.
Partial Eta Squared
MaxAngle Error(MaxAngle)
Greenhouse-Geisser
9.704 2.261 4.291 .555 .601 .041
Greenhouse-Geisser
227.105 29.396 7.726
Table 16: Mauchly’s Test of Sphericity for the Supinated posture
Mauchly's Test of Sphericityb
Measure:MEASURE_1
Within Subjects Effect
Mauchly's W
Approx. Chi-Square df Sig.
Epsilon
Greenhouse-Geisser
Huynh-Feldt
Lower-bound
SupMaxAnkleAngle
.290 14.128 9 .121 .654 .834 .250

11
Table 17: Repeated Measures ANOVA, supinated position. Sphericity Assumed was taken in consideration since Mauchly’s test (above) was non-significant
Tests of Within-Subjects Effects
Measure:MEASURE_1
Source Type III Sum of Squares df
Mean Square F Sig.
Partial Eta Squared
SupMaxAnkleAngle Error(SupMaxAnkleAngle)
Sphericity Assumed 7.456 4 1.864 .664 .620 .049
Sphericity Assumed 145.940 52 2.807
Table 18: Regression analysis of all subjects at Neutral and Supinated postures. P-value shows whether average increase is significant. Only subject no9 had a significant increase
in Maximum Ankle Angle at the Neutral position (an increase of 2.88o, significant p-value=0.011)
Max Angle Neutral Maximum Foot Dorsiflexion
Angle (o)/(p-value)
Max Angle Supinated Maximum Foot Dorsiflexion
Angle (o)/(p-value) 1 -0.208 (0.589) -0.782 (0.062) 2 -0.260 (0.606) -0.404 (0.149) 3 0.060 (0.837) -0.090 (0.799) 4 -0.818 (0.096) -0.284 (0.441) 5 -0.262 (0.661) 0.363 (0.121) 6 -0.111 (0.743) 0.257 (0.392) 7 -0.335 (0.045) -0.345 (0.631) 8 -0.637 (0.279) -0.208 (0.891) 9 2.88 (0.011) -0.175 (0.309) 10 0.111 (0.717) 0.373 (0.529) 11 0.611 (0.279) 2.482 (0.345) 12 0.171 (0.917) 0.203 (0.694) 13 0.173 (0.748) 1.041 (0.061) 14 0.015 (0.980) 0.318 (0.571)

12
Chapter 10: Reliability of a New Ankle Goniometer
Table 19: Sample output of Goniometer/Vicon at approximately 5o increments.
Goniometer Output Angle (degrees)
Vicon Output Angle (degrees)
0.00 0.10 5.20 5.49
10.10 10.75 15.00 16.19 19.70 20.48
Table 20: Descriptive statistics
Descriptive Statistics
Mean Std. Deviation N
Goniometer 13.2603 5.75923 1000
Vicon 13.9518 6.07161 1000
10.3.1 Trial 1: Interrater and intrarater testretest reliability using a known
moment; a doubleblind design
Table 21: Rater 1 (Test-Retest) and Rater 2 Maximum Ankle Dorsiflexion Angles
Rater1 Test (degrees)
Rater1(2) Re-Test (degrees)
Rater2 (degrees)
11.28 13.66 10.06 23.18 22.74 20.34 18.82 20.62 22.22 17.04 17.6 19.16 11.02 13.46 14.86 20.6 20.3 22.04
17.06 17.04 19.68 19.86 21.06 23.62 27.8 29.56 29.84 17.3 16.36 18.3
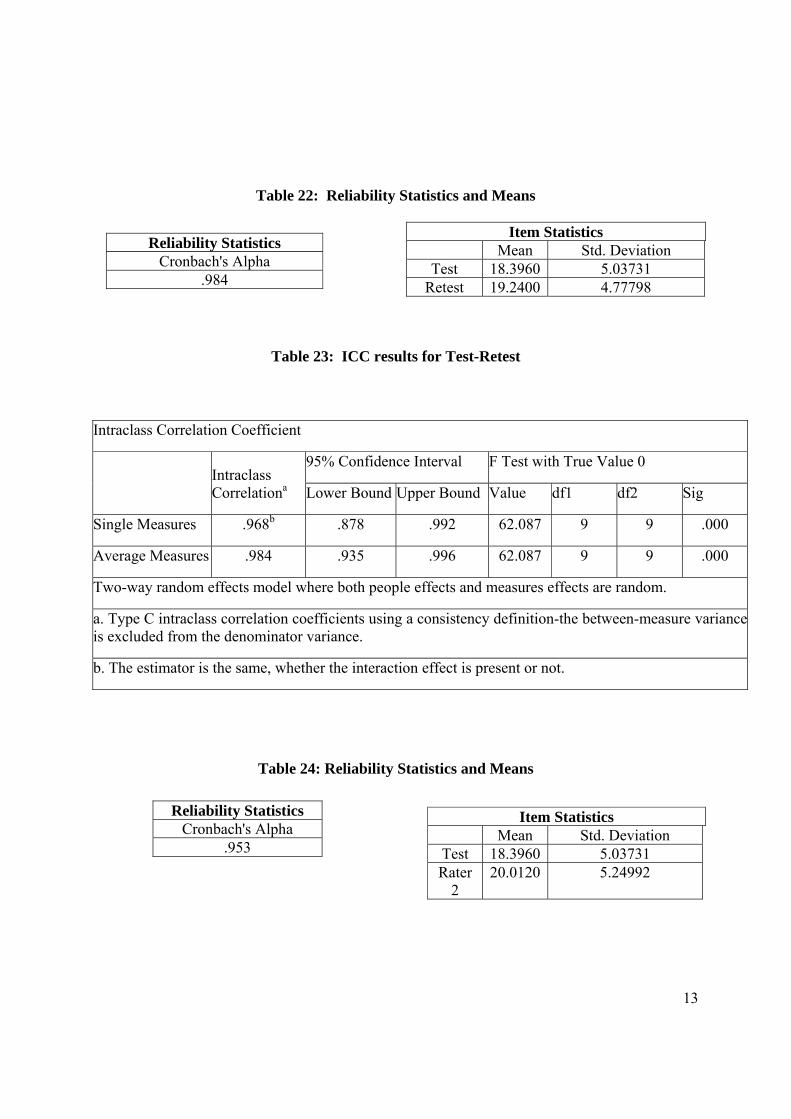
13
Table 22: Reliability Statistics and Means
Table 23: ICC results for Test-Retest
Table 24: Reliability Statistics and Means
Item Statistics Mean Std. Deviation
Test 18.3960 5.03731 Retest 19.2400 4.77798
Reliability Statistics Cronbach's Alpha
.984
Intraclass Correlation Coefficient
Intraclass Correlationa
95% Confidence Interval F Test with True Value 0
Lower Bound Upper Bound Value df1 df2 Sig
Single Measures .968b .878 .992 62.087 9 9 .000
Average Measures .984 .935 .996 62.087 9 9 .000
Two-way random effects model where both people effects and measures effects are random.
a. Type C intraclass correlation coefficients using a consistency definition-the between-measure variance is excluded from the denominator variance.
b. The estimator is the same, whether the interaction effect is present or not.
Reliability Statistics Cronbach's Alpha
.953
Item Statistics Mean Std. Deviation
Test 18.3960 5.03731 Rater
2 20.0120 5.24992

14
Table 25: ICC of Rater1 vs Rater2; inter-rater reliability
Intraclass Correlation Coefficient
Intraclass Correlationa
95% Confidence Interval F Test with True Value 0
Lower Bound Upper Bound Value df1 df2 Sig
Single Measures .911b .684 .977 21.432 9 9 .000
Average Measures .953 .812 .988 21.432 9 9 .000
Two-way random effects model where both people effects and measures effects are random.
a. Type C intraclass correlation coefficients using a consistency definition-the between-measure variance is excluded from the denominator variance.
b. The estimator is the same, whether the interaction effect is present or not.
10.3.2 Trial 2: Intra-tester reliability with uncontrolled moment and variable knee
position; a double-blind design
Table 26: Cronbach’s Alpha for Test-Retest with Knees extended and flexed
Table 27: Means of Test-Retest with the Knees Extended and Flexed.
Reliability Statistics Cronbach's Alpha
Cronbach's Alpha Based on Standardized Items
.950 .954
Reliability Statistics Cronbach's Alpha
Cronbach's Alpha Based on Standardized Items
.947 .947
Item Statistics Mean Std. Deviation N TESTKneeFlx 24.39804.64779 10RETESTKneeFlx 23.76405.27982 10
Item Statistics Mean Std. Deviation N TESTKneeExt 17.3220 5.46285 10RETESTKneeExt 19.3360 5.47988 10
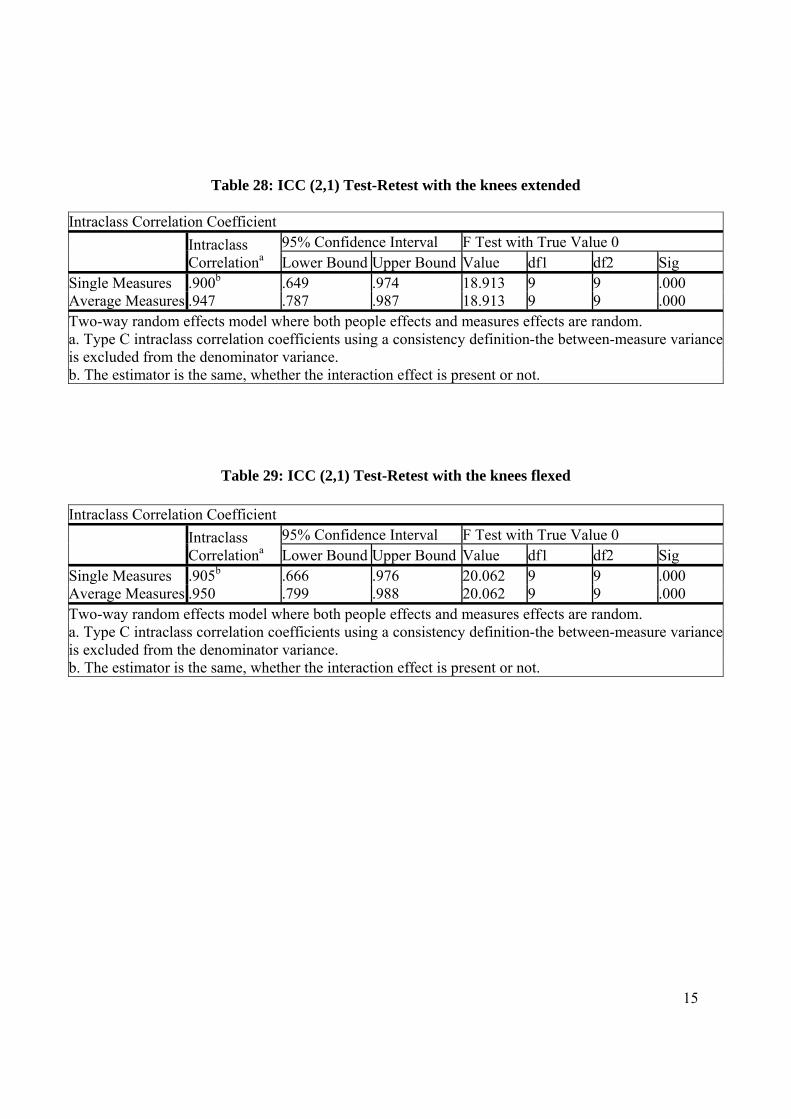
15
Table 28: ICC (2,1) Test-Retest with the knees extended
Intraclass Correlation Coefficient
Intraclass Correlationa
95% Confidence Interval F Test with True Value 0 Lower Bound Upper Bound Value df1 df2 Sig
Single Measures .900b .649 .974 18.913 9 9 .000 Average Measures .947 .787 .987 18.913 9 9 .000 Two-way random effects model where both people effects and measures effects are random. a. Type C intraclass correlation coefficients using a consistency definition-the between-measure variance is excluded from the denominator variance. b. The estimator is the same, whether the interaction effect is present or not.
Table 29: ICC (2,1) Test-Retest with the knees flexed
Intraclass Correlation Coefficient
Intraclass Correlationa
95% Confidence Interval F Test with True Value 0 Lower Bound Upper Bound Value df1 df2 Sig
Single Measures .905b .666 .976 20.062 9 9 .000 Average Measures .950 .799 .988 20.062 9 9 .000 Two-way random effects model where both people effects and measures effects are random. a. Type C intraclass correlation coefficients using a consistency definition-the between-measure variance is excluded from the denominator variance. b. The estimator is the same, whether the interaction effect is present or not.
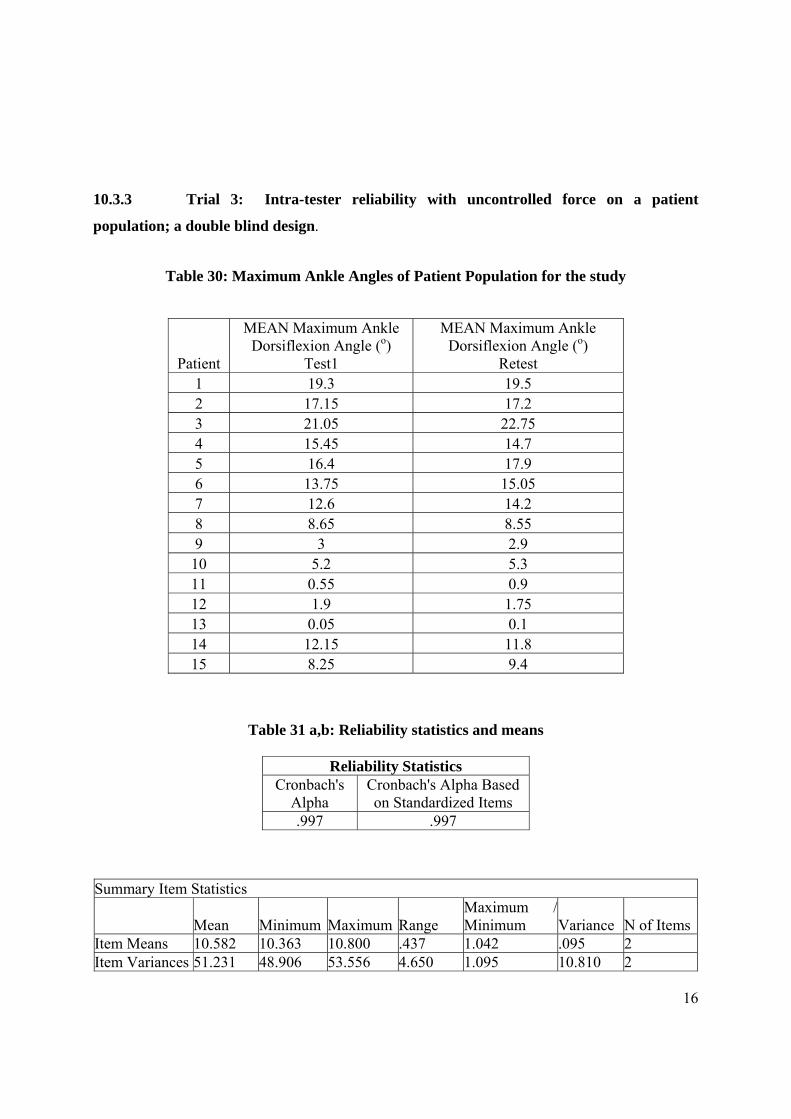
16
10.3.3 Trial 3: Intra-tester reliability with uncontrolled force on a patient
population; a double blind design.
Table 30: Maximum Ankle Angles of Patient Population for the study
Table 31 a,b: Reliability statistics and means
Reliability Statistics Cronbach's
Alpha Cronbach's Alpha Based on Standardized Items
.997 .997
Summary Item Statistics
Mean Minimum Maximum Range
Maximum / Minimum Variance N of Items
Item Means 10.582 10.363 10.800 .437 1.042 .095 2 Item Variances 51.231 48.906 53.556 4.650 1.095 10.810 2
Patient
MEAN Maximum Ankle Dorsiflexion Angle (o)
Test1
MEAN Maximum Ankle Dorsiflexion Angle (o)
Retest 1 19.3 19.5 2 17.15 17.2 3 21.05 22.75 4 15.45 14.7 5 16.4 17.9 6 13.75 15.05 7 12.6 14.2 8 8.65 8.55 9 3 2.9
10 5.2 5.3 11 0.55 0.9 12 1.9 1.75 13 0.05 0.1 14 12.15 11.8 15 8.25 9.4
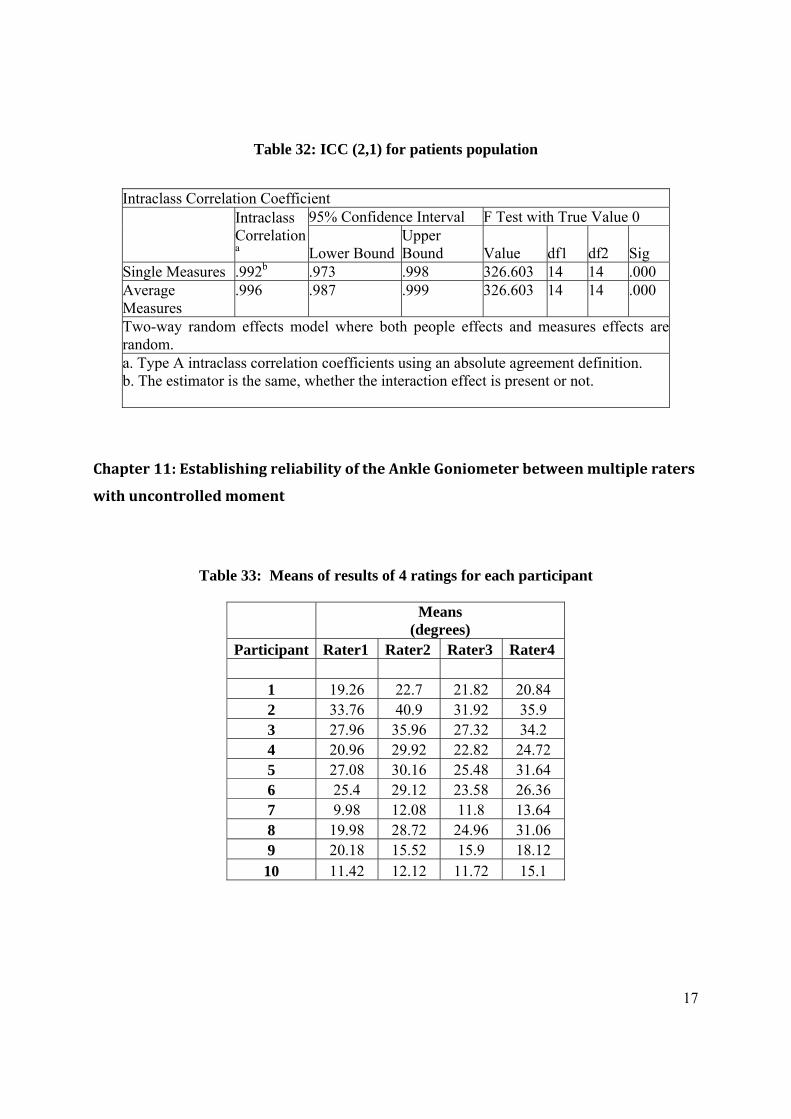
17
Table 32: ICC (2,1) for patients population
Intraclass Correlation Coefficient
Intraclass Correlationa
95% Confidence Interval F Test with True Value 0
Lower BoundUpper Bound Value df1 df2 Sig
Single Measures .992b .973 .998 326.603 14 14 .000 Average Measures
.996 .987 .999 326.603 14 14 .000
Two-way random effects model where both people effects and measures effects arerandom. a. Type A intraclass correlation coefficients using an absolute agreement definition. b. The estimator is the same, whether the interaction effect is present or not.
Chapter 11: Establishing reliability of the Ankle Goniometer between multiple raters
with uncontrolled moment
Table 33: Means of results of 4 ratings for each participant
Means
(degrees) Participant Rater1 Rater2 Rater3 Rater4
1 19.26 22.7 21.82 20.84 2 33.76 40.9 31.92 35.9 3 27.96 35.96 27.32 34.2 4 20.96 29.92 22.82 24.72 5 27.08 30.16 25.48 31.64 6 25.4 29.12 23.58 26.36 7 9.98 12.08 11.8 13.64 8 19.98 28.72 24.96 31.06 9 20.18 15.52 15.9 18.12 10 11.42 12.12 11.72 15.1

18
Table 34: Reliability Results for multiple raters
Reliability Statistics
Cronbach's Alpha
.977
Intraclass Correlation Coefficient
Intraclass
Correlationa
95% Confidence Interval F Test with True Value 0
Lower Bound Upper Bound Value df1 df2 Sig
Single Measures .915b .798 .975 44.076 9 27 .000
Average Measures .977 .940 .994 44.076 9 27 .000
Two-way random effects model where both people effects and measures effects are random.
a. Type C intraclass correlation coefficients using a consistency definition-the between-measure variance is excluded from
the denominator variance.
b. The estimator is the same, whether the interaction effect is present or not.