algebra 1 unit 1: patterns - ledyard center...
TRANSCRIPT

Approved 4/12/13 Algebra 1
Unit 1: Patterns
1
Adapted from The Leadership and Learning Center “Rigorous Curriculum Design” model.
*Adapted from the Arizona Academic Content Standards.
Pacing: 5 – 6 days (includes 2 short sessions)
Mathematical Practices
Mathematical Practices #1 and #3 describe a classroom environment that encourages thinking mathematically and are critical for quality teaching and learning. Practices in bold are to be emphasized in the unit. 1. Make sense of problems and persevere in solving them. 2. Reason abstractly and quantitatively. 3. Construct viable arguments and critique the reasoning of others. 4. Model with mathematics. 5. Use appropriate tools strategically. 6. Attend to precision. 7. Look for and make use of structure. 8. Look for and express regularity in repeated reasoning.
Standards Overview
Understand the concept of a function and use function notation Build a function that models a relationship between two quantities

Approved 4/12/13 Algebra 1
Unit 1: Patterns
2
Adapted from The Leadership and Learning Center “Rigorous Curriculum Design” model.
*Adapted from the Arizona Academic Content Standards.
Priority and Supporting CCSS Explanations and Examples*
F-IF 3. Recognize that sequences are functions, sometimes
defined recursively, whose domain is a subset of the
integers...
Recursive and explicit rules for sequences are first introduced in the context of chemistry. For example, the number of hydrogen atoms in a hydrocarbon is a function of the number of carbon atoms. This relationship may be defined by the recursive rule “add two to the previous number of hydrogen atoms” or explicitly as h = 2 + 2c. The function may also be represented in a table or a graph or with concrete models.
F-BF 1. Write a function that describes a relationship
between two quantities.*
a. Determine an explicit expression, a recursive process, or
steps for calculation from a context.
Example; You frequently go to the gym to work out lifting weights. You plan to gradually increase the size of the weights over the next month. You always put two plates that appear to be the same weight on each side of the bar. The plates are not labeled but you do know the bar weighs 20 kg. How can we express the total weight you lifted on any day?” Students will assign a variable for the weight of a plate (say w) and derive an expression for the total weight lifted, 4w +20 or its equivalent.
F-BF 2. Write arithmetic and geometric sequences ...
recursively and [arithmetic sequences] with an explicit
formula, use them to model situations, and translate
between the two forms.*
Arithmetic sequences may be introduced through geometric models. For example, the number of beams required to make a steel truss in the following pattern is an arithmetic sequence.

Approved 4/12/13 Algebra 1
Unit 1: Patterns
3
Adapted from The Leadership and Learning Center “Rigorous Curriculum Design” model.
*Adapted from the Arizona Academic Content Standards.
Priority and Supporting CCSS Explanations and Examples*
Arithmetic sequences are also found in patterns for integers which can be used to justify and reinforce rules for operations. For example in completing this pattern
5 * 4 = _______
5 * 3 = _______
5 * 2 = _______
5 * 1 = _______
5 * 0 = _______
5 * -1 = _______
5 * -2 = _______
5 * -3 = _______
Students will find an arithmetic sequence with a common difference
of -5. This pattern illustrates that the product of a positive integer
and a negative integer is negative.

Approved 4/12/13 Algebra 1
Unit 1: Patterns
4
Adapted from The Leadership and Learning Center “Rigorous Curriculum Design” model.
*Adapted from the Arizona Academic Content Standards.
Priority and Supporting CCSS Explanations and Examples*
Compound interest is a good example of a geometric sequence. For example,
“You just won first prize in a poetry writing contest. If
you take the $500 you won and invest it in a mutual
fund earning 8% interest per year, about how long will
it take for your money to double? “

Approved 4/12/13 Algebra 1
Unit 1: Patterns
5
Adapted from The Leadership and Learning Center “Rigorous Curriculum Design” model.
*Adapted from the Arizona Academic Content Standards.
Concepts What Students Need to Know
Skills What Students Need To Be Able To Do
Bloom’s Taxonomy Levels
Recursive rule Explicit rule Arithmetic sequence Geometric sequence
Find (specific term) Write (recursive rule) Write (explicit rule) Draw (next in sequence) Predict (nth term)
1 3 3 3 4
Essential Questions
What is a sequence?
How can patterns be represented?
What are the advantages and disadvantages of a recursive rule compared to an explicit rule?

Approved 4/12/13 Algebra 1
Unit 1: Patterns
6
Adapted from The Leadership and Learning Center “Rigorous Curriculum Design” model.
*Adapted from the Arizona Academic Content Standards.
Corresponding Big Ideas
Analyzing patterns and writing recursive and explicit algebraic rules provides a powerful way to extend patterns and make predictions
Standardized Assessment Correlations (State, College and Career)
CAPT through 2014; Smarter balance assessment thereafter
Vocabulary inductive reasoning, conjecture, sequence, term, arithmetic sequence, common difference, geometric sequence, common ratio, fractal, iteration, self-similarity ,

Approved 4/12/13 Algebra 1
Unit 1: Patterns
7
Adapted from The Leadership and Learning Center “Rigorous Curriculum Design” model.
*Adapted from the Arizona Academic Content Standards.
Topic Section in
Text
PH Algebra 1
©2009
CCSS
Inductive Reasoning and Conjectures
Extend a pattern using a list, table,
or graph
Describe a pattern using a recursive
rule, in writing. (Recursive - relates
a new term to the previous term.)
* PH Geometry 1.1
*PH Mathematics
Course 3 8.4
*Glencoe math
Matters 1 3.6
1.4 Activity Lab
1.4 Objective 1
F-IF 3
F-BF 1.a
Function Rules
Describe a pattern writing a
recursive rule expressed as a
function.
Use a function rule to solve a
problem.
5.4 F-BF 1
LEARNING ACTIVITIES

Approved 4/12/13 Algebra 1
Unit 1: Patterns
8
Adapted from The Leadership and Learning Center “Rigorous Curriculum Design” model.
*Adapted from the Arizona Academic Content Standards.
Arithmetic Sequences
Find a common difference
Write a recursive rule, expressed as
a function, to describe a pattern
Describe a pattern using an explicit
rule (Explicit - uses the first term and
common difference to find a future
term)
5.7
.
F.BF2
Geometric Sequences
Find a common ratio
Write a recursive rule, expressed as
a function, to describe a pattern.
Describe a pattern using an explicit
rule.
(Explicit - uses the first term and
common ratio to find a future term)
Compound interest formula
Fractals
8.6, 8.8
PH Geometry
p.430-431
F.BF1
F.BF2
Unit Assessments The items developed for this section can be used during the course of instruction when deemed appropriate by the teacher.
Mid Unit Test End of Unit Test Performance Task

Approved 4/12/13 Algebra I
Unit 2: Linear Equations and Inequalities
1
Adapted from The Leadership and Learning Center “Rigorous Curriculum Design” model.
*Adapted from the Arizona Academic Content Standards.
Pacing: 10 days (includes 4 short sessions)
Mathematical Practices
Mathematical Practices #1 and #3 describe a classroom environment that encourages thinking mathematically and are critical for quality teaching and learning. Practices in bold are to be emphasized in the unit. 1. Make sense of problems and persevere in solving them. 2. Reason abstractly and quantitatively. 3. Construct viable arguments and critique the reasoning of others. 4. Model with mathematics. 5. Use appropriate tools strategically. 6. Attend to precision. 7. Look for and make use of structure. 8. Look for and express regularity in repeated reasoning.
Standards Overview
Reason quantitatively and use units to solve problems. Interpret the structure of expressions Create equations that describe numbers or relationships Understand solving equations as a process of reasoning and explain the reasoning Solve equations and inequalities in one variable

Approved 4/12/13 Algebra I
Unit 2: Linear Equations and Inequalities
2
Adapted from The Leadership and Learning Center “Rigorous Curriculum Design” model.
*Adapted from the Arizona Academic Content Standards.
Priority and Supporting CCSS Explanations and Examples*
N-Q 1. Use units as a way to understand problems and to
guide the solution of multi-step problems; choose and
interpret units consistently in formulas; choose and interpret
the scale and the origin in graphs and data displays.
In all problem situations the answer should be reported with appropriate units. In situations involving money, answers should be rounded to the nearest cent. When data sets involve large numbers (e.g. tables in which quantities are reported in the millions) the degree of precision in any calculation is limited by the degree of precision in the data. These ideas are introduced in the solution to contextual problems in Unit 2 and reinforced throughout the remainder of the course. .
N-Q 2. Define appropriate quantities for the purpose of
descriptive modeling.
N-Q 3. Choose a level of accuracy appropriate to limitations
on measurement when reporting quantities.
A-SSE 1. Interpret expressions that represent a quantity in
terms of its context.*
a. Interpret parts of an expression, such as terms,
factors, and coefficients.
Understanding the order of operations is essential to unpacking the
meaning of a complex algebraic expression and to develop a strategy
for solving an equation.

Approved 4/12/13 Algebra I
Unit 2: Linear Equations and Inequalities
3
Adapted from The Leadership and Learning Center “Rigorous Curriculum Design” model.
*Adapted from the Arizona Academic Content Standards.
Priority and Supporting CCSS Explanations and Examples*
b. Interpret complicated expressions by viewing one or more
of their parts as a single entity...
Using the commutative, associative and distributive properties enables students to find equivalent expressions, which are helpful in solving equations.
A-CED 1. (part) Create equations and inequalities in one
variable and use them to solve problems. Include
equations arising from linear ... functions
Here are some examples where students can create equations and inequalities.
a. (Two step equation) The bank charges a monthly fee of $2.25 for your Dad’s checking account and an additional $1.25 for each transaction with his debit card, whether used at an ATM machine or by using the card to make a purchase. He noticed a transaction charge of $13.50 on this month’s statement. He is trying to remember how many times he used the debit card. Can you use the information on the statement help him figure out how many transactions he made?
b. (Equations with variables on both sides) Willie and Malia have
been hired by two different neighbors to pick-up mail and
newspapers while they are on vacation. Willie will be paid $7
plus $3 per day. Malia will be paid $10 plus $3 per day. By which
day will they have earned the same amount of money?

Approved 4/12/13 Algebra I
Unit 2: Linear Equations and Inequalities
4
Adapted from The Leadership and Learning Center “Rigorous Curriculum Design” model.
*Adapted from the Arizona Academic Content Standards.
Priority and Supporting CCSS Explanations and Examples*
c. (Equations which require using the distributive property) Jessica
wanted to buy 7 small pizzas but she only had four, $2 off,
coupons. So, she bought four with the discount and paid full
price for the other three, and the bill came to $44.50. How much
was each small pizza?
d. (Inequality) The student council has set aside $6,000 to purchase
the shirts. (They plan to sell them later at double the price.) How
many shirts can they buy at the price they found online if the
shipping costs are $14?
A-CED 4. Rearrange formulas to highlight a quantity of
interest, using the same reasoning as in solving equations.
For example, rearrange Ohm’s law V = IR to highlight
resistance R.
Begin with a familiar formula such as one for the perimeter of a rectangle: p = 2l + 2w. Consider this progression of problems:
(a) Values for the variables l and w are given. We can find p by
substituting for l and w and evaluating the expression on the
right side.
(b) Values for the variables l and p are given. We can find w by
substituting for l and p and solving the equation for w.
(c) We can find a formula for w in terms of l and p, by following
the same steps as in (b) above to solve for w. This gives us a
general method for finding w when the other variables are
known. (Check this new formula by showing that it gives the
correct value for w when the values of l and p from (b) are

Approved 4/12/13 Algebra I
Unit 2: Linear Equations and Inequalities
5
Adapted from The Leadership and Learning Center “Rigorous Curriculum Design” model.
*Adapted from the Arizona Academic Content Standards.
Priority and Supporting CCSS Explanations and Examples*
substituted. )
A-REI 1. Explain each step in solving a simple equation
as following from the equality of numbers asserted at
the previous step, starting from the assumption that the
original equation has a solution. Construct a viable
argument to justify a solution method.
For two-step equations, flow charts may be used to help students “undo” the order of operations to find the value of a variable. For example, this flow chart may be used to solve the equation 4x – 2 = 30.
Then students learn to solve equations by performing the same operation (except for division by zero) on both sides of the equal sign. 4x – 2 = 30 +2 +2 4x = 32 4 4 x = 8
A-REI 3. Solve linear equations and inequalities in one
variable, including equations with coefficients represented by
letters.

Approved 4/12/13 Algebra I
Unit 2: Linear Equations and Inequalities
6
Adapted from The Leadership and Learning Center “Rigorous Curriculum Design” model.
*Adapted from the Arizona Academic Content Standards.
Priority and Supporting CCSS Explanations and Examples*
In solving multiple-step equations students should realize that there may be several valid solution paths. For example here are two approaches to the equation 3x + 10 = 7x – 6. 3x + 10 = 7x – 6 3x + 10 = 7x – 6
–3x –3x –7x –7x
10 = 4x – 6 –4x + 10 = –6
+6 +6 –10 –10
16 = 4x –4x = –16
4 4 –4 –4
4 = x x = 4
Approved 4/12/13 Algebra I
Unit 2: Linear Equations and Inequalities
7
Adapted from The Leadership and Learning Center “Rigorous Curriculum Design” model.
*Adapted from the Arizona Academic Content Standards.
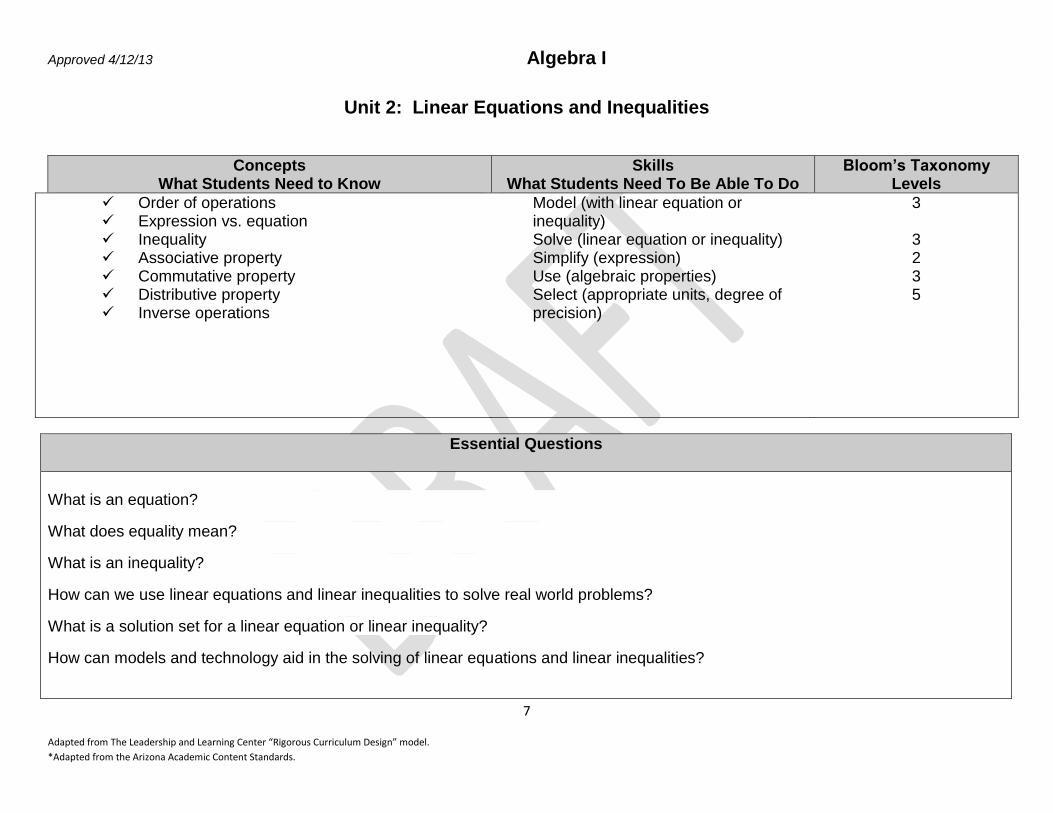
Concepts What Students Need to Know
Skills What Students Need To Be Able To Do
Bloom’s Taxonomy Levels
Order of operations Expression vs. equation Inequality Associative property Commutative property Distributive property Inverse operations
Model (with linear equation or inequality) Solve (linear equation or inequality) Simplify (expression) Use (algebraic properties) Select (appropriate units, degree of precision)
3
3 2 3 5
Essential Questions
What is an equation?
What does equality mean?
What is an inequality?
How can we use linear equations and linear inequalities to solve real world problems?
What is a solution set for a linear equation or linear inequality?
How can models and technology aid in the solving of linear equations and linear inequalities?

Approved 4/12/13 Algebra I
Unit 2: Linear Equations and Inequalities
8
Adapted from The Leadership and Learning Center “Rigorous Curriculum Design” model.
*Adapted from the Arizona Academic Content Standards.
Standardized Assessment Correlations (State, College and Career)
CAPT through 2014, Smarter Balance assessment thereafter.
Vocabulary
Variable, algebraic expression, equation, open sentence, simplify, exponent, base, power, evaluate, additive inverse, properties of equalities (multiplicative identify, additive identity, associative, commutative, distributive), term, constant, coefficient, like terms, inverse operations, identity (x=x), solution,
Topic Section in
Text
PH Algebra 1
©2009
CCSS
Real numbers
Classify numbers: natural, whole,
integer, rational, irrational
1.3
N-RN3
Corresponding Big Ideas
To obtain a solution to an equation, no matter how complex, always involves the process of undoing the operations.
Learning Activities

Approved 4/12/13 Algebra I
Unit 2: Linear Equations and Inequalities
9
Adapted from The Leadership and Learning Center “Rigorous Curriculum Design” model.
*Adapted from the Arizona Academic Content Standards.
Real number operations (review)
Simplify numerical expressions
using order of operations, with an
emphasis on fractions
1.1-1.2
A-SSE 1
Variable Expressions
Interpret parts of an expression,
such as terms, factors, and
coefficients.
Simplify by combining like terms
Associative Property
Commutative Property
Distributive Property
Simplify by using properties
Translate word sentences into
variable expressions
Evaluate variable expressions
involving the combination of like
terms and distribution
2.1-2.5
A-SSE.1a
A-SSE.1b
A-SSE.2
Solve Multi-step Linear Equations
Define the use of inverse operations to solve equations
Justify steps using equality of
numbers, properties from algebra
3.1-3.3 A-CED.1
A-CED.4

Approved 4/12/13 Algebra I
Unit 2: Linear Equations and Inequalities
10
Adapted from The Leadership and Learning Center “Rigorous Curriculum Design” model.
*Adapted from the Arizona Academic Content Standards.
Rearrange formulas to highlight a
quantity of interest.
Create and solve equations to solve
problems.
A-REI.1
A-REI.3
Unit Assessments The items developed for this section can be used during the course of instruction when deemed appropriate by the teacher.
Mid unit test End-of-unit test Performance Task CAPT Practice Problems – See appendix

Approved 4/12/13 Algebra 1
Unit 3: Functions
1
Adapted from The Leadership and Learning Center “Rigorous Curriculum Design” model.
*Adapted from the Arizona Academic Content Standards.
Pacing: 11 days (include 4 short sessions)
Mathematical Practices
Mathematical Practices #1 and #3 describe a classroom environment that encourages thinking mathematically and are critical for quality teaching and learning. Practices in bold are to be emphasized in the unit. 1. Make sense of problems and persevere in solving them. 2. Reason abstractly and quantitatively. 3. Construct viable arguments and critique the reasoning of others. 4. Model with mathematics. 5. Use appropriate tools strategically. 6. Attend to precision. 7. Look for and make use of structure. 8. Look for and express regularity in repeated reasoning.
Standards Overview
Create equations that describe numbers or relationships Represent and solve equations and inequalities graphically Understand the concept of a function and use function notation Interpret functions that arise in applications in terms of the context Analyze functions using different representations

Approved 4/12/13 Algebra 1
Unit 3: Functions
2
Adapted from The Leadership and Learning Center “Rigorous Curriculum Design” model.
*Adapted from the Arizona Academic Content Standards.
Priority and Supporting CCSS Explanations and Examples*
A-CED 2. Create equations in two or more variables to
represent relationships between quantities; graph
equations on coordinate axes with labels and scales
Students may collect data from water that is cooling using two
thermometers, one measuring Celsius, the other Fahrenheit. From this
they can create of the relationship and show that it can be modeled with
a linear function.
A-REI 10. Understand that the graph of an equation in two
variables is the set of all its solutions plotted in the
coordinate plane, often forming a curve (which could be a
line).
The graph below shows the height of a hot air balloon as a function of time. Explain what the point (50, 300) on this graph represents.

Approved 4/12/13 Algebra 1
Unit 3: Functions
3
Adapted from The Leadership and Learning Center “Rigorous Curriculum Design” model.
*Adapted from the Arizona Academic Content Standards.
Priority and Supporting CCSS Explanations and Examples*
F-IF 1. Understand that a function from one set (called the
domain) to another set (called the range) assigns to each
element of the domain exactly one element of the range. If f
is a function and x is an element of its domain, then f(x)
denotes the output of f corresponding to the input x. The
graph of f is the graph of the equation y = f(x).
The domain of a function given by an algebraic expression, unless otherwise specified, is the largest possible domain. Mapping diagrams may be used to introduce the concepts of domain and range. The vertical line test may be used to determine whether a graph represents a function.

Approved 4/12/13 Algebra 1
Unit 3: Functions
4
Adapted from The Leadership and Learning Center “Rigorous Curriculum Design” model.
*Adapted from the Arizona Academic Content Standards.
Priority and Supporting CCSS Explanations and Examples*
F-IF 2. Use function notation, evaluate functions for
inputs in their domains, and interpret statements that
use function notation in terms of a context.
Examples: If f(x) = x2 + 4x – 12, find f(2) Let f(x) = 10x – 5; find f(1/2), f(-6), f(a) If P(t) is the population of Tucson t years after 2000, interpret the statements P(0) = 487,000 and P(10)-P(9) = 5,900.
F-IF 4. For a function that models a relationship between
two quantities, interpret key features of graphs and
tables in terms of the quantities and sketch graphs
showing key features given a verbal description of the
relationship. Key features include: intercepts; intervals
where the function is increasing, decreasing, positive,
or negative....*
Students may be given graphs to interpret or produce graphs given an expression or table for the function, by hand or using technology. Examples: • A rocket is launched from 180 feet above the ground at time t = 0. The function that models this situation is given by h = – 16t2 + 96t + 180, where t is measured in seconds and h is height above the ground measured in feet.
o What is a reasonable domain restriction for t in this context?
o Determine the height of the rocket 2 seconds after it was launched.
o Determine the maximum height obtained by the rocket.
o Determine the time when the rocket is 100 feet above the ground.

Approved 4/12/13 Algebra 1
Unit 3: Functions
5
Adapted from The Leadership and Learning Center “Rigorous Curriculum Design” model.
*Adapted from the Arizona Academic Content Standards.
Priority and Supporting CCSS Explanations and Examples*
o Determine the time at which the rocket hits the ground.
o How would you refine your answer to the first question based on
your response to the fifth question? • It started raining lightly at 5am, then the rainfall became heavier at 7am. By 10am the storm was over, with a total rainfall of 3 inches. It didn’t rain for the rest of the day. Sketch a possible graph for the number of inches of rain as a function of time, from midnight to midday.

Approved 4/12/13 Algebra 1
Unit 3: Functions
6
Adapted from The Leadership and Learning Center “Rigorous Curriculum Design” model.
*Adapted from the Arizona Academic Content Standards.
Priority and Supporting CCSS Explanations and Examples*
F-IF 5. Relate the domain of a function to its graph and,
where applicable, to the quantitative relationship it describes.
For example, if the function h(n) gives the number of person-
hours it takes to assemble n engines in factory, then the
positive integers would be an appropriate domain for the
function.*
Students may explain orally, or in written format, the existing relationships.
F-IF 7b. Graph square root, cube root, and piecewise-
defined functions, including step functions and absolute
value functions.
Emphasis in this unit is distinguishing the graphs of linear and non-linear functions; linear functions are emphasized in Unit 4; non-linear functions are studied in more detail in later units.
F-IF 9. Compare properties of two functions each
represented in a different way (algebraically, graphically,
numerically in tables, or by verbal descriptions).
Students may be asked to match graphs with tables or equations with which they may represent, and to explain their reasoning.

Approved 4/12/13 Algebra 1
Unit 3: Functions
7
Adapted from The Leadership and Learning Center “Rigorous Curriculum Design” model.
*Adapted from the Arizona Academic Content Standards.
Concepts What Students Need to Know
Skills What Students Need To Be Able To Do
Bloom’s Taxonomy Levels
Independent variable Dependent variable Ordered pair Mapping Diagram Table Graph Equation for a function Function notation Domain Range Vertical Line test
Determine (whether or not a relation is a function) Determine (range and domain of a function) Model (a real world situation with a function) Evaluate (a function) Represent a function (with table, graph, equation, mapping diagram)
4
4
3
3 3

Approved 4/12/13 Algebra 1
Unit 3: Functions
8
Adapted from The Leadership and Learning Center “Rigorous Curriculum Design” model.
*Adapted from the Arizona Academic Content Standards.
Essential Questions
What is a function?
What are the different ways that functions may be represented?
How can functions be used to model real world situations, make predictions, and solve problems
Corresponding Big Ideas
Functions are a mathematical way to describe relationships between two quantities that vary.
Standardized Assessment Correlations (State, College and Career)
CAPT through 2014, Smarter Balance assessment thereafter.
Unit Vocabulary
Function, independent and dependent variable, domain, range, relation, vertical line test, function notation, discrete and continuous
data, Intercepts, Intervals of increasing / decreasing / positive / negative/constant, input, output, ordered pairs, co-ordinate points,
coordinate plane, axis, table of values, mapping, set, evaluate, function rule, end behavior of a linear, slope, slope intercept form

Approved 4/12/13 Algebra 1
Unit 3: Functions
9
Adapted from The Leadership and Learning Center “Rigorous Curriculum Design” model.
*Adapted from the Arizona Academic Content Standards.
Learning Activities
Topic Section in Text
PH Algebra 1
CCSS
Introduction to Functions
Determine whether a relation is a function given a relation
expressed with a set, table or graph
Determine domain and range values for a variety of functions
Relate the domain of a function to its graph and where
applicable, to the quantitative relationship it describes.
Use function notation to communicate pairings of input and
output values
Evaluate functions for inputs in their domain
Understand that the graph of an equation in two variables is
the set of all its solutions plotted on the coordinate plane
Interpret statements that use function notation in terms of a
context.
1.4 Objective 2
5.1-5.3, 5.5, 5.6
F-IF.2
F-IF.1
A-REI.10

Approved 4/12/13 Algebra 1
Unit 3: Functions
10
Adapted from The Leadership and Learning Center “Rigorous Curriculum Design” model.
*Adapted from the Arizona Academic Content Standards.
Functions – Linear vs. non-linear (square root, cube root,
piecewise defined, step, and absolute value functions)
Compare graphs of functions and relate to their equations
Sketch graphs showing key features (x and y intercepts,
intervals of increasing / decreasing / positive / negative,
relative max / min, symmetry, end behavior) given a
verbal description of the relationship
Interpret key features of the graphs and tables in terms of
the quantities of a function that models a relationship
between two quantities
Compare properties of two functions each represented in
a different way (algebraically, graphically, numerically in
tables, or by verbal descriptions.)
6.7 scatterplot -
linear
6.8 abs value
8.7 exponentials
10.1 quadratics
11.4 sq. root
12.1 rational
F-IF.4
A-CED.2
F-IF.9
Unit Assessments The items developed for this section can be used during the course of instruction when deemed appropriate by the teacher.
End-of-Unit Test Performance Task Unit 2 assessment developed by LHS Algebra 1 teachers, found in the LHS network Math Folder. CAPT released items selected by their alignment to the unit content, are imbedded in the cumulative unit assessment. Other CAPT released items may be used for instructional purposes throughout the unit. See appendix.

Approved 4/12/13 Algebra 1
Unit 4: Linear Functions
1
Adapted from The Leadership and Learning Center “Rigorous Curriculum Design” model.
*Adapted from the Arizona Academic Content Standards.
Pacing: 14 days (includes 5 short sessions)
Mathematical Practices
Mathematical Practices #1 and #3 describe a classroom environment that encourages thinking mathematically and are critical for quality teaching and learning. Practices in bold are to be emphasized in the unit. 1. Make sense of problems and persevere in solving them. 2. Reason abstractly and quantitatively. 3. Construct viable arguments and critique the reasoning of others. 4. Model with mathematics. 5. Use appropriate tools strategically. 6. Attend to precision. 7. Look for and make use of structure. 8. Look for and express regularity in repeated reasoning.
Standards Overview
Interpret functions that arise in applications in terms of the context Analyze functions using different representations Construct and compare linear and exponential models and solve problems Interpret expressions for functions in terms of the situation they model

Approved 4/12/13 Algebra 1
Unit 4: Linear Functions
2
Adapted from The Leadership and Learning Center “Rigorous Curriculum Design” model.
*Adapted from the Arizona Academic Content Standards.
Priority and Supporting CCSS Explanations and Examples*
F-IF 6. Calculate and interpret the average rate of change of
a function (presented symbolically or as a table) over a
specified interval. Estimate the rate of change from a graph.*
For linear functions, the rate of change is also the slope of the line. Example: A cell phone company uses the function y = 0.03x + 14.99 to determine the monthly charge, y, in dollars, for a customer using the phone fo x minutes. Interpret the slope of this function in the context of this problem and indicate the appropriate units.
F-IF 7. Graph functions expressed symbolically and show
key features of the graph, by hand in simple cases and using
technology for more complicated cases.*
a. Graph linear ...functions and show intercepts..
Example: Find the x-intercept and the y-intercept for each of these lines. y = –3x + 18 y – 7 = 2/3(x + 4) 6x + 4y = 96

Approved 4/12/13 Algebra 1
Unit 4: Linear Functions
3
Adapted from The Leadership and Learning Center “Rigorous Curriculum Design” model.
*Adapted from the Arizona Academic Content Standards.
Priority and Supporting CCSS Explanations and Examples*
F-IF 8. Write a function defined by an expression in different
but equivalent forms to reveal and explain different
properties of the function.
For linear functions, the slope intercept form easily reveals the slope and the y-intercept. From the standard form one can easily determine both intercepts. The point-slope form focuses attention on a particular point on the graph and is directly related to the definition of slope.
F-LE 1. Distinguish between situations that can be modeled
with linear functions [and with exponential functions].
a. Prove that linear functions grow by equal differences
over equal intervals... over equal intervals.
Given several tables of values, determine which represent linear functions, and explain why.
b. Recognize situations in which one quantity changes at a
constant rate per unit interval relative to another....
Input Output
1 3
2 4
3 6
4 9
5 13
Input Output
1 8
2 6
3 4
4 2
5 0
x y
0 1
1 2
4 3
7 4
8 5

Approved 4/12/13 Algebra 1
Unit 4: Linear Functions
4
Adapted from The Leadership and Learning Center “Rigorous Curriculum Design” model.
*Adapted from the Arizona Academic Content Standards.
Priority and Supporting CCSS Explanations and Examples*
F-LE 2. Construct linear ... functions, including
arithmetic ... sequences, given a graph, a description of
a relationship, or two input-output pairs (include reading
these from a table).
Example: Sara’s starting salary is $32,500. Each year she receives a $700 raise. Write a sequence in explicit form to describe the situation. Draw a graph representing this situation. Is this function discrete or continuous?
F-LE 5. Interpret the parameters in a linear ... function in
terms of a context.
Use technology to explore the effects of the parameters m and b in the linear functions y = mx + b by holding first one parameter and then the other constant while allowing the other one to vary. Example: A student club is raising funds to fight cancer. They raffle off a gift basket and sell raffle tickets. The function that gives their profit is f(x) = 2x – 80, where x is the number of tickets sold.
a. How much did they spend on the gift basket? b. How much do they charge for each ticket? c. If they raise the price of a ticket, which parameter will change, the
slope or the y-intercept? Explain.

Approved 4/12/13 Algebra 1
Unit 4: Linear Functions
5
Adapted from The Leadership and Learning Center “Rigorous Curriculum Design” model.
*Adapted from the Arizona Academic Content Standards.
Concepts What Students Need to Know
Skills What Students Need To Be Able To Do
Bloom’s Taxonomy Levels
Rate of change Constant additive change Slope x-intercept y-intercept slope-intercept form point-slope form standard form velocity
Inequalities in two variables
Find (slope given two points) Interpret (slope as rate of change) Determine (whether function is linear) Find (equation of a line) Rearrange (equation of a line into a different form) Model (linear function) Graph (linear function) Find (slopes of parallel and perpendicular lines) Interpret (parameters of linear function) Create linear (inequalities) Graph linear (inequalities)
1 2 4 1 3
3 3 1
2
3

Approved 4/12/13 Algebra 1
Unit 4: Linear Functions
6
Adapted from The Leadership and Learning Center “Rigorous Curriculum Design” model.
*Adapted from the Arizona Academic Content Standards.
Essential Questions
What is a linear function?
What are the different ways that linear functions may be represented?
What is the significance of a linear function’s slope and y-intercept?
How may linear functions model real world situations?
How may linear functions help us analyze real world situations and solve practical problems?
Corresponding Big Ideas
Linear functions are characterized by a constant average rate of change (or constant additive change).
Unit Vocabulary
Linear function, independent and dependent variable, discrete, continuous, function notation, exponential and quadratic function, slope, intercepts, arithmetic sequence, average-rate-of-change, velocity, slope-intercept form, point-slope form, standard form

Approved 4/12/13 Algebra 1
Unit 4: Linear Functions
7
Adapted from The Leadership and Learning Center “Rigorous Curriculum Design” model.
*Adapted from the Arizona Academic Content Standards.
Learning Activities
Topic Section in the Text CCSS
Determining the rate-of-change
Calculate and interpret the average-rate-of-change using information provided symbolically or given in a table or graph or provided in a verbal description
Graphing lines
Graph linear functions expressed symbolically or verbally using the slope and X Y intercepts
Graph manually and using technology Developing and constructing linear functions
Develop linear functions (equations) using arithmetic sequences, graphs, verbal descriptions or data provided in tables.
Compare, use and understand the benefits of the different forms of a linear function – slope-intercept, point-slope and standard forms
Interpret the parameters in a linear function in terms of their context – slope, intercepts
Understand the unique aspects of horizontal and vertical lines
6.1 to 6.6
F-IF 6
F-IF 7
F-IF 8 F-LE 2 F-LE 5
F-LE 1

Approved 4/12/13 Algebra 1
Unit 4: Linear Functions
8
Adapted from The Leadership and Learning Center “Rigorous Curriculum Design” model.
*Adapted from the Arizona Academic Content Standards.
Linear Inequalities
Graph the solutions to a linear inequality in two variables as a half-plane (excluding the boundary in the case of a strict inequality)
7-5
Standardized Assessment Correlations (State, College and Career)
CAPT through 2014, Smarter Balance assessment thereafter.
Unit Assessments The items developed for this section can be used during the course of instruction when deemed appropriate by the teacher.
Mid-unit test End-of-unit test Performance task CAPT released items – see appendix

Approved 4/12/13 Algebra I
Unit 5: Scatter Plots and Trend Lines
1
Adapted from The Leadership and Learning Center “Rigorous Curriculum Design” model.
*Adapted from the Arizona Academic Content Standards.
Pacing: 15 days (includes 5 short sessions) – two parts/two assessments
Mathematical Practices
Mathematical Practices #1 and #3 describe a classroom environment that encourages thinking mathematically and are critical for quality teaching and learning. Practices in bold are to be emphasized in the unit. 1. Make sense of problems and persevere in solving them. 2. Reason abstractly and quantitatively. 3. Construct viable arguments and critique the reasoning of others. 4. Model with mathematics. 5. Use appropriate tools strategically. 6. Attend to precision. 7. Look for and make use of structure. 8. Look for and express regularity in repeated reasoning.
Standards Overview
Analyze functions using different representations Summarize, represent, and interpret data on a single count or measurement variable Summarize, represent, and interpret data on two categorical and quantitative variables Interpret linear models

Approved 4/12/13 Algebra I
Unit 5: Scatter Plots and Trend Lines
2
Adapted from The Leadership and Learning Center “Rigorous Curriculum Design” model.
*Adapted from the Arizona Academic Content Standards.
Priority and Supporting CCSS Explanations and Examples*
F-IF 7b. Graph ... piecewise-defined functions, including step
functions and absolute value functions.
Piecewise linear functions may model sets of data. For example the world women’s swimming records for the 100 meter free style exhibit two distinct linear trends; one for the years 1910-1936, the other for 1956-2010.
S-ID 1 Represent data with plots on the real number line (dot
plots, histograms, and box plots).
Students may compare and contrast the advantage of each of these representations.
S-ID 2. Use statistics appropriate to the shape of the
data distribution to compare center (median, mean) and
spread (interquartile range, standard deviation) of two or
more different data sets.
Students may use spreadsheets, graphing calculators and statistical software for calculations, summaries, and comparisons of data sets. Example: Given a set of test scores: 99, 96, 94, 93, 90, 88, 86, 77, 70, 68, find the mean, median and standard deviation. Explain how the values vary about the mean and median. What information does this give the teacher?

Approved 4/12/13 Algebra I
Unit 5: Scatter Plots and Trend Lines
3
Adapted from The Leadership and Learning Center “Rigorous Curriculum Design” model.
*Adapted from the Arizona Academic Content Standards.
Priority and Supporting CCSS Explanations and Examples*
S-ID 3. Interpret differences in shape, center, and spread
in the context of the data sets, accounting for possible
effects of extreme data points (outliers).
Example:
After the 2009-2010 NBA season LeBron James switched teams
from the Cleveland Cavaliers to the Miami Heat, and he remained
the top scorer (in points per game) in his first year in Miami.
Compare team statistics for Cleveland (2009-2010) and Miami
(2010-2011) for all players who averaged at least 10 minutes per
game. Using the 1.5 X IQR rule, determine for which team and
year James’s performance may be considered an outlier.
S-ID 6. Represent data on two quantitative variables on a
scatter plot, and describe how the variables are related.
a. Fit a function to the data; use functions fitted to data
to solve problems in the context of the data...
Students may use spreadsheets, graphing calculators, and statistical software to represent data, describe how the variables are related, fit functions to data, perform regressions, and calculate residuals. Example: Make a scatter plot of data showing the rise in sea level over the past century. Fit a trend line and use it to predict the sea level in the year 2020.
c. Fit a linear function for a scatter plot that suggests a linear
association

Approved 4/12/13 Algebra I
Unit 5: Scatter Plots and Trend Lines
4
Adapted from The Leadership and Learning Center “Rigorous Curriculum Design” model.
*Adapted from the Arizona Academic Content Standards.
Priority and Supporting CCSS Explanations and Examples*
S-ID 7. Interpret the slope (rate of change) and the
intercept (constant term) of a linear model in the context
of the data.
Students may use spreadsheets or graphing calculators to create
representations of data sets and create linear models. Example: • Lisa lights a candle and records its height in inches every hour. The results recorded as (time, height) are (0, 20), (1, 18.3), (2, 16.6), (3, 14.9), (4, 13.2), (5, 11.5), (7, 8.1), (9, 4.7), and (10, 3). Express the candle’s height (h) as a function of time (t) and state the meaning of the slope and the intercept in terms of the burning candle.
S-ID 8. Compute (using technology) and interpret the
correlation coefficient of a linear fit.
Example: Collect height, shoe-size, and wrist circumference data for each student. Determine the best way to display the data. Answer the following questions: Is there a correlation between any two of the three indicators? Is there a correlation between all three indicators? What patterns and trends are apparent in the data? What inferences can be made from the data?

Approved 4/12/13 Algebra I
Unit 5: Scatter Plots and Trend Lines
5
Adapted from The Leadership and Learning Center “Rigorous Curriculum Design” model.
*Adapted from the Arizona Academic Content Standards.
Priority and Supporting CCSS Explanations and Examples*
S-ID 9. Distinguish between correlation and causation. Some data leads observers to believe that there is a cause and
effect relationship when a strong relationship is observed. Students should be careful not to assume that correlation implies causation. The determination that one thing causes another requires a controlled randomized experiment. Example: Diane did a study for a health class about the effects of a student’s end-of-year math test scores on height. Based on a graph of her data, she found that there was a direct relationship between students’ math scores and height. She concluded that “doing well on your end-of-course math tests makes you tall.” Is this conclusion justified? Explain any flaws in Diane’s reasoning.
N-Q1. Use units as a way to understand problems and to
guide the solution of multi-step problems; choose and
interpret units consistently in formulas; choose and interpret
the scale and the origin in graphs and data displays.

Approved 4/12/13 Algebra I
Unit 5: Scatter Plots and Trend Lines
6
Adapted from The Leadership and Learning Center “Rigorous Curriculum Design” model.
*Adapted from the Arizona Academic Content Standards.
Priority and Supporting CCSS Explanations and Examples*
S-ID5. Summarize categorical data for two categories in
two-way frequency tables. Interpret relative frequencies in
the context of the data(including joint, marginal, and
conditional relative frequencies). Recognize possible
associations and trends in the data.

Approved 4/12/13 Algebra I
Unit 5: Scatter Plots and Trend Lines
7
Adapted from The Leadership and Learning Center “Rigorous Curriculum Design” model.
*Adapted from the Arizona Academic Content Standards.
Concepts What Students Need to Know
Skills What Students Need To Be Able To Do
Bloom’s Taxonomy Levels
Measures of central tendency (mean, median, mode) Measures of spread (range, interquartile range, standard deviation) Outlier Histogram Box plot Scatter plot Trend line Line of best fit Correlation Correlation coefficient Causation Interpolation Extrapolation Piecewise linear function
Calculate (mean, median, mode, interquartile range) Fit (trend line to scatter plot) Use (technology to find standard deviation, line of best fit, correlation coefficient) Interpret (correlation) Predict (using interpolation, extrapolation) Identify (outliers) Evaluate (piecewise function)
1
3 3
2 4
4 3

Approved 4/12/13 Algebra I
Unit 5: Scatter Plots and Trend Lines
8
Adapted from The Leadership and Learning Center “Rigorous Curriculum Design” model.
*Adapted from the Arizona Academic Content Standards.
Essential Questions
How do we make predictions and informed decisions based on current numerical information?
What are the advantages and disadvantages of analyzing data by hand versus by using technology?
What is the potential impact of making a decision from data that contains one or more outliers?
Corresponding Big Ideas
Although scatter plots and trend lines may reveal a pattern, the relationship of the variables may indicate a correlation, but not causation.
Standardized Assessment Correlations (State, College and Career)
CAPT through 2014, Smarter Balance assessment thereafter.
Unit Vocabulary
Measures of Central Tendency, Mean, Median, Mode, Bimodal, Outlier, Quartiles, Box-and-Whisker Plot, Range, Interquartile range,
Standard Deviation, Two-way Tables, Relative Frequency (Joint, Marginal, Conditional), Scatterplot, Trend Line, Linear Regression,
Correlation Coefficient, Exponential Growth, Exponential Decay, scale, origin

Approved 4/12/13 Algebra I
Unit 5: Scatter Plots and Trend Lines
9
Adapted from The Leadership and Learning Center “Rigorous Curriculum Design” model.
*Adapted from the Arizona Academic Content Standards.
Learning Activities
PART 1: Analyze Data
Topic Section in Text
Stats in Your World,
2012 Bock/Mariano
(Teacher Resources)
CCSS
What are Data?
Data tables
Categorical and quantitative variables
Chapter 2 N-Q1
Categorical Data
Frequency tables
Relative frequency bar chart
Contingency Table
Marginal distributions
Conditional distributions
Associations vs. Independence
Chapter 3 N-Q1
S-ID5
S-ID9
Quantitative Data
Histograms
Relative frequency histograms
Dotplots
Distribution Descriptions
Chapter 4 N-Q1
S-ID1
S-ID2

Approved 4/12/13 Algebra I
Unit 5: Scatter Plots and Trend Lines
10
Adapted from The Leadership and Learning Center “Rigorous Curriculum Design” model.
*Adapted from the Arizona Academic Content Standards.
SHAPE – modes, uniform, symmetric, tails,
skewed, gaps, outliers
CENTER – median
SPREAD – range, quartiles, interquartile
range (IQR), percentiles
Symmetric Distributions
Mean, median, standard deviation
S-ID3
Analyzing and Interpreting Data
Boxplots
Comparing groups with Histograms
Comparing groups with Boxplots
Outliers
Chapter 5 N-Q1
S-ID1
S-ID2
S-ID3
Unit Assessments The items developed for this section can be used during the course of instruction when deemed appropriate by the teacher.
End of Unit Test Performance Task

Approved 4/12/13 Algebra I
Unit 5: Scatter Plots and Trend Lines
11
Adapted from The Leadership and Learning Center “Rigorous Curriculum Design” model.
*Adapted from the Arizona Academic Content Standards.
Learning Activities
Part 2: Fit Functions to Data
Topic Section in Text CCSS
Linear Models
Scatterplot
Trend Line
Linear Regression
Correlation Coefficient
Piecewise Linear Functions
Evaluate
Alg I 6.7
Stats in Your World
Chapter 7
PH Algebra 2
2.4 ex 4, Activity Lab
pg 86-87
PH Algebra 2
2.2 Extension, p. 71
S-ID6a
S-ID6c
N-Q1
F-IF.7b
Linear vs Exponential
Alg I 10.8 Activity Lab
pg 466
PH Algebra 2
8.5 Activity Lab, p.469
S-ID6a
S-ID6c
N-Q1
Unit Assessments The items developed for this section can be used during the course of instruction when deemed appropriate by the teacher.
End of Unit Test Performance Task

Approved 4/12/13 Algebra I
Unit 6: Systems of Linear Equations and Inequalities
Pacing: 12 days (includes 4 short sessions)
Mathematical Practices
Mathematical Practices #1 and #3 describe a classroom environment that encourages thinking mathematically and are critical for quality teaching and learning. Practices in bold are to be emphasized in the unit. 1. Make sense of problems and persevere in solving them. 2. Reason abstractly and quantitatively. 3. Construct viable arguments and critique the reasoning of others. 4. Model with mathematics. 5. Use appropriate tools strategically. 6. Attend to precision. 7. Look for and make use of structure. 8. Look for and express regularity in repeated reasoning.
Standards Overview
Create equations that describe numbers or relationships Solve systems of equations Represent and solve equations and inequalities graphically

Approved 4/12/13 Algebra I
Unit 6: Systems of Linear Equations and Inequalities
Priority and Supporting CCSS Explanations and Examples*
A-CED 3. Represent constraints by equations or inequalities,
and by systems of equations and/or inequalities, and
interpret solutions as viable or nonviable options in a
modeling context...
Example: Given two sets of data that can be modeled with linear
functions, find the intersection of the two trend lines, if it exists, and
interpret the solution. For instance, if these trends continue, when
will the women catch the men and what percentage of women will be
earning $50,000 - $74,999?
Number
of
years
since
2000
% of
men
earning
$50,000 -
$74,999
% of women
earning
$50,000 -
$74,999
3 20.2 13.3
4 20.5 14.2
5 20.7 15.1
A-REI 5. Prove that, given a system of two equations in two
variables, replacing one equation by the sum of that
equation and a multiple of the other produces a system with
the same solutions.
Example: Given that the sum of two numbers is 10 and their difference is 4, what are the numbers? Explain how your answer can be deduced from the fact that they two numbers, x and y, satisfy the equations x + y = 10 and x – y = 4.

Approved 4/12/13 Algebra I
Unit 6: Systems of Linear Equations and Inequalities
Priority and Supporting CCSS Explanations and Examples*
A-REI 6. Solve systems of linear equations exactly and
approximately (e.g., with graphs), focusing on pairs of
linear equations in two variables.
.The system solution methods can include but are not limited to graphical, elimination/linear combination, substitution, and modeling. Systems can be written algebraically or can be represented in context. Students may use graphing calculators, programs, or applets to model and find approximate solutions for systems of equations. Examples: Solve the system of equations: x+ y = 11 and 3x – y = 5. Use a second method to check your answer. Your class is planning to raise money for a class trip to Washington, DC, by selling your own version of Connecticut Trail Mix. You find you can purchase a mixture of dried fruit for $3.25 per pound and a nut mixture for $5.50 per pound. The class plans to combine the dried fruit and nuts to make a mixture that costs $4.00 per pound, which will be sold at a higher price to make a profit. You anticipate you will need 180 pounds of trail mix. How many pounds of dried fruit and how many pounds of mixed nuts do you need?
A-REI 11. Explain why the x-coordinates of the points
where the graphs of the equations y = f(x) and y = g(x)
intersect are the solutions of the equation f(x) = g(x);
find the solutions approximately, e.g., using technology
to graph the functions, make tables of values, or find
successive approximations. Include cases where f(x)
and/or g(x) are linear ...functions.*
Students need to understand that numerical solution methods (data in a
table used to approximate an algebraic function) and graphical solution
methods may produce approximate solutions, and algebraic solution
methods produce precise solutions that can be represented graphically
or numerically. Students may use graphing calculators or programs to
generate tables of values, graph, or solve a variety of functions.

Approved 4/12/13 Algebra I
Unit 6: Systems of Linear Equations and Inequalities
Concepts What Students Need to Know
Skills What Students Need To Be Able To Do
Bloom’s Taxonomy Levels
Systems of linear equations Solution to a system of linear equations Graphing method Substitution method Elimination method Systems of linear inequalities graphing method
Solve (systems using graphs) Solve (systems using algebraic methods) Model (with systems of linear equations) Interpret (solution of systems of linear equations)
3 3
3
2
Essential Questions
What does the number of solutions (none, one or infinite) of a system of linear equations represent?
What are the advantages and disadvantages of solving a system of linear equations graphically versus algebraically? What does the solution set of a system of linear inequalities represent?
Corresponding Big Ideas
A system of linear equations is an algebraic way to compare two equations that model a situation and find the breakeven point or choose the most efficient or economical plan. A system of linear equalities is a graphic way to compare two inequalities that model a situation and find the feasibility region.

Approved 4/12/13 Algebra I
Unit 6: Systems of Linear Equations and Inequalities
Standardized Assessment Correlations (State, College and Career)
CAPT through 2014, Smarter Balance assessment thereafter.
Vocabulary
System of linear equations, system of linear inequalities, no solution, infinitely many solutions, substitution method, elimination
method, constraints, scale, coordinate axes, labels, solutions, half-plane, boundary, intersection
Learning Activities
Topic Section in Text CCSS
Systems of Linear Equations
Find exact solution by elimination method
Find exact solution by substitution method
Find approximate solution using graphing
Explain why the x coordinate of the point of intersection is the
solution to the equation f(x)=g(x)
Interpret solutions of systems (one solution, no solutions,
infinitely many solutions)
Applications of Linear Systems
PH Algebra 1
7-1
7-2
7-3
7-4
CC.9-12.A.CED.3
CC.9-12.A.REI.6
CC.9-12.A.REI.5
CC9.12.A.REI.11
Systems of Linear Inequalities
Find approximate solution using graphing
Interpret solution of systems
Applications of Linear Inequality Systems
PH Algebra 1
7-6
CC.9-12.A.CED.3
CC9-12.A.REI.11
CC9-12.A.REI.12

Approved 4/12/13 Algebra I
Unit 6: Systems of Linear Equations and Inequalities
Unit Assessments
The items developed for this section can be used during the course of instruction when deemed appropriate by the teacher. Performance Task End-of-Unit Test

Approved 4/12/13
Algebra I
Unit 7: An Introduction to Exponential Functions
1
Adapted from The Leadership and Learning Center “Rigorous Curriculum Design” model.
*Adapted from the Arizona Academic Content Standards.
Pacing: 15 days (includes 5 short sessions)
Mathematical Practices
Mathematical Practices #1 and #3 describe a classroom environment that encourages thinking mathematically and are critical for quality teaching and learning. Practices in bold are to be emphasized in the unit. 1. Make sense of problems and persevere in solving them. 2. Reason abstractly and quantitatively. 3. Construct viable arguments and critique the reasoning of others. 4. Model with mathematics. 5. Use appropriate tools strategically. 6. Attend to precision. 7. Look for and make use of structure. 8. Look for and express regularity in repeated reasoning.
Standards Overview
Extend the properties of exponents to rational exponents. Interpret the structure of expressions Write expressions in equivalent forms to solve problems Analyze functions using different representations Build a function that models a relationship between two quantities Construct and compare linear and exponential models and solve problems Interpret expressions for functions in terms of the situation they model

Approved 4/12/13
Algebra I
Unit 7: An Introduction to Exponential Functions
2
Adapted from The Leadership and Learning Center “Rigorous Curriculum Design” model.
*Adapted from the Arizona Academic Content Standards.
Priority and Supporting CCSS Explanations and Examples*
N-RN 1. Explain how the definition of the meaning of rational exponents
follows from extending the properties of integer exponents to those
values, allowing for a notation for radicals in terms of rational exponents.
For example, we define 51/3 to be the cube root of 5 because we want
(51/3)3 = 5(1/3)3 to hold, so (51/3)3 must equal 5.
Students may explain orally or in written format.
N-RN 2. Rewrite expressions involving radicals and rational
exponents using the properties of exponents.
Example
ab = (ab)1
2 = a1
2b1
2 = a × b
A-SSE 1b. Interpret complicated expressions by viewing one or more of
their parts as a single entity. For example, interpret P(1+r)n as the
product of P and a factor not depending on P.
Students should understand the vocabulary for the parts that make up the whole expression and be able to identify those parts and interpret there meaning in terms of a context. For example in the expression P(1+r)n, r may be the interest rate and 1 + r may be described as the “growth factor.”

Approved 4/12/13
Algebra I
Unit 7: An Introduction to Exponential Functions
3
Adapted from The Leadership and Learning Center “Rigorous Curriculum Design” model.
*Adapted from the Arizona Academic Content Standards.
Priority and Supporting CCSS Explanations and Examples*
A-SSE 3c. Use the properties of exponents to transform
expressions for exponential functions. For example the
expression 1.15t can be rewritten as [1.15 (1/12)](12t) ≈1.012(12t)
to reveal the approximate equivalent monthly interest rate if
the annual rate is 15%.
In this example the annual growth factor is 1.15 and the monthly
growth factor is 1.012.
F-IF 7. Graph functions expressed symbolically and show
key features of the graph, by hand in simple cases and using
technology for more complicated cases.*
e. Graph exponential ... functions, showing intercepts and
end behavior...
Exponential functions are similar to linear functions in that the y-intercept often represents a starting point. In exponential growth models, as the independent variable increases, the dependent variable increases at continually increasing rates. In exponential decay models, as the independent variable increases, the dependent variable approaches zero asymptotically.
F-IF 8b. Use the properties of exponents to interpret
expressions for exponential functions. For example, identify
percent rate of change in functions such as y = (1.02) t, y =
(0.97)t, y = (1.01) 12t, y = (1.2) (t/10), and classify them as
representing exponential functions.
All exponential functions may be written in the form f(x) = abx. In a later course students may learn that they may also be written in the form f(x) = aebx.

Approved 4/12/13
Algebra I
Unit 7: An Introduction to Exponential Functions
4
Adapted from The Leadership and Learning Center “Rigorous Curriculum Design” model.
*Adapted from the Arizona Academic Content Standards.
Priority and Supporting CCSS Explanations and Examples*
F-BF 2. Write ... geometric sequences both recursively
and with an explicit formula, use them to model
situations, and translate between the two forms.*
A recursive formula is An= r An-1. An explicit formula is An= A1 rn-1
F-LE 1. Distinguish between situations that can be modeled
with linear functions and with exponential functions.
a. Prove ... that exponential functions grow by equal
factors over equal intervals....
Example: Common differences for world population growth show an increasing trend, suggesting that an exponential model may be more appropriate than a linear one.
Years since 1980 Population (billions) Common differences 0 4.453 ---
1 4.529 .076
2 4.609 .080
3 4.690 .081
4 4.771 .081
5 4.852 .081
6 4.936 .084
7 5.022 .086
8 5.109 .087
9 5.196 .087

Approved 4/12/13
Algebra I
Unit 7: An Introduction to Exponential Functions
5
Adapted from The Leadership and Learning Center “Rigorous Curriculum Design” model.
*Adapted from the Arizona Academic Content Standards.
Priority and Supporting CCSS Explanations and Examples*
c. Recognize situations in which a quantity grows or decays
by a constant percent rate per unit interval relative to
another.
Example: Technetium-99m is a drug taken by a patient and then
used to study tumors in the brain, lungs and other parts of the body.
A patient takes a 1000-mg pill. The data below shows how much
active ingredient remains in the body over 6-hour time intervals.
Technetium-99m Decay
# of 6-hour Time
Intervals
Amount of Drug
Remaining (mg)
0 1000
1 500
2 250
3 125

Approved 4/12/13
Algebra I
Unit 7: An Introduction to Exponential Functions
6
Adapted from The Leadership and Learning Center “Rigorous Curriculum Design” model.
*Adapted from the Arizona Academic Content Standards.
Priority and Supporting CCSS Explanations and Examples*
F-LE 2. Construct linear and exponential functions,
including arithmetic and geometric sequences, given a
graph, a description of a relationship, or two input-
output pairs (include reading these from a table).
Example: Determine an exponential function of the form f(x) = abx using data points from the table. Graph the function and identify the key characteristics of the graph.
x f(x)
0 2
1 6
3 54
F-LE 3. Observe using graphs and tables that a quantity
increasing exponentially eventually exceeds a quantity
increasing linearly ...
Example: Contrast the growth of f(x)=3x + 20 and g(x)=3x, for x = 0, 1, 2, 3, 4, 5.

Approved 4/12/13
Algebra I
Unit 7: An Introduction to Exponential Functions
7
Adapted from The Leadership and Learning Center “Rigorous Curriculum Design” model.
*Adapted from the Arizona Academic Content Standards.
Priority and Supporting CCSS Explanations and Examples*
F-LE 5. Interpret the parameters in a ... exponential
function in terms of a context.
Example: A function of the form f(n) = P(1 + r)n is used to model the amount of money in a savings account that earns 5% interest, compounded annually, where n is the number of years since the initial deposit. What is the value of r? What is the meaning of the constant P in terms of the savings account?

Approved 4/12/13
Algebra I
Unit 7: An Introduction to Exponential Functions
8
Adapted from The Leadership and Learning Center “Rigorous Curriculum Design” model.
*Adapted from the Arizona Academic Content Standards.
Concepts What Students Need to Know
Skills What Students Need To Be Able To Do
Bloom’s Taxonomy Levels
Exponential Function Exponential Growth Exponential Decay Growth Factor Half life Compound Interest Asymptote Laws of Exponents
Recognize (exponential functions) Compare and contrast (linear and exponential growth) Recognize (features of exponential graphs) Model (with exponential functions) Use (exponential models to predict) Apply (laws of exponents)
1 2
1
3 3 3
Essential Questions
What characterizes exponential growth and decay? What are real world models of exponential growth and decay? What are the limitations of exponential growth models? How can one differentiate an exponential model from a linear model given a real world data set?
Corresponding Big Ideas

Approved 4/12/13
Algebra I
Unit 7: An Introduction to Exponential Functions
9
Adapted from The Leadership and Learning Center “Rigorous Curriculum Design” model.
*Adapted from the Arizona Academic Content Standards.
When comparing an exponential model with a linear model, the question is not if the exponential model will generate very large or very
small inputs, but rather when.
With real data, sometimes deciding whether data is linear or non-linear is more complex than just looking at a graph, differences ( yn – yn-1), or an r-value; it is important to examine differences that are approximately the same more carefully to see if there is a pattern of increasing or decreasing values that, because the pattern is exponential, soon begins to produce outputs of remarkable values.
Standardized Assessment Correlations (State, College and Career)
CAPT through 2014, Smarter Balance assessment thereafter.
Unit Vocabulary
Exponential function, exponential growth, exponential decay, growth factor, half-life, compound interest, asymptote, laws of exponents,
rational exponents

Approved 4/12/13
Algebra I
Unit 7: An Introduction to Exponential Functions
10
Adapted from The Leadership and Learning Center “Rigorous Curriculum Design” model.
*Adapted from the Arizona Academic Content Standards.
Learning Activities
Topic Section in Text CCSS
Variable Expressions
Interpret parts of an expression, such as
terms, factors, and coefficients.
A-SSE.1b
Laws of Exponents
Product Rule, Power Rule, Quotient Rule,
Zero Exponent, Negative Exponents
Simplify numerical and variable
expressions containing exponents.
Evaluate variable expressions
containing exponents.
PH Algebra 1
8.1, 8.3-8.5
A-SSE 1
A-SSE 2
Rational Exponents
Define 51/3 to be …
Express numbers written in radical
form using rational exponents.
Express numbers written with
rational exponents using radicals.
Simplify numerical expressions
containing rational exponents and
radicals.
PH Algebra 2, 7.4
N.RN.2
N.RN.1

Approved 4/12/13
Algebra I
Unit 7: An Introduction to Exponential Functions
11
Adapted from The Leadership and Learning Center “Rigorous Curriculum Design” model.
*Adapted from the Arizona Academic Content Standards.
Evaluate expressions containing
rational exponents and radicals.
Linear Functions vs. Exponential
Describe the difference in rates of
change
Observe with tables and graphs that a
quantity increasing exponentially…
PH Algebra 1
Activity Lab 8.7, p. 466 - 467
CC.9-12.F.LE.1b
CC.9-12.F.LE.3
Exponential Functions
Calculate and interpret the average rate
of change of a function over a specified
interval, presented symbolically or as a
table.
Estimate the rate of change from a
graph.
Graph exponential functions
Interpret the parameters in an
exponential function in terms of a
context
Write an exponential function based on
information from a graph, description of
a relationship (Compound Interest), two
input/output pairs from a table,
arithmetic or geometric sequence
Use properties of exponents to
PH Algebra 1
8.7 – 8.8
CC.9-12.F.IF.6
CC.9-12.F.IF.6
CC.9-12.F.IF.7e
CC.9-12.F.LE.5
CC.9-12.F.LE.2
CC.9-12.A.SSE.3c

Approved 4/12/13
Algebra I
Unit 7: An Introduction to Exponential Functions
12
Adapted from The Leadership and Learning Center “Rigorous Curriculum Design” model.
*Adapted from the Arizona Academic Content Standards.
transform expressions for exponential
functions.
Use properties of exponents to interpret
expressions for exponential functions.
CC.9-12.F.IF.8b
Unit Assessments The items developed for this section can be used during the course of instruction when deemed appropriate by the teacher.
Mid-unit quiz End-of-unit test Performance task

13
Adapted from The Leadership and Learning Center “Rigorous Curriculum Design” model.

Approved 4/12/13
Algebra 1
Unit 8: Quadratic Functions and Equations
Pacing: 15 days (includes 5 short sessions)
Mathematical Practices
Mathematical Practices #1 and #3 describe a classroom environment that encourages thinking mathematically and are critical for quality teaching and learning. Practices in bold are to be emphasized in the unit. 1. Make sense of problems and persevere in solving them. 2. Reason abstractly and quantitatively. 3. Construct viable arguments and critique the reasoning of others. 4. Model with mathematics. 5. Use appropriate tools strategically. 6. Attend to precision. 7. Look for and make use of structure. 8. Look for and express regularity in repeated reasoning.
Standards Overview
Use properties of rational and irrational numbers. Write expressions in equivalent forms to solve problems Perform arithmetic operations on polynomials Solve equations and inequalities in one variable Interpret functions that arise in applications in terms of the context Analyze functions using different representations

Approved 4/12/13
Algebra 1
Unit 8: Quadratic Functions and Equations
Priority and Supporting CCSS Explanations and Examples*
N-RN 3. Explain why the sum or product of two rational numbers
is rational; that the sum of a rational number and an irrational
number is irrational; and that the product of a nonzero rational
number and an irrational number is irrational.
Since every difference is a sum and every quotient is a product, this includes differences and quotients as well. Explaining why the four operations on rational numbers produce rational numbers can be a review of students understanding of fractions and negative numbers. Explaining why the sum of a rational and an irrational number is irrational, or why the product is irrational, includes reasoning about the inverse relationship between addition and subtraction (as well as multiplication and division) Example: if a, b, and c are all rational numbers then the solutions to
the equation are given by , Recognizing that the first term is always rational, we may conclude that whenever the second term is irrational then the solutions must also be irrational.
A-SSE 3. a Factor a quadratic expression to reveal the
zeros of the function it defines. b. Complete the square
in a quadratic expression to reveal the maximum or
minimum value of the function it defines.
Three forms of the quadratic function reveal different features of its graph.
Standard form: reveals the y intercept, (0, c).
Vertex form: reveals the vertex (h, k) and thus the maximum or minimum value of the function.
Factored form: reveals the x-intercepts (x1,0) and (x2,0) .
ax2 + bx + c = 0x = -
b
2a±b2 - 4ac
2a
f (x) = ax2 + bx + c
f (x) = a(x - h)2 + k
f (x) = a(x - x1)(x - x2 )

Approved 4/12/13
Algebra 1
Unit 8: Quadratic Functions and Equations
Priority and Supporting CCSS Explanations and Examples*
A-APR 1. Understand that polynomials form a system
analogous to the integers, namely, they are closed
under the operations of addition, subtraction, and
multiplication; add, subtract, and multiply polynomials.
The product of two binomials of degree one is generally a trinomial of degree two; the process of expanding this product may be reversed to produce the factored form of the polynomial.
A-CED 1. Create equations and inequalities in one variable
and use them to solve problems. Include equations arising
from ...quadratic functions ...
Example: Lava coming from the eruption of a volcano follows a parabolic path. The height h in feet of a piece of lava t seconds after it is ejected from
the volcano is given by . After how many seconds does the lava reach its maximum height of 1000 feet?
A-CED 2. Create equations in two or more variables to
represent relationships between quantities; graph equations
on coordinate axes with labels and scales.
h(t) = -16t 2 + 64t + 936

Approved 4/12/13
Algebra 1
Unit 8: Quadratic Functions and Equations
Priority and Supporting CCSS Explanations and Examples*
A-REI 4. a. Use the method of completing the square to
transform any quadratic equation in x into an equation of the
form (x – p)2 = q that has the same solutions. Derive the
quadratic formula from this form. b. Solve quadratic
equations by inspection (e.g., for x2 = 49), taking square
roots, completing the square, the quadratic formula and
factoring, as appropriate to the initial form of the equation.
Students may solve by factoring, completing the square, and using the quadratic formula. The zero product property is used to explain why the factors are set equal to zero. Students should relate the value of the discriminant to the type of root to expect. A natural extension would be to relate the type of solutions to ax2 + bx + c = 0 to the behavior of the graph of y = ax2 + bx + c .
Value of Discriminant
Nature of Roots
Nature of Graph
b2–4ac = 0 One real root One x-intercept
b2–4ac > 0 Two real roots Two x-intercepts
b2–4ac < 0 No real root Does not intersect x-axis
F-IF 4. For a function that models a relationship between
two quantities, interpret key features of graphs and
tables in terms of the quantities, and sketch graphs
showing key features given a verbal description of the
relationship. Key features include: intercepts; intervals
where the function is increasing, decreasing, positive,
or negative; relative maximums and minimums;
symmetries... *
Example : A rocket is launched from 180 feet above the ground at time t = 0. The function that models this situation is given by h = – 16t2 + 96t + 180, where t is measured in seconds and h is height above the ground measured in feet.
1. What is a reasonable domain restriction for t in this context?
2. Determine the height of the rocket two seconds after it was launched.

Approved 4/12/13
Algebra 1
Unit 8: Quadratic Functions and Equations
Priority and Supporting CCSS Explanations and Examples*
F-IF 7a. Graph ... quadratic functions and show
intercepts, maxima, and minima.
3. Determine the maximum height obtained by the rocket.
4. Determine the time when the rocket is 100 feet above the ground.
5. Determine the time at which the rocket hits the ground.
6. How would you refine your answer to question 1 based on your
response to question 5?
F-IF 8a. Use the process of factoring and completing the
square in a quadratic function to show zeros, extreme
values, and symmetry of the graph, and interpret these
in terms of a context.
F-BF 3. Identify the effect on the graph of replacing f(x)
by f(x) + k, kf(x), f(kx), and f(x + k) for specific values of k
(both positive and negative); find the value of k given
the graphs. Experiment with cases and illustrate an
explanation of the effects on the graph using
technology...
Students should recognize these transformations of the parent graph f(x)= x2: f(x)= x2 + k is a vertical translation f(x) = (x + k)2 is a horizontal translation f(x)= kx2 stretches the graph for k > 0 f(x)= –x2 reflects the graph over the x-axis.

Approved 4/12/13
Algebra 1
Unit 8: Quadratic Functions and Equations
Concepts What Students Need to Know
Skills What Students Need To Be Able To Do
Bloom’s Taxonomy Levels
Quadratic Function Quadratic Equation Quadratic Formula Parabola Factored form Vertex form Standard form Square Root Property Zero Product Property Completing the Square Vertex Line of Symmetry First and Second Differences Monomial Binomial Trinomial
Graph (quadratic functions) Find (line of symmetry, vertex) Solve (quadratic equation) Model (with quadratic functions) Solve (problems arising from quadratic models) Expand (product of two binomials) Factor (quadratic trinomial) Use (quadratic formula)
3 1 3 3 3
3 3 3

Approved 4/12/13
Algebra 1
Unit 8: Quadratic Functions and Equations
Essential Questions
What features distinguish the graph of a quadratic function from other graphs?
How can an understanding of polynomials help in understanding quadratic functions and equations?
What are the advantages and disadvantages of different forms of the quadratic function and different methods for solving
quadratic equations?
Corresponding Big Ideas
Many real world situations can be modeled with quadratic functions.
Standardized Assessment Correlations (State, College and Career)
CAPT through 2014, Smarter Balance assessment thereafter.

Approved 4/12/13
Algebra 1
Unit 8: Quadratic Functions and Equations
Unit Vocabulary
Monomial, binomial, trinomial, polynomial, standard form of a polynomial, quadratic term, linear term, constant term, parabola, axis of symmetry, vertex, maximum, minimum, zeros (roots), factored form, zero-product property, completing the square, quadratic formula, discriminant
Learning Activities
Topic Section in Text CCSS
Quadratic Expressions - REVIEW
Identify the quadratic, linear, and constant terms of a quadratic expression.
Factor quadratic expressions by GCF, trinomials (a=1 and a≠1), and difference of squares.
PH Algebra 1 9.5-9.7 A-APR 1
Quadratic Graphs
Define quadratic function by the standard form of its equation
Study features of the parabola (axis of symmetry, vertex)
Identify vertex as max or min
Graph a quadratic
10.1 – 10.2 F-IF 4
F-IF 7a
F-BF 3
Solving Quadratic Equations
Find Zeros or Roots by graphing
Use Graphing Calculator to find zeros
10.3 A-CED 2
A-REI 4
F-IF 4

Approved 4/12/13
Algebra 1
Unit 8: Quadratic Functions and Equations
Find Zeros using square roots
Model problem with quadratic equation and solve
Identify and interpret “no solution”
Solve Quadratic Equations
Use the Zero-Product Property
Solve by Factoring
Solve by Completing the Square
Solve using the Quadratic Formula
Choose appropriate method of solving based on the initial form of the equation
Model problem with quadratic equation and solve
10.4-10.6
A-SSE 3a
A-SSE 3b A-REI 4
A-CED 2
F-IF 8a
Using the Discriminant
Relationship between discriminant and the graph of the quadratic
Properties of the discriminant to determine the number of solutions
Use discriminant to solve problems
10.7 N-RN 3
A-REI 4
F-IF 4

Approved 4/12/13
Algebra 1
Unit 8: Quadratic Functions and Equations
Unit Assessments The items developed for this section can be used during the course of instruction when deemed appropriate by the teacher.
Mid-unit quiz End-of-unit test Performance task