algebra 2 math curriculum pacing guide (revised 2017) … · · 2017-06-01algebra 2 math...
TRANSCRIPT

Algebra 2 Math Curriculum Pacing Guide (Revised 2017) Amherst County Public Schools
Suggested Sequence of Instruction and Pacing
1st 9-weeks Unit 1 - Solving Equations and Inequalities (including absolute value) Unit 2 - Graphing Absolute Value & Radicals, Simplifying Radicals, Operations with Complex Numbers Unit 3 - Factoring
2nd 9-weeks Unit 1 - Operations With Functions Unit 2 - Quadratics Unit 3 - Polynomials Additional Topics - Systems of Equations
3rd 9-weeks Unit 1 - Sequences and Series Unit 2 - Rational Expressions and Equations Unit 3 - Graphing Rational, Exponential and Logs Additional Topics - Regression
4th 9-weeks Unit 1 - Statistics - Combinations/Permutations and the Normal Curve Unit 2 - Variation, Properties and Regression SOL Review
Textbook Overview: Larson Algebra 2
First Nine Weeks SOL Objectives Vocabulary Essential Questions & Examples
Unit 1 Solving Equations and Inequalities - Including Absolute Value (14 Days)
AII.4 The student will solve, algebraically and graphically, a) absolute value equations and
inequalities; Graphing calculators will be used
for solving and for confirming the algebraic solutions. (Use of Graphing Calculator moved to AII.3 EKS)
(AII.4 moved to NEW AII.3) The student will use problem solving, mathematical communication, mathematical reasoning, connections and representations to: ● Solve absolute value equations and
inequalities algebraically and graphically. ● Write absolute value equations or
inequalities for given graphs. ● Apply an appropriate equation to solve a
real-world problem. Textbook Lessons: Extension 1.6 – Use Interval Notation – p49 Section 1.7 – Solve Absolute Value Equations and Inequalities – p51 Additional Lesson C – Solve Absolute Value Equations and Inequalities by Graphing – pA12 (AII.4 moved to NEW AII.3) AII.3 US – Clarified that solutions and intervals may be expressed in different
Absolute value equation Absolute value inequality Inequality Compound statement Extraneous solution Notation Solution Set
● How is an absolute value equation solved? ● How can the solution for an absolute value inequality
be described? ● What are the characteristics of an absolute value
function? ● Why can an absolute value equation take on more than
one solution? Examples 1. hat is the solution to |x | ?W + 4 < 2
. x or xa < − 6 > − 2
. b − 6 < x < − 2
. xc < − 2
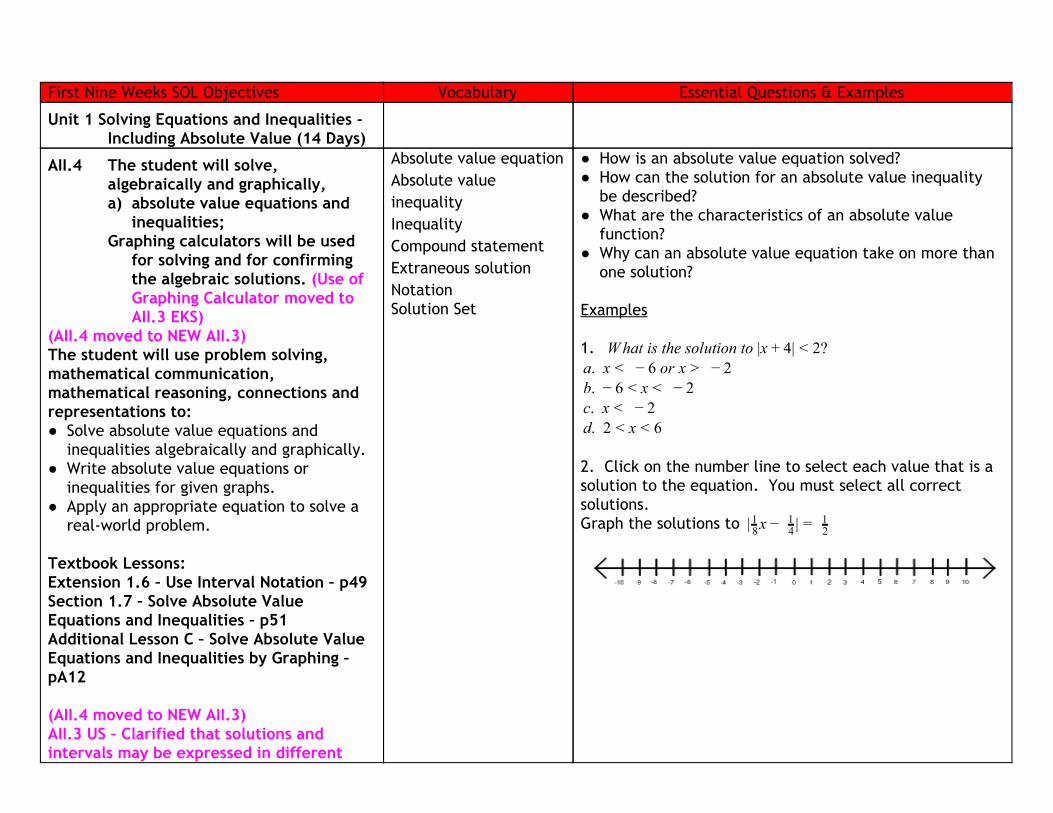
. 2d < x < 6 2. Click on the number line to select each value that is a solution to the equation. You must select all correct solutions. Graph the solutions to x || 8
1 − 41 = 2
1
formats, including set notation, using equations and inequalities, or interval notation.
Unit 2 - Graphing, Radicals and Complex Numbers (14 Days)
AII.6 The student will recognize the general shape of function (absolute value, square root, and cube root) families and will convert between graphic and symbolic forms of functions. A transformational approach to graphing will be employed. Graphing calculators will be used as a tool to investigate the shapes and behaviors of these functions. (moves to AII.6 EKS)
The student will use problem solving, mathematical communication, mathematical reasoning, connections and representations to:
● Recognize graphs of parent functions. ● Given the graph of a function, identify
the parent function. ● Given the equation and using a
transformational approach, graph a function.
● Given a transformation of a parent function, identify the graph of the transformed function.
● Given the graph of a function, identify
Transformation Translation Reflection Dilation Parent function/anchor graph Preimage Absolute value function Square Root Function Cube Root Function
● What are different representations of functions? ● What is the transformational approach to graphing? ● What is the connection between the algebraic and
graphical representation of a transformation? ● How can the calculator be used to investigate the
absolute value function, square root, and cube root function
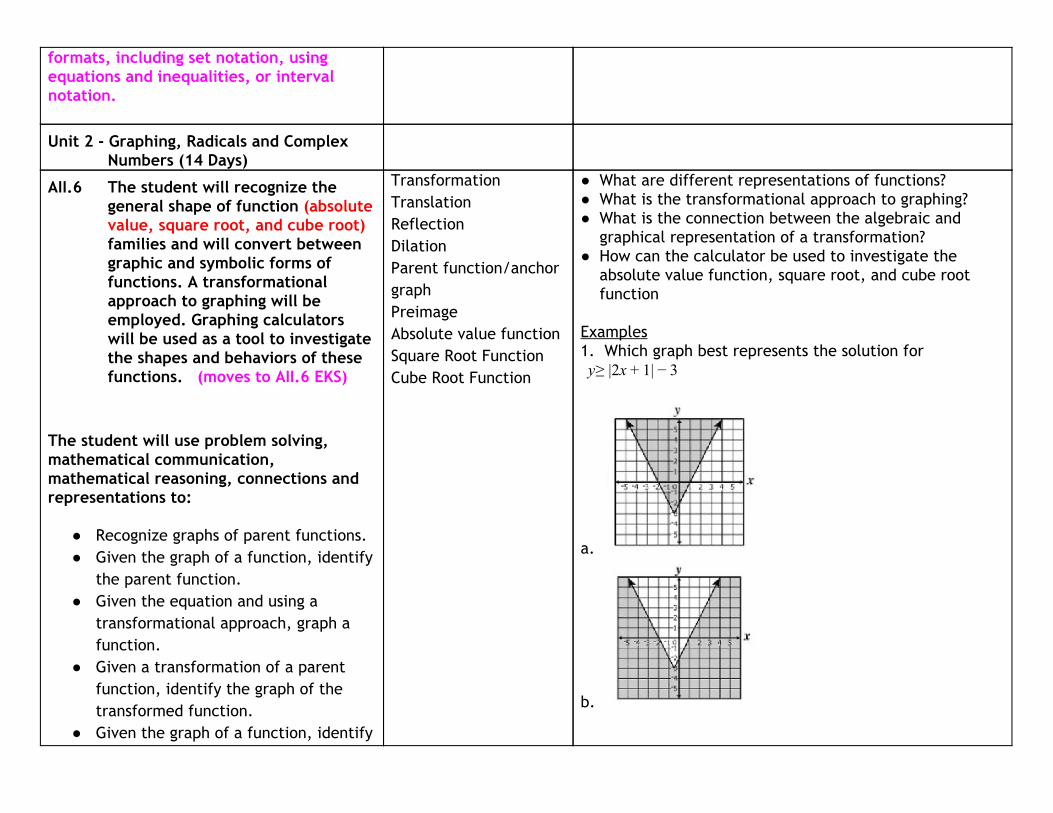
Examples 1. Which graph best represents the solution for ≥ |2x |y + 1 − 3
a.
b.

the transformations that map the preimage to the image in order to determine the equation of the image.
● Using a transformational approach, write the equation of a function given its graph.
Textbook Lessons: Investigating Algebra Activity 2.7 – p121 Section 2.7 – Use Absolute Value Functions and Transformations – p123 Section 6.5 – Graph Square Root and Cube Root Functions – p446 AII.6b EKS – Transform exponential and logarithmic functions (given a graph) limited to single transformations.
c.
d. 2. The graph most accurately represents which of the following functions? a. |x |y = + 3 + 2 b. |x |y = − 3 + 2 c. |x |y = − 2 + 3 d. |x |y = + 2 + 3
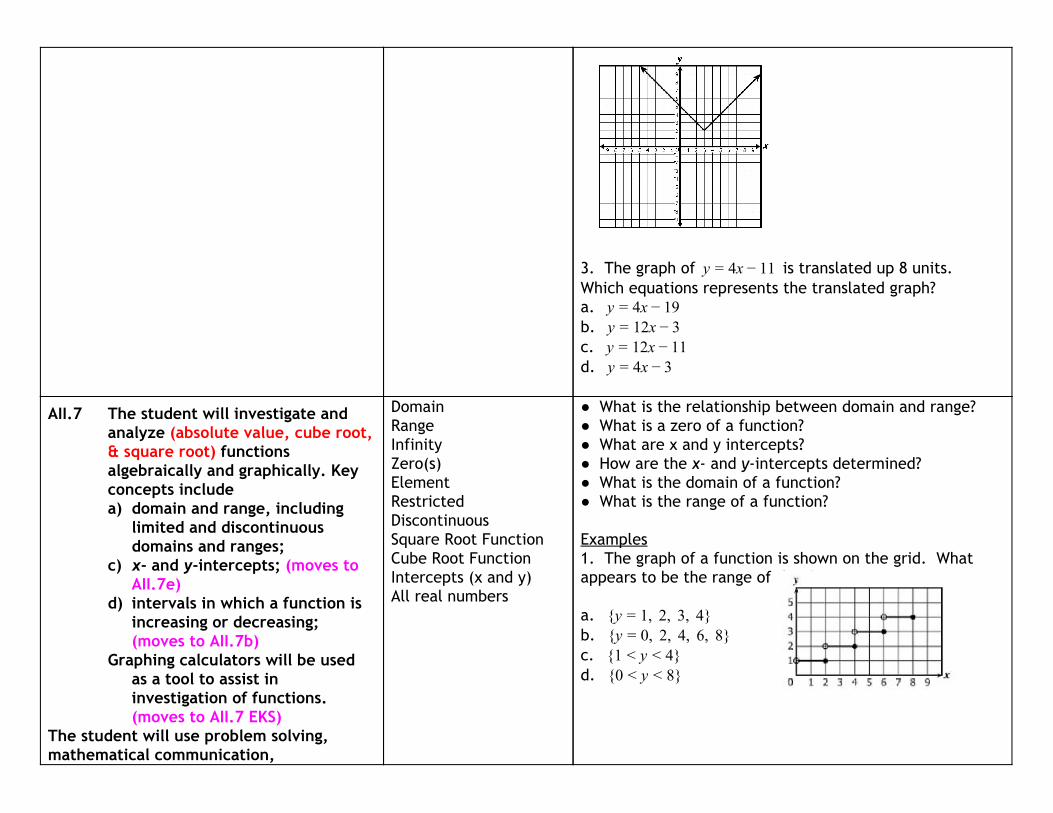
3. The graph of is translated up 8 units.x 1y = 4 − 1 Which equations represents the translated graph? a. x 9y = 4 − 1 b. 2xy = 1 − 3 c. 2x 1y = 1 − 1 d. xy = 4 − 3
AII.7 The student will investigate and analyze (absolute value, cube root, & square root) functions algebraically and graphically. Key concepts include a) domain and range, including
limited and discontinuous domains and ranges;
c) x- and y-intercepts; (moves to AII.7e)
d) intervals in which a function is increasing or decreasing; (moves to AII.7b)
Graphing calculators will be used as a tool to assist in investigation of functions. (moves to AII.7 EKS)
The student will use problem solving, mathematical communication,
Domain Range Infinity Zero(s) Element Restricted Discontinuous Square Root Function Cube Root Function Intercepts (x and y) All real numbers
● What is the relationship between domain and range? ● What is a zero of a function? ● What are x and y intercepts? ● How are the x- and y-intercepts determined? ● What is the domain of a function? ● What is the range of a function? Examples 1. The graph of a function is shown on the grid. What appears to be the range of this function? a. y , 2, 3, 4}{ = 1 b. y , 2, 4, 6, 8}{ = 0 c. 1 }{ < y < 4 d. 0 }{ < y < 8

mathematical reasoning, connections and representations to:
● Identify the domain, range, zeros, and intercepts of a function presented algebraically or graphically.
● Describe restricted/discontinuous domains and ranges.
Textbook Lessons: Section 2.1 – Represent Relations and Functions – p72 Section 6.5 – Graph Square Root and Cube Root Functions – p446 AII.7 US – Clarified that solutions and intervals may be expressed in different formats, including set notation, using equations and inequalities, or interval notation. AII.7a,d,e EKS – Clarified that examples for identifying domain, range, zeros, and intercepts should include graphs with discontinuities.
AII.1 The student, given rational, radical, or polynomial expressions, will b) add, subtract, multiply, divide,
and simplify radical expressions containing rational numbers and variables, and expressions containing rational exponents;
Radical Radicand Index Radical sign Conjugate Rationalize the denominator
● What is a radical expression? ● How are radical expressions simplified? ● How is conversion between radical and rational
exponents completed? ● How do you know when radicals can be added or
subtracted? ●

c) write radical expressions as expressions containing rational exponents and vice versa; and (moved to AII.1b EKS)
The student will use problem solving, mathematical communication, mathematical reasoning, connections and representations to:
● Simplify radical expressions containing positive rational numbers and variables.
● Convert from radical notation to exponential notation, and vice versa.
● Add and subtract radical expressions. ● Multiply and divide radical expressions
not requiring rationalizing the denominators.
● Multiply and divide radical expressions requiring rationalizing the denominators (Pre AP Alg 2)
Textbook Lessons: Section 4.5 – Solve Quadratic Equations by Finding Square Roots – p266 (simplifying square roots and rationalizing the denominator – not solving quadratic equations) Section 6.1 – Evaluate nth Roots and Use Rational Exponents – p414 Section 6.2 – Apply Properties of Rational Exponents – p420 AII.1c - Write radical expressions as an expression containing rational exponents
Examples 1. Click and drag each selected term to the correct box. Simplify completely: √3 162 x y6 7
________ √3 _________
3 6 9 x x x x y y y y2 2 3 4 2 3 4

and vice versa (moved to AII.1b EKS) AII.1b EKS – Simplification of radicals may include rationalizing denominators.
AII.3 The student will perform operations on complex numbers, express the results in simplest form using patterns of the powers of i, and identify field properties that are valid for the complex numbers.
(AII.3 moved to NEW AII.2) The student will use problem solving, mathematical communication, mathematical reasoning, connections and representations to:
● Recognize that the square root of –1 is represented as i.
● Determine which field properties apply to the complex number system.
● Simplify radical expressions containing negative rational numbers and express in a+bi form.
● Simplify powers of i. ● Add, subtract, and multiply complex
numbers. ● Place the following sets of numbers in
a hierarchy of subsets: complex, pure imaginary, real, rational, irrational, integers, whole, and natural.
● Write a real number in a+bi form. ● Write a pure imaginary number in a+bi
Complex number Subset Hierarchy Real number Field property Imaginary number Pure imaginary number Distributive Property Associative Property Commutative Property Reflexive Property Symmetric Property Identity Property
● How are real, imaginary, and complex numbers related? ● What properties extend from the real numbers to the
complex numbers? ● What is the relationship between a complex number
and its conjugate? ● What are the patterns of the powers of i?
Examples 1. Click on the box to choose each expression you want to select. You must select all correct expressions. Identify each expression that is equivalent to (i).
, i , i , ii47 33 21 15 Review Properties, but test on them in Q4 when review again. 1. Which statement illustrates the symmetric property of equality? a. f 7 7i 9i, then 7 7i 9iI √x + 1 = 4 √x + 1 = 4 b. f 7 7i 9i, then 49i 7iI √x + 1 = 4 = 7√x + 1 c. f 7 7i 9i, and 49i 2 i, hen 7 7i 2 iI √x + 1 = 4 = 1 √x − 3 t √x + 1 = 1 √x − 3
d. f 7 7i 9i and 7 7i 5i, hen 49i 5iI √x + 1 = 4 √x + 1 − y = 3 t − y = − 3
2. Click and drag each selected property to the correct box. The steps used to simplify an expression are shown. Identify the missing property the justifies each step. 5i + 4(6 + 3i) GIVEN

form.
Textbook Lessons: Section 4.6 – Perform Operations with Complex Numbers – p275 Additional Lesson D – Powers of i – pA14 Section 1.1 – Apply Properties of Real Numbers – p2 Deleted AII.3 - Identification of field properties valid for the complex number (SOL and EKS) removed BUT application of the properties is still expected. Deleted AII.3 - EKS - Hierarchy of subsets of complex numbers.
(AII.3 moved to NEW AII.2)
5i + 24 – 12i _________ 24 + 5i + 12i_________ 24 + (5i + 12i)________ 24 + (5 + 12)i________ 24 + 17i SUBSTITUTION PROPERTY Associative Property of Addition Distributive Property Closure Property of Addition Identity Property of Addition Commutative Property of Addition Inverse Property of Addition
Unit 3 - Factoring (10 Days)
AII.1 The student, given rational, radical, or polynomial expressions, will d) factor polynomials completely.
(moved to AII.1c) The student will use problem solving, mathematical communication, mathematical reasoning, connections and representations to:
● Factor polynomials by applying general patterns including difference of squares, sum and difference of cubes, and perfect square trinomials.
Factor Complete factorization Conjugate Polynomial Sum of cubes Difference of cubes Perfect Square Trinomial Difference of Squares
● When is a polynomial completely factored? ● What are the patterns to investigate when factoring a
polynomial?
Examples *Grouping is the preferred method for factoring general trinomials. What is the complete factorization of each expression:
- Difference of squares:
- Sum of two cubes :
- Difference of two cubes:,

● Factor polynomials completely over the integers
● Verify polynomial identities, including the difference of square, sum and difference of cubes and perfect square trinomials.
Textbook Lessons: Section 4.3 – Solve x2 + bx + c = 0 by Factoring – p252 (review factoring trinomials and perfect square – do not solve) Section 4.4 – Solve ax2 + bx + c = 0 by Factoring – p259 (review factoring trinomials – do not solve) Section 5.4 – Factor and Solve Polynomial Equations – p353 (factor completely – do not solve) AII.1d - Factor Polynomials (moved to AII.1c) AII.1c EKS – Clarified that factoring polynomials should include those in one or two variables with no more than four terms over the set of integers with factors that are constant, linear, or quadratic.
- Perfect square trinomial:
- General trinomials: 1. Click and drag each selected factor into the box. Factor the following polynomial completely.
6x 6xy 0y1 2 − 3 − 1 2 2 4 6 8 10 (x + 5y) (2x – 5y) (2x – y) (4x + y) (4x + 5y) (8x – y)
Second Nine Weeks SOL Objectives Vocabulary Essential Questions & Examples
Unit 1 - Operations With Functions (9 Days)
AII.7 The student will investigate and analyze functions algebraically and graphically. Key concepts include g) inverse of a function; and (moves
to AII.7j) h) composition of multiple
functions. (moves to AII.7k) Graphing calculators will be used as
a tool to assist in investigation of functions. (moves to AII.7 EKS)
The student will use problem solving, mathematical communication, mathematical reasoning, connections and representations to:
● Find the inverse of a function.
● Graph the inverse of a function as a reflection across the line y = x.
● Find the composition of two functions.
● Use the composition of functions to verify two functions are inverses.
Textbook Lessons: Section 6.3 – Perform Function Operations and Composition – p428 Section 6.4 – Use Inverse Functions – p438
AII.7f - Determine values of a function for elements in its domain.
Inverse of a function Composition of functions
● What is the relationship between a function and its inverse?
● What operations can be performed on functions? ● What is meant by composition of functions? ● Which is more appropriate to use to determine the
value of a function? Graph or equation? When?
Examples
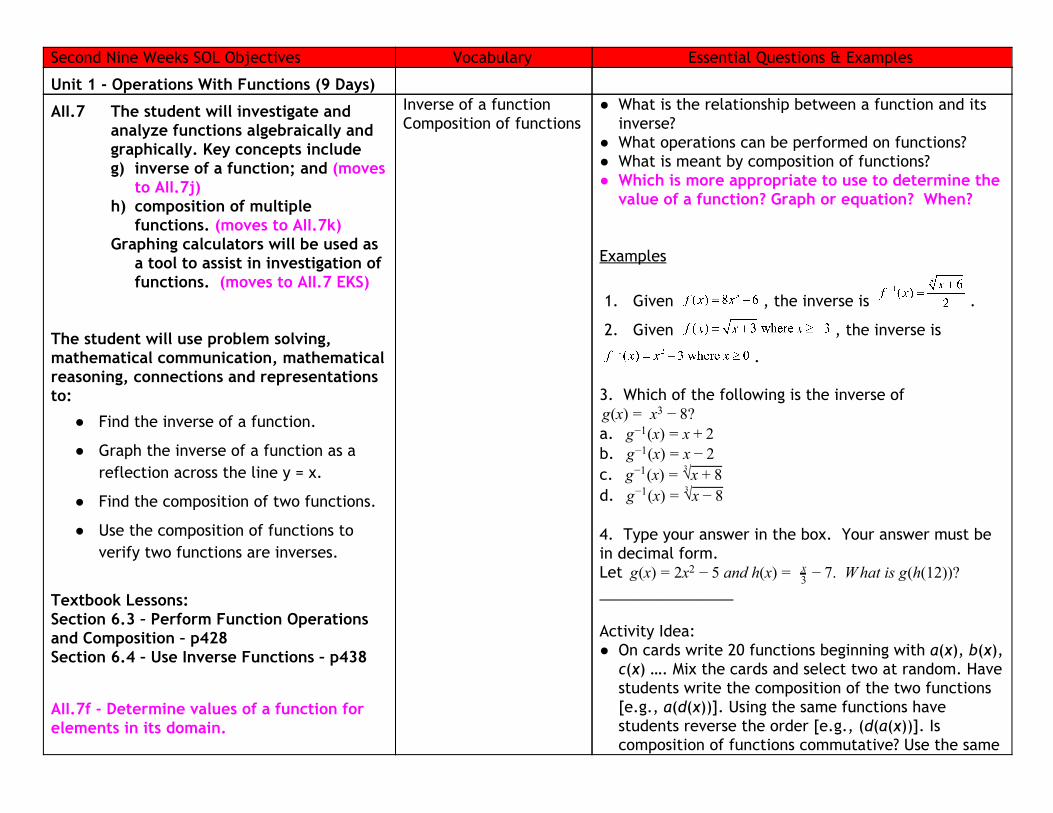
1. Given , the inverse is .
2. Given , the inverse is
. 3. Which of the following is the inverse of
(x) x ?g = 3 − 8 a. (x)g−1 = x + 2 b. (x)g−1 = x − 2 c. (x)g−1 = √3 x + 8 d. (x)g−1 = √3 x − 8 4. Type your answer in the box. Your answer must be in decimal form. Let (x) x and h(x) . What is g(h(12))?g = 2 2 − 5 = x3 − 7 ________________ Activity Idea: ● On cards write 20 functions beginning with a(x), b(x),
c(x) …. Mix the cards and select two at random. Have students write the composition of the two functions [e.g., a(d(x))]. Using the same functions have students reverse the order [e.g., (d(a(x))]. Is composition of functions commutative? Use the same

AII.7g - Make connections between and among multiple representation of a function.
Use of graphing calculator moves to AII.7 EKS
AII.7j EKS– Determine inverse of a function limited to linear, quadratic, cubic, square root, and cube root functions.
AII.7k EKS – Clarified that determining composition of functions includes both algebraic and graphical approaches.
AII.7 US – Clarified that solutions and intervals may be expressed in different formats, including set notation, using equations and inequalities, or interval notation.
cards and have students perform the four operations.
Unit 2 - Quadratics (11 Days - PreAP 13 include CTS)
AII.4 The student will solve, algebraically and graphically, b) quadratic equations over the set
of complex numbers;
(AII.4 moved to NEW AII.3) The student will use problem solving, mathematical communication, mathematical reasoning, connections and representations to:
● Solve a quadratic equation over the set
completing the square extraneous solution quadratic equation quadratic formula Root Imaginary root Solution Discriminant Real solution No solution
● What are the methods used to solve quadratic equations?
● How is the discriminant of a quadratic equation calculated and what is its significance?
● How does a graphing calculator confirm algebraic solutions of quadratic equation?
● What is a real-world example for a quadratic, absolute value, radical, or rational equation?
● When working with a real-world problem, how are solution(s) verified?
● What are the possible number of solutions for each type of equation?

of complex numbers using an appropriate strategy.
● Calculate the discriminant of a quadratic equation to determine the number of real and complex solutions.
● Recognize that the quadratic formula can be derived by applying the completion of squares to any quadratic equation in standard form. (moved to AII.3.US)
● Apply an appropriate equation to solve a real-world problem.
Textbook Lessons: Section 4.3 – Solve x2 + bx + c = 0 by Factoring – p252 (solve) Section 4.4 – Solve ax2 + bx + c = 0 by Factoring – p259 (solve) Section 4.5 – Solve Quadratic Equations by Finding Square Roots – p266 (solve) Section 4.7 – Complete the Square – p284 (Pre-AP only) Section 4.8 – Use the Quadratic Formula and the Discriminant – p292 Section 4.10 – Write Quadratic Functions and Models – p309 (use the QuadReg function on the calculator) (AII.4 moved to NEW AII.3) AII.3 US – Clarified that solutions and intervals may be expressed in different formats, including set notation, using equations and inequalities, or interval notation.
Empty set
● How does the graph of a quadratic with a positive, negative, or zero discriminant look?
Examples 1. Click on the correct answer. What is the solution set to 6 x?x2 = 1 − 4
±4}{ 2±2 }{ √5 2±2i }{ √3 − ±2 }{ 2 √5 − ±2i }{ 2 √3
2. The graph of g(x) is shown. What appears to be a solution of g(x) = 0? a. -3 b. -1 c. 0 d. 3
3. A solution to a quadratic equation is .3 1i1 − 1 √7 Which of the following must also be a solution to the equation?
3 1i− 1 − 1 √7 3 1i− 1 + 1 √7
3 1i1 − 1 √7

3 1i1 + 1 √7
AII.6 The student will recognize the general shape of function and will convert between graphic and symbolic forms of functions. A transformational approach to graphing will be employed. USE QUADRATIC,
The student will use problem solving, mathematical communication, mathematical reasoning, connections and representations to:
● Recognize graphs of parent functions.
● Given a transformation of a parent function, identify the graph of the transformed function.
● Given the equation and using a transformational approach, graph a function.
● Given the graph of a function, identify the parent function.
● Given the graph of a function, identify the transformations that map the preimage to the image in order to determine the equation of the image.
● Using a transformational approach, write the equation of a function given its graph.
Transformation Translation Reflection Dilation Parent function/anchor graph Preimage Quadratic function
● What are different representations of functions? ● What is the transformational approach to graphing? ● What is the connection between the algebraic and
graphical representation of a transformation? ● How can the calculator be used to investigate the
quadratic function
Examples 1. Given . What is the vertex of the(x)f = (x )− 4 2 − 1 graph for this function? a. (-4, -1) b. (-4, 1) c. (4, -1) d. (4, 1)
2. The parent function is given Write the new equation for the graph, if it is translated to the left 5 units and up 2 units.
Textbook Lessons:
Section 4.1 – Graph Quadratic Functions in Standard Form – p236 Graphing Calculator Activity 4.1 – Finding Maximum and Minimum Values – p244 Section 4.1 – Graph quadratic Functions in Vertex or Intercept Form – p245
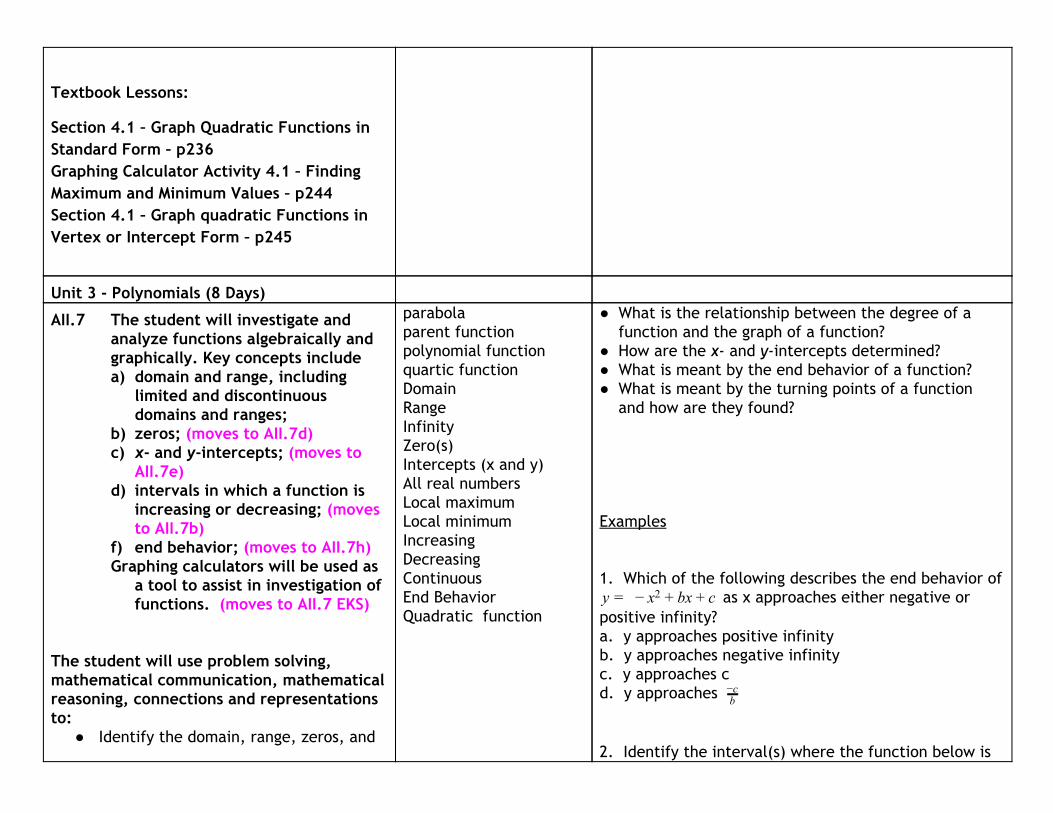
Unit 3 - Polynomials (8 Days)
AII.7 The student will investigate and analyze functions algebraically and graphically. Key concepts include a) domain and range, including
limited and discontinuous domains and ranges;
b) zeros; (moves to AII.7d) c) x- and y-intercepts; (moves to
AII.7e) d) intervals in which a function is
increasing or decreasing; (moves to AII.7b)
f) end behavior; (moves to AII.7h) Graphing calculators will be used as
a tool to assist in investigation of functions. (moves to AII.7 EKS)
The student will use problem solving, mathematical communication, mathematical reasoning, connections and representations to:
● Identify the domain, range, zeros, and
parabola parent function polynomial function quartic function Domain Range Infinity Zero(s) Intercepts (x and y) All real numbers Local maximum Local minimum Increasing Decreasing Continuous End Behavior Quadratic function
● What is the relationship between the degree of a function and the graph of a function?
● How are the x- and y-intercepts determined? ● What is meant by the end behavior of a function? ● What is meant by the turning points of a function
and how are they found?
Examples 1. Which of the following describes the end behavior of
as x approaches either negative orxy = − x2 + b + c positive infinity? a. y approaches positive infinity b. y approaches negative infinity c. y approaches c d. y approaches b
−c 2. Identify the interval(s) where the function below is

intercepts of a function presented algebraically or graphically.
● Describe restricted/discontinuous domains and ranges.
● Given the graph of a function, identify intervals on which the function is increasing and decreasing.
● Describe the end behavior of a function.
Textbook Lessons: Section 5.2 – Evaluate and Graph Polynomial
Functions p337
AII.7a - Analyze the continuity of functions
AII.7c - Determine the extrema of a function
AII.7 US – Clarified that solutions and intervals may be expressed in different formats, including set notation, using equations and inequalities, or interval notation.
AII.7a,d,e EKS – Clarified that examples for identifying domain, range, zeros, and intercepts should include graphs with discontinuities.
AII.7b EKS – Identify intervals on which the function is increasing or decreasing limited to linear, quadratic, absolute value, square root, cube root, polynomial, exponential, and logarithmic functions.
only decreasing. Choose all correct answers.
A. B. C. D.
E. Activity Idea: ● On cards write 20 functions beginning with a(x), b(x),
c(x) …. Mix the cards and select two at random. Have students write the composition of the two functions [e.g., a(d(x))]. Using the same functions have students reverse the order [e.g., (d(a(x))]. Is composition of functions commutative? Use the same cards and have students perform the four operations.
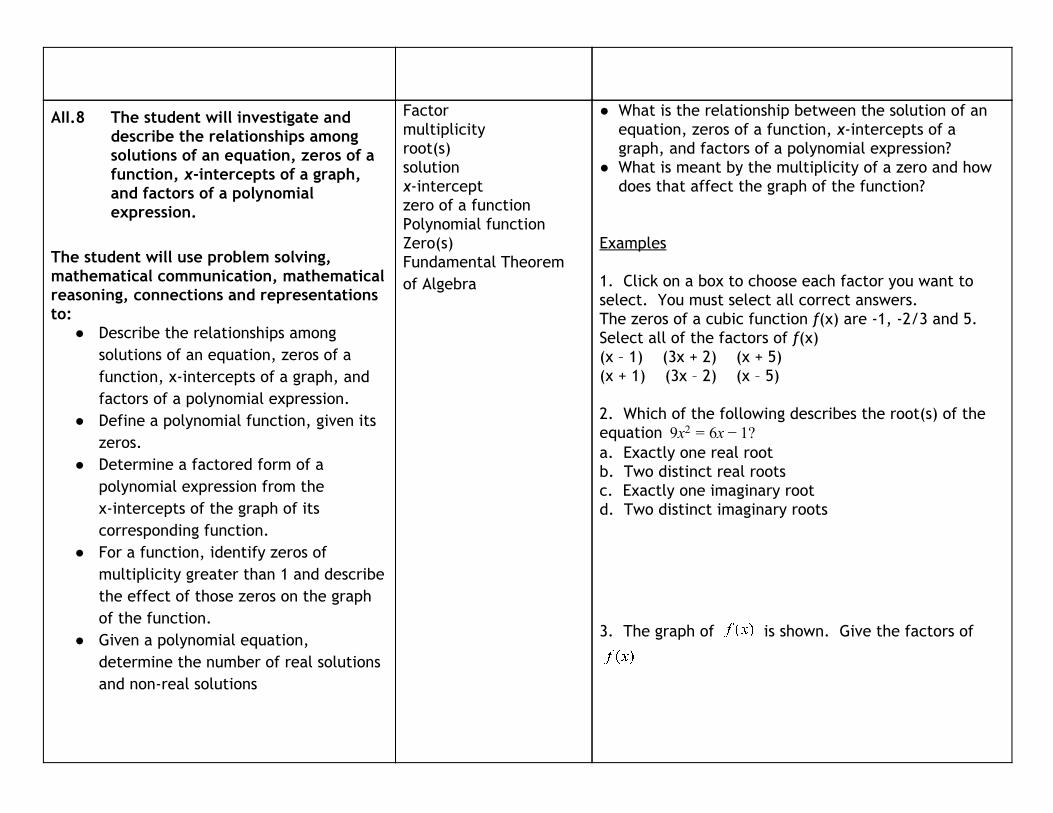
AII.8 The student will investigate and describe the relationships among solutions of an equation, zeros of a function, x-intercepts of a graph, and factors of a polynomial expression.
The student will use problem solving, mathematical communication, mathematical reasoning, connections and representations to:
● Describe the relationships among solutions of an equation, zeros of a function, x-intercepts of a graph, and factors of a polynomial expression.
● Define a polynomial function, given its zeros.
● Determine a factored form of a polynomial expression from the x-intercepts of the graph of its corresponding function.
● For a function, identify zeros of multiplicity greater than 1 and describe the effect of those zeros on the graph of the function.
● Given a polynomial equation, determine the number of real solutions and non-real solutions
Factor multiplicity root(s) solution x-intercept zero of a function Polynomial function Zero(s) Fundamental Theorem of Algebra
● What is the relationship between the solution of an equation, zeros of a function, x-intercepts of a graph, and factors of a polynomial expression?
● What is meant by the multiplicity of a zero and how does that affect the graph of the function?
Examples 1. Click on a box to choose each factor you want to select. You must select all correct answers. The zeros of a cubic function f(x) are -1, -2/3 and 5. Select all of the factors of f(x) (x – 1) (3x + 2) (x + 5) (x + 1) (3x – 2) (x – 5) 2. Which of the following describes the root(s) of the equation x x ?9 2 = 6 − 1 a. Exactly one real root b. Two distinct real roots c. Exactly one imaginary root d. Two distinct imaginary roots
3. The graph of is shown. Give the factors of
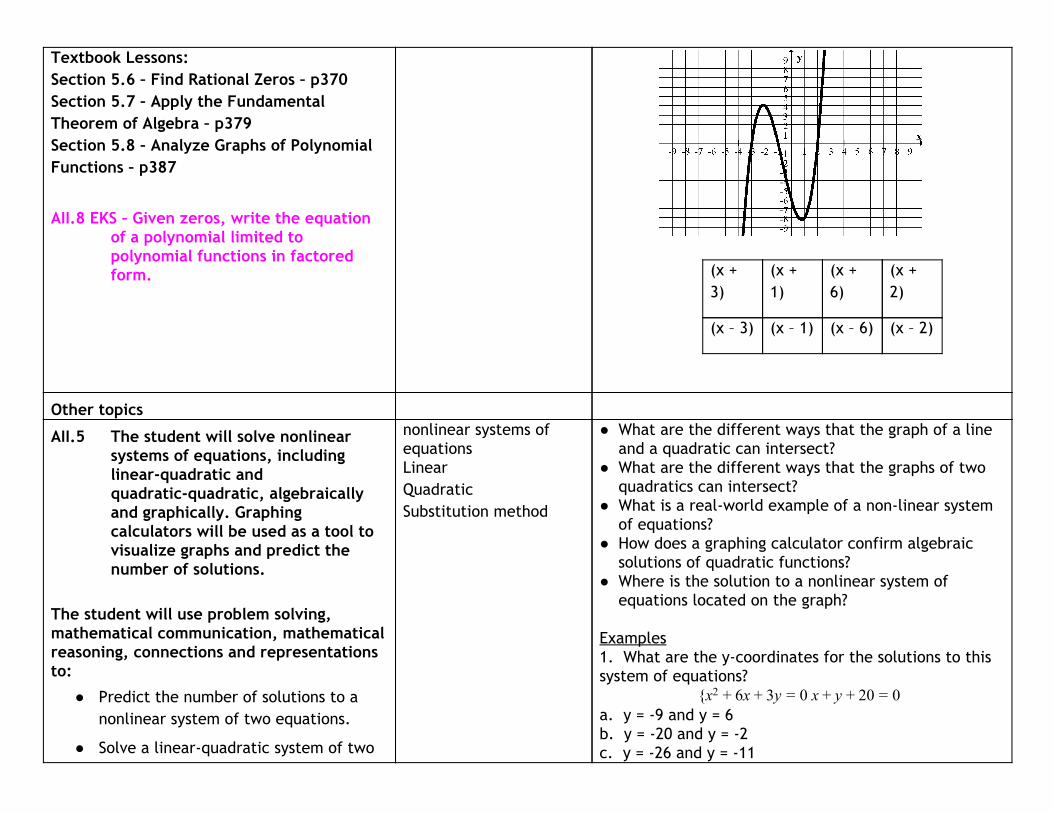
Textbook Lessons: Section 5.6 – Find Rational Zeros – p370 Section 5.7 – Apply the Fundamental Theorem of Algebra – p379 Section 5.8 – Analyze Graphs of Polynomial Functions – p387
AII.8 EKS – Given zeros, write the equation of a polynomial limited to polynomial functions in factored form.
(x + 3)
(x + 1)
(x + 6)
(x + 2)
(x – 3) (x – 1) (x – 6) (x – 2)
Other topics
AII.5 The student will solve nonlinear systems of equations, including linear-quadratic and quadratic-quadratic, algebraically and graphically. Graphing calculators will be used as a tool to visualize graphs and predict the number of solutions.
The student will use problem solving, mathematical communication, mathematical reasoning, connections and representations to:
● Predict the number of solutions to a nonlinear system of two equations.
● Solve a linear-quadratic system of two
nonlinear systems of equations Linear Quadratic Substitution method
● What are the different ways that the graph of a line and a quadratic can intersect?
● What are the different ways that the graphs of two quadratics can intersect?
● What is a real-world example of a non-linear system of equations?
● How does a graphing calculator confirm algebraic solutions of quadratic functions?
● Where is the solution to a nonlinear system of equations located on the graph?
Examples 1. What are the y-coordinates for the solutions to this system of equations?
x x y x 0 { 2 + 6 + 3 = 0 + y + 2 = 0 a. y = -9 and y = 6 b. y = -20 and y = -2 c. y = -26 and y = -11
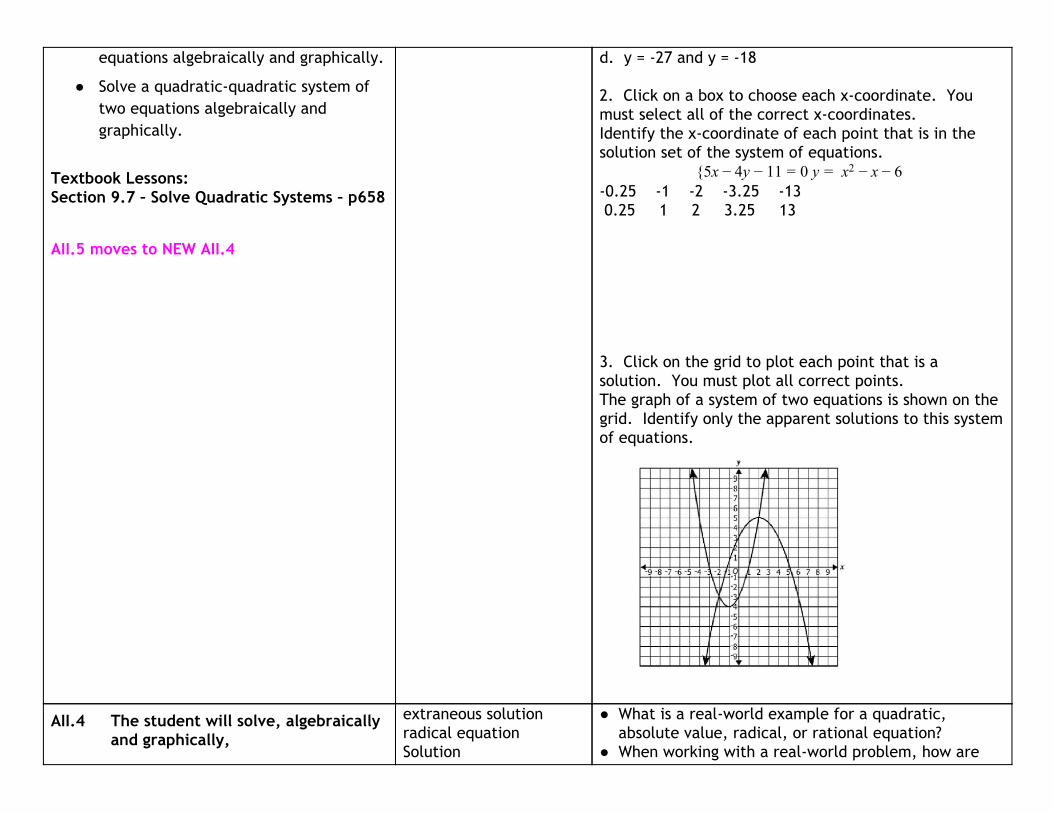
equations algebraically and graphically.
● Solve a quadratic-quadratic system of two equations algebraically and graphically.
Textbook Lessons: Section 9.7 – Solve Quadratic Systems – p658
AII.5 moves to NEW AII.4
d. y = -27 and y = -18 2. Click on a box to choose each x-coordinate. You must select all of the correct x-coordinates. Identify the x-coordinate of each point that is in the solution set of the system of equations.
5x y 1 y x { − 4 − 1 = 0 = 2 − x − 6 -0.25 -1 -2 -3.25 -13 0.25 1 2 3.25 13 3. Click on the grid to plot each point that is a solution. You must plot all correct points. The graph of a system of two equations is shown on the grid. Identify only the apparent solutions to this system of equations.
AII.4 The student will solve, algebraically and graphically,
extraneous solution radical equation Solution
● What is a real-world example for a quadratic, absolute value, radical, or rational equation?
● When working with a real-world problem, how are

d) equations containing radical expressions.
The student will use problem solving, mathematical communication, mathematical reasoning, connections and representations to:
● Solve an equation containing a radical expression algebraically and graphically.
● Verify possible solutions to an equation containing rational or radical expressions.
● Apply an appropriate equation to solve a real-world problem.
Textbook Lessons: Section 6.6 – Solve Radical Equations – p452 AII4 moves to NEW AII.3 AII.3 US – Clarified that solutions and intervals may be expressed in different formats, including set notation, using equations and inequalities, or interval notation.
Real solution No solution Empty set
solution(s) verified? ● How is an equation containing radical expressions
solved?
Examples

Third Nine Weeks SOL Objectives Vocabulary Essential Questions & Examples
Unit 1 - Sequence and Series (10 Days)
AII.2 The student will investigate and apply the properties of arithmetic and geometric sequences and series to solve real-world problems, including writing the first n terms, finding the nth term, and evaluating summation formulas. Notation will include Σ and an.
(AII.2 Moved to Functions Strand as AII.5) The student will use problem solving, mathematical communication, mathematical reasoning, connections and representations to:
● Distinguish between a sequence and a series.
● Generalize patterns in a sequence using explicit and recursive formulas.
● Use and interpret the notation: Σ, n, nth term, and .
● Given the formula, find (the nth term) for an arithmetic or a geometric sequence.
● Given formulas, write the first n terms
and find the sum, , of the first n terms of an arithmetic or geometric series.
● Given the formula, find the sum of a convergent infinite series.
● Model real-world situations using sequences and series.
Textbook Lessons: Section 12.1 – Define and Use Sequences and Series – p794
Common difference Common ratio Term arithmetic sequence explicit formula geometric sequence recursive formula sequence series sigma notation (summation notation)
● What is the difference between a series and a sequence?
● What is the difference between arithmetic and geometric sequences and series?
● What is Sigma notation (Σ)? ● What real-world situations use sequences and series? Examples 1. What is the 14th term of the arithmetic sequence with a first term of 7 and a common difference of 10? A. 130 B. 137 C. 147 D. 221 2. What is the sum of this infinite series?
3. What is the value of
A. 14,550 B. 17,800 C. 13, 450 D. 15,550
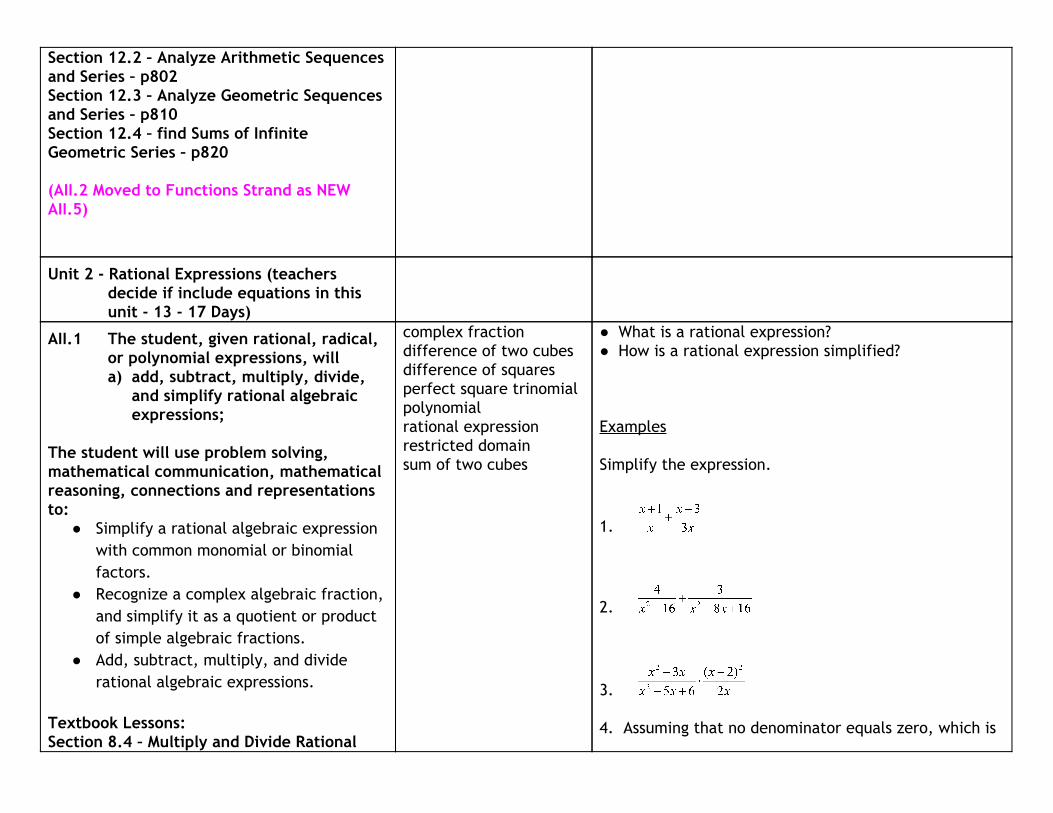
Section 12.2 – Analyze Arithmetic Sequences and Series – p802 Section 12.3 – Analyze Geometric Sequences and Series – p810 Section 12.4 – find Sums of Infinite Geometric Series – p820 (AII.2 Moved to Functions Strand as NEW AII.5)
Unit 2 - Rational Expressions (teachers decide if include equations in this unit - 13 - 17 Days)
AII.1 The student, given rational, radical, or polynomial expressions, will a) add, subtract, multiply, divide,
and simplify rational algebraic expressions;
The student will use problem solving, mathematical communication, mathematical reasoning, connections and representations to:
● Simplify a rational algebraic expression with common monomial or binomial factors.
● Recognize a complex algebraic fraction, and simplify it as a quotient or product of simple algebraic fractions.
● Add, subtract, multiply, and divide rational algebraic expressions.
Textbook Lessons: Section 8.4 – Multiply and Divide Rational
complex fraction difference of two cubes difference of squares perfect square trinomial polynomial rational expression restricted domain sum of two cubes
● What is a rational expression? ● How is a rational expression simplified? Examples Simplify the expression.
1.
2.
3. 4. Assuming that no denominator equals zero, which is
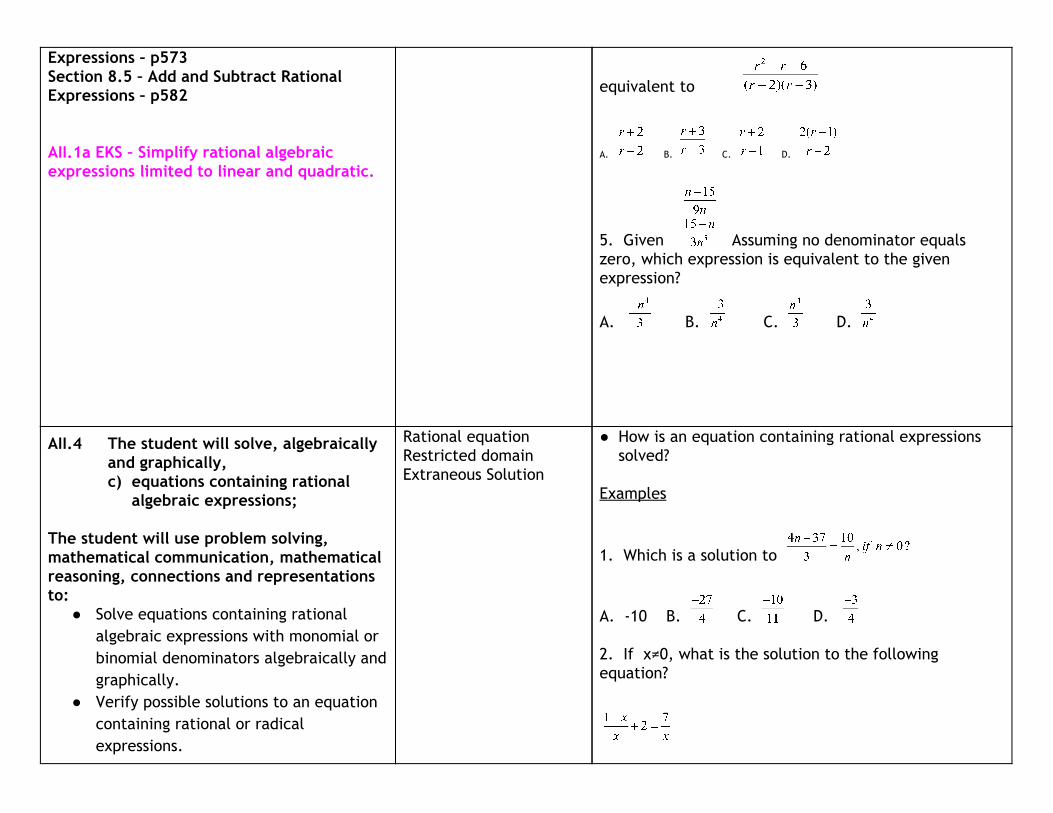
Expressions – p573 Section 8.5 – Add and Subtract Rational Expressions – p582 AII.1a EKS – Simplify rational algebraic expressions limited to linear and quadratic.
equivalent to
A. B. C. D.
5. Given Assuming no denominator equals zero, which expression is equivalent to the given expression?
A. B. C. D.
AII.4 The student will solve, algebraically and graphically, c) equations containing rational
algebraic expressions;
The student will use problem solving, mathematical communication, mathematical reasoning, connections and representations to:
● Solve equations containing rational algebraic expressions with monomial or binomial denominators algebraically and graphically.
● Verify possible solutions to an equation containing rational or radical expressions.
Rational equation Restricted domain Extraneous Solution
● How is an equation containing rational expressions solved?
Examples
1. Which is a solution to
A. -10 B. C. D. 2. If x≠0, what is the solution to the following equation?
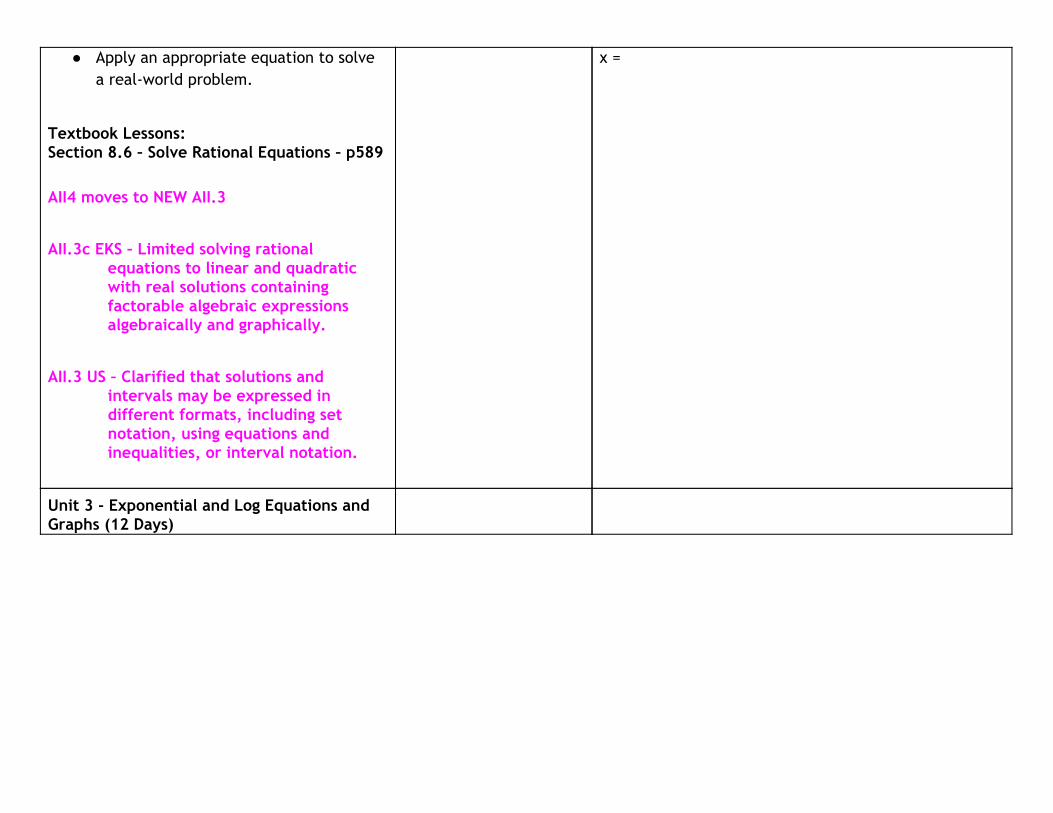
● Apply an appropriate equation to solve a real-world problem.
Textbook Lessons: Section 8.6 – Solve Rational Equations – p589
AII4 moves to NEW AII.3
AII.3c EKS – Limited solving rational equations to linear and quadratic with real solutions containing factorable algebraic expressions algebraically and graphically.
AII.3 US – Clarified that solutions and intervals may be expressed in different formats, including set notation, using equations and inequalities, or interval notation.
x =
Unit 3 - Exponential and Log Equations and Graphs (12 Days)
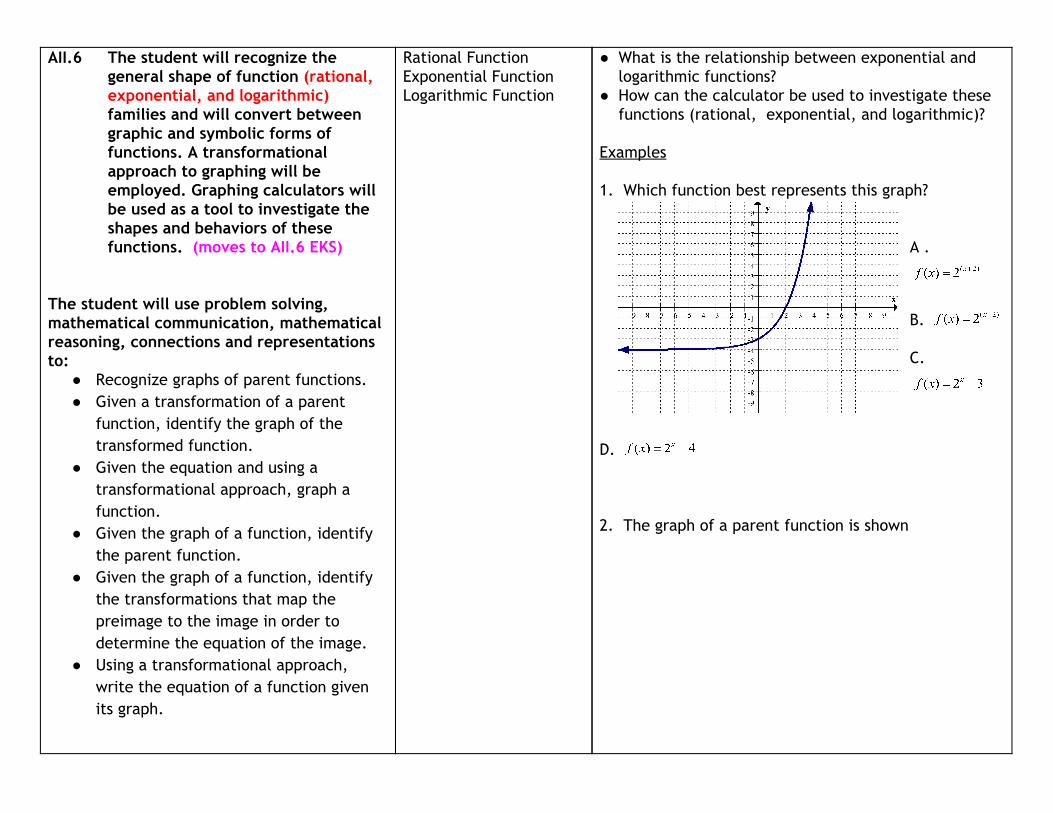
AII.6 The student will recognize the general shape of function (rational, exponential, and logarithmic) families and will convert between graphic and symbolic forms of functions. A transformational approach to graphing will be employed. Graphing calculators will be used as a tool to investigate the shapes and behaviors of these functions. (moves to AII.6 EKS)
The student will use problem solving, mathematical communication, mathematical reasoning, connections and representations to:
● Recognize graphs of parent functions. ● Given a transformation of a parent
function, identify the graph of the transformed function.
● Given the equation and using a transformational approach, graph a function.
● Given the graph of a function, identify the parent function.
● Given the graph of a function, identify the transformations that map the preimage to the image in order to determine the equation of the image.
● Using a transformational approach, write the equation of a function given its graph.
Rational Function Exponential Function Logarithmic Function
● What is the relationship between exponential and logarithmic functions?
● How can the calculator be used to investigate these functions (rational, exponential, and logarithmic)?
Examples 1. Which function best represents this graph? A .
B. C.
D. 2. The graph of a parent function is shown

Textbook Lessons: Section 7.1 – Graph Exponential Growth Functions – p478 Section 7.2 – Graph Exponential Decay Functions – p486 Section 7.3 – Use Functions Involving e – p492 Section 7.4 – Evaluate Logarithms and Graph Logarithmic Functions – p499 Section 7.7 – Write and apply Exponential and Power Functions – p529 Section 8.2 – Graph Simple Rational Functions – p558 Section 8.3 – Graph General Rational Functions – p565
AII.6b EKS – Transform exponential and logarithmic functions (given a graph) limited to single transformations.
Which function belongs to this same family?
A. B.
C. D.
AII.7 The student will investigate and analyze functions algebraically and graphically. Key concepts include a) domain and range, including
limited and discontinuous domains and ranges;
b) zeros; (Moves to AII.7 b) c) x- and y-intercepts; (moves to
AII.7e) d) intervals in which a function is
increasing or decreasing; (moves to AII.7b)
e) asymptotes; (moves to AII.7i) f) end behavior; (moves to AII.7h) g) inverse of a function (moves to AII.7j)
Asymptotes parent function Domain Range Infinity Zero(s) Intercepts (x and y) All real numbers Increasing Decreasing Continuous End Behavior Rational Function Exponential Function Logarithmic Function
● What is an asymptote? ● What role do asymptotes have in graphing functions? ● What is meant by the end behavior of a function? ● How are the x- and y-intercepts determined?
Examples
1. Which number is a zero of
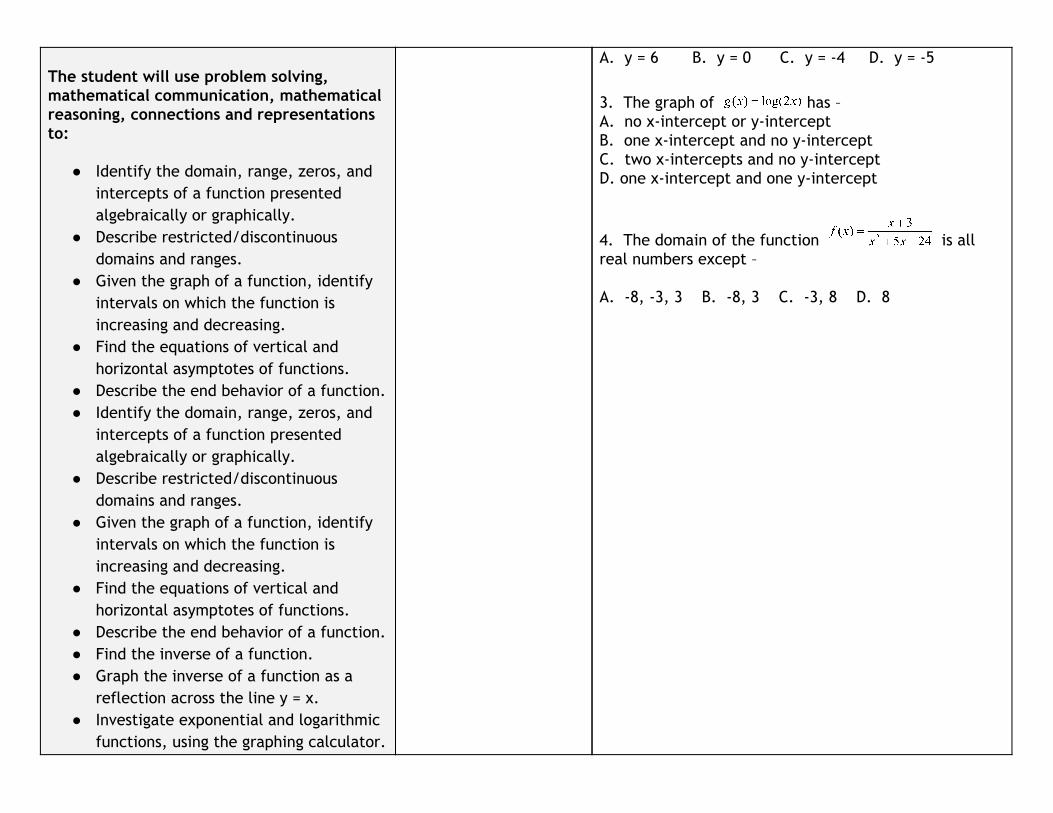
A. B. C. D. 2. What is the equation of the horizontal asymptote of the graph of the following equation?
The student will use problem solving, mathematical communication, mathematical reasoning, connections and representations to:
● Identify the domain, range, zeros, and intercepts of a function presented algebraically or graphically.
● Describe restricted/discontinuous domains and ranges.
● Given the graph of a function, identify intervals on which the function is increasing and decreasing.
● Find the equations of vertical and horizontal asymptotes of functions.
● Describe the end behavior of a function. ● Identify the domain, range, zeros, and
intercepts of a function presented algebraically or graphically.
● Describe restricted/discontinuous domains and ranges.
● Given the graph of a function, identify intervals on which the function is increasing and decreasing.
● Find the equations of vertical and horizontal asymptotes of functions.
● Describe the end behavior of a function. ● Find the inverse of a function. ● Graph the inverse of a function as a
reflection across the line y = x. ● Investigate exponential and logarithmic
functions, using the graphing calculator.
A. y = 6 B. y = 0 C. y = -4 D. y = -5
3. The graph of has – A. no x-intercept or y-intercept B. one x-intercept and no y-intercept C. two x-intercepts and no y-intercept D. one x-intercept and one y-intercept
4. The domain of the function is all real numbers except – A. -8, -3, 3 B. -8, 3 C. -3, 8 D. 8

● Convert between logarithmic and exponential forms of an equation with bases consisting of natural numbers.
Textbook Lessons: Section 7.2 – Graph Exponential Decay Functions – p486 Section 7.4 – Evaluate Logarithms and Graph Logarithmic Functions – p499 Delete AII.7 EKS - Convert between logarithmic and exponential forms of an equations. AII.7 US – Clarified that solutions and intervals may be expressed in different formats, including set notation, using equations and inequalities, or interval notation. AII.7a,d,e EKS – Clarified that examples for identifying domain, range, zeros, and intercepts should include graphs with discontinuities. AII.7b EKS – Identify intervals on which the function is increasing or decreasing limited to linear, quadratic, absolute value, square root, cube root, polynomial, exponential, and logarithmic functions. AII.7i EKS – Determine equations of vertical and horizontal asymptotes limited to rational, exponential, and logarithmic functions.

AII.7j EKS– Determine inverse of a function limited to linear, quadratic, cubic, square root, and cube root functions. Other Topics (tested in Q4 with variation and properties)
AII.9 The student will collect and analyze data, determine the equation of the curve of best fit, make predictions, and solve real-world problems, using mathematical models. Mathematical models will include polynomial, exponential, and logarithmic functions.
The student will use problem solving, mathematical communication, mathematical reasoning, connections and representations to:
● Collect and analyze data. ● Investigate scatterplots to determine if
patterns exist and then identify the patterns.
● Find an equation for the curve of best fit for data, using a graphing calculator. Models will include polynomial, quadratic and exponential, and logarithmic functions.
● Make predictions, using data, scatterplots, or the equation of the curve of best fit.
Textbook Lessons: Section 2.6 – Draw Scatter Plots and
curve of best fit mathematical model scatterplot Data Prediction Polynomial Coefficient Function Exponential Logarithmic Quadratic
● How do various algebraic equations fit real world data?
● How can the curve-of-best-fit help predict trends of data?
● How are the equations-of-best-fit determined on a graphing calculator?
Examples 1. Madison deposited $1,000 into a savings account that compounds interest yearly. After her initial deposit, Madison did not withdraw or deposit any money from this account. The table below shows the amount in her savings account over a period of years.
Amount in Savings Account Number of Years After the Deposit
Amount in Savings
2 $1,123.60 4 $1,262.48 6 $1,418.52 8 $1,593.85 10 $1,790.85
Using the exponential curve of best fit, which is closest to the expected amount in the savings account 30 years after the time Madison deposited the initial $1,000? A. $2,854 B. $3,291 C. $5,743 D. $16,854
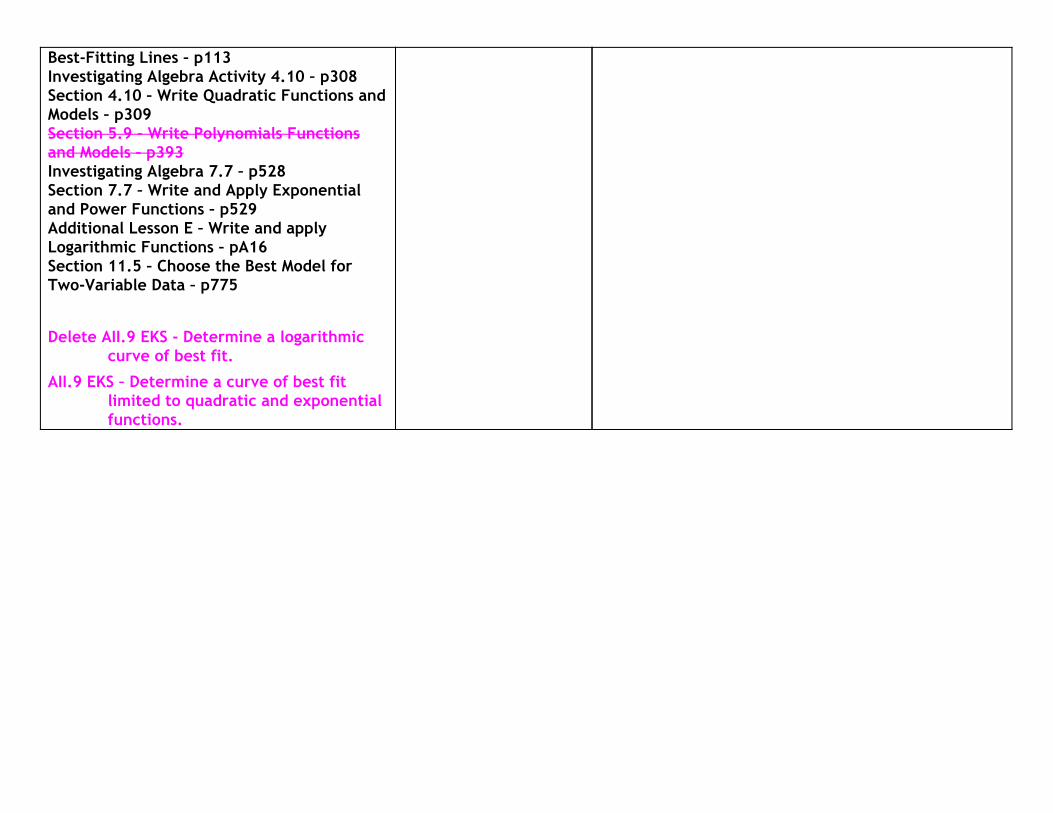
Best-Fitting Lines – p113 Investigating Algebra Activity 4.10 – p308 Section 4.10 – Write Quadratic Functions and Models – p309 Section 5.9 – Write Polynomials Functions and Models – p393 Investigating Algebra 7.7 – p528 Section 7.7 – Write and Apply Exponential and Power Functions – p529 Additional Lesson E – Write and apply Logarithmic Functions – pA16 Section 11.5 – Choose the Best Model for Two-Variable Data – p775
Delete AII.9 EKS - Determine a logarithmic curve of best fit.
AII.9 EKS – Determine a curve of best fit limited to quadratic and exponential functions.

Fourth Nine Weeks SOL Objectives Vocabulary Essential Questions & Examples
Unit 1 - Statistics (13 Days)
AII.11 The student will identify properties of a normal distribution and apply those properties to determine probabilities associated with areas under the standard normal curve.
The student will use problem solving, mathematical communication, mathematical reasoning, connections and representations to:
● Identify the properties of a normal probability distribution.
● Describe how the standard deviation and the mean affect the graph of the normal distribution.
● Compare two sets of normally distributed data using a standard normal distribution and z-scores.
● Represent probability as area under the curve of a standard normal probability distribution.
● Use the graphing calculator or a standard normal probability table to determine probabilities or percentiles based on z-scores.
Textbook Lessons: Section 11.3 – Use Normal Distribution – P757 AII.11 EKS – Interpret variation, standard
area under a curve mean normal distribution curve normal probability distribution percentile population standard deviation standard normal curve z-score symmetric data set probability spread
● What is a normal distribution curve and how is the graph constructed?
● How can the amount of data that lies within 1, 2, 3, or k standard deviations of the mean be found?
● How does the standard normal distribution curve correspond to probability?
● How can the area under the standard normal curve be found?
● How is a standard normal probability table used and applied in problem solving?
Examples 1. The heights of a large population of ostriches are normally distributed. Which is closest to the percentage of these heights that is within 3 standard deviations of the mean? A. 0.3% B. 5% C. 95% D. 99.7% 2. A normally distributed data set of 500 values has a mean of 35 and a standard deviation of 7. Which is closest to the probability that a value in the data set will fall between 42 and 46? A. 0.04 B. 0.10 C. 10 D. 50
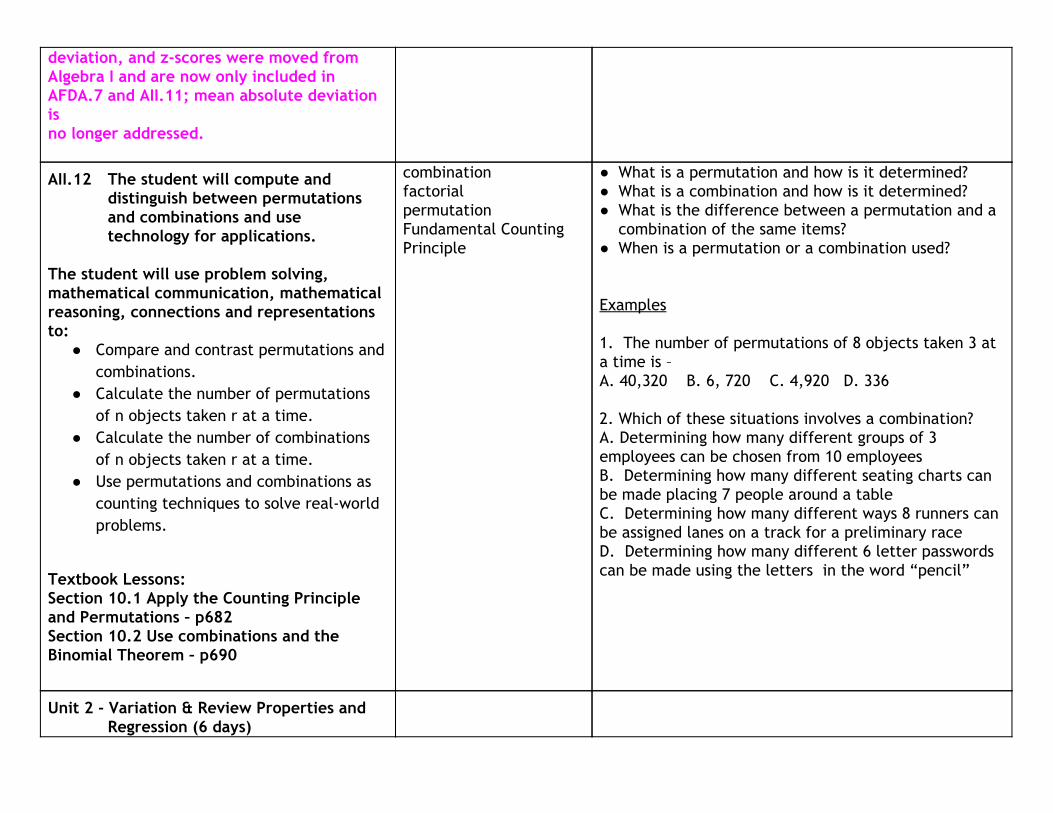
deviation, and z-scores were moved from Algebra I and are now only included in AFDA.7 and AII.11; mean absolute deviation is no longer addressed.
AII.12 The student will compute and distinguish between permutations and combinations and use technology for applications.
The student will use problem solving, mathematical communication, mathematical reasoning, connections and representations to:
● Compare and contrast permutations and combinations.
● Calculate the number of permutations of n objects taken r at a time.
● Calculate the number of combinations of n objects taken r at a time.
● Use permutations and combinations as counting techniques to solve real-world problems.
Textbook Lessons: Section 10.1 Apply the Counting Principle and Permutations – p682 Section 10.2 Use combinations and the Binomial Theorem – p690
combination factorial permutation Fundamental Counting Principle
● What is a permutation and how is it determined? ● What is a combination and how is it determined? ● What is the difference between a permutation and a
combination of the same items? ● When is a permutation or a combination used?
Examples 1. The number of permutations of 8 objects taken 3 at a time is – A. 40,320 B. 6, 720 C. 4,920 D. 336 2. Which of these situations involves a combination? A. Determining how many different groups of 3 employees can be chosen from 10 employees B. Determining how many different seating charts can be made placing 7 people around a table C. Determining how many different ways 8 runners can be assigned lanes on a track for a preliminary race D. Determining how many different 6 letter passwords can be made using the letters in the word “pencil”
Unit 2 - Variation & Review Properties and Regression (6 days)
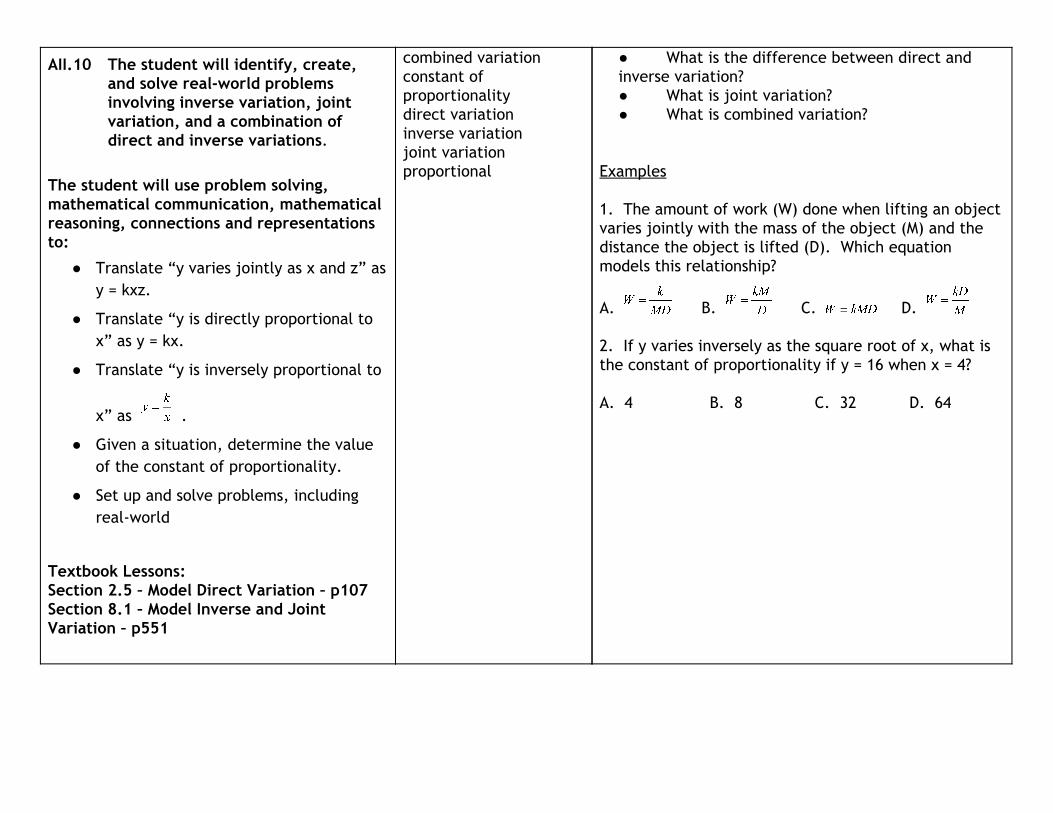
AII.10 The student will identify, create, and solve real-world problems involving inverse variation, joint variation, and a combination of direct and inverse variations.
The student will use problem solving, mathematical communication, mathematical reasoning, connections and representations to:
● Translate “y varies jointly as x and z” as y = kxz.
● Translate “y is directly proportional to x” as y = kx.
● Translate “y is inversely proportional to
x” as .
● Given a situation, determine the value of the constant of proportionality.
● Set up and solve problems, including real-world
Textbook Lessons: Section 2.5 – Model Direct Variation – p107 Section 8.1 – Model Inverse and Joint Variation – p551
combined variation constant of proportionality direct variation inverse variation joint variation proportional
● What is the difference between direct and inverse variation? ● What is joint variation? ● What is combined variation?
Examples 1. The amount of work (W) done when lifting an object varies jointly with the mass of the object (M) and the distance the object is lifted (D). Which equation models this relationship?
A. B. C. D. 2. If y varies inversely as the square root of x, what is the constant of proportionality if y = 16 when x = 4? A. 4 B. 8 C. 32 D. 64

AII.3 The student will perform operations on complex numbers, express the results in simplest form using patterns of the powers of i, and identify field properties that are valid for the complex numbers.
(AII.3 moved to NEW AII.2) The student will use problem solving, mathematical communication, mathematical reasoning, connections and representations to:
● Determine which field properties apply to the complex number system.
● Place the following sets of numbers in a hierarchy of subsets: complex, pure imaginary, real, rational, irrational, integers, whole, and natural.
Textbook Lessons: Section 1.1 – Apply Properties of Real Numbers – p2 Deleted AII.3 - Identification of field properties valid for the complex number (SOL and EKS) removed BUT application of the properties is still expected. Deleted AII.3 - EKS - Hierarchy of subsets of complex numbers.
(AII.3 moved to NEW AII.2)
Complex number Subset Hierarchy Real number Field property Imaginary number Pure imaginary number Distributive Property Associative Property Commutative Property Reflexive Property Symmetric Property Identity Property
● How are real, imaginary, and complex numbers related?
● What properties extend from the real numbers to the complex numbers?
● What is the relationship between a complex number and its conjugate?
● What are the patterns of the powers of i?
Examples Review Properties, but test on them in Q4 when review again. 1. Which statement illustrates the symmetric property of equality? a. f 7 7i 9i, then 7 7i 9iI √x + 1 = 4 √x + 1 = 4 b. f 7 7i 9i, then 49i 7iI √x + 1 = 4 = 7√x + 1 c. f 7 7i 9i, and 49i 2 i, hen 7 7i 2I √x + 1 = 4 = 1 √x − 3 t √x + 1 = 1 √x −
d. f 7 7i 9i and 7 7i 5i, hen 49i 5iI √x + 1 = 4 √x + 1 − y = 3 t − y = − 3
2. Click and drag each selected property to the correct box. The steps used to simplify an expression are shown. Identify the missing property the justifies each step. 5i + 4(6 + 3i) GIVEN 5i + 24 – 12i _________ 24 + 5i + 12i_________ 24 + (5i + 12i)________ 24 + (5 + 12)i________ 24 + 17i SUBSTITUTION PROPERTY Associative Property of Addition Distributive Property Closure Property of Addition Identity Property of Addition
Commutative Property of Addition Inverse Property of Addition
SOL REVIEW (13 - 15 Days)
Additional Topics after the SOL test