algebris ucits funds plc (an investment company with
TRANSCRIPT
ALGEBRIS UCITS FUNDS PLC
(an investment company with variable capital incorporated with limited liability in Ireland with
registered number 509801 and established as an umbrella fund with segregated liability
between Sub-Funds)
INTERIM REPORT AND UNAUDITED CONDENSED FINANCIAL STATEMENTS
FOR THE PERIOD FROM 1 JANUARY 2020 TO 30 JUNE 2020

ALGEBRIS UCITS FUNDS PLC
Contents
1
Management and Administration 2-3
Investment Manager’s Report
4-11
Unaudited Statement of Financial Position 12-15
Unaudited Statement of Comprehensive Income 16-23
Unaudited Statement of Changes in Net Assets Attributable to Holders of Redeemable
Participating Shares 24-27
Unaudited Statement of Cash Flows 28-31
Notes to the Unaudited Financial Statements 32-84
Unaudited Schedule of Investments 85-154
Unaudited Schedule of Significant Changes in Investments 155-167
Other Additional Disclosures 168-179

ALGEBRIS UCITS FUNDS PLC
Management and Administration
2
Registered Office 33 Sir John Rogerson’s Quay
Dublin 2
Ireland
Directors* Alexander Lasagna
Carl O’Sullivan**
Desmond Quigley**
Investment Manager, Distributor
and Promoter
Algebris (UK) Limited
1 St James’s Market
London
SW1Y 4AH
United Kingdom
Sub Investment Managers Algebris Investments (Asia) Pte Limited
9 Straits View
#05-08 Marina One West Tower
Singapore 018937
Algebris Investments (US) Inc.
1209 Orange Street
Wilmington
New Castle County
Delaware 19801
USA
Depositary HSBC France, Dublin Branch
1 Grand Canal Square
Grand Canal Harbour
Dublin 2
Ireland
Administrator, Registrar and
Transfer Agent
HSBC Securities Services (Ireland) DAC
1 Grand Canal Square
Grand Canal Harbour
Dublin 2
Ireland
Independent Auditor
KPMG
1 Harbourmaster Place
IFSC
Dublin 1
Ireland
Legal Adviser Dillon Eustace
33 Sir John Rogerson’s Quay
Dublin 2
Ireland
ALGEBRIS UCITS FUNDS PLC
Management and Administration (continued)
3
Company Secretary Tudor Trust Limited
33 Sir John Rogerson’s Quay
Dublin 2
Ireland
Representative in Switzerland ACOLIN Fund Services AG
Leutschenbachstrasse 50
CH-8050 Zurich
Switzerland
Paying Agent in Switzerland Bank Vontobel Limited
43 Gotthardstrasse
CH-8022 Zurich
Switzerland
* All directors are non-executive
** Independent director
ALGEBRIS UCITS FUNDS PLC
Algebris Financial Credit Fund
Investment Manager’s Report
for the period from 1 January 2020 to 30 June 2020
4
After the strong performance in 2019, following one of the greatest rallies in global credit and equities, 2020 started on a
more cautious tone. Growing geopolitical concerns dampened sentiment across global equities due to several factors, from
the killing of Iranian General Soleimani and its ensuing ramifications across the Middle East, political uncertainty in both
the UK and Italy, to the mounting apprehension around the coronavirus outbreak and its macroeconomic impact.
In March, the global economic fallout from the Coronavirus led to a great deal of market volatility. On one side social
distancing and lockdown of major developed economies spread concerns around a demand shock and the potential recession
coming from it. This was gradually eased by an unprecedented set of policy responses announced globally, as governments
and Central Banks pledged to backstop losses to the real economy bringing relief across global markets.
The fund was conservatively positioned going into the COVID-19 outbreak, with a 20% cash buffer. After trimming
exposure to lower conviction positions in early February, the invested portfolio constituted primarily of high coupon and
backend bonds issued by leading banks with low extension risk. As the sell-off gathered pace, we took advantage of the
market and liquidity dislocation. We added to existing positions, with a preference for grandfathered and/or disqualified
perpetuals that were sold indiscriminately, as well as bonds from core issuers that had underperformed the most.
Financial markets continued to ameliorate throughout April as constructive headlines related to COVID-19 (flattening
curves, progress on testing and vaccinations, easing of lockdowns) and ongoing willingness from Central Banks globally
to do “whatever it takes” outweighed the negatives of a very uncertain macroeconomic fallout. In Europe, most banks
remained profitable whilst provisioning for higher expected COVID-19 related losses.
Momentum carried over from April into May and drove most asset classes higher. With infection curves flattening and
cases dropping in virtually all developed markets, optimism increased that the recovery will successfully begin to take hold
and within it normalize consumer and business trends. European banks wrapped up their first quarter reporting season with
trends largely consistent across the sector. Asset quality remained broadly under control thanks to the combination of
moratoriums, state guarantees and direct government relief.
Despite growing geopolitical tensions and a rise in COVID-19 contagion rates, June was another positive month across risk
assets as lockdowns eased, monetary policy remained conducive and economic data surprised to the upside. Compression
across European rates and tighter spreads drove credit performance in June with higher beta securities lagging better-quality
assets as flight to quality dominated. Spreads rallied up to 30bps across AT1, T2 and Senior, closing June on average at
670bps, 240bps, and 130bps, respectively.
In terms of primary deals, US banks led the way in reopening access to financial markets in the first quarter, followed by
European banks in the second quarter. Issuance was first concentrated in senior, and later shifted to the subordinated space
across Tier 2 and AT1s. Regulatory requirements continue to support primary flows, with widespread high-quality
issuances from the most solid institutions globally. The Fund maintains a cash buffer to opportunistically deploy across
new deals, with a disciplined stance on new deal participation.
ALGEBRIS UCITS FUNDS PLC
Algebris Financial Income Fund
Investment Manager’s Report
for the period from 1 January 2020 to 30 June 2020
5
The pandemic outbreak and lockdown of major economies caused an abrupt slowdown of global economic activity in the
first quarter, triggering a broad-based sell-off across asset classes. The memory of past crises and the inherent exposure of
the sector to the economic cycle put banks back under the spotlight, dragging equities down 50% while spreads on bonds
widened by two or three times. Although memory from the Global Financial Crisis exacerbated the dislocation in financials,
banks face today’s global recession from a much stronger starting point. Regulators also acknowledge that banks have a
key role to play in dealing with the effects of COVID-19 by maintaining the flow of credit to the economy.
European banks’ final Q4-19 results were broadly positive, with most banks benefitting from trading gains to beat
expectations. Core capital was built up across the board ahead of another round of Stress Tests later this year. The highlight
in February was Intesa’s all share takeover of UBI. In March, the global economic fallout from the Coronavirus led to a
great deal of market volatility. On one side social distancing and lockdown of major developed economies spread concerns
around a demand shock a potential recession. This was gradually eased by an unprecedented set of policy responses
announced globally, as governments and Central Banks pledged to backstop losses to the real economy bringing relief
across global markets.
Financial markets continued to ameliorate throughout April as constructive headlines related to COVID-19 (flattening
curves, progress on testing and vaccinations, easing of lockdowns) and ongoing willingness from Central Banks globally
to do “whatever it takes” outweighed the negatives of a very uncertain macroeconomic fallout. Momentum carried over
from April into May and drove most asset classes higher. Coming into the earnings season, the market’s focus had been
on how the economic uncertainty from the lockdowns would interact with the unprecedented government support for the
sector and the overall economy. Loan losses did rise substantially, and will continue to be elevated, but pre-provision profits
were able to absorb losses despite the severity of the contraction. The fund recovered some of the Q1 losses across equities
and credit. Despite growing geopolitical tensions and a rise in contagion rates, June was another positive month across risk
assets as lockdowns eased, monetary policy remained conducive and economic data surprised to the upside.
In financial credit, irrespective of the Q2 rebound, spreads remain wider than pre-pandemic levels and bonds are untainted
by direct central bank actions. Regulatory requirements continue to support primary flows, with widespread high-quality
issuances from the most solid institutions globally. Senior issuance in late Q2 was robust, with primary deals printing very
close to secondary fair value and ongoing demand expected to keep driving spreads tighter over the next months.
Bank equities have significantly lagged the wider market recovery, mainly due to uncertainties on COVID-19 related losses
and restrictions on dividend payments. Although the ultimate impact of the pandemic remains unclear, bank valuations at
less than 0.5x of tangible book value more than reflect the uncertain economic outlook. Valuations are yet to reflect the
positive impact of regulatory and government actions on the sector, including through loans guarantees, payment
moratoriums, lowered borrowing costs and increased net interest margins from TLTRO rate cuts. Those measures and
policies should provide significant protection from credit losses and asset quality deterioration.

ALGEBRIS UCITS FUNDS PLC
Algebris Allocation Fund
Investment Manager’s Report
for the period from 1 January 2020 to 30 June 2020
6
After the strong performance last year, following one of the greatest rallies in global credit and equities, 2020 started
on a more cautious tone. The first quarter was particularly difficult for financial assets, including the funds in the
portfolio, as the spread of the coronavirus across the developed world led to a great deal of volatility and, eventually,
a severe recession.
All underlying fund positions in the portfolio suffered losses during the March sell-off. The pandemic outbreak and
lockdown of major economies caused an abrupt slowdown of global economic activity. Memory from past crisis put
banks once again in the spotlight, with unseen drawdowns in financial equity and credit hurting the Fund performance
due to the over 50% exposure to the sector. A position in the Algebris Quant Arbitrage Fund significantly detracted
performance, as this fund suffered a severe drawdown in March that did not reverse, against the model forecasts. This
fund was subsequently liquidated, realising a material loss for the Algebris Allocation Fund.
The second quarter saw a broad recovery in asset prices across equity and credit. The unprecedented response by
Central Banks and governments, initial slowing of contagion rates, progress on testing and vaccination, as well as
lockdown easing brought relief to global markets. Regulatory pragmatism towards the banking sector (relaxation of
capital requirements and accounting rules, loan moratoria, government guarantees) contributed to the positive Fund
performance, as such measures significantly mitigate bank balance sheet deterioration and credit losses. Exposure to
credit, both in the financial sector and across sectors / geographies through the Algebris Global Credit Opportunities
Fund, benefitted performance as the Fund partially recovered earlier losses before quarter end.
Banks face this global recession from an unprecedentedly strong starting point, with robust capital buffers, good
liquidity, lighter and cleaner balance sheets that have been stress-tested repeatedly since the Global Financial Crisis.
Still, bank equities significantly lagged the wider market recovery, mainly due to uncertainties on COVID-19 related
losses and restrictions on dividend payments. Exposure to Italian equities via the Algebris Core Italy Fund was another
detractor to the year-to-date performance, despite the fund outperforming broader Italian equity markets. The overall
macroeconomic scenario for Italy remains uncertain, with GDP expected to decline by 11% according to most recent
EU estimates.
In financial credit spreads remain wider than pre-pandemic levels, while regulatory requirements continue to support
primary flows. Despite the severe recession, many banks are expected to maintain solid buffers over their capital
requirements. Further performance recovery for the portfolio is dependent upon the EU response to the crisis (the
“Next Generation EU” plan), continuous regulatory support for the banking sector and for the overall global macro
recovery.

ALGEBRIS UCITS FUNDS PLC
Algebris Financial Equity Fund
Investment Manager’s Report
for the period from 1 January 2020 to 30 June 2020
7
The first quarter of 2020 saw financial equities suffer significant losses as a result of the effects of COVID-19 and the
lockdown of major economies. The memory of past crises and the inherent exposure of the sector to the economic
cycle put banks back under the spotlight, dragging equities down 50% or below the trough levels of prior crises. This
period is often compared to the Global Financial Crisis with regard to stock market volatility and drawdowns.
However, relative to other sectors of the global economy (corporates, governments, households) banks face this
recession from a stronger starting point, with lower leverage, higher capital buffers, better liquidity, cleaner balance
sheets.
European banks’ final Q4-19 results were broadly positive, with most banks benefitting from trading gains to beat
expectations. Core capital was built up across the board ahead of another round of Stress Tests later this year. The
highlight in February was Intesa’s all share takeover of UBI. The fund was positioned cautiously into the sell-off,
having come into March with nearly a 30% cash position. At the end of March the fund was fully invested, using the
stock market collapse to add new positions and top-up existing holdings.
Banks play a key role in dealing with the economic effects of the pandemic by maintaining the flow of credit to the
economy, which has resulted in a great deal of regulatory pragmatism. The unprecedented response by Central Banks
and governments, together with the initial slowing of contagion rates, progress on testing and vaccination, and
lockdown easing, all brought relief to the market in the second quarter. This led to a wide recovery in asset prices
across equity and credit, though financial equities still lag behind the broader market.
Coming into the earnings season in May, the focus had been on how the economic uncertainty from the lockdowns
would interact with the unprecedented government support for the sector and the overall economy. Loan losses did
rise substantially, and will continue to be elevated, but pre-provision profits were able to absorb losses despite the
severity of the contraction in what is looking increasingly like an earnings, rather than a capital, event for the bank
sector. In June some of the fund exposure was shifted to Europe, primarily by taking profits from US positions that
had been added during the height of the panic. While US banks and insurers broadly remain well positioned from a
balance sheet perspective, the new regulatory uncertainty around dividends combined with a continued lack of
visibility on reserve builds and ultimate losses makes the investment proposition for the US banking sector less
attractive, especially for stocks that have rebounded in some cases 50-100% off the lows.
Meanwhile, European bank stocks remain at distressed valuations despite the better backdrop (political/ COVID/
economic/ regulatory) than in the US. In contrast to past crises, European policymakers have responded to the rapid
onset of COVID-19 swiftly and in a coordinated manner. In Europe austerity has been abandoned for aggressive fiscal
expansion. The ECB is now paying banks to lend, and governments are pre-emptively absorbing banks’ credit losses.
Banks are being encouraged to consolidate by their regulator. The speed and chaos of the crisis has obscured the full
impact of these policies, of which banks will be key beneficiaries. Although the ultimate impact of the pandemic
remains unclear, bank valuations at less than 0.5x of tangible book value more than reflect the uncertain economic
outlook

ALGEBRIS UCITS FUNDS PLC
Algebris Global Credit Opportunities Fund (formerly Algebris Macro Credit Fund)
Investment Manager’s Report
for the period from 1 January 2020 to 30 June 2020
8
We began 2020 defensively positioned in the fund given tight valuations, and rising concerns about the Coronavirus
spreading outside of China. We understood that if this was to happen, there was a high risk of a strong decline in
global demand as well as a permanent output loss, which would lead to a structural GDP decline.
Our first line of defence was to reduce the credit exposure down to 50% invested, maintaining a good amount of dry
powder. Second, we implemented macro/tail hedges in equities and credit in February as concerns about a global
contagion started to materialize. And lastly, we stated to focus on vulnerable businesses which could suffer distress
or go into default should contagions continued.
This positioning allowed us to weather some of the volatility in March, when credit indices fell sharply. However,
as spreads widened, we saw an unprecedented opportunity to lock-in substantial yield in high-quality balance sheets.
Our case for increasing our credit exposure was based on three factors: a stabilization in the contagion rate, a timely
and targeted policy response from governments and central banks, and the high levels of fear across investors, that
skyrocketed the cost of protection.
In April, as Fed Chair Powell’s remarks confirmed that government and monetary policy support would backstop
any prolonged widening in credit, we continued to add selectively in credits with strong balance sheets, but which
had lagged the recovery, like Telefonica, GE, Barclays, ING and Credit Agricole. We believed government bailouts
would transfer risk from the private to the public sector, which is generally credit positive. However, unlike for the
2008 crisis, we foresaw that these bailouts would come with strings attached, which is why we also re-loaded
protection on assets without central bank support, like equities and Emerging Markets currencies.
We maintained our view that investors will need to be extra selective about which sectors they buy, and focused
mainly in sectors which were challenged, but could survive – like banks, autos, gaming, paper and packaging; while
avoiding sectors with structural overcapacity.
We maintained this approach through May, with our credit exposure reaching nearly 70% by the end of the month.
We were particularly positive on European credit, where we thought the proposed recovery fund would be a game-
changer towards a closer fiscal union. We also thought that central bank stimulus would continue to support liquidity
in the credit markets, moving risk from private to public balance sheets and reducing government bond yields.
With economies reopening and activity rebounding faster than most investors anticipated, credit markets performed
well throughout May/Jun. We used this rally as an opportunity to take profit on IG/ defensive credits and instead
focused the portfolio on credits that either have good yields for volatility or alpha opportunities with upside-catalysts.
We believe current levels still offer good opportunities. However, with the strong performance in credit indices, we
think this opportunity is now present in special situations outside of popular benchmark indices and can only be
captured through active portfolio management and credit selection, which is the focus of this strategy.

ALGEBRIS UCITS FUNDS PLC
Algebris Core Italy Fund
Investment Manager’s Report
for the period from 1 January 2020 to 30 June 2020
9
After the strong performance last year, 2020 started on a more cautious tone for Italian equities, which were
negatively affected by several geopolitical factors, most notably, the risk of a global spread of the Coronavirus. More
locally, news was slightly more positive, with a better than expected budget deficit, slight improvements in consumer
and manufacturing data, and a centre-left victory in Emilia Romagna which would improve the current government
stability.
Given uncertainty related to the virus, we expected strong volatility for the first part of 2020, which is why we started
the year by strategically trimming those positions whose earnings were more exposed to the global cycle.
The virus finally spread globally in February and March, with Italy being one of the worst affected countries. Our
portfolio was negatively impacted by the shutdown of economic activities and the lockdown measures in the country,
and many of the companies we own issued profit warnings as they got ready for a decline in demand as well as a
deterioration in supply globally. Governments and central banks announced a series of stimulus measures to counter
the economic impact of the lockdowns, but the outcome remained uncertain. The outlook for demand driven sectors,
such as consumer discretionary and capital goods, looked particularly gloomy and we kept on protecting the portfolio
by focusing on names with solid fundamentals, consistent free cash flow generation (even in a slowing environment),
and attractive valuations.
Global equities started recovering in April as constructive headlines related to COVID-19 (flattening curves, progress
on testing and vaccinations, easing of lockdowns) outweighed what still was a very uncertain macroeconomic fallout.
Positive news also came from the EU Commission with the proposal of the “Next Generation EU” plan (worth EUR
750bn). Given the harsh impact of the pandemic on the Italian economy, the country was expected to be one of the
major recipients of these funds. However, the plan still needed to go through a tough negotiation phase and the risk
of resizing or making structural modifications couldn’t be ruled out before it finally got a sign off from all EU
countries. The Italian economic outlook is still expected to be weak despite fiscal stimulus and we started to assess
which sectors/companies would emerge as winners in the new normal after the market turmoil is over, increasing
exposure to those names.
While the outlook for the year is still uncertain and we expect Italian equities to remain under pressure in the near
term, we remain confident that over the medium-to-long term the asset class has a significant upside from the current
levels, the reasons being: 1) excellence of Italian small-medium cap firms in their niches; 2) strong management
vision; 3) M&A campaigns outside domestic borders; 4) attractive valuations; 5) massive amounts of liquidity and
stimulus injected by policymakers, providing strong support to the banking system via forbearance on
capital/restructured loans, and guaranteed funding for SMEs.
ALGEBRIS UCITS FUNDS PLC
Algebris Quant Arbitrage Fund
Investment Manager’s Report
for the period from 1 January 2020 to 30 June 2020
10
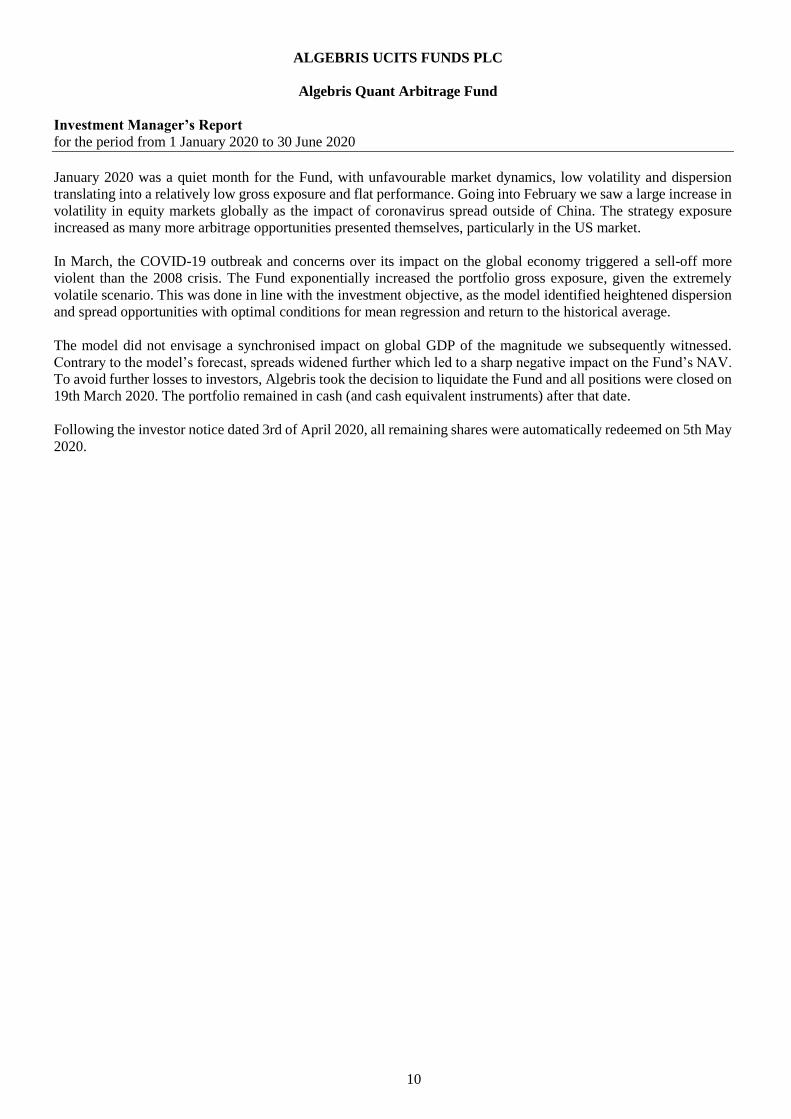
January 2020 was a quiet month for the Fund, with unfavourable market dynamics, low volatility and dispersion
translating into a relatively low gross exposure and flat performance. Going into February we saw a large increase in
volatility in equity markets globally as the impact of coronavirus spread outside of China. The strategy exposure
increased as many more arbitrage opportunities presented themselves, particularly in the US market.
In March, the COVID-19 outbreak and concerns over its impact on the global economy triggered a sell-off more
violent than the 2008 crisis. The Fund exponentially increased the portfolio gross exposure, given the extremely
volatile scenario. This was done in line with the investment objective, as the model identified heightened dispersion
and spread opportunities with optimal conditions for mean regression and return to the historical average.
The model did not envisage a synchronised impact on global GDP of the magnitude we subsequently witnessed.
Contrary to the model’s forecast, spreads widened further which led to a sharp negative impact on the Fund’s NAV.
To avoid further losses to investors, Algebris took the decision to liquidate the Fund and all positions were closed on
19th March 2020. The portfolio remained in cash (and cash equivalent instruments) after that date.
Following the investor notice dated 3rd of April 2020, all remaining shares were automatically redeemed on 5th May
2020.
ALGEBRIS UCITS FUNDS PLC
Algebris IG Financial Credit Fund
Investment Manager’s Report
for the period from 1 January 2020 to 30 June 2020
11
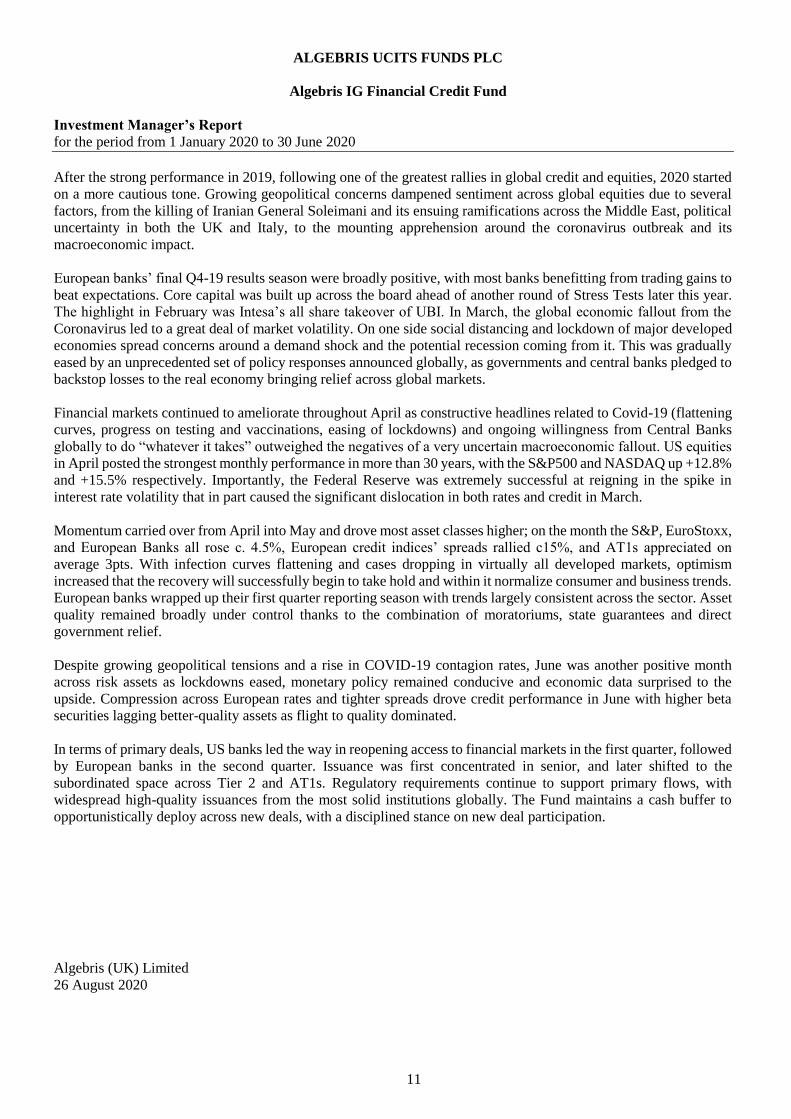
After the strong performance in 2019, following one of the greatest rallies in global credit and equities, 2020 started
on a more cautious tone. Growing geopolitical concerns dampened sentiment across global equities due to several
factors, from the killing of Iranian General Soleimani and its ensuing ramifications across the Middle East, political
uncertainty in both the UK and Italy, to the mounting apprehension around the coronavirus outbreak and its
macroeconomic impact.
European banks’ final Q4-19 results season were broadly positive, with most banks benefitting from trading gains to
beat expectations. Core capital was built up across the board ahead of another round of Stress Tests later this year.
The highlight in February was Intesa’s all share takeover of UBI. In March, the global economic fallout from the
Coronavirus led to a great deal of market volatility. On one side social distancing and lockdown of major developed
economies spread concerns around a demand shock and the potential recession coming from it. This was gradually
eased by an unprecedented set of policy responses announced globally, as governments and central banks pledged to
backstop losses to the real economy bringing relief across global markets.
Financial markets continued to ameliorate throughout April as constructive headlines related to Covid-19 (flattening
curves, progress on testing and vaccinations, easing of lockdowns) and ongoing willingness from Central Banks
globally to do “whatever it takes” outweighed the negatives of a very uncertain macroeconomic fallout. US equities
in April posted the strongest monthly performance in more than 30 years, with the S&P500 and NASDAQ up +12.8%
and +15.5% respectively. Importantly, the Federal Reserve was extremely successful at reigning in the spike in
interest rate volatility that in part caused the significant dislocation in both rates and credit in March.
Momentum carried over from April into May and drove most asset classes higher; on the month the S&P, EuroStoxx,
and European Banks all rose c. 4.5%, European credit indices’ spreads rallied c15%, and AT1s appreciated on
average 3pts. With infection curves flattening and cases dropping in virtually all developed markets, optimism
increased that the recovery will successfully begin to take hold and within it normalize consumer and business trends.
European banks wrapped up their first quarter reporting season with trends largely consistent across the sector. Asset
quality remained broadly under control thanks to the combination of moratoriums, state guarantees and direct
government relief.
Despite growing geopolitical tensions and a rise in COVID-19 contagion rates, June was another positive month
across risk assets as lockdowns eased, monetary policy remained conducive and economic data surprised to the
upside. Compression across European rates and tighter spreads drove credit performance in June with higher beta
securities lagging better-quality assets as flight to quality dominated.
In terms of primary deals, US banks led the way in reopening access to financial markets in the first quarter, followed
by European banks in the second quarter. Issuance was first concentrated in senior, and later shifted to the
subordinated space across Tier 2 and AT1s. Regulatory requirements continue to support primary flows, with
widespread high-quality issuances from the most solid institutions globally. The Fund maintains a cash buffer to
opportunistically deploy across new deals, with a disciplined stance on new deal participation.
Algebris (UK) Limited
26 August 2020
ALGEBRIS UCITS FUNDS PLC
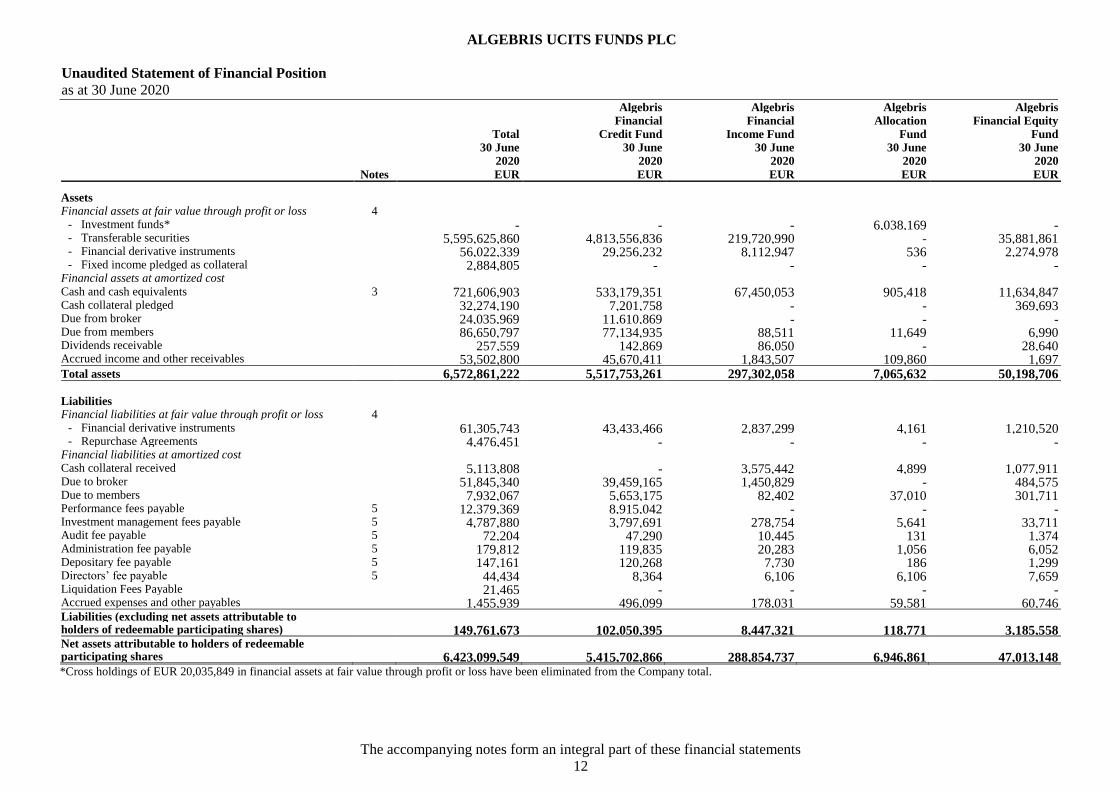
Unaudited Statement of Financial Position
as at 30 June 2020
The accompanying notes form an integral part of these financial statements
12
Algebris Algebris Algebris Algebris Financial Financial Allocation Financial Equity Total Credit Fund Income Fund Fund Fund 30 June 30 June 30 June 30 June 30 June 2020 2020 2020 2020 2020
Notes EUR EUR EUR EUR EUR
Assets Financial assets at fair value through profit or loss 4
- Investment funds* - - - 6,038,169 - - Transferable securities 5,595,625,860 4,813,556,836 219,720,990 - 35,881,861 - Financial derivative instruments 56,022,339 29,256,232 8,112,947 536 2,274,978 - Fixed income pledged as collateral 2,884,805 - - - -
Financial assets at amortized cost Cash and cash equivalents 3 721,606,903 533,179,351 67,450,053 905,418 11,634,847 Cash collateral pledged 32,274,190 7,201,758 - - 369,693 Due from broker 24,035,969 11,610,869 - - - Due from members 86,650,797 77,134,935 88,511 11,649 6,990 Dividends receivable 257,559 142,869 86,050 - 28,640 Accrued income and other receivables 53,502,800 45,670,411 1,843,507 109,860 1,697 Total assets 6,572,861,222 5,517,753,261 297,302,058 7,065,632 50,198,706 Liabilities Financial liabilities at fair value through profit or loss 4
- Financial derivative instruments 61,305,743 43,433,466 2,837,299 4,161 1,210,520 - Repurchase Agreements 4,476,451 - - - -
Financial liabilities at amortized cost Cash collateral received 5,113,808 - 3,575,442 4,899 1,077,911 Due to broker 51,845,340 39,459,165 1,450,829 - 484,575 Due to members 7,932,067 5,653,175 82,402 37,010 301,711 Performance fees payable 5 12,379,369 8,915,042 - - - Investment management fees payable 5 4,787,880 3,797,691 278,754 5,641 33,711 Audit fee payable 5 72,204 47,290 10,445 131 1,374 Administration fee payable 5 179,812 119,835 20,283 1,056 6,052 Depositary fee payable 5 147,161 120,268 7,730 186 1,299 Directors’ fee payable 5 44,434 8,364 6,106 6,106 7,659 Liquidation Fees Payable 21,465 - - - - Accrued expenses and other payables 1,455,939 496,099 178,031 59,581 60,746 Liabilities (excluding net assets attributable to holders of redeemable participating shares) 149,761,673 102,050,395 8,447,321 118,771 3,185,558 Net assets attributable to holders of redeemable
participating shares 6,423,099,549 5,415,702,866 288,854,737 6,946,861 47,013,148 *Cross holdings of EUR 20,035,849 in financial assets at fair value through profit or loss have been eliminated from the Company total.

ALGEBRIS UCITS FUNDS PLC
Unaudited Statement of Financial Position (continued)
as at 30 June 2020
The accompanying notes form an integral part of these financial statements
13
Algebris Algebris Algebris Algebris Global Credit Core Italy Quant Arbitrage IG Financial Opportunities Fund** Fund Fund*** Credit Fund 30 June 30 June 30 June 30 June 2020 2020 2020 2020
Notes EUR EUR EUR EUR
Assets Financial assets at fair value through profit or loss 4
- Investment funds* - - - 13,997,680 - Transferable securities 362,253,183 41,267,525 - 122,945,465 - Financial derivative instruments 15,364,158 361,189 - 652,299 - Fixed income pledged as collateral 2,884,805 - - -
Financial assets at amortized cost Cash and cash equivalents 3 92,432,937 1,254,835 21,465 14,727,997 Cash collateral pledged 24,702,739 - - - Due from broker 12,375,700 49,400 - - Due from members 2,680,947 38,343 - 6,689,422 Dividends receivable - - - - Accrued income and other receivables 4,864,460 38,641 - 974,224 Total assets 517,558,929 43,009,933 21,465 159,987,087 Liabilities Financial liabilities at fair value through profit or loss 4
- Financial derivative instruments 13,286,887 57 - 533,353 - Repurchase Agreements 4,476,451 - - -
Financial liabilities at amortized cost Cash collateral received - - - 455,556 Due to broker 9,290,835 - - 1,159,936 Due to members 1,707,909 19,367 - 130,493 Performance fees payable 5 3,464,327 - - - Investment management fees payable 5 595,815 10,035 - 66,233 Audit fee payable 5 9,670 3,175 - 119 Administration fee payable 5 23,796 2,633 - 6,157 Depositary fee payable 5 12,914 1,136 - 3,628 Directors’ fee payable 5 6,106 6,106 - 3,987 Liquidation Fees Payable - - 21,465 - Accrued expenses and other payables 613,923 25,430 - 22,129 Liabilities (excluding net assets attributable to holders of redeemable participating shares) 33,488,633 67,939 21,465 2,381,591 Net assets attributable to holders of redeemable participating shares 484,070,296 42,941,994 - 157,605,496 *Cross holdings of EUR 20,035,849 in financial assets at fair value through profit or loss have been eliminated from the Company total.
** Formerly known as Algebris Macro Credit Fund.
***The Algebris Quant Arbitrage Fund portfolio of investments was liquidated into cash on 19 March 2020 and final redemptions were made as at 5 May 2020.

ALGEBRIS UCITS FUNDS PLC
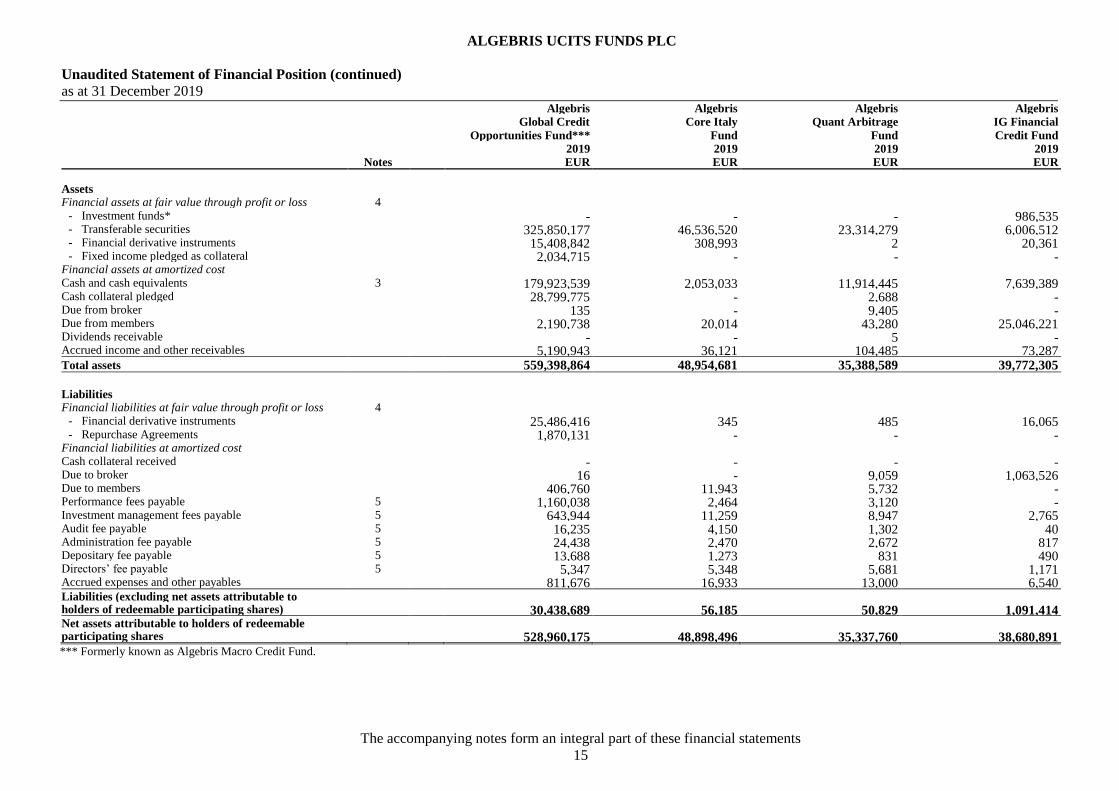
Unaudited Statement of Financial Position (continued)
as at 31 December 2019
The accompanying notes form an integral part of these financial statements
14
Algebris Algebris Algebris Algebris
Financial Financial Allocation Financial
Total Credit Fund Income Fund Fund Equity Fund
2019 2019 2019 2019 2019
Notes EUR EUR EUR EUR EUR
Assets Financial assets at fair value through profit or loss 4
- Investment funds* - - - 8,665,802 - - Transferable securities 5,129,078,258 4,298,567,409 374,660,222 - 54,143,139 - Financial derivative instruments 45,864,937 24,905,054 2,884,179 206 2,337,300 - Fixed income pledged as collateral 2,034,715 - - - -
Financial assets at amortised cost Cash and cash equivalents 3 1,127,447,955 813,465,388 92,926,195 895,273 18,630,693 Cash collateral pledged 33,080,352 - 4,277,889 - - Due from broker 686,535 3,858 579,064 - 94,073 Due from members 55,530,376 25,468,953 2,707,341 1,384 52,445 Dividends receivable 302,545 144,709 139,980 - 17,851 Accrued income and other receivables 48,760,711 40,763,756 2,480,760 106,448 4,911 Total assets 6,442,786,384 5,203,319,127 480,655,630 9,669,113 75,280,412
Liabilities Financial liabilities at fair value through profit or loss 4
- Financial derivative instruments 41,834,948 8,546,824 7,022,585 - 762,228 - Repurchase Agreements 1,870,131 - - - -
Financial liabilities at amortised cost Cash collateral received 12,825,148 11,139,602 - 4,908 1,680,638 Due to broker 1,076,326 2,599 969 - 157 Due to members 8,446,162 5,533,554 2,300,693 9,297 178,183 Performance fees payable 5 20,151,844 18,985,942 - 6 274 Investment management fees payable 5 4,746,277 3,543,889 473,687 7,303 54,483 Audit fee payable 5 132,414 92,330 15,630 259 2,468 Administration fee payable 5 177,803 113,369 25,598 760 7,679 Depositary fee payable 5 145,624 114,825 12,332 248 1,937 Directors’ fee payable 5 40,620 6,541 5,348 5,347 5,837 Accrued expenses and other payables 1,504,884 426,940 149,537 39,586 40,672 Liabilities (excluding net assets attributable to holders of redeemable participating shares) 92,952,181 48,506,415 10,006,379 67,714 2,734,556 Net assets attributable to holders of redeemable
participating shares
6,349,834,203 5,154,812,712 470,649,251 9,601,399 72,545,856
*Cross holdings of EUR 9,652,337 in financial assets at fair value through profit or loss have been eliminated from the Company total.
ALGEBRIS UCITS FUNDS PLC
Unaudited Statement of Financial Position (continued)
as at 31 December 2019
The accompanying notes form an integral part of these financial statements
15
Algebris Algebris Algebris Algebris
Global Credit Core Italy Quant Arbitrage IG Financial
Opportunities Fund*** Fund Fund Credit Fund
2019 2019 2019 2019
Notes EUR EUR EUR EUR
Assets Financial assets at fair value through profit or loss 4
- Investment funds* - - - 986,535 - Transferable securities 325,850,177 46,536,520 23,314,279 6,006,512 - Financial derivative instruments 15,408,842 308,993 2 20,361 - Fixed income pledged as collateral 2,034,715 - - -
Financial assets at amortized cost Cash and cash equivalents 3 179,923,539 2,053,033 11,914,445 7,639,389 Cash collateral pledged 28,799,775 - 2,688 - Due from broker 135 - 9,405 - Due from members 2,190,738 20,014 43,280 25,046,221 Dividends receivable - - 5 - Accrued income and other receivables 5,190,943 36,121 104,485 73,287 Total assets 559,398,864 48,954,681 35,388,589 39,772,305
Liabilities Financial liabilities at fair value through profit or loss 4
- Financial derivative instruments 25,486,416 345 485 16,065 - Repurchase Agreements 1,870,131 - - -
Financial liabilities at amortized cost Cash collateral received - - - - Due to broker 16 - 9,059 1,063,526 Due to members 406,760 11,943 5,732 - Performance fees payable 5 1,160,038 2,464 3,120 - Investment management fees payable 5 643,944 11,259 8,947 2,765 Audit fee payable 5 16,235 4,150 1,302 40 Administration fee payable 5 24,438 2,470 2,672 817 Depositary fee payable 5 13,688 1,273 831 490 Directors’ fee payable 5 5,347 5,348 5,681 1,171 Accrued expenses and other payables 811,676 16,933 13,000 6,540 Liabilities (excluding net assets attributable to holders of redeemable participating shares) 30,438,689 56,185 50,829 1,091,414 Net assets attributable to holders of redeemable participating shares 528,960,175 48,898,496 35,337,760 38,680,891 *** Formerly known as Algebris Macro Credit Fund.
ALGEBRIS UCITS FUNDS PLC
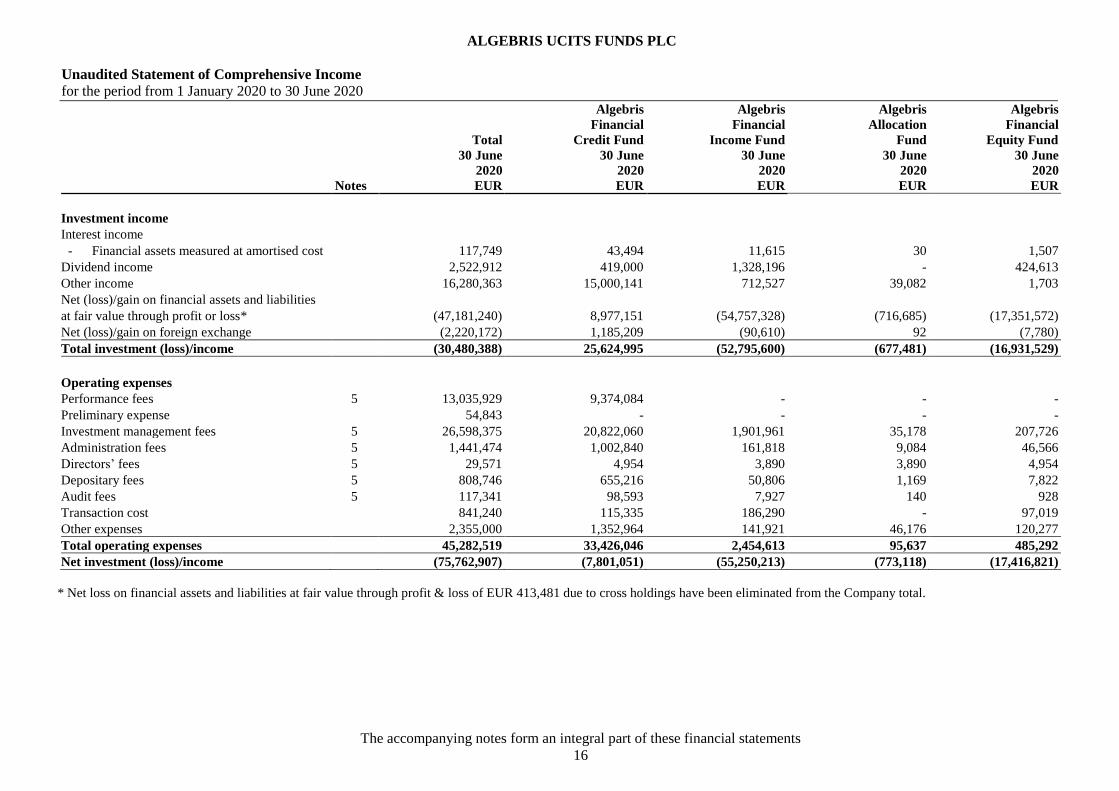
Unaudited Statement of Comprehensive Income
for the period from 1 January 2020 to 30 June 2020
The accompanying notes form an integral part of these financial statements
16
Algebris
Financial
Algebris
Financial
Algebris
Allocation
Algebris
Financial
Total Credit Fund Income Fund Fund Equity Fund
30 June 30 June 30 June 30 June 30 June
2020 2020 2020 2020 2020
Notes EUR EUR EUR EUR EUR
Investment income
Interest income
- Financial assets measured at amortised cost 117,749 43,494 11,615 30 1,507
Dividend income 2,522,912 419,000 1,328,196 - 424,613
Other income 16,280,363 15,000,141 712,527 39,082 1,703
Net (loss)/gain on financial assets and liabilities
at fair value through profit or loss* (47,181,240) 8,977,151 (54,757,328) (716,685) (17,351,572)
Net (loss)/gain on foreign exchange (2,220,172) 1,185,209 (90,610) 92 (7,780)
Total investment (loss)/income (30,480,388) 25,624,995 (52,795,600) (677,481) (16,931,529)
Operating expenses
Performance fees 5 13,035,929 9,374,084 - - -
Preliminary expense 54,843 - - - -
Investment management fees 5 26,598,375 20,822,060 1,901,961 35,178 207,726
Administration fees 5 1,441,474 1,002,840 161,818 9,084 46,566
Directors’ fees 5 29,571 4,954 3,890 3,890 4,954
Depositary fees 5 808,746 655,216 50,806 1,169 7,822
Audit fees 5 117,341 98,593 7,927 140 928
Transaction cost 841,240 115,335 186,290 - 97,019
Other expenses 2,355,000 1,352,964 141,921 46,176 120,277
Total operating expenses 45,282,519 33,426,046 2,454,613 95,637 485,292
Net investment (loss)/income (75,762,907) (7,801,051) (55,250,213) (773,118) (17,416,821)
* Net loss on financial assets and liabilities at fair value through profit & loss of EUR 413,481 due to cross holdings have been eliminated from the Company total.

ALGEBRIS UCITS FUNDS PLC
Unaudited Statement of Comprehensive Income (continued)
for the period from 1 January 2020 to 30 June 2020
The accompanying notes form an integral part of these financial statements
17
Algebris
Financial
Algebris
Financial
Algebris
Allocation
Algebris
Financial
Total Credit Fund Income Fund Fund Equity Fund
30 June 30 June 30 June 30 June 30 June
2020 2020 2020 2020 2020
Notes EUR EUR EUR EUR EUR
Finance costs
Distributions to holders of redeemable
participating shares 6 65,228,100 58,635,291 2,609,486 - 58,424
Interest expense
- Financial liabilities measured at FVTPL 793,083 - 3,505 - -
- Financial liabilities measured at
amortised cost 3,340,725 2,056,205 278,011 2,691 50,371
Total finance costs 69,361,908 60,691,496 2,891,002 2,691 108,795
(Loss)/profit before tax (145,124,815) (68,492,547) (58,141,215) (775,809) (17,525,616)
Withholding tax on dividends 662,223 125,700 337,318 - 107,918
Withholding tax on interest 591,807 244,594 - - -
Decrease in net assets attributable to holders
of redeemable participating shares from
operations (146,378,845) (68,862,841) (58,478,533) (775,809) (17,633,534)
ALGEBRIS UCITS FUNDS PLC
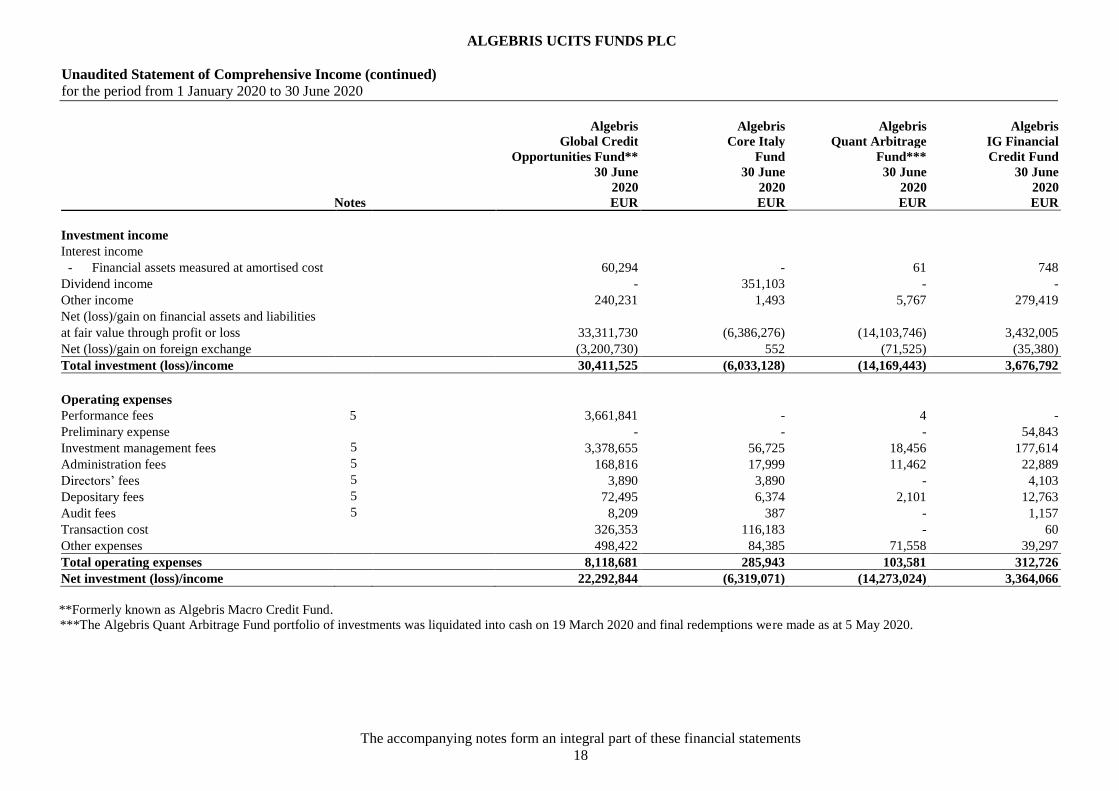
Unaudited Statement of Comprehensive Income (continued)
for the period from 1 January 2020 to 30 June 2020
The accompanying notes form an integral part of these financial statements
18
Algebris
Global Credit
Algebris
Core Italy
Algebris
Quant Arbitrage
Algebris
IG Financial
Opportunities Fund** Fund Fund*** Credit Fund
30 June 30 June 30 June 30 June
2020 2020 2020 2020
Notes EUR EUR EUR EUR
Investment income
Interest income
- Financial assets measured at amortised cost 60,294 - 61 748
Dividend income - 351,103 - -
Other income 240,231 1,493 5,767 279,419
Net (loss)/gain on financial assets and liabilities
at fair value through profit or loss 33,311,730 (6,386,276) (14,103,746) 3,432,005
Net (loss)/gain on foreign exchange (3,200,730) 552 (71,525) (35,380)
Total investment (loss)/income 30,411,525 (6,033,128) (14,169,443) 3,676,792
Operating expenses
Performance fees 5 3,661,841 - 4 -
Preliminary expense - - - 54,843
Investment management fees 5 3,378,655 56,725 18,456 177,614
Administration fees 5 168,816 17,999 11,462 22,889
Directors’ fees 5 3,890 3,890 - 4,103
Depositary fees 5 72,495 6,374 2,101 12,763
Audit fees 5 8,209 387 - 1,157
Transaction cost 326,353 116,183 - 60
Other expenses 498,422 84,385 71,558 39,297
Total operating expenses 8,118,681 285,943 103,581 312,726
Net investment (loss)/income 22,292,844 (6,319,071) (14,273,024) 3,364,066
**Formerly known as Algebris Macro Credit Fund.
***The Algebris Quant Arbitrage Fund portfolio of investments was liquidated into cash on 19 March 2020 and final redemptions were made as at 5 May 2020.

ALGEBRIS UCITS FUNDS PLC
Unaudited Statement of Comprehensive Income (continued)
for the period from 1 January 2020 to 30 June 2020
The accompanying notes form an integral part of these financial statements
19
Algebris
Global Credit
Algebris
Core Italy
Algebris
Quant Arbitrage
Algebris
IG Financial
Opportunities Fund** Fund Fund*** Credit Fund
30 June 30 June 30 June 30 June
2020 2020 2020 2020
Notes EUR EUR EUR EUR
Finance costs
Distributions to holders of redeemable
participating shares 6 3,841,655 - - 83,244
Interest expense
- Financial liabilities measured at FVTPL 783,300 6,278 - -
- Financial liabilities measured at
amortised cost 847,294 7,521 47,972 50,660
Total finance costs 5,472,249 13,799 47,972 133,904
(Loss)/profit before tax 16,820,595 (6,332,870) (14,320,996) 3,230,162
Withholding tax on dividends - 91,287 - -
Withholding tax on interest 338,719 - - 8,494
Decrease in net assets attributable to holders
of redeemable participating shares from
operations 16,481,876 (6,424,157) (14,320,996) 3,221,668
** Formerly known as Algebris Macro Credit Fund.
*** The Algebris Quant Arbitrage Fund portfolio of investments was liquidated into cash on 19 March 2020 and final redemptions were made as at 5 May 2020.

ALGEBRIS UCITS FUNDS PLC
Unaudited Statement of Comprehensive Income (continued)
for the period from 1 January 2019 to 30 June 2019
The accompanying notes form an integral part of these financial statements
20
Algebris
Financial
Algebris
Financial
Algebris
Allocation
Algebris
Financial
Total Credit Fund Income Fund Fund Equity Fund
30 June 30 June 30 June 30 June 30 June
2019 2019 2019 2019 2019
Notes EUR EUR EUR EUR EUR
Investment income
Interest income
- Financial assets measured at FVTPL 157,273,755 128,903,594 8,047,960 27,549 22,924
- Financial assets measured at amortised cost 273,048 68,847 83,568 2,846 28,228
Dividend income 6,096,253 402,375 4,123,203 13,559 1,044,603
Other income 3,177,817 2,420,216 356,360 63,113 4,683
Net gain on financial assets and liabilities
at fair value through profit or loss* 416,127,473 293,629,880 54,561,549 700,628 9,637,944
Net (loss)/gain on foreign exchange (351,784) (249,414) (120,894) 6,020 12,012
Total investment income 582,596,562 425,175,498 67,051,746 813,715 10,750,394
Operating expenses
Performance fees 5 8,590,735 8,590,549 - 3 -
Preliminary expense 2,579 - - - -
Investment management fees 5 24,659,240 16,834,460 2,966,353 48,364 342,189
Administration fees 5 1,271,906 817,967 180,496 7,856 61,096
Directors’ fees 5 30,052 4,834 4,203 4,203 4,203
Dividend expense 46,545 - - - 18,848
Depositary fees 5 739,458 552,292 73,599 1,709 12,809
Audit fees 5 76,834 60,665 6,619 151 888
Transaction cost 624,529 23,155 169,564 6,678 263,018
Other expenses 2,270,779 1,314,227 148,346 76,242 75,626
Total operating expenses 38,312,657 28,198,149 3,549,180 145,206 778,677
Net investment income 544,283,905 396,977,349 63,502,566 668,509 9,971,717
* Net gain on financial assets and liabilities at fair value through profit & loss of EUR 254,058 due to cross holdings have been eliminated from the Company total.

ALGEBRIS UCITS FUNDS PLC
Unaudited Statement of Comprehensive Income (continued)
for the period from 1 January 2019 to 30 June 2019
The accompanying notes form an integral part of these financial statements
21
Algebris
Financial
Algebris
Financial
Algebris
Allocation
Algebris
Financial
Total Credit Fund Income Fund Fund Equity Fund
30 June 30 June 30 June 30 June 30 June
2019 2019 2019 2019 2019
Notes EUR EUR EUR EUR EUR
Finance costs
Distributions to holders of redeemable
participating shares 6 67,980,295 56,598,168 5,093,606 - 131,452
Interest expense
- Financial liabilities measured at FVTPL 970,789 154,914 3,230 - -
- Financial liabilities measured at amortised
cost 1,682,761 1,077,603 215,033 5,696 77,329
Total finance costs 70,633,845 57,830,685 5,311,869 5,696 208,781
Profit before tax 473,650,060 339,146,664 58,190,697 662,813 9,762,936
Withholding tax on dividends 1,345,949 120,713 909,150 2,611 216,890
Withholding tax on interest 446,112 401,871 7,001 - -
Increase in net assets attributable to holders
of redeemable participating shares from
operations 471,857,999 338,624,080 57,274,546 660,202 9,546,046

ALGEBRIS UCITS FUNDS PLC
Unaudited Statement of Comprehensive Income (continued)
for the period from 1 January 2019 to 30 June 2019
The accompanying notes form an integral part of these financial statements
22
Algebris
Global Credit
Algebris
Core Italy
Algebris
Quant Arbitrage
Opportunities Fund*** Fund Fund
30 June 30 June 30 June
2019 2019 2019
Notes EUR EUR EUR
Investment income
Interest income
- Financial assets measured at FVTPL 19,803,842 404,841 63,045
- Financial assets measured at amortised
cost 89,305 167 87
Dividend income - 512,513 -
Other income 294,631 11,618 27,196
Net gain on financial assets and liabilities
at fair value through profit or loss 54,325,579 3,470,080 55,871
Net (loss)/gain on foreign exchange (2,347) 8,423 (5,584)
Total investment income 74,511,010 4,407,642 140,615
Operating expenses
Performance fees 5 84 6 93
Preliminary expense - 97 2,482
Investment management fees 5 4,412,587 52,765 2,522
Administration fees 5 186,644 13,448 4,399
Directors’ fees 5 4,203 4,203 4,203
Dividend expense - 27,697 -
Depositary fees 5 91,358 6,015 1,676
Audit fees 5 7,860 370 281
Transaction cost 106,145 55,965 4
Other expenses 553,683 59,204 43,451
Total operating expenses 5,362,564 219,770 59,111
Net investment income 69,148,446 4,187,872 81,504
***Formerly known as Algebris Macro Credit Fund.
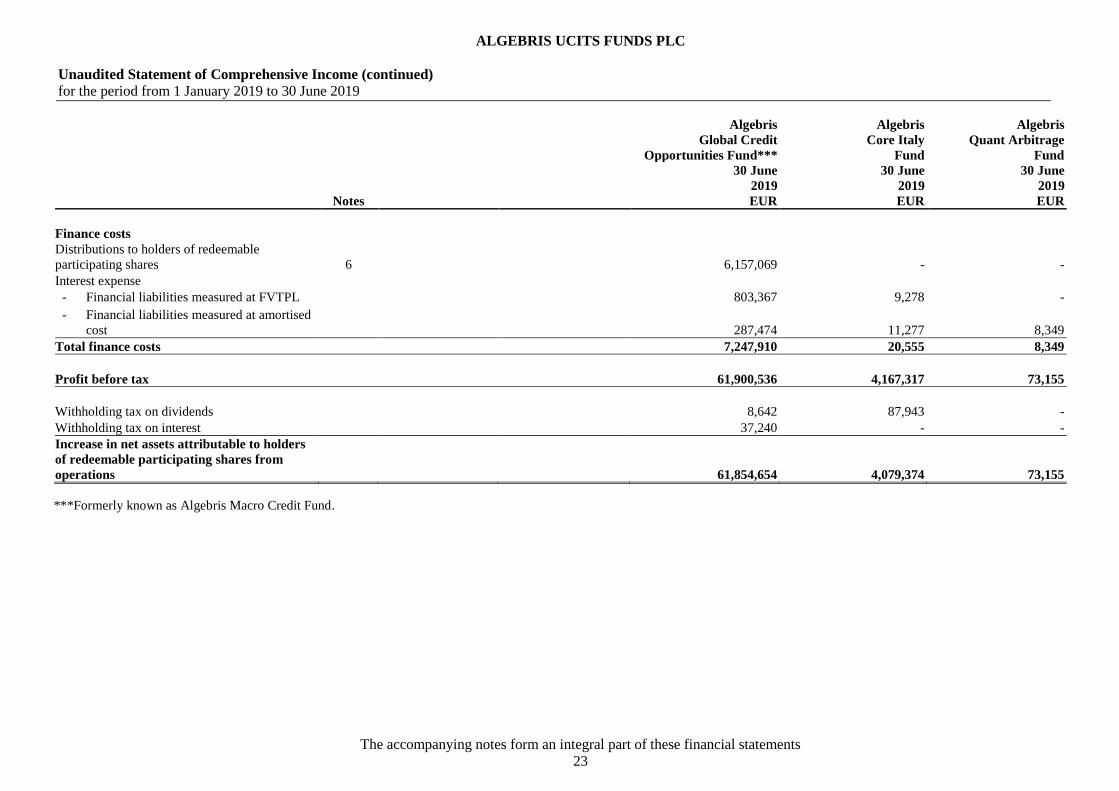
ALGEBRIS UCITS FUNDS PLC
Unaudited Statement of Comprehensive Income (continued)
for the period from 1 January 2019 to 30 June 2019
The accompanying notes form an integral part of these financial statements
23
Algebris
Global Credit
Algebris
Core Italy
Algebris
Quant Arbitrage
Opportunities Fund*** Fund Fund
30 June 30 June 30 June
2019 2019 2019
Notes EUR EUR EUR
Finance costs
Distributions to holders of redeemable
participating shares 6 6,157,069 - -
Interest expense
- Financial liabilities measured at FVTPL 803,367 9,278 -
- Financial liabilities measured at amortised
cost 287,474 11,277 8,349
Total finance costs 7,247,910 20,555 8,349
Profit before tax 61,900,536 4,167,317 73,155
Withholding tax on dividends 8,642 87,943 -
Withholding tax on interest 37,240 - -
Increase in net assets attributable to holders
of redeemable participating shares from
operations 61,854,654 4,079,374 73,155
***Formerly known as Algebris Macro Credit Fund.
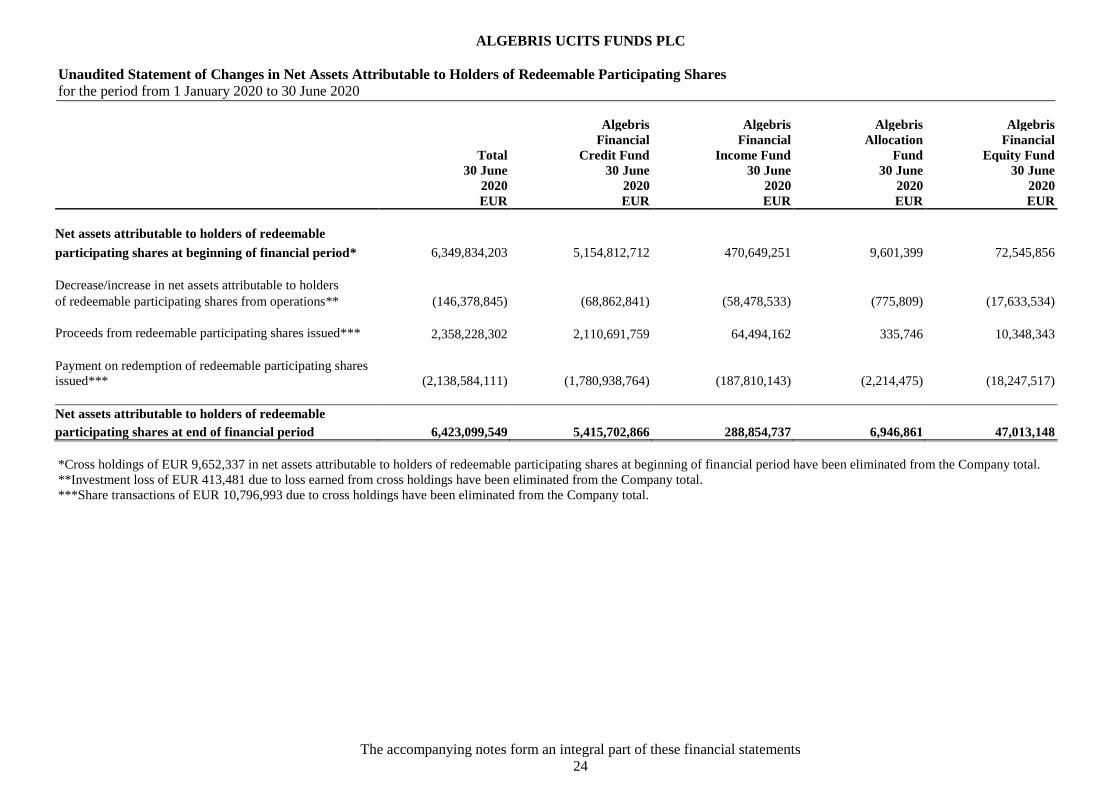
ALGEBRIS UCITS FUNDS PLC
Unaudited Statement of Changes in Net Assets Attributable to Holders of Redeemable Participating Shares
for the period from 1 January 2020 to 30 June 2020
The accompanying notes form an integral part of these financial statements
24
Algebris Algebris Algebris Algebris
Financial Financial Allocation Financial
Total Credit Fund Income Fund Fund Equity Fund
30 June 30 June 30 June 30 June 30 June
2020 2020 2020 2020 2020
EUR EUR EUR EUR EUR
Net assets attributable to holders of redeemable
participating shares at beginning of financial period* 6,349,834,203 5,154,812,712 470,649,251 9,601,399 72,545,856
Decrease/increase in net assets attributable to holders
of redeemable participating shares from operations** (146,378,845) (68,862,841) (58,478,533) (775,809) (17,633,534)
Proceeds from redeemable participating shares issued***
issued
2,358,228,302 2,110,691,759 64,494,162 335,746 10,348,343
Payment on redemption of redeemable participating shares
issued*** (2,138,584,111) (1,780,938,764) (187,810,143) (2,214,475) (18,247,517)
Net assets attributable to holders of redeemable
participating shares at end of financial period 6,423,099,549 5,415,702,866 288,854,737 6,946,861 47,013,148
*Cross holdings of EUR 9,652,337 in net assets attributable to holders of redeemable participating shares at beginning of financial period have been eliminated from the Company total.
**Investment loss of EUR 413,481 due to loss earned from cross holdings have been eliminated from the Company total.
***Share transactions of EUR 10,796,993 due to cross holdings have been eliminated from the Company total.

ALGEBRIS UCITS FUNDS PLC
Unaudited Statement of Changes in Net Assets Attributable to Holders of Redeemable Participating Shares (continued)
for the period from 1 January 2020 to 30 June 2020
The accompanying notes form an integral part of these financial statements
25
Algebris Algebris Algebris Algebris
Global Credit Core Italy Quant Arbitrage IG Financial Credit
Opportunities Fund**** Fund Fund***** Fund
30 June 30 June 30 June 30 June
2020 2020 2020 2020
EUR EUR EUR EUR
Net assets attributable to holders of redeemable
participating shares at beginning of financial period 528,960,175 48,898,496 35,337,760 38,680,891
Decrease/increase in net assets attributable to holders
of redeemable participating shares from operations 16,481,876 (6,424,157) (14,320,996) 3,221,668
Proceeds from redeemable participating shares issued
issued
52,673,616 6,098,122 5,692,662 121,056,034
Payment on redemption of redeemable participating shares
issued (114,045,371) (5,630,467) (26,709,426) (5,353,097)
Net assets attributable to holders of redeemable
participating shares at end of financial period 484,070,296 42,941,994 - 157,605,496
****Formerly known as Algebris Macro Credit Fund.
*****The Algebris Quant Arbitrage Fund portfolio of investments was liquidated into cash on 19 March 2020 and final redemptions were made as at 5 May 2020.

ALGEBRIS UCITS FUNDS PLC
Unaudited Statement of Changes in Net Assets Attributable to Holders of Redeemable Participating Shares (continued)
for the period from 1 January 2019 to 30 June 2019
The accompanying notes form an integral part of these financial statements
26
Algebris Algebris Algebris Algebris
Financial Financial Allocation Financial
Total Credit Fund Income Fund Fund Equity Fund
30 June 30 June 30 June 30 June 30 June
2019 2019 2019 2019 2019
EUR EUR EUR EUR EUR
Net assets attributable to holders of redeemable
participating shares at beginning of financial period 5,640,298,822 4,323,313,890 472,310,644 12,134,254 80,288,782
Increase in net assets attributable to holders
of redeemable participating shares from operations 471,857,999 338,624,080 57,274,546 660,202 9,546,046
Proceeds from redeemable participating shares issued*
issued
1,036,631,194 859,764,382 137,302,230 942,775 13,167,639
Payment on redemption of redeemable participating shares
issued (1,414,651,393) (1,022,089,666) (176,792,363) (3,163,741) (19,811,929)
Net assets attributable to holders of redeemable
participating shares at end of financial period 5,734,136,622 4,499,612,686 490,095,057 10,573,490 83,190,538
*Share transactions of EUR 6,903,979 due to cross holdings have been eliminated from the Company total.

ALGEBRIS UCITS FUNDS PLC
Unaudited Statement of Changes in Net Assets Attributable to Holders of Redeemable Participating Shares (continued)
for the period from 1 January 2019 to 30 June 2019
The accompanying notes form an integral part of these financial statements
27
Algebris Algebris Algebris
Global Credit Core Italy Quant Arbitrage
Opportunities Fund*** Fund Fund
30 June 30 June 30 June
2019 2019 2019
EUR EUR EUR
Net assets attributable to holders of redeemable
participating shares at beginning of financial period 704,095,328 35,995,510 12,160,414
Increase in net assets attributable to holders
of redeemable participating shares from operations 61,854,654 4,079,374 73,155
Proceeds from redeemable participating shares issued
issued
20,500,332 4,736,359 7,121,456
Payment on redemption of redeemable participating shares
issued (188,059,751) (2,650,818) (2,083,125)
Net assets attributable to holders of redeemable
participating shares at end of financial period 598,390,563 42,160,425 17,271,900
*** Formerly known as Algebris Macro Credit Fund.
ALGEBRIS UCITS FUNDS PLC
Unaudited Statement of Cash Flows
for the period from 1 January 2020 to 30 June 2020
The accompanying notes form an integral part of these financial statements
28
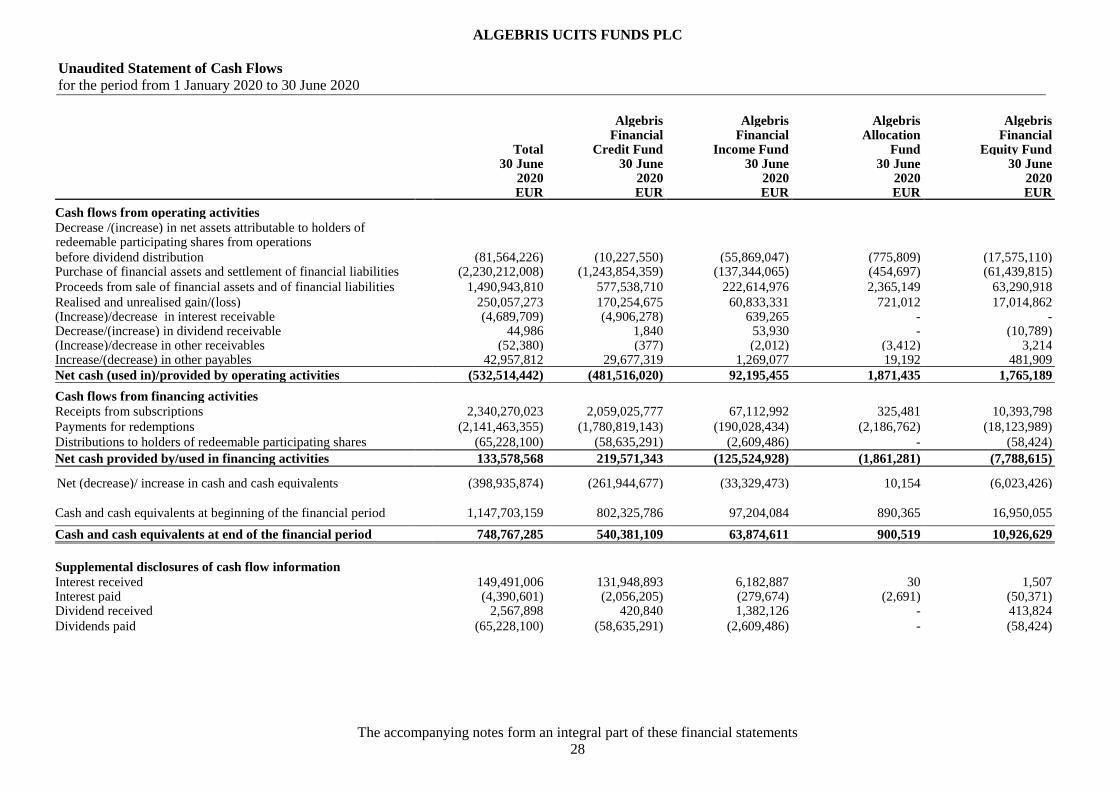
Algebris Algebris Algebris Algebris Financial Financial Allocation Financial Total Credit Fund Income Fund Fund Equity Fund 30 June 30 June 30 June 30 June 30 June 2020 2020 2020 2020 2020 EUR EUR EUR EUR EUR
Cash flows from operating activities
Decrease /(increase) in net assets attributable to holders of redeemable participating shares from operations
before dividend distribution (81,564,226) (10,227,550) (55,869,047) (775,809) (17,575,110) Purchase of financial assets and settlement of financial liabilities (2,230,212,008) (1,243,854,359) (137,344,065) (454,697) (61,439,815)
Proceeds from sale of financial assets and of financial liabilities 1,490,943,810 577,538,710 222,614,976 2,365,149 63,290,918
Realised and unrealised gain/(loss)
250,057,273 170,254,675 60,833,331 721,012 17,014,862 (Increase)/decrease in interest receivable (4,689,709) (4,906,278) 639,265 - - Decrease/(increase) in dividend receivable 44,986 1,840 53,930 - (10,789) (Increase)/decrease in other receivables (52,380) (377) (2,012) (3,412) 3,214 Increase/(decrease) in other payables 42,957,812 29,677,319 1,269,077 19,192 481,909
Net cash (used in)/provided by operating activities (532,514,442) (481,516,020) 92,195,455 1,871,435 1,765,189
Cash flows from financing activities
Receipts from subscriptions 2,340,270,023 2,059,025,777 67,112,992 325,481 10,393,798
Payments for redemptions (2,141,463,355) (1,780,819,143) (190,028,434) (2,186,762) (18,123,989)
Distributions to holders of redeemable participating shares (65,228,100) (58,635,291) (2,609,486) - (58,424)
Net cash provided by/used in financing activities
133,578,568 219,571,343 (125,524,928) (1,861,281) (7,788,615)
Net (decrease)/ increase in cash and cash equivalents (398,935,874) (261,944,677) (33,329,473) 10,154 (6,023,426)
Cash and cash equivalents at beginning of the financial period 1,147,703,159 802,325,786 97,204,084 890,365 16,950,055
Cash and cash equivalents at end of the financial period 748,767,285 540,381,109 63,874,611 900,519 10,926,629
Supplemental disclosures of cash flow information
Interest received 149,491,006 131,948,893 6,182,887 30 1,507 Interest paid (4,390,601) (2,056,205) (279,674) (2,691) (50,371) Dividend received 2,567,898 420,840 1,382,126 - 413,824
Dividends paid (65,228,100) (58,635,291) (2,609,486) - (58,424)
ALGEBRIS UCITS FUNDS PLC
Unaudited Statement of Cash Flows (continued)
for the period from 1 January 2020 to 30 June 2020
The accompanying notes form an integral part of these financial statements
29
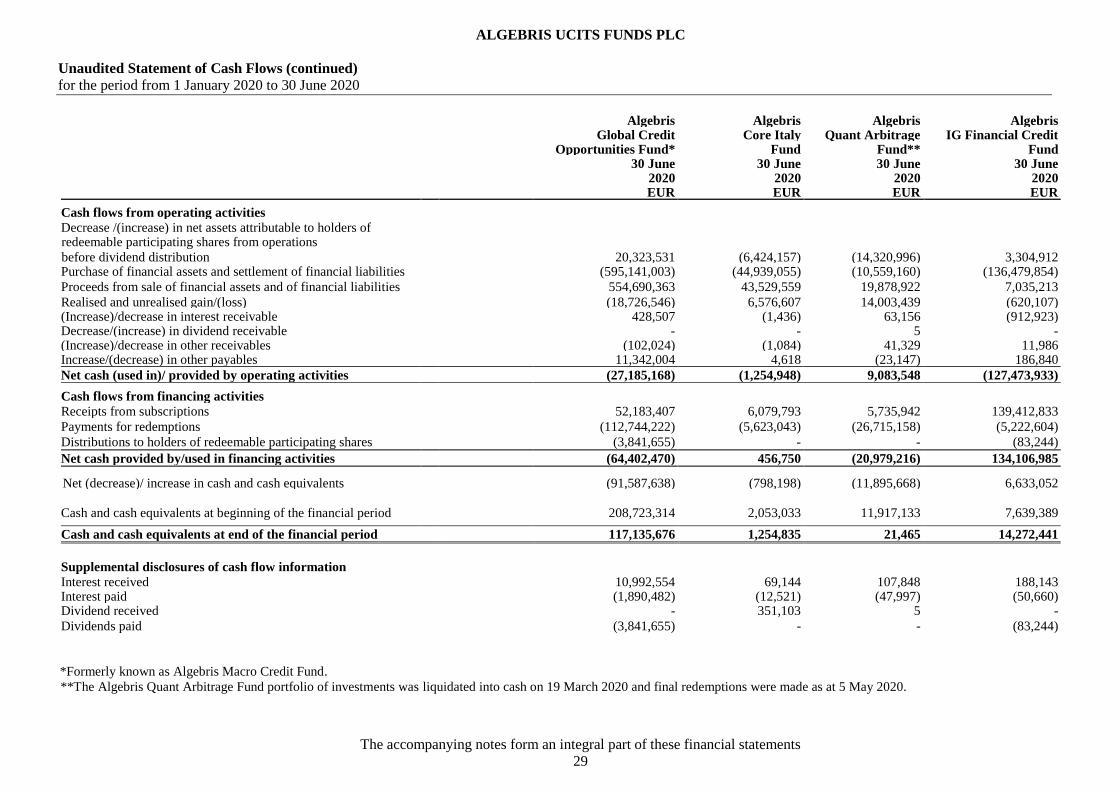
Algebris Algebris Algebris Algebris Global Credit Core Italy Quant Arbitrage IG Financial Credit Opportunities Fund* Fund Fund** Fund 30 June 30 June 30 June 30 June 2020 2020 2020 2020 EUR EUR EUR EUR
Cash flows from operating activities
Decrease /(increase) in net assets attributable to holders of redeemable participating shares from operations
before dividend distribution 20,323,531 (6,424,157) (14,320,996) 3,304,912 Purchase of financial assets and settlement of financial liabilities (595,141,003) (44,939,055) (10,559,160) (136,479,854)
Proceeds from sale of financial assets and of financial liabilities 554,690,363 43,529,559 19,878,922 7,035,213
Realised and unrealised gain/(loss)
(18,726,546) 6,576,607 14,003,439 (620,107) (Increase)/decrease in interest receivable 428,507 (1,436) 63,156 (912,923) Decrease/(increase) in dividend receivable - - 5 - (Increase)/decrease in other receivables (102,024) (1,084) 41,329 11,986 Increase/(decrease) in other payables 11,342,004 4,618 (23,147) 186,840
Net cash (used in)/ provided by operating activities (27,185,168) (1,254,948) 9,083,548 (127,473,933)
Cash flows from financing activities
Receipts from subscriptions 52,183,407 6,079,793 5,735,942 139,412,833
Payments for redemptions (112,744,222) (5,623,043) (26,715,158) (5,222,604)
Distributions to holders of redeemable participating shares (3,841,655) - - (83,244)
Net cash provided by/used in financing activities
(64,402,470) 456,750 (20,979,216) 134,106,985
Net (decrease)/ increase in cash and cash equivalents (91,587,638) (798,198) (11,895,668) 6,633,052
Cash and cash equivalents at beginning of the financial period 208,723,314 2,053,033 11,917,133 7,639,389
Cash and cash equivalents at end of the financial period 117,135,676 1,254,835 21,465 14,272,441
Supplemental disclosures of cash flow information
Interest received 10,992,554 69,144 107,848 188,143 Interest paid (1,890,482) (12,521) (47,997) (50,660) Dividend received - 351,103 5 -
Dividends paid (3,841,655) - - (83,244)
*Formerly known as Algebris Macro Credit Fund.
**The Algebris Quant Arbitrage Fund portfolio of investments was liquidated into cash on 19 March 2020 and final redemptions were made as at 5 May 2020.

ALGEBRIS UCITS FUNDS PLC
Unaudited Statement of Cash Flows (continued)
for the period from 1 January 2019 to 30 June 2019
The accompanying notes form an integral part of these financial statements
30
Algebris Algebris Algebris Algebris Financial Financial Allocation Financial Total Credit Fund Income Fund Fund Equity Fund 30 June 30 June 30 June 30 June 30 June 2019 2019 2019 2019 2019 EUR EUR EUR EUR EUR
Cash flows from operating activities
Increase in net assets attributable to holders of redeemable participating shares from operations
before dividend distribution 540,092,352 395,222,248 62,368,152 660,202 9,677,498 Purchase of financial assets and settlement of financial liabilities (1,246,868,414) (501,401,998) (145,951,184) (23,292,544) (70,471,719)
Proceeds from sale of financial assets and of financial liabilities 2,006,640,718 978,821,457 219,636,301 25,012,941 88,920,779
Realised and unrealised (loss)/gain
(462,807,788) (330,440,397) (54,659,276) (746,648) (8,697,001) Decrease /(increase) in interest receivable 11,212,525 8,249,498 (33,560) 38,885 (9,049) (Increase)/decrease in dividend receivable (119,029) 301 (149,456) 880 33,001 (Increase)/decrease in other receivables (63,117) (6,147) (6,137) (14,643) (4,359) Increase/(decrease) in other payables 17,028,960 7,904,512 (78,939) (12,017) 2,936,077
Net cash provided by/(used in) operating activities 865,116,207 558,349,474 81,125,901 1,647,056 22,385,227
Cash flows from financing activities
Receipts from subscriptions 1,007,648,251 824,331,262 138,193,012 342,035 13,299,335
Payments for redemptions (1,412,216,471) (1,020,819,424) (174,661,721) (3,142,760) (19,837,296)
Distributions to holders of redeemable participating shares (67,980,295) (56,598,168) (5,093,606) - (131,452)
Net cash used in financing activities
(472,548,515) (253,086,330) (41,562,315) (2,800,725) (6,669,413)
Net increase/(decrease) in cash and cash equivalents 392,567,692 305,263,144 39,563,586 (1,153,669) 15,715,814
Cash and cash equivalents at beginning of the financial period 456,596,703 282,137,644 51,079,426 1,937,130 10,582,250
Cash and cash equivalents at end of the financial period 849,164,395 587,400,788 90,643,012 783,461 26,298,064
Supplemental disclosures of cash flow information
Interest received 168,807,209 137,221,939 8,097,968 69,280 42,103 Interest paid (2,626,947) (1,232,517) (216,369) (5,696) (77,329)
Dividend received 5,980,979 402,676 3,973,747 14,439 1,077,604
Dividends paid (68,026,840) (56,598,168) (5,093,606) - (150,300)

ALGEBRIS UCITS FUNDS PLC
Unaudited Statement of Cash Flows (continued)
for the period from 1 January 2019 to 30 June 2019
The accompanying notes form an integral part of these financial statements
31
Algebris Algebris Algebris Global Credit Core Italy Quant Arbitrage Opportunities Fund** Fund Fund 30 June 30 June 30 June 2019 2019 2019 EUR EUR EUR
Cash flows from operating activities
Decrease in net assets attributable to holders of redeemable participating shares from operations
before dividend distribution 68,011,723 4,079,374 73,155 Purchase of financial assets and settlement of financial liabilities (449,656,796) (34,268,076) (21,826,097)
Proceeds from sale of financial assets and of financial liabilities 645,386,717 31,906,927 16,955,596
Realised and unrealised (loss)/gain
(64,816,431) (3,374,506) (73,529) Decrease /(increase) in interest receivable 2,961,806 115,958 (111,013) (Increase)/decrease in dividend receivable - - (3,755) (Increase)/decrease in other receivables (2,681) (4,406) (24,744) Increase/(decrease) in other payables 5,791,850 431,408 56,069
Net cash (used in)/provided by operating activities 207,676,188 (1,113,321) (4,954,318)
Cash flows from financing activities
Receipts from subscriptions 19,595,461 4,765,690 7,121,456
Payments for redemptions (189,370,633) (2,301,512) (2,083,125)
Distributions to holders of redeemable participating shares (6,157,069) - -
Net cash used in/provided by financing activities
(175,932,241) 2,464,178 5,038,331 Net increase in cash and cash equivalents 31,743,947 1,350,857 84,013
Cash and cash equivalents at beginning of the financial period 106,258,158 794,750 3,807,345
Cash and cash equivalents at end of the financial period 138,002,105 2,145,607 3,891,358
Supplemental disclosures of cash flow information
Interest received 22,854,953 520,966 - Interest paid (1,066,347) (20,325) (8,364) Dividend received - 512,513 -
Dividends paid (6,157,069) (27,697) -
** Formerly known as Algebris Macro Credit Fund.
ALGEBRIS UCITS FUNDS PLC
Notes to the Unaudited Financial Statements
for the period from 1 January 2020 to 30 June 2020
32
1. Principal accounting policies
The principal accounting policies adopted by the Company in the preparation of these financial statements are set out
below.
(a) Basis of preparation
The condensed financial statements of the Company have been prepared in accordance with IAS 34, Interim Financial
Reporting, Irish Statute comprising the Companies Acts 2014 (as amended), the European Communities (Undertakings for
Collective Investment in Transferable Securities) Regulations, 2011, as amended (the “UCITS Regulations”) and the Central
Bank (Supervision and Enforcement) Act 2013 (Section 48(1)) (Undertakings for Collective Investment in Transferable
Securities) Regulations 2019 (the “Central Bank UCITS Regulations”).
These condensed interim financial statements do not contain all of the information and disclosures required in the full annual
financial statements and should be read in conjunction with the financial statements of the Company for the financial year ended
31 December 2019, which have been prepared in accordance with International Financial Reporting Standards (“IFRS”).
The accounting policies and methods of computation applied by the Company in these condensed financial statements are the
same as those applied by the Company in its annual financial statements as at and for the year ended 31 December 2019.
(b) Financial assets and liabilities at fair value through profit or loss
Derivative financial instruments
Forward foreign exchange contracts A forward foreign currency contract involves an obligation to purchase or sell a specific currency at a future date, at a price set
at the time the contract is made. Forward foreign currency contracts are valued by reference to the forward price at which a new
forward foreign currency contract of the same size and maturity could be undertaken at the valuation date. The unrealised gain
or loss on open forward foreign currency contracts is calculated as the difference between the contract rate and the forward
price and is recognised in the Statement of Financial Position and the Statement of Comprehensive Income. Realised and change
in unrealised gains or losses on forward contracts are recognised in the Statement of Comprehensive Income. Where a forward
foreign currency contract is purchased to hedge the currency risk of a specific class which is issued in a currency other than the
measurement currency of the Company, all gains and losses on that forward foreign currency contract are allocated to that class.
Contracts for difference Contracts for difference are agreements between the Company and third parties, which allow the Company to acquire an
exposure to the price movement of specific securities without actually purchasing the securities. The changes in contract values
are recorded as unrealised gains or losses and the Company recognises a realised gain or loss when the contract is closed.
Realised and unrealised gains and losses on contracts for difference are recognised in the Statement of Comprehensive Income.
At each valuation point the difference in price between the contract price of the contracts for difference and the market price of
the underlying equity is recorded as the fair value (unrealised gain or loss) of the contracts for difference. When a contract for
difference is closed the difference between the contract price of the contract for difference and the market price is recorded as
a realised fair value gain or loss in the Statement of Comprehensive Income.
Futures Futures are contracts for delayed delivery of commodities in which the seller agrees to make delivery at a specific future date
of a specific commodity, at a specified price or yield. Gains and losses on futures are recorded by the Sub-Funds based on
market fluctuations and are recorded as realised or unrealised gains/(losses) or other income dependent upon settlement terms
of the contracts held. Futures are valued at fair value based on the settlement price on the relevant valuation date.

ALGEBRIS UCITS FUNDS PLC
Notes to the Unaudited Financial Statements (continued)
for the period from 1 January 2020 to 30 June 2020
33
1. Principal accounting policies (continued)
(b) Financial assets and liabilities at fair value through profit or loss (continued)
Options An option is a financial contract that gives an investor the right, but not the obligation, to either buy or sell an asset at a predetermined price (known as the strike price) by a specified date (known as the expiration date). Options are valued at fair value based on the closing price on the relevant valuation date provided by the relevant counterparty. The premium on written call options exercised is added to the proceeds from the sale of the underlying security or foreign currency in determining the realised gain or loss. The premium on written put options exercised is subtracted from the cost of the securities or foreign currencies purchased. Premiums received from written options, which expire unexercised, are treated as realised gains. For unsettled positions, unrealised gains or losses are recognised in the Statement of Comprehensive Income. Swaps Generally, a swap contract is an agreement that obligates two parties to exchange a series of cash flows at specified intervals based upon or calculated by reference to changes in specified prices or rates for a specified notional amount of the underlying assets. The payment flows are usually netted against each other, with the difference being paid by one party to the other. Equity swaps are valued based on the underlying security. OTC swaps are valued at fair value by an external vendor Markit. Repurchase agreements When a Fund sells a Financial asset and simultaneously enters into an agreement to repurchase the same or a similar asset at a fixed price on a future date (sale and repurchase agreement), the arrangement is accounted for as borrowing and is recognised in the statement of financial position as a payable under a sale and repurchase agreement, and the underlying asset is reclassified in the Fund’s statement of financial position to pledged financial assets at FVTPL. A repurchase agreement (repo) is when a fund sells the financial assets and enters into an agreement with a counterparty to lend them a specific investment in exchange for cash as collateral. The Company values repurchase agreements at fair value. Equity Warrants Warrants are recorded as an asset or liability at their fair value on the Statement of Financial Position. Fair value as determined by the Administrator is the quoted market price as provided by electronic feed from one or more reputable price vendors. The change in fair value, if any, is recorded as an unrealised gain or loss in the Statement of Comprehensive Income. Realised gains or losses on warrants are shown in the Statement of Comprehensive Income. On the expiry of a warrant the amount previously recognised in the Statement of Financial Position is recognised in the Statement of Comprehensive Income as a realised gain or loss. Realised and unrealised gains and losses on all derivative contracts are recognised in the Statement of Comprehensive Income. (c) Elimination of cross holdings Algebris Allocation Fund, a Sub-Fund of the Company holds investments in Class M Accumulating Shares of Algebris Financial Credit Fund, Algebris Financial Income Fund, Algebris Financial Equity Fund, Algebris Global Credit Opportunities Fund, Algebris Core Italy Fund and Algebris IG Financial Credit Fund, all of which are also Sub-Funds of the Company. Algebris IG Financial Credit Fund, a Sub-Fund of the Company holds investments in Algebris Financial Credit Fund Class M Accumulating which is also a Sub-Fund of the Company. For the purposes of determining the net assets and results of the Company, these cross holdings are eliminated so that the total amounts only reflect external assets and liabilities of the Company as a whole. This elimination for the purpose of ascertaining the total Company results and net assets does not have any effect on the results and net assets of any individual Sub-Fund.

ALGEBRIS UCITS FUNDS PLC
Notes to the Unaudited Financial Statements (continued)
for the period from 1 January 2020 to 30 June 2020
34
2. Financial assets and liabilities at fair value through profit or loss Algebris Algebris Algebris Algebris
Financial Financial Allocation Financial
Total Credit Fund Income Fund Fund Equity Fund
30 June 30 June 30 June 30 June 30 June
2020 2020 2020 2020 2020
EUR EUR EUR EUR EUR
Financial assets at fair value through profit or loss
Investment funds** - - - 6,038,169 -
Transferable securities
- Equity securities* 167,520,447 14,361,312 81,586,651 - 30,874,986
- Fixed income 5,428,105,413 4,799,195,524 138,134,339 - 5,006,875
- Fixed income pledged as collateral 2,884,805 - - - -
Financial derivatives
- Contracts for difference 7,299,666 - 4,957,251 - 1,684,835
- Equity warrants 370,596 - 93,074 - -
- Forward foreign exchange contracts 26,829,906 23,178,004 1,798,709 536 353,884
- Futures 75,634 - - - -
- Options 14,530,969 6,078,228 1,263,913 - 236,259
- Other swaps 6,915,568 - - - -
Total financial assets at fair value through profit or loss 5,654,533,004 4,842,813,068 227,833,937 6,038,705 38,156,839
Financial liabilities at fair value through profit or loss
Financial derivatives
- Contracts for difference (755,021) - (91,419) - (663,602)
- Forward foreign exchange contracts (40,785,374) (35,677,653) (1,724,577) (4,161) (367,695)
- Futures (11,382,441) (7,755,813) (781,158) - (136,349)
- Options (4,084,205) - (240,145) - (42,874)
- Other swaps (4,298,702) - - - -
Repurchase Agreements (4,476,451) - - - -
Total financial liabilities at fair value through profit or loss (65,782,194) (43,433,466) (2,837,299) (4,161) (1,210,520)
ALGEBRIS UCITS FUNDS PLC
Notes to the Unaudited Financial Statements (continued)
for the period from 1 January 2020 to 30 June 2020
35
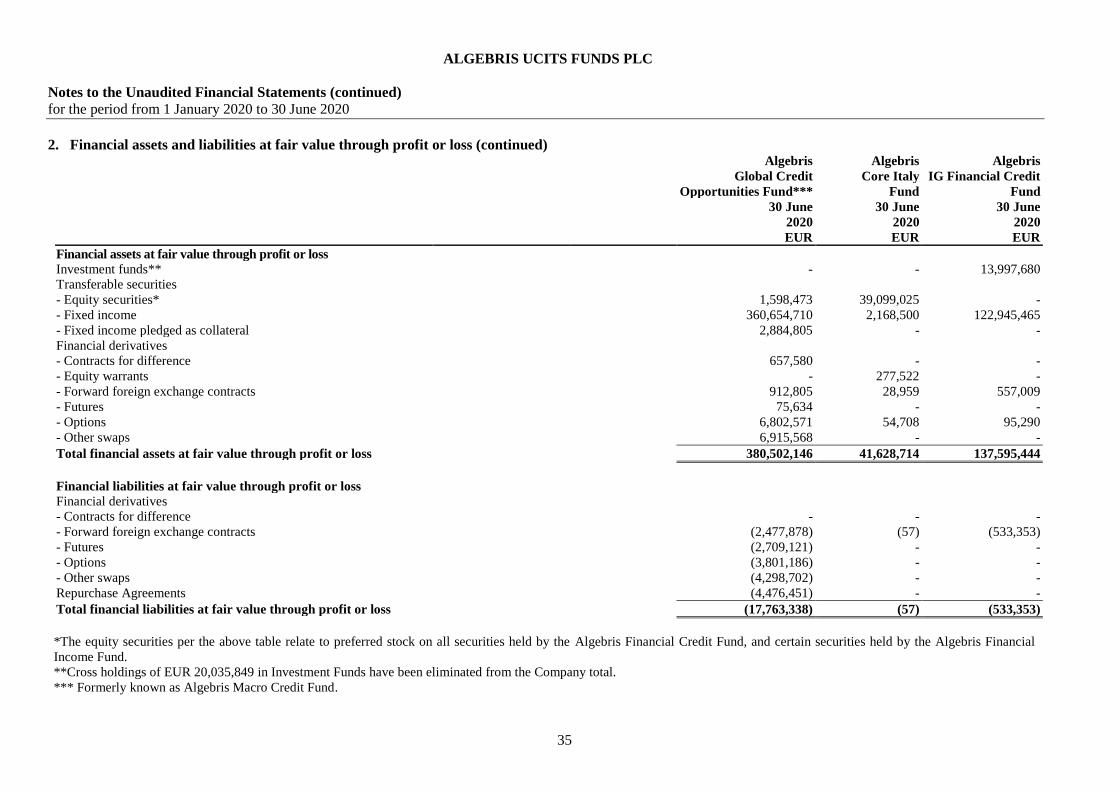
2. Financial assets and liabilities at fair value through profit or loss (continued) Algebris Algebris Algebris
Global Credit Core Italy IG Financial Credit
Opportunities Fund*** Fund Fund
30 June 30 June 30 June
2020 2020 2020
EUR EUR EUR
Financial assets at fair value through profit or loss
Investment funds** - - 13,997,680
Transferable securities
- Equity securities* 1,598,473 39,099,025 -
- Fixed income 360,654,710 2,168,500 122,945,465
- Fixed income pledged as collateral 2,884,805 - -
Financial derivatives
- Contracts for difference 657,580 - -
- Equity warrants - 277,522 -
- Forward foreign exchange contracts 912,805 28,959 557,009
- Futures 75,634 - -
- Options 6,802,571 54,708 95,290
- Other swaps 6,915,568 - -
Total financial assets at fair value through profit or loss 380,502,146 41,628,714 137,595,444
Financial liabilities at fair value through profit or loss
Financial derivatives
- Contracts for difference - - -
- Forward foreign exchange contracts (2,477,878) (57) (533,353)
- Futures (2,709,121) - -
- Options (3,801,186) - -
- Other swaps (4,298,702) - -
Repurchase Agreements (4,476,451) - -
Total financial liabilities at fair value through profit or loss (17,763,338) (57) (533,353)
*The equity securities per the above table relate to preferred stock on all securities held by the Algebris Financial Credit Fund, and certain securities held by the Algebris Financial
Income Fund.
**Cross holdings of EUR 20,035,849 in Investment Funds have been eliminated from the Company total. *** Formerly known as Algebris Macro Credit Fund.
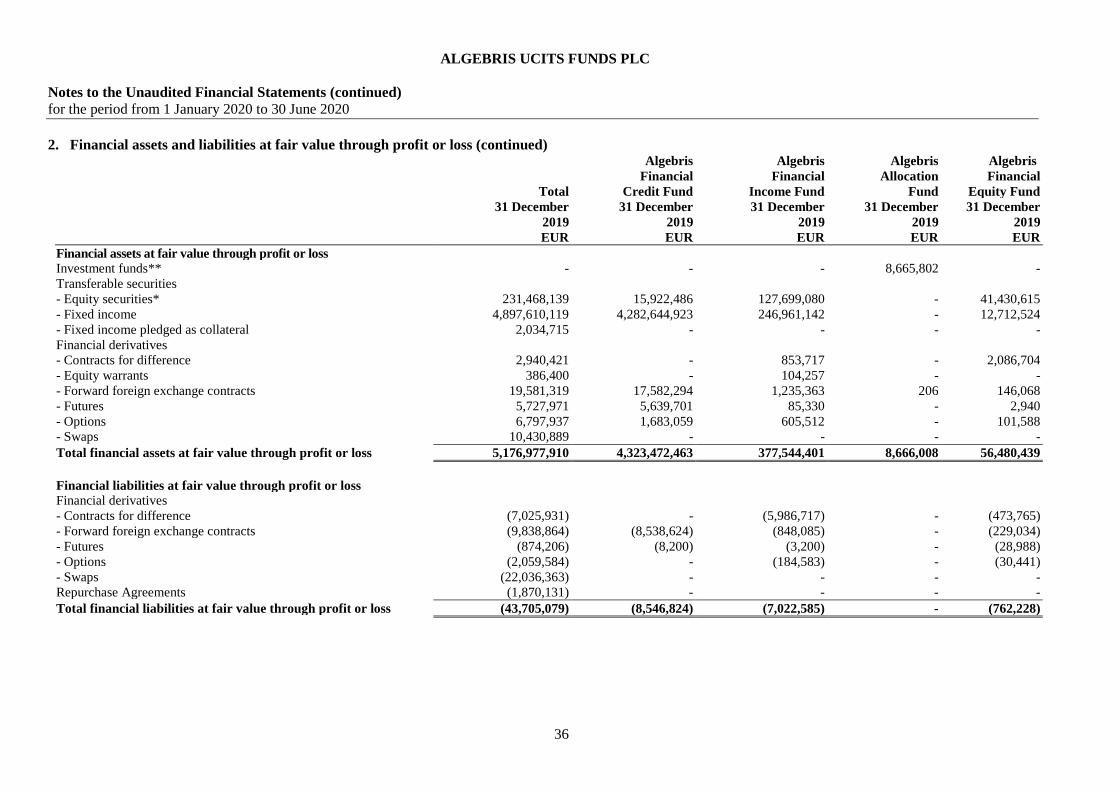
ALGEBRIS UCITS FUNDS PLC
Notes to the Unaudited Financial Statements (continued)
for the period from 1 January 2020 to 30 June 2020
36
2. Financial assets and liabilities at fair value through profit or loss (continued) Algebris Algebris Algebris Algebris
Financial Financial Allocation Financial
Total Credit Fund Income Fund Fund Equity Fund
31 December 31 December 31 December 31 December 31 December
2019 2019 2019 2019 2019
EUR EUR EUR EUR EUR
Financial assets at fair value through profit or loss
Investment funds** - - - 8,665,802 -
Transferable securities
- Equity securities* 231,468,139 15,922,486 127,699,080 - 41,430,615
- Fixed income 4,897,610,119 4,282,644,923 246,961,142 - 12,712,524
- Fixed income pledged as collateral 2,034,715 - - - -
Financial derivatives
- Contracts for difference 2,940,421 - 853,717 - 2,086,704
- Equity warrants 386,400 - 104,257 - -
- Forward foreign exchange contracts 19,581,319 17,582,294 1,235,363 206 146,068
- Futures 5,727,971 5,639,701 85,330 - 2,940
- Options 6,797,937 1,683,059 605,512 - 101,588
- Swaps 10,430,889 - - - -
Total financial assets at fair value through profit or loss 5,176,977,910 4,323,472,463 377,544,401 8,666,008 56,480,439
Financial liabilities at fair value through profit or loss
Financial derivatives
- Contracts for difference (7,025,931) - (5,986,717) - (473,765)
- Forward foreign exchange contracts (9,838,864) (8,538,624) (848,085) - (229,034)
- Futures (874,206) (8,200) (3,200) - (28,988)
- Options (2,059,584) - (184,583) - (30,441)
- Swaps (22,036,363) - - - -
Repurchase Agreements (1,870,131) - - - -
Total financial liabilities at fair value through profit or loss (43,705,079) (8,546,824) (7,022,585) - (762,228)

ALGEBRIS UCITS FUNDS PLC
Notes to the Unaudited Financial Statements (continued)
for the period from 1 January 2020 to 30 June 2020
37
2. Financial assets and liabilities at fair value through profit or loss (continued) Algebris Algebris Algebris Algebris
Global Credit Core Italy Quant Arbitrage IG Financial
Opportunities Fund*** Fund Fund Credit Fund
31 December 31 December 31 December 31 December
2019 2019 2019 2019
EUR EUR EUR EUR
Financial assets at fair value through profit or loss
Investment funds** - - - 986,535
Transferable securities
- Equity securities* 2,164,124 44,251,834 - -
- Fixed income 323,686,053 2,284,686 23,314,279 6,006,512
- Fixed income pledged as collateral 2,034,715 - - -
Financial derivatives
- Contracts for difference - - - -
- Equity warrants - 282,143 - -
- Forward foreign exchange contracts 570,175 26,850 2 20,361
- Futures - - - -
- Options 4,407,778 - - -
- Swaps 10,430,889 - -
Total financial assets at fair value through profit or loss 343,293,734 46,845,513 23,314,281 7,013,408
Financial liabilities at fair value through profit or loss
Financial derivatives
- Contracts for difference (565,449) - - -
- Forward foreign exchange contracts (206,566) (5) (485) (16,065)
- Futures (833,478) (340) - -
- Options (1,844,560) - - -
- Swaps (22,036,363) - - -
Repurchase Agreements (1,870,131) - - -
Total financial liabilities at fair value through profit or loss (27,356,547) (345) (485) (16,065)
*The equity securities per the above table relate to preferred stock on all securities held by the Algebris Financial Credit Fund, and certain securities held by the Algebris Financial
Income Fund.
**Cross holdings of EUR 9,652,337 in Investment Funds have been eliminated from the Company total.
*** Formerly known as Algebris Macro Credit Fund.

ALGEBRIS UCITS FUNDS PLC
Notes to the Unaudited Financial Statements (continued)
for the period from 1 January 2020 to 30 June 2020
38
3. Cash and cash equivalents
The break-up of cash and cash equivalents with different custodians is detailed below:
Algebris Financial Credit Fund
Foreign
currency
equivalent
HSBC Bank Plc
EUR
BNP Paribas
EUR
Merrill Lynch
EUR
Total
30 June 2020
EUR
Cash
- held in local currency 232,684,645 267,580,770 22,188,047 522,453,462
- held in foreign currency (Cost: Euro 3,555,878) GBP 3,235,196 3,571,589 - - 3,571,589
- held in foreign currency (Cost: Euro 6,685,920) USD 7,511,130 6,687,076 - (412) 6,686,664
- held in foreign currency (Cost: Euro 0) (JPY 45) - - - -
- held in foreign currency (Cost: Euro 356,905) CHF 380,575 357,667 - - 357,667
- held in foreign currency (Cost: Euro 109,970) SGD 172,144 109,970 - - 109,970
- held in foreign currency (Cost: Euro (1)) (HKD 10) (1) - - (1)
Total 243,410,946 267,580,770 22,187,635 533,179,351
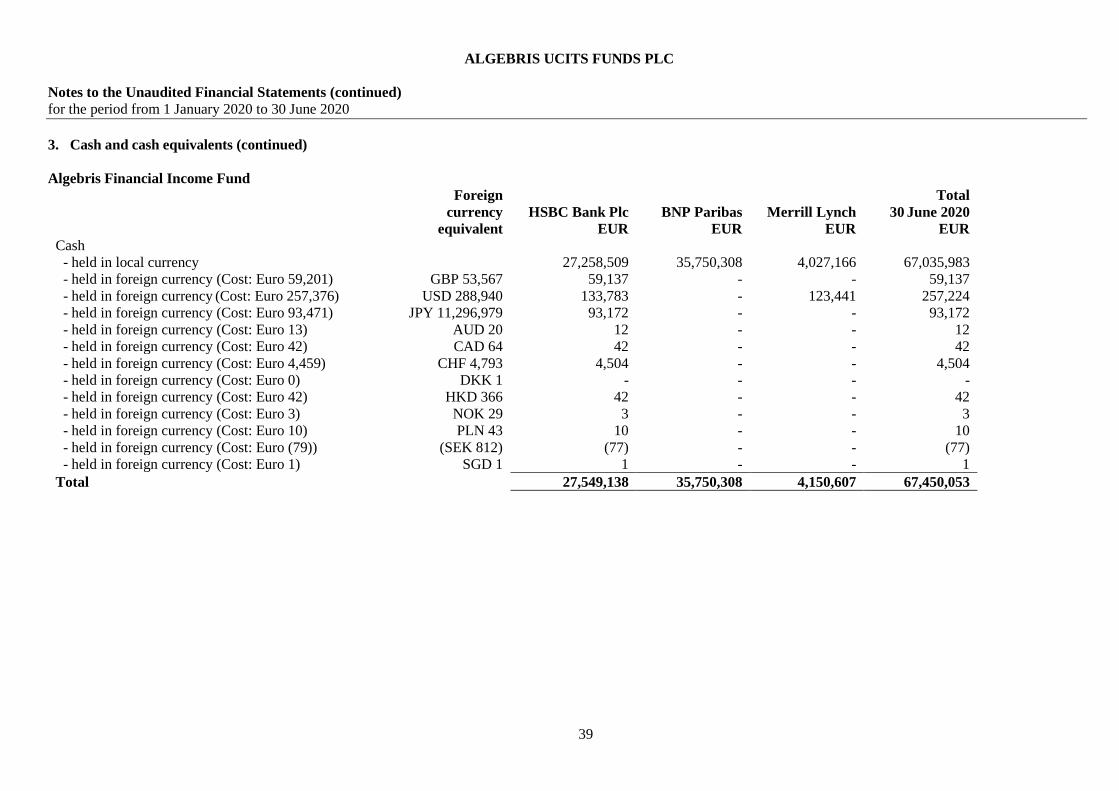
ALGEBRIS UCITS FUNDS PLC
Notes to the Unaudited Financial Statements (continued)
for the period from 1 January 2020 to 30 June 2020
39
3. Cash and cash equivalents (continued)
Algebris Financial Income Fund
Foreign
currency
equivalent
HSBC Bank Plc
EUR
BNP Paribas
EUR
Merrill Lynch
EUR
Total
30 June 2020
EUR
Cash
- held in local currency 27,258,509 35,750,308 4,027,166 67,035,983
- held in foreign currency (Cost: Euro 59,201) GBP 53,567 59,137 - - 59,137
- held in foreign currency (Cost: Euro 257,376) USD 288,940 133,783 - 123,441 257,224
- held in foreign currency (Cost: Euro 93,471) JPY 11,296,979 93,172 - - 93,172
- held in foreign currency (Cost: Euro 13) AUD 20 12 - - 12
- held in foreign currency (Cost: Euro 42) CAD 64 42 - - 42
- held in foreign currency (Cost: Euro 4,459) CHF 4,793 4,504 - - 4,504
- held in foreign currency (Cost: Euro 0) DKK 1 - - - -
- held in foreign currency (Cost: Euro 42) HKD 366 42 - - 42
- held in foreign currency (Cost: Euro 3) NOK 29 3 - - 3
- held in foreign currency (Cost: Euro 10) PLN 43 10 - - 10
- held in foreign currency (Cost: Euro (79)) (SEK 812) (77) - - (77)
- held in foreign currency (Cost: Euro 1) SGD 1 1 - - 1
Total 27,549,138 35,750,308 4,150,607 67,450,053

ALGEBRIS UCITS FUNDS PLC
Notes to the Unaudited Financial Statements (continued)
for the period from 1 January 2020 to 30 June 2020
40
3. Cash and cash equivalents (continued)
Algebris Allocation Fund
Foreign
currency
equivalent
HSBC Bank Plc
EUR
BNP Paribas
EUR
Total
30 June 2020
EUR
Cash
- held in local currency 495,751 409,618 905,369
- held in foreign currency (Cost: Euro (1)) (GBP 1) (1) - (1)
- held in foreign currency (Cost: Euro (2)) (USD 2) (2) - (2)
- held in foreign currency (Cost: Euro (6)) (JPY 699) (6) - (6)
- held in foreign currency (Cost: Euro (2)) (AUD 2) (1) - (1)
- held in foreign currency (Cost: Euro 57) CAD 88 58 - 58
- held in foreign currency (Cost: Euro (3)) (DKK 22) (3) - (3)
- held in foreign currency (Cost: Euro 7) HKD 60 7 - 7
- held in foreign currency (Cost: Euro (1)) (MXN 15) (1) - (1)
- held in foreign currency (Cost: Euro 8) NOK 79 7 - 7
- held in foreign currency (Cost: Euro (10)) (SGD 15) (9) - (9)
- held in foreign currency (Cost: Euro 0) ZAR 7 - - -
Total 495,800 409,618 905,418
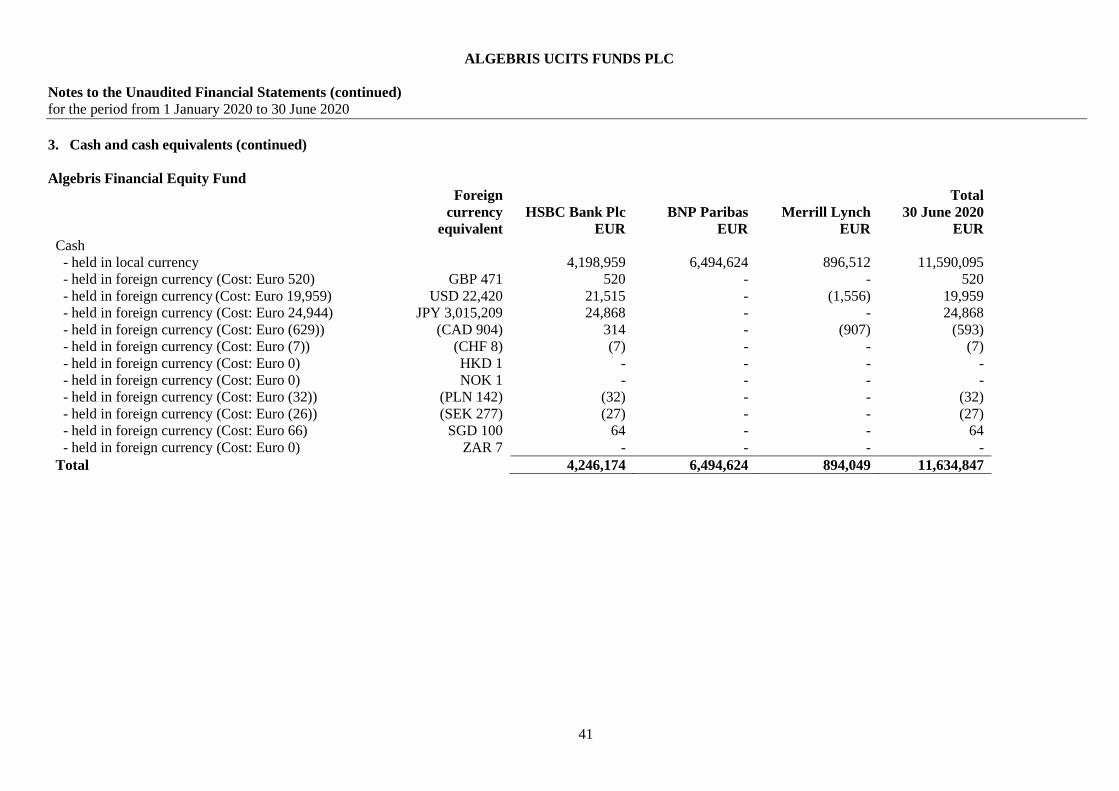
ALGEBRIS UCITS FUNDS PLC
Notes to the Unaudited Financial Statements (continued)
for the period from 1 January 2020 to 30 June 2020
41
3. Cash and cash equivalents (continued)
Algebris Financial Equity Fund
Foreign
currency
equivalent
HSBC Bank Plc
EUR
BNP Paribas
EUR
Merrill Lynch
EUR
Total
30 June 2020
EUR
Cash
- held in local currency 4,198,959 6,494,624 896,512 11,590,095
- held in foreign currency (Cost: Euro 520) GBP 471 520 - - 520
- held in foreign currency (Cost: Euro 19,959) USD 22,420 21,515 - (1,556) 19,959
- held in foreign currency (Cost: Euro 24,944) JPY 3,015,209 24,868 - - 24,868
- held in foreign currency (Cost: Euro (629)) (CAD 904) 314 - (907) (593)
- held in foreign currency (Cost: Euro (7)) (CHF 8) (7) - - (7)
- held in foreign currency (Cost: Euro 0) HKD 1 - - - -
- held in foreign currency (Cost: Euro 0) NOK 1 - - - -
- held in foreign currency (Cost: Euro (32)) (PLN 142) (32) - - (32)
- held in foreign currency (Cost: Euro (26)) (SEK 277) (27) - - (27)
- held in foreign currency (Cost: Euro 66) SGD 100 64 - - 64
- held in foreign currency (Cost: Euro 0) ZAR 7 - - - -
Total 4,246,174 6,494,624 894,049 11,634,847

ALGEBRIS UCITS FUNDS PLC
Notes to the Unaudited Financial Statements (continued)
for the period from 1 January 2020 to 30 June 2020
42
3. Cash and cash equivalents (continued)
Algebris Global Credit Opportunities Fund*
Foreign currency
equivalent
HSBC
Bank Plc
EUR
Merrill
Lynch
EUR
BNP
Paribas
EUR
Goldman
Sachs
EUR
JP
Morgan
EUR
Total
30 June
2020
EUR
Cash
- held in local currency 56,137,198 1,042,065 28,322,351 1 (102,497) 85,399,118
- held in foreign currency (Cost: Euro (923)) (GBP 840) (934) 7 (1) - - (928)
- held in foreign currency (Cost: Euro 309,899) USD 348,167 435,237 (92,740) - (32,544) (2) 309,951
- held in foreign currency (Cost: Euro (119)) (JPY 14,459) (80) (39) - - - (119)
- held in foreign currency (Cost: Euro (607)) (AUD 993) (610) - - - - (610)
- held in foreign currency (Cost: Euro 5) CAD 7 5 - - - - 5
- held in foreign currency (Cost: Euro 787) CHF 838 787 - - - - 787
- held in foreign currency (Cost: Euro 24) CNY 188 24 - - - - 24
- held in foreign currency (Cost: Euro 1) HKD 9 1 - - - - 1
- held in foreign currency (Cost: Euro (4)) (HUF 1,173) (3) - - - - (3)
- held in foreign currency (Cost: Euro 6,725,823) IDR 107,708,831,522 6,726,485 - - - - 6,726,485
- held in foreign currency (Cost: Euro (1,548)) (MXN 39,997) (1,548) - - - - (1,548)
- held in foreign currency (Cost: Euro (4)) (NZD 6) (4) - - - - (4)
- held in foreign currency (Cost: Euro (519)) (PLN 2,314) (521) - - - - (521)
- held in foreign currency (Cost: Euro 285) RUB 22,649 284 - - - - 284
- held in foreign currency (Cost: Euro 0) SEK 4 - - - - - -
- held in foreign currency (Cost: Euro 48) TRY 331 43 - - - - 43
- held in foreign currency (Cost: Euro (27)) (ZAR 551) (28) - - - - (28)
Total 63,296,336 949,293 28,322,350 (32,543) (102,499) 92,432,937
*Formerly known as Algebris Macro Credit Fund.

ALGEBRIS UCITS FUNDS PLC
Notes to the Unaudited Financial Statements (continued)
for the period from 1 January 2020 to 30 June 2020
43
3. Cash and cash equivalents (continued)
Algebris Core Italy Fund
Foreign
currency
equivalent
HSBC Bank Plc
EUR
BNP Paribas
EUR
Merrill
Lynch
EUR
Total
30 June 2020
EUR
Cash
- held in local currency 254,794 1,000,000 60 1,254,854
- held in foreign currency (Cost: Euro (1)) (GBP 1) (1) - - (1)
- held in foreign currency (Cost: Euro (17)) (USD 19) (17) - - (17)
- held in foreign currency (Cost: Euro (1)) (JPY 68) (1) - - (1)
- held in foreign currency (Cost: Euro (1)) (CHF 1) - - - -
Total 254,775 1,000,000 60 1,254,835
Algebris Quant Arbitrage Fund**
Foreign
currency
equivalent
HSBC Bank
Plc
EUR
Morgan
Stanley
EUR
Total
30 June 2020
EUR
Cash
- held in local currency 21,521 (93) 21,428
- held in foreign currency (Cost: Euro 46) USD 52 6 40 46
- held in foreign currency (Cost: Euro (1)) (JPY 59) - - -
- held in foreign currency (Cost: Euro (24)) (CAD 36) (24) - (24)
- held in foreign currency (Cost: Euro (1)) (CHF 1) (1) - (1)
- held in foreign currency (Cost: Euro (28)) (DKK 209) (28) - (28)
- held in foreign currency (Cost: Euro 2) MXN 33 1 - 1
- held in foreign currency (Cost: Euro 0) (NOK 1) - - -
- held in foreign currency (Cost: Euro 56) RUB 4,184 53 - 53
- held in foreign currency (Cost: Euro 0) (SEK 2) - - -
- held in foreign currency (Cost: Euro (11)) (ZAR 190) (10) - (10)
Total 21,518 (53) 21,465
**The sub-fund portfolio of investments was liquidated into cash on 19 March 2020 and final redemptions were made as at 5 May 2020.
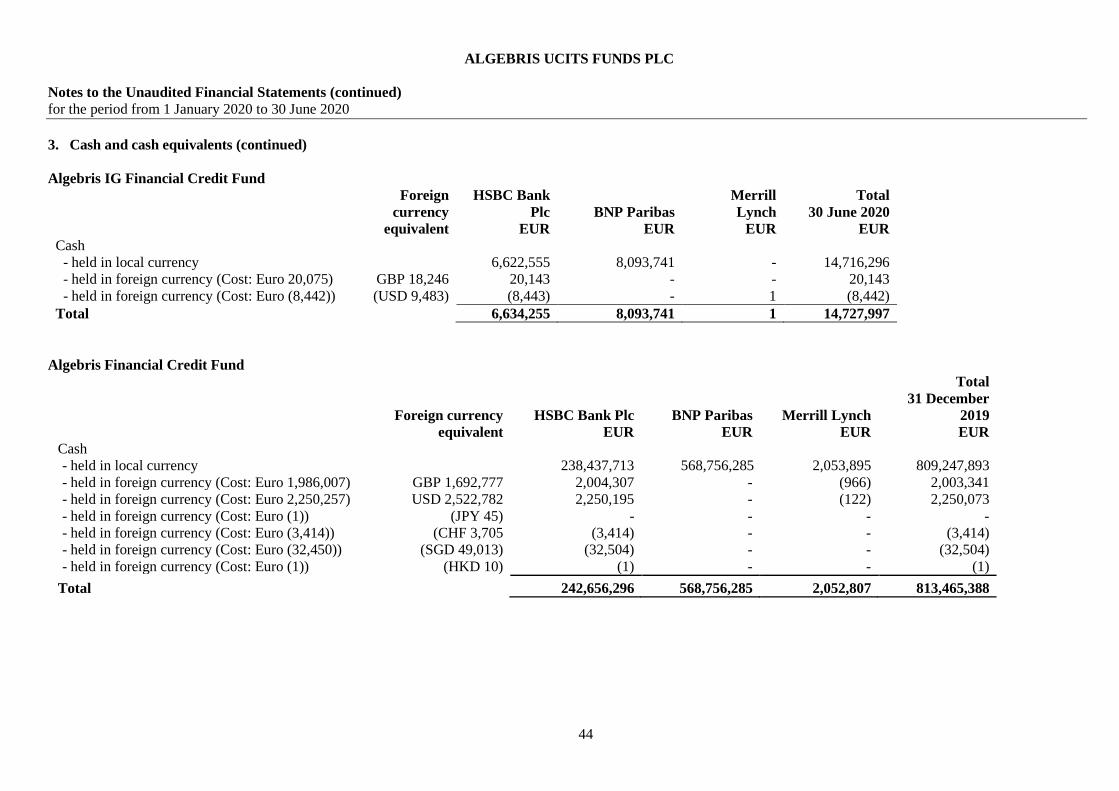
ALGEBRIS UCITS FUNDS PLC
Notes to the Unaudited Financial Statements (continued)
for the period from 1 January 2020 to 30 June 2020
44
3. Cash and cash equivalents (continued)
Algebris IG Financial Credit Fund
Foreign
currency
equivalent
HSBC Bank
Plc
EUR
BNP Paribas
EUR
Merrill
Lynch
EUR
Total
30 June 2020
EUR
Cash
- held in local currency 6,622,555 8,093,741 - 14,716,296
- held in foreign currency (Cost: Euro 20,075) GBP 18,246 20,143 - - 20,143
- held in foreign currency (Cost: Euro (8,442)) (USD 9,483) (8,443) - 1 (8,442)
Total 6,634,255 8,093,741 1 14,727,997
Algebris Financial Credit Fund
Foreign currency
equivalent
HSBC Bank Plc
EUR
BNP Paribas
EUR
Merrill Lynch
EUR
Total
31 December
2019
EUR
Cash
- held in local currency 238,437,713 568,756,285 2,053,895 809,247,893
- held in foreign currency (Cost: Euro 1,986,007) GBP 1,692,777 2,004,307 - (966) 2,003,341
- held in foreign currency (Cost: Euro 2,250,257) USD 2,522,782 2,250,195 - (122) 2,250,073
- held in foreign currency (Cost: Euro (1)) (JPY 45) - - - -
- held in foreign currency (Cost: Euro (3,414)) (CHF 3,705 (3,414) - - (3,414)
- held in foreign currency (Cost: Euro (32,450)) (SGD 49,013) (32,504) - - (32,504)
- held in foreign currency (Cost: Euro (1)) (HKD 10) (1) - - (1)
Total 242,656,296 568,756,285 2,052,807 813,465,388

ALGEBRIS UCITS FUNDS PLC
Notes to the Unaudited Financial Statements (continued)
for the period from 1 January 2020 to 30 June 2020
45
3. Cash and cash equivalents (continued)
Algebris Financial Income Fund
Foreign
currency
equivalent
HSBC Bank Plc
EUR
BNP Paribas
EUR
Merrill Lynch
EUR
Total
31 December
2019
EUR
Cash
- held in local currency 20,180,002 71,859,544 952,289 92,991,835
- held in foreign currency(Cost: Euro 94,840) GBP 80,602 95,390 - - 95,390
- held in foreign currency (Cost: Euro (160,807)) (USD 179,882) (160,437) - - (160,437)
- held in foreign currency (Cost: Euro (5)) (JPY 611) (5) - - (5)
- held in foreign currency (Cost: Euro 13) AUD 20 13 - - 13
- held in foreign currency (Cost: Euro 42) CAD 64 44 - - 44
- held in foreign currency (Cost: Euro 0) DKK 1 - - - -
- held in foreign currency (Cost: Euro 42) HKD 364 42 - - 42
- held in foreign currency (Cost: Euro 3) NOK 29 3 - - 3
- held in foreign currency (Cost: Euro 10) PLN 43 10 - - 10
- held in foreign currency (Cost: Euro (78)) (SEK 807) (77) - - (77)
- held in foreign currency (Cost: Euro (624)) (SGD 939) (623) - - (623)
Total 20,114,362 71,859,544 952,289 92,926,195
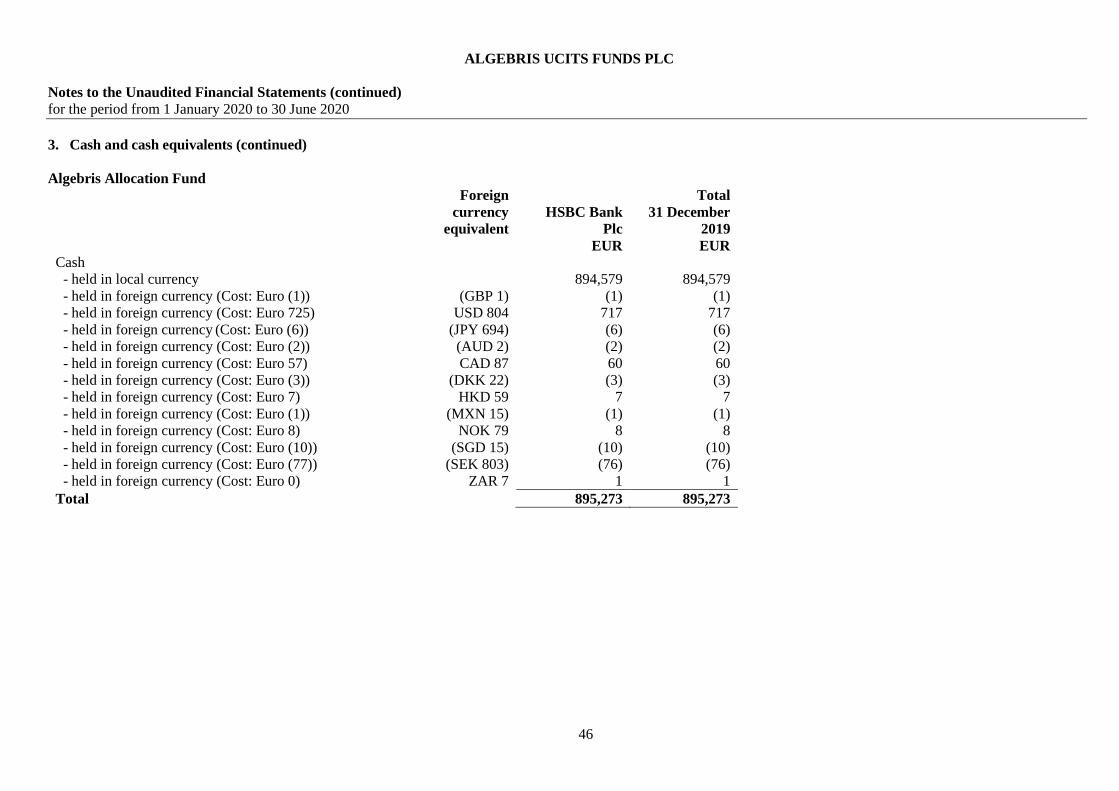
ALGEBRIS UCITS FUNDS PLC
Notes to the Unaudited Financial Statements (continued)
for the period from 1 January 2020 to 30 June 2020
46
3. Cash and cash equivalents (continued)
Algebris Allocation Fund
Foreign
currency
equivalent
HSBC Bank
Plc
EUR
Total
31 December
2019
EUR
Cash
- held in local currency 894,579 894,579
- held in foreign currency (Cost: Euro (1)) (GBP 1) (1) (1)
- held in foreign currency (Cost: Euro 725) USD 804 717 717
- held in foreign currency (Cost: Euro (6)) (JPY 694) (6) (6)
- held in foreign currency (Cost: Euro (2)) (AUD 2) (2) (2)
- held in foreign currency (Cost: Euro 57) CAD 87 60 60
- held in foreign currency (Cost: Euro (3)) (DKK 22) (3) (3)
- held in foreign currency (Cost: Euro 7) HKD 59 7 7
- held in foreign currency (Cost: Euro (1)) (MXN 15) (1) (1)
- held in foreign currency (Cost: Euro 8) NOK 79 8 8
- held in foreign currency (Cost: Euro (10)) (SGD 15) (10) (10)
- held in foreign currency (Cost: Euro (77)) (SEK 803) (76) (76)
- held in foreign currency (Cost: Euro 0) ZAR 7 1 1
Total 895,273 895,273

ALGEBRIS UCITS FUNDS PLC
Notes to the Unaudited Financial Statements (continued)
for the period from 1 January 2020 to 30 June 2020
47
3. Cash and cash equivalents (continued)
Algebris Financial Equity Fund
Foreign
currency
equivalent
HSBC Bank
Plc
EUR
BNP Paribas
EUR
Merrill Lynch
EUR
Total
31 December
2019
EUR
Cash
- held in local currency 6,175,679 11,999,869 403,530 18,579,078
- held in foreign currency (Cost: Euro 42,671) GBP 36,439 43,124 - - 43,124
- held in foreign currency (Cost: Euro 5,726) USD 6,406 66,157 - (60,444) 5,713
- held in foreign currency (Cost: Euro 3,655) BRL 16,454 3,651 - - 3,651
- held in foreign currency (Cost: Euro (872)) (CAD 1,282) 58 - (938) (880)
- held in foreign currency (Cost: Euro 0) NOK 1 - - - -
- held in foreign currency (Cost: Euro (32)) (PLN 140) (33) - - (33)
- held in foreign currency (Cost: Euro (25)) (SEK 275) (26) - - (26)
- held in foreign currency (Cost: Euro 66) SGD 100 66 - - 66
- held in foreign currency (Cost: Euro 0) ZAR 7 - - - -
Total 6,288,676 11,999,869 342,148 18,630,693

ALGEBRIS UCITS FUNDS PLC
Notes to the Unaudited Financial Statements (continued)
for the period from 1 January 2020 to 30 June 2020
48
3. Cash and cash equivalents (continued)
Algebris Global Credit Opportunities Fund*
Foreign
currency
equivalent
HSBC Bank
Plc
EUR
Merrill
Lynch
EUR
BNP
Paribas
EUR
CITI
Bank
EUR
Goldman
Sachs
EUR
JP
Morgan
EUR
Morgan
Stanley
EUR
Total
31 December
2019
EUR
Cash
- held in local currency 65,252,003 21,373,234 91,805,752 - 1 4 - 178,430,994
- held in foreign currency (Cost: Euro 21,651) GBP 18,540 27,791 (5,510) (1) - - (338) - 21,942
- held in foreign currency (Cost: Euro 1,576,856) USD 1,755,954 1,171,636 329,955 - (1) (1) (2) 64,551 1,566,138
- held in foreign currency (Cost: Euro (118)) (JPY 14,366) (79) (39) - - - - (118)
- held in foreign currency (Cost: Euro (2,070)) (AUD 3,361) 70 (2,174) - - - - - (2,104)
- held in foreign currency (Cost: Euro (240)) (CAD 355) 5 (249) - - - - - (244)
- held in foreign currency (Cost: Euro 23,813) CHF 25,845 23,813 - - - - - - 23,813
- held in foreign currency (Cost: Euro 23) CNY 186 24 - - - - - - 24
- held in foreign currency (Cost: Euro 1) HKD 9 1 - - - - - - 1
- held in foreign currency (Cost: Euro (4)) (HUF 1,163) (4) - - - - - - (4)
- held in foreign currency (Cost: Euro (112,611)) (MXN 2,374,524) (109,562) (2,300) - - - - - (111,862)
- held in foreign currency (Cost: Euro 36) NZD 62 (4) 41 - - - - - 37
- held in foreign currency (Cost: Euro (539)) (PLN 2,286) (4) (533) - - - - - (537)
- held in foreign currency (Cost: Euro (8)) (RUB 538) (8) - - - - - - (8)
- held in foreign currency (Cost: Euro (4,869)) (SEK 51,986) 287 (5,239) - - - - - (4,952)
- held in foreign currency (Cost: Euro 99) TRY 631 95 - - - - - - 95
- held in foreign currency (Cost: Euro 309) ZAR 5,089 106 218 - - - - - 324
Total 66,366,170 21,687,404 91,805,751 (1) - (336) 64,551 179,923,539
*Formerly known as Algebris Macro Credit Fund.
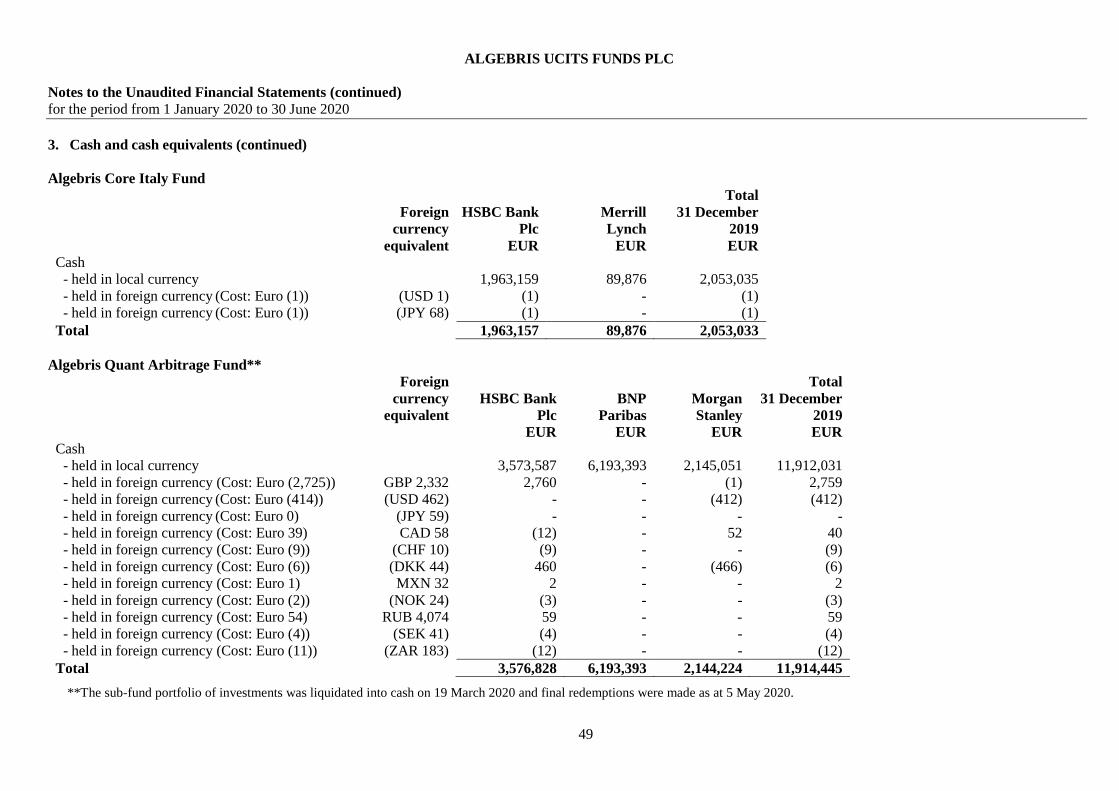
ALGEBRIS UCITS FUNDS PLC
Notes to the Unaudited Financial Statements (continued)
for the period from 1 January 2020 to 30 June 2020
49
3. Cash and cash equivalents (continued)
Algebris Core Italy Fund
Foreign
currency
equivalent
HSBC Bank
Plc
EUR
Merrill
Lynch
EUR
Total
31 December
2019
EUR
Cash
- held in local currency 1,963,159 89,876 2,053,035
- held in foreign currency (Cost: Euro (1)) (USD 1) (1) - (1)
- held in foreign currency (Cost: Euro (1)) (JPY 68) (1) - (1)
Total 1,963,157 89,876 2,053,033
Algebris Quant Arbitrage Fund**
Foreign
currency
equivalent
HSBC Bank
Plc
EUR
BNP
Paribas
EUR
Morgan
Stanley
EUR
Total
31 December
2019
EUR
Cash
- held in local currency 3,573,587 6,193,393 2,145,051 11,912,031
- held in foreign currency (Cost: Euro (2,725)) GBP 2,332 2,760 - (1) 2,759
- held in foreign currency (Cost: Euro (414)) (USD 462) - - (412) (412)
- held in foreign currency (Cost: Euro 0) (JPY 59) - - - -
- held in foreign currency (Cost: Euro 39) CAD 58 (12) - 52 40
- held in foreign currency (Cost: Euro (9)) (CHF 10) (9) - - (9)
- held in foreign currency (Cost: Euro (6)) (DKK 44) 460 - (466) (6)
- held in foreign currency (Cost: Euro 1) MXN 32 2 - - 2
- held in foreign currency (Cost: Euro (2)) (NOK 24) (3) - - (3)
- held in foreign currency (Cost: Euro 54) RUB 4,074 59 - - 59
- held in foreign currency (Cost: Euro (4)) (SEK 41) (4) - - (4)
- held in foreign currency (Cost: Euro (11)) (ZAR 183) (12) - - (12)
Total 3,576,828 6,193,393 2,144,224 11,914,445
**The sub-fund portfolio of investments was liquidated into cash on 19 March 2020 and final redemptions were made as at 5 May 2020.

ALGEBRIS UCITS FUNDS PLC
Notes to the Unaudited Financial Statements (continued)
for the period from 1 January 2020 to 30 June 2020
50
3. Cash and cash equivalents (continued)
Algebris IG Financial Credit Fund
Foreign
currency
equivalent
HSBC Bank
Plc
EUR
Total
31 December
2019
EUR
Cash
- held in local currency 7,623,290 7,623,290
- held in foreign currency (Cost: Euro (1)) (GBP 1) (2) (2)
- held in foreign currency (Cost: Euro 16,277) USD 18,052 16,101 16,101
Total 7,639,389 7,639,389
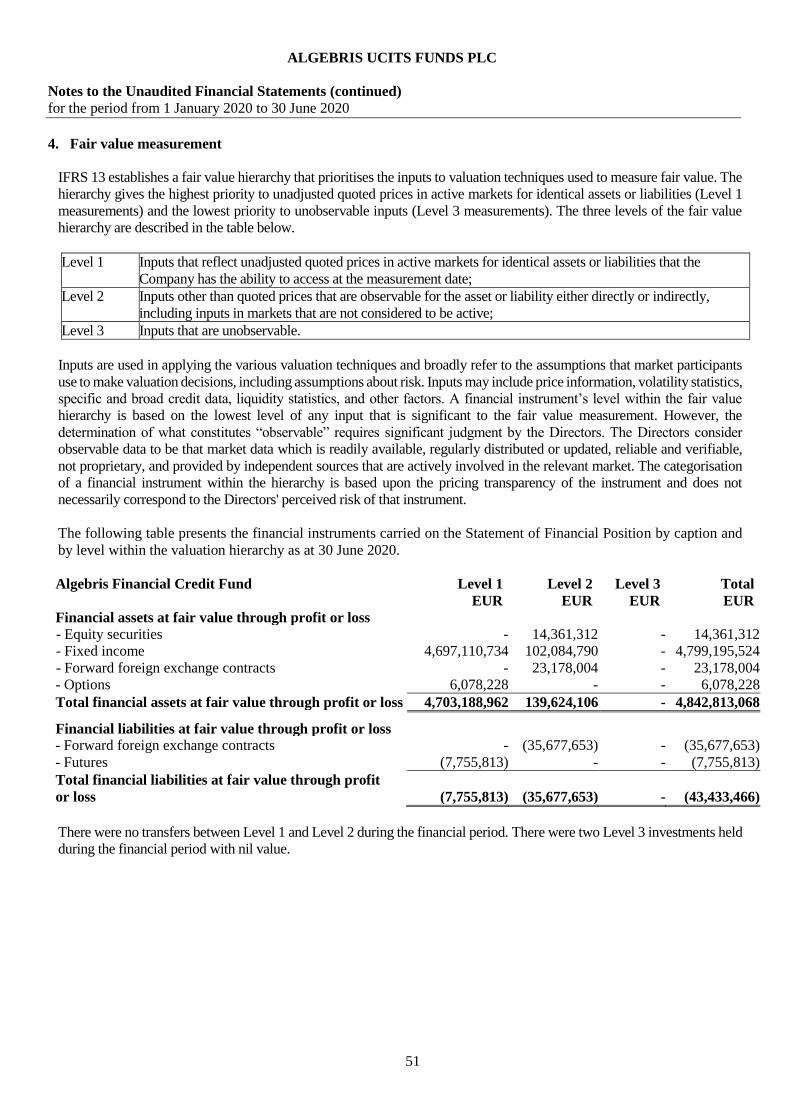
ALGEBRIS UCITS FUNDS PLC
Notes to the Unaudited Financial Statements (continued)
for the period from 1 January 2020 to 30 June 2020
51
4. Fair value measurement
IFRS 13 establishes a fair value hierarchy that prioritises the inputs to valuation techniques used to measure fair value. The
hierarchy gives the highest priority to unadjusted quoted prices in active markets for identical assets or liabilities (Level 1
measurements) and the lowest priority to unobservable inputs (Level 3 measurements). The three levels of the fair value
hierarchy are described in the table below.
Level 1 Inputs that reflect unadjusted quoted prices in active markets for identical assets or liabilities that the
Company has the ability to access at the measurement date;
Level 2 Inputs other than quoted prices that are observable for the asset or liability either directly or indirectly,
including inputs in markets that are not considered to be active;
Level 3 Inputs that are unobservable.
Inputs are used in applying the various valuation techniques and broadly refer to the assumptions that market participants
use to make valuation decisions, including assumptions about risk. Inputs may include price information, volatility statistics,
specific and broad credit data, liquidity statistics, and other factors. A financial instrument’s level within the fair value
hierarchy is based on the lowest level of any input that is significant to the fair value measurement. However, the
determination of what constitutes “observable” requires significant judgment by the Directors. The Directors consider
observable data to be that market data which is readily available, regularly distributed or updated, reliable and verifiable,
not proprietary, and provided by independent sources that are actively involved in the relevant market. The categorisation
of a financial instrument within the hierarchy is based upon the pricing transparency of the instrument and does not
necessarily correspond to the Directors' perceived risk of that instrument.
The following table presents the financial instruments carried on the Statement of Financial Position by caption and
by level within the valuation hierarchy as at 30 June 2020.
Algebris Financial Credit Fund Level 1 Level 2 Level 3 Total
EUR EUR EUR EUR
Financial assets at fair value through profit or loss
- Equity securities - 14,361,312 - 14,361,312
- Fixed income 4,697,110,734 102,084,790 - 4,799,195,524
- Forward foreign exchange contracts - 23,178,004 - 23,178,004
- Options 6,078,228 - - 6,078,228
Total financial assets at fair value through profit or loss 4,703,188,962 139,624,106 - 4,842,813,068 Financial liabilities at fair value through profit or loss
- Forward foreign exchange contracts - (35,677,653) - (35,677,653)
- Futures (7,755,813) - - (7,755,813)
Total financial liabilities at fair value through profit
or loss (7,755,813) (35,677,653) - (43,433,466)
There were no transfers between Level 1 and Level 2 during the financial period. There were two Level 3 investments held
during the financial period with nil value.
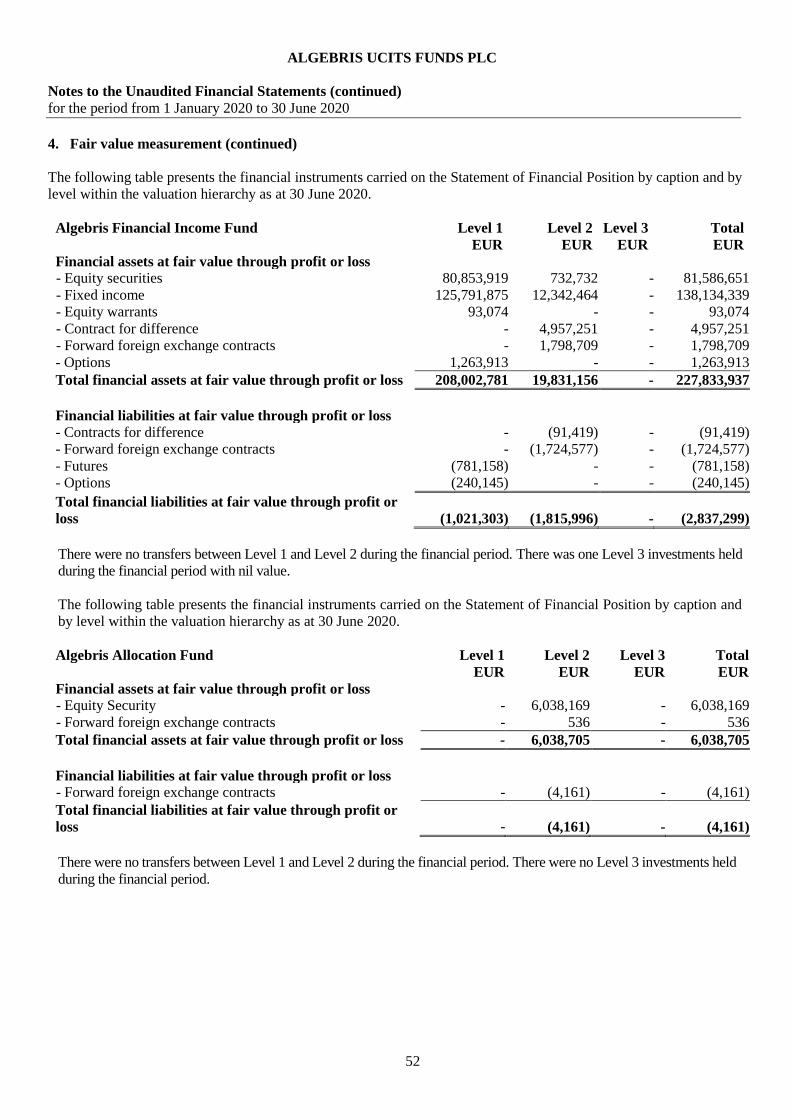
ALGEBRIS UCITS FUNDS PLC
Notes to the Unaudited Financial Statements (continued)
for the period from 1 January 2020 to 30 June 2020
52
4. Fair value measurement (continued)
The following table presents the financial instruments carried on the Statement of Financial Position by caption and by
level within the valuation hierarchy as at 30 June 2020.
Algebris Financial Income Fund Level 1 Level 2 Level 3 Total
EUR EUR EUR EUR
Financial assets at fair value through profit or loss
- Equity securities 80,853,919 732,732 - 81,586,651
- Fixed income 125,791,875 12,342,464 - 138,134,339
- Equity warrants 93,074 - - 93,074
- Contract for difference - 4,957,251 - 4,957,251
- Forward foreign exchange contracts - 1,798,709 - 1,798,709
- Options 1,263,913 - - 1,263,913
Total financial assets at fair value through profit or loss 208,002,781 19,831,156 - 227,833,937
Financial liabilities at fair value through profit or loss
- Contracts for difference - (91,419) - (91,419)
- Forward foreign exchange contracts - (1,724,577) - (1,724,577)
- Futures (781,158) - - (781,158)
- Options (240,145) - - (240,145)
Total financial liabilities at fair value through profit or
loss (1,021,303) (1,815,996) - (2,837,299)
There were no transfers between Level 1 and Level 2 during the financial period. There was one Level 3 investments held
during the financial period with nil value.
The following table presents the financial instruments carried on the Statement of Financial Position by caption and
by level within the valuation hierarchy as at 30 June 2020.
Algebris Allocation Fund Level 1 Level 2 Level 3 Total
EUR EUR EUR EUR
Financial assets at fair value through profit or loss
- Equity Security - 6,038,169 - 6,038,169
- Forward foreign exchange contracts - 536 - 536
Total financial assets at fair value through profit or loss - 6,038,705 - 6,038,705
Financial liabilities at fair value through profit or loss
- Forward foreign exchange contracts - (4,161) - (4,161)
Total financial liabilities at fair value through profit or
loss - (4,161) - (4,161)
There were no transfers between Level 1 and Level 2 during the financial period. There were no Level 3 investments held
during the financial period.
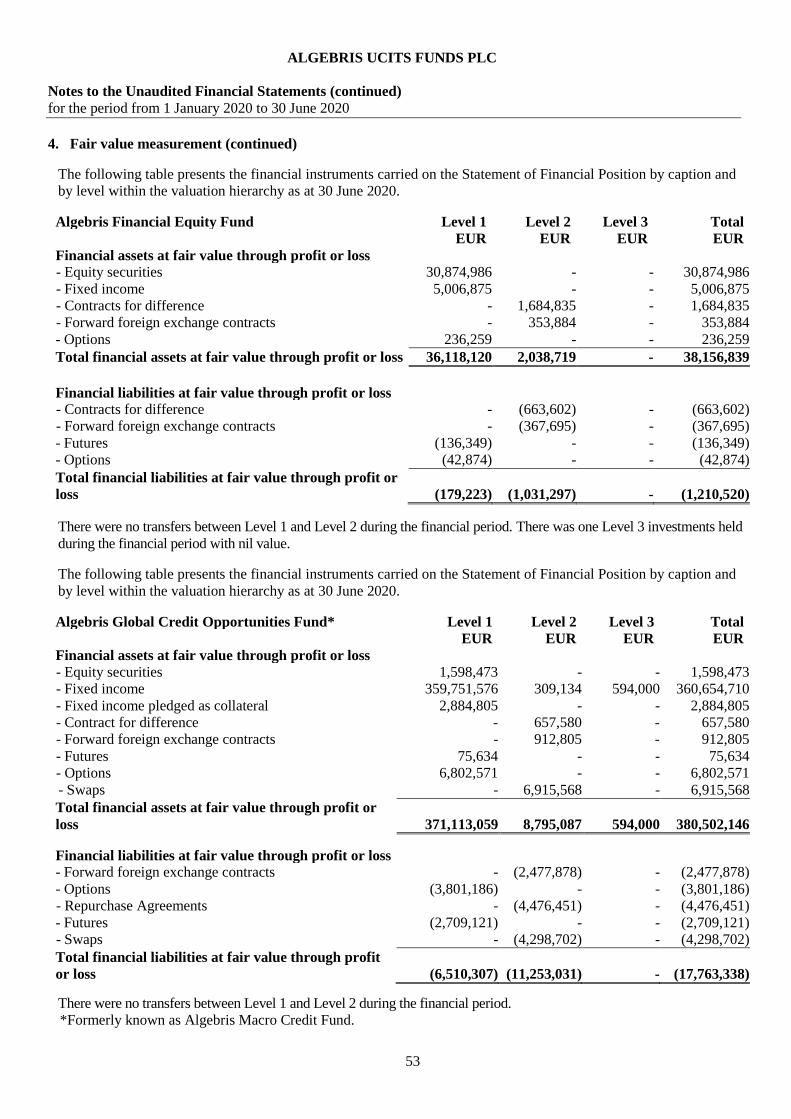
ALGEBRIS UCITS FUNDS PLC
Notes to the Unaudited Financial Statements (continued)
for the period from 1 January 2020 to 30 June 2020
53
4. Fair value measurement (continued)
The following table presents the financial instruments carried on the Statement of Financial Position by caption and
by level within the valuation hierarchy as at 30 June 2020.
Algebris Financial Equity Fund Level 1 Level 2 Level 3 Total
EUR EUR EUR EUR
Financial assets at fair value through profit or loss
- Equity securities 30,874,986 - - 30,874,986
- Fixed income 5,006,875 - - 5,006,875
- Contracts for difference - 1,684,835 - 1,684,835
- Forward foreign exchange contracts - 353,884 - 353,884
- Options 236,259 - - 236,259
Total financial assets at fair value through profit or loss 36,118,120 2,038,719 - 38,156,839
Financial liabilities at fair value through profit or loss
- Contracts for difference - (663,602) - (663,602)
- Forward foreign exchange contracts - (367,695) - (367,695)
- Futures (136,349) - - (136,349)
- Options (42,874) - - (42,874)
Total financial liabilities at fair value through profit or
loss (179,223) (1,031,297) - (1,210,520)
There were no transfers between Level 1 and Level 2 during the financial period. There was one Level 3 investments held
during the financial period with nil value.
The following table presents the financial instruments carried on the Statement of Financial Position by caption and
by level within the valuation hierarchy as at 30 June 2020.
Algebris Global Credit Opportunities Fund* Level 1 Level 2 Level 3 Total
EUR EUR EUR EUR
Financial assets at fair value through profit or loss
- Equity securities 1,598,473 - - 1,598,473
- Fixed income 359,751,576 309,134 594,000 360,654,710
- Fixed income pledged as collateral 2,884,805 - - 2,884,805
- Contract for difference - 657,580 - 657,580
- Forward foreign exchange contracts - 912,805 - 912,805
- Futures 75,634 - - 75,634
- Options 6,802,571 - - 6,802,571
- Swaps - 6,915,568 - 6,915,568
Total financial assets at fair value through profit or
loss 371,113,059 8,795,087 594,000 380,502,146
Financial liabilities at fair value through profit or loss
- Forward foreign exchange contracts - (2,477,878) - (2,477,878)
- Options (3,801,186) - - (3,801,186)
- Repurchase Agreements - (4,476,451) - (4,476,451)
- Futures (2,709,121) - - (2,709,121)
- Swaps - (4,298,702) - (4,298,702)
Total financial liabilities at fair value through profit
or loss (6,510,307) (11,253,031) - (17,763,338)
There were no transfers between Level 1 and Level 2 during the financial period.
*Formerly known as Algebris Macro Credit Fund.
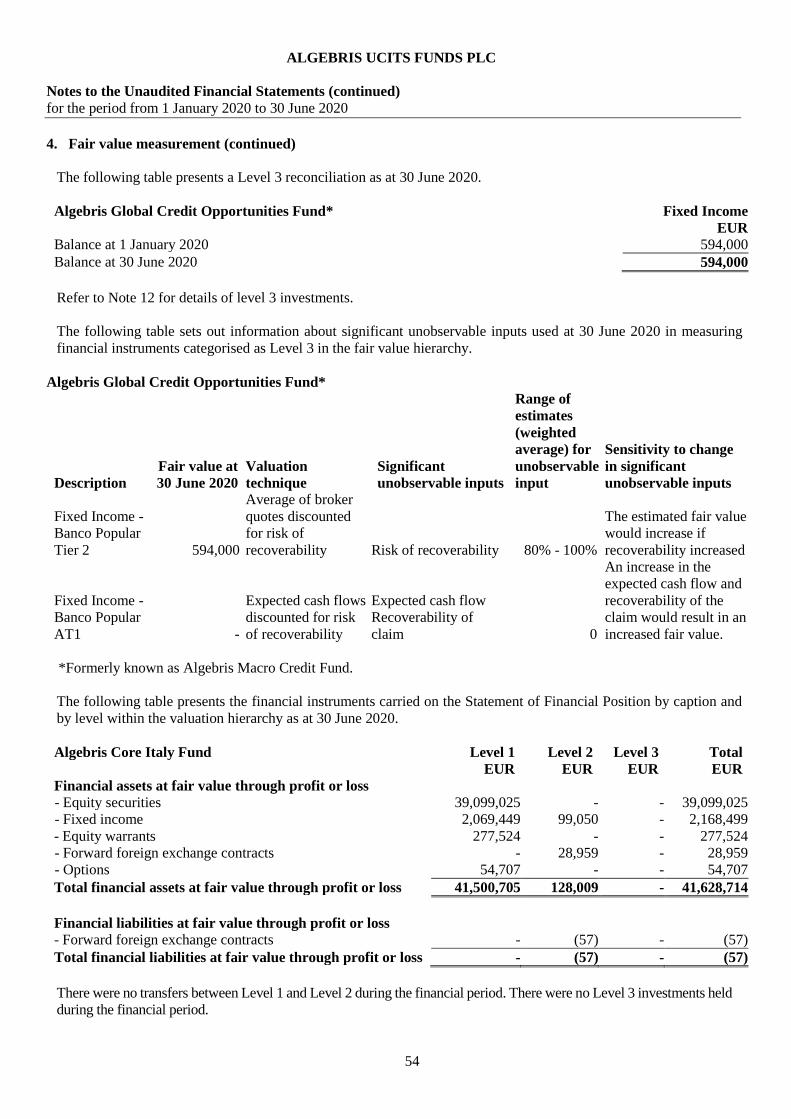
ALGEBRIS UCITS FUNDS PLC
Notes to the Unaudited Financial Statements (continued)
for the period from 1 January 2020 to 30 June 2020
54
4. Fair value measurement (continued)
The following table presents a Level 3 reconciliation as at 30 June 2020.
Algebris Global Credit Opportunities Fund* Fixed Income
EUR
Balance at 1 January 2020 594,000
Balance at 30 June 2020 594,000
Refer to Note 12 for details of level 3 investments.
The following table sets out information about significant unobservable inputs used at 30 June 2020 in measuring
financial instruments categorised as Level 3 in the fair value hierarchy.
Algebris Global Credit Opportunities Fund*
Description
Fair value at
30 June 2020
Valuation
technique
Significant
unobservable inputs
Range of
estimates
(weighted
average) for
unobservable
input
Sensitivity to change
in significant
unobservable inputs
Fixed Income -
Banco Popular
Tier 2 594,000
Average of broker
quotes discounted
for risk of
recoverability Risk of recoverability 80% - 100%
The estimated fair value
would increase if
recoverability increased
Fixed Income -
Banco Popular
AT1 -
Expected cash flows
discounted for risk
of recoverability
Expected cash flow
Recoverability of
claim 0
An increase in the
expected cash flow and
recoverability of the
claim would result in an
increased fair value.
*Formerly known as Algebris Macro Credit Fund.
The following table presents the financial instruments carried on the Statement of Financial Position by caption and
by level within the valuation hierarchy as at 30 June 2020.
Algebris Core Italy Fund Level 1 Level 2 Level 3 Total
EUR EUR EUR EUR
Financial assets at fair value through profit or loss
- Equity securities 39,099,025 - - 39,099,025
- Fixed income 2,069,449 99,050 - 2,168,499
- Equity warrants 277,524 - - 277,524
- Forward foreign exchange contracts - 28,959 - 28,959
- Options 54,707 - - 54,707
Total financial assets at fair value through profit or loss 41,500,705 128,009 - 41,628,714
Financial liabilities at fair value through profit or loss
- Forward foreign exchange contracts - (57) - (57)
Total financial liabilities at fair value through profit or loss - (57) - (57)
There were no transfers between Level 1 and Level 2 during the financial period. There were no Level 3 investments held
during the financial period.
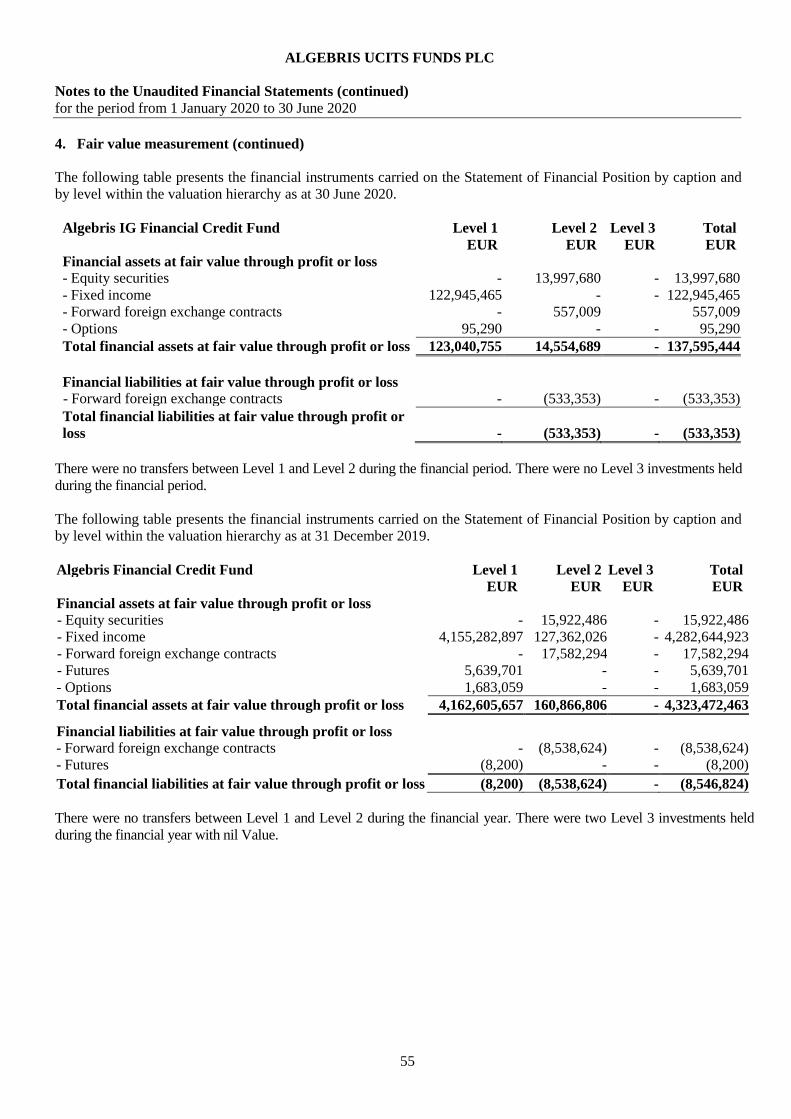
ALGEBRIS UCITS FUNDS PLC
Notes to the Unaudited Financial Statements (continued)
for the period from 1 January 2020 to 30 June 2020
55
4. Fair value measurement (continued)
The following table presents the financial instruments carried on the Statement of Financial Position by caption and
by level within the valuation hierarchy as at 30 June 2020.
Algebris IG Financial Credit Fund Level 1 Level 2 Level 3 Total
EUR EUR EUR EUR
Financial assets at fair value through profit or loss
- Equity securities - 13,997,680 - 13,997,680
- Fixed income 122,945,465 - - 122,945,465
- Forward foreign exchange contracts - 557,009 557,009
- Options 95,290 - - 95,290
Total financial assets at fair value through profit or loss 123,040,755 14,554,689 - 137,595,444
Financial liabilities at fair value through profit or loss
- Forward foreign exchange contracts - (533,353) - (533,353)
Total financial liabilities at fair value through profit or
loss - (533,353) - (533,353)
There were no transfers between Level 1 and Level 2 during the financial period. There were no Level 3 investments held
during the financial period.
The following table presents the financial instruments carried on the Statement of Financial Position by caption and
by level within the valuation hierarchy as at 31 December 2019.
Algebris Financial Credit Fund Level 1 Level 2 Level 3 Total
EUR EUR EUR EUR
Financial assets at fair value through profit or loss
- Equity securities - 15,922,486 - 15,922,486
- Fixed income 4,155,282,897 127,362,026 - 4,282,644,923
- Forward foreign exchange contracts - 17,582,294 - 17,582,294
- Futures 5,639,701 - - 5,639,701
- Options 1,683,059 - - 1,683,059
Total financial assets at fair value through profit or loss 4,162,605,657 160,866,806 - 4,323,472,463 Financial liabilities at fair value through profit or loss
- Forward foreign exchange contracts - (8,538,624) - (8,538,624)
- Futures (8,200) - - (8,200)
Total financial liabilities at fair value through profit or loss (8,200) (8,538,624) - (8,546,824)
There were no transfers between Level 1 and Level 2 during the financial year. There were two Level 3 investments held
during the financial year with nil Value.

ALGEBRIS UCITS FUNDS PLC
Notes to the Unaudited Financial Statements (continued)
for the period from 1 January 2020 to 30 June 2020
56
4. Fair value measurement (continued)
The following table presents the financial instruments carried on the Statement of Financial Position by caption and by
level within the valuation hierarchy as at 31 December 2019.
Algebris Financial Income Fund Level 1 Level 2 Level 3 Total
EUR EUR EUR EUR
Financial assets at fair value through profit or loss
- Equity securities 126,886,695 812,385 - 127,699,080
- Fixed income 221,612,231 25,348,911 - 246,961,142
- Futures 85,330 - - 85,330
- Equity warrants 104,257 - - 104,257
- Contract for difference - 853,717 - 853,717
- Forward foreign exchange contracts - 1,235,363 - 1,235,363
- Options 605,512 - - 605,512
Total financial assets at fair value through profit or loss 349,294,025 28,250,376 - 377,544,401
Financial liabilities at fair value through profit or loss
- Contracts for difference - (5,986,717) - (5,986,717)
- Forward foreign exchange contracts - (848,085) - (848,085)
- Futures (3,200) - - (3,200)
- Options (184,583) - - (184,583)
Total financial liabilities at fair value through profit or
loss (187,783) (6,834,802) - (7,022,585) There were no transfers between Level 1 and Level 2 during the financial year. There was one Level 3 investments held during
the financial year with nil value.
The following table presents the financial instruments carried on the Statement of Financial Position by caption and by
level within the valuation hierarchy as at 31 December 2019.
Algebris Allocation Fund* Level 1 Level 2 Level 3 Total
EUR EUR EUR EUR
Financial assets at fair value through profit or loss
- Equity Security - 8,665,802 - 8,665,802
- Forward foreign exchange contracts - 206 - 206
Total financial assets at fair value through profit or loss - 8,666,008 - 8,666,008
There were no transfers between Level 1 and Level 2 during the financial year. There were no Level 3 investments held
during the financial year.
*Formerly known as Algebris Asset Allocation Fund.

ALGEBRIS UCITS FUNDS PLC
Notes to the Unaudited Financial Statements (continued)
for the period from 1 January 2020 to 30 June 2020
57
4. Fair value measurement (continued)
The following table presents the financial instruments carried on the Statement of Financial Position by caption and by
level within the valuation hierarchy as at 31 December 2019.
Algebris Financial Equity Fund Level 1 Level 2 Level 3 Total
EUR EUR EUR EUR
Financial assets at fair value through profit or loss
- Equity securities 41,430,615 - - 41,430,615
- Fixed income 12,712,524 - - 12,712,524
- Contracts for difference - 2,086,704 - 2,086,704
- Forward foreign exchange contracts - 146,068 - 146,068
- Futures 2,940 - - 2,940
- Options 101,588 - 101,588
Total financial assets at fair value through profit or loss 54,247,667 2,232,772 - 56,480,439
Financial liabilities at fair value through profit or loss
- Contracts for difference - (473,765) - (473,765)
- Forward foreign exchange contracts - (229,034) - (229,034)
- Futures (28,988) - - (28,988)
- Options (30,441) - - (30,441)
Total financial liabilities at fair value through profit or
loss (59,429) (702,799) - (762,228)
There were no transfers between Level 1 and Level 2 during the financial year. There was one Level 3 investments held
during the financial year with nil value.
The following table presents the financial instruments carried on the Statement of Financial Position by caption and by
level within the valuation hierarchy as at 31 December 2019.
Algebris Global Credit Opportunities Fund* Level 1 Level 2 Level 3 Total
EUR EUR EUR EUR
Financial assets at fair value through profit or loss
- Equity securities 2,164,124 - - 2,164,124
- Fixed income 301,697,736 21,394,317 594,000 323,686,053
- Fixed income pledged as collateral 2,034,715 - - 2,034,715
- Forward foreign exchange contracts - 570,175 - 570,175
- Options 4,407,778 - - 4,407,778
- Swaps - 10,430,889 - 10,430,889
Total financial assets at fair value through profit or loss 310,304,353 32,395,381 594,000 343,293,734
Financial liabilities at fair value through profit or loss
- Contract for difference - (565,450) - (565,450)
- Forward foreign exchange contracts - (206,566) - (206,566)
- Options (1,844,560) - - (1,844,560)
- Repurchase Agreements - (1,870,131) - (1,870,131)
- Futures (833,478) - - (833,478)
- Swaps - (22,036,362) - (22,036,362)
Total financial liabilities at fair value through profit
or loss (2,678,038) (24,678,509) - (27,356,547)
There were no transfers between Level 1 and Level 2 during the financial year.
*Formerly known as Algebris Macro Credit Fund.

ALGEBRIS UCITS FUNDS PLC
Notes to the Unaudited Financial Statements (continued)
for the period from 1 January 2020 to 30 June 2020
58
4. Fair value measurement (continued)
The following table presents a Level 3 reconciliation as at 31 December 2019.
Algebris Global Credit Opportunities Fund* Fixed Income
EUR
Balance at 1 January 2019 693,000
Total loss recognised in Statement of Comprehensive Income (99,000)
Balance at 31 December 2019 594,000 Refer to Note 12 for details of level 3 investments.
The following table sets out information about significant unobservable inputs used at 31 December 2019 in measuring
financial instruments categorised as Level 3 in the fair value hierarchy. Algebris Global Credit Opportunities Fund*
Description
Fair value at
31 December
2019 Valuation technique
Significant
unobservable inputs
Range of
estimates
(weighted
average) for
unobservable
input
Sensitivity to change
in significant
unobservable inputs
Fixed Income -
Banco Popular
Tier 2 594,000
Average of broker
quotes discounted for
risk of recoverability Risk of recoverability 80% - 100%
The estimated fair
value would increase
if recoverability
increased
Fixed Income -
Banco Popular
AT1 -
Expected cash flows
discounted for risk of
recoverability
Expected cash flow
Recoverability of
claim 0
An increase in the
expected cash flow
and recoverability of
the claim would result
in an increased fair
value. The following table presents the financial instruments carried on the Statement of Financial Position by caption and by
level within the valuation hierarchy as at 31 December 2019.
Algebris Core Italy Fund Level 1 Level 2 Level 3 Total
EUR EUR EUR EUR
Financial assets at fair value through profit or loss
- Equity securities 44,251,834 - - 44,251,834
- Fixed income 2,184,509 100,177 - 22,84,686
- Equity warrants 282,143 - - 282,143
- Forward foreign exchange contracts - 26,850 - 26,850
Total financial assets at fair value through profit or loss 46,718,486 127,027 - 46,845,513
Financial liabilities at fair value through profit or loss
- Forward foreign exchange contracts - (5) - (5)
- Futures (340) - - (340)
Total financial liabilities at fair value through profit or
loss (340) (5) - (345)
There were no transfers between Level 1 and Level 2 during the financial period. There were no Level 3 investments held
during the financial year.
*Formerly known as Algebris Macro Credit Fund.

ALGEBRIS UCITS FUNDS PLC
Notes to the Unaudited Financial Statements (continued)
for the period from 1 January 2020 to 30 June 2020
59
4. Fair value measurement (continued)
The following table presents the financial instruments carried on the Statement of Financial Position by caption and by
level within the valuation hierarchy as at 31 December 2019.
Algebris Quant Arbitrage Fund* Level 1 Level 2 Level 3 Total
EUR EUR EUR EUR
Financial assets at fair value through profit or loss
- Fixed income 23,314,279 - - 23,314,279
- Forward foreign exchange contracts - 2 - 2
Total financial assets at fair value through profit or loss 23,314,279 2 - 23,314,281
Financial liabilities at fair value through profit or loss
- Forward foreign exchange contracts - (485) - (485)
Total financial liabilities at fair value through profit or loss - (485) - (485)
There were no transfers between Level 1 and Level 2 during the financial year. There were no Level 3 investments held
during the financial year.
The following table presents the financial instruments carried on the Statement of Financial Position by caption and by
level within the valuation hierarchy as at 31 December 2019.
Algebris IG Financial Credit Fund Level 1 Level 2 Level 3 Total
EUR EUR EUR EUR
Financial assets at fair value through profit or loss
- Equity securities - 986,535 - 986,535
- Fixed income 6,006,512 - - 6,006,512
- Forward foreign exchange contracts - 20,361 - 20,361
Total financial assets at fair value through profit or loss 6,006,512 1,006,896 - 7,013,408
Financial liabilities at fair value through profit or loss
- Forward foreign exchange contracts - (16,065) - (16,065)
Total financial liabilities at fair value through profit or loss - (16,065) - (16,065)
There were no transfers between Level 1 and Level 2 during the financial year. There were no Level 3 investments held
during the financial year.
*Formerly known as Algebris Tail Risk Fund.
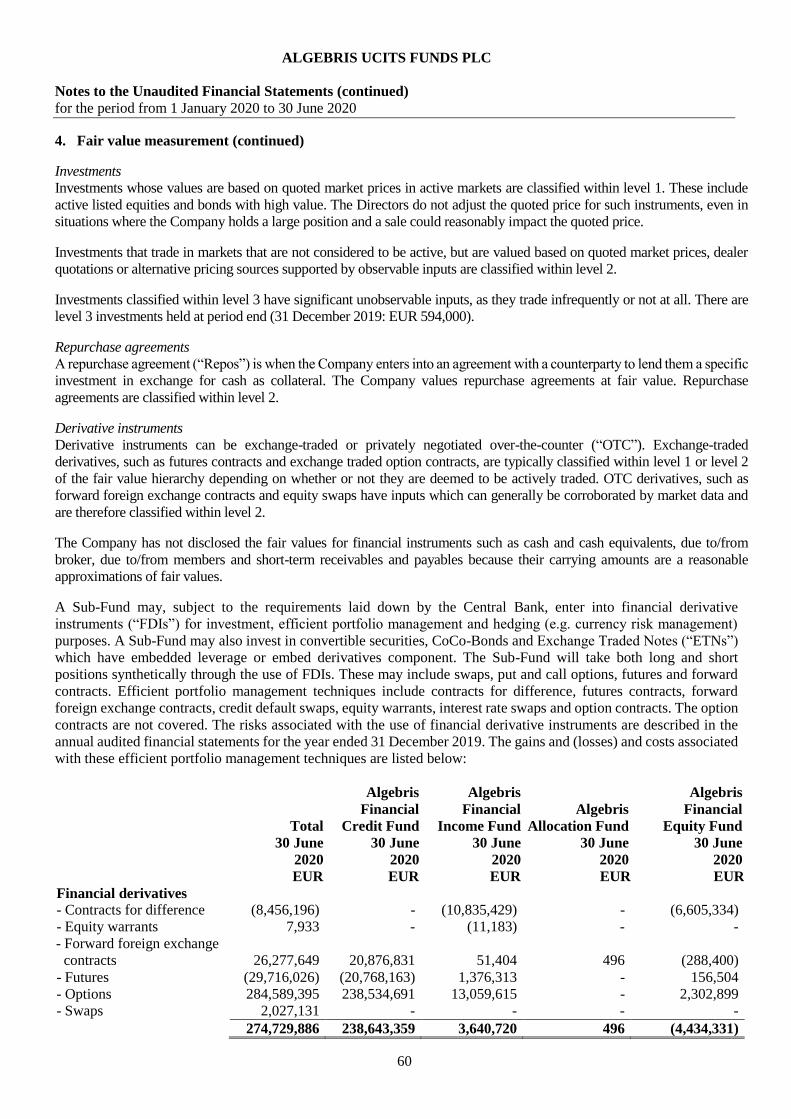
ALGEBRIS UCITS FUNDS PLC
Notes to the Unaudited Financial Statements (continued)
for the period from 1 January 2020 to 30 June 2020
60
4. Fair value measurement (continued)
Investments
Investments whose values are based on quoted market prices in active markets are classified within level 1. These include
active listed equities and bonds with high value. The Directors do not adjust the quoted price for such instruments, even in
situations where the Company holds a large position and a sale could reasonably impact the quoted price.
Investments that trade in markets that are not considered to be active, but are valued based on quoted market prices, dealer
quotations or alternative pricing sources supported by observable inputs are classified within level 2.
Investments classified within level 3 have significant unobservable inputs, as they trade infrequently or not at all. There are
level 3 investments held at period end (31 December 2019: EUR 594,000).
Repurchase agreements
A repurchase agreement (“Repos”) is when the Company enters into an agreement with a counterparty to lend them a specific
investment in exchange for cash as collateral. The Company values repurchase agreements at fair value. Repurchase
agreements are classified within level 2.
Derivative instruments
Derivative instruments can be exchange-traded or privately negotiated over-the-counter (“OTC”). Exchange-traded
derivatives, such as futures contracts and exchange traded option contracts, are typically classified within level 1 or level 2
of the fair value hierarchy depending on whether or not they are deemed to be actively traded. OTC derivatives, such as
forward foreign exchange contracts and equity swaps have inputs which can generally be corroborated by market data and
are therefore classified within level 2.
The Company has not disclosed the fair values for financial instruments such as cash and cash equivalents, due to/from
broker, due to/from members and short-term receivables and payables because their carrying amounts are a reasonable
approximations of fair values.
A Sub-Fund may, subject to the requirements laid down by the Central Bank, enter into financial derivative
instruments (“FDIs”) for investment, efficient portfolio management and hedging (e.g. currency risk management)
purposes. A Sub-Fund may also invest in convertible securities, CoCo-Bonds and Exchange Traded Notes (“ETNs”)
which have embedded leverage or embed derivatives component. The Sub-Fund will take both long and short
positions synthetically through the use of FDIs. These may include swaps, put and call options, futures and forward
contracts. Efficient portfolio management techniques include contracts for difference, futures contracts, forward
foreign exchange contracts, credit default swaps, equity warrants, interest rate swaps and option contracts. The option
contracts are not covered. The risks associated with the use of financial derivative instruments are described in the
annual audited financial statements for the year ended 31 December 2019. The gains and (losses) and costs associated
with these efficient portfolio management techniques are listed below:
Algebris
Financial
Algebris
Financial Algebris
Algebris
Financial
Total Credit Fund Income Fund Allocation Fund Equity Fund
30 June 30 June 30 June 30 June 30 June
2020 2020 2020 2020 2020
EUR EUR EUR EUR EUR
Financial derivatives
- Contracts for difference (8,456,196) - (10,835,429) - (6,605,334)
- Equity warrants 7,933 - (11,183) - -
- Forward foreign exchange
contracts 26,277,649 20,876,831 51,404 496 (288,400)
- Futures (29,716,026) (20,768,163) 1,376,313 - 156,504
- Options 284,589,395 238,534,691 13,059,615 - 2,302,899
- Swaps 2,027,131 - - - -
274,729,886 238,643,359 3,640,720 496 (4,434,331)

ALGEBRIS UCITS FUNDS PLC
Notes to the Unaudited Financial Statements (continued)
for the period from 1 January 2020 to 30 June 2020
61
4. Fair value measurement (continued)
Derivative instruments (continued)
Algebris
Global Credit
Algebris
Core
Algebris
Quant Arbitrage
Algebris IG
Financial
Opportunities Fund* Italy Fund Fund Credit Fund
30 June 30 June 30 June 30 June
2020 2020 2020 2020
EUR EUR EUR EUR
Financial derivatives
- Contracts for difference 8,984,567 - - -
- Equity warrants - 19,116 - -
- Forward foreign exchange
contracts 3,782,088 121,808 2,482 1,730,940
- Futures (10,563,177) 82,497 - -
- Options 30,723,129 (143,357) - 112,418
- Swaps 16,107,098 - (14,079,967) -
49,033,705 80,064 (14,077,485) 1,843,358
Algebris
Financial
Algebris
Financial Algebris
Algebris
Financial
Total Credit Fund Income Fund Allocation Fund Equity Fund
30 June 30 June 30 June 30 June 30 June
2019 2019 2019 2019 2019
EUR EUR EUR EUR EUR
Financial derivatives
- Contracts for difference 3,039,045 - 7,220,751 (793) (1,343,028)
- Equity warrants 182,265 - 21,593 - -
- Forward foreign exchange
contracts (43,770,671) (35,919,082) (2,466,022) (95,552)
(535,189)
- Futures (28,590,082) (23,237,885) (1,910,424) (93,997) (1,416,426)
- Options (28,794,237) (18,558,190) (7,034,084) (32,294) (1,035,022)
- Swaps 26,370,811 - - - -
(71,562,869) (77,715,157) (4,168,186) (222,636) (4,329,665)
Algebris
Global Credit
Algebris
Core
Algebris
Quant
Arbitrage
Opportunities Fund* Italy Fund Fund
30 June 30 June 30 June
2019 2019 2019
EUR EUR EUR
Financial derivatives
- Contracts for difference (3,202,729) 364,844 -
- Equity warrants - 160,672 -
- Forward foreign exchange
contracts (4,810,518) 95,593 (39,901)
- Futures (1,395,065) (536,285) -
- Options (2,056,417) (78,230) -
- Swaps (26,376,161) - (5,350)
(37,840,890) 6,594 (45,251)
*Formerly known as Algebris Macro Credit Fund.

ALGEBRIS UCITS FUNDS PLC
Notes to the Unaudited Financial Statements (continued)
for the period from 1 January 2020 to 30 June 2020
62
5. Fees and expenses
Investment management fees
For Algebris Financial Credit Fund, the Investment Manager shall be entitled to receive an investment management fee
(the “Management Fee”) from the Company equal to 0.50% per annum of the Net Asset Value of the Class I Shares and
Class XXL Shares, 0.79% per annum of the Net Asset Value of the Class Z Shares, 1.20% per annum of the Net Asset
Value of the Class R Shares, 1.50% per annum of the Net Asset Value of the Class W Shares, 1.00% per annum of the Net
Asset Value of the Class C Shares, 1.35% per annum of the Net Asset Value of the Class A Shares and 0.85% per annum
of the Net Asset Value of the Class I2D Shares.
For Algebris Financial Income Fund, the Investment Manager shall be entitled to receive the Management Fee from the
Sub-Fund equal to 0.90% per annum of the Net Asset Value of the Class I Shares, 1.80% per annum of the Net Asset Value
of the Class R Shares and 0.50% per annum of the Net Asset Value of the Class B Shares and Class XXL Shares.
For Algebris Allocation Fund, the Investment Manager shall be entitled to receive the Management Fee from the Sub-Fund
equal to 0.80% per annum of the Net Asset Value of the Class I Shares, 1.60% per annum of the Net Asset Value of the
Class R Shares and 0.50% per annum of the Net Asset Value of the Class B Shares.
For Algebris Financial Equity Fund, the Investment Manager shall be entitled to receive the Management Fee from the
Sub-Fund equal to 1.25% per annum of the Net Asset Value of the Class I Shares, 2.00% per annum of the Net Asset Value
of the Class R Shares and 1.00% per annum of the Net Asset Value of the Class B Shares.
For Algebris Global Credit Opportunities Fund, the Investment Manager shall be entitled to receive the Management Fee
from the Sub-Fund equal to 0.75% per annum of the Net Asset Value of the Class B Shares, 0.90% per annum of the Net
Asset Value of the Class I Shares and 1.50% per annum of the Net Asset Value of the Class R Shares.
For Algebris Core Italy Fund, the Investment Manager shall be entitled to receive the Management Fee from the Sub-Fund
equal to 0.50% per annum of the Net Asset Value of the Class EB and Class I Shares and 1.00% per annum of the Net
Asset Value of the Class R Shares.
For Algebris Quant Arbitrage Fund, the Investment Manager shall be entitled to receive the Management Fee from the
Sub-Fund equal to 0.50% per annum of the Net Asset Value of the Class EB Shares and 0.75% per annum of the Net Asset
Value of the Class I Shares and 1.50% per annum of Net Asset Value of the Class R Shares. Effective from 19 March 2020,
the Investment Manager waived its right to receive a Management Fee.
Until 18 March 2020, for Algebris IG Financial Credit Fund, the Investment Manager shall be entitled to receive the
Management Fee from the Sub-Fund equal to 0.40% per annum of the Net Asset Value of the Class B Shares, 0.60% per
annum of the Net Asset Value of the Class I Shares and 1.20% per annum of the Net Asset Value of the Class R Shares.
From 19 March 2020, for Algebris IG Financial Credit Fund, the Investment Manager shall be entitled to receive the
Management Fee from the Sub-Fund equal to 0.40% per annum of the Net Asset Value of the Class B Shares, 0.50% per
annum of the Net Asset Value of the Class I Shares and 1.00% per annum of the Net Asset Value of the Class R Shares.
The Management Fee shall be (i) calculated and accrued daily; and (ii) is calculated by reference to the Net Asset Value
of the relevant Shares before the deduction of that days’ Management Fee and accrued Performance Fee. The Management
Fee is normally payable in arrears within 14 days of the end of the relevant month end.
No Management Fee shall be payable in respect of Class M, Class Mm or Class Md Shares.
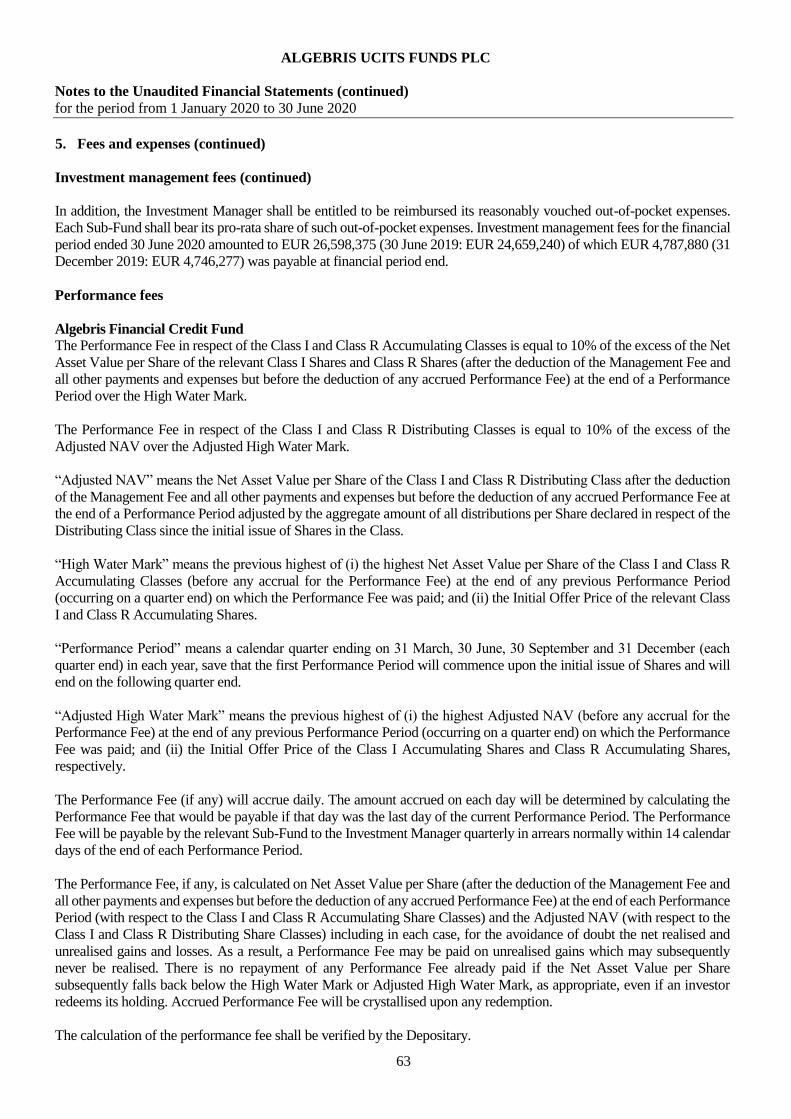
ALGEBRIS UCITS FUNDS PLC
Notes to the Unaudited Financial Statements (continued)
for the period from 1 January 2020 to 30 June 2020
63
5. Fees and expenses (continued)
Investment management fees (continued)
In addition, the Investment Manager shall be entitled to be reimbursed its reasonably vouched out-of-pocket expenses.
Each Sub-Fund shall bear its pro-rata share of such out-of-pocket expenses. Investment management fees for the financial
period ended 30 June 2020 amounted to EUR 26,598,375 (30 June 2019: EUR 24,659,240) of which EUR 4,787,880 (31
December 2019: EUR 4,746,277) was payable at financial period end.
Performance fees
Algebris Financial Credit Fund
The Performance Fee in respect of the Class I and Class R Accumulating Classes is equal to 10% of the excess of the Net
Asset Value per Share of the relevant Class I Shares and Class R Shares (after the deduction of the Management Fee and
all other payments and expenses but before the deduction of any accrued Performance Fee) at the end of a Performance
Period over the High Water Mark.
The Performance Fee in respect of the Class I and Class R Distributing Classes is equal to 10% of the excess of the
Adjusted NAV over the Adjusted High Water Mark.
“Adjusted NAV” means the Net Asset Value per Share of the Class I and Class R Distributing Class after the deduction
of the Management Fee and all other payments and expenses but before the deduction of any accrued Performance Fee at
the end of a Performance Period adjusted by the aggregate amount of all distributions per Share declared in respect of the
Distributing Class since the initial issue of Shares in the Class.
“High Water Mark” means the previous highest of (i) the highest Net Asset Value per Share of the Class I and Class R
Accumulating Classes (before any accrual for the Performance Fee) at the end of any previous Performance Period
(occurring on a quarter end) on which the Performance Fee was paid; and (ii) the Initial Offer Price of the relevant Class
I and Class R Accumulating Shares.
“Performance Period” means a calendar quarter ending on 31 March, 30 June, 30 September and 31 December (each
quarter end) in each year, save that the first Performance Period will commence upon the initial issue of Shares and will
end on the following quarter end.
“Adjusted High Water Mark” means the previous highest of (i) the highest Adjusted NAV (before any accrual for the
Performance Fee) at the end of any previous Performance Period (occurring on a quarter end) on which the Performance
Fee was paid; and (ii) the Initial Offer Price of the Class I Accumulating Shares and Class R Accumulating Shares,
respectively.
The Performance Fee (if any) will accrue daily. The amount accrued on each day will be determined by calculating the
Performance Fee that would be payable if that day was the last day of the current Performance Period. The Performance
Fee will be payable by the relevant Sub-Fund to the Investment Manager quarterly in arrears normally within 14 calendar
days of the end of each Performance Period.
The Performance Fee, if any, is calculated on Net Asset Value per Share (after the deduction of the Management Fee and
all other payments and expenses but before the deduction of any accrued Performance Fee) at the end of each Performance
Period (with respect to the Class I and Class R Accumulating Share Classes) and the Adjusted NAV (with respect to the
Class I and Class R Distributing Share Classes) including in each case, for the avoidance of doubt the net realised and
unrealised gains and losses. As a result, a Performance Fee may be paid on unrealised gains which may subsequently
never be realised. There is no repayment of any Performance Fee already paid if the Net Asset Value per Share
subsequently falls back below the High Water Mark or Adjusted High Water Mark, as appropriate, even if an investor
redeems its holding. Accrued Performance Fee will be crystallised upon any redemption.
The calculation of the performance fee shall be verified by the Depositary.

ALGEBRIS UCITS FUNDS PLC
Notes to the Unaudited Financial Statements (continued)
for the period from 1 January 2020 to 30 June 2020
64
5. Fees and expenses (continued)
Performance fees (continued)
Algebris Financial Credit Fund (continued)
No performance fees shall be payable in respect of Class M, Class XXL, Class W and Class Z Shares.
Performance fees for the financial period ended 30 June 2020 amounted to EUR 9,374,084 (30 June 2019: EUR
8,590,549) of which EUR 8,915,042 (31 December 2019: EUR 18,985,942) was payable at financial period end.
Algebris Financial Income Fund
There are no performance fees in respect of Algebris Financial Income Fund.
Algebris Allocation Fund
The Performance Fee in respect of the Class B, Class I and Class R Shares is equal to 10% of the excess of the Net Asset
Value per Share of the relevant Class B Shares, Class I Shares and Class R Shares (after the deduction of the Management
Fee and all other payments and expenses but before the deduction of any accrued Performance Fee) at the end of a
Performance Period over the High Water Mark.
No performance fees shall be payable in respect of Class M shares.
Performance fees for the financial period ended 30 June 2020 amounted to EUR Nil (30 June 2019: EUR 3) of which
EUR Nil (31 December 2019: EUR 6) was payable at financial period end.
Algebris Financial Equity Fund
The Performance Fee in respect of the Class B and Class Bm Shares is equal to 10% of the excess of the Net Asset Value
per Share and Class I, Class Im, Class R and Class Rm Shares is equal to 15% of the excess of the Net Asset Value per
Share of the relevant Class B, Class Bm, Class I, Class Im, Class R and Class Rm Shares (after the deduction of the
Management Fee and all other payments and expenses but before the deduction of any accrued Performance Fee) at the
end of a Performance Period over the High Water Mark.
No performance fees shall be payable in respect of Class M, Class Mm Shares and Class Md Shares.
Performance fees for the financial period ended 30 June 2020 amounted to EUR Nil (30 June 2019: EUR Nil) of which
EUR Nil (31 December 2019: 274) was payable at financial period end.
The Performance Fee, if any, is calculated on Net Asset Value per Share (after the deduction of the Management Fee and
all other payments and expenses but before the deduction of any accrued Performance Fee) at the end of each Performance
Period (with respect to the Class B, Class Bm, Class I, Class Im, Class R and Class Rm Shares) including in each case,
for the avoidance of doubt the net realised and unrealised gains and losses. As a result, a Performance Fee may be paid on
unrealised gains which may subsequently never be realised. There is no repayment of any Performance Fee already paid
if the Net Asset Value per Share subsequently falls back below the High Water Mark or Adjusted High Water Mark, as
appropriate, even if an investor redeems its holding. Accrued Performance Fee will be crystallised upon any redemption.

ALGEBRIS UCITS FUNDS PLC
Notes to the Unaudited Financial Statements (continued)
for the period from 1 January 2020 to 30 June 2020
65
5. Fees and expenses (continued)
Performance fees (continued)
Algebris Global Credit Opportunities Fund
The Performance Fee in respect of the Class I and Class R Accumulating Classes is equal to 15% of the excess of the Net
Asset Value per Share of the relevant Class I Shares and Class R Shares (after the deduction of the Management Fee and
all other payments and expenses but before the deduction of any accrued Performance Fee) at the end of a Performance
Period over the High Water Mark.
The Performance Fee in respect of the Class B Accumulating Class Shares is equal to 10% of the excess of the Net Asset
Value per Share of the Class B Accumulating Class Shares (after the deduction of the Management Fee and all other
payments and expenses but before the deduction of any accrued Performance Fee) at the end of a Performance Period
over the High Water Mark.
The Performance Fee in respect of the Class I and Class R Distributing Classes is equal to 15% of the excess of the
Adjusted NAV over the Adjusted High Water Mark.
The Performance Fee in respect of the Class B Distributing Class is equal to 10% of the excess of the Adjusted NAV
over the Adjusted High Water Mark.
The Performance Fee, if any, is calculated on Net Asset Value per Share (after the deduction of the Management Fee and
all other payments and expenses but before the deduction of any accrued Performance Fee) at the end of each Performance
Period (with respect to the Class B, Class I and Class R Accumulating Shares Classes) and the Adjusted NAV (with
respect to the Class B, Class I and Class R Distributing Share Classes) including in each case, for the avoidance of doubt
the net realised and unrealised gains and losses. As a result, a Performance Fee may be paid on unrealised gains which
may subsequently never be realised. There is no repayment of any Performance Fee already paid if the Net Asset Value
per Share subsequently falls back below the High Water Mark or Adjusted High Water Mark, as appropriate, even if an
investor redeems its holding.
The Performance Fee (if any) will accrue daily. The amount accrued on each day will be determined by calculating the
Performance Fee that would be payable if that day was the last day of the current Performance Period. The Performance
Fee will be payable by the relevant Sub-Fund to the Investment Manager quarterly in arrears normally within 14 calendar
days of the end of each Performance Period.
No performance fee shall be payable in respect of Class M and Md shares .
Performance fees for the financial period ended 30 June 2020 amounted to EUR 3,661,841 (30 June 2019: EUR 84) of
which EUR 3,464,327 (31 December 2019: EUR 1,160,038) was payable at financial period end.
Algebris Core Italy Fund
The Performance Fee in respect of the Class I and Class R Accumulating Classes is equal to 10% of the excess of the Net
Asset Value per Share of the relevant Class I and Class R Shares (after the deduction of the Management Fee and all other
payments and expenses but before the deduction of any accrued Performance Fee) at the end of a Performance Period
over the High Water Mark.
The Performance Fee in respect of the Class I and Class R Distributing Classes is equal to 10% of the excess of the Adjusted
NAV over the Initial Offer Price of the relevant Distributing Class Adjusted High Water Mark.

ALGEBRIS UCITS FUNDS PLC
Notes to the Unaudited Financial Statements (continued)
for the period from 1 January 2020 to 30 June 2020
66
5. Fees and expenses (continued)
Performance fees (continued)
Algebris Core Italy Fund (continued)
The Performance Fee (if any) will accrue daily. The amount accrued on each day will be determined by calculating the
Performance Fee that would be payable if that day was the last day of the current Performance Period. The Performance Fee
will be payable by the relevant Sub-Fund to the Investment Manager quarterly in arrears normally within 14 calendar days
of the end of each Performance Period.
No performance fees shall be payable in respect of Class EB and Class M Shares.
Performance fees for the financial period ended 30 June 2020 amounted to EUR Nil (30 June 2019: EUR 6) of which
EUR Nil (31 December 2019: EUR 2,464) was payable at financial period end.
Algebris Quant Arbitrage Fund
The Performance Fee in respect of the Class I and Class R Accumulating Classes is equal to 15% of the excess of the Net
Asset Value per Share of the relevant Class I and Class R Shares (after the deduction of the Management Fee and all other
payments and expenses but before the deduction of any accrued Performance Fee) at the end of a Performance Period over
the High Water Mark.
The Performance Fee in respect of the Class EB Accumulating Class Shares is equal to 10% of the excess of the Net Asset
Value per Share of the Class EB Accumulating Class Shares (after the deduction of the Management Fee and all other
payments and expenses but before the deduction of any accrued Performance Fee) at the end of a Performance Period over
the High Water Mark.
The Performance Fee (if any) will accrue daily. The amount accrued on each day will be determined by calculating the
Performance Fee that would be payable if that day was the last day of the current Performance Period. The Performance Fee
will be payable by the Fund to the Investment Manager quarterly in arrears normally within 14 calendar days of the end of
each Performance Period.
No performance fees shall be payable in respect of Class M Shares.
Performance fees for the financial period ended 30 June 2020 amounted to EUR 4 (30 June 2019: EUR 93) of which
EUR Nil (31 December 2019: EUR 3,120) was payable at financial period end.
Algebris IG Financial Credit Fund
There are no performance fees in respect of Algebris IG Financial Credit Fund.
Administration fees
The Administrator shall be entitled to receive out of the assets of each Sub-Fund a fee, accrued and calculated daily and
payable monthly in arrears, at a rate of up to 0.05% per annum of a Sub-Fund’s Net Asset Value for the first EUR 250
million, 0.035% per annum of a Sub-Fund’s Net Asset Value between EUR 250 million and EUR 500 million and 0.02%
per annum of a Sub-Fund’s Net Asset Value above EUR 500 million subject to a minimum monthly fee of up to EUR 300
per Share Class (which shall be reduced by 50% for the first six months after the launch of a Sub-Fund). The Administrator
shall receive an annual reporting fee of EUR 3,000 per Sub-Fund.
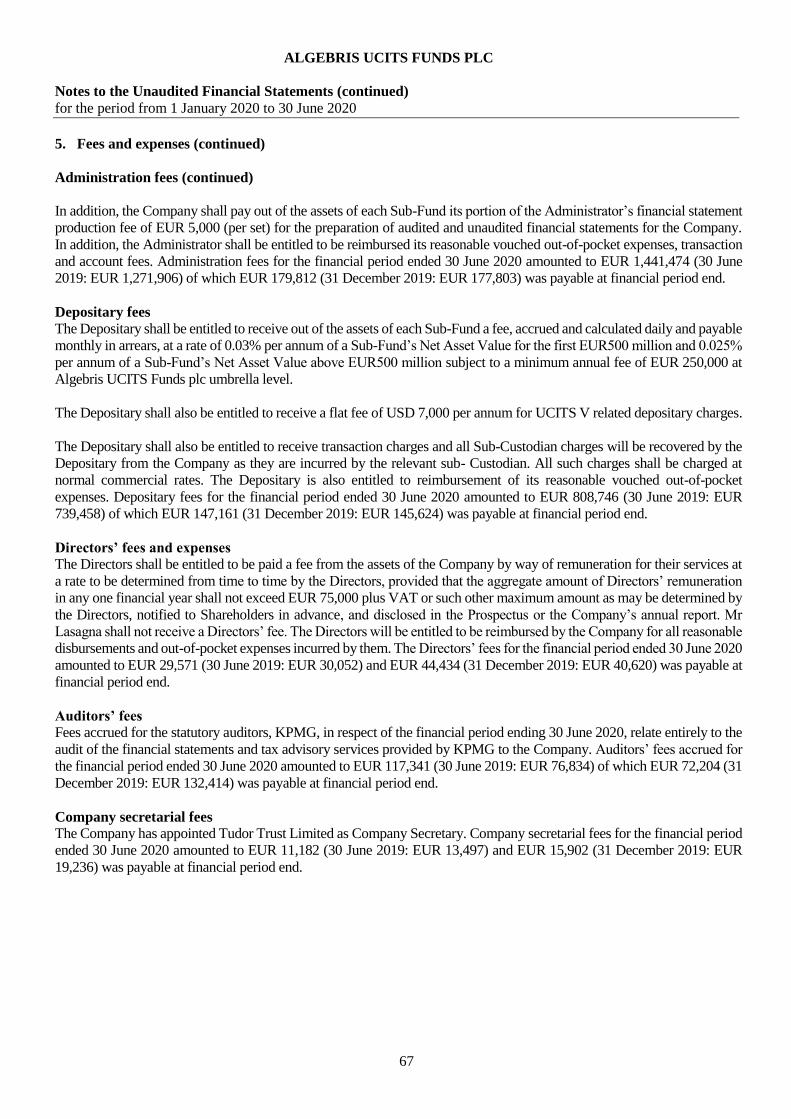
ALGEBRIS UCITS FUNDS PLC
Notes to the Unaudited Financial Statements (continued)
for the period from 1 January 2020 to 30 June 2020
67
5. Fees and expenses (continued)
Administration fees (continued)
In addition, the Company shall pay out of the assets of each Sub-Fund its portion of the Administrator’s financial statement
production fee of EUR 5,000 (per set) for the preparation of audited and unaudited financial statements for the Company.
In addition, the Administrator shall be entitled to be reimbursed its reasonable vouched out-of-pocket expenses, transaction
and account fees. Administration fees for the financial period ended 30 June 2020 amounted to EUR 1,441,474 (30 June
2019: EUR 1,271,906) of which EUR 179,812 (31 December 2019: EUR 177,803) was payable at financial period end.
Depositary fees
The Depositary shall be entitled to receive out of the assets of each Sub-Fund a fee, accrued and calculated daily and payable
monthly in arrears, at a rate of 0.03% per annum of a Sub-Fund’s Net Asset Value for the first EUR500 million and 0.025%
per annum of a Sub-Fund’s Net Asset Value above EUR500 million subject to a minimum annual fee of EUR 250,000 at
Algebris UCITS Funds plc umbrella level.
The Depositary shall also be entitled to receive a flat fee of USD 7,000 per annum for UCITS V related depositary charges.
The Depositary shall also be entitled to receive transaction charges and all Sub-Custodian charges will be recovered by the
Depositary from the Company as they are incurred by the relevant sub- Custodian. All such charges shall be charged at
normal commercial rates. The Depositary is also entitled to reimbursement of its reasonable vouched out-of-pocket
expenses. Depositary fees for the financial period ended 30 June 2020 amounted to EUR 808,746 (30 June 2019: EUR
739,458) of which EUR 147,161 (31 December 2019: EUR 145,624) was payable at financial period end.
Directors’ fees and expenses
The Directors shall be entitled to be paid a fee from the assets of the Company by way of remuneration for their services at
a rate to be determined from time to time by the Directors, provided that the aggregate amount of Directors’ remuneration
in any one financial year shall not exceed EUR 75,000 plus VAT or such other maximum amount as may be determined by
the Directors, notified to Shareholders in advance, and disclosed in the Prospectus or the Company’s annual report. Mr
Lasagna shall not receive a Directors’ fee. The Directors will be entitled to be reimbursed by the Company for all reasonable
disbursements and out-of-pocket expenses incurred by them. The Directors’ fees for the financial period ended 30 June 2020
amounted to EUR 29,571 (30 June 2019: EUR 30,052) and EUR 44,434 (31 December 2019: EUR 40,620) was payable at
financial period end.
Auditors’ fees
Fees accrued for the statutory auditors, KPMG, in respect of the financial period ending 30 June 2020, relate entirely to the
audit of the financial statements and tax advisory services provided by KPMG to the Company. Auditors’ fees accrued for
the financial period ended 30 June 2020 amounted to EUR 117,341 (30 June 2019: EUR 76,834) of which EUR 72,204 (31
December 2019: EUR 132,414) was payable at financial period end.
Company secretarial fees
The Company has appointed Tudor Trust Limited as Company Secretary. Company secretarial fees for the financial period
ended 30 June 2020 amounted to EUR 11,182 (30 June 2019: EUR 13,497) and EUR 15,902 (31 December 2019: EUR
19,236) was payable at financial period end.

ALGEBRIS UCITS FUNDS PLC
Notes to the Unaudited Financial Statements (continued)
for the period from 1 January 2020 to 30 June 2020
68
6. Distributions
The Directors are permitted to declare distributions in respect of any Class of Shares. Distributions may not be payable
for all Classes of Shares. A distribution may include accrued revenue which may subsequently never be received. The
amount of the net income to be distributed is determined at the discretion of the Directors in accordance with Articles
and the Directors will also determine what proportion of a Sub-Fund’s expenses may be netted against the income to
arrive at the net income figure. For the Distributing Classes, the current distribution policy is to distribute net income
(consisting of revenue, including any accrued interest and dividends less expenses).
Algebris Financial Credit Fund
30 June 2020 30 June 2019
Share Class Ex-Date Rate Ex-Date Rate
CHF Class Id 9-Jan-2020 CHF 1.2581 - -
CHF Class Rd 9-Jan-2020 CHF 1.0680 9-Jan-2019 CHF 1.5066
EUR Class Cd 9-Jan-2020 EUR 0.0103 - -
EUR Class Id 9-Jan-2020 EUR 1.3595 9-Jan-2019 EUR 1.7558
EUR Class Md 9-Jan-2020 EUR 0.9854 9-Jan-2019 EUR 1.9621
EUR Class Rd 9-Jan-2020 EUR 1.1986 9-Jan-2019 EUR 1.6202
EUR Class Wd 9-Jan-2020 EUR 1.3333 9-Jan-2019 EUR 1.6521
EUR Class XXLd 9-Jan-2020 EUR 1.2642 9-Jan-2019 EUR 1.5809
EUR Class Zd 9-Jan-2020 EUR 1.2533 - -
GBP Class Id 9-Jan-2020 GBP 1.3627 9-Jan-2019 GBP 1.8857
GBP Class Md 9-Jan-2020 GBP 1.3106 9-Jan-2019 GBP 1.0042
GBP Class Rd 9-Jan-2020 GBP 1.2964 9-Jan-2019 GBP 1.4503
GBP Class Wd 9-Jan-2020 GBP 1.2218 9-Jan-2019 GBP 1.3765
GBP Class Zd 9-Jan-2020 GBP 1.3274 9-Jan-2019 GBP 1.6158
SGD Class Id 9-Jan-2020 SGD 1.2890 - -
SGD Class Rd 9-Jan-2020 SGD 1.2651 9-Jan-2019 SGD 1.5764
SGD Class Wd 9-Jan-2020 SGD 1.2205 9-Jan-2019 SGD 1.4867
USD Class I2d 9-Jan-2020 USD 1.0749 - -
USD Class Id 9-Jan-2020 USD 1.3457 9-Jan-2019 USD 1.8417
USD Class Md 9-Jan-2020 USD 1.3885 9-Jan-2019 USD 2.8599
USD Class Rd 9-Jan-2020 USD 1.2383 9-Jan-2019 USD 1.6005
USD Class Wd 9-Jan-2020 USD 1.2635 9-Jan-2019 USD 1.6621
USD Class Zd 9-Jan-2020 USD 1.2901 9-Jan-2019 USD 1.3230
CHF Class Rd 8-Apr-2020 CHF 1.2965 8-Apr-2019 CHF 1.4058
CHF Class Wd 8-Apr-2020 CHF 0.0167 - -
EUR Class Cd 8-Apr-2020 EUR 0.5863 - -
EUR Class Id 8-Apr-2020 EUR 1.4629 8-Apr-2019 EUR 1.6374
EUR Class Md 8-Apr-2020 EUR 0.1451 8-Apr-2019 EUR 1.4806
EUR Class Rd 8-Apr-2020 EUR 1.3725 8-Apr-2019 EUR 1.4115
EUR Class Wd 8-Apr-2020 EUR 1.0695 8-Apr-2019 EUR 1.4855
EUR Class XXLd 8-Apr-2020 EUR 1.2579 8-Apr-2019 EUR 1.4682
GBP Class Id 8-Apr-2020 GBP 1.3902 8-Apr-2019 GBP 1.6987
GBP Class Md 8-Apr-2020 GBP 1.3601 8-Apr-2019 GBP 1.4909
GBP Class Rd 8-Apr-2020 GBP 1.4585 8-Apr-2019 GBP 1.3754
GBP Class Wd 8-Apr-2020 GBP 0.9695 8-Apr-2019 GBP 1.3889
GBP Class Zd 8-Apr-2020 GBP 1.4193 8-Apr-2019 GBP 1.4932
SGD Class Id 8-Apr-2020 SGD 0.6450 - -
SGD Class Rd 8-Apr-2020 SGD 1.3557 8-Apr-2019 SGD 1.5316
SGD Class Wd 8-Apr-2020 SGD 0.6229 8-Apr-2019 SGD 1.3859

ALGEBRIS UCITS FUNDS PLC
Notes to the Unaudited Financial Statements (continued)
for the period from 1 January 2020 to 30 June 2020
69
6. Distributions (continued)
Algebris Financial Credit Fund (continued)
USD Class Cd 8-Apr-2020 USD 0.3946 - -
USD Class I2d 8-Apr-2020 USD 1.2563 - -
USD Class Id 8-Apr-2020 USD 1.5173 8-Apr-2019 USD 1.7102
USD Class Md 8-Apr-2020 USD 1.3902 8-Apr-2019 USD 1.5774
USD Class Rd 8-Apr-2020 USD 1.5067 8-Apr-2019 USD 1.5134
USD Class Wd 8-Apr-2020 USD 1.0386 8-Apr-2019 USD 1.5166
USD Class Zd 8-Apr-2020 USD 1.4623 8-Apr-2019 USD 1.2486
Algebris Financial Income Fund
30 June 2020 30 June 2019
Share Class Ex-Date Rate Ex-Date Rate
CHF Class Id - - 9-Jan-2019 CHF 0.8920
CHF Class Rd 9-Jan-2020 CHF 0.7147 9-Jan-2019 CHF 0.8572
EUR Class Bd 9-Jan-2020 EUR 0.9489 9-Jan-2019 EUR 1.2775
EUR Class Id 9-Jan-2020 EUR 0.8976 9-Jan-2019 EUR 1.0007
EUR Class Md 9-Jan-2020 EUR 0.8161 9-Jan-2019 EUR 1.0197
EUR Class Rd 9-Jan-2020 EUR 0.8237 9-Jan-2019 EUR 0.9710
GBP Class Bd 9-Jan-2020 GBP 0.9836 9-Jan-2019 GBP 1.1465
GBP Class Id 9-Jan-2020 GBP 0.7593 9-Jan-2019 GBP 1.1753
GBP Class Rd 9-Jan-2020 GBP 0.7494 9-Jan-2019 GBP 0.8871
SGD Class Id 9-Jan-2020 SGD 0.8965 9-Jan-2019 SGD 1.0336
SGD Class Rd 9-Jan-2020 SGD 0.7696 9-Jan-2019 SGD 0.9205
USD Class Bd - - 9-Jan-2019 USD 1.2012
USD Class Id 9-Jan-2020 USD 1.0212 9-Jan-2019 USD 1.1513
USD Class Md 9-Jan-2020 USD 1.0742 9-Jan-2019 USD 1.2196
USD Class Rd 9-Jan-2020 USD 0.7724 9-Jan-2019 USD 1.0729
CHF Class Rd 8-Apr-2020 CHF 0.7455 8-Apr-2019 CHF 0.9252
EUR Class Bd 8-Apr-2020 EUR 0.9947 8-Apr-2019 EUR 1.1272
EUR Class Id 8-Apr-2020 EUR 0.9882 8-Apr-2019 EUR 1.1788
EUR Class Md 8-Apr-2020 EUR 0.8565 8-Apr-2019 EUR 0.9650
EUR Class Rd 8-Apr-2020 EUR 1.0078 8-Apr-2019 EUR 1.0393
GBP Class Bd 8-Apr-2020 GBP 1.0363 8-Apr-2019 GBP 1.1578
GBP Class Id 8-Apr-2020 GBP 0.8903 8-Apr-2019 GBP 1.1986
GBP Class Rd 8-Apr-2020 GBP 0.9600 8-Apr-2019 GBP 1.0353
SGD Class Id 8-Apr-2020 SGD 0.9376 8-Apr-2019 SGD 1.0029
SGD Class Rd 8-Apr-2020 SGD 1.0289 8-Apr-2019 SGD 1.1711
USD Class Bd - - 8-Apr-2019 USD 1.2239
USD Class Id 8-Apr-2020 USD 1.2842 8-Apr-2019 USD 1.2881
USD Class Md 8-Apr-2020 USD 1.1322 8-Apr-2019 USD 1.2395
USD Class Rd 8-Apr-2020 USD 1.0214 8-Apr-2019 USD 0.9940
Algebris Financial Equity Fund
30 June 2020 30 June 2019
Share Class Ex-Date Rate Ex-Date Rate
GBP Class Md 9-Jan-2020 GBP 0.0974 9-Jan-2019 GBP 0.2983
USD Class Md 9-Jan-2020 USD 0.1319 9-Jan-2019 USD 0.3960
GBP Class Md 8-Apr-2020 GBP 0.2460 8-Apr-2019 GBP 0.2020
USD Class Md 8-Apr-2020 USD 0.3891 8-Apr-2019 USD 0.2701
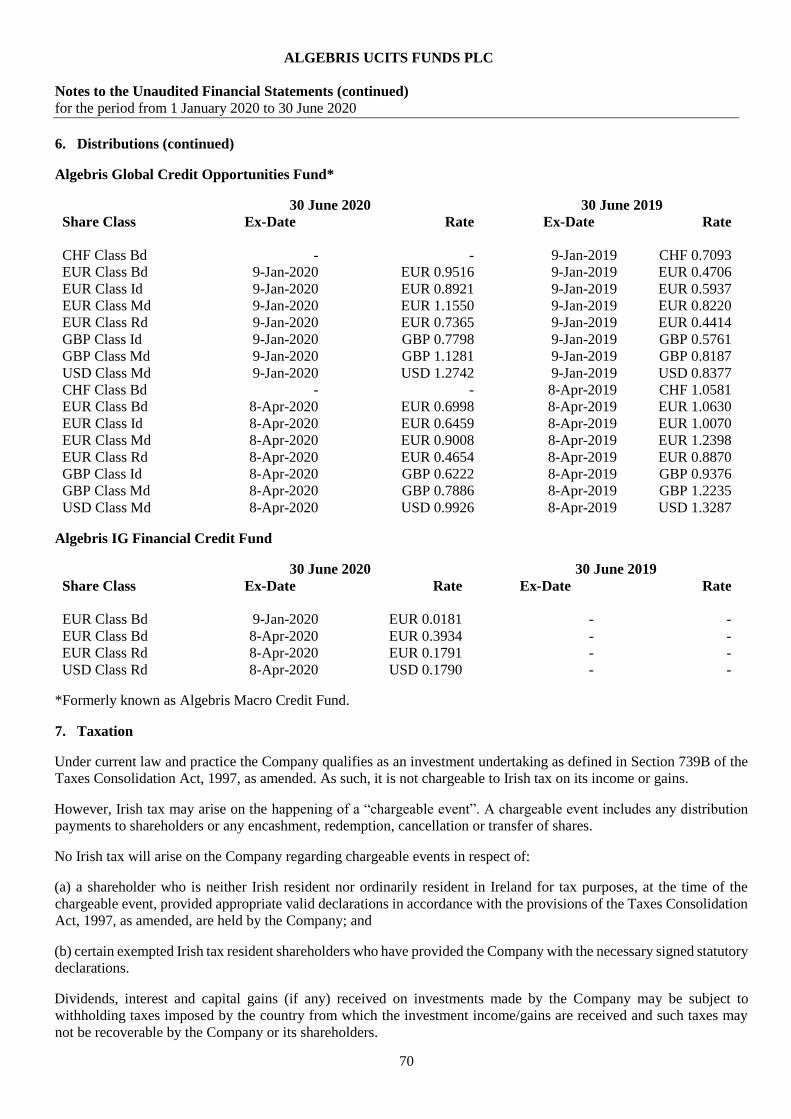
ALGEBRIS UCITS FUNDS PLC
Notes to the Unaudited Financial Statements (continued)
for the period from 1 January 2020 to 30 June 2020
70
6. Distributions (continued)
Algebris Global Credit Opportunities Fund*
30 June 2020 30 June 2019
Share Class Ex-Date Rate Ex-Date Rate
CHF Class Bd - - 9-Jan-2019 CHF 0.7093
EUR Class Bd 9-Jan-2020 EUR 0.9516 9-Jan-2019 EUR 0.4706
EUR Class Id 9-Jan-2020 EUR 0.8921 9-Jan-2019 EUR 0.5937
EUR Class Md 9-Jan-2020 EUR 1.1550 9-Jan-2019 EUR 0.8220
EUR Class Rd 9-Jan-2020 EUR 0.7365 9-Jan-2019 EUR 0.4414
GBP Class Id 9-Jan-2020 GBP 0.7798 9-Jan-2019 GBP 0.5761
GBP Class Md 9-Jan-2020 GBP 1.1281 9-Jan-2019 GBP 0.8187
USD Class Md 9-Jan-2020 USD 1.2742 9-Jan-2019 USD 0.8377
CHF Class Bd - - 8-Apr-2019 CHF 1.0581
EUR Class Bd 8-Apr-2020 EUR 0.6998 8-Apr-2019 EUR 1.0630
EUR Class Id 8-Apr-2020 EUR 0.6459 8-Apr-2019 EUR 1.0070
EUR Class Md 8-Apr-2020 EUR 0.9008 8-Apr-2019 EUR 1.2398
EUR Class Rd 8-Apr-2020 EUR 0.4654 8-Apr-2019 EUR 0.8870
GBP Class Id 8-Apr-2020 GBP 0.6222 8-Apr-2019 GBP 0.9376
GBP Class Md 8-Apr-2020 GBP 0.7886 8-Apr-2019 GBP 1.2235
USD Class Md 8-Apr-2020 USD 0.9926 8-Apr-2019 USD 1.3287
Algebris IG Financial Credit Fund
30 June 2020 30 June 2019
Share Class Ex-Date Rate Ex-Date Rate
EUR Class Bd 9-Jan-2020 EUR 0.0181 - -
EUR Class Bd 8-Apr-2020 EUR 0.3934 - -
EUR Class Rd 8-Apr-2020 EUR 0.1791 - -
USD Class Rd 8-Apr-2020 USD 0.1790 - -
*Formerly known as Algebris Macro Credit Fund.
7. Taxation
Under current law and practice the Company qualifies as an investment undertaking as defined in Section 739B of the
Taxes Consolidation Act, 1997, as amended. As such, it is not chargeable to Irish tax on its income or gains.
However, Irish tax may arise on the happening of a “chargeable event”. A chargeable event includes any distribution
payments to shareholders or any encashment, redemption, cancellation or transfer of shares.
No Irish tax will arise on the Company regarding chargeable events in respect of:
(a) a shareholder who is neither Irish resident nor ordinarily resident in Ireland for tax purposes, at the time of the
chargeable event, provided appropriate valid declarations in accordance with the provisions of the Taxes Consolidation
Act, 1997, as amended, are held by the Company; and
(b) certain exempted Irish tax resident shareholders who have provided the Company with the necessary signed statutory
declarations.
Dividends, interest and capital gains (if any) received on investments made by the Company may be subject to
withholding taxes imposed by the country from which the investment income/gains are received and such taxes may
not be recoverable by the Company or its shareholders.

ALGEBRIS UCITS FUNDS PLC
Notes to the Unaudited Financial Statements (continued)
for the period from 1 January 2020 to 30 June 2020
71
8. Soft commissions
There were no soft commission arrangements affecting the Company during the financial period ended 30 June 2020
(30 June 2019: Nil). 9. Net asset value table
The following table discloses the dealing Net Asset Value, the shares in issue and Net Asset Value per Share for each
Share Class as at 30 June 2020 and 31 December 2019.
30 June 2020
Algebris Financial Credit Fund
Net Asset Value Shares in Issue
Rounded
Net Asset Value per Share
CHF Class C Shares CHF 1,957,433 19,704 CHF 99.34
CHF Class I Shares CHF 15,161,008 92,140 CHF 164.54
CHF Class Id Shares CHF 12,838 115 CHF 111.66
CHF Class R Shares CHF 7,666,276 61,368 CHF 124.92
CHF Class Rd Shares CHF 2,681,485 27,064 CHF 99.08
CHF Class W Shares CHF 254,740 2,574 CHF 98.97
CHF Class Z Shares CHF 34,555,173 279,742 CHF 123.53
EUR Class C Shares EUR 27,407,535 275,270 EUR 99.57
EUR Class Cd Shares EUR 32,868,172 324,138 EUR 101.40
EUR Class I Shares EUR 1,539,713,158 8,917,281 EUR 172.67
EUR Class Id Shares EUR 766,987,565 6,559,786 EUR 116.92
EUR Class M Shares EUR 21,935,509 119,538 EUR 183.50
EUR Class Md Shares EUR 6,575,040 60,674 EUR 108.37
EUR Class R Shares EUR 708,947,910 4,704,891 EUR 150.68
EUR Class Rd Shares EUR 641,160,415 6,167,441 EUR 103.96
EUR Class W Shares EUR 47,407,438 367,051 EUR 129.16
EUR Class Wd Shares EUR 50,017,171 473,795 EUR 105.57
EUR Class XXLD Shares EUR 75,467,524 715,357 EUR 105.50
EUR Class Z Shares EUR 139,591,625 1,107,705 EUR 126.02
GBP Class C Shares GBP 974,409 9,728 GBP 100.17
GBP Class Cd Shares GBP 2,274,584 21,774 GBP 104.46
GBP Class I Shares GBP 10,067,949 70,590 GBP 142.63
GBP Class Id Shares GBP 312,001,824 2,728,751 GBP 114.34
GBP Class M Shares GBP 71,439 503 GBP 142.08
GBP Class Md Shares GBP 40,850 372 GBP 109.93
GBP Class R Shares GBP 8,490,884 67,121 GBP 126.50
GBP Class Rd Shares GBP 14,309,353 138,669 GBP 103.19
GBP Class W Shares GBP 3,317,893 29,001 GBP 114.40
GBP Class Wd Shares GBP 4,683,578 45,328 GBP 103.33
GBP Class Z Shares GBP 11,896,938 93,128 GBP 127.75
GBP Class Zd Shares GBP 16,750,016 153,668 GBP 109.00
HKD Class I Shares HKD 9,974 90 HKD 110.82
HKD Class R Shares HKD 9,913 90 HKD 110.14
JPY Class I Shares JPY 656,242 5,700 JPY 115
SGD Class I Shares SGD 1,445,724 12,292 SGD 117.62
SGD Class Id Shares SGD 1,865,000 17,230 SGD 108.24
SGD Class R Shares SGD 1,801,590 14,261 SGD 126.33
SGD Class Rd Shares SGD 5,367,090 51,038 SGD 105.16
SGD Class Wd Shares SGD 15,908,447 154,278 SGD 103.12
USD Class A Shares USD 1,091 10 USD 109.06
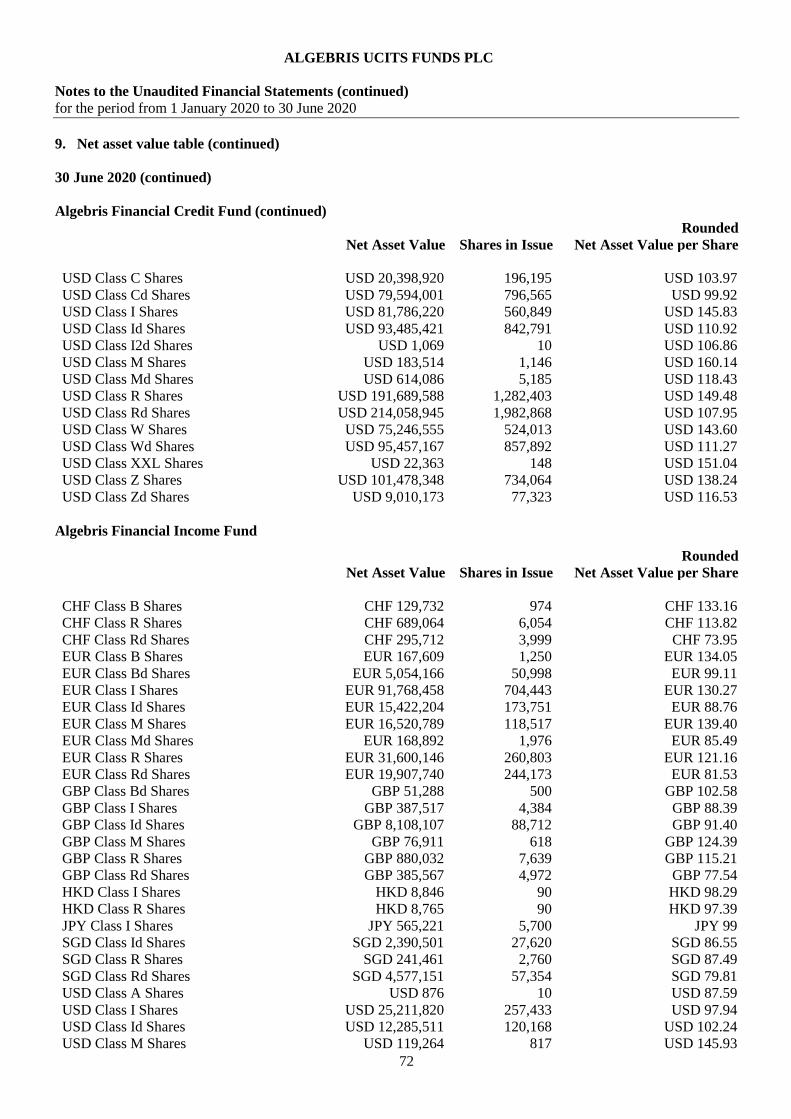
ALGEBRIS UCITS FUNDS PLC
Notes to the Unaudited Financial Statements (continued)
for the period from 1 January 2020 to 30 June 2020
72
9. Net asset value table (continued)
30 June 2020 (continued)
Algebris Financial Credit Fund (continued)
Net Asset Value Shares in Issue
Rounded
Net Asset Value per Share
USD Class C Shares USD 20,398,920 196,195 USD 103.97
USD Class Cd Shares USD 79,594,001 796,565 USD 99.92
USD Class I Shares USD 81,786,220 560,849 USD 145.83
USD Class Id Shares USD 93,485,421 842,791 USD 110.92
USD Class I2d Shares USD 1,069 10 USD 106.86
USD Class M Shares USD 183,514 1,146 USD 160.14
USD Class Md Shares USD 614,086 5,185 USD 118.43
USD Class R Shares USD 191,689,588 1,282,403 USD 149.48
USD Class Rd Shares USD 214,058,945 1,982,868 USD 107.95
USD Class W Shares USD 75,246,555 524,013 USD 143.60
USD Class Wd Shares USD 95,457,167 857,892 USD 111.27
USD Class XXL Shares USD 22,363 148 USD 151.04
USD Class Z Shares USD 101,478,348 734,064 USD 138.24
USD Class Zd Shares USD 9,010,173 77,323 USD 116.53
Algebris Financial Income Fund
Net Asset Value Shares in Issue
Rounded
Net Asset Value per Share
CHF Class B Shares CHF 129,732 974 CHF 133.16
CHF Class R Shares CHF 689,064 6,054 CHF 113.82
CHF Class Rd Shares CHF 295,712 3,999 CHF 73.95
EUR Class B Shares EUR 167,609 1,250 EUR 134.05
EUR Class Bd Shares EUR 5,054,166 50,998 EUR 99.11
EUR Class I Shares EUR 91,768,458 704,443 EUR 130.27
EUR Class Id Shares EUR 15,422,204 173,751 EUR 88.76
EUR Class M Shares EUR 16,520,789 118,517 EUR 139.40
EUR Class Md Shares EUR 168,892 1,976 EUR 85.49
EUR Class R Shares EUR 31,600,146 260,803 EUR 121.16
EUR Class Rd Shares EUR 19,907,740 244,173 EUR 81.53
GBP Class Bd Shares GBP 51,288 500 GBP 102.58
GBP Class I Shares GBP 387,517 4,384 GBP 88.39
GBP Class Id Shares GBP 8,108,107 88,712 GBP 91.40
GBP Class M Shares GBP 76,911 618 GBP 124.39
GBP Class R Shares GBP 880,032 7,639 GBP 115.21
GBP Class Rd Shares GBP 385,567 4,972 GBP 77.54
HKD Class I Shares HKD 8,846 90 HKD 98.29
HKD Class R Shares HKD 8,765 90 HKD 97.39
JPY Class I Shares JPY 565,221 5,700 JPY 99
SGD Class Id Shares SGD 2,390,501 27,620 SGD 86.55
SGD Class R Shares SGD 241,461 2,760 SGD 87.49
SGD Class Rd Shares SGD 4,577,151 57,354 SGD 79.81
USD Class A Shares USD 876 10 USD 87.59
USD Class I Shares USD 25,211,820 257,433 USD 97.94
USD Class Id Shares USD 12,285,511 120,168 USD 102.24
USD Class M Shares USD 119,264 817 USD 145.93

ALGEBRIS UCITS FUNDS PLC
Notes to the Unaudited Financial Statements (continued)
for the period from 1 January 2020 to 30 June 2020
73
9. Net asset value table (continued)
30 June 2020 (continued)
Algebris Financial Income Fund (continued)
Net Asset Value Shares in Issue
Rounded
Net Asset Value per Share
USD Class Md Shares USD 21,281,705 185,066 USD 115.00
USD Class R Shares USD 20,681,281 159,117 USD 129.98
USD Class Rd Shares USD 23,389,697 280,844 USD 83.28
Algebris Allocation Fund
Net Asset Value Shares in Issue
Rounded
Net Asset Value per Share
CHF Class R Shares CHF 52,978 607 CHF 87.21
EUR Class B Shares EUR 974 10 EUR 97.40
EUR Class I Shares EUR 5,371,089 57,186 EUR 93.92
EUR Class M Shares EUR 296,911 3,036 EUR 97.79
EUR Class R Shares EUR 1,215,278 13,615 EUR 89.26
JPY Class B Shares JPY 121,038 1,250 JPY 96.83
USD Class R Shares USD 13,279 145 USD 91.60
Algebris Financial Equity Fund
Net Asset Value
Shares in
Issue
Rounded
Net Asset Value per Share
CHF Class B Shares CHF 2,227,963 20,970 CHF 106.24
CHF Class R Shares CHF 119,698 1,212 CHF 98.80
EUR Class B Shares EUR 3,983,268 45,396 EUR 87.75
EUR Class Bm Shares EUR 451,361 387 EUR 1,166.01
EUR Class I Shares EUR 9,547,916 114,010 EUR 83.75
EUR Class M Shares EUR 5,038,759 52,932 EUR 95.19
EUR Class R Shares EUR 1,685,363 22,315 EUR 75.53
EUR Class Rm Shares EUR 18 0 EUR 890.90
GBP Class B Shares GBP 516,580 7,557 GBP 68.36
GBP Class I Shares GBP 15,042 202 GBP 74.54
GBP Class M Shares GBP 504,865 5,233 GBP 96.47
GBP Class Md Shares GBP 3,290,837 54,902 GBP 59.94
JPY Class B Shares JPY 451,993 5,700 JPY 79
USD Class B Shares USD 14,544,203 148,517 USD 97.93
USD Class Bm Shares USD 174,021 125 USD 1,392.17
USD Class Md Shares USD 6,945,524 83,089 USD 83.59
USD Class Mm Shares USD 37,403 18 USD 2,090.72

ALGEBRIS UCITS FUNDS PLC
Notes to the Unaudited Financial Statements (continued)
for the period from 1 January 2020 to 30 June 2020
74
9. Net asset value table (continued)
30 June 2020 (continued)
Algebris Global Credit Opportunities Fund*
Net Asset Value Shares in Issue
Rounded
Net Asset Value per Share
CHF Class B Shares CHF 236,389 1,978 CHF 119.52
CHF Class R Shares CHF 237,937 2,360 CHF 100.82
EUR Class B Shares EUR 1,064,588 8,650 EUR 123.07
EUR Class Bd Shares EUR 10,815,612 100,000 EUR 108.16
EUR Class I Shares EUR 33,670,887 280,529 EUR 120.03
EUR Class Id Shares EUR 20,268,713 192,271 EUR 105.42
EUR Class M Shares EUR 4,179,919 32,288 EUR 129.46
EUR Class Md Shares EUR 87,729 800 EUR 109.66
EUR Class R Shares EUR 148,743,037 1,258,484 EUR 118.19
EUR Class Rd Shares EUR 252,892,290 2,386,336 EUR 105.98
GBP Class B Shares GBP 19,208 150 GBP 128.28
GBP Class I Shares GBP 167,001 1,489 GBP 112.14
GBP Class Id Shares GBP 411,726 3,966 GBP 103.80
GBP Class M Shares GBP 18,781 161 GBP 116.79
GBP Class Md Shares GBP 67,317 614 GBP 109.70
GBP Class R Shares GBP 110,369 930 GBP 118.63
JPY Class I Shares JPY 677,413 5,700 JPY 118.84
USD Class B Shares USD 67,433 500 USD 134.87
USD Class I Shares USD 4,969,282 43,820 USD 113.40
USD Class M Shares USD 4,481,574 33,324 USD 134.49
USD Class Md Shares USD 1,311,984 10,734 USD 122.23
USD Class R Shares USD 1,563,867 12,519 USD 124.92
Algebris Core Italy Fund
Net Asset Value Shares in Issue
Rounded
Net Asset Value per Share
EUR Class Eb Shares EUR 22,155,282 227,169 EUR 97.53
EUR Class I Shares EUR 997 10 EUR 99.68
EUR Class M Shares EUR 20,471,793 207,070 EUR 98.86
EUR Class R Shares EUR 345,487 3,695 EUR 93.50
GBP Class M Shares GBP 3,062 35 GBP 88.40
JPY Class I Shares JPY 125,540 1,250 JPY 100.43
USD Class I Shares USD 1,125 11 USD 102.30
*Formerly known as Algebris Macro Credit Fund.

ALGEBRIS UCITS FUNDS PLC
Notes to the Unaudited Financial Statements (continued)
for the period from 1 January 2020 to 30 June 2020
75
9. Net asset value table (continued)
30 June 2020 (continued)
Algebris IG Financial Credit Fund
Net Asset Value Shares in Issue
Rounded
Net Asset Value per Share
CHF Class B Shares CHF 1,133 11 CHF 103.05
CHF Class I Shares CHF 1,133 11 CHF 102.98
CHF Class R Shares CHF 1,128 11 CHF 102.59
EUR Class B Shares EUR 51,261,478 496,255 EUR 103.30
EUR Class Bd Shares EUR 20,673,671 202,390 EUR 102.15
EUR Class I Shares EUR 2,564,380 24,855 EUR 103.17
EUR Class M Shares EUR 10,086,237 97,390 EUR 103.56
EUR Class R Shares EUR 43,113,294 419,309 EUR 102.82
EUR Class Rd Shares EUR 19,220,863 190,306 EUR 101.00
GBP Class B Shares GBP 931 9 GBP 103.49
GBP Class I Shares GBP 931 9 GBP 103.41
GBP Class Id Shares GBP 1,001 10 GBP 100.10
GBP Class M Shares GBP 1,001 10 GBP 100.12
GBP Class Md Shares GBP 1,001 10 GBP 100.12
GBP Class R Shares GBP 927 9 GBP 103.04
HKD Class B Shares HKD 9,155 87 HKD 105.23
HKD Class I Shares HKD 9,147 87 HKD 105.14
HKD Class R Shares HKD 9,114 87 HKD 104.76
JPY Class B Shares JPY 122,197 1,180 JPY 103.56
JPY Class I Shares JPY 122,089 1,180 JPY 103.47
JPY Class M Shares JPY 408,026,274 3,930,000 JPY 103.82
JPY Class R Shares JPY 121,617 1,180 JPY 103.07
SGD Class B Shares SGD 1,567 15 SGD 104.44
SGD Class I Shares SGD 1,566 15 SGD 104.39
SGD Class R Shares SGD 1,560 15 SGD 104.00
USD Class B Shares USD 3,441,805 32,696 USD 105.27
USD Class I Shares USD 1,156 11 USD 105.09
USD Class M Shares USD 4,075,598 38,700 USD 105.31
USD Class R Shares USD 741,603 7,098 USD 104.49
USD Class Rd Shares USD 1,120 11 USD 101.85

ALGEBRIS UCITS FUNDS PLC
Notes to the Unaudited Financial Statements (continued)
for the period from 1 January 2020 to 30 June 2020
76
9. Net asset value table (continued)
31 December 2019
Algebris Financial Credit Fund
Net Asset Value Shares in Issue
Rounded
Net Asset Value per Share
CHF Class I Shares CHF 10,678,394 65,976 CHF 161.85
CHF Fund Class Id CHF 52,401 500 CHF 104.80
CHF Class R Shares CHF 7,742,480 62,921 CHF 123.05
CHF Class Rd Shares CHF 4,080,348 40,805 CHF 100.00
CHF Class Z Shares CHF 38,799,567 320,276 CHF 121.14
EUR Fund Class Cd EUR 249,947 2,500 EUR 99.98
EUR Class I Shares EUR 1,411,043,983 8,343,159 EUR 169.13
EUR Class Id Shares EUR 827,212,095 7,046,769 EUR 117.39
EUR Class M Shares EUR 9,067,577 50,688 EUR 178.89
EUR Class Md Shares EUR 644,000 6,032 EUR 106.77
EUR Class R Shares EUR 631,677,037 4,266,753 EUR 148.05
EUR Class Rd Shares EUR 686,575,773 6,552,195 EUR 104.79
EUR Class W Shares EUR 20,764,809 163,693 EUR 126.85
EUR Class Wd Shares EUR 43,722,502 411,881 EUR 106.15
EUR Class XXLD Shares EUR 75,612,966 715,357 EUR 105.70
EUR Class Z Shares EUR 136,441,380 1,106,282 EUR 123.33
EUR Fund Class Zd EUR 5,238,854 50,000 EUR 104.78
GBP Class I Shares GBP 9,277,576 66,483 GBP 139.55
GBP Class Id Shares GBP 317,222,822 2,763,583 GBP 114.79
GBP Class M Shares GBP 121,392 877 GBP 138.42
GBP Class Md Shares GBP 1,560,182 14,178 GBP 110.04
GBP Class R Shares GBP 6,621,722 53,315 GBP 124.20
GBP Class Rd Shares GBP 16,187,377 155,454 GBP 104.13
GBP Class W Shares GBP 337,049 3,004 GBP 112.22
GBP Class Wd Shares GBP 2,866,160 27,629 GBP 103.74
GBP Class Z Shares GBP 11,460,184 91,662 GBP 125.03
GBP Class Zd Shares GBP 18,011,715 164,635 GBP 109.40
HKD Fund Class I HKD 9,622 90 HKD 106.91
HKD Fund Class R HKD 9,591 90 HKD 106.57
JPY Class I Shares JPY 641,377 5,700 JPY 112.52
SGD Class I Shares SGD 398,404 3,476 SGD 114.62
SGD Class Id Shares SGD 107,577 1,000 SGD 107.58
SGD Class R Shares SGD 3,028,303 24,598 SGD 123.11
SGD Class Rd Shares SGD 5,105,062 48,559 SGD 105.13
SGD Class Wd Shares SGD 3,531,661 34,559 SGD 102.19
USD Fund Class 12D USD 1,053 10 USD 105.33
USD Fund Class A USD 1,052 10 USD 105.19
USD Fund Class C USD 150,372 1,500 USD 100.25
USD Class I Shares USD 83,933,561 595,907 USD 140.85
USD Class Id Shares USD 99,924,867 908,092 USD 110.04
USD Class M Shares USD 229,766 1,496 USD 153.59
USD Class Md Shares USD 630,988 5,414 USD 116.56
USD Class R Shares USD 203,802,268 1,407,974 USD 144.75
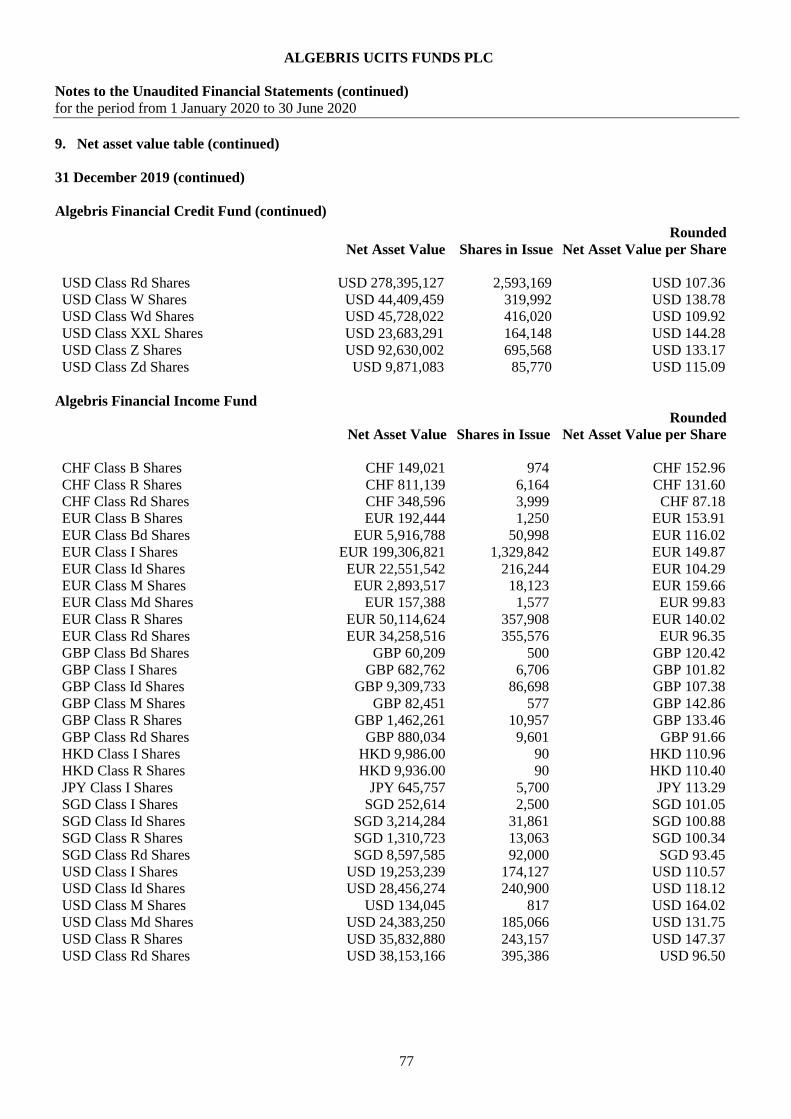
ALGEBRIS UCITS FUNDS PLC
Notes to the Unaudited Financial Statements (continued)
for the period from 1 January 2020 to 30 June 2020
77
9. Net asset value table (continued)
31 December 2019 (continued)
Algebris Financial Credit Fund (continued)
Net Asset Value Shares in Issue
Rounded
Net Asset Value per Share
USD Class Rd Shares USD 278,395,127 2,593,169 USD 107.36
USD Class W Shares USD 44,409,459 319,992 USD 138.78
USD Class Wd Shares USD 45,728,022 416,020 USD 109.92
USD Class XXL Shares USD 23,683,291 164,148 USD 144.28
USD Class Z Shares USD 92,630,002 695,568 USD 133.17
USD Class Zd Shares USD 9,871,083 85,770 USD 115.09
Algebris Financial Income Fund
Net Asset Value Shares in Issue
Rounded
Net Asset Value per Share
CHF Class B Shares CHF 149,021 974 CHF 152.96
CHF Class R Shares CHF 811,139 6,164 CHF 131.60
CHF Class Rd Shares CHF 348,596 3,999 CHF 87.18
EUR Class B Shares EUR 192,444 1,250 EUR 153.91
EUR Class Bd Shares EUR 5,916,788 50,998 EUR 116.02
EUR Class I Shares EUR 199,306,821 1,329,842 EUR 149.87
EUR Class Id Shares EUR 22,551,542 216,244 EUR 104.29
EUR Class M Shares EUR 2,893,517 18,123 EUR 159.66
EUR Class Md Shares EUR 157,388 1,577 EUR 99.83
EUR Class R Shares EUR 50,114,624 357,908 EUR 140.02
EUR Class Rd Shares EUR 34,258,516 355,576 EUR 96.35
GBP Class Bd Shares GBP 60,209 500 GBP 120.42
GBP Class I Shares GBP 682,762 6,706 GBP 101.82
GBP Class Id Shares GBP 9,309,733 86,698 GBP 107.38
GBP Class M Shares GBP 82,451 577 GBP 142.86
GBP Class R Shares GBP 1,462,261 10,957 GBP 133.46
GBP Class Rd Shares GBP 880,034 9,601 GBP 91.66
HKD Class I Shares HKD 9,986.00 90 HKD 110.96
HKD Class R Shares HKD 9,936.00 90 HKD 110.40
JPY Class I Shares JPY 645,757 5,700 JPY 113.29
SGD Class I Shares SGD 252,614 2,500 SGD 101.05
SGD Class Id Shares SGD 3,214,284 31,861 SGD 100.88
SGD Class R Shares SGD 1,310,723 13,063 SGD 100.34
SGD Class Rd Shares SGD 8,597,585 92,000 SGD 93.45
USD Class I Shares USD 19,253,239 174,127 USD 110.57
USD Class Id Shares USD 28,456,274 240,900 USD 118.12
USD Class M Shares USD 134,045 817 USD 164.02
USD Class Md Shares USD 24,383,250 185,066 USD 131.75
USD Class R Shares USD 35,832,880 243,157 USD 147.37
USD Class Rd Shares USD 38,153,166 395,386 USD 96.50
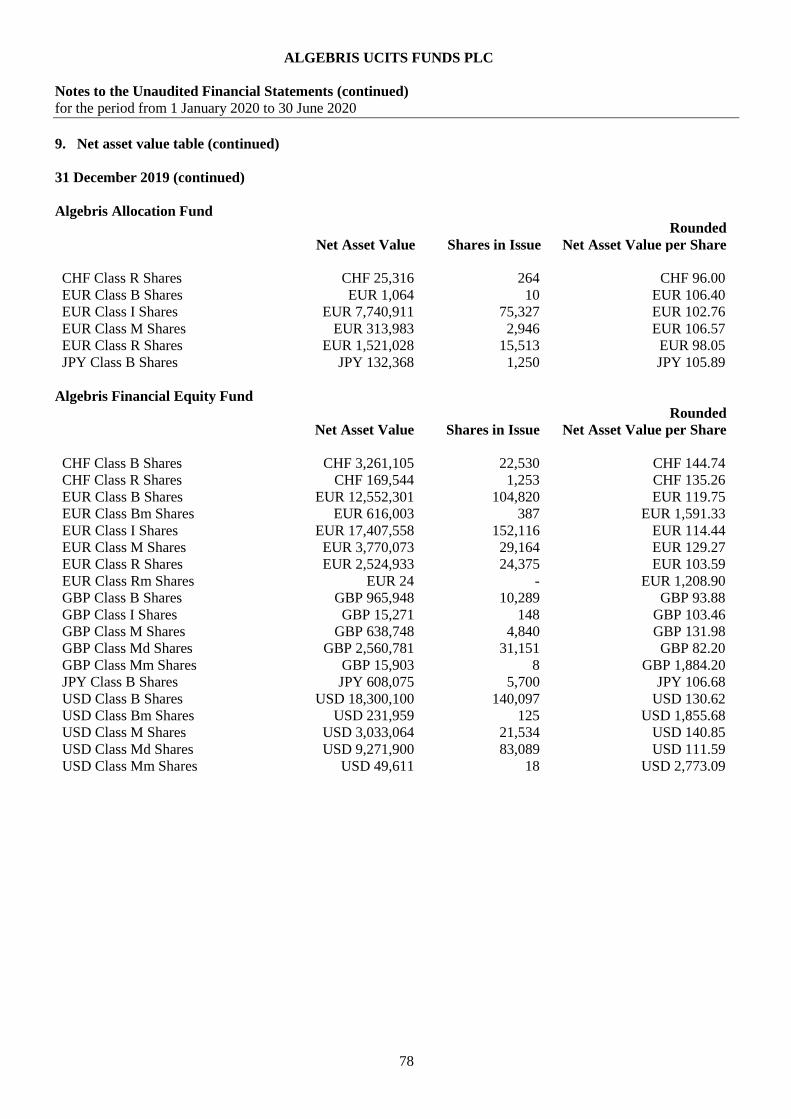
ALGEBRIS UCITS FUNDS PLC
Notes to the Unaudited Financial Statements (continued)
for the period from 1 January 2020 to 30 June 2020
78
9. Net asset value table (continued)
31 December 2019 (continued)
Algebris Allocation Fund
Net Asset Value Shares in Issue
Rounded
Net Asset Value per Share
CHF Class R Shares CHF 25,316 264 CHF 96.00
EUR Class B Shares EUR 1,064 10 EUR 106.40
EUR Class I Shares EUR 7,740,911 75,327 EUR 102.76
EUR Class M Shares EUR 313,983 2,946 EUR 106.57
EUR Class R Shares EUR 1,521,028 15,513 EUR 98.05
JPY Class B Shares JPY 132,368 1,250 JPY 105.89
Algebris Financial Equity Fund
Net Asset Value Shares in Issue
Rounded
Net Asset Value per Share
CHF Class B Shares CHF 3,261,105 22,530 CHF 144.74
CHF Class R Shares CHF 169,544 1,253 CHF 135.26
EUR Class B Shares EUR 12,552,301 104,820 EUR 119.75
EUR Class Bm Shares EUR 616,003 387 EUR 1,591.33
EUR Class I Shares EUR 17,407,558 152,116 EUR 114.44
EUR Class M Shares EUR 3,770,073 29,164 EUR 129.27
EUR Class R Shares EUR 2,524,933 24,375 EUR 103.59
EUR Class Rm Shares EUR 24 - EUR 1,208.90
GBP Class B Shares GBP 965,948 10,289 GBP 93.88
GBP Class I Shares GBP 15,271 148 GBP 103.46
GBP Class M Shares GBP 638,748 4,840 GBP 131.98
GBP Class Md Shares GBP 2,560,781 31,151 GBP 82.20
GBP Class Mm Shares GBP 15,903 8 GBP 1,884.20
JPY Class B Shares JPY 608,075 5,700 JPY 106.68
USD Class B Shares USD 18,300,100 140,097 USD 130.62
USD Class Bm Shares USD 231,959 125 USD 1,855.68
USD Class M Shares USD 3,033,064 21,534 USD 140.85
USD Class Md Shares USD 9,271,900 83,089 USD 111.59
USD Class Mm Shares USD 49,611 18 USD 2,773.09
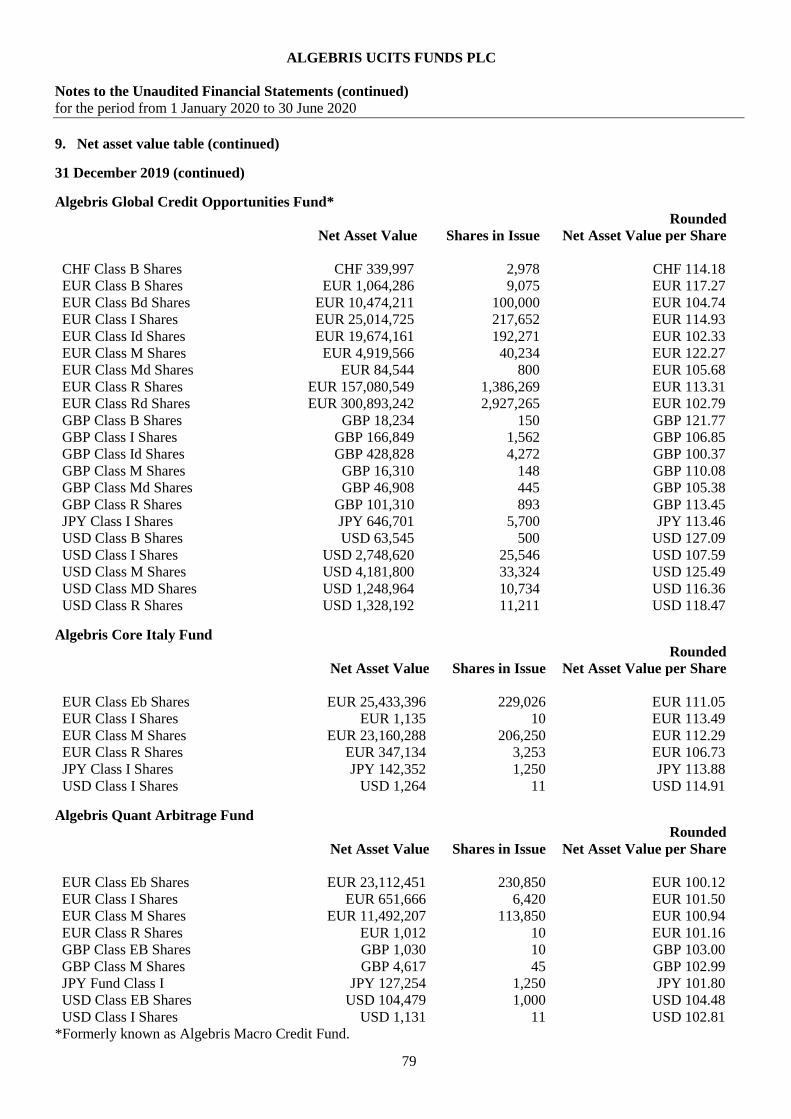
ALGEBRIS UCITS FUNDS PLC
Notes to the Unaudited Financial Statements (continued)
for the period from 1 January 2020 to 30 June 2020
79
9. Net asset value table (continued)
31 December 2019 (continued)
Algebris Global Credit Opportunities Fund*
Net Asset Value Shares in Issue
Rounded
Net Asset Value per Share
CHF Class B Shares CHF 339,997 2,978 CHF 114.18
EUR Class B Shares EUR 1,064,286 9,075 EUR 117.27
EUR Class Bd Shares EUR 10,474,211 100,000 EUR 104.74
EUR Class I Shares EUR 25,014,725 217,652 EUR 114.93
EUR Class Id Shares EUR 19,674,161 192,271 EUR 102.33
EUR Class M Shares EUR 4,919,566 40,234 EUR 122.27
EUR Class Md Shares EUR 84,544 800 EUR 105.68
EUR Class R Shares EUR 157,080,549 1,386,269 EUR 113.31
EUR Class Rd Shares EUR 300,893,242 2,927,265 EUR 102.79
GBP Class B Shares GBP 18,234 150 GBP 121.77
GBP Class I Shares GBP 166,849 1,562 GBP 106.85
GBP Class Id Shares GBP 428,828 4,272 GBP 100.37
GBP Class M Shares GBP 16,310 148 GBP 110.08
GBP Class Md Shares GBP 46,908 445 GBP 105.38
GBP Class R Shares GBP 101,310 893 GBP 113.45
JPY Class I Shares JPY 646,701 5,700 JPY 113.46
USD Class B Shares USD 63,545 500 USD 127.09
USD Class I Shares USD 2,748,620 25,546 USD 107.59
USD Class M Shares USD 4,181,800 33,324 USD 125.49
USD Class MD Shares USD 1,248,964 10,734 USD 116.36
USD Class R Shares USD 1,328,192 11,211 USD 118.47
Algebris Core Italy Fund
Net Asset Value Shares in Issue
Rounded
Net Asset Value per Share
EUR Class Eb Shares EUR 25,433,396 229,026 EUR 111.05
EUR Class I Shares EUR 1,135 10 EUR 113.49
EUR Class M Shares EUR 23,160,288 206,250 EUR 112.29
EUR Class R Shares EUR 347,134 3,253 EUR 106.73
JPY Class I Shares JPY 142,352 1,250 JPY 113.88
USD Class I Shares USD 1,264 11 USD 114.91
Algebris Quant Arbitrage Fund
Net Asset Value Shares in Issue
Rounded
Net Asset Value per Share
EUR Class Eb Shares EUR 23,112,451 230,850 EUR 100.12
EUR Class I Shares EUR 651,666 6,420 EUR 101.50
EUR Class M Shares EUR 11,492,207 113,850 EUR 100.94
EUR Class R Shares EUR 1,012 10 EUR 101.16
GBP Class EB Shares GBP 1,030 10 GBP 103.00
GBP Class M Shares GBP 4,617 45 GBP 102.99
JPY Fund Class I JPY 127,254 1,250 JPY 101.80
USD Class EB Shares USD 104,479 1,000 USD 104.48
USD Class I Shares USD 1,131 11 USD 102.81
*Formerly known as Algebris Macro Credit Fund.

ALGEBRIS UCITS FUNDS PLC
Notes to the Unaudited Financial Statements (continued)
for the period from 1 January 2020 to 30 June 2020
80
9. Net asset value table (continued)
31 December 2019 (continued)
Algebris IG Financial Credit Fund
Net Asset Value Shares in Issue
Rounded
Net Asset Value per Share
2019 2019
CHF Class B Shares CHF 1,108 11 CHF 100.77
CHF Class I Shares CHF 1,108 11 CHF 100.73
CHF Class R Shares CHF 1,107 11 CHF 100.63
EUR Class B Shares EUR 6,849,683 68,010 EUR 100.72
EUR Class BD Shares EUR 20,004,865 200,000 EUR 100.02
EUR Class I Shares EUR 1,007 10 EUR 100.67
EUR Class M Shares EUR 4,786,224 47,494 EUR 100.78
EUR Class R Shares EUR 202,189 2,010 EUR 100.59
GBP Class B Shares GBP 908 9 GBP 100.94
GBP Class I Shares GBP 908 9 GBP 100.93
GBP Class R Shares GBP 907 9 GBP 100.82
HKD Class B Shares HKD 8,808 87 HKD 101.24
HKD Class I Shares HKD 8,806 87 HKD 101.22
HKD Class R Shares HKD 8,797 87 HKD 101.11
JPY Class B Shares JPY 119,106 1,180 JPY 100.94
JPY Class I Shares JPY 119,076 1,180 JPY 100.91
JPY Class M Shares JPY 396,929,791 3,930,000 JPY 101.00
JPY Class R Shares JPY 118,950 1,180 JPY 100.81
SGD Class B Shares SGD 1,514.00 15 SGD 100.93
SGD Class I Shares SGD 1,514.00 15 SGD 100.92
SGD Class R Shares SGD 1,512.00 15 SGD 100.81
USD Class B Shares USD 1,113 11 USD 101.17
USD Class I Shares USD 1,113 11 USD 101.14
USD Class M Shares USD 3,998,328 39,500 USD 101.22
USD Class R Shares USD 1,111 11 USD 101.03
# All the share classes other than in base currency are hedged.

ALGEBRIS UCITS FUNDS PLC
Notes to the Unaudited Financial Statements (continued)
for the period from 1 January 2020 to 30 June 2020
81
10. Exchange rates
The following exchange rates were used to translate assets and liabilities into the functional currency Euro for the
Sub-Funds:
Currenc 30 June 2020 31 December 2019
Swiss francs 0.9398 0.9214
Euro 1.0000 1.0000
Japanese Yen 0.0082 0.0082
Pound Sterling 1.1040 1.1835
Singapore Dollar 0.6388 0.6632
United States Dollar 0.8902 0.8919
Hong Kong Dollar 0.1149 -
11. Related Party Transactions and Connected Persons
The below table provides an analysis of related party transactions for the period ended 30 June 2020.
Name Relationship Transaction type Fees paid
Algebris (UK) Limited Investment Manager,
Promoter
Investment management
services
See note 5
The Investment Manager is a subsidiary of Algebris Investments (Luxembourg) S.a.r.l. Alexander Lasagna, Director
of the Company, is also a Director of both the Investment Manager and Algebris Investments (Luxembourg) S.a.r.l.
Alexander Lasagna holds 32,032 (31 December 2019: 31,796) shares in Algebris Financial Equity Fund.
Fees paid to the Directors and the Company Secretary for the financial period ended 30 June 2020 are included in
Note 5 of these financial statements.
Algebris Investments (Asia) PTE LTD, a subsidiary of Algebris Investments (Luxembourg) S.a.r.l. holds 28,348 (31
December 2019: 28,348) shares in Algebris Financial Credit Fund, 5,700 (31 December 2019: 5,700) shares in Algebris
Financial Income Fund, 10 (31 December 2019: 10) shares in Algebris Allocation Fund, 19,410 (31 December 2019:
19,410) shares in Algebris Financial Equity Fund, 5,700 (31 December 2019: 5,700) shares in Algebris Global Credit
Opportunities Fund, 200,023 (31 December 2019: 200,023) shares in Algebris Core Italy Fund, Nil (31 December
2019: 100,050) shares in Algebris Quant Arbitrage Fund and 53,614 (31 December 2019: Nil) shares in Algebris IG
Financial Credit Fund.
The Investment Manager holds 200 (31 December 2019: 200) shares in Algebris Financial Credit Fund, 190 (31
December 2019: 180) shares in Algebris Financial Income Fund, 1,250 (31 December 2019: 1,250) shares in Algebris
Allocation Fund, 1,271 (31 December 2019: 1,271) shares in Algebris Core Italy Fund, Nil (31 December 2019: 1,291)
shares in Algebris Quant Arbitrage Fund and 4,003,820 (31 December 2019: 4,003,769) shares in Algebris IG
Financial Credit Fund.
Connected Persons Transactions
In accordance with the requirements of the Central Bank UCITS Regulations, all transactions carried out with the
Company by the management company or depositary of a UCITS, and the delegate or sub-delegates of such a
management company or depositary (excluding any non-group company sub-depositaries appointed by a depositary),
and any associated or group companies of such a management company, depositary, delegate or sub-delegate
(“connected parties”) must be carried out as if negotiated at arm’s length and be in the best interests of shareholders.
The Directors are satisfied that there are arrangements (evidenced by written procedures) in place to ensure that the
obligations set out in the Central Bank UCITS Regulations are applied to all transactions with connected persons and
transactions with connected persons entered into during the period complied with the obligations set out in the Central
Bank UCITS Regulations.

ALGEBRIS UCITS FUNDS PLC
Notes to the Unaudited Financial Statements (continued)
for the period from 1 January 2020 to 30 June 2020
82
11. Related Party Transactions and Connected Persons (continued)
Cross Sub-Fund Investments
For Algebris Allocation Fund, as at 30 June 2020, the cross Sub-Fund investments were as follows –
Currenc EUR EUR
30 June 2020 31 December 2019
Algebris UCITS Funds plc - Algebris Financial Income Fund Class M
Accumulating 1,263,120 1,692,722
Algebris UCITS Funds plc - Algebris Financial Credit Fund Class M
Accumulating 1,165,860 1,501,327
Algebris UCITS Funds plc - Algebris Global Credit Opportunities Fund
Class M Accumulating 1,238,880 1,432,782
Algebris UCITS Funds plc - Algebris Core Italy Fund Class M
Accumulating 777,464 824,376
Algebris UCITS Funds plc - Algebris Quant Arbitrage Fund Class M
Accumulating - 1,403,066
Algebris UCITS Funds plc - Algebris Financial Equity Fund Class M EUR
Shares 171,432 -
Algebris UCITS Funds Plc - Algebris IG Financial Credit Fund Class M
EUR Accumulating 1,078,896 1,361,880
Algebris UCITS Funds Plc - Algebris Financial Credit Fund Class M USD
Accumulating 135,933 178,547
Algebris UCITS Funds Plc - Algebris IG Financial Credit Fund Class M
USD Accumulating 206,584 271,102
Total 6,038,169 8,665,802
There was net (loss)/gain on financial assets and liabilities at fair value through profit & loss of EUR (717,181) (31
December 2019: EUR 784,852) due to such cross holdings.
For Algebris IG Financial Credit Fund, as at 30 June 2020, the cross Sub-Fund investments were as follows
EUR EUR
30 June 2020
31 December
2019
Algebris UCITS Funds plc - Algebris Financial Credit Fund Class M
Accumulating 13,997,680 986,535
Total 13,997,680 986,535
There was net gain on financial assets and liabilities at fair value through profit & loss of EUR 303,700 (31 December
2019: EUR 20,050) due to such cross holdings.
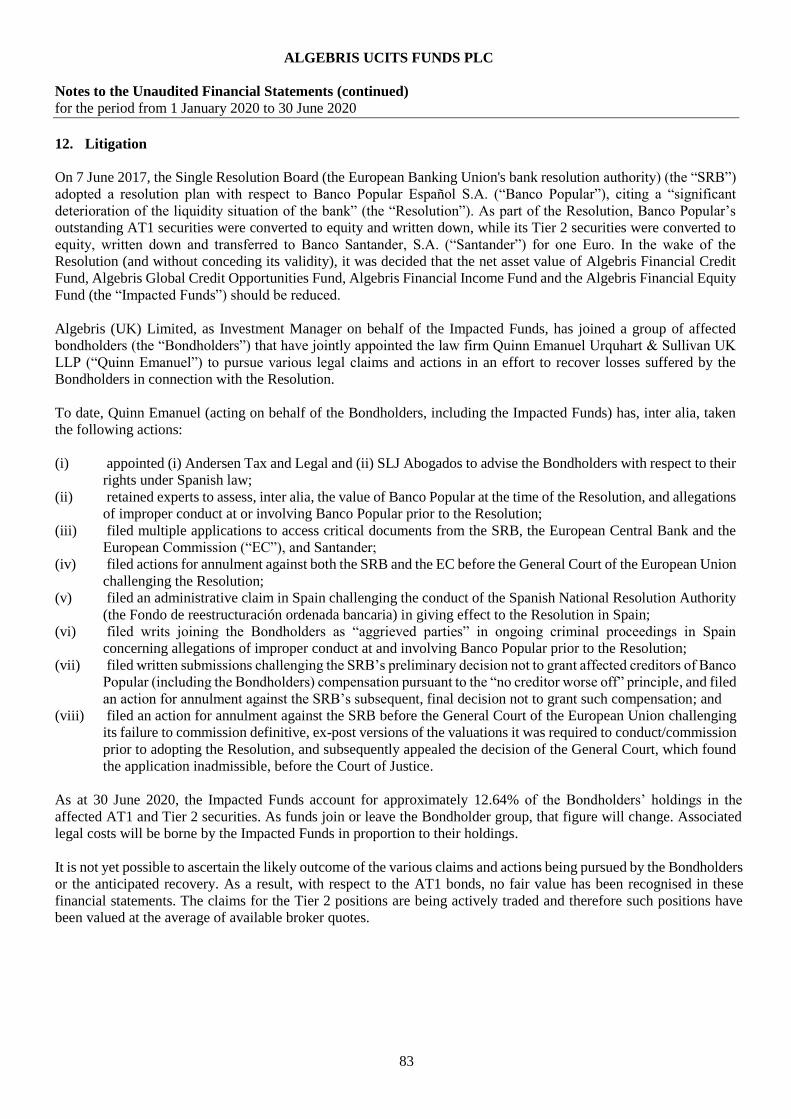
ALGEBRIS UCITS FUNDS PLC
Notes to the Unaudited Financial Statements (continued)
for the period from 1 January 2020 to 30 June 2020
83
12. Litigation
On 7 June 2017, the Single Resolution Board (the European Banking Union's bank resolution authority) (the “SRB”)
adopted a resolution plan with respect to Banco Popular Español S.A. (“Banco Popular”), citing a “significant
deterioration of the liquidity situation of the bank” (the “Resolution”). As part of the Resolution, Banco Popular’s
outstanding AT1 securities were converted to equity and written down, while its Tier 2 securities were converted to
equity, written down and transferred to Banco Santander, S.A. (“Santander”) for one Euro. In the wake of the
Resolution (and without conceding its validity), it was decided that the net asset value of Algebris Financial Credit
Fund, Algebris Global Credit Opportunities Fund, Algebris Financial Income Fund and the Algebris Financial Equity
Fund (the “Impacted Funds”) should be reduced.
Algebris (UK) Limited, as Investment Manager on behalf of the Impacted Funds, has joined a group of affected
bondholders (the “Bondholders”) that have jointly appointed the law firm Quinn Emanuel Urquhart & Sullivan UK
LLP (“Quinn Emanuel”) to pursue various legal claims and actions in an effort to recover losses suffered by the
Bondholders in connection with the Resolution.
To date, Quinn Emanuel (acting on behalf of the Bondholders, including the Impacted Funds) has, inter alia, taken
the following actions:
(i) appointed (i) Andersen Tax and Legal and (ii) SLJ Abogados to advise the Bondholders with respect to their
rights under Spanish law;
(ii) retained experts to assess, inter alia, the value of Banco Popular at the time of the Resolution, and allegations
of improper conduct at or involving Banco Popular prior to the Resolution;
(iii) filed multiple applications to access critical documents from the SRB, the European Central Bank and the
European Commission (“EC”), and Santander;
(iv) filed actions for annulment against both the SRB and the EC before the General Court of the European Union
challenging the Resolution;
(v) filed an administrative claim in Spain challenging the conduct of the Spanish National Resolution Authority
(the Fondo de reestructuración ordenada bancaria) in giving effect to the Resolution in Spain;
(vi) filed writs joining the Bondholders as “aggrieved parties” in ongoing criminal proceedings in Spain
concerning allegations of improper conduct at and involving Banco Popular prior to the Resolution;
(vii) filed written submissions challenging the SRB’s preliminary decision not to grant affected creditors of Banco
Popular (including the Bondholders) compensation pursuant to the “no creditor worse off” principle, and filed
an action for annulment against the SRB’s subsequent, final decision not to grant such compensation; and
(viii) filed an action for annulment against the SRB before the General Court of the European Union challenging
its failure to commission definitive, ex-post versions of the valuations it was required to conduct/commission
prior to adopting the Resolution, and subsequently appealed the decision of the General Court, which found
the application inadmissible, before the Court of Justice.
As at 30 June 2020, the Impacted Funds account for approximately 12.64% of the Bondholders’ holdings in the
affected AT1 and Tier 2 securities. As funds join or leave the Bondholder group, that figure will change. Associated
legal costs will be borne by the Impacted Funds in proportion to their holdings.
It is not yet possible to ascertain the likely outcome of the various claims and actions being pursued by the Bondholders
or the anticipated recovery. As a result, with respect to the AT1 bonds, no fair value has been recognised in these
financial statements. The claims for the Tier 2 positions are being actively traded and therefore such positions have
been valued at the average of available broker quotes.

ALGEBRIS UCITS FUNDS PLC
Notes to the Unaudited Financial Statements (continued)
for the period from 1 January 2020 to 30 June 2020
84
13. Significant events during the period
In March 2020, the COVID-19 outbreak was declared a pandemic by the World Health Organization. The outbreak
and the response of Governments in dealing with the pandemic has seen a corresponding significant increase in
financial market volatility and corresponding fluctuations in the fair value of the Company’s investment portfolio.
The Company continued to determine net asset values with the frequency as set out in the offering documents,
consistently applying valuation policies and reflective of prevailing market conditions. As the market conditions
remain extremely volatile, the Investment Manager does not consider it meaningful to quantify the impact of this
outbreak on the Company.
The nature and extent of the impact of such events is difficult to predict but they may adversely affect the return on
each Fund and its investments. Market disruptions or closures may result in the Investment Manager being unable to
accurately value the assets of a Fund, or in the event of high levels of redemption, the Company may use certain
liquidity management tools permitted by the Central Bank, including deferred redemptions, the implementation of fair
value pricing or temporarily suspension of a Fund.
Supplements to the Prospectus dated 5 December 2018 were issued for Algebris Core Italy Fund with an effective date
12 March 2020. The Investment policy was revised to require at least 17.5% of the Fund's Net Asset Value to be
invested in Italian Securities not listed on the FTSE MIB index and that 3.5% of the Net Asset Value is required to be
invested in Italian Securities issued by companies not listed on the FTSE MIB or FTSE Mid Cap indices. The
Investment Manager became a signatory to the United Nations’ Principles for Responsible Investing (“UNPRI”) on
23 July 2019.
Supplements to the Prospectus dated 5 December 2018 were issued for Algebris IG Financial Credit Fund with an
effective date 19 March 2020 to reflect the revised management fee in respect of Class I and Class R shares which
would be 0.5% and 1% per annum respectively.
The Algebris Quant Arbitrage Fund portfolio of investments was liquidated into cash on 19 March 2020 and final
redemptions were made as at 5 May 2020.
The Algebris Macro Credit Fund was renamed the Algebris Global Credit Opportunities Fund and the Supplement to
the Prospectus dated 5 December 2018 was revised and issued with effective date 25 June 2020.
There were no other significant events during the period.
14. Significant events subsequent to the period end
The COVID-19 outbreak has caused extensive disruption to businesses and economic activities globally. The
uncertainty and instability described in Note 13 continues post financial period-end.
Supplements to the Prospectus dated 5 December 2018 were issued for Algebris IG Financial Credit Fund with an
effective date 01 July 2020.
There were no other significant events subsequent to the period end.
15. Approval of financial statements
The financial statements were approved and authorised for issue by the Board of Directors on 26 August 2020.

ALGEBRIS UCITS FUNDS PLC
Algebris Financial Credit Fund
Unaudited Schedule of Investments
as at 30 June 2020
85
Holdings Financial Assets at Fair Value Through Profit or Loss Fair Value % of Net
EUR Asset Value
Equity Securities
United States 14,361,312 0.26
24,186 First Tennessee Bank (144A) (Preferred) Perpetual 14,361,312 0.26
Total Equity Securities 14,361,312 0.26
Fixed Income Securities
Austria 30,277,188 0.56
32,800,000 Bawag Group 30,277,188 0.56
Denmark 52,479,908 0.97
10,000,000 Danske Bank 2.25% 14/01/2028 11,116,520 0.21
45,165,000 Danske Bank Perpetual 41,363,388 0.76
Finland 28,231,550 0.52
29,500,000 Nordea Bank Abp Perpetual 28,231,550 0.52
France 524,335,184 9.68
60,000,000 BNP Paribas Perpetual (AX7277939) 54,615,864 1.01
15,900,000 BNP Paribas Perpetual (EG5801956) 15,329,777 0.28
11,500,000 BNP Paribas VAR Perpetual 11,261,462 0.21
171,300,000 Credit Agricole 7.875% Perpetual 165,840,604 3.06
57,630,000 Credit Agricole VAR Perpetual 58,743,301 1.09
79,544,000 Societe Generale VAR Perpetual (EJ9873484) 74,441,939 1.37
38,500,000 Societe Generale Perpetual 34,616,754 0.64
46,400,000 Societe Generale Perpetual (LUX) 41,255,230 0.76
68,355,000 Societe Generale VAR Perpetual 68,230,253 1.26
Germany 210,725,706 3.89
14,200,000 Aareal Bank 7.625% Perpetual 13,347,716 0.25
14,000,000 Commerzbank Ag 12/05/2030 14,103,110 0.26
25,800,000 Deutsche Bank 2.625% 16/12/2024 28,687,885 0.53
18,080,000 Deutsche Bank 24/05/2028 14,709,777 0.27
31,900,000 Deutsche Bank 19/05/2031 33,488,620 0.62
33,400,000 Deutsche Bank 08/07/2031 29,715,980 0.55
86,400,000 Deutsche Bank 01/12/2032 71,795,916 1.32
6,600,000 Deutsche Bank Ag Perpetual 4,876,702 0.09

ALGEBRIS UCITS FUNDS PLC
Algebris Financial Credit Fund
Unaudited Schedule of Investments (continued)
as at 30 June 2020
86
Holdings Financial Assets at Fair Value Through Profit or Loss Fair Value % of Net
EUR Asset Value
Fixed Income Securities (continued)
Ireland 13,656,982 0.25
13,700,000 Aib Group Perpetual 13,656,982 0.25
Italy 909,322,576 16.79
21,000,000 Banca Monte Dei Paschi 2.625% 28/04/2025 20,649,195 0.38
14,400,000 Banco Bpm SPA 1.625% 18/02/2025 13,347,216 0.25
16,040,000 Banco Bpm SPA 01/10/2029 15,641,647 0.29
9,605,000 Credito Valtellinese 4.7% 04/08/2021 9,536,997 0.18
5,125,000 Credito Valtellinese VAR 12/04/2027 5,190,036 0.10
76,777,000 Intesa Sanpaolo (144A) 5.71% 15/01/2026 72,437,832 1.34
175,032,000 Intesa Sanpaolo (144A) Perpetual 156,384,306 2.89
93,200,000 Intesa Sanpaolo Perpetual (AM0179896 Corporation) 102,163,044 1.89
71,000,000 Intesa Sanpaolo Perpetual (BG1868226) 57,387,880 1.06
32,533,000 Intesa Sanpaolo SPA 5.148% 10/06/2030 37,443,616 0.69
122,525,000 Unicredit 19/06/2032 115,143,286 2.12
63,120,000 Unicredit Perpetual 56,542,776 1.04
60,550,000 Unicredit Perpetual (AQ4052637 Corporation) 53,736,308 0.99
36,800,000 Unicredit Perpetual (AX6444902) 38,632,088 0.71
32,900,000 Unicredit Spa 30/06/2035 29,341,130 0.54
5,300,000 Unicredit Spa Perpetual 3,946,857 0.07
97,960,000 Unicredit SPA VAR Perpetual 96,323,578 1.78
21,500,000 Unione Di Banche Italian 04/03/2029 23,337,605 0.43
2,101,000 Unipolsai Perpetual 2,137,179 0.04
Jersey 4,844,526 0.09
2,887,000 HBOS Sterling Finance Jersey Perpetual 4,844,526 0.09
Luxembourg 68,747,655 1.27
124,500,000 Mitsubishi Ufj Investor (Series PRX) 15/12/2050 68,747,655 1.27
Mexico 22,319,564 0.41
26,700,000 Bbva Bancomer Texas VAR 18/01/2033 22,319,564 0.41
Netherlands 128,694,367 2.38
68,600,000 ABN Amro Bank VAR Perpetual 65,988,055 1.22
27,300,000 ING Group (Series) Perpetual 25,214,769 0.46
10,450,000 ING Group 6.5% Perpetual 9,558,778 0.18
30,500,000 ING Group Perpetual 27,932,765 0.52

ALGEBRIS UCITS FUNDS PLC
Algebris Financial Credit Fund
Unaudited Schedule of Investments (continued)
as at 30 June 2020
87
Holdings Financial Assets at Fair Value Through Profit or Loss Fair Value % of Net
EUR Asset Value
Fixed Income Securities (continued)
Spain 911,368,107 16.83
60,800,000 Banco Bilbao Vizcaya ARG Perpetual (AX7516377) 60,092,288 1.11
75,600,000 Banco Bilbao Vizcaya ARG VAR Perpetual 78,338,232 1.45
8,000,000 Banco Bilbao Vizcaya Perpetual 7,803,440 0.14
52,800,000 Banco Bilbao Vizcaya REG Perpetual 43,097,360 0.80
2,400,000 Banco De Sabadell 1.125% 27/03/2025 2,187,732 0.04
50,800,000 Banco De Sabadell VAR Perpetual 41,233,090 0.76
45,400,000 Banco Popular Espanol Perpetual - -
24,200,000 Banco Popular Espanol VAR Perpetual - -
13,800,000 Banco Santander 3.49% 28/05/2030 13,170,505 0.24
73,800,000 Banco Santander 11/09/2049 70,838,037 1.31
10,858,000 Banco Santander Perpetual 9,065,724 0.17
105,800,000 Banco Santander Perpetual (AR5470927 Corporation) 95,927,273 1.77
9,000,000 Banco Santander Perpetual (AX1003505) 8,383,068 0.16
54,400,000 Banco Santander Perpetual (ZP3895189) 49,368,000 0.91
97,500,000 Banco Santander VAR Perpetual 100,392,337 1.85
70,800,000 Banco Santander VAR Perpetual (DSE) 67,148,136 1.24
11,200,000 Caixabank 15/02/2027 11,446,792 0.21
123,200,000 Caixabank (Series) VAR Perpetual 123,894,848 2.29
121,000,000 Caixabank Perpetual 108,010,045 1.99
24,000,000 Ibercaja Banco Perpetual 20,971,200 0.39
Switzerland 448,492,748 8.28
1,600,000 Credit Suisse Group 02/04/2026 1,774,048 0.03
49,200,000 Credit Suisse Group 01/04/2031 49,923,349 0.92
88,500,000 Credit Suisse Group 7.5% Perpetual 85,187,060 1.57
61,000,000 Credit Suisse Group Perpetual 56,815,855 1.05
20,400,000 Credit Suisse Group Perpetual (ZR1187288) 18,569,394 0.34
27,600,000 Credit Suisse Group VAR Perpetual 25,430,428 0.47
50,600,000
Credit Suisse Group VAR Perpetual (AU3887497
Corporation) 46,793,626 0.87
20,800,000 UBS Group Perpetual 20,507,434 0.38
87,750,000 UBS Group Perpetual (JK4458820) 79,387,463 1.47
8,300,000 UBS Group Perpetual (QZ1261762) 7,564,431 0.14
60,200,000 UBS Group Perpetual (UV4180070) 56,539,660 1.04
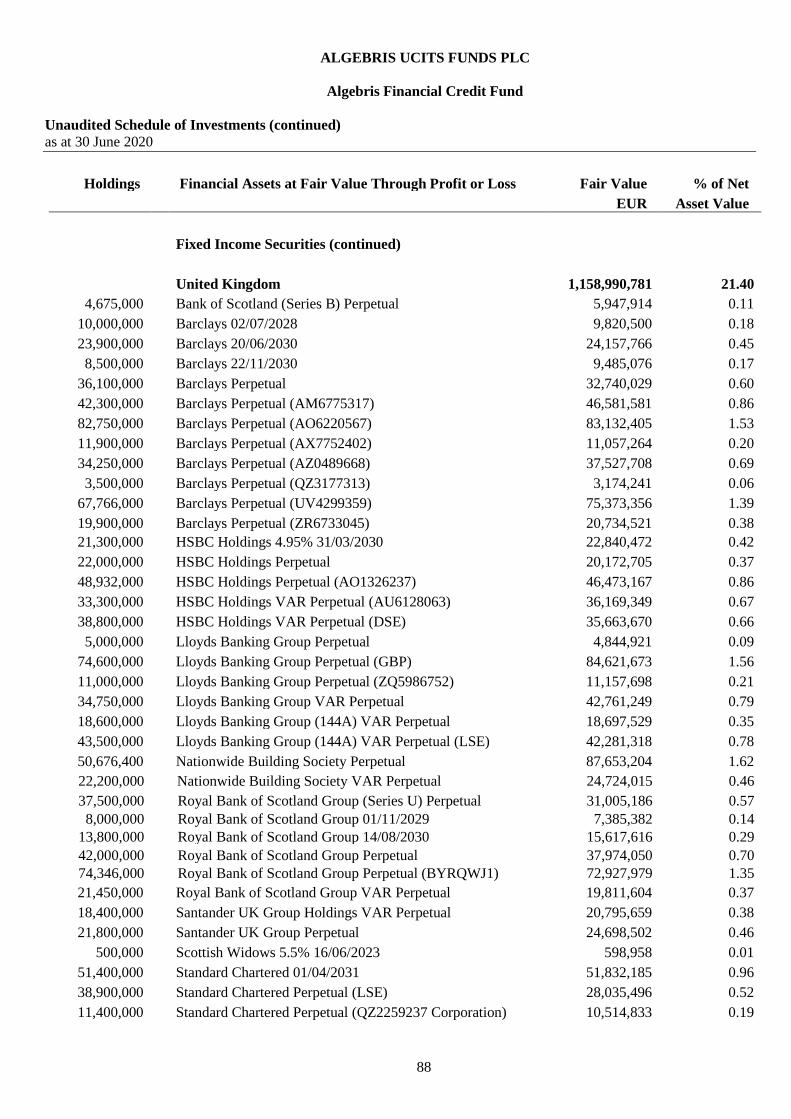
ALGEBRIS UCITS FUNDS PLC
Algebris Financial Credit Fund
Unaudited Schedule of Investments (continued)
as at 30 June 2020
88
Holdings Financial Assets at Fair Value Through Profit or Loss Fair Value % of Net
EUR Asset Value
Fixed Income Securities (continued)
United Kingdom 1,158,990,781 21.40
4,675,000 Bank of Scotland (Series B) Perpetual 5,947,914 0.11
10,000,000 Barclays 02/07/2028 9,820,500 0.18
23,900,000 Barclays 20/06/2030 24,157,766 0.45
8,500,000 Barclays 22/11/2030 9,485,076 0.17
36,100,000 Barclays Perpetual 32,740,029 0.60
42,300,000 Barclays Perpetual (AM6775317) 46,581,581 0.86
82,750,000 Barclays Perpetual (AO6220567) 83,132,405 1.53
11,900,000 Barclays Perpetual (AX7752402) 11,057,264 0.20
34,250,000 Barclays Perpetual (AZ0489668) 37,527,708 0.69
3,500,000 Barclays Perpetual (QZ3177313) 3,174,241 0.06
67,766,000 Barclays Perpetual (UV4299359) 75,373,356 1.39
19,900,000 Barclays Perpetual (ZR6733045) 20,734,521 0.38
21,300,000 HSBC Holdings 4.95% 31/03/2030 22,840,472 0.42
22,000,000 HSBC Holdings Perpetual 20,172,705 0.37
48,932,000 HSBC Holdings Perpetual (AO1326237) 46,473,167 0.86
33,300,000 HSBC Holdings VAR Perpetual (AU6128063) 36,169,349 0.67
38,800,000 HSBC Holdings VAR Perpetual (DSE) 35,663,670 0.66
5,000,000 Lloyds Banking Group Perpetual 4,844,921 0.09
74,600,000 Lloyds Banking Group Perpetual (GBP) 84,621,673 1.56
11,000,000 Lloyds Banking Group Perpetual (ZQ5986752) 11,157,698 0.21
34,750,000 Lloyds Banking Group VAR Perpetual 42,761,249 0.79
18,600,000 Lloyds Banking Group (144A) VAR Perpetual 18,697,529 0.35
43,500,000 Lloyds Banking Group (144A) VAR Perpetual (LSE) 42,281,318 0.78
50,676,400 Nationwide Building Society Perpetual 87,653,204 1.62
22,200,000 Nationwide Building Society VAR Perpetual 24,724,015 0.46
37,500,000 Royal Bank of Scotland Group (Series U) Perpetual 31,005,186 0.57
8,000,000 Royal Bank of Scotland Group 01/11/2029 7,385,382 0.14
13,800,000 Royal Bank of Scotland Group 14/08/2030 15,617,616 0.29
42,000,000 Royal Bank of Scotland Group Perpetual 37,974,050 0.70
74,346,000 Royal Bank of Scotland Group Perpetual (BYRQWJ1) 72,927,979 1.35
21,450,000 Royal Bank of Scotland Group VAR Perpetual 19,811,604 0.37
18,400,000 Santander UK Group Holdings VAR Perpetual 20,795,659 0.38
21,800,000 Santander UK Group Perpetual 24,698,502 0.46
500,000 Scottish Widows 5.5% 16/06/2023 598,958 0.01
51,400,000 Standard Chartered 01/04/2031 51,832,185 0.96
38,900,000 Standard Chartered Perpetual (LSE) 28,035,496 0.52
11,400,000 Standard Chartered Perpetual (QZ2259237 Corporation) 10,514,833 0.19

ALGEBRIS UCITS FUNDS PLC
Algebris Financial Credit Fund
Unaudited Schedule of Investments (continued)
as at 30 June 2020
89
Holdings Financial Assets at Fair Value Through Profit or Loss Fair Value % of Net
EUR Asset Value
Fixed Income Securities (continued)
United States 286,708,682 5.30
21,200,000 American International Group (Series A-9) 01/04/2048 19,435,567 0.36
12,400,000 Bank of America 31/03/2029 14,853,216 0.27
9,200,000 Citigroup (Series R) Perpetual 8,021,764 0.15
12,000,000 Citigroup 1.75% 23/10/2026 13,495,220 0.25
24,400,000 Citigroup 08/04/2026 23,391,570 0.43
39,400,000 Citigroup 31/03/2031 41,815,806 0.77
23,800,000 Discover Financial Services (Series C) Perpetual 18,764,668 0.35
25,902,000 Dresdner Funding Trust I 8.151% 30/06/2031 31,952,641 0.59
8,000,000 Goldman Sachs Group (Series R) Perpetual 6,886,068 0.13
22,500,000 Goldman Sachs Group 3.375% 27/03/2025 25,119,000 0.46
30,300,000 Goldman Sachs Group 3.5% 01/04/2025 29,577,094 0.55
19,700,000 Huntington Bancshares (Series F) Perpetual 18,326,805 0.34
325,000 HVB Funding Trust I (144A) 8.741% 30/06/2031 391,212 0.01
3,380,000 HVB Funding Trust III (144A) 9% 22/10/2031 4,047,093 0.07
15,900,000 Morgan Stanley 01/04/2031 16,199,372 0.30
17,200,000 Voya Financial 23/01/2048 14,431,586 0.27
Total Fixed Income Securities 4,799,195,524 88.62
Options
414 S&P 500 Index 2850 Put 17/07/2020 534,408 0.01
2,309 S&P 500 Index 2930 Put 17/07/2020 5,543,820 0.10
Total Options 6,078,228 0.11
Forward Contracts*
Buy EUR 715,417,594 Sell GBP 638,111,000 17/07/2020 11,125,671 0.21
Buy USD 221,560,155 Sell EUR 194,800,729 17/07/2020 2,371,414 0.04
Buy USD 193,722,489 Sell EUR 170,325,220 17/07/2020 2,073,460 0.04
Buy USD 102,820,300 Sell EUR 90,401,947 17/07/2020 1,100,511 0.02
Buy USD 91,203,464 Sell EUR 80,188,161 17/07/2020 976,173 0.02
Buy USD 90,873,944 Sell EUR 79,898,439 17/07/2020 972,647 0.02
Buy USD 80,709,300 Sell EUR 70,961,453 17/07/2020 863,852 0.02
Buy USD 78,116,952 Sell EUR 68,682,202 17/07/2020 836,105 0.02
Buy USD 76,421,077 Sell EUR 67,191,150 17/07/2020 817,954 0.02
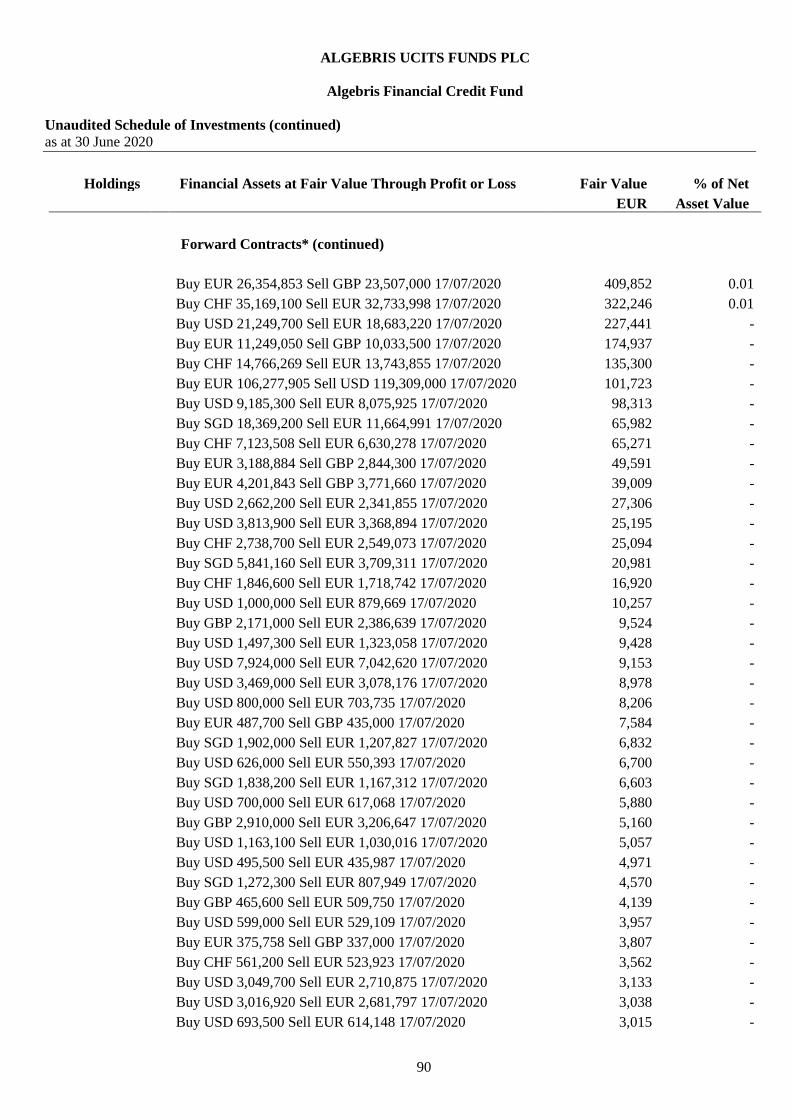
ALGEBRIS UCITS FUNDS PLC
Algebris Financial Credit Fund
Unaudited Schedule of Investments (continued)
as at 30 June 2020
90
Holdings Financial Assets at Fair Value Through Profit or Loss Fair Value % of Net
EUR Asset Value
Forward Contracts* (continued)
Buy EUR 26,354,853 Sell GBP 23,507,000 17/07/2020 409,852 0.01
Buy CHF 35,169,100 Sell EUR 32,733,998 17/07/2020 322,246 0.01
Buy USD 21,249,700 Sell EUR 18,683,220 17/07/2020 227,441 -
Buy EUR 11,249,050 Sell GBP 10,033,500 17/07/2020 174,937 -
Buy CHF 14,766,269 Sell EUR 13,743,855 17/07/2020 135,300 -
Buy EUR 106,277,905 Sell USD 119,309,000 17/07/2020 101,723 -
Buy USD 9,185,300 Sell EUR 8,075,925 17/07/2020 98,313 -
Buy SGD 18,369,200 Sell EUR 11,664,991 17/07/2020 65,982 -
Buy CHF 7,123,508 Sell EUR 6,630,278 17/07/2020 65,271 -
Buy EUR 3,188,884 Sell GBP 2,844,300 17/07/2020 49,591 -
Buy EUR 4,201,843 Sell GBP 3,771,660 17/07/2020 39,009 -
Buy USD 2,662,200 Sell EUR 2,341,855 17/07/2020 27,306 -
Buy USD 3,813,900 Sell EUR 3,368,894 17/07/2020 25,195 -
Buy CHF 2,738,700 Sell EUR 2,549,073 17/07/2020 25,094 -
Buy SGD 5,841,160 Sell EUR 3,709,311 17/07/2020 20,981 -
Buy CHF 1,846,600 Sell EUR 1,718,742 17/07/2020 16,920 -
Buy USD 1,000,000 Sell EUR 879,669 17/07/2020 10,257 -
Buy GBP 2,171,000 Sell EUR 2,386,639 17/07/2020 9,524 -
Buy USD 1,497,300 Sell EUR 1,323,058 17/07/2020 9,428 -
Buy USD 7,924,000 Sell EUR 7,042,620 17/07/2020 9,153 -
Buy USD 3,469,000 Sell EUR 3,078,176 17/07/2020 8,978 -
Buy USD 800,000 Sell EUR 703,735 17/07/2020 8,206 -
Buy EUR 487,700 Sell GBP 435,000 17/07/2020 7,584 -
Buy SGD 1,902,000 Sell EUR 1,207,827 17/07/2020 6,832 -
Buy USD 626,000 Sell EUR 550,393 17/07/2020 6,700 -
Buy SGD 1,838,200 Sell EUR 1,167,312 17/07/2020 6,603 -
Buy USD 700,000 Sell EUR 617,068 17/07/2020 5,880 -
Buy GBP 2,910,000 Sell EUR 3,206,647 17/07/2020 5,160 -
Buy USD 1,163,100 Sell EUR 1,030,016 17/07/2020 5,057 -
Buy USD 495,500 Sell EUR 435,987 17/07/2020 4,971 -
Buy SGD 1,272,300 Sell EUR 807,949 17/07/2020 4,570 -
Buy GBP 465,600 Sell EUR 509,750 17/07/2020 4,139 -
Buy USD 599,000 Sell EUR 529,109 17/07/2020 3,957 -
Buy EUR 375,758 Sell GBP 337,000 17/07/2020 3,807 -
Buy CHF 561,200 Sell EUR 523,923 17/07/2020 3,562 -
Buy USD 3,049,700 Sell EUR 2,710,875 17/07/2020 3,133 -
Buy USD 3,016,920 Sell EUR 2,681,797 17/07/2020 3,038 -
Buy USD 693,500 Sell EUR 614,148 17/07/2020 3,015 -
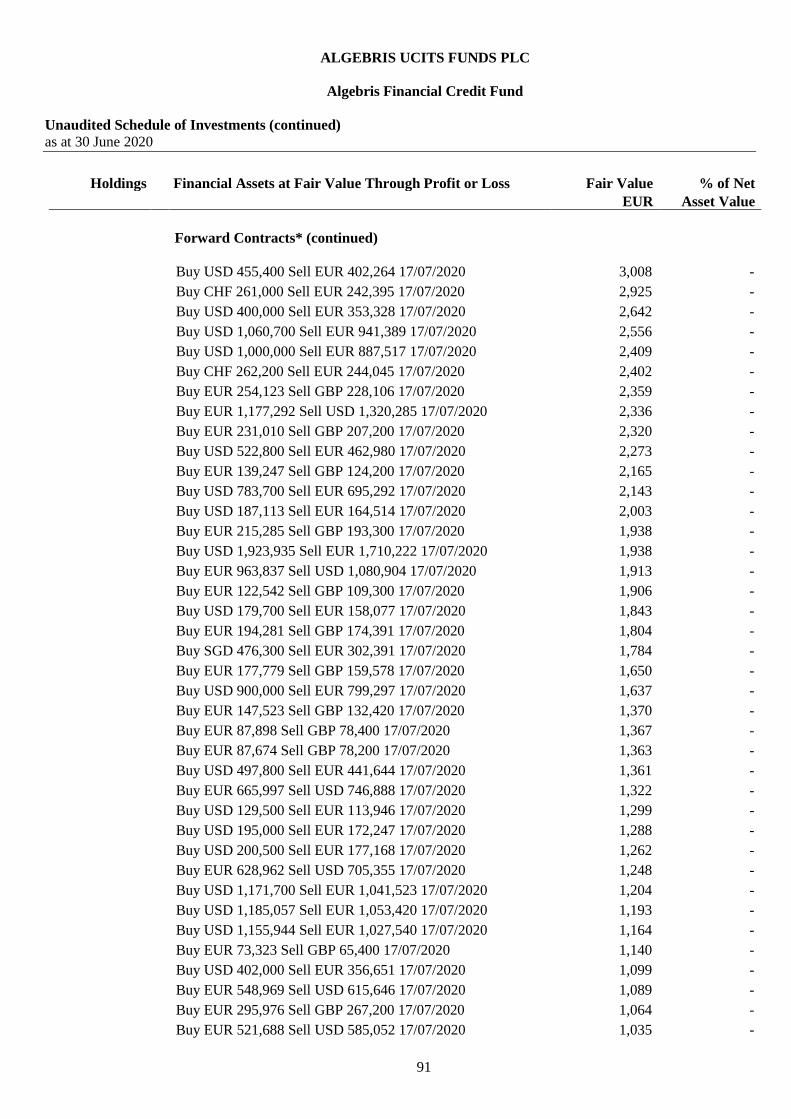
ALGEBRIS UCITS FUNDS PLC
Algebris Financial Credit Fund
Unaudited Schedule of Investments (continued)
as at 30 June 2020
91
Holdings Financial Assets at Fair Value Through Profit or Loss Fair Value % of Net
EUR Asset Value
Forward Contracts* (continued)
Buy USD 455,400 Sell EUR 402,264 17/07/2020 3,008 -
Buy CHF 261,000 Sell EUR 242,395 17/07/2020 2,925 -
Buy USD 400,000 Sell EUR 353,328 17/07/2020 2,642 -
Buy USD 1,060,700 Sell EUR 941,389 17/07/2020 2,556 -
Buy USD 1,000,000 Sell EUR 887,517 17/07/2020 2,409 -
Buy CHF 262,200 Sell EUR 244,045 17/07/2020 2,402 -
Buy EUR 254,123 Sell GBP 228,106 17/07/2020 2,359 -
Buy EUR 1,177,292 Sell USD 1,320,285 17/07/2020 2,336 -
Buy EUR 231,010 Sell GBP 207,200 17/07/2020 2,320 -
Buy USD 522,800 Sell EUR 462,980 17/07/2020 2,273 -
Buy EUR 139,247 Sell GBP 124,200 17/07/2020 2,165 -
Buy USD 783,700 Sell EUR 695,292 17/07/2020 2,143 -
Buy USD 187,113 Sell EUR 164,514 17/07/2020 2,003 -
Buy EUR 215,285 Sell GBP 193,300 17/07/2020 1,938 -
Buy USD 1,923,935 Sell EUR 1,710,222 17/07/2020 1,938 -
Buy EUR 963,837 Sell USD 1,080,904 17/07/2020 1,913 -
Buy EUR 122,542 Sell GBP 109,300 17/07/2020 1,906 -
Buy USD 179,700 Sell EUR 158,077 17/07/2020 1,843 -
Buy EUR 194,281 Sell GBP 174,391 17/07/2020 1,804 -
Buy SGD 476,300 Sell EUR 302,391 17/07/2020 1,784 -
Buy EUR 177,779 Sell GBP 159,578 17/07/2020 1,650 -
Buy USD 900,000 Sell EUR 799,297 17/07/2020 1,637 -
Buy EUR 147,523 Sell GBP 132,420 17/07/2020 1,370 -
Buy EUR 87,898 Sell GBP 78,400 17/07/2020 1,367 -
Buy EUR 87,674 Sell GBP 78,200 17/07/2020 1,363 -
Buy USD 497,800 Sell EUR 441,644 17/07/2020 1,361 -
Buy EUR 665,997 Sell USD 746,888 17/07/2020 1,322 -
Buy USD 129,500 Sell EUR 113,946 17/07/2020 1,299 -
Buy USD 195,000 Sell EUR 172,247 17/07/2020 1,288 -
Buy USD 200,500 Sell EUR 177,168 17/07/2020 1,262 -
Buy EUR 628,962 Sell USD 705,355 17/07/2020 1,248 -
Buy USD 1,171,700 Sell EUR 1,041,523 17/07/2020 1,204 -
Buy USD 1,185,057 Sell EUR 1,053,420 17/07/2020 1,193 -
Buy USD 1,155,944 Sell EUR 1,027,540 17/07/2020 1,164 -
Buy EUR 73,323 Sell GBP 65,400 17/07/2020 1,140 -
Buy USD 402,000 Sell EUR 356,651 17/07/2020 1,099 -
Buy EUR 548,969 Sell USD 615,646 17/07/2020 1,089 -
Buy EUR 295,976 Sell GBP 267,200 17/07/2020 1,064 -
Buy EUR 521,688 Sell USD 585,052 17/07/2020 1,035 -

ALGEBRIS UCITS FUNDS PLC
Algebris Financial Credit Fund
Unaudited Schedule of Investments (continued)
as at 30 June 2020
92
Holdings Financial Assets at Fair Value Through Profit or Loss Fair Value % of Net
EUR Asset Value
Forward Contracts* (continued)
Buy EUR 92,717 Sell GBP 83,100 17/07/2020 999 -
Buy EUR 106,225 Sell GBP 95,350 17/07/2020 986 -
Buy USD 971,954 Sell EUR 863,988 17/07/2020 979 -
Buy USD 971,316 Sell EUR 863,421 17/07/2020 978 -
Buy USD 951,607 Sell EUR 845,901 17/07/2020 958 -
Buy EUR 289,084 Sell USD 323,800 17/07/2020 926 -
Buy EUR 402,990 Sell USD 451,800 17/07/2020 921 -
Buy CHF 389,311 Sell EUR 365,069 17/07/2020 854 -
Buy EUR 428,912 Sell USD 481,007 17/07/2020 851 -
Buy EUR 399,435 Sell USD 447,950 17/07/2020 793 -
Buy EUR 468,765 Sell GBP 424,000 17/07/2020 790 -
Buy USD 316,300 Sell EUR 280,721 17/07/2020 762 -
Buy USD 737,331 Sell EUR 655,427 17/07/2020 743 -
Buy USD 88,500 Sell EUR 78,015 17/07/2020 743 -
Buy USD 700,000 Sell EUR 622,229 17/07/2020 719 -
Buy GBP 150,300 Sell EUR 165,176 17/07/2020 712 -
Buy EUR 349,185 Sell USD 391,600 17/07/2020 690 -
Buy USD 250,000 Sell EUR 221,798 17/07/2020 684 -
Buy EUR 42,604 Sell GBP 38,000 17/07/2020 663 -
Buy EUR 70,740 Sell GBP 63,498 17/07/2020 657 -
Buy CHF 101,800 Sell EUR 95,038 17/07/2020 646 -
Buy EUR 63,543 Sell GBP 57,000 17/07/2020 631 -
Buy CHF 91,100 Sell EUR 85,049 17/07/2020 578 -
Buy USD 300,000 Sell EUR 266,432 17/07/2020 546 -
Buy EUR 584,565 Sell USD 656,300 17/07/2020 507 -
Buy USD 48,500 Sell EUR 42,664 17/07/2020 497 -
Buy CHF 136,727 Sell EUR 128,019 17/07/2020 493 -
Buy USD 459,800 Sell EUR 408,716 17/07/2020 472 -
Buy USD 253,400 Sell EUR 225,046 17/07/2020 461 -
Buy EUR 48,204 Sell GBP 43,269 17/07/2020 448 -
Buy EUR 53,420 Sell GBP 48,000 17/07/2020 442 -
Buy EUR 304,830 Sell GBP 275,800 17/07/2020 426 -
Buy EUR 25,450 Sell GBP 22,700 17/07/2020 396 -
Buy EUR 163,230 Sell USD 183,000 17/07/2020 373 -
Buy USD 44,200 Sell EUR 38,963 17/07/2020 371 -
Buy EUR 327,486 Sell GBP 296,400 17/07/2020 346 -
Buy CHF 155,955 Sell EUR 146,244 17/07/2020 342 -
Buy CHF 51,900 Sell EUR 48,466 17/07/2020 316 -
Buy CHF 29,700 Sell EUR 27,608 17/07/2020 308 -
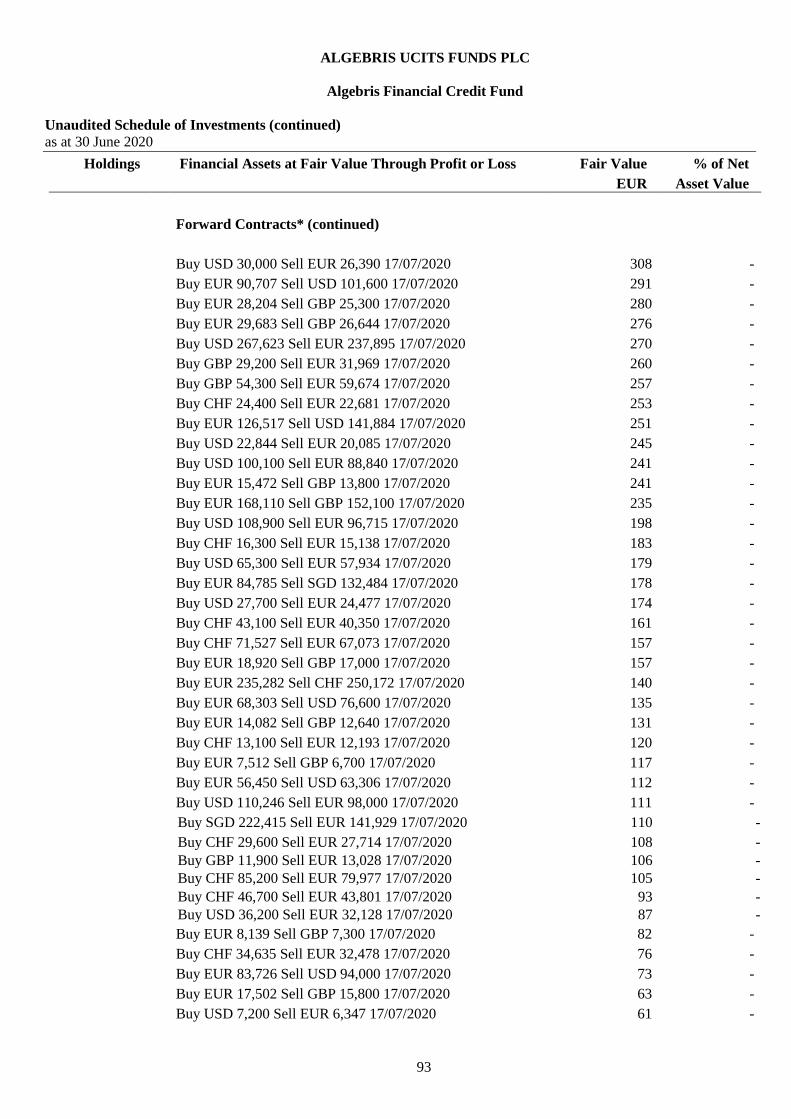
ALGEBRIS UCITS FUNDS PLC
Algebris Financial Credit Fund
Unaudited Schedule of Investments (continued)
as at 30 June 2020
93
Holdings Financial Assets at Fair Value Through Profit or Loss Fair Value % of Net
EUR Asset Value
Forward Contracts* (continued)
Buy USD 30,000 Sell EUR 26,390 17/07/2020 308 -
Buy EUR 90,707 Sell USD 101,600 17/07/2020 291 -
Buy EUR 28,204 Sell GBP 25,300 17/07/2020 280 -
Buy EUR 29,683 Sell GBP 26,644 17/07/2020 276 -
Buy USD 267,623 Sell EUR 237,895 17/07/2020 270 -
Buy GBP 29,200 Sell EUR 31,969 17/07/2020 260 -
Buy GBP 54,300 Sell EUR 59,674 17/07/2020 257 -
Buy CHF 24,400 Sell EUR 22,681 17/07/2020 253 -
Buy EUR 126,517 Sell USD 141,884 17/07/2020 251 -
Buy USD 22,844 Sell EUR 20,085 17/07/2020 245 -
Buy USD 100,100 Sell EUR 88,840 17/07/2020 241 -
Buy EUR 15,472 Sell GBP 13,800 17/07/2020 241 -
Buy EUR 168,110 Sell GBP 152,100 17/07/2020 235 -
Buy USD 108,900 Sell EUR 96,715 17/07/2020 198 -
Buy CHF 16,300 Sell EUR 15,138 17/07/2020 183 -
Buy USD 65,300 Sell EUR 57,934 17/07/2020 179 -
Buy EUR 84,785 Sell SGD 132,484 17/07/2020 178 -
Buy USD 27,700 Sell EUR 24,477 17/07/2020 174 -
Buy CHF 43,100 Sell EUR 40,350 17/07/2020 161 -
Buy CHF 71,527 Sell EUR 67,073 17/07/2020 157 -
Buy EUR 18,920 Sell GBP 17,000 17/07/2020 157 -
Buy EUR 235,282 Sell CHF 250,172 17/07/2020 140 -
Buy EUR 68,303 Sell USD 76,600 17/07/2020 135 -
Buy EUR 14,082 Sell GBP 12,640 17/07/2020 131 -
Buy CHF 13,100 Sell EUR 12,193 17/07/2020 120 -
Buy EUR 7,512 Sell GBP 6,700 17/07/2020 117 -
Buy EUR 56,450 Sell USD 63,306 17/07/2020 112 -
Buy USD 110,246 Sell EUR 98,000 17/07/2020 111 -
Buy SGD 222,415 Sell EUR 141,929 17/07/2020 110 -
Buy CHF 29,600 Sell EUR 27,714 17/07/2020 108 -
Buy GBP 11,900 Sell EUR 13,028 17/07/2020 106 -
Buy CHF 85,200 Sell EUR 79,977 17/07/2020 105 -
Buy CHF 46,700 Sell EUR 43,801 17/07/2020 93 -
Buy USD 36,200 Sell EUR 32,128 17/07/2020 87 -
Buy EUR 8,139 Sell GBP 7,300 17/07/2020 82 -
Buy CHF 34,635 Sell EUR 32,478 17/07/2020 76 -
Buy EUR 83,726 Sell USD 94,000 17/07/2020 73 -
Buy EUR 17,502 Sell GBP 15,800 17/07/2020 63 -
Buy USD 7,200 Sell EUR 6,347 17/07/2020 61 -

ALGEBRIS UCITS FUNDS PLC
Algebris Financial Credit Fund
Unaudited Schedule of Investments (continued)
as at 30 June 2020
94
Holdings Financial Assets at Fair Value Through Profit or Loss Fair Value % of Net
EUR Asset Value
Forward Contracts* (continued)
Buy GBP 300,100 Sell EUR 331,165 17/07/2020 60 -
Buy EUR 23,603 Sell SGD 36,881 17/07/2020 50 -
Buy USD 97,400 Sell EUR 86,629 17/07/2020 50 -
Buy EUR 82,242 Sell CHF 87,447 17/07/2020 49 -
Buy CHF 21,146 Sell EUR 19,829 17/07/2020 46 -
Buy EUR 50,414 Sell USD 56,600 17/07/2020 44 -
Buy USD 22,700 Sell EUR 20,160 17/07/2020 41 -
Buy CHF 10,400 Sell EUR 9,737 17/07/2020 38 -
Buy CHF 10,500 Sell EUR 9,832 17/07/2020 37 -
Buy SGD 74,331 Sell EUR 47,433 17/07/2020 37 -
Buy JPY 669,400 Sell EUR 5,486 17/07/2020 34 -
Buy EUR 1,431,269 Sell USD 1,608,263 17/07/2020 34 -
Buy EUR 8,862 Sell GBP 8,000 17/07/2020 32 -
Buy EUR 2,789 Sell GBP 2,500 17/07/2020 30 -
Buy CHF 7,800 Sell EUR 7,304 17/07/2020 28 -
Buy EUR 46,892 Sell CHF 49,860 17/07/2020 28 -
Buy EUR 11,596 Sell USD 13,000 17/07/2020 27 -
Buy EUR 925,440 Sell USD 1,039,882 17/07/2020 22 -
Buy EUR 13,484 Sell GBP 12,200 17/07/2020 19 -
Buy EUR 7,540 Sell SGD 11,782 17/07/2020 16 -
Buy EUR 7,423 Sell SGD 11,599 17/07/2020 16 -
Buy HKD 10,200 Sell EUR 1,157 17/07/2020 15 -
Buy CHF 11,300 Sell EUR 10,607 17/07/2020 14 -
Buy HKD 10,100 Sell EUR 1,145 17/07/2020 14 -
Buy EUR 6,327 Sell SGD 9,886 17/07/2020 13 -
Buy EUR 525,608 Sell USD 590,606 17/07/2020 13 -
Buy CHF 5,200 Sell EUR 4,876 17/07/2020 12 -
Buy USD 4,900 Sell EUR 4,349 17/07/2020 12 -
Buy SGD 24,376 Sell EUR 15,555 17/07/2020 12 -
Buy SGD 23,404 Sell EUR 14,935 17/07/2020 12 -
Buy EUR 470,201 Sell USD 528,347 17/07/2020 11 -
Buy USD 1,048 Sell EUR 921 17/07/2020 11 -
Buy USD 1,070 Sell EUR 941 17/07/2020 11 -
Buy EUR 16,639 Sell CHF 17,692 17/07/2020 10 -
Buy EUR 436,994 Sell USD 491,034 17/07/2020 10 -
Buy CHF 6,900 Sell EUR 6,477 17/07/2020 9 -
Buy EUR 12,481 Sell GBP 11,300 17/07/2020 9 -
Buy EUR 978 Sell GBP 878 17/07/2020 9 -
Buy EUR 561 Sell GBP 500 17/07/2020 9 -
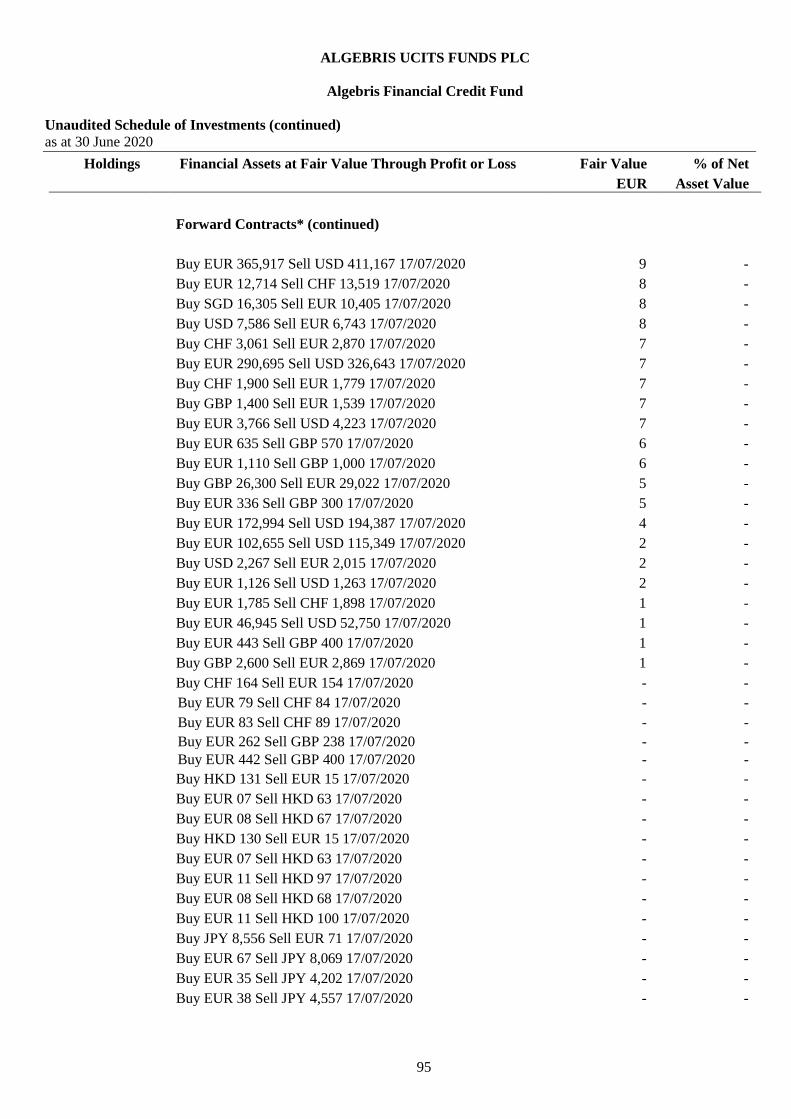
ALGEBRIS UCITS FUNDS PLC
Algebris Financial Credit Fund
Unaudited Schedule of Investments (continued)
as at 30 June 2020
95
Holdings Financial Assets at Fair Value Through Profit or Loss Fair Value % of Net
EUR Asset Value
Forward Contracts* (continued)
Buy EUR 365,917 Sell USD 411,167 17/07/2020 9 -
Buy EUR 12,714 Sell CHF 13,519 17/07/2020 8 -
Buy SGD 16,305 Sell EUR 10,405 17/07/2020 8 -
Buy USD 7,586 Sell EUR 6,743 17/07/2020 8 -
Buy CHF 3,061 Sell EUR 2,870 17/07/2020 7 -
Buy EUR 290,695 Sell USD 326,643 17/07/2020 7 -
Buy CHF 1,900 Sell EUR 1,779 17/07/2020 7 -
Buy GBP 1,400 Sell EUR 1,539 17/07/2020 7 -
Buy EUR 3,766 Sell USD 4,223 17/07/2020 7 -
Buy EUR 635 Sell GBP 570 17/07/2020 6 -
Buy EUR 1,110 Sell GBP 1,000 17/07/2020 6 -
Buy GBP 26,300 Sell EUR 29,022 17/07/2020 5 -
Buy EUR 336 Sell GBP 300 17/07/2020 5 -
Buy EUR 172,994 Sell USD 194,387 17/07/2020 4 -
Buy EUR 102,655 Sell USD 115,349 17/07/2020 2 -
Buy USD 2,267 Sell EUR 2,015 17/07/2020 2 -
Buy EUR 1,126 Sell USD 1,263 17/07/2020 2 -
Buy EUR 1,785 Sell CHF 1,898 17/07/2020 1 -
Buy EUR 46,945 Sell USD 52,750 17/07/2020 1 -
Buy EUR 443 Sell GBP 400 17/07/2020 1 -
Buy GBP 2,600 Sell EUR 2,869 17/07/2020 1 -
Buy CHF 164 Sell EUR 154 17/07/2020 - -
Buy EUR 79 Sell CHF 84 17/07/2020 - -
Buy EUR 83 Sell CHF 89 17/07/2020 - -
Buy EUR 262 Sell GBP 238 17/07/2020 - -
Buy EUR 442 Sell GBP 400 17/07/2020 - -
Buy HKD 131 Sell EUR 15 17/07/2020 - -
Buy EUR 07 Sell HKD 63 17/07/2020 - -
Buy EUR 08 Sell HKD 67 17/07/2020 - -
Buy HKD 130 Sell EUR 15 17/07/2020 - -
Buy EUR 07 Sell HKD 63 17/07/2020 - -
Buy EUR 11 Sell HKD 97 17/07/2020 - -
Buy EUR 08 Sell HKD 68 17/07/2020 - -
Buy EUR 11 Sell HKD 100 17/07/2020 - -
Buy JPY 8,556 Sell EUR 71 17/07/2020 - -
Buy EUR 67 Sell JPY 8,069 17/07/2020 - -
Buy EUR 35 Sell JPY 4,202 17/07/2020 - -
Buy EUR 38 Sell JPY 4,557 17/07/2020 - -
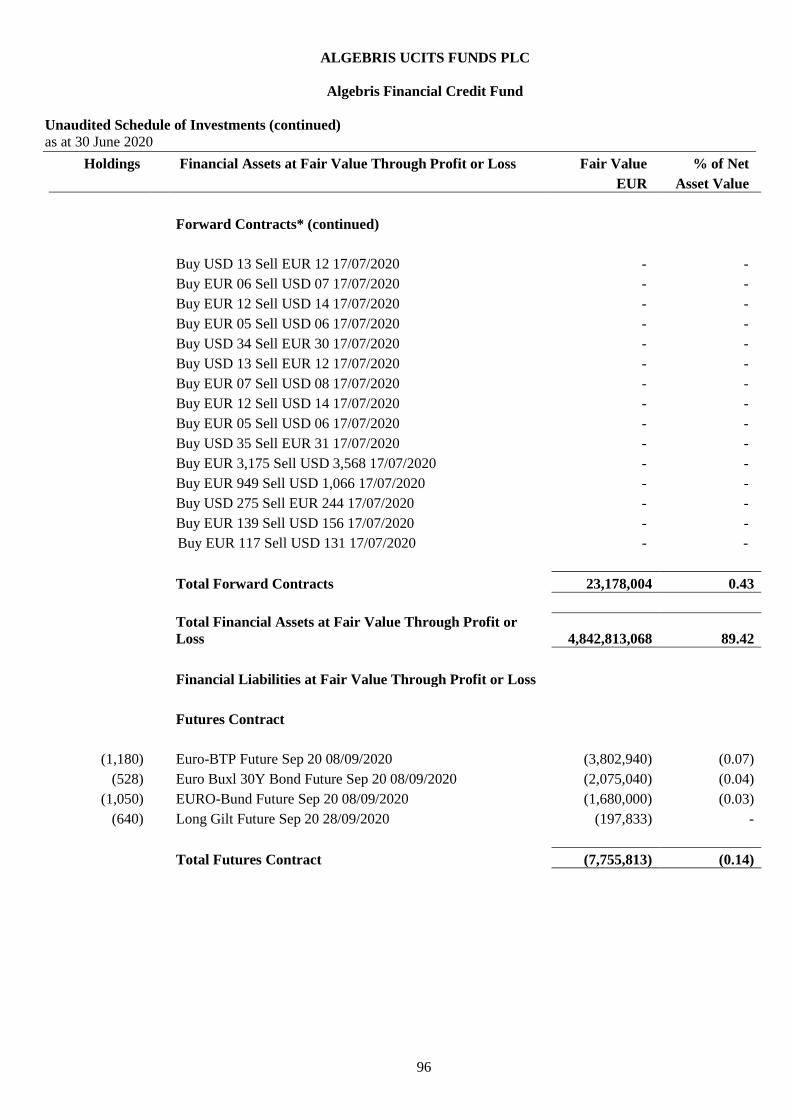
ALGEBRIS UCITS FUNDS PLC
Algebris Financial Credit Fund
Unaudited Schedule of Investments (continued)
as at 30 June 2020
96
Holdings Financial Assets at Fair Value Through Profit or Loss Fair Value % of Net
EUR Asset Value
Forward Contracts* (continued)
Buy USD 13 Sell EUR 12 17/07/2020 - -
Buy EUR 06 Sell USD 07 17/07/2020 - -
Buy EUR 12 Sell USD 14 17/07/2020 - -
Buy EUR 05 Sell USD 06 17/07/2020 - -
Buy USD 34 Sell EUR 30 17/07/2020 - -
Buy USD 13 Sell EUR 12 17/07/2020 - -
Buy EUR 07 Sell USD 08 17/07/2020 - -
Buy EUR 12 Sell USD 14 17/07/2020 - -
Buy EUR 05 Sell USD 06 17/07/2020 - -
Buy USD 35 Sell EUR 31 17/07/2020 - -
Buy EUR 3,175 Sell USD 3,568 17/07/2020 - -
Buy EUR 949 Sell USD 1,066 17/07/2020 - -
Buy USD 275 Sell EUR 244 17/07/2020 - -
Buy EUR 139 Sell USD 156 17/07/2020 - -
Buy EUR 117 Sell USD 131 17/07/2020 - -
Total Forward Contracts 23,178,004 0.43
Total Financial Assets at Fair Value Through Profit or
Loss 4,842,813,068 89.42
Financial Liabilities at Fair Value Through Profit or Loss
Futures Contract
(1,180) Euro-BTP Future Sep 20 08/09/2020 (3,802,940) (0.07)
(528) Euro Buxl 30Y Bond Future Sep 20 08/09/2020 (2,075,040) (0.04)
(1,050) EURO-Bund Future Sep 20 08/09/2020 (1,680,000) (0.03)
(640) Long Gilt Future Sep 20 28/09/2020 (197,833) -
Total Futures Contract (7,755,813) (0.14)

ALGEBRIS UCITS FUNDS PLC
Algebris Financial Credit Fund
Unaudited Schedule of Investments (continued)
as at 30 June 2020
97
Holdings Financial Liabilities at Fair Value Through Profit or Loss Fair Value % of Net
EUR Asset Value
Forward Contracts*
Buy EUR 2,301,642,511 Sell USD 2,617,815,000 17/07/2020 (28,019,127) (0.52)
Buy GBP 318,617,446 Sell EUR 357,217,673 17/07/2020 (5,555,198) (0.10)
Buy EUR 40,502,715 Sell USD 46,066,500 17/07/2020 (493,061) (0.01)
Buy GBP 16,993,920 Sell EUR 19,052,719 17/07/2020 (296,295) (0.01)
Buy GBP 14,472,731 Sell EUR 16,226,090 17/07/2020 (252,337) (0.01)
Buy GBP 12,085,800 Sell EUR 13,549,984 17/07/2020 (210,720) (0.01)
Buy GBP 10,019,782 Sell EUR 11,233,670 17/07/2020 (174,698) -
Buy GBP 7,919,200 Sell EUR 8,878,604 17/07/2020 (138,074) -
Buy GBP 4,818,700 Sell EUR 5,402,481 17/07/2020 (84,016) -
Buy GBP 3,905,000 Sell EUR 4,372,986 17/07/2020 (62,984) -
Buy GBP 3,282,400 Sell EUR 3,680,060 17/07/2020 (57,230) -
Buy GBP 3,776,268 Sell EUR 4,215,775 17/07/2020 (47,856) -
Buy GBP 2,022,300 Sell EUR 2,267,300 17/07/2020 (35,259) -
Buy EUR 1,894,549 Sell USD 2,154,800 17/07/2020 (23,063) -
Buy EUR 1,820,674 Sell USD 2,069,200 17/07/2020 (20,761) -
Buy GBP 964,000 Sell EUR 1,080,788 17/07/2020 (16,808) -
Buy EUR 1,271,092 Sell USD 1,445,700 17/07/2020 (15,474) -
Buy EUR 663,110 Sell USD 754,200 17/07/2020 (8,072) -
Buy EUR 664,671 Sell USD 755,400 17/07/2020 (7,579) -
Buy EUR 616,071 Sell USD 700,700 17/07/2020 (7,500) -
Buy EUR 769,396 Sell USD 872,800 17/07/2020 (7,331) -
Buy EUR 665,817 Sell USD 755,300 17/07/2020 (6,344) -
Buy EUR 516,719 Sell USD 587,700 17/07/2020 (6,290) -
Buy EUR 2,634,256 Sell USD 2,966,563 17/07/2020 (5,765) -
Buy EUR 473,286 Sell USD 538,300 17/07/2020 (5,762) -
Buy EUR 588,331 Sell USD 667,400 17/07/2020 (5,606) -
Buy EUR 479,508 Sell USD 545,100 17/07/2020 (5,591) -
Buy EUR 2,564,700 Sell GBP 2,328,322 17/07/2020 (5,101) -
Buy EUR 2,266,149 Sell USD 2,552,020 17/07/2020 (4,960) -
Buy EUR 401,277 Sell USD 456,400 17/07/2020 (4,885) -
Buy GBP 336,700 Sell EUR 375,391 17/07/2020 (3,771) -
Buy EUR 527,262 Sell USD 596,700 17/07/2020 (3,757) -
Buy EUR 360,721 Sell USD 409,200 17/07/2020 (3,437) -
Buy EUR 2,063,507 Sell GBP 1,872,569 17/07/2020 (3,273) -
Buy EUR 1,733,289 Sell SGD 2,719,200 17/07/2020 (3,251) -
Buy GBP 290,300 Sell EUR 323,622 17/07/2020 (3,214) -
Buy EUR 438,044 Sell CHF 469,314 17/07/2020 (3,075) -
Buy GBP 248,500 Sell EUR 277,056 17/07/2020 (2,783) -
Buy EUR 225,604 Sell USD 256,400 17/07/2020 (2,573)
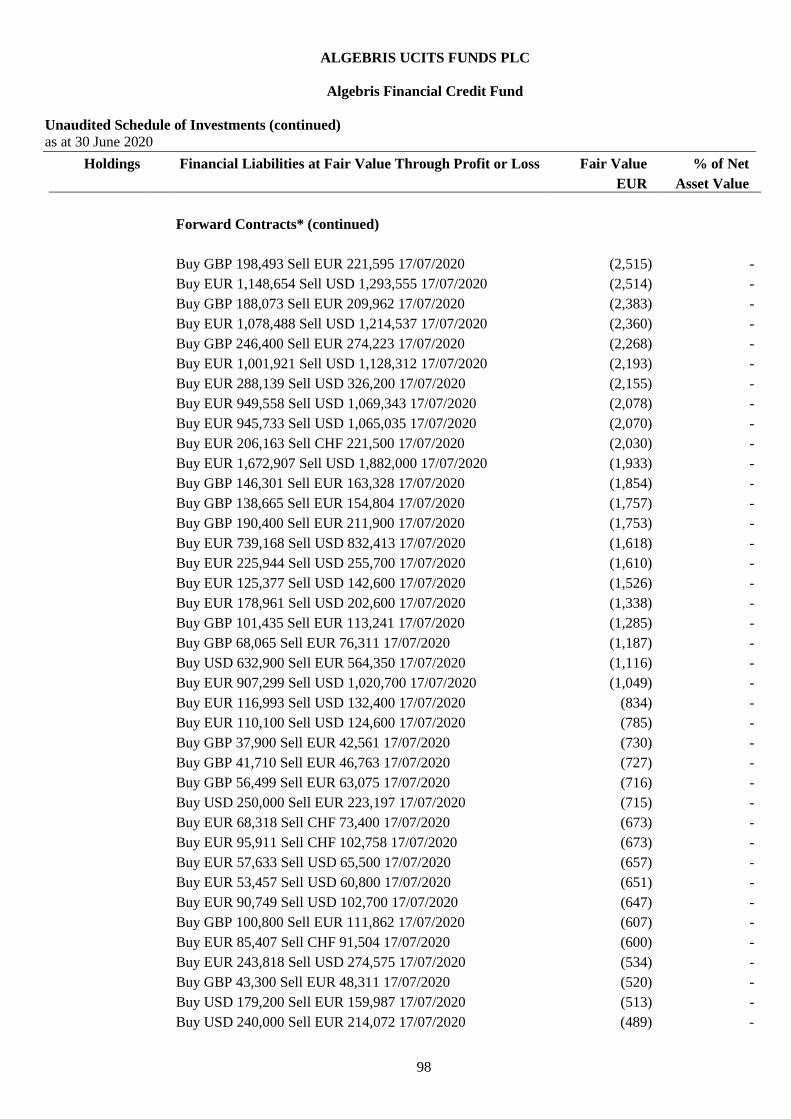
ALGEBRIS UCITS FUNDS PLC
Algebris Financial Credit Fund
Unaudited Schedule of Investments (continued)
as at 30 June 2020
98
Holdings Financial Liabilities at Fair Value Through Profit or Loss Fair Value % of Net
EUR Asset Value
Forward Contracts* (continued)
Buy GBP 198,493 Sell EUR 221,595 17/07/2020 (2,515) -
Buy EUR 1,148,654 Sell USD 1,293,555 17/07/2020 (2,514) -
Buy GBP 188,073 Sell EUR 209,962 17/07/2020 (2,383) -
Buy EUR 1,078,488 Sell USD 1,214,537 17/07/2020 (2,360) -
Buy GBP 246,400 Sell EUR 274,223 17/07/2020 (2,268) -
Buy EUR 1,001,921 Sell USD 1,128,312 17/07/2020 (2,193) -
Buy EUR 288,139 Sell USD 326,200 17/07/2020 (2,155) -
Buy EUR 949,558 Sell USD 1,069,343 17/07/2020 (2,078) -
Buy EUR 945,733 Sell USD 1,065,035 17/07/2020 (2,070) -
Buy EUR 206,163 Sell CHF 221,500 17/07/2020 (2,030) -
Buy EUR 1,672,907 Sell USD 1,882,000 17/07/2020 (1,933) -
Buy GBP 146,301 Sell EUR 163,328 17/07/2020 (1,854) -
Buy GBP 138,665 Sell EUR 154,804 17/07/2020 (1,757) -
Buy GBP 190,400 Sell EUR 211,900 17/07/2020 (1,753) -
Buy EUR 739,168 Sell USD 832,413 17/07/2020 (1,618) -
Buy EUR 225,944 Sell USD 255,700 17/07/2020 (1,610) -
Buy EUR 125,377 Sell USD 142,600 17/07/2020 (1,526) -
Buy EUR 178,961 Sell USD 202,600 17/07/2020 (1,338) -
Buy GBP 101,435 Sell EUR 113,241 17/07/2020 (1,285) -
Buy GBP 68,065 Sell EUR 76,311 17/07/2020 (1,187) -
Buy USD 632,900 Sell EUR 564,350 17/07/2020 (1,116) -
Buy EUR 907,299 Sell USD 1,020,700 17/07/2020 (1,049) -
Buy EUR 116,993 Sell USD 132,400 17/07/2020 (834) -
Buy EUR 110,100 Sell USD 124,600 17/07/2020 (785) -
Buy GBP 37,900 Sell EUR 42,561 17/07/2020 (730) -
Buy GBP 41,710 Sell EUR 46,763 17/07/2020 (727) -
Buy GBP 56,499 Sell EUR 63,075 17/07/2020 (716) -
Buy USD 250,000 Sell EUR 223,197 17/07/2020 (715) -
Buy EUR 68,318 Sell CHF 73,400 17/07/2020 (673) -
Buy EUR 95,911 Sell CHF 102,758 17/07/2020 (673) -
Buy EUR 57,633 Sell USD 65,500 17/07/2020 (657) -
Buy EUR 53,457 Sell USD 60,800 17/07/2020 (651) -
Buy EUR 90,749 Sell USD 102,700 17/07/2020 (647) -
Buy GBP 100,800 Sell EUR 111,862 17/07/2020 (607) -
Buy EUR 85,407 Sell CHF 91,504 17/07/2020 (600) -
Buy EUR 243,818 Sell USD 274,575 17/07/2020 (534) -
Buy GBP 43,300 Sell EUR 48,311 17/07/2020 (520) -
Buy USD 179,200 Sell EUR 159,987 17/07/2020 (513) -
Buy USD 240,000 Sell EUR 214,072 17/07/2020 (489) -
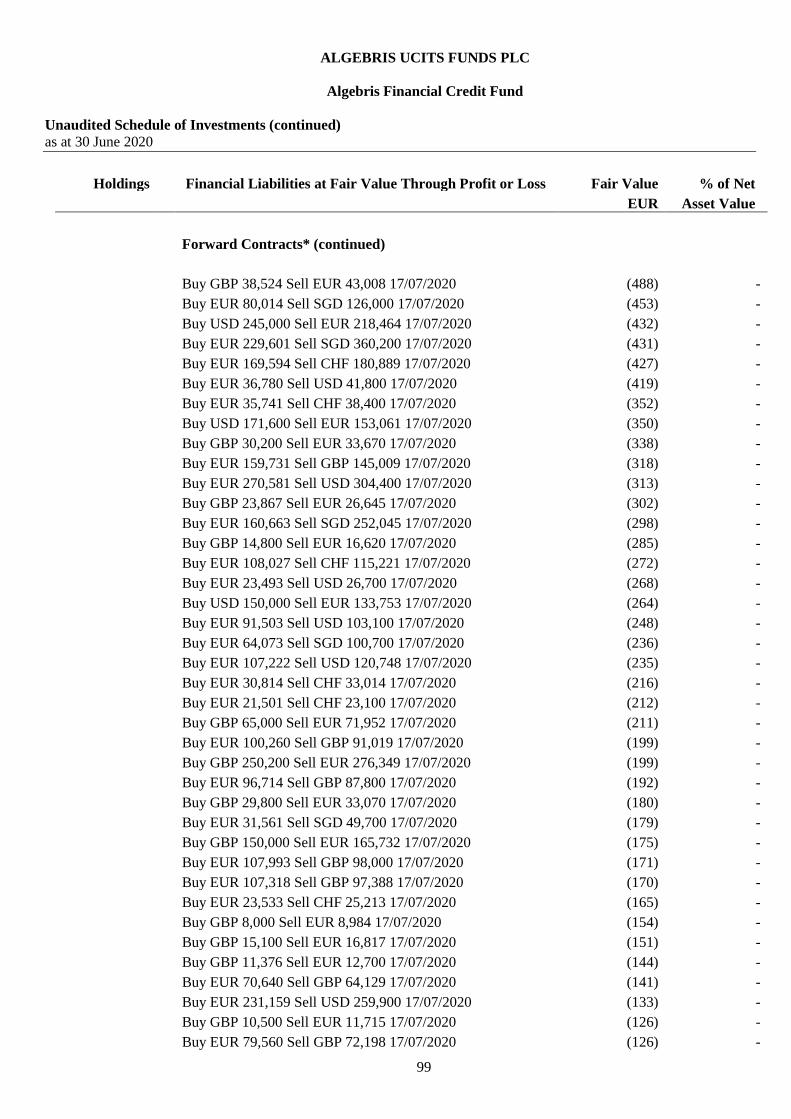
ALGEBRIS UCITS FUNDS PLC
Algebris Financial Credit Fund
Unaudited Schedule of Investments (continued)
as at 30 June 2020
99
Holdings Financial Liabilities at Fair Value Through Profit or Loss Fair Value % of Net
EUR Asset Value
Forward Contracts* (continued)
Buy GBP 38,524 Sell EUR 43,008 17/07/2020 (488) -
Buy EUR 80,014 Sell SGD 126,000 17/07/2020 (453) -
Buy USD 245,000 Sell EUR 218,464 17/07/2020 (432) -
Buy EUR 229,601 Sell SGD 360,200 17/07/2020 (431) -
Buy EUR 169,594 Sell CHF 180,889 17/07/2020 (427) -
Buy EUR 36,780 Sell USD 41,800 17/07/2020 (419) -
Buy EUR 35,741 Sell CHF 38,400 17/07/2020 (352) -
Buy USD 171,600 Sell EUR 153,061 17/07/2020 (350) -
Buy GBP 30,200 Sell EUR 33,670 17/07/2020 (338) -
Buy EUR 159,731 Sell GBP 145,009 17/07/2020 (318) -
Buy EUR 270,581 Sell USD 304,400 17/07/2020 (313) -
Buy GBP 23,867 Sell EUR 26,645 17/07/2020 (302) -
Buy EUR 160,663 Sell SGD 252,045 17/07/2020 (298) -
Buy GBP 14,800 Sell EUR 16,620 17/07/2020 (285) -
Buy EUR 108,027 Sell CHF 115,221 17/07/2020 (272) -
Buy EUR 23,493 Sell USD 26,700 17/07/2020 (268) -
Buy USD 150,000 Sell EUR 133,753 17/07/2020 (264) -
Buy EUR 91,503 Sell USD 103,100 17/07/2020 (248) -
Buy EUR 64,073 Sell SGD 100,700 17/07/2020 (236) -
Buy EUR 107,222 Sell USD 120,748 17/07/2020 (235) -
Buy EUR 30,814 Sell CHF 33,014 17/07/2020 (216) -
Buy EUR 21,501 Sell CHF 23,100 17/07/2020 (212) -
Buy GBP 65,000 Sell EUR 71,952 17/07/2020 (211) -
Buy EUR 100,260 Sell GBP 91,019 17/07/2020 (199) -
Buy GBP 250,200 Sell EUR 276,349 17/07/2020 (199) -
Buy EUR 96,714 Sell GBP 87,800 17/07/2020 (192) -
Buy GBP 29,800 Sell EUR 33,070 17/07/2020 (180) -
Buy EUR 31,561 Sell SGD 49,700 17/07/2020 (179) -
Buy GBP 150,000 Sell EUR 165,732 17/07/2020 (175) -
Buy EUR 107,993 Sell GBP 98,000 17/07/2020 (171) -
Buy EUR 107,318 Sell GBP 97,388 17/07/2020 (170) -
Buy EUR 23,533 Sell CHF 25,213 17/07/2020 (165) -
Buy GBP 8,000 Sell EUR 8,984 17/07/2020 (154) -
Buy GBP 15,100 Sell EUR 16,817 17/07/2020 (151) -
Buy GBP 11,376 Sell EUR 12,700 17/07/2020 (144) -
Buy EUR 70,640 Sell GBP 64,129 17/07/2020 (141) -
Buy EUR 231,159 Sell USD 259,900 17/07/2020 (133) -
Buy GBP 10,500 Sell EUR 11,715 17/07/2020 (126) -
Buy EUR 79,560 Sell GBP 72,198 17/07/2020 (126) -
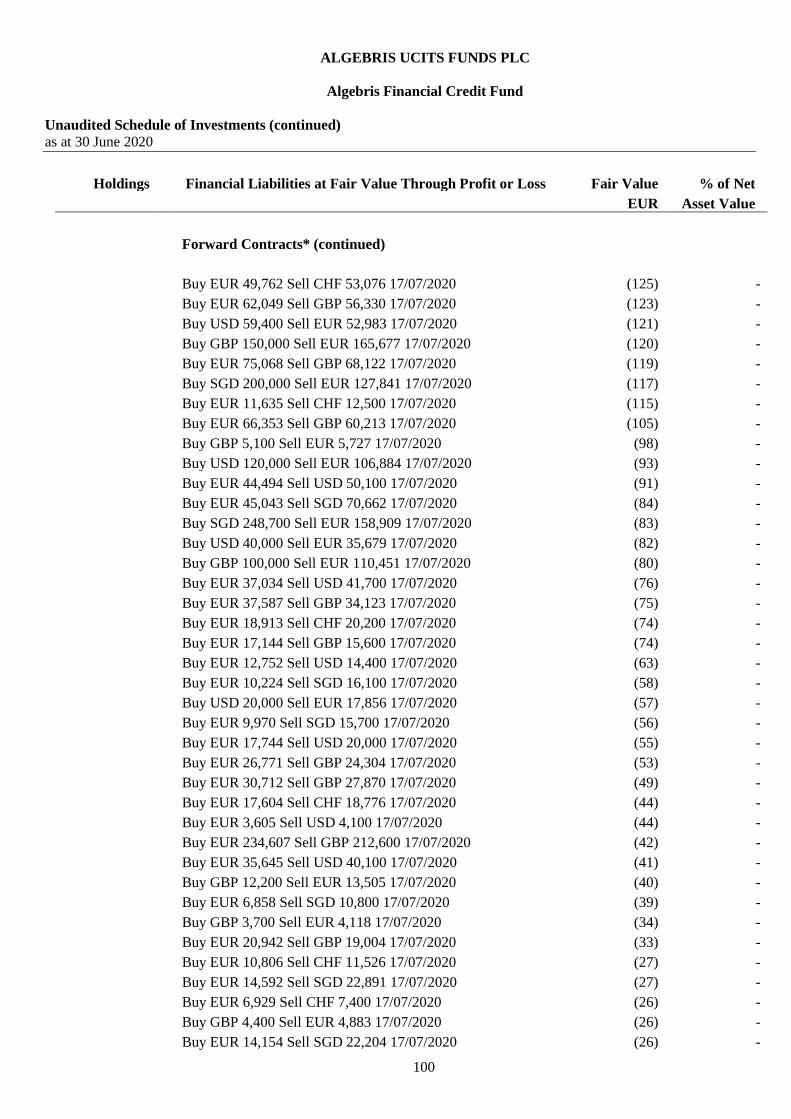
ALGEBRIS UCITS FUNDS PLC
Algebris Financial Credit Fund
Unaudited Schedule of Investments (continued)
as at 30 June 2020
100
Holdings Financial Liabilities at Fair Value Through Profit or Loss Fair Value % of Net
EUR Asset Value
Forward Contracts* (continued)
Buy EUR 49,762 Sell CHF 53,076 17/07/2020 (125) -
Buy EUR 62,049 Sell GBP 56,330 17/07/2020 (123) -
Buy USD 59,400 Sell EUR 52,983 17/07/2020 (121) -
Buy GBP 150,000 Sell EUR 165,677 17/07/2020 (120) -
Buy EUR 75,068 Sell GBP 68,122 17/07/2020 (119) -
Buy SGD 200,000 Sell EUR 127,841 17/07/2020 (117) -
Buy EUR 11,635 Sell CHF 12,500 17/07/2020 (115) -
Buy EUR 66,353 Sell GBP 60,213 17/07/2020 (105) -
Buy GBP 5,100 Sell EUR 5,727 17/07/2020 (98) -
Buy USD 120,000 Sell EUR 106,884 17/07/2020 (93) -
Buy EUR 44,494 Sell USD 50,100 17/07/2020 (91) -
Buy EUR 45,043 Sell SGD 70,662 17/07/2020 (84) -
Buy SGD 248,700 Sell EUR 158,909 17/07/2020 (83) -
Buy USD 40,000 Sell EUR 35,679 17/07/2020 (82) -
Buy GBP 100,000 Sell EUR 110,451 17/07/2020 (80) -
Buy EUR 37,034 Sell USD 41,700 17/07/2020 (76) -
Buy EUR 37,587 Sell GBP 34,123 17/07/2020 (75) -
Buy EUR 18,913 Sell CHF 20,200 17/07/2020 (74) -
Buy EUR 17,144 Sell GBP 15,600 17/07/2020 (74) -
Buy EUR 12,752 Sell USD 14,400 17/07/2020 (63) -
Buy EUR 10,224 Sell SGD 16,100 17/07/2020 (58) -
Buy USD 20,000 Sell EUR 17,856 17/07/2020 (57) -
Buy EUR 9,970 Sell SGD 15,700 17/07/2020 (56) -
Buy EUR 17,744 Sell USD 20,000 17/07/2020 (55) -
Buy EUR 26,771 Sell GBP 24,304 17/07/2020 (53) -
Buy EUR 30,712 Sell GBP 27,870 17/07/2020 (49) -
Buy EUR 17,604 Sell CHF 18,776 17/07/2020 (44) -
Buy EUR 3,605 Sell USD 4,100 17/07/2020 (44) -
Buy EUR 234,607 Sell GBP 212,600 17/07/2020 (42) -
Buy EUR 35,645 Sell USD 40,100 17/07/2020 (41) -
Buy GBP 12,200 Sell EUR 13,505 17/07/2020 (40) -
Buy EUR 6,858 Sell SGD 10,800 17/07/2020 (39) -
Buy GBP 3,700 Sell EUR 4,118 17/07/2020 (34) -
Buy EUR 20,942 Sell GBP 19,004 17/07/2020 (33) -
Buy EUR 10,806 Sell CHF 11,526 17/07/2020 (27) -
Buy EUR 14,592 Sell SGD 22,891 17/07/2020 (27) -
Buy EUR 6,929 Sell CHF 7,400 17/07/2020 (26) -
Buy GBP 4,400 Sell EUR 4,883 17/07/2020 (26) -
Buy EUR 14,154 Sell SGD 22,204 17/07/2020 (26) -

ALGEBRIS UCITS FUNDS PLC
Algebris Financial Credit Fund
Unaudited Schedule of Investments (continued)
as at 30 June 2020
101
Holdings Financial Liabilities at Fair Value Through Profit or Loss Fair Value % of Net
EUR Asset Value
Forward Contracts* (continued)
Buy EUR 2,111 Sell USD 2,400 17/07/2020 (25) -
Buy EUR 3,209 Sell CHF 3,438 17/07/2020 (23) -
Buy EUR 11,316 Sell GBP 10,273 17/07/2020 (23) -
Buy EUR 14,133 Sell GBP 12,825 17/07/2020 (22) -
Buy USD 27,500 Sell EUR 24,494 17/07/2020 (21) -
Buy EUR 7,366 Sell USD 8,300 17/07/2020 (20) -
Buy EUR 34,420 Sell USD 38,700 17/07/2020 (20) -
Buy GBP 15,700 Sell EUR 17,347 17/07/2020 (18) -
Buy EUR 9,781 Sell SGD 15,345 17/07/2020 (18) -
Buy EUR 1,675 Sell CHF 1,800 17/07/2020 (17) -
Buy EUR 7,270 Sell USD 8,187 17/07/2020 (16) -
Buy USD 5,200 Sell EUR 4,642 17/07/2020 (15) -
Buy EUR 7,247 Sell GBP 6,579 17/07/2020 (14) -
Buy EUR 1,143 Sell USD 1,300 17/07/2020 (14) -
Buy GBP 4,100 Sell EUR 4,539 17/07/2020 (13) -
Buy CHF 15,700 Sell EUR 14,769 17/07/2020 (12) -
Buy EUR 1,774 Sell CHF 1,900 17/07/2020 (12) -
Buy EUR 1,587 Sell CHF 1,700 17/07/2020 (11) -
Buy EUR 69,046 Sell SGD 108,134 17/07/2020 (11) -
Buy GBP 839 Sell EUR 937 17/07/2020 (11) -
Buy EUR 6,121 Sell GBP 5,555 17/07/2020 (10) -
Buy EUR 2,088 Sell GBP 1,900 17/07/2020 (9) -
Buy EUR 2,060 Sell CHF 2,200 17/07/2020 (8) -
Buy CHF 8,800 Sell EUR 8,278 17/07/2020 (7) -
Buy EUR 972 Sell USD 1,100 17/07/2020 (7) -
Buy EUR 34,540 Sell GBP 31,300 17/07/2020 (6) -
Buy EUR 10,317 Sell USD 11,600 17/07/2020 (6) -
Buy GBP 500 Sell EUR 557 17/07/2020 (6) -
Buy GBP 498 Sell EUR 556 17/07/2020 (6) -
Buy EUR 2,140 Sell USD 2,410 17/07/2020 (5) -
Buy EUR 1,442 Sell CHF 1,538 17/07/2020 (4) -
Buy GBP 400 Sell EUR 445 17/07/2020 (4) -
Buy EUR 25,177 Sell SGD 39,431 17/07/2020 (4) -
Buy GBP 500 Sell EUR 555 17/07/2020 (3) -
Buy USD 900 Sell EUR 804 17/07/2020 (3) -
Buy EUR 1,877 Sell CHF 2,000 17/07/2020 (3) -
Buy EUR 176 Sell USD 200 17/07/2020 (2) -
Buy EUR 154 Sell CHF 165 17/07/2020 (1) -
Buy EUR 93 Sell CHF 100 17/07/2020 (1) -

ALGEBRIS UCITS FUNDS PLC
Algebris Financial Credit Fund
Unaudited Schedule of Investments (continued)
as at 30 June 2020
102
Holdings Financial Liabilities at Fair Value Through Profit or Loss Fair Value % of Net
EUR Asset Value
Forward Contracts* (continued)
Buy EUR 1,221 Sell CHF 1,300 17/07/2020 (1) -
Buy GBP 100 Sell EUR 111 17/07/2020 (1) -
Buy EUR 616 Sell GBP 559 17/07/2020 (1) -
Buy EUR 431 Sell GBP 391 17/07/2020 (1) -
Buy EUR 315 Sell GBP 286 17/07/2020 (1) -
Buy GBP 1,600 Sell EUR 1,767 17/07/2020 (1) -
Buy EUR 8,163 Sell SGD 12,784 17/07/2020 (1) -
Buy EUR 5,455 Sell SGD 8,543 17/07/2020 (1) -
Buy EUR 7,935 Sell SGD 12,427 17/07/2020 (1) -
Buy EUR 256 Sell USD 288 17/07/2020 (1) -
Buy EUR 1,104 Sell GBP 1,000 17/07/2020 - -
Buy GBP 100 Sell EUR 111 17/07/2020 - -
Buy EUR 16 Sell HKD 139 17/07/2020 - -
Buy EUR 11 Sell HKD 100 17/07/2020 - -
Buy EUR 46 Sell JPY 5,600 17/07/2020 - -
Total Forward Contracts (35,677,653) (0.66)
Total Financial Liabilities at Fair Value Through Profit or
Loss (43,433,466) (0.80)
Net Financial Assets and Liabilities at Fair Value Through
Profit or Loss 4,799,379,602 88.62
Other Net Assets 616,323,264 11.38
Total Net Assets Attributable to Holders of Redeemable
Participating Shares 5,415,702,866 100.00
% of total
assets
Transferable securities admitted to an official stock
exchange listing or traded in a regulated market 4,813,556,836 87.24
Over the counter financial derivatives 29,256,232 0.53
Cash and other current assets 674,940,193 12.23
Total 5,517,753,261 100.00
*The counterparty for all the forward contracts is HSBC Bank plc.
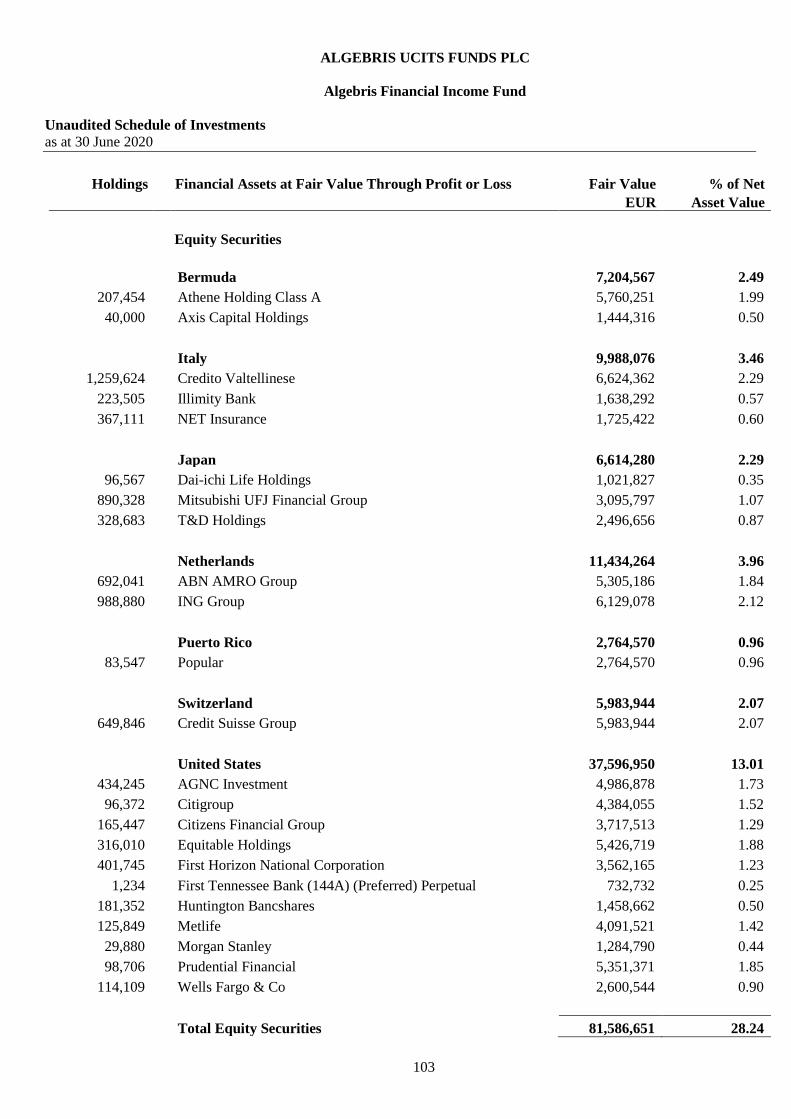
ALGEBRIS UCITS FUNDS PLC
Algebris Financial Income Fund
Unaudited Schedule of Investments
as at 30 June 2020
103
Holdings Financial Assets at Fair Value Through Profit or Loss Fair Value % of Net
EUR Asset Value
Equity Securities
Bermuda 7,204,567 2.49
207,454 Athene Holding Class A 5,760,251 1.99
40,000 Axis Capital Holdings 1,444,316 0.50
Italy 9,988,076 3.46
1,259,624 Credito Valtellinese 6,624,362 2.29
223,505 Illimity Bank 1,638,292 0.57
367,111 NET Insurance 1,725,422 0.60
Japan 6,614,280 2.29
96,567 Dai-ichi Life Holdings 1,021,827 0.35
890,328 Mitsubishi UFJ Financial Group 3,095,797 1.07
328,683 T&D Holdings 2,496,656 0.87
Netherlands 11,434,264 3.96
692,041 ABN AMRO Group 5,305,186 1.84
988,880 ING Group 6,129,078 2.12
Puerto Rico 2,764,570 0.96
83,547 Popular 2,764,570 0.96
Switzerland 5,983,944 2.07
649,846 Credit Suisse Group 5,983,944 2.07
United States 37,596,950 13.01
434,245 AGNC Investment 4,986,878 1.73
96,372 Citigroup 4,384,055 1.52
165,447 Citizens Financial Group 3,717,513 1.29
316,010 Equitable Holdings 5,426,719 1.88
401,745 First Horizon National Corporation 3,562,165 1.23
1,234 First Tennessee Bank (144A) (Preferred) Perpetual 732,732 0.25
181,352 Huntington Bancshares 1,458,662 0.50
125,849 Metlife 4,091,521 1.42
29,880 Morgan Stanley 1,284,790 0.44
98,706 Prudential Financial 5,351,371 1.85
114,109 Wells Fargo & Co 2,600,544 0.90
Total Equity Securities 81,586,651 28.24
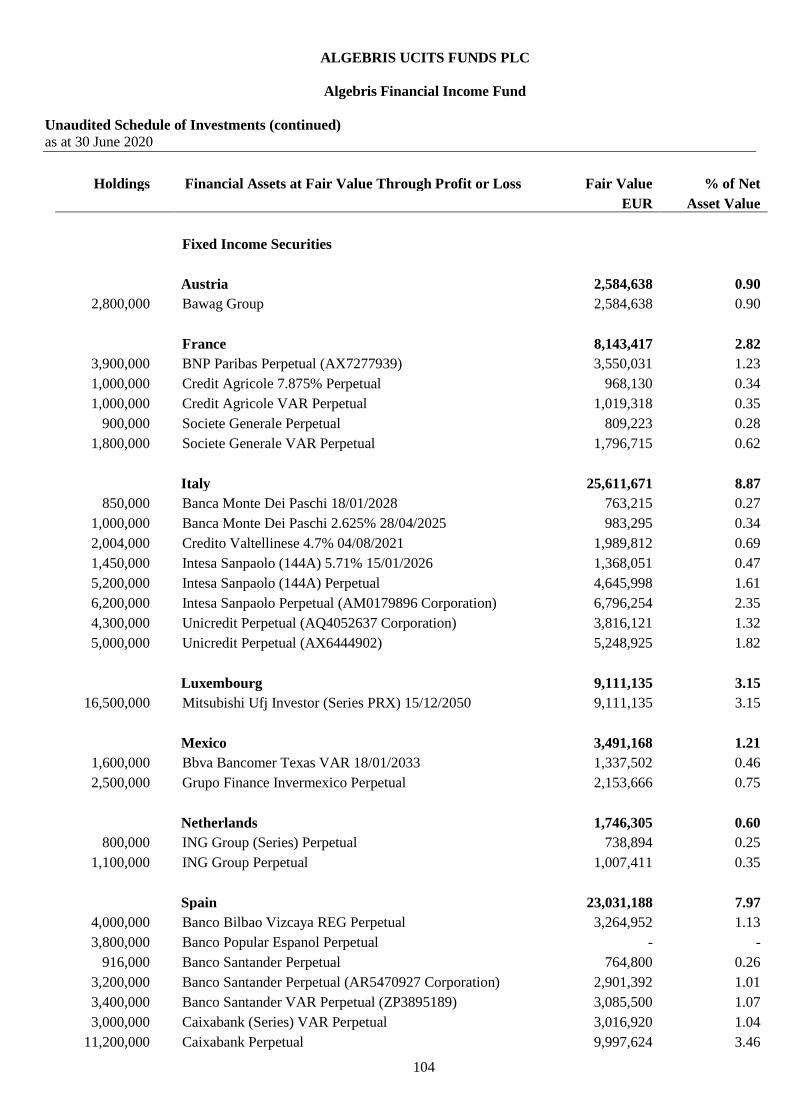
ALGEBRIS UCITS FUNDS PLC
Algebris Financial Income Fund
Unaudited Schedule of Investments (continued)
as at 30 June 2020
104
Holdings Financial Assets at Fair Value Through Profit or Loss Fair Value % of Net
EUR Asset Value
Fixed Income Securities
Austria 2,584,638 0.90
2,800,000 Bawag Group 2,584,638 0.90
France 8,143,417 2.82
3,900,000 BNP Paribas Perpetual (AX7277939) 3,550,031 1.23
1,000,000 Credit Agricole 7.875% Perpetual 968,130 0.34
1,000,000 Credit Agricole VAR Perpetual 1,019,318 0.35
900,000 Societe Generale Perpetual 809,223 0.28
1,800,000 Societe Generale VAR Perpetual 1,796,715 0.62
Italy 25,611,671 8.87
850,000 Banca Monte Dei Paschi 18/01/2028 763,215 0.27
1,000,000 Banca Monte Dei Paschi 2.625% 28/04/2025 983,295 0.34
2,004,000 Credito Valtellinese 4.7% 04/08/2021 1,989,812 0.69
1,450,000 Intesa Sanpaolo (144A) 5.71% 15/01/2026 1,368,051 0.47
5,200,000 Intesa Sanpaolo (144A) Perpetual 4,645,998 1.61
6,200,000 Intesa Sanpaolo Perpetual (AM0179896 Corporation) 6,796,254 2.35
4,300,000 Unicredit Perpetual (AQ4052637 Corporation) 3,816,121 1.32
5,000,000 Unicredit Perpetual (AX6444902) 5,248,925 1.82
Luxembourg 9,111,135 3.15
16,500,000 Mitsubishi Ufj Investor (Series PRX) 15/12/2050 9,111,135 3.15
Mexico 3,491,168 1.21
1,600,000 Bbva Bancomer Texas VAR 18/01/2033 1,337,502 0.46
2,500,000 Grupo Finance Invermexico Perpetual 2,153,666 0.75
Netherlands 1,746,305 0.60
800,000 ING Group (Series) Perpetual 738,894 0.25
1,100,000 ING Group Perpetual 1,007,411 0.35
Spain 23,031,188 7.97
4,000,000 Banco Bilbao Vizcaya REG Perpetual 3,264,952 1.13
3,800,000 Banco Popular Espanol Perpetual - -
916,000 Banco Santander Perpetual 764,800 0.26
3,200,000 Banco Santander Perpetual (AR5470927 Corporation) 2,901,392 1.01
3,400,000 Banco Santander VAR Perpetual (ZP3895189) 3,085,500 1.07
3,000,000 Caixabank (Series) VAR Perpetual 3,016,920 1.04
11,200,000 Caixabank Perpetual 9,997,624 3.46
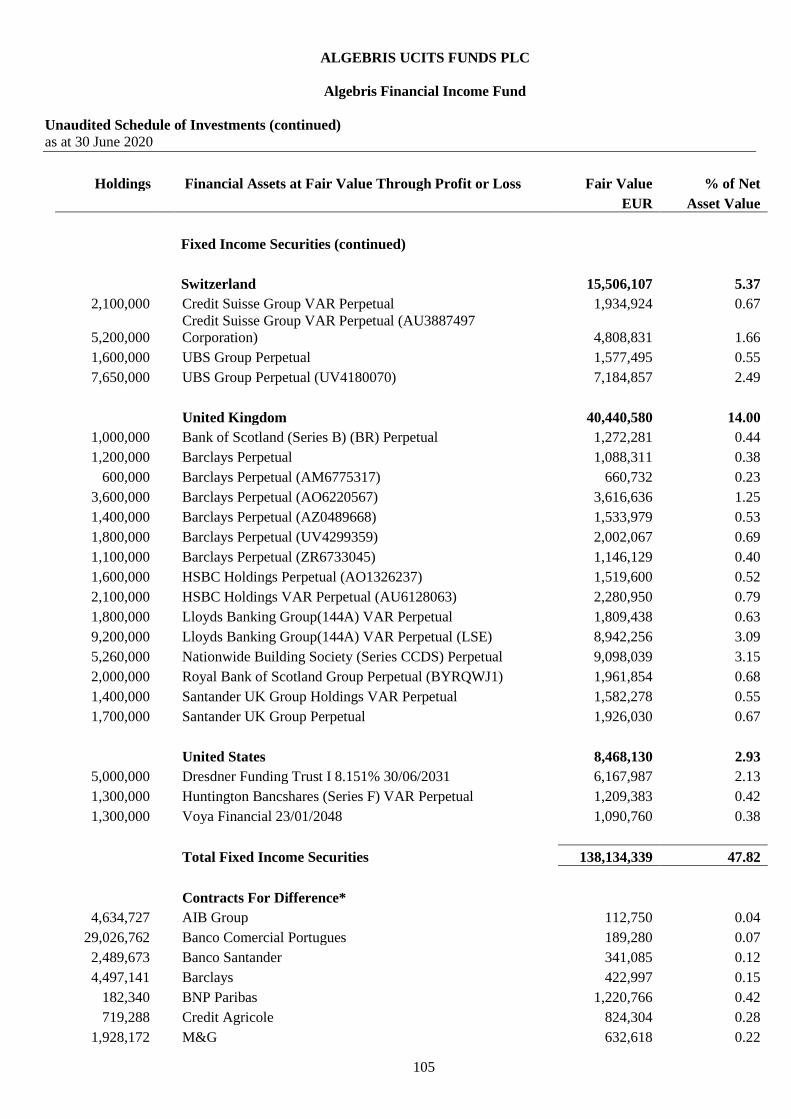
ALGEBRIS UCITS FUNDS PLC
Algebris Financial Income Fund
Unaudited Schedule of Investments (continued)
as at 30 June 2020
105
Holdings Financial Assets at Fair Value Through Profit or Loss Fair Value % of Net
EUR Asset Value
Fixed Income Securities (continued)
Switzerland 15,506,107 5.37
2,100,000 Credit Suisse Group VAR Perpetual 1,934,924 0.67
5,200,000
Credit Suisse Group VAR Perpetual (AU3887497
Corporation) 4,808,831 1.66
1,600,000 UBS Group Perpetual 1,577,495 0.55
7,650,000 UBS Group Perpetual (UV4180070) 7,184,857 2.49
United Kingdom 40,440,580 14.00
1,000,000 Bank of Scotland (Series B) (BR) Perpetual 1,272,281 0.44
1,200,000 Barclays Perpetual 1,088,311 0.38
600,000 Barclays Perpetual (AM6775317) 660,732 0.23
3,600,000 Barclays Perpetual (AO6220567) 3,616,636 1.25
1,400,000 Barclays Perpetual (AZ0489668) 1,533,979 0.53
1,800,000 Barclays Perpetual (UV4299359) 2,002,067 0.69
1,100,000 Barclays Perpetual (ZR6733045) 1,146,129 0.40
1,600,000 HSBC Holdings Perpetual (AO1326237) 1,519,600 0.52
2,100,000 HSBC Holdings VAR Perpetual (AU6128063) 2,280,950 0.79
1,800,000 Lloyds Banking Group(144A) VAR Perpetual 1,809,438 0.63
9,200,000 Lloyds Banking Group(144A) VAR Perpetual (LSE) 8,942,256 3.09
5,260,000 Nationwide Building Society (Series CCDS) Perpetual 9,098,039 3.15
2,000,000 Royal Bank of Scotland Group Perpetual (BYRQWJ1) 1,961,854 0.68
1,400,000 Santander UK Group Holdings VAR Perpetual 1,582,278 0.55
1,700,000 Santander UK Group Perpetual 1,926,030 0.67
United States 8,468,130 2.93
5,000,000 Dresdner Funding Trust I 8.151% 30/06/2031 6,167,987 2.13
1,300,000 Huntington Bancshares (Series F) VAR Perpetual 1,209,383 0.42
1,300,000 Voya Financial 23/01/2048 1,090,760 0.38
Total Fixed Income Securities 138,134,339 47.82
Contracts For Difference*
4,634,727 AIB Group 112,750 0.04
29,026,762 Banco Comercial Portugues 189,280 0.07
2,489,673 Banco Santander 341,085 0.12
4,497,141 Barclays 422,997 0.15
182,340 BNP Paribas 1,220,766 0.42
719,288 Credit Agricole 824,304 0.28
1,928,172 M&G 632,618 0.22
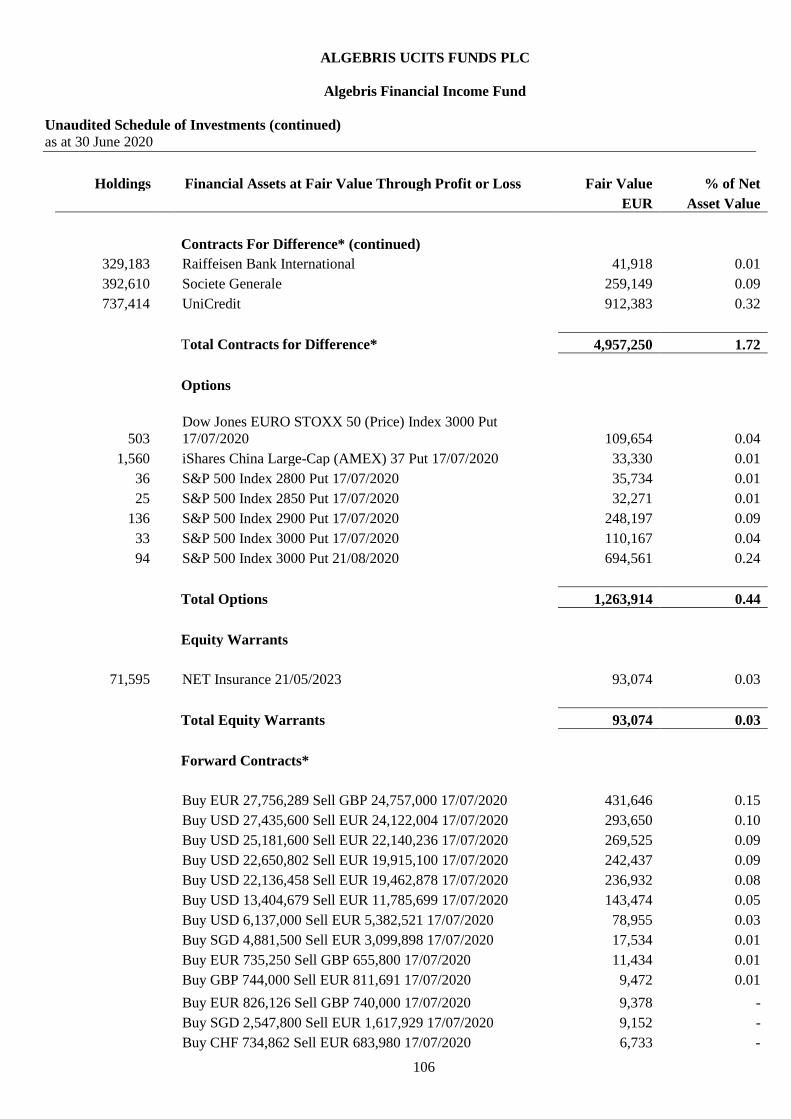
ALGEBRIS UCITS FUNDS PLC
Algebris Financial Income Fund
Unaudited Schedule of Investments (continued)
as at 30 June 2020
106
Holdings Financial Assets at Fair Value Through Profit or Loss Fair Value % of Net
EUR Asset Value
Contracts For Difference* (continued)
329,183 Raiffeisen Bank International 41,918 0.01
392,610 Societe Generale 259,149 0.09
737,414 UniCredit 912,383 0.32
Total Contracts for Difference* 4,957,250 1.72
Options
503
Dow Jones EURO STOXX 50 (Price) Index 3000 Put
17/07/2020 109,654 0.04
1,560 iShares China Large-Cap (AMEX) 37 Put 17/07/2020 33,330 0.01
36 S&P 500 Index 2800 Put 17/07/2020 35,734 0.01
25 S&P 500 Index 2850 Put 17/07/2020 32,271 0.01
136 S&P 500 Index 2900 Put 17/07/2020 248,197 0.09
33 S&P 500 Index 3000 Put 17/07/2020 110,167 0.04
94 S&P 500 Index 3000 Put 21/08/2020 694,561 0.24
Total Options 1,263,914 0.44
Equity Warrants
71,595 NET Insurance 21/05/2023 93,074 0.03
Total Equity Warrants 93,074 0.03
Forward Contracts*
Buy EUR 27,756,289 Sell GBP 24,757,000 17/07/2020 431,646 0.15
Buy USD 27,435,600 Sell EUR 24,122,004 17/07/2020 293,650 0.10
Buy USD 25,181,600 Sell EUR 22,140,236 17/07/2020 269,525 0.09
Buy USD 22,650,802 Sell EUR 19,915,100 17/07/2020 242,437 0.09
Buy USD 22,136,458 Sell EUR 19,462,878 17/07/2020 236,932 0.08
Buy USD 13,404,679 Sell EUR 11,785,699 17/07/2020 143,474 0.05
Buy USD 6,137,000 Sell EUR 5,382,521 17/07/2020 78,955 0.03
Buy SGD 4,881,500 Sell EUR 3,099,898 17/07/2020 17,534 0.01
Buy EUR 735,250 Sell GBP 655,800 17/07/2020 11,434 0.01
Buy GBP 744,000 Sell EUR 811,691 17/07/2020 9,472 0.01
Buy EUR 826,126 Sell GBP 740,000 17/07/2020 9,378 -
Buy SGD 2,547,800 Sell EUR 1,617,929 17/07/2020 9,152 -
Buy CHF 734,862 Sell EUR 683,980 17/07/2020 6,733 -
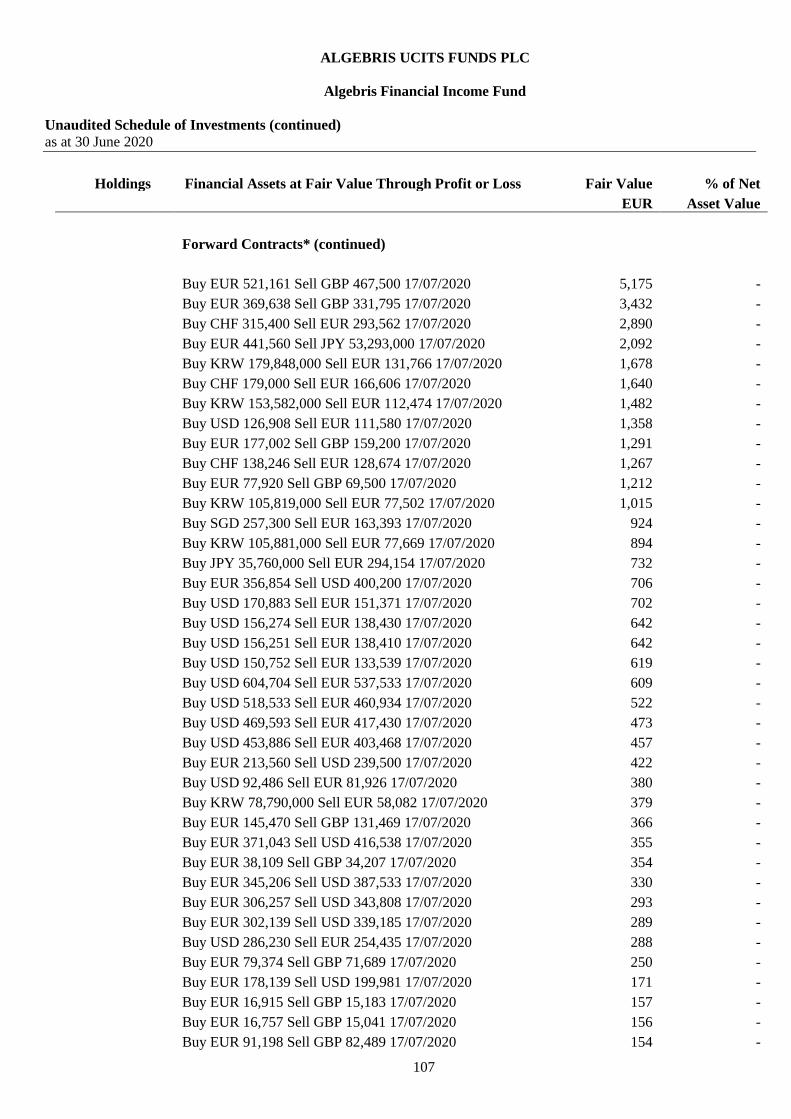
ALGEBRIS UCITS FUNDS PLC
Algebris Financial Income Fund
Unaudited Schedule of Investments (continued)
as at 30 June 2020
107
Holdings Financial Assets at Fair Value Through Profit or Loss Fair Value % of Net
EUR Asset Value
Forward Contracts* (continued)
Buy EUR 521,161 Sell GBP 467,500 17/07/2020 5,175 -
Buy EUR 369,638 Sell GBP 331,795 17/07/2020 3,432 -
Buy CHF 315,400 Sell EUR 293,562 17/07/2020 2,890 -
Buy EUR 441,560 Sell JPY 53,293,000 17/07/2020 2,092 -
Buy KRW 179,848,000 Sell EUR 131,766 17/07/2020 1,678 -
Buy CHF 179,000 Sell EUR 166,606 17/07/2020 1,640 -
Buy KRW 153,582,000 Sell EUR 112,474 17/07/2020 1,482 -
Buy USD 126,908 Sell EUR 111,580 17/07/2020 1,358 -
Buy EUR 177,002 Sell GBP 159,200 17/07/2020 1,291 -
Buy CHF 138,246 Sell EUR 128,674 17/07/2020 1,267 -
Buy EUR 77,920 Sell GBP 69,500 17/07/2020 1,212 -
Buy KRW 105,819,000 Sell EUR 77,502 17/07/2020 1,015 -
Buy SGD 257,300 Sell EUR 163,393 17/07/2020 924 -
Buy KRW 105,881,000 Sell EUR 77,669 17/07/2020 894 -
Buy JPY 35,760,000 Sell EUR 294,154 17/07/2020 732 -
Buy EUR 356,854 Sell USD 400,200 17/07/2020 706 -
Buy USD 170,883 Sell EUR 151,371 17/07/2020 702 -
Buy USD 156,274 Sell EUR 138,430 17/07/2020 642 -
Buy USD 156,251 Sell EUR 138,410 17/07/2020 642 -
Buy USD 150,752 Sell EUR 133,539 17/07/2020 619 -
Buy USD 604,704 Sell EUR 537,533 17/07/2020 609 -
Buy USD 518,533 Sell EUR 460,934 17/07/2020 522 -
Buy USD 469,593 Sell EUR 417,430 17/07/2020 473 -
Buy USD 453,886 Sell EUR 403,468 17/07/2020 457 -
Buy EUR 213,560 Sell USD 239,500 17/07/2020 422 -
Buy USD 92,486 Sell EUR 81,926 17/07/2020 380 -
Buy KRW 78,790,000 Sell EUR 58,082 17/07/2020 379 -
Buy EUR 145,470 Sell GBP 131,469 17/07/2020 366 -
Buy EUR 371,043 Sell USD 416,538 17/07/2020 355 -
Buy EUR 38,109 Sell GBP 34,207 17/07/2020 354 -
Buy EUR 345,206 Sell USD 387,533 17/07/2020 330 -
Buy EUR 306,257 Sell USD 343,808 17/07/2020 293 -
Buy EUR 302,139 Sell USD 339,185 17/07/2020 289 -
Buy USD 286,230 Sell EUR 254,435 17/07/2020 288 -
Buy EUR 79,374 Sell GBP 71,689 17/07/2020 250 -
Buy EUR 178,139 Sell USD 199,981 17/07/2020 171 -
Buy EUR 16,915 Sell GBP 15,183 17/07/2020 157 -
Buy EUR 16,757 Sell GBP 15,041 17/07/2020 156 -
Buy EUR 91,198 Sell GBP 82,489 17/07/2020 154 -

ALGEBRIS UCITS FUNDS PLC
Algebris Financial Income Fund
Unaudited Schedule of Investments (continued)
as at 30 June 2020
108
Holdings Financial Assets at Fair Value Through Profit or Loss Fair Value % of Net
EUR Asset Value
Forward Contracts* (continued)
Buy EUR 18,679 Sell GBP 16,800 17/07/2020 136 -
Buy EUR 48,118 Sell SGD 75,148 17/07/2020 127 -
Buy EUR 7,960 Sell GBP 7,100 17/07/2020 124 -
Buy EUR 24,941 Sell SGD 38,951 17/07/2020 66 -
Buy EUR 8,227 Sell GBP 7,400 17/07/2020 60 -
Buy EUR 8,116 Sell GBP 7,300 17/07/2020 59 -
Buy SGD 31,399 Sell EUR 19,996 17/07/2020 56 -
Buy EUR 3,476 Sell GBP 3,100 17/07/2020 54 -
Buy EUR 3,363 Sell GBP 3,000 17/07/2020 52 -
Buy SGD 100,312 Sell EUR 64,012 17/07/2020 50 -
Buy EUR 33,821 Sell GBP 30,600 17/07/2020 47 -
Buy EUR 2,358 Sell GBP 2,100 17/07/2020 40 -
Buy EUR 15,932 Sell GBP 14,399 17/07/2020 40 -
Buy USD 37,000 Sell EUR 32,889 17/07/2020 38 -
Buy EUR 3,568 Sell GBP 3,200 17/07/2020 36 -
Buy EUR 182,829 Sell USD 205,404 17/07/2020 34 -
Buy CHF 15,035 Sell EUR 14,099 17/07/2020 33 -
Buy EUR 168,042 Sell USD 188,791 17/07/2020 32 -
Buy EUR 3,288 Sell GBP 2,951 17/07/2020 31 -
Buy JPY 602,300 Sell EUR 4,936 17/07/2020 31 -
Buy SGD 16,516 Sell EUR 10,518 17/07/2020 29 -
Buy EUR 150,221 Sell USD 168,770 17/07/2020 28 -
Buy EUR 147,100 Sell USD 165,264 17/07/2020 28 -
Buy SGD 52,538 Sell EUR 33,526 17/07/2020 26 -
Buy EUR 7,784 Sell GBP 7,030 17/07/2020 25 -
Buy CHF 4,882 Sell EUR 4,567 17/07/2020 21 -
Buy EUR 2,171 Sell GBP 1,949 17/07/2020 20 -
Buy EUR 6,961 Sell GBP 6,291 17/07/2020 18 -
Buy EUR 6,980 Sell GBP 6,308 17/07/2020 18 -
Buy EUR 87,130 Sell USD 97,889 17/07/2020 16 -
Buy EUR 8,900 Sell GBP 8,050 17/07/2020 15 -
Buy CHF 6,452 Sell EUR 6,050 17/07/2020 14 -
Buy KRW 92,931,000 Sell EUR 68,940 17/07/2020 14 -
Buy HKD 9,400 Sell EUR 1,066 17/07/2020 13 -
Buy HKD 9,300 Sell EUR 1,055 17/07/2020 13 -
Buy EUR 3,410 Sell GBP 3,080 17/07/2020 11 -
Buy EUR 1,557 Sell GBP 1,400 17/07/2020 11 -
Buy EUR 3,410 Sell GBP 3,080 17/07/2020 11 -
Buy EUR 673 Sell GBP 600 17/07/2020 10 -

ALGEBRIS UCITS FUNDS PLC
Algebris Financial Income Fund
Unaudited Schedule of Investments (continued)
as at 30 June 2020
109
Holdings Financial Assets at Fair Value Through Profit or Loss Fair Value % of Net
EUR Asset Value
Forward Contracts* (continued)
Buy USD 933 Sell EUR 820 17/07/2020 10 -
Buy CHF 2,095 Sell EUR 1,960 17/07/2020 9 -
Buy EUR 1,112 Sell GBP 1,000 17/07/2020 8 -
Buy EUR 448 Sell GBP 400 17/07/2020 7 -
Buy EUR 3,893 Sell GBP 3,521 17/07/2020 7 -
Buy EUR 3,899 Sell GBP 3,527 17/07/2020 7 -
Buy EUR 2,538 Sell SGD 3,963 17/07/2020 7 -
Buy CHF 2,843 Sell EUR 2,666 17/07/2020 6 -
Buy CHF 928 Sell EUR 868 17/07/2020 4 -
Buy GBP 400 Sell EUR 438 17/07/2020 4 -
Buy USD 875 Sell EUR 775 17/07/2020 4 -
Buy EUR 775 Sell GBP 700 17/07/2020 3 -
Buy EUR 1,371 Sell GBP 1,239 17/07/2020 3 -
Buy SGD 1,655 Sell EUR 1,054 17/07/2020 3 -
Buy SGD 5,295 Sell EUR 3,379 17/07/2020 3 -
Buy USD 2,632 Sell EUR 2,340 17/07/2020 3 -
Buy EUR 10,660 Sell CHF 11,339 17/07/2020 2 -
Buy EUR 918 Sell GBP 830 17/07/2020 2 -
Buy EUR 677 Sell GBP 611 17/07/2020 2 -
Buy EUR 1,717 Sell USD 1,927 17/07/2020 2 -
Buy EUR 4,576 Sell CHF 4,867 17/07/2020 1 -
Buy EUR 451 Sell GBP 407 17/07/2020 1 -
Buy EUR 515 Sell GBP 466 17/07/2020 1 -
Buy EUR 769 Sell GBP 696 17/07/2020 1 -
Buy EUR 77 Sell JPY 9,224 17/07/2020 1 -
Buy EUR 182 Sell JPY 21,954 17/07/2020 1 -
Buy EUR 1,985 Sell CHF 2,111 17/07/2020 - -
Buy GBP 2,000 Sell EUR 2,207 17/07/2020 - -
Buy EUR 08 Sell HKD 70 17/07/2020 - -
Buy EUR 09 Sell HKD 79 17/07/2020 - -
Buy EUR 17 Sell HKD 144 17/07/2020 - -
Buy HKD 65 Sell EUR 07 17/07/2020 - -
Buy EUR 41 Sell HKD 357 17/07/2020 - -
Buy HKD 194 Sell EUR 22 17/07/2020 - -
Buy EUR 08 Sell HKD 70 17/07/2020 - -
Buy EUR 09 Sell HKD 79 17/07/2020 - -
Buy EUR 17 Sell HKD 144 17/07/2020 - -
Buy HKD 63 Sell EUR 07 17/07/2020 - -
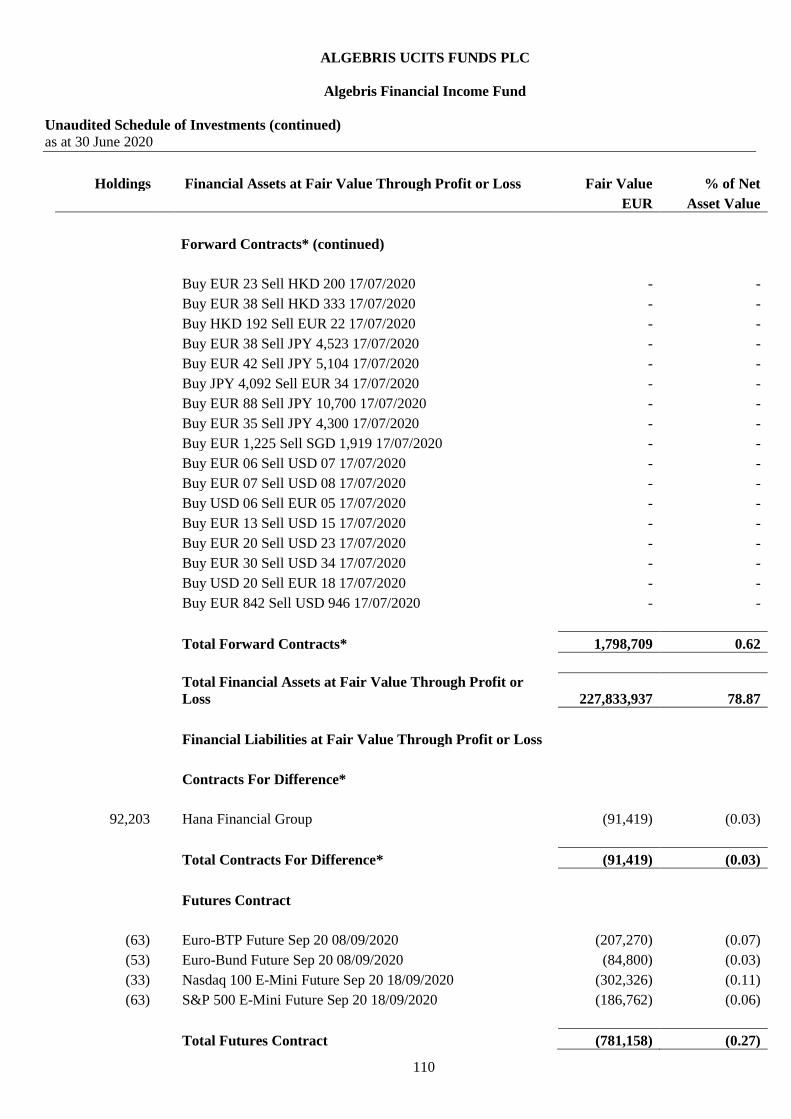
ALGEBRIS UCITS FUNDS PLC
Algebris Financial Income Fund
Unaudited Schedule of Investments (continued)
as at 30 June 2020
110
Holdings Financial Assets at Fair Value Through Profit or Loss Fair Value % of Net
EUR Asset Value
Forward Contracts* (continued)
Buy EUR 23 Sell HKD 200 17/07/2020 - -
Buy EUR 38 Sell HKD 333 17/07/2020 - -
Buy HKD 192 Sell EUR 22 17/07/2020 - -
Buy EUR 38 Sell JPY 4,523 17/07/2020 - -
Buy EUR 42 Sell JPY 5,104 17/07/2020 - -
Buy JPY 4,092 Sell EUR 34 17/07/2020 - -
Buy EUR 88 Sell JPY 10,700 17/07/2020 - -
Buy EUR 35 Sell JPY 4,300 17/07/2020 - -
Buy EUR 1,225 Sell SGD 1,919 17/07/2020 - -
Buy EUR 06 Sell USD 07 17/07/2020 - -
Buy EUR 07 Sell USD 08 17/07/2020 - -
Buy USD 06 Sell EUR 05 17/07/2020 - -
Buy EUR 13 Sell USD 15 17/07/2020 - -
Buy EUR 20 Sell USD 23 17/07/2020 - -
Buy EUR 30 Sell USD 34 17/07/2020 - -
Buy USD 20 Sell EUR 18 17/07/2020 - -
Buy EUR 842 Sell USD 946 17/07/2020 - -
Total Forward Contracts* 1,798,709 0.62
Total Financial Assets at Fair Value Through Profit or
Loss 227,833,937 78.87
Financial Liabilities at Fair Value Through Profit or Loss
Contracts For Difference*
92,203 Hana Financial Group (91,419) (0.03)
Total Contracts For Difference* (91,419) (0.03)
Futures Contract
(63) Euro-BTP Future Sep 20 08/09/2020 (207,270) (0.07)
(53) Euro-Bund Future Sep 20 08/09/2020 (84,800) (0.03)
(33) Nasdaq 100 E-Mini Future Sep 20 18/09/2020 (302,326) (0.11)
(63) S&P 500 E-Mini Future Sep 20 18/09/2020 (186,762) (0.06)
Total Futures Contract (781,158) (0.27)

ALGEBRIS UCITS FUNDS PLC
Algebris Financial Income Fund
Unaudited Schedule of Investments (continued)
as at 30 June 2020
111
Holdings Financial Liabilities at Fair Value Through Profit or Loss Fair Value % of Net
EUR Asset Value
Options
(36) S&P 500 Index 2500 Put 17/07/2020 (8,493) -
(51) S&P 500 Index 2600 Put 17/07/2020 (16,345) (0.01)
(94) S&P 500 Index 2600 Put 21/08/2020 (184,100) (0.06)
(57) S&P 500 Index 2700 Put 17/07/2020 (31,207) (0.01)
Total Options (240,145) (0.08)
Forward Contracts*
Buy EUR 109,942,669 Sell USD 125,045,295 17/07/2020 (1,338,391) (0.47)
Buy GBP 9,052,068 Sell EUR 10,148,718 17/07/2020 (157,826) (0.06)
Buy EUR 7,824,430 Sell JPY 954,764,000 17/07/2020 (48,801) (0.02)
Buy EUR 4,857,263 Sell CHF 5,204,000 17/07/2020 (34,096) (0.01)
Buy GBP 939,198 Sell EUR 1,052,981 17/07/2020 (16,375) (0.01)
Buy EUR 1,318,570 Sell USD 1,499,700 17/07/2020 (16,052) (0.01)
Buy GBP 1,344,000 Sell EUR 1,497,292 17/07/2020 (13,901) (0.01)
Buy EUR 1,046,174 Sell CHF 1,124,000 17/07/2020 (10,299) (0.01)
Buy EUR 2,104,256 Sell KRW 2,848,216,000 17/07/2020 (9,078) -
Buy GBP 411,472 Sell EUR 461,321 17/07/2020 (7,174) -
Buy GBP 411,400 Sell EUR 461,241 17/07/2020 (7,173) -
Buy EUR 429,058 Sell USD 489,200 17/07/2020 (6,294) -
Buy EUR 394,151 Sell USD 449,400 17/07/2020 (5,782) -
Buy EUR 353,806 Sell USD 403,400 17/07/2020 (5,190) -
Buy EUR 346,527 Sell USD 395,100 17/07/2020 (5,083) -
Buy EUR 209,617 Sell USD 239,000 17/07/2020 (3,075) -
Buy EUR 197,052 Sell KRW 268,931,000 17/07/2020 (2,491) -
Buy GBP 191,344 Sell EUR 213,614 17/07/2020 (2,425) -
Buy JPY 30,412,000 Sell EUR 253,132 17/07/2020 (2,347) -
Buy JPY 28,804,000 Sell EUR 239,822 17/07/2020 (2,296) -
Buy EUR 167,756 Sell USD 190,800 17/07/2020 (2,042) -
Buy EUR 888,727 Sell USD 1,000,838 17/07/2020 (1,945) -
Buy EUR 156,238 Sell USD 177,700 17/07/2020 (1,902) -
Buy EUR 816,107 Sell USD 919,057 17/07/2020 (1,786) -
Buy EUR 137,335 Sell USD 156,200 17/07/2020 (1,672) -
Buy EUR 136,543 Sell USD 155,300 17/07/2020 (1,662) -
Buy EUR 733,399 Sell USD 825,916 17/07/2020 (1,605) -
Buy EUR 717,358 Sell USD 807,851 17/07/2020 (1,570) -
Buy JPY 60,800,000 Sell EUR 502,866 17/07/2020 (1,493) -

ALGEBRIS UCITS FUNDS PLC
Algebris Financial Income Fund
Unaudited Schedule of Investments (continued)
as at 30 June 2020
112
Holdings Financial Liabilities at Fair Value Through Profit or Loss Fair Value % of Net
EUR Asset Value
Forward Contracts* (continued)
Buy GBP 80,832 Sell EUR 90,625 17/07/2020 (1,409) -
Buy GBP 555,000 Sell EUR 613,895 17/07/2020 (1,334) -
Buy EUR 165,181 Sell USD 187,000 17/07/2020 (1,235) -
Buy GBP 130,800 Sell EUR 145,570 17/07/2020 (1,204) -
Buy EUR 81,944 Sell USD 93,200 17/07/2020 (998) -
Buy GBP 54,663 Sell EUR 61,285 17/07/2020 (953) -
Buy EUR 434,241 Sell USD 489,020 17/07/2020 (950) -
Buy GBP 49,410 Sell EUR 55,331 17/07/2020 (797) -
Buy EUR 203,352 Sell CHF 217,000 17/07/2020 (612) -
Buy EUR 85,889 Sell USD 97,200 17/07/2020 (612) -
Buy EUR 55,063 Sell SGD 87,100 17/07/2020 (561) -
Buy EUR 284,003 Sell USD 319,500 17/07/2020 (328) -
Buy EUR 28,701 Sell SGD 45,400 17/07/2020 (292) -
Buy EUR 206,148 Sell USD 231,947 17/07/2020 (268) -
Buy EUR 189,920 Sell USD 213,688 17/07/2020 (247) -
Buy GBP 19,257 Sell EUR 21,498 17/07/2020 (244) -
Buy EUR 168,970 Sell USD 190,116 17/07/2020 (220) -
Buy EUR 166,227 Sell USD 187,030 17/07/2020 (216) -
Buy EUR 113,432 Sell SGD 177,950 17/07/2020 (211) -
Buy JPY 34,651,000 Sell EUR 285,928 17/07/2020 (187) -
Buy EUR 24,995 Sell CHF 26,779 17/07/2020 (175) -
Buy EUR 22,988 Sell SGD 36,200 17/07/2020 (130) -
Buy EUR 98,171 Sell USD 110,457 17/07/2020 (128) -
Buy EUR 54,167 Sell USD 61,000 17/07/2020 (119) -
Buy EUR 59,191 Sell SGD 92,857 17/07/2020 (110) -
Buy GBP 8,489 Sell EUR 9,477 17/07/2020 (108) -
Buy GBP 8,437 Sell EUR 9,419 17/07/2020 (107) -
Buy EUR 64,242 Sell KRW 86,719,000 17/07/2020 (102) -
Buy GBP 5,831 Sell EUR 6,530 17/07/2020 (94) -
Buy EUR 12,232 Sell CHF 13,100 17/07/2020 (81) -
Buy EUR 10,714 Sell CHF 11,479 17/07/2020 (75) -
Buy EUR 11,812 Sell SGD 18,600 17/07/2020 (67) -
Buy EUR 4,840 Sell CHF 5,200 17/07/2020 (48) -
Buy GBP 2,771 Sell EUR 3,103 17/07/2020 (45) -
Buy CHF 196,000 Sell EUR 184,268 17/07/2020 (43) -
Buy GBP 2,555 Sell EUR 2,861 17/07/2020 (41) -
Buy EUR 5,229 Sell CHF 5,600 17/07/2020 (35) -
Buy EUR 4,733 Sell CHF 5,071 17/07/2020 (33) -

ALGEBRIS UCITS FUNDS PLC
Algebris Financial Income Fund
Unaudited Schedule of Investments (continued)
as at 30 June 2020
113
Holdings Financial Liabilities at Fair Value Through Profit or Loss Fair Value % of Net
EUR Asset Value
Forward Contracts* (continued)
Buy EUR 26,508 Sell SGD 41,560 17/07/2020 (33) -
Buy EUR 2,908 Sell SGD 4,600 17/07/2020 (30) -
Buy EUR 2,017 Sell USD 2,300 17/07/2020 (30) -
Buy EUR 2,141 Sell CHF 2,300 17/07/2020 (21) -
Buy GBP 1,694 Sell EUR 1,891 17/07/2020 (21) -
Buy EUR 13,761 Sell SGD 21,574 17/07/2020 (17) -
Buy EUR 2,241 Sell CHF 2,400 17/07/2020 (15) -
Buy EUR 5,133 Sell CHF 5,478 17/07/2020 (15) -
Buy GBP 1,127 Sell EUR 1,258 17/07/2020 (14) -
Buy GBP 700 Sell EUR 786 17/07/2020 (13) -
Buy EUR 5,985 Sell CHF 6,380 17/07/2020 (12) -
Buy EUR 5,977 Sell SGD 9,376 17/07/2020 (11) -
Buy EUR 931 Sell CHF 1,000 17/07/2020 (9) -
Buy GBP 800 Sell EUR 892 17/07/2020 (9) -
Buy GBP 564 Sell EUR 632 17/07/2020 (9) -
Buy GBP 1,000 Sell EUR 1,113 17/07/2020 (9) -
Buy EUR 4,112 Sell USD 4,631 17/07/2020 (9) -
Buy EUR 703 Sell USD 800 17/07/2020 (9) -
Buy EUR 2,203 Sell CHF 2,351 17/07/2020 (7) -
Buy EUR 23,212 Sell SGD 36,358 17/07/2020 (7) -
Buy GBP 343 Sell EUR 384 17/07/2020 (6) -
Buy EUR 1,080 Sell SGD 1,700 17/07/2020 (6) -
Buy EUR 2,567 Sell CHF 2,737 17/07/2020 (5) -
Buy EUR 12,079 Sell SGD 18,920 17/07/2020 (4) -
Buy EUR 961 Sell CHF 1,026 17/07/2020 (3) -
Buy EUR 1,117 Sell CHF 1,191 17/07/2020 (2) -
Buy GBP 200 Sell EUR 223 17/07/2020 (2) -
Buy EUR 1,399 Sell SGD 2,193 17/07/2020 (2) -
Buy GBP 100 Sell EUR 111 17/07/2020 (1) -
Buy EUR 947 Sell USD 1,065 17/07/2020 (1) -
Buy EUR 23 Sell HKD 200 17/07/2020 - -
Buy JPY 12,405 Sell EUR 103 17/07/2020 - -
Total Forward Contracts (1,724,577) (0.60)
Total Financial Liabilities at Fair Value Through Profit or
Loss (2,837,299) (0.98)

ALGEBRIS UCITS FUNDS PLC
Algebris Financial Income Fund
Unaudited Schedule of Investments (continued)
as at 30 June 2020
114
Holdings Financial Liabilities at Fair Value Through Profit or Loss Fair Value % of Net
EUR Asset Value
Net Financial Assets and Liabilities at Fair Value Through
Profit or Loss 224,996,638 77.89
Other Net Assets 63,858,099 22.11
Total Net Assets Attributable to Holders of Redeemable
Participating Shares 288,854,737 100.00
% of total
assets
Transferable securities admitted to an official stock
exchange listing or traded in a regulated market 219,720,990 73.90
Over the counter financial derivatives 8,112,947 2.73
Cash and other current assets 69,468,121 23.37
Total Assets 297,302,058 100.00
*The counterparty for all the contracts for differences and forward contracts is HSBC Bank plc
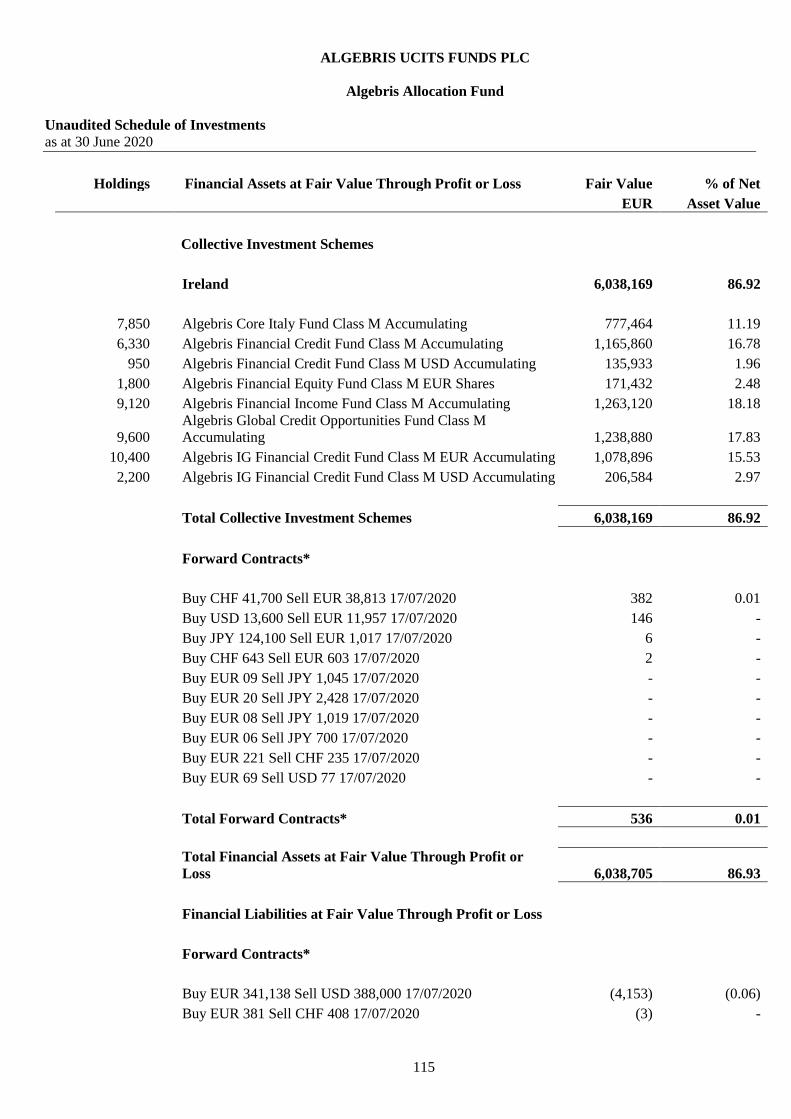
ALGEBRIS UCITS FUNDS PLC
Algebris Allocation Fund
Unaudited Schedule of Investments
as at 30 June 2020
115
Holdings Financial Assets at Fair Value Through Profit or Loss Fair Value % of Net
EUR Asset Value
Collective Investment Schemes
Ireland 6,038,169 86.92
7,850 Algebris Core Italy Fund Class M Accumulating 777,464 11.19
6,330 Algebris Financial Credit Fund Class M Accumulating 1,165,860 16.78
950 Algebris Financial Credit Fund Class M USD Accumulating 135,933 1.96
1,800 Algebris Financial Equity Fund Class M EUR Shares 171,432 2.48
9,120 Algebris Financial Income Fund Class M Accumulating 1,263,120 18.18
9,600
Algebris Global Credit Opportunities Fund Class M
Accumulating 1,238,880 17.83
10,400 Algebris IG Financial Credit Fund Class M EUR Accumulating 1,078,896 15.53
2,200 Algebris IG Financial Credit Fund Class M USD Accumulating 206,584 2.97
Total Collective Investment Schemes 6,038,169 86.92
Forward Contracts*
Buy CHF 41,700 Sell EUR 38,813 17/07/2020 382 0.01
Buy USD 13,600 Sell EUR 11,957 17/07/2020 146 -
Buy JPY 124,100 Sell EUR 1,017 17/07/2020 6 -
Buy CHF 643 Sell EUR 603 17/07/2020 2 -
Buy EUR 09 Sell JPY 1,045 17/07/2020 - -
Buy EUR 20 Sell JPY 2,428 17/07/2020 - -
Buy EUR 08 Sell JPY 1,019 17/07/2020 - -
Buy EUR 06 Sell JPY 700 17/07/2020 - -
Buy EUR 221 Sell CHF 235 17/07/2020 - -
Buy EUR 69 Sell USD 77 17/07/2020 - -
Total Forward Contracts* 536 0.01
Total Financial Assets at Fair Value Through Profit or
Loss 6,038,705 86.93
Financial Liabilities at Fair Value Through Profit or Loss
Forward Contracts*
Buy EUR 341,138 Sell USD 388,000 17/07/2020 (4,153) (0.06)
Buy EUR 381 Sell CHF 408 17/07/2020 (3) -

ALGEBRIS UCITS FUNDS PLC
Algebris Allocation Fund
Unaudited Schedule of Investments (continued)
as at 30 June 2020
116
Holdings Financial Liabilities at Fair Value Through Profit or Loss Fair Value % of Net
EUR Asset Value
Forward Contracts* (continued)
Buy EUR 764 Sell CHF 816 17/07/2020 (3) -
Buy EUR 332 Sell CHF 354 17/07/2020 (1) -
Buy EUR 237 Sell USD 267 17/07/2020 (1) -
Buy JPY 1,943 Sell EUR 16 17/07/2020 - -
Buy EUR 88 Sell USD 99 17/07/2020 - -
Buy USD 214 Sell EUR 190 17/07/2020 - -
Buy EUR 99 Sell USD 112 17/07/2020 - -
Total Forward Contracts* (4,161) (0.06)
Total Financial Liabilities at Fair Value Through Profit or
Loss (4,161) (0.06)
Net Financial Assets and Liabilities at Fair Value Through
Profit or Loss 6,034,544 86.87
Other Net Assets 912,317 13.13
Total Net Assets Attributable to Holders of Redeemable
Participating Shares 6,946,861 100.00
% of total
assets
Transferable securities admitted to an official stock
exchange listing or traded in a regulated market - -
Investment Funds 6,038,169 85.46
Over the counter financial derivatives 536 0.01
Cash and other current assets 1,026,927 14.53
Total Assets 7,065,632 100.00
*The counterparty for all the forward contracts is HSBC Bank plc.

ALGEBRIS UCITS FUNDS PLC
Algebris Financial Equity Fund
Unaudited Schedule of Investments
as at 30 June 2020
117
Holdings Financial Assets at Fair Value Through Profit or Loss Fair Value % of Net
EUR Asset Value
Equity Securities
Austria 3,918,329 8.33
49,191 Bawag Group 1,512,131 3.22
48,745 Erste Group Bank 1,021,208 2.17
87,326 Raiffeisen Bank International 1,384,990 2.94
Bermuda 2,061,571 4.39
52,820 Athene Holding Class A 1,466,621 3.12
16,477 Axis Capital Holdings 594,950 1.27
Italy 1,482,732 3.15
231,330 Credito Valtellinese 1,216,565 2.59
36,312 Illimity Bank 266,167 0.56
Japan 2,072,173 4.41
43,055 Dai-ichi Life Holdings 455,588 0.97
257,697 Mitsubishi UFJ Financial Group 896,049 1.91
94,858 T&D Holdings 720,536 1.53
Netherlands 4,303,021 9.15
253,593 ABN AMRO Group 1,944,044 4.13
380,603 ING Group 2,358,977 5.02
Puerto Rico 1,591,265 3.39
48,089 Popular 1,591,265 3.39
Switzerland 2,465,536 5.24
267,753 Credit Suisse Group 2,465,536 5.24
United States 12,980,359 27.61
70,908 AGNC Investment 814,309 1.73
1,634 Allegheny 711,524 1.51
19,313 Ambac Financial Group 246,205 0.52
16,442 American International Group 456,389 0.97
324,519 BGC Partners Class A 791,580 1.68
8,460 Capital One Financial Corporation 471,389 1.00
32,541 Citigroup 1,480,321 3.15
25,593 Citizens Financial Group 575,062 1.22
16,157 Cowen 233,157 0.50
80,960 Equitable Holdings 1,390,295 2.96
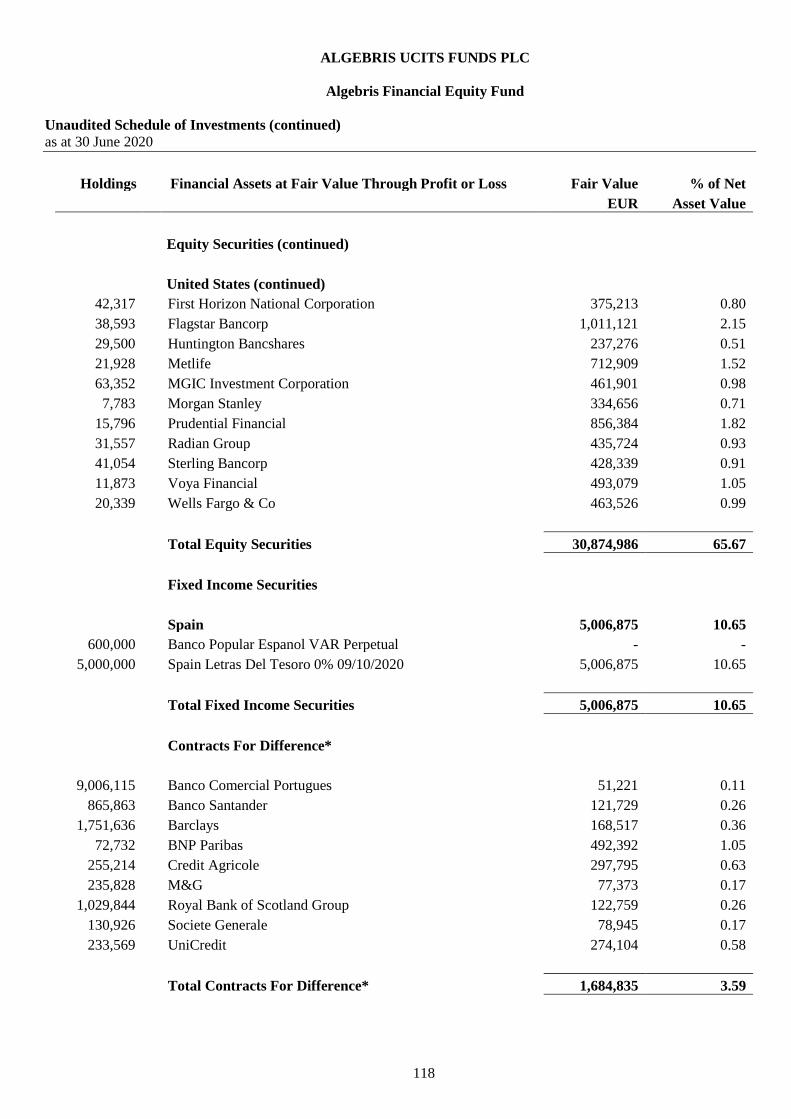
ALGEBRIS UCITS FUNDS PLC
Algebris Financial Equity Fund
Unaudited Schedule of Investments (continued)
as at 30 June 2020
118
Holdings Financial Assets at Fair Value Through Profit or Loss Fair Value % of Net
EUR Asset Value
Equity Securities (continued)
United States (continued)
42,317 First Horizon National Corporation 375,213 0.80
38,593 Flagstar Bancorp 1,011,121 2.15
29,500 Huntington Bancshares 237,276 0.51
21,928 Metlife 712,909 1.52
63,352 MGIC Investment Corporation 461,901 0.98
7,783 Morgan Stanley 334,656 0.71
15,796 Prudential Financial 856,384 1.82
31,557 Radian Group 435,724 0.93
41,054 Sterling Bancorp 428,339 0.91
11,873 Voya Financial 493,079 1.05
20,339 Wells Fargo & Co 463,526 0.99
Total Equity Securities 30,874,986 65.67
Fixed Income Securities
Spain 5,006,875 10.65
600,000 Banco Popular Espanol VAR Perpetual - -
5,000,000 Spain Letras Del Tesoro 0% 09/10/2020 5,006,875 10.65
Total Fixed Income Securities 5,006,875 10.65
Contracts For Difference*
9,006,115 Banco Comercial Portugues 51,221 0.11
865,863 Banco Santander 121,729 0.26
1,751,636 Barclays 168,517 0.36
72,732 BNP Paribas 492,392 1.05
255,214 Credit Agricole 297,795 0.63
235,828 M&G 77,373 0.17
1,029,844 Royal Bank of Scotland Group 122,759 0.26
130,926 Societe Generale 78,945 0.17
233,569 UniCredit 274,104 0.58
Total Contracts For Difference* 1,684,835 3.59
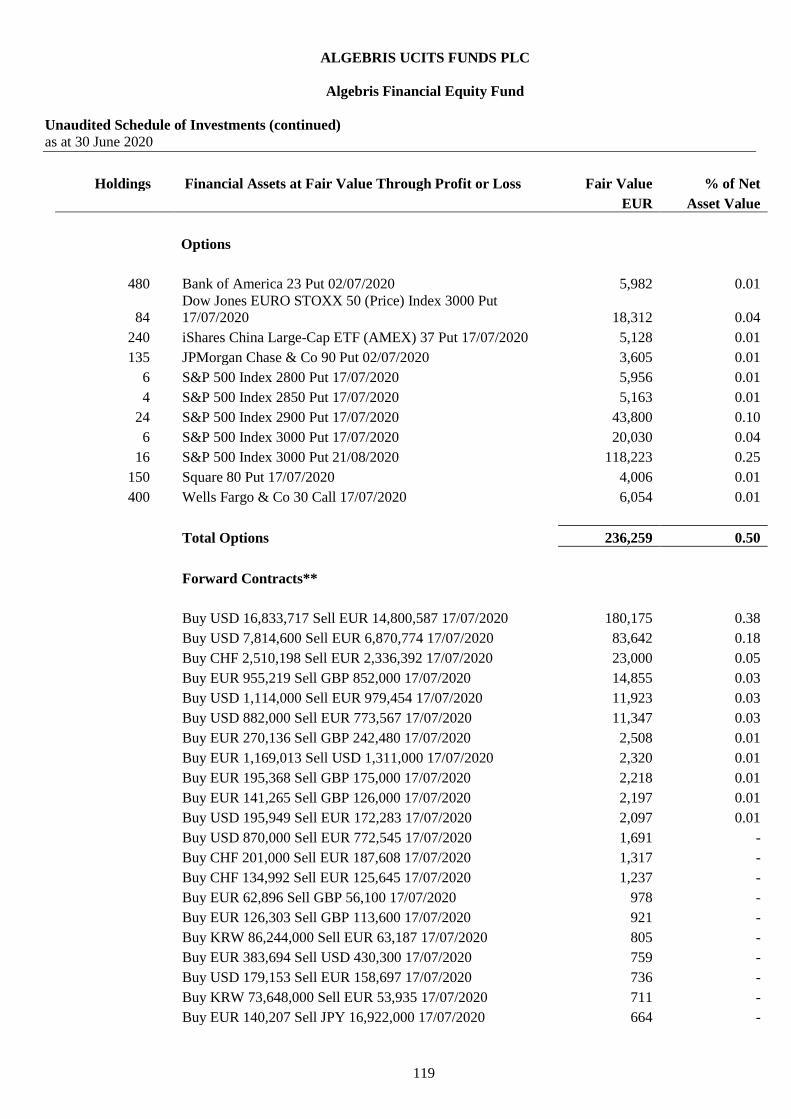
ALGEBRIS UCITS FUNDS PLC
Algebris Financial Equity Fund
Unaudited Schedule of Investments (continued)
as at 30 June 2020
119
Holdings Financial Assets at Fair Value Through Profit or Loss Fair Value % of Net
EUR Asset Value
Options
480 Bank of America 23 Put 02/07/2020 5,982 0.01
84
Dow Jones EURO STOXX 50 (Price) Index 3000 Put
17/07/2020 18,312 0.04
240 iShares China Large-Cap ETF (AMEX) 37 Put 17/07/2020 5,128 0.01
135 JPMorgan Chase & Co 90 Put 02/07/2020 3,605 0.01
6 S&P 500 Index 2800 Put 17/07/2020 5,956 0.01
4 S&P 500 Index 2850 Put 17/07/2020 5,163 0.01
24 S&P 500 Index 2900 Put 17/07/2020 43,800 0.10
6 S&P 500 Index 3000 Put 17/07/2020 20,030 0.04
16 S&P 500 Index 3000 Put 21/08/2020 118,223 0.25
150 Square 80 Put 17/07/2020 4,006 0.01
400 Wells Fargo & Co 30 Call 17/07/2020 6,054 0.01
Total Options 236,259 0.50
Forward Contracts**
Buy USD 16,833,717 Sell EUR 14,800,587 17/07/2020 180,175 0.38
Buy USD 7,814,600 Sell EUR 6,870,774 17/07/2020 83,642 0.18
Buy CHF 2,510,198 Sell EUR 2,336,392 17/07/2020 23,000 0.05
Buy EUR 955,219 Sell GBP 852,000 17/07/2020 14,855 0.03
Buy USD 1,114,000 Sell EUR 979,454 17/07/2020 11,923 0.03
Buy USD 882,000 Sell EUR 773,567 17/07/2020 11,347 0.03
Buy EUR 270,136 Sell GBP 242,480 17/07/2020 2,508 0.01
Buy EUR 1,169,013 Sell USD 1,311,000 17/07/2020 2,320 0.01
Buy EUR 195,368 Sell GBP 175,000 17/07/2020 2,218 0.01
Buy EUR 141,265 Sell GBP 126,000 17/07/2020 2,197 0.01
Buy USD 195,949 Sell EUR 172,283 17/07/2020 2,097 0.01
Buy USD 870,000 Sell EUR 772,545 17/07/2020 1,691 -
Buy CHF 201,000 Sell EUR 187,608 17/07/2020 1,317 -
Buy CHF 134,992 Sell EUR 125,645 17/07/2020 1,237 -
Buy EUR 62,896 Sell GBP 56,100 17/07/2020 978 -
Buy EUR 126,303 Sell GBP 113,600 17/07/2020 921 -
Buy KRW 86,244,000 Sell EUR 63,187 17/07/2020 805 -
Buy EUR 383,694 Sell USD 430,300 17/07/2020 759 -
Buy USD 179,153 Sell EUR 158,697 17/07/2020 736 -
Buy KRW 73,648,000 Sell EUR 53,935 17/07/2020 711 -
Buy EUR 140,207 Sell JPY 16,922,000 17/07/2020 664 -
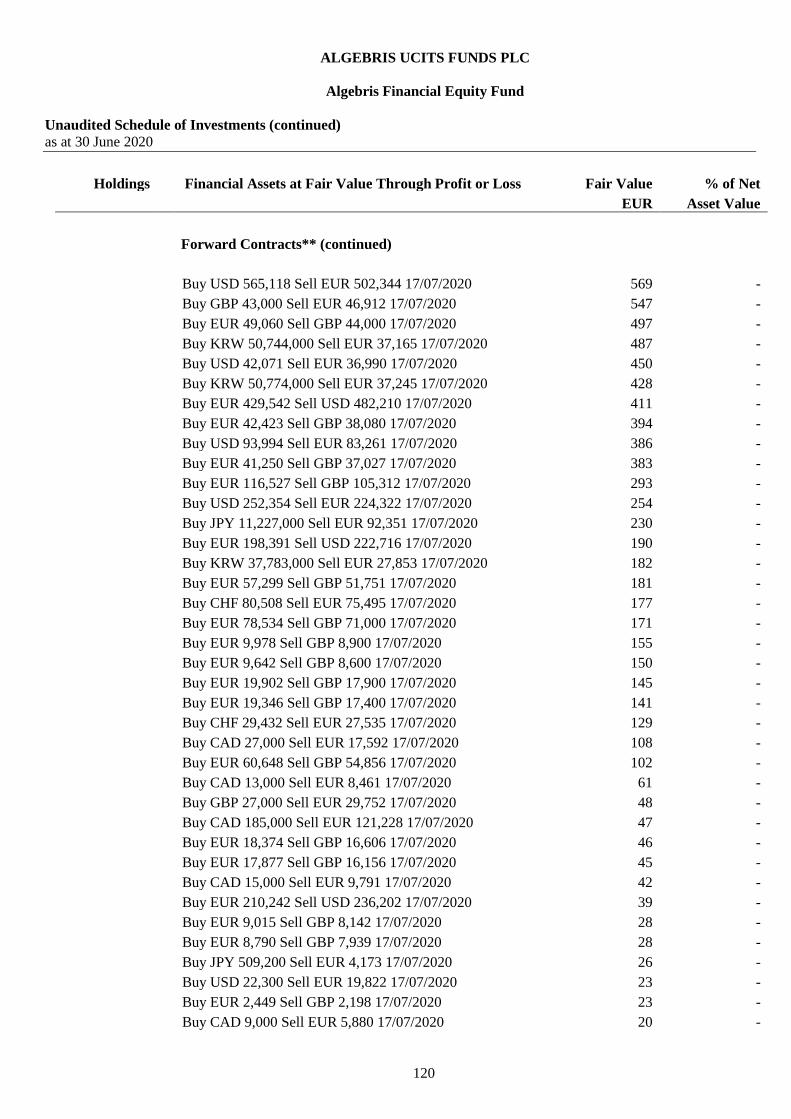
ALGEBRIS UCITS FUNDS PLC
Algebris Financial Equity Fund
Unaudited Schedule of Investments (continued)
as at 30 June 2020
120
Holdings Financial Assets at Fair Value Through Profit or Loss Fair Value % of Net
EUR Asset Value
Forward Contracts** (continued)
Buy USD 565,118 Sell EUR 502,344 17/07/2020 569 -
Buy GBP 43,000 Sell EUR 46,912 17/07/2020 547 -
Buy EUR 49,060 Sell GBP 44,000 17/07/2020 497 -
Buy KRW 50,744,000 Sell EUR 37,165 17/07/2020 487 -
Buy USD 42,071 Sell EUR 36,990 17/07/2020 450 -
Buy KRW 50,774,000 Sell EUR 37,245 17/07/2020 428 -
Buy EUR 429,542 Sell USD 482,210 17/07/2020 411 -
Buy EUR 42,423 Sell GBP 38,080 17/07/2020 394 -
Buy USD 93,994 Sell EUR 83,261 17/07/2020 386 -
Buy EUR 41,250 Sell GBP 37,027 17/07/2020 383 -
Buy EUR 116,527 Sell GBP 105,312 17/07/2020 293 -
Buy USD 252,354 Sell EUR 224,322 17/07/2020 254 -
Buy JPY 11,227,000 Sell EUR 92,351 17/07/2020 230 -
Buy EUR 198,391 Sell USD 222,716 17/07/2020 190 -
Buy KRW 37,783,000 Sell EUR 27,853 17/07/2020 182 -
Buy EUR 57,299 Sell GBP 51,751 17/07/2020 181 -
Buy CHF 80,508 Sell EUR 75,495 17/07/2020 177 -
Buy EUR 78,534 Sell GBP 71,000 17/07/2020 171 -
Buy EUR 9,978 Sell GBP 8,900 17/07/2020 155 -
Buy EUR 9,642 Sell GBP 8,600 17/07/2020 150 -
Buy EUR 19,902 Sell GBP 17,900 17/07/2020 145 -
Buy EUR 19,346 Sell GBP 17,400 17/07/2020 141 -
Buy CHF 29,432 Sell EUR 27,535 17/07/2020 129 -
Buy CAD 27,000 Sell EUR 17,592 17/07/2020 108 -
Buy EUR 60,648 Sell GBP 54,856 17/07/2020 102 -
Buy CAD 13,000 Sell EUR 8,461 17/07/2020 61 -
Buy GBP 27,000 Sell EUR 29,752 17/07/2020 48 -
Buy CAD 185,000 Sell EUR 121,228 17/07/2020 47 -
Buy EUR 18,374 Sell GBP 16,606 17/07/2020 46 -
Buy EUR 17,877 Sell GBP 16,156 17/07/2020 45 -
Buy CAD 15,000 Sell EUR 9,791 17/07/2020 42 -
Buy EUR 210,242 Sell USD 236,202 17/07/2020 39 -
Buy EUR 9,015 Sell GBP 8,142 17/07/2020 28 -
Buy EUR 8,790 Sell GBP 7,939 17/07/2020 28 -
Buy JPY 509,200 Sell EUR 4,173 17/07/2020 26 -
Buy USD 22,300 Sell EUR 19,822 17/07/2020 23 -
Buy EUR 2,449 Sell GBP 2,198 17/07/2020 23 -
Buy CAD 9,000 Sell EUR 5,880 17/07/2020 20 -

ALGEBRIS UCITS FUNDS PLC
Algebris Financial Equity Fund
Unaudited Schedule of Investments (continued)
as at 30 June 2020
121
Holdings Financial Assets at Fair Value Through Profit or Loss Fair Value % of Net
EUR Asset Value
Forward Contracts** (continued)
Buy EUR 97,287 Sell USD 109,300 17/07/2020 18 -
Buy EUR 67,517 Sell CHF 71,816 17/07/2020 16 -
Buy EUR 9,553 Sell GBP 8,641 17/07/2020 16 -
Buy EUR 9,305 Sell GBP 8,416 17/07/2020 16 -
Buy USD 2,345 Sell EUR 2,077 17/07/2020 10 -
Buy EUR 11,818 Sell GBP 10,700 17/07/2020 9 -
Buy CHF 4,317 Sell EUR 4,048 17/07/2020 9 -
Buy CHF 1,575 Sell EUR 1,473 17/07/2020 7 -
Buy USD 6,311 Sell EUR 5,610 17/07/2020 6 -
Buy KRW 44,563,000 Sell EUR 33,059 17/07/2020 6 -
Buy EUR 4,992 Sell USD 5,604 17/07/2020 5 -
Buy EUR 667 Sell GBP 600 17/07/2020 5 -
Buy EUR 336 Sell GBP 300 17/07/2020 5 -
Buy EUR 6,561 Sell CAD 10,000 17/07/2020 5 -
Buy USD 506 Sell EUR 448 17/07/2020 2 -
Buy EUR 5,902 Sell CAD 9,000 17/07/2020 2 -
Buy EUR 453 Sell GBP 409 17/07/2020 1 -
Buy EUR 499 Sell GBP 451 17/07/2020 1 -
Buy EUR 469 Sell GBP 424 17/07/2020 1 -
Buy EUR 1,068 Sell USD 1,199 17/07/2020 1 -
Buy USD 1,359 Sell EUR 1,208 17/07/2020 1 -
Buy EUR 3,644 Sell CHF 3,876 17/07/2020 1 -
Buy EUR 274 Sell JPY 33,187 17/07/2020 1 -
Buy EUR 121 Sell JPY 14,583 17/07/2020 1 -
Buy EUR 62 Sell JPY 7,478 17/07/2020 1 -
Buy EUR 60 Sell JPY 7,149 17/07/2020 1 -
Buy EUR 2,443 Sell USD 2,745 17/07/2020 - -
Buy EUR 524 Sell USD 589 17/07/2020 - -
Total Forward Contracts** 353,884 0.75
Total Financial Assets at Fair Value Through Profit or
Loss 38,156,839 81.16
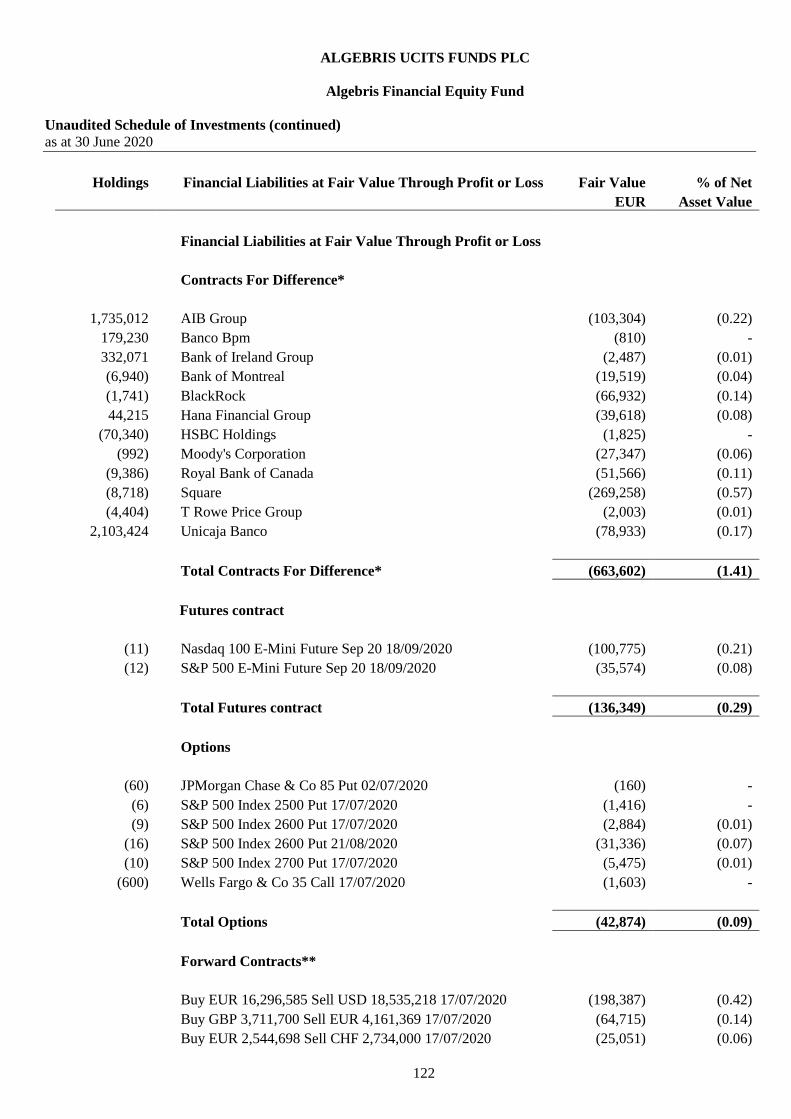
ALGEBRIS UCITS FUNDS PLC
Algebris Financial Equity Fund
Unaudited Schedule of Investments (continued)
as at 30 June 2020
122
Holdings Financial Liabilities at Fair Value Through Profit or Loss Fair Value % of Net
EUR Asset Value
Financial Liabilities at Fair Value Through Profit or Loss
Contracts For Difference*
1,735,012 AIB Group (103,304) (0.22)
179,230 Banco Bpm (810) -
332,071 Bank of Ireland Group (2,487) (0.01)
(6,940) Bank of Montreal (19,519) (0.04)
(1,741) BlackRock (66,932) (0.14)
44,215 Hana Financial Group (39,618) (0.08)
(70,340) HSBC Holdings (1,825) -
(992) Moody's Corporation (27,347) (0.06)
(9,386) Royal Bank of Canada (51,566) (0.11)
(8,718) Square (269,258) (0.57)
(4,404) T Rowe Price Group (2,003) (0.01)
2,103,424 Unicaja Banco (78,933) (0.17)
Total Contracts For Difference* (663,602) (1.41)
Futures contract
(11) Nasdaq 100 E-Mini Future Sep 20 18/09/2020 (100,775) (0.21)
(12) S&P 500 E-Mini Future Sep 20 18/09/2020 (35,574) (0.08)
Total Futures contract (136,349) (0.29)
Options
(60) JPMorgan Chase & Co 85 Put 02/07/2020 (160) -
(6) S&P 500 Index 2500 Put 17/07/2020 (1,416) -
(9) S&P 500 Index 2600 Put 17/07/2020 (2,884) (0.01)
(16) S&P 500 Index 2600 Put 21/08/2020 (31,336) (0.07)
(10) S&P 500 Index 2700 Put 17/07/2020 (5,475) (0.01)
(600) Wells Fargo & Co 35 Call 17/07/2020 (1,603) -
Total Options (42,874) (0.09)
Forward Contracts**
Buy EUR 16,296,585 Sell USD 18,535,218 17/07/2020 (198,387) (0.42)
Buy GBP 3,711,700 Sell EUR 4,161,369 17/07/2020 (64,715) (0.14)
Buy EUR 2,544,698 Sell CHF 2,734,000 17/07/2020 (25,051) (0.06)

ALGEBRIS UCITS FUNDS PLC
Algebris Financial Equity Fund
Unaudited Schedule of Investments (continued)
as at 30 June 2020
123
Holdings Financial Liabilities at Fair Value Through Profit or Loss Fair Value % of Net
EUR Asset Value
Forward Contracts** (continued)
Buy EUR 2,524,498 Sell JPY 308,048,000 17/07/2020 (15,745) (0.04)
Buy GBP 583,100 Sell EUR 653,742 17/07/2020 (10,167) (0.02)
Buy GBP 567,348 Sell EUR 636,082 17/07/2020 (9,892) (0.02)
Buy EUR 452,300 Sell USD 515,700 17/07/2020 (6,635) (0.02)
Buy EUR 1,009,074 Sell KRW 1,365,832,000 17/07/2020 (4,353) (0.01)
Buy GBP 222,000 Sell EUR 248,895 17/07/2020 (3,871) (0.01)
Buy EUR 209,881 Sell USD 239,300 17/07/2020 (3,079) (0.01)
Buy GBP 269,000 Sell EUR 299,681 17/07/2020 (2,782) (0.01)
Buy EUR 215,410 Sell USD 245,000 17/07/2020 (2,622) (0.01)
Buy EUR 978,187 Sell USD 1,101,583 17/07/2020 (2,141) (0.01)
Buy EUR 746,880 Sell USD 841,000 17/07/2020 (1,548) -
Buy GBP 119,340 Sell EUR 133,230 17/07/2020 (1,512) -
Buy EUR 99,176 Sell USD 112,800 17/07/2020 (1,207) -
Buy EUR 94,494 Sell KRW 128,962,000 17/07/2020 (1,194) -
Buy EUR 152,850 Sell CHF 163,761 17/07/2020 (1,073) -
Buy EUR 453,983 Sell USD 511,252 17/07/2020 (994) -
Buy JPY 11,999,000 Sell EUR 99,903 17/07/2020 (957) -
Buy JPY 9,833,000 Sell EUR 81,844 17/07/2020 (759) -
Buy EUR 640,022 Sell USD 720,000 17/07/2020 (725) -
Buy EUR 53,808 Sell USD 61,200 17/07/2020 (655) -
Buy GBP 40,541 Sell EUR 45,400 17/07/2020 (654) -
Buy GBP 75,000 Sell EUR 83,387 17/07/2020 (608) -
Buy EUR 71,617 Sell CHF 76,700 17/07/2020 (475) -
Buy JPY 19,136,000 Sell EUR 158,270 17/07/2020 (470) -
Buy EUR 105,535 Sell GBP 96,000 17/07/2020 (421) -
Buy GBP 142,000 Sell EUR 157,122 17/07/2020 (395) -
Buy GBP 22,000 Sell EUR 24,637 17/07/2020 (355) -
Buy EUR 34,066 Sell CHF 36,600 17/07/2020 (335) -
Buy GBP 18,900 Sell EUR 21,190 17/07/2020 (330) -
Buy EUR 220,180 Sell USD 247,735 17/07/2020 (286) -
Buy EUR 25,954 Sell CAD 40,000 17/07/2020 (268) -
Buy GBP 74,000 Sell EUR 81,933 17/07/2020 (258) -
Buy EUR 84,339 Sell CHF 90,000 17/07/2020 (254) -
Buy GBP 18,698 Sell EUR 20,874 17/07/2020 (237) -
Buy GBP 18,308 Sell EUR 20,439 17/07/2020 (232) -
Buy JPY 8,319,000 Sell EUR 68,811 17/07/2020 (211) -
Buy EUR 15,567 Sell CAD 24,000 17/07/2020 (166) -
Buy GBP 8,500 Sell EUR 9,545 17/07/2020 (164) -
Buy EUR 35,263 Sell CAD 54,000 17/07/2020 (136) -
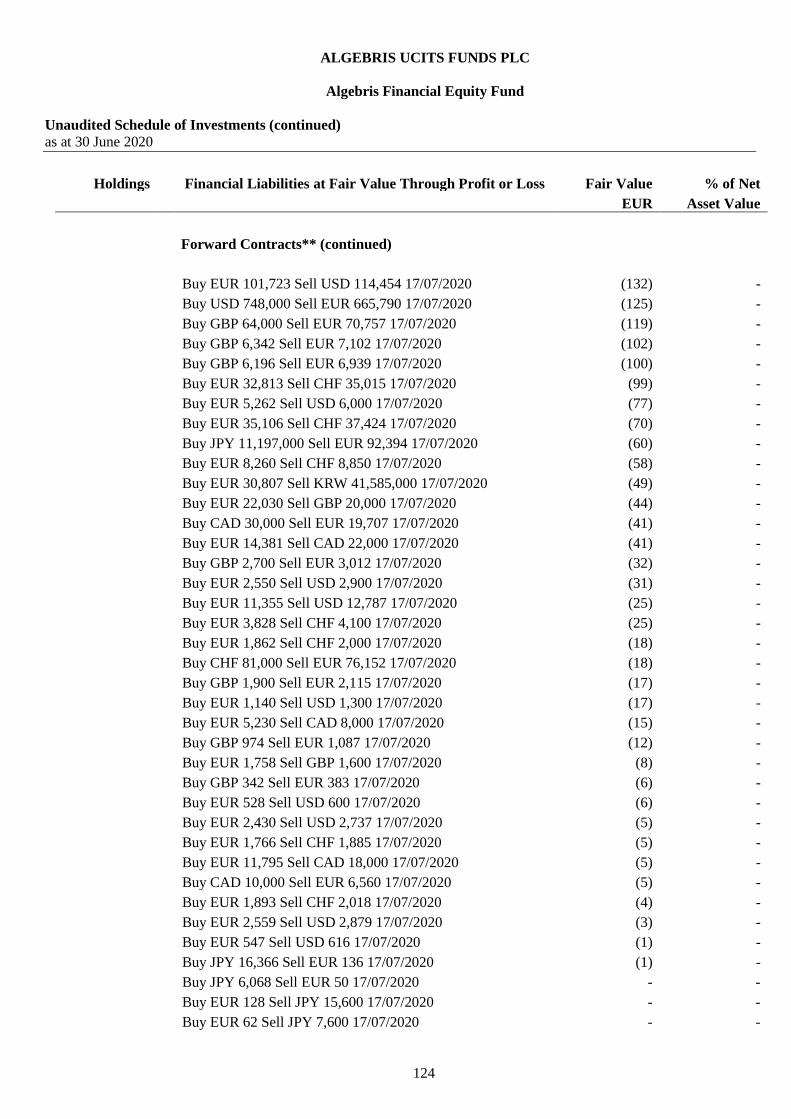
ALGEBRIS UCITS FUNDS PLC
Algebris Financial Equity Fund
Unaudited Schedule of Investments (continued)
as at 30 June 2020
124
Holdings Financial Liabilities at Fair Value Through Profit or Loss Fair Value % of Net
EUR Asset Value
Forward Contracts** (continued)
Buy EUR 101,723 Sell USD 114,454 17/07/2020 (132) -
Buy USD 748,000 Sell EUR 665,790 17/07/2020 (125) -
Buy GBP 64,000 Sell EUR 70,757 17/07/2020 (119) -
Buy GBP 6,342 Sell EUR 7,102 17/07/2020 (102) -
Buy GBP 6,196 Sell EUR 6,939 17/07/2020 (100) -
Buy EUR 32,813 Sell CHF 35,015 17/07/2020 (99) -
Buy EUR 5,262 Sell USD 6,000 17/07/2020 (77) -
Buy EUR 35,106 Sell CHF 37,424 17/07/2020 (70) -
Buy JPY 11,197,000 Sell EUR 92,394 17/07/2020 (60) -
Buy EUR 8,260 Sell CHF 8,850 17/07/2020 (58) -
Buy EUR 30,807 Sell KRW 41,585,000 17/07/2020 (49) -
Buy EUR 22,030 Sell GBP 20,000 17/07/2020 (44) -
Buy CAD 30,000 Sell EUR 19,707 17/07/2020 (41) -
Buy EUR 14,381 Sell CAD 22,000 17/07/2020 (41) -
Buy GBP 2,700 Sell EUR 3,012 17/07/2020 (32) -
Buy EUR 2,550 Sell USD 2,900 17/07/2020 (31) -
Buy EUR 11,355 Sell USD 12,787 17/07/2020 (25) -
Buy EUR 3,828 Sell CHF 4,100 17/07/2020 (25) -
Buy EUR 1,862 Sell CHF 2,000 17/07/2020 (18) -
Buy CHF 81,000 Sell EUR 76,152 17/07/2020 (18) -
Buy GBP 1,900 Sell EUR 2,115 17/07/2020 (17) -
Buy EUR 1,140 Sell USD 1,300 17/07/2020 (17) -
Buy EUR 5,230 Sell CAD 8,000 17/07/2020 (15) -
Buy GBP 974 Sell EUR 1,087 17/07/2020 (12) -
Buy EUR 1,758 Sell GBP 1,600 17/07/2020 (8) -
Buy GBP 342 Sell EUR 383 17/07/2020 (6) -
Buy EUR 528 Sell USD 600 17/07/2020 (6) -
Buy EUR 2,430 Sell USD 2,737 17/07/2020 (5) -
Buy EUR 1,766 Sell CHF 1,885 17/07/2020 (5) -
Buy EUR 11,795 Sell CAD 18,000 17/07/2020 (5) -
Buy CAD 10,000 Sell EUR 6,560 17/07/2020 (5) -
Buy EUR 1,893 Sell CHF 2,018 17/07/2020 (4) -
Buy EUR 2,559 Sell USD 2,879 17/07/2020 (3) -
Buy EUR 547 Sell USD 616 17/07/2020 (1) -
Buy JPY 16,366 Sell EUR 136 17/07/2020 (1) -
Buy JPY 6,068 Sell EUR 50 17/07/2020 - -
Buy EUR 128 Sell JPY 15,600 17/07/2020 - -
Buy EUR 62 Sell JPY 7,600 17/07/2020 - -
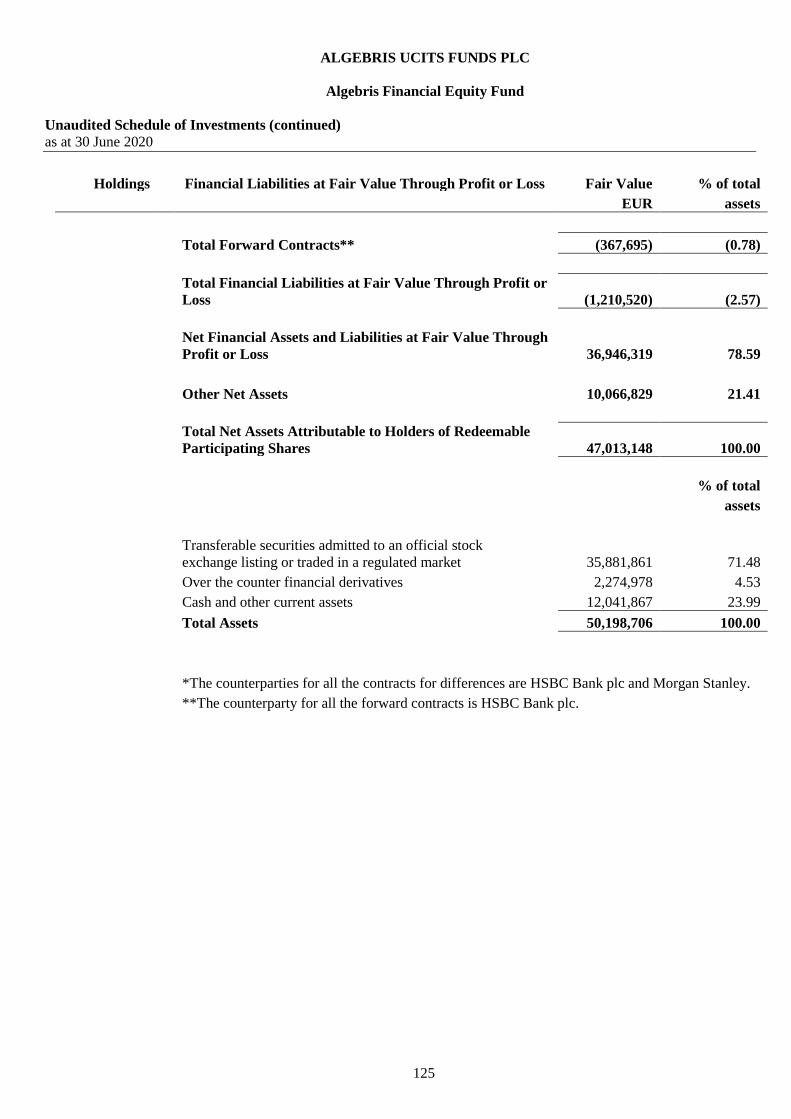
ALGEBRIS UCITS FUNDS PLC
Algebris Financial Equity Fund
Unaudited Schedule of Investments (continued)
as at 30 June 2020
125
Holdings Financial Liabilities at Fair Value Through Profit or Loss Fair Value % of total
EUR assets
Total Forward Contracts** (367,695) (0.78)
Total Financial Liabilities at Fair Value Through Profit or
Loss (1,210,520) (2.57)
Net Financial Assets and Liabilities at Fair Value Through
Profit or Loss 36,946,319 78.59
Other Net Assets 10,066,829 21.41
Total Net Assets Attributable to Holders of Redeemable
Participating Shares 47,013,148 100.00
% of total
assets
Transferable securities admitted to an official stock
exchange listing or traded in a regulated market 35,881,861 71.48
Over the counter financial derivatives 2,274,978 4.53
Cash and other current assets 12,041,867 23.99
Total Assets 50,198,706 100.00
*The counterparties for all the contracts for differences are HSBC Bank plc and Morgan Stanley.
**The counterparty for all the forward contracts is HSBC Bank plc.

ALGEBRIS UCITS FUNDS PLC
Algebris Global Credit Opportunities Fund
Unaudited Schedule of Investments
as at 30 June 2020
126
Holdings Financial Assets at Fair Value Through Profit or Loss Fair Value % of Net
EUR Asset Value
Italy 1,598,473 0.33
303,950 Credito Valtellinese 1,598,473 0.33
Total Equity Securities 1,598,473 0.33
Fixed Income Securities
Argentina 1,525,370 0.31
3,850,000 Provincia De Buenos Aire STP 15/05/2035 1,525,370 0.31
Austria 2,270,449 0.47
1,400,000 Bawag Group 1,292,319 0.27
1,000,000 Erste Group Bank Perpetual 978,130 0.20
Brazil 1,719,680 0.36
2,000,000 Federal Republic of Brazil 3.875% 12/06/2030 1,719,680 0.36
Canada 965,904 0.20
1,000,000 Air Canada Convertible 4% 01/07/2025 965,904 0.20
Cayman Islands 9,908,474 2.05
1,000,000 Central China Real Estate 6.875% 10/02/2021 890,781 0.18
1,000,000 Central China Real Estate 7.65% 27/08/2023 883,123 0.18
1,000,000 Central China Real Estate 8.75% 23/01/2021 908,618 0.19
200,000 Country Garden Holdings 5.4% 27/05/2025 185,210 0.04
1,000,000 Country Garden Holdings 7.25% 04/04/2021 896,724 0.19
2,000,000 Dar Al-arkan Sukuk 6.875% 26/02/2027 1,512,766 0.31
2,000,000 Fantasia Holdings Group 8.375% 08/03/2021 1,786,880 0.37
2,000,000 Fantasia Holdings Group 11.875% 01/06/2023 1,819,304 0.38
1,000,000 Kaisa Group Holdings 6.75% 18/02/2021 889,317 0.18
170,000 Nb Finance 0% 13/07/2045 47,494 0.01
1,113,286 Odbrcht Offshore Drill Finance 7.72% 01/12/2026 87,077 0.02
151,439 Odebrecht Oil & Finance 0% Perpetual 1,180 -
Channel Island 655,165 0.14
1,000,000 Eagle Interest Glo/Ruyi 5.375% 01/05/2023 655,165 0.14
Ecuador 2,772,152 0.57
500,000 Republic of Ecuador 7.875% 27/03/2025 196,408 0.04
7,000,000 Republic of Ecuador 7.875% 23/01/2028 2,575,744 0.53
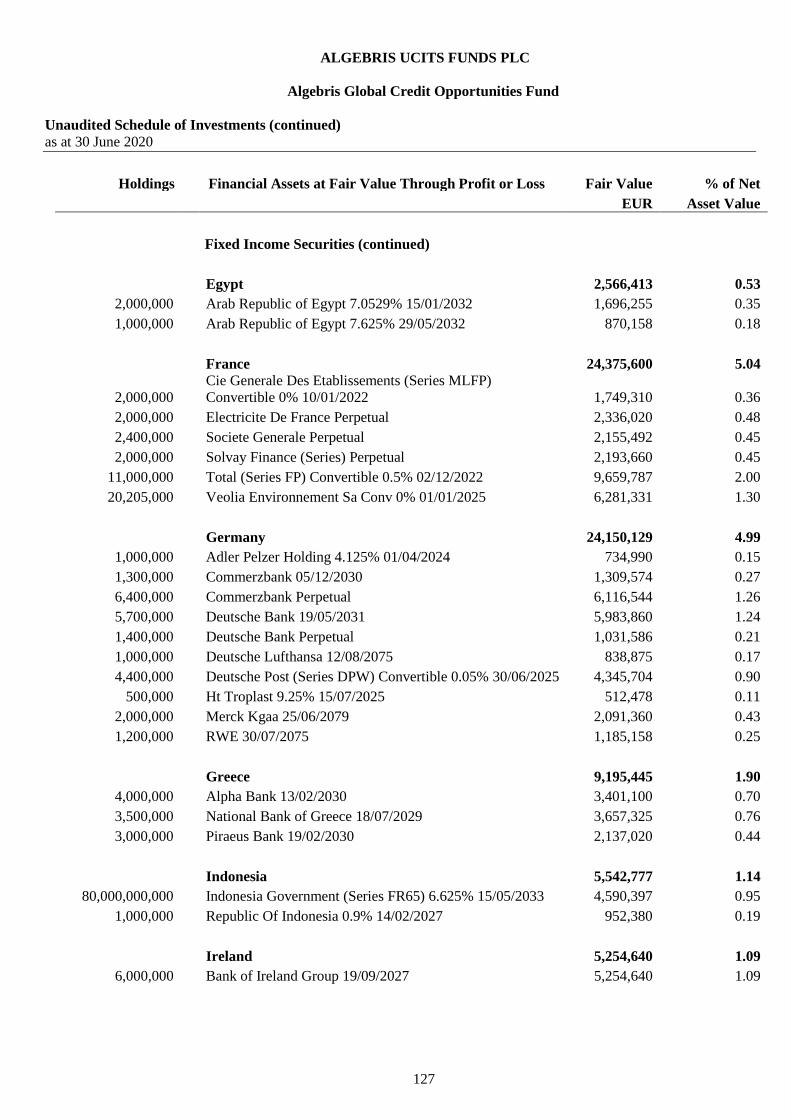
ALGEBRIS UCITS FUNDS PLC
Algebris Global Credit Opportunities Fund
Unaudited Schedule of Investments (continued)
as at 30 June 2020
127
Holdings Financial Assets at Fair Value Through Profit or Loss Fair Value % of Net
EUR Asset Value
Fixed Income Securities (continued)
Egypt 2,566,413 0.53
2,000,000 Arab Republic of Egypt 7.0529% 15/01/2032 1,696,255 0.35
1,000,000 Arab Republic of Egypt 7.625% 29/05/2032 870,158 0.18
France 24,375,600 5.04
2,000,000
Cie Generale Des Etablissements (Series MLFP)
Convertible 0% 10/01/2022 1,749,310 0.36
2,000,000 Electricite De France Perpetual 2,336,020 0.48
2,400,000 Societe Generale Perpetual 2,155,492 0.45
2,000,000 Solvay Finance (Series) Perpetual 2,193,660 0.45
11,000,000 Total (Series FP) Convertible 0.5% 02/12/2022 9,659,787 2.00
20,205,000 Veolia Environnement Sa Conv 0% 01/01/2025 6,281,331 1.30
Germany 24,150,129 4.99
1,000,000 Adler Pelzer Holding 4.125% 01/04/2024 734,990 0.15
1,300,000 Commerzbank 05/12/2030 1,309,574 0.27
6,400,000 Commerzbank Perpetual 6,116,544 1.26
5,700,000 Deutsche Bank 19/05/2031 5,983,860 1.24
1,400,000 Deutsche Bank Perpetual 1,031,586 0.21
1,000,000 Deutsche Lufthansa 12/08/2075 838,875 0.17
4,400,000 Deutsche Post (Series DPW) Convertible 0.05% 30/06/2025 4,345,704 0.90
500,000 Ht Troplast 9.25% 15/07/2025 512,478 0.11
2,000,000 Merck Kgaa 25/06/2079 2,091,360 0.43
1,200,000 RWE 30/07/2075 1,185,158 0.25
Greece 9,195,445 1.90
4,000,000 Alpha Bank 13/02/2030 3,401,100 0.70
3,500,000 National Bank of Greece 18/07/2029 3,657,325 0.76
3,000,000 Piraeus Bank 19/02/2030 2,137,020 0.44
Indonesia 5,542,777 1.14
80,000,000,000 Indonesia Government (Series FR65) 6.625% 15/05/2033 4,590,397 0.95
1,000,000 Republic Of Indonesia 0.9% 14/02/2027 952,380 0.19
Ireland 5,254,640 1.09
6,000,000 Bank of Ireland Group 19/09/2027 5,254,640 1.09

ALGEBRIS UCITS FUNDS PLC
Algebris Global Credit Opportunities Fund
Unaudited Schedule of Investments (continued)
as at 30 June 2020
128
Holdings Financial Assets at Fair Value Through Profit or Loss Fair Value % of Net
EUR Asset Value
Fixed Income Securities (continued)
Italy 42,918,318 8.87
3,000,000 Banca Monte Dei Paschi 10.5% 23/07/2029 3,319,005 0.69
4,700,000 Banca Monte Dei Paschi VAR 18/01/2028 4,220,130 0.87
4,000,000 Banco BPM Perpetual 3,461,780 0.72
4,000,000 Banco Bpm SPA Perpetual 3,053,600 0.63
2,000 Buoni Poliennali Del Tesoro 3.85% 01/09/2049 2,704 -
2,546,000 CMF 9% 15/06/2022 2,485,252 0.51
4,500,000 Cooperativa Muratori & C 6% 15/02/2023 111,893 0.02
6,500,000 Cooperativa Muratori & C 6.875% 01/08/2022 182,195 0.04
1,341,000 Credito Valtellinese VAR 12/04/2027 1,358,017 0.28
5,000,000 Eni (Series ENI) Convertible 0% 13/04/2022 4,909,650 1.01
4,000,000 Intesa Sanpaolo Perpetual 3,232,800 0.67
8,600,000 Intesa Sanpaolo Perpetual (BG1868226) 6,951,208 1.44
400,000 Officine Maccaferri 5.75% 01/06/2021 145,700 0.03
6,000,000 Telecom Italia SPA Convertible 1.125% 26/03/2022 5,871,450 1.21
1,900,000 Unicredit SPA 30/06/2035 1,703,704 0.35
2,000,000 Unione Di Banche Italian Perpetual 1,909,230 0.40
Jersey 2,550,610 0.53
2,800,000 Aston Martin Capital Holdings 12% 15/04/2022 (PIK) 2,550,610 0.53
Latvia 707,184 0.15
846,000 Air Baltic Corporation 6.75% 30/07/2024 707,184 0.15
Liberia 1,665,849 0.34
2,000,000 Royal Caribbean Cruises Convertible 4.25% 15/06/2023 1,665,849 0.34
Luxembourg 56,117,143 11.59
2,700,000 Aggregate Holdings 5% 10/08/2021 2,562,462 0.53
5,500,000 Altice Finco (144A) 7.625% 15/02/2025 5,106,248 1.05
2,000,000 Altice France Holding (144A) 10.5% 15/05/2027 1,970,518 0.41
2,000,000 Cabot Financial Luxembourg 7.5% 01/10/2023 2,226,588 0.46
1,600,000
Citigroup Global Market Fund (Series TKA) Convertible
0.5% 04/08/2023 1,634,136 0.34
850,000 Codere Finance 2 Luxembourg (144A) 7.625% 01/11/2021 499,096 0.10
1,450,000 Codere Finance 2 Luxembourg 6.75% 01/11/2021 953,912 0.20
3,400,000 Codere Finance 2 Luxembourg 7.625% 01/11/2021 1,996,384 0.41
7,200,000 Crystal Almond Sarl 4.25% 15/10/2024 7,109,928 1.47
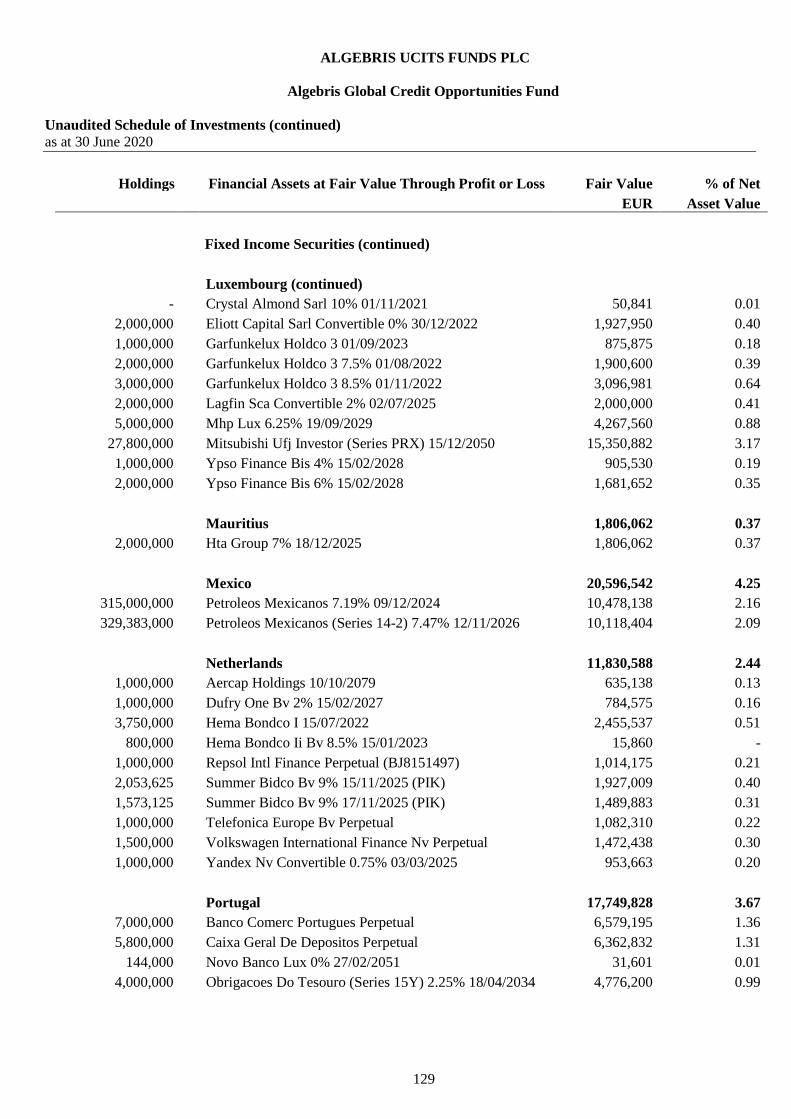
ALGEBRIS UCITS FUNDS PLC
Algebris Global Credit Opportunities Fund
Unaudited Schedule of Investments (continued)
as at 30 June 2020
129
Holdings Financial Assets at Fair Value Through Profit or Loss Fair Value % of Net
EUR Asset Value
Fixed Income Securities (continued)
Luxembourg (continued)
- Crystal Almond Sarl 10% 01/11/2021 50,841 0.01
2,000,000 Eliott Capital Sarl Convertible 0% 30/12/2022 1,927,950 0.40
1,000,000 Garfunkelux Holdco 3 01/09/2023 875,875 0.18
2,000,000 Garfunkelux Holdco 3 7.5% 01/08/2022 1,900,600 0.39
3,000,000 Garfunkelux Holdco 3 8.5% 01/11/2022 3,096,981 0.64
2,000,000 Lagfin Sca Convertible 2% 02/07/2025 2,000,000 0.41
5,000,000 Mhp Lux 6.25% 19/09/2029 4,267,560 0.88
27,800,000 Mitsubishi Ufj Investor (Series PRX) 15/12/2050 15,350,882 3.17
1,000,000 Ypso Finance Bis 4% 15/02/2028 905,530 0.19
2,000,000 Ypso Finance Bis 6% 15/02/2028 1,681,652 0.35
Mauritius 1,806,062 0.37
2,000,000 Hta Group 7% 18/12/2025 1,806,062 0.37
Mexico 20,596,542 4.25
315,000,000 Petroleos Mexicanos 7.19% 09/12/2024 10,478,138 2.16
329,383,000 Petroleos Mexicanos (Series 14-2) 7.47% 12/11/2026 10,118,404 2.09
Netherlands 11,830,588 2.44
1,000,000 Aercap Holdings 10/10/2079 635,138 0.13
1,000,000 Dufry One Bv 2% 15/02/2027 784,575 0.16
3,750,000 Hema Bondco I 15/07/2022 2,455,537 0.51
800,000 Hema Bondco Ii Bv 8.5% 15/01/2023 15,860 -
1,000,000 Repsol Intl Finance Perpetual (BJ8151497) 1,014,175 0.21
2,053,625 Summer Bidco Bv 9% 15/11/2025 (PIK) 1,927,009 0.40
1,573,125 Summer Bidco Bv 9% 17/11/2025 (PIK) 1,489,883 0.31
1,000,000 Telefonica Europe Bv Perpetual 1,082,310 0.22
1,500,000 Volkswagen International Finance Nv Perpetual 1,472,438 0.30
1,000,000 Yandex Nv Convertible 0.75% 03/03/2025 953,663 0.20
Portugal 17,749,828 3.67
7,000,000 Banco Comerc Portugues Perpetual 6,579,195 1.36
5,800,000 Caixa Geral De Depositos Perpetual 6,362,832 1.31
144,000 Novo Banco Lux 0% 27/02/2051 31,601 0.01
4,000,000 Obrigacoes Do Tesouro (Series 15Y) 2.25% 18/04/2034 4,776,200 0.99
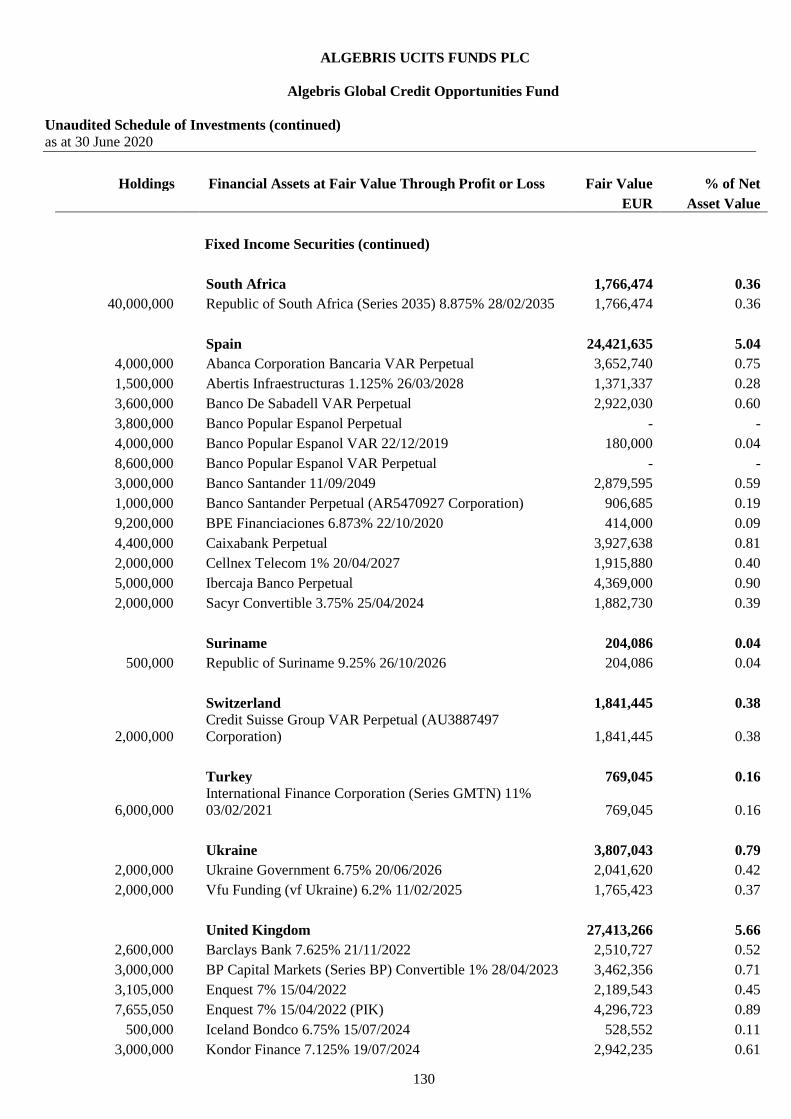
ALGEBRIS UCITS FUNDS PLC
Algebris Global Credit Opportunities Fund
Unaudited Schedule of Investments (continued)
as at 30 June 2020
130
Holdings Financial Assets at Fair Value Through Profit or Loss Fair Value % of Net
EUR Asset Value
Fixed Income Securities (continued)
South Africa 1,766,474 0.36
40,000,000 Republic of South Africa (Series 2035) 8.875% 28/02/2035 1,766,474 0.36
Spain 24,421,635 5.04
4,000,000 Abanca Corporation Bancaria VAR Perpetual 3,652,740 0.75
1,500,000 Abertis Infraestructuras 1.125% 26/03/2028 1,371,337 0.28
3,600,000 Banco De Sabadell VAR Perpetual 2,922,030 0.60
3,800,000 Banco Popular Espanol Perpetual - -
4,000,000 Banco Popular Espanol VAR 22/12/2019 180,000 0.04
8,600,000 Banco Popular Espanol VAR Perpetual - -
3,000,000 Banco Santander 11/09/2049 2,879,595 0.59
1,000,000 Banco Santander Perpetual (AR5470927 Corporation) 906,685 0.19
9,200,000 BPE Financiaciones 6.873% 22/10/2020 414,000 0.09
4,400,000 Caixabank Perpetual 3,927,638 0.81
2,000,000 Cellnex Telecom 1% 20/04/2027 1,915,880 0.40
5,000,000 Ibercaja Banco Perpetual 4,369,000 0.90
2,000,000 Sacyr Convertible 3.75% 25/04/2024 1,882,730 0.39
Suriname 204,086 0.04
500,000 Republic of Suriname 9.25% 26/10/2026 204,086 0.04
Switzerland 1,841,445 0.38
2,000,000
Credit Suisse Group VAR Perpetual (AU3887497
Corporation) 1,841,445 0.38
Turkey 769,045 0.16
6,000,000
International Finance Corporation (Series GMTN) 11%
03/02/2021 769,045 0.16
Ukraine 3,807,043 0.79
2,000,000 Ukraine Government 6.75% 20/06/2026 2,041,620 0.42
2,000,000 Vfu Funding (vf Ukraine) 6.2% 11/02/2025 1,765,423 0.37
United Kingdom 27,413,266 5.66
2,600,000 Barclays Bank 7.625% 21/11/2022 2,510,727 0.52
3,000,000 BP Capital Markets (Series BP) Convertible 1% 28/04/2023 3,462,356 0.71
3,105,000 Enquest 7% 15/04/2022 2,189,543 0.45
7,655,050 Enquest 7% 15/04/2022 (PIK) 4,296,723 0.89
500,000 Iceland Bondco 6.75% 15/07/2024 528,552 0.11
3,000,000 Kondor Finance 7.125% 19/07/2024 2,942,235 0.61

ALGEBRIS UCITS FUNDS PLC
Algebris Global Credit Opportunities Fund
Unaudited Schedule of Investments (continued)
as at 30 June 2020
131
Holdings Financial Assets at Fair Value Through Profit or Loss Fair Value % of Net
EUR Asset Value
Fixed Income Securities (continued)
United Kingdom (continued)
1,000,000 Legal & General Group 11/01/2050 1,139,923 0.23
2,500,000 Matalan Finance 6.75% 31/01/2023 1,967,055 0.41
2,650,000 Ote (Series GMTN) 0.875% 24/09/2026 2,608,143 0.54
4,650,000 Royal Bank of Scotland Group (Series U) Perpetual 3,808,779 0.79
2,000,000 Virgin Media Finance 3.75% 15/07/2030 1,959,230 0.40
United States 56,250,938 11.62
1,110,000 Adient US LLC (144A) 7% 15/05/2026 1,024,117 0.21
2,000,000
Apollo Commercial Real Estate Finance Convertible 4.75%
23/08/2022 1,553,459 0.32
100,000 Aviation Capital Group (144A) 4.125% 01/08/2025 80,214 0.02
1,500,000 Chesapeake Energy (144A) Convertible 5.5% 15/09/2026 38,792 0.01
1,000,000 Commerzbank 8.125% 19/09/2023 1,001,785 0.21
1,000,000 Encore Capital Group Convertible 2.875% 15/03/2021 867,978 0.18
2,000,000 Ford Motor Company 9% 22/04/2025 1,929,004 0.40
3,000,000 General Electric (Series D) Perpetual 2,100,107 0.43
1,000,000 Hubspot Convertible 0.375% 01/06/2025 959,891 0.20
1,000,000 JPMorgan Chase Bank Convertible 0% 24/05/2022 1,055,395 0.22
3,000,000 JPMorgan Chase Bank Convertible 0.125% 01/01/2023 2,854,313 0.59
5,000,000 Palo Alto Networks Convertible 0.375% 01/06/2025 4,427,780 0.91
1,000,000 Ringcentral Convertible 0% 01/03/2025 948,099 0.20
3,216,000 Sanchez Energy 6.125% 15/01/2023 17,178 -
885,000 Toys R US 7.375% 15/10/2018 11,818 -
40,000,000 US Treasury Note 1.125% 28/02/2022 36,174,108 7.47
1,500,000 Vistajet Malta/Xo Management 10.5% 01/06/2024 1,206,900 0.25
Venezuela 221,261 0.05
3,170,000 Petroleos DE Venezuela S 6% 16/05/2024 71,256 0.02
2,000,000 Petroleos DE Venezuela S 6% 15/11/2026 44,957 0.01
2,000,000 Petroleos De Venezuela S 9% 17/11/2021 44,957 0.01
1,000,000 Venezuela 12.75% 23/08/2022 60,091 0.01
Total Fixed Income Securities 363,539,515 75.10

ALGEBRIS UCITS FUNDS PLC
Algebris Global Credit Opportunities Fund
Unaudited Schedule of Investments (continued)
as at 30 June 2020
132
Holdings Financial Assets at Fair Value Through Profit or Loss Fair Value % of Net
EUR Asset Value
Options
24,193,548 AUD Put / USD Call 0.62 63,204 0.01
1,922 DAX Index (9500/7250) 18/09/2020 98,182 0.02
7,250
Dow Jones EURO STOXX 50 (Price) Index 21/08/2020
(2550/1950) 86,816 0.02
300
Dow Jones EURO STOXX 50 (Price) Index 2500 Put
21/08/2020 44,400 0.01
350
Dow Jones EURO STOXX 50 (Price) Index 2600 Put
18/09/2020 127,225 0.03
9,279
Dual Binary Option Dow Jones EURO STOXX 50 (Price)
Index (3450) EUR/USD (1.15) 21/08/2020 263,944 0.05
8,886
Dual Binary Option S&P 500 Index (3500) iShares Physical
Gold ETC ETF (32.5) 18/09/2020 58,250 0.01
10,000,000 EUR Call / MXN Put 27.5 16/09/2020 152,425 0.03
15,000,000
EUR Call / MXN Put 27.5 11/27/2020 Knock Out Option
27.4 1,598 -
15,000,000 EUR Call / MXN Put 27.75 16/07/2020 25,365 -
10,000,000 EUR Call / MXN Put 29.5 16/09/2020 62,449 0.01
15,000,000 EUR Call / RUB Put 83 16/09/2020 305,988 0.06
15,000,000 EUR Call / RUB Put 88 05/10/2020 126,410 0.03
10,000,000 EUR Call / RUB Put 91.5 16/09/2020 (500024800) 43,360 0.01
20,000,000 EUR Call / RUB Put 91.5 16/09/2020 (500024842) 65,028 0.01
10,000,000 EUR Call / RUB Put 91.5 16/09/2020 (500024855) 34,066 0.01
30,000,000 EUR Call / USD Put 1.16 30/11/2020 134,153 0.03
10,000,000 EUR Call / ZAR Put 22 15/07/2020 811 -
636,336 iShares Physical Gold ETC ETF 18/09/2020 (37/42) 137,045 0.03
300,143 iShares Physical Gold ETC ETF 18/12/2020 (36/36) 238,130 0.05
579,710 iShares Physical Gold ETC ETF 18/12/2020 (37/37) 209,329 0.04
4,000 iShares Physical Gold ETC ETF 36 Call 18/09/2020 267,070 0.06
3,000 iShares Physical Gold ETC ETF 37 Call 18/12/2020 296,448 0.06
3,000 iShares Physical Gold ETC ETF 39 Call 18/12/2020 190,460 0.04
100,000,000
iTraxx Europe Crossover Index Series 33 Ver 1 5 Yr Credit
Default Swap Index 5% 20/06/2025 (BNPOTC) 6.5% Put
09/16/2020 570,833 0.12
50,000,000
iTraxx Europe Crossover Index Series 33 Ver 1 5 Yr Credit
Default Swap Index 5% 20/06/2025 (JPMOTC) 6.5% Put
09/16/2020 146,699 0.03
50,000,000
iTraxx Europe Crossover Index Series 33 Ver 1 5 Yr Credit
Default Swap Index 5% 20/06/2025 (MLOTC) 6.5% Put
09/16/2020 285,416 0.06
20,700 Russell 2000 Index 1000 Put 18/09/2020 168,323 0.03
8,020 S&P 500 Index 02/07/2020 (2700/2700) 513,418 0.11
6,450 S&P 500 Index 09/07/2020 (2800/2800) 466,489 0.10
6,520 S&P 500 Index 17/07/2020 (2800/2800) 373,517 0.08
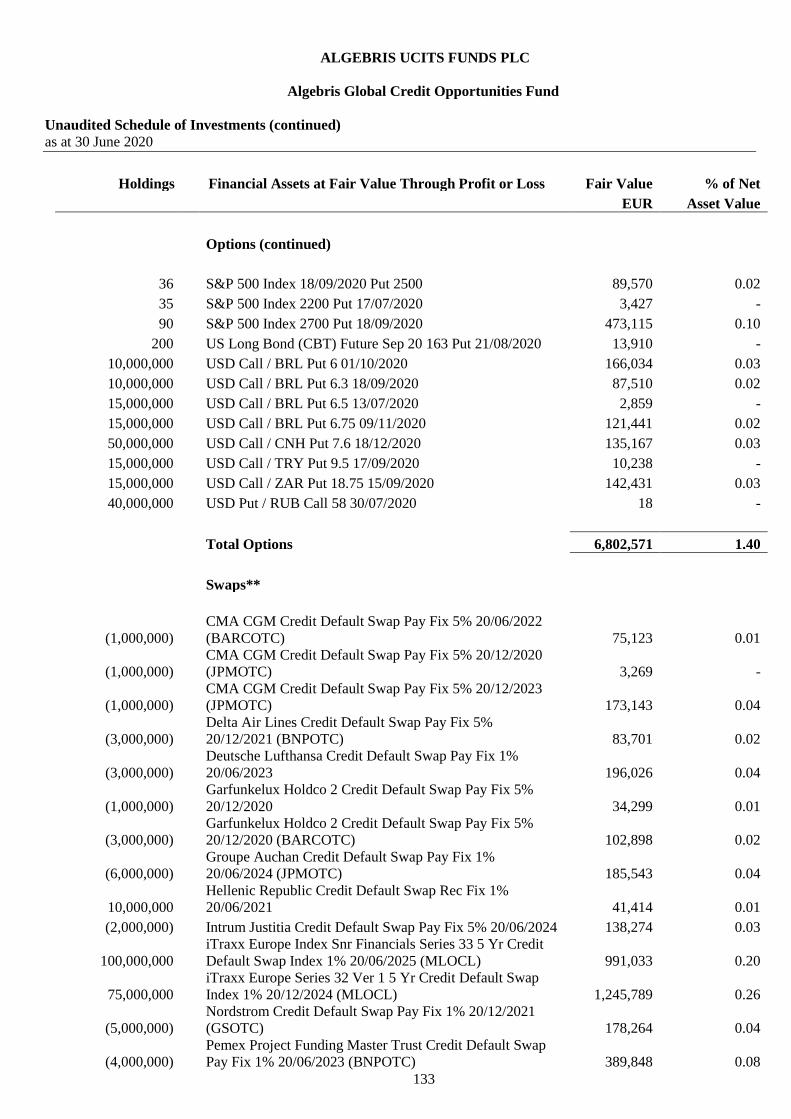
ALGEBRIS UCITS FUNDS PLC
Algebris Global Credit Opportunities Fund
Unaudited Schedule of Investments (continued)
as at 30 June 2020
133
Holdings Financial Assets at Fair Value Through Profit or Loss Fair Value % of Net
EUR Asset Value
Options (continued)
36 S&P 500 Index 18/09/2020 Put 2500 89,570 0.02
35 S&P 500 Index 2200 Put 17/07/2020 3,427 -
90 S&P 500 Index 2700 Put 18/09/2020 473,115 0.10
200 US Long Bond (CBT) Future Sep 20 163 Put 21/08/2020 13,910 -
10,000,000 USD Call / BRL Put 6 01/10/2020 166,034 0.03
10,000,000 USD Call / BRL Put 6.3 18/09/2020 87,510 0.02
15,000,000 USD Call / BRL Put 6.5 13/07/2020 2,859 -
15,000,000 USD Call / BRL Put 6.75 09/11/2020 121,441 0.02
50,000,000 USD Call / CNH Put 7.6 18/12/2020 135,167 0.03
15,000,000 USD Call / TRY Put 9.5 17/09/2020 10,238 -
15,000,000 USD Call / ZAR Put 18.75 15/09/2020 142,431 0.03
40,000,000 USD Put / RUB Call 58 30/07/2020 18 -
Total Options 6,802,571 1.40
Swaps**
(1,000,000)
CMA CGM Credit Default Swap Pay Fix 5% 20/06/2022
(BARCOTC) 75,123 0.01
(1,000,000)
CMA CGM Credit Default Swap Pay Fix 5% 20/12/2020
(JPMOTC) 3,269 -
(1,000,000)
CMA CGM Credit Default Swap Pay Fix 5% 20/12/2023
(JPMOTC) 173,143 0.04
(3,000,000)
Delta Air Lines Credit Default Swap Pay Fix 5%
20/12/2021 (BNPOTC) 83,701 0.02
(3,000,000)
Deutsche Lufthansa Credit Default Swap Pay Fix 1%
20/06/2023 196,026 0.04
(1,000,000)
Garfunkelux Holdco 2 Credit Default Swap Pay Fix 5%
20/12/2020 34,299 0.01
(3,000,000)
Garfunkelux Holdco 2 Credit Default Swap Pay Fix 5%
20/12/2020 (BARCOTC) 102,898 0.02
(6,000,000)
Groupe Auchan Credit Default Swap Pay Fix 1%
20/06/2024 (JPMOTC) 185,543 0.04
10,000,000
Hellenic Republic Credit Default Swap Rec Fix 1%
20/06/2021 41,414 0.01
(2,000,000) Intrum Justitia Credit Default Swap Pay Fix 5% 20/06/2024 138,274 0.03
100,000,000
iTraxx Europe Index Snr Financials Series 33 5 Yr Credit
Default Swap Index 1% 20/06/2025 (MLOCL) 991,033 0.20
75,000,000
iTraxx Europe Series 32 Ver 1 5 Yr Credit Default Swap
Index 1% 20/12/2024 (MLOCL) 1,245,789 0.26
(5,000,000)
Nordstrom Credit Default Swap Pay Fix 1% 20/12/2021
(GSOTC) 178,264 0.04
(4,000,000)
Pemex Project Funding Master Trust Credit Default Swap
Pay Fix 1% 20/06/2023 (BNPOTC) 389,848 0.08

ALGEBRIS UCITS FUNDS PLC
Algebris Global Credit Opportunities Fund
Unaudited Schedule of Investments (continued)
as at 30 June 2020
134
Holdings Financial Assets at Fair Value Through Profit or Loss Fair Value % of Net
EUR Asset Value
Swaps** (continued)
(5,000,000)
Pemex Project Funding Master Trust Credit Default Swap
Pay Fix 1% 20/06/2023 (JPMOTC) 487,310 0.10
(2,000,000)
Pemex Project Funding Master Trust Credit Default Swap
Rec Fix 1% 20/06/2025 348,337 0.07
(1,000,000)
Royal Caribbean Cruises Credit Default Swap Pay Fix 5%
20/06/2022 (GSOTC) 183,737 0.04
(2,000,000)
Telecom Italia Credit Default Swap Pay Fix 1% 20/06/2022
(JPMOTC) 15,221 -
(2,000,000)
Telecom Italia Credit Default Swap Pay Fix 1% 20/06/2022
(MLOTC) 15,221 -
(4,000,000) Tesla Credit Default Swap Pay Fix 1% 20/06/2023 122,719 0.02
(5,000,000) Tui Credit Default Swap Pay Fix 5% 20/12/2021 (GSOTC) 917,273 0.19
(2,000,000) Tui Credit Default Swap Pay Fix 5% 20/06/2024 (BNPOTC) 459,875 0.10
(500,000) Tui Credit Default Swap Pay Fix 5% 20/06/2024 (JPMOTC) 114,969 0.02
(10,000,000)
United Mexican States Credit Default Swap Pay Fix 1%
20/06/2025 (MSIOTC) 237,153 0.05
(2,000,000)
Vue International Bidco Credit Default Swap Pay Fix 5%
20/06/2022 (JPMOTC) 175,129 0.04
Total Swaps** 6,915,568 1.43
Contracts For Difference***
470,484 iShares Physical Gold ETC ETF 657,580 0.14
Total Contracts For Difference*** 657,580 0.14
Futures Contract
870 US 2YR Note Future (CBT) Sep 20 30/09/2020 75,634 0.02
Total Futures Contract 75,634 0.02

ALGEBRIS UCITS FUNDS PLC
Algebris Global Credit Opportunities Fund
Unaudited Schedule of Investments (continued)
as at 30 June 2020
135
Holdings Financial Assets at Fair Value Through Profit or Loss Fair Value % of Net
EUR Asset Value
Forward Contracts*
Buy RUB 1,274,850,000 Sell EUR 15,000,000 27/04/2021 330,524 0.07
Buy EUR 19,981,456 Sell GBP 17,822,300 17/07/2020 310,738 0.07
Buy USD 5,385,000 Sell EUR 4,722,971 17/07/2020 69,280 0.02
Buy USD 4,951,300 Sell EUR 4,353,296 17/07/2020 52,995 0.01
Buy USD 4,528,000 Sell EUR 3,981,121 17/07/2020 48,464 0.01
Buy USD 2,500,000 Sell ZAR 43,003,750 09/11/2020 32,541 0.01
Buy EUR 1,131,239 Sell GBP 1,009,000 17/07/2020 17,592 -
Buy USD 1,594,800 Sell EUR 1,402,184 17/07/2020 17,070 -
Buy USD 1,325,600 Sell EUR 1,165,498 17/07/2020 14,188 -
Buy CHF 1,061,000 Sell EUR 987,537 17/07/2020 9,722 -
Buy CHF 360,500 Sell EUR 335,539 17/07/2020 3,303 -
Buy CHF 241,000 Sell EUR 224,313 17/07/2020 2,208 -
Buy USD 144,300 Sell EUR 126,936 17/07/2020 1,480 -
Buy USD 68,200 Sell EUR 59,963 17/07/2020 730 -
Buy USD 57,200 Sell EUR 50,330 17/07/2020 574 -
Buy EUR 158,096 Sell USD 177,300 17/07/2020 313 -
Buy USD 30,000 Sell EUR 26,446 17/07/2020 252 -
Buy EUR 13,800 Sell GBP 12,400 17/07/2020 114 -
Buy CZK 552,000 Sell EUR 20,608 17/07/2020 93 -
Buy EUR 54,770 Sell AUD 89,000 17/07/2020 91 -
Buy USD 63,551 Sell EUR 56,492 17/07/2020 64 -
Buy USD 52,394 Sell EUR 46,574 17/07/2020 53 -
Buy AUD 11,000 Sell EUR 6,715 17/07/2020 43 -
Buy AUD 15,000 Sell EUR 9,177 17/07/2020 38 -
Buy EUR 3,787 Sell GBP 3,399 17/07/2020 35 -
Buy EUR 3,567 Sell GBP 3,200 17/07/2020 35 -
Buy JPY 685,700 Sell EUR 5,619 17/07/2020 35 -
Buy USD 31,000 Sell EUR 27,556 17/07/2020 32 -
Buy EUR 3,002 Sell GBP 2,700 17/07/2020 22 -
Buy USD 19,769 Sell EUR 17,573 17/07/2020 20 -
Buy AUD 7,000 Sell EUR 4,280 17/07/2020 20 -
Buy EUR 1,847 Sell GBP 1,658 17/07/2020 17 -
Buy USD 15,339 Sell EUR 13,635 17/07/2020 16 -
Buy EUR 8,616 Sell AUD 14,000 17/07/2020 14 -
Buy EUR 1,779 Sell GBP 1,600 17/07/2020 13 -
Buy AUD 8,000 Sell EUR 4,902 17/07/2020 13 -
Buy CHF 4,334 Sell EUR 4,064 17/07/2020 10 -
Buy EUR 1,007 Sell GBP 904 17/07/2020 9 -
Buy CHF 2,972 Sell EUR 2,787 17/07/2020 7 -

ALGEBRIS UCITS FUNDS PLC
Algebris Global Credit Opportunities Fund
Unaudited Schedule of Investments (continued)
as at 30 June 2020
136
Holdings Financial Assets at Fair Value Through Profit or Loss Fair Value % of Net
EUR Asset Value
Forward Contracts* (continued)
Buy EUR 1,001 Sell GBP 900 17/07/2020 7 -
Buy EUR 619 Sell GBP 556 17/07/2020 6 -
Buy EUR 556 Sell GBP 500 17/07/2020 4 -
Buy CHF 1,000 Sell EUR 936 17/07/2020 4 -
Buy AUD 9,000 Sell EUR 5,525 17/07/2020 4 -
Buy EUR 198 Sell GBP 178 17/07/2020 2 -
Buy GBP 200 Sell EUR 219 17/07/2020 2 -
Buy EUR 112 Sell GBP 100 17/07/2020 2 -
Buy EUR 209 Sell GBP 188 17/07/2020 2 -
Buy EUR 111 Sell GBP 100 17/07/2020 1 -
Buy USD 827 Sell EUR 735 17/07/2020 1 -
Buy EUR 25,086 Sell USD 28,188 17/07/2020 1 -
Buy EUR 111 Sell GBP 100 17/07/2020 1 -
Buy EUR 107 Sell GBP 97 17/07/2020 - -
Buy EUR 303 Sell USD 341 17/07/2020 - -
Buy GBP 200 Sell EUR 221 17/07/2020 - -
Buy GBP 2,000 Sell EUR 2,207 17/07/2020 - -
Buy GBP 400 Sell EUR 442 17/07/2020 - -
Buy EUR 47 Sell JPY 5,692 17/07/2020 - -
Buy EUR 45 Sell JPY 5,500 17/07/2020 - -
Buy JPY 8,488 Sell EUR 70 17/07/2020 - -
Buy EUR 31 Sell JPY 3,765 17/07/2020 - -
Buy EUR 4,950 Sell USD 5,562 17/07/2020 - -
Buy EUR 88 Sell GBP 80 17/07/2020 - -
Buy EUR 16,908 Sell USD 18,999 17/07/2020 - -
Buy EUR 7,639 Sell USD 8,584 17/07/2020 - -
Total Forward Contracts* 912,805 0.19
Total Financial Assets at Fair Value Through Profit or Loss 380,502,146 78.61
Financial Liabilities at Fair Value Through Profit or Loss
Reverse Repurchase Agreements
2,000,000
Garfunkelux Holdco 3 7.5% 01/08/2022 (Repo Rate (2.5%) @
96.7916663) (1,799,879) (0.37)
2,000,000
Hellenic Petroleum Finance 2% 10/04/2024 (Repo Rate (0.6%)
@ 84.752459) (1,829,047) (0.38)

ALGEBRIS UCITS FUNDS PLC
Algebris Global Credit Opportunities Fund
Unaudited Schedule of Investments (continued)
as at 30 June 2020
137
Holdings Financial Liabilities at Fair Value Through Profit or Loss Fair Value % of Net
EUR Asset Value
Reverse Repurchase Agreements (continued)
1,000,000
Ote (Ser GMTN) 0.875% 09/24/2026 (Repo Rate (0.6%) @
91.4523626) (847,525) (0.17)
Total Reverse Repurchase Agreements (4,476,451) (0.92)
Options
(300) Alibaba Group Holding 280 Call 18/09/2020 (22,567) (0.01)
(15,000,000)
CDX NA HY Series 34 5 Yr Credit Default Swap Index 5%
20/06/2025 8.4% Put 16/09/2020 (164,139) (0.03)
(25,000,000)
CDX NA HY Series 34 5 Yr Credit Default Swap Index 5%
20/06/2025 9.4% Put 19/08/2020 (285,431) (0.06)
(25,000,000)
CDX NA HY Series 34 5 Yr Credit Default Swap Index 5%
20/06/2025 84% Put 16/09/2020 (273,565) (0.06)
(20,000,000)
CDX NA HY Series 34 5 Yr Credit Default Swap Index 5%
20/06/2025 90% Put 16/09/2020 (305,773) (0.06)
(20,000,000)
CDX NA HY Series 34 5 Yr Credit Default Swap Index 5%
20/06/2025 93% Put 19/08/2020 (206,051) (0.04)
(15,000,000) EUR Call / RUB Put 90 16/09/2020 (85,140) (0.02)
(10,000,000) EUR Put / MXN Call 24 16/09/2020 (36,384) (0.01)
(15,000,000) EUR Put / RUB Call 74 16/09/2020 (60,596) (0.01)
(500) Euro-OAT Future Sep 20 163 Put 24/07/2020 (20,000) -
(1,000)
iShares iBoxx $ Investment Grade Corporate Bond ETF 134
Call 21/08/2020 (166,919) (0.04)
(2,475)
iShares iBoxx $ Investment Grade Corporate Bond Fund 122
Put 17/07/2020 (33,050) (0.01)
(1,010)
iShares iBoxx $ Investment Grade Corporate Bond Fund 135
Call 17/07/2020 (56,196) (0.01)
(2,000) iShares iBoxx High Yield Bond Fund ETF 83 Call 21/08/2020 (162,913) (0.03)
(3,000) iShares Physical Gold ETC ETF 31.25 Put 18/12/2020 (136,206) (0.03)
(4,000) iShares Physical Gold ETC ETF 37 Call 18/09/2020 (185,169) (0.04)
(3,000) iShares Physical Gold ETC ETF 40 Call 18/12/2020 (157,571) (0.03)
(3,000) iShares Physical Gold ETC ETF 44 Call 18/12/2020 (74,780) (0.02)
(25,000,000)
iTraxx Europe Crossover Index Series 33 Ver 1 5 Yr Credit
Default Swap Index 5% 20/06/2025 3.25% Call 16/09/2020 (182,064) (0.04)
(100,000,000)
iTraxx Europe Crossover Index Series 33 Ver 1 5 Yr Credit
Default Swap Index 5% 20/06/2025 8% Put 16/09/2020 (302,592) (0.06)
(75,000,000)
iTraxx Europe Crossover Index Series 33 Ver 1 5 Yr Credit
Default Swap Index 5% 20/06/2025 9% Put 09/16/2020 (151,094) (0.03)
(50,000,000)
iTraxx Europe Index Snr Financials Series 33 5 Yr Credit
Default Swap Index 1% 20/06/2025 1% Put 09/16/2020 (195,027) (0.04)
(35) S&P 500 Index 2200 Put 16/10/2020 (68,860) (0.01)
(80) S&P 500 Index 2250 Put 16/10/2020 (180,896) (0.04)
(90) S&P 500 Index 2350 Put 18/09/2020 (169,857) (0.04)

ALGEBRIS UCITS FUNDS PLC
Algebris Global Credit Opportunities Fund
Unaudited Schedule of Investments (continued)
as at 30 June 2020
138
Holdings Financial Liabilities at Fair Value Through Profit or Loss Fair Value % of Net
EUR Asset Value
Options (continued)
(87) Siemens (FRNK) 115 Call 18/09/2020 (17,878) -
(10,000,000) USD Call / BRL Put 6.5 22/07/2020 (5,688) -
(50,000,000) USD Call / CNH Put 8 18/12/2020 (51,256) (0.01)
(15,000,000) USD Call / ZAR Put 20.25 15/09/2020 (43,524) (0.01)
30,000,000 USD Put / RUB Call 59 09/07/2020 - -
Total Options (3,801,186) (0.79)
Swaps**
(2,000,000)
Ardagh Pkg Financial Holdings USA Credit Default Swap Pay
Fix 5% 20/06/2023 (206,024) (0.04)
3,000,000 Barclays Credit Default Swap Rec Fix 1% 20/12/2024 (99,064) (0.02)
11,300,000
CDX NA HY Series 33 5 Yr Credit Default Swap Index 5%
20/12/2024 (MLOCL) (49,309) (0.01)
4,000,000
CDX NA HY Series 33 5 Yr Credit Default Swap Index 5%
20/12/2024 (MLOTC) (1,321,767) (0.27)
1,000,000
CMA CGM Credit Default Swap Rec Fix 5% 20/12/2021
(JPMOTC) (51,424) (0.01)
575,000,000
DBAMCF Interest Rate Swap Pay Fix 2.135% Rec Flt CZK-
PRIBOR-PRBO 6M 28/01/2022 (589,442) (0.12)
(3,000,000)
DBAMCF TRSWB First Quantum Minerals L (144A) 6.5%
01/03/2024 (224,006) (0.05)
(2,000,000)
DBAMCF TRSWB Sigma Holdco 5.75% 15/05/2026
(500024669) (213,752) (0.04)
3,000,000
Delta Air Lines Credit Default Swap Rec Fix 5% 20/12/2020
(BNPOTC) (8,231) -
3,000,000
Deutsche Lufthansa Credit Default Swap Pay Fix 1%
20/06/2021 (BNPOTC) (83,922) (0.02)
(3,000,000)
Eni Spa (BRl Credit Default Swap Pay Fix 1% 20/06/2022
(BARCOTC) (35,892) (0.01)
1,000,000
Garfunkelux Holdco 2 Credit Default Swap Rec Fix 5%
20/06/2022 (JPM) (117,446) (0.02)
2,000,000
Garfunkelux Holdco 2 Credit Default Swap Rec Fix 5%
20/06/2022 (MLOTC) (234,892) (0.05)
(5,000,000)
Glencore Finance Europe Credit Default Swap Pay Fix 5%
20/12/2024 (MLOTC) (700,807) (0.15)
10,000,000 Hellenic Republic Credit Default Swap Rec Fix 1% 20/06/2023 (414) -
5,000,000 Hellenic Republic Credit Default Swap Rec Fix 1% 20/06/2024 (41,697) (0.01)
5,000,000
Hellenic Republic Credit Default Swap Rec Fix 1% 20/06/2024
(JPMOTC) (41,697) (0.01)
5,000,000
Pemex Project Funding Master Trust Credit Default Swap Rec
Fix 1% 20/06/2021 (139,649) (0.03)

ALGEBRIS UCITS FUNDS PLC
Algebris Global Credit Opportunities Fund
Unaudited Schedule of Investments (continued)
as at 30 June 2020
139
Holdings Financial Liabilities at Fair Value Through Profit or Loss Fair Value % of Net
EUR Asset Value
Swaps** (continued)
10,000,000
Republic of Indonesia Credit Default Swap Rec Fix 1%
20/06/2025 (139,266) (0.03)
Total Swap (4,298,701) (0.89)
Futures Contract
(600) Euro-BTP Future Sep 20 08/09/2020 (2,335,000) (0.48)
(400) US Long Bond (CBT) Future Sep 20 21/09/2020 (374,121) (0.08)
Total Futures Contract (2,709,121) (0.56)
Forward Contracts*
Buy EUR 144,037,040 Sell USD 163,823,149 17/07/2020 (1,753,440) (0.36)
Buy USD 5,000,000 Sell TRY 39,357,500 11/09/2020 (447,927) (0.10)
Buy USD 2,500,000 Sell BRL 14,583,000 08/11/2020 (144,460) (0.03)
Buy GBP 3,227,000 Sell EUR 3,617,948 17/07/2020 (56,264) (0.01)
Buy ZAR 43,042,500 Sell USD 2,500,000 09/11/2020 (30,568) (0.01)
Buy EUR 988,467 Sell CHF 1,062,000 17/07/2020 (9,731) -
Buy EUR 662,494 Sell USD 753,500 17/07/2020 (8,065) -
Buy USD 5,428,000 Sell EUR 4,838,162 17/07/2020 (7,643) -
Buy GBP 401,200 Sell EUR 449,805 17/07/2020 (6,995) -
Buy GBP 186,600 Sell EUR 209,206 17/07/2020 (3,253) -
Buy GBP 111,700 Sell EUR 125,232 17/07/2020 (1,947) -
Buy EUR 864,696 Sell GBP 785,000 17/07/2020 (1,720) -
Buy CZK 14,305,000 Sell EUR 537,803 17/07/2020 (1,352) -
Buy GBP 68,100 Sell EUR 76,350 17/07/2020 (1,187) -
Buy EUR 41,046 Sell USD 46,800 17/07/2020 (602) -
Buy EUR 23,944 Sell USD 27,300 17/07/2020 (351) -
Buy GBP 19,400 Sell EUR 21,750 17/07/2020 (338) -
Buy GBP 18,700 Sell EUR 20,965 17/07/2020 (326) -
Buy EUR 29,176 Sell AUD 48,000 17/07/2020 (314) -
Buy EUR 15,166 Sell AUD 25,000 17/07/2020 (193) -
Buy EUR 11,226 Sell USD 12,800 17/07/2020 (165) -
Buy EUR 112,831 Sell CHF 120,200 17/07/2020 (148) -
Buy EUR 7,016 Sell USD 8,000 17/07/2020 (103) -
Buy EUR 37,857 Sell USD 42,633 17/07/2020 (83) -
Buy EUR 34,378 Sell USD 38,715 17/07/2020 (75) -
Buy EUR 10,515 Sell USD 11,900 17/07/2020 (75) -

ALGEBRIS UCITS FUNDS PLC
Algebris Global Credit Opportunities Fund
Unaudited Schedule of Investments (continued)
as at 30 June 2020
140
Holdings Financial Liabilities at Fair Value Through Profit or Loss Fair Value % of Net
EUR Asset Value
Forward Contracts* (continued)
Buy GBP 3,500 Sell EUR 3,930 17/07/2020 (68) -
Buy GBP 4,938 Sell EUR 5,513 17/07/2020 (63) -
Buy EUR 11,100 Sell GBP 10,100 17/07/2020 (48) -
Buy EUR 3,031 Sell AUD 5,000 17/07/2020 (40) -
Buy GBP 2,500 Sell EUR 2,789 17/07/2020 (30) -
Buy EUR 9,801 Sell AUD 16,000 17/07/2020 (29) -
Buy GBP 2,175 Sell EUR 2,428 17/07/2020 (27) -
Buy EUR 11,684 Sell USD 13,158 17/07/2020 (26) -
Buy EUR 3,046 Sell AUD 5,000 17/07/2020 (26) -
Buy AUD 48,000 Sell EUR 29,513 17/07/2020 (23) -
Buy EUR 10,079 Sell USD 11,351 17/07/2020 (22) -
Buy EUR 2,804 Sell CHF 3,004 17/07/2020 (20) -
Buy GBP 1,380 Sell EUR 1,541 17/07/2020 (18) -
Buy EUR 2,521 Sell CHF 2,700 17/07/2020 (17) -
Buy EUR 1,860 Sell CHF 1,993 17/07/2020 (13) -
Buy EUR 1,867 Sell CHF 2,000 17/07/2020 (12) -
Buy EUR 12,277 Sell AUD 20,000 17/07/2020 (11) -
Buy GBP 777 Sell EUR 867 17/07/2020 (10) -
Buy EUR 6,135 Sell AUD 10,000 17/07/2020 (9) -
Buy GBP 10,000 Sell EUR 11,045 17/07/2020 (8) -
Buy EUR 439 Sell USD 500 17/07/2020 (6) -
Buy EUR 1,721 Sell CHF 1,836 17/07/2020 (4) -
Buy EUR 2,384 Sell GBP 2,163 17/07/2020 (4) -
Buy GBP 235 Sell EUR 262 17/07/2020 (3) -
Buy GBP 300 Sell EUR 334 17/07/2020 (3) -
Buy GBP 209 Sell EUR 233 17/07/2020 (3) -
Buy EUR 1,246 Sell CHF 1,329 17/07/2020 (3) -
Buy EUR 1,042 Sell GBP 946 17/07/2020 (2) -
Buy EUR 502 Sell USD 565 17/07/2020 (1) -
Buy GBP 200 Sell EUR 222 17/07/2020 (1) -
Buy GBP 100 Sell EUR 111 17/07/2020 (1) -
Buy GBP 200 Sell EUR 222 17/07/2020 (1) -
Buy EUR 315 Sell GBP 286 17/07/2020 (1) -
Buy EUR 666 Sell GBP 604 17/07/2020 (1) -
Total Forward Contracts* (2,477,879) (0.51)
Total Financial Liabilities at Fair Value Through Profit or
Loss (17,763,338) (3.67)

ALGEBRIS UCITS FUNDS PLC
Algebris Global Credit Opportunities Fund
Unaudited Schedule of Investments (continued)
as at 30 June 2020
141
Holdings Financial Liabilities at Fair Value Through Profit or Loss Fair Value % of Net
EUR Asset Value
Net Financial Assets and Liabilities at Fair Value Through
Profit or Loss 362,738,808 74.94
Other Net Assets 121,331,488 25.06
Total Net Assets Attributable to Holders of Redeemable
Participating Shares 484,070,296 100.00
% of total
assets
Transferable securities admitted to an official stock
exchange listing or traded in a regulated market 365,137,988 70.55
Over the counter financial derivatives 15,364,158 2.97
Cash and other current assets 137,056,783 26.48
Total Assets 517,558,929 100.00
*The counterparty for all the forward contracts is HSBC Bank plc.
**The counterparties for all the swap contracts are Bank of America Merrill Lynch, Barclays
Capital London, BNP Paribas, Goldman Sachs and JP Morgan Securities and Morgan Stanley.
***The counterparty for all the contracts for differences is HSBC Bank plc.
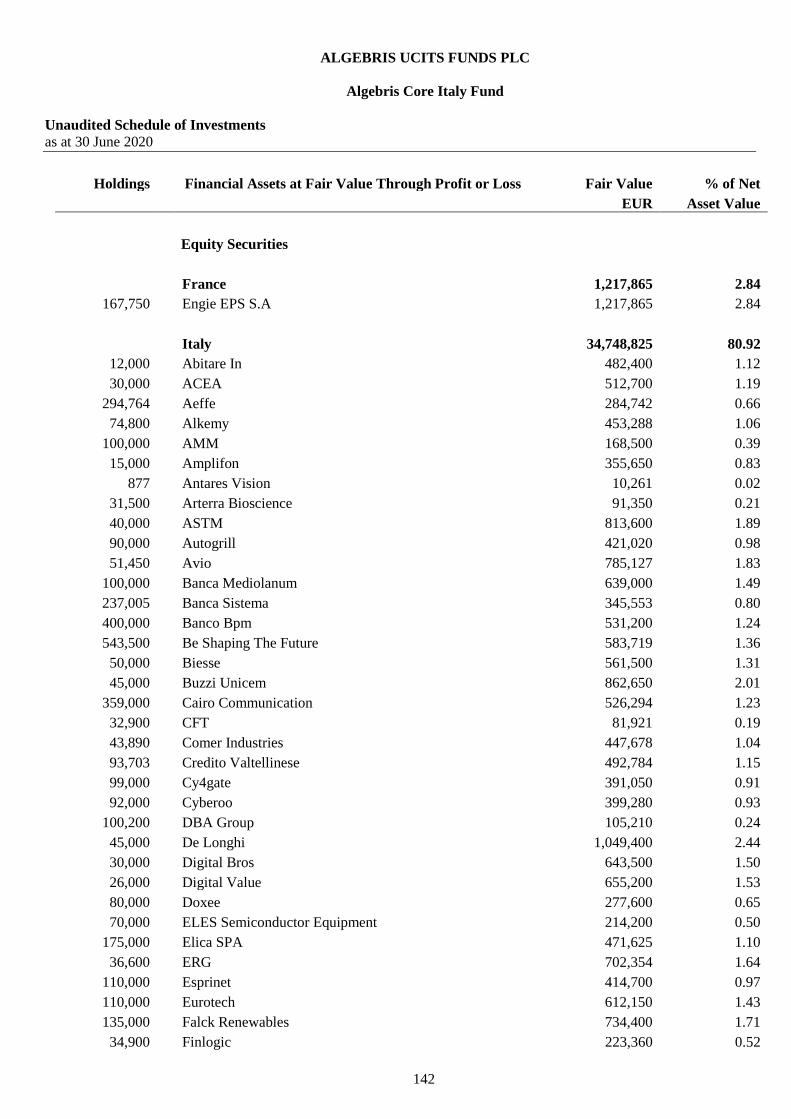
ALGEBRIS UCITS FUNDS PLC
Algebris Core Italy Fund
Unaudited Schedule of Investments
as at 30 June 2020
142
Holdings Financial Assets at Fair Value Through Profit or Loss Fair Value % of Net
EUR Asset Value
Equity Securities
France 1,217,865 2.84
167,750 Engie EPS S.A 1,217,865 2.84
Italy 34,748,825 80.92
12,000 Abitare In 482,400 1.12
30,000 ACEA 512,700 1.19
294,764 Aeffe 284,742 0.66
74,800 Alkemy 453,288 1.06
100,000 AMM 168,500 0.39
15,000 Amplifon 355,650 0.83
877 Antares Vision 10,261 0.02
31,500 Arterra Bioscience 91,350 0.21
40,000 ASTM 813,600 1.89
90,000 Autogrill 421,020 0.98
51,450 Avio 785,127 1.83
100,000 Banca Mediolanum 639,000 1.49
237,005 Banca Sistema 345,553 0.80
400,000 Banco Bpm 531,200 1.24
543,500 Be Shaping The Future 583,719 1.36
50,000 Biesse 561,500 1.31
45,000 Buzzi Unicem 862,650 2.01
359,000 Cairo Communication 526,294 1.23
32,900 CFT 81,921 0.19
43,890 Comer Industries 447,678 1.04
93,703 Credito Valtellinese 492,784 1.15
99,000 Cy4gate 391,050 0.91
92,000 Cyberoo 399,280 0.93
100,200 DBA Group 105,210 0.24
45,000 De Longhi 1,049,400 2.44
30,000 Digital Bros 643,500 1.50
26,000 Digital Value 655,200 1.53
80,000 Doxee 277,600 0.65
70,000 ELES Semiconductor Equipment 214,200 0.50
175,000 Elica SPA 471,625 1.10
36,600 ERG 702,354 1.64
110,000 Esprinet 414,700 0.97
110,000 Eurotech 612,150 1.43
135,000 Falck Renewables 734,400 1.71
34,900 Finlogic 223,360 0.52

ALGEBRIS UCITS FUNDS PLC
Algebris Core Italy Fund
Unaudited Schedule of Investments (continued)
as at 30 June 2020
143
Holdings Financial Assets at Fair Value Through Profit or Loss Fair Value % of Net
EUR Asset Value
Equity Securities (continued)
Italy (continued)
110,250 FOS 313,110 0.73
21,800 Gabelli Value 213,640 0.50
169,300 Garofalo Health Care 812,640 1.89
26,000 Gibus 122,720 0.29
60,000 Gismondi 1754 152,400 0.35
220,000 H-Farm 62,920 0.15
20,000 IDeaMI 198,000 0.46
29,947 Illimity Bank 219,512 0.51
11,125 IMA Industria Macchine Automatiche 595,187 1.39
80,000 Infrastrutture Wireless Italiane 713,600 1.66
87,500 Intred 689,500 1.61
40,000 Kolinpharma 361,600 0.84
56,200 LU-VE 691,260 1.61
89,280 MailUp 467,827 1.09
54,500 Marzocchi Pompe 204,920 0.48
43,000 Neodecortech 120,400 0.28
94,736 NET Insurance 445,259 1.04
128,000 Newlat Food 645,120 1.50
42,000 Nexi 646,800 1.51
61,000 NVP Srl 168,970 0.39
50,202 Pattern 190,266 0.44
13,900 Pharmanutra 323,870 0.75
220,199 Piquadro Spa 325,895 0.76
135,000 Poste Italiane 1,044,900 2.43
55,000 Powersoft 227,700 0.53
115,000 RAI Way 672,750 1.57
60,000 Renergetica 253,800 0.59
40,000 Sabaf 442,000 1.03
17,440 SAES Getters 418,560 0.97
370,000 Saipem 821,030 1.91
570 Salcef 6,897 0.02
151,800 Sebino 390,126 0.91
250,000 SEC 82,798 0.19
70,000 Servizi Italia 162,400 0.38
9,000 Sesa Spa 482,400 1.12
17,100 Somec 313,785 0.73
40,000 Techedge 176,800 0.41
3,000,000 Telecom Italia/Milano 1,049,100 2.44

ALGEBRIS UCITS FUNDS PLC
Algebris Core Italy Fund
Unaudited Schedule of Investments (continued)
as at 30 June 2020
144
Holdings Financial Assets at Fair Value Through Profit or Loss Fair Value % of Net
EUR Asset Value
Equity Securities (continued)
Italy (continued)
45,491 Tinexta 543,163 1.26
230,000 Triboo 294,400 0.69
26,400 Unidata 436,920 1.02
70,000 Unieuro 522,900 1.22
20,000 VEI 1 197,000 0.46
25,405 Vetrya 96,539 0.22
130,000 Websolute 210,600 0.49
625,000 Webuild 871,875 2.03
Netherlands 1,665,603 3.88
84,882 Cementir Holding 537,303 1.25
95,000 CNH Industrial 591,660 1.38
60,000 Fiat Chrysler Automobiles 536,640 1.25
United Kingdom 1,466,732 3.41
1,205,614 Telit Communications 1,466,732 3.41
Total Equity Securities 39,099,025 91.05
Fixed Income Securities
Argentina 99,050 0.23
250,000 Provincia De Buenos Aire 15/05/2035 99,050 0.23
Italy 965,070 2.25
300,000 Banca Monte Dei Paschi VAR 18/01/2028 269,370 0.63
500,000 Cooperativa Muratori & C 6% 15/02/2023 12,433 0.03
500,000 Cooperativa Muratori & C 6.875% 01/08/2022 14,015 0.03
400,000 Credito Valtellinese 4.7% 04/08/2021 397,168 0.93
275,333 Gamenet Group 27/04/2023 272,084 0.63
Luxembourg 1,104,380 2.57
2,000,000 Mitsubishi Ufj Investor (Series PRX) 15/12/2050 1,104,380 2.57
Total Fixed Income Securities 2,168,500 5.05

ALGEBRIS UCITS FUNDS PLC
Algebris Core Italy Fund
Unaudited Schedule of Investments (continued)
as at 30 June 2020
145
Holdings Financial Assets at Fair Value Through Profit or Loss Fair Value % of Net
EUR Asset Value
Options
67 FTSE MIB Index 16500 Put 21/08/2020 39,698 0.09
79 FTSE MIB Index 17000 Put 17/07/2020 15,010 0.04
Total Options 54,708 0.13
Equity Warrants
24,000 Arterra Bioscience 28/10/2022 23,686 0.05
3,420 CFT 28/06/2022 513 -
92,000 Cyberoo 16/10/2023 80,040 0.19
16,700 DBA Group 07/01/2021 1,080 -
80,000 Doxee 15/12/2022 13,832 0.03
20,000 ELES Semiconductor Equipment 31/07/2024 16,588 0.04
8,250 ELES Semiconductor Equipment 31/12/2099 12,787 0.03
29,812 FOS 30/09/2022 26,667 0.06
3,000 Gabelli Value 19/04/2023 58 -
15,000 Gismondi 1754 31/10/2022 3,885 0.01
2,400 Guala Closures 21/12/2023 696 -
15,000 Maps 28/06/2024 14,031 0.03
18,410 NET Insurance 21/05/2023 23,933 0.06
25,000 Powersoft 15/10/2021 18,725 0.04
122,400 Sebino 31/07/2023 13,195 0.03
24,400 Unidata SpA 31/12/2022 12,686 0.03
6,000 VEI 1 27/02/2023 3,120 0.01
120,000 Websolute 30/11/2022 12,000 0.03
Total Equity Warrants 277,522 0.64
Forward Contracts*
Buy EUR 1,805,050 Sell GBP 1,610,000 17/07/2020 28,071 0.07
Buy GBP 104,000 Sell EUR 114,330 17/07/2020 456 -
Buy GBP 85,000 Sell EUR 93,665 17/07/2020 151 -
Buy GBP 65,000 Sell EUR 71,599 17/07/2020 142 -
Buy EUR 54,200 Sell GBP 49,000 17/07/2020 118 -
Buy USD 1,150 Sell EUR 1,011 17/07/2020 12 -
Buy JPY 129,800 Sell EUR 1,064 17/07/2020 7 -
Buy EUR 109 Sell GBP 98 17/07/2020 1 -
Buy EUR 71 Sell GBP 64 17/07/2020 1 -
Buy EUR 33 Sell JPY 4,005 17/07/2020 - -
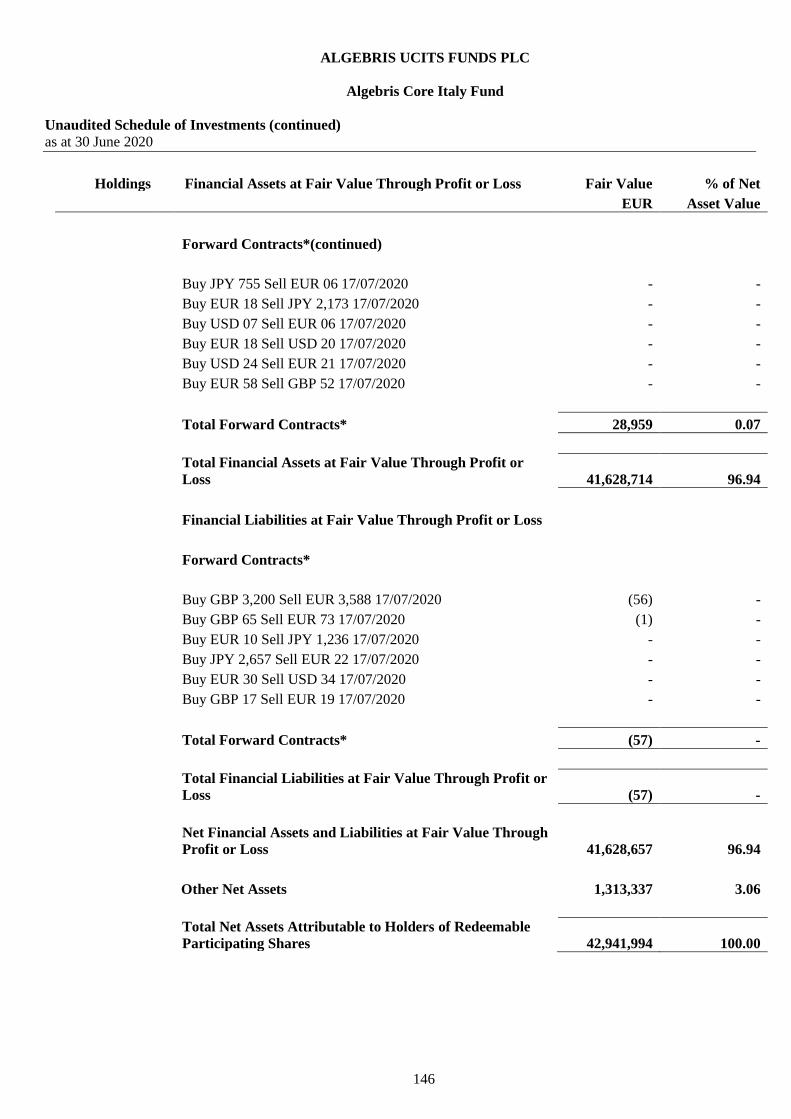
ALGEBRIS UCITS FUNDS PLC
Algebris Core Italy Fund
Unaudited Schedule of Investments (continued)
as at 30 June 2020
146
Holdings Financial Assets at Fair Value Through Profit or Loss Fair Value % of Net
EUR Asset Value
Forward Contracts*(continued)
Buy JPY 755 Sell EUR 06 17/07/2020 - -
Buy EUR 18 Sell JPY 2,173 17/07/2020 - -
Buy USD 07 Sell EUR 06 17/07/2020 - -
Buy EUR 18 Sell USD 20 17/07/2020 - -
Buy USD 24 Sell EUR 21 17/07/2020 - -
Buy EUR 58 Sell GBP 52 17/07/2020 - -
Total Forward Contracts* 28,959 0.07
Total Financial Assets at Fair Value Through Profit or
Loss 41,628,714 96.94
Financial Liabilities at Fair Value Through Profit or Loss
Forward Contracts*
Buy GBP 3,200 Sell EUR 3,588 17/07/2020 (56) -
Buy GBP 65 Sell EUR 73 17/07/2020 (1) -
Buy EUR 10 Sell JPY 1,236 17/07/2020 - -
Buy JPY 2,657 Sell EUR 22 17/07/2020 - -
Buy EUR 30 Sell USD 34 17/07/2020 - -
Buy GBP 17 Sell EUR 19 17/07/2020 - -
Total Forward Contracts* (57) -
Total Financial Liabilities at Fair Value Through Profit or
Loss (57) -
Net Financial Assets and Liabilities at Fair Value Through
Profit or Loss 41,628,657 96.94
Other Net Assets 1,313,337 3.06
Total Net Assets Attributable to Holders of Redeemable
Participating Shares 42,941,994 100.00

ALGEBRIS UCITS FUNDS PLC
Algebris Core Italy Fund
Unaudited Schedule of Investments (continued)
as at 30 June 2020
147
Holdings Financial Assets at Fair Value Through Profit or Loss Fair Value % of total
EUR assets
Transferable securities admitted to an official stock
exchange listing or traded in a regulated market 41,267,525 95.95
Over the counter financial derivatives 361,189 0.84
Cash and other current assets 1,381,219 3.21
Total Assets 43,009,933 100.00
*The counterparty for all the forward contracts is HSBC Bank plc.

ALGEBRIS UCITS FUNDS PLC
Algebris IG Financial Credit Fund
Unaudited Schedule of Investments
as at 30 June 2020
148
Holdings Financial Assets at Fair Value Through Profit or Loss Fair Value % of Net
EUR Asset Value
Fixed Income Securities
Austria 1,673,408 1.06
1,600,000 Erste Group Bank Perpetual 1,673,408 1.06
Denmark 5,558,260 3.53
5,000,000 Danske Bank 2.25% 14/01/2028 5,558,260 3.53
France 12,216,208 7.75
4,600,000 Bnp Paribas 13/01/2031 4,322,210 2.74
3,300,000 Bnp Paribas 4.4% 14/08/2028 3,406,421 2.16
1,500,000 Credit Agricole 4.375% 17/03/2025 1,480,811 0.94
1,000,000 Credit Agricole 7.875% Perpetual 968,130 0.62
2,000,000 Credit Agricole VAR Perpetual 2,038,636 1.29
Germany 10,521,992 6.68
1,500,000 Allianz 08/07/2050 1,526,790 0.97
3,500,000 Commerzbank 05/12/2030 3,525,778 2.24
1,000,000 Deutsche Bank 26/11/2025 934,167 0.59
1,100,000 Deutsche Bank 19/05/2031 1,154,780 0.73
1,300,000 Deutsche Bank 08/07/2031 1,156,610 0.74
2,000,000 Deutsche Bank 2.625% 16/12/2024 2,223,867 1.41
Ireland 1,096,546 0.70
1,100,000 Aib Group Perpetual 1,096,546 0.70
Italy 24,844,910 15.76
1,000,000 Banco Bpm SPA 1.625% 18/02/2025 926,890 0.59
4,000,000 Intesa Sanpaolo 2.125% 26/05/2025 4,165,120 2.64
2,600,000 Intesa Sanpaolo 2.5% 15/01/2030 2,779,284 1.76
1,500,000 Intesa Sanpaolo SPA 5.148% 10/06/2030 1,726,414 1.09
4,600,000 Unicredit 19/06/2032 4,322,866 2.74
1,700,000 Unicredit 02/04/2034 1,718,857 1.09
2,600,000 Unicredit SPA 15/01/2032 2,360,488 1.50
1,800,000 Unicredit SPA 30/06/2035 1,605,290 1.02
2,100,000 Unione Di Banche Italian 12/07/2029 2,170,161 1.38
3,000,000 Unipol Gruppo 3.5% 29/11/2027 3,069,540 1.95
Netherlands 4,102,003 2.60
2,400,000 ABN Amro Bank 27/03/2028 2,222,665 1.41
2,000,000 Ing Group 22/03/2028 1,879,338 1.19

ALGEBRIS UCITS FUNDS PLC
Algebris IG Financial Credit Fund
Unaudited Schedule of Investments (continued)
as at 30 June 2020
149
Holdings Financial Assets at Fair Value Through Profit or Loss Fair Value % of Net
EUR Asset Value
Fixed Income Securities (continued)
Spain 13,502,583 8.57
2,000,000 Banco Bilbao Vizcaya ARG 22/02/2029 2,037,430 1.29
1,000,000 Banco Bilbao Vizcaya ARG (Series GMTN) 3.5% 10/02/2027 1,105,720 0.70
1,200,000 Banco De Sabadell 1.125% 27/03/2025 1,093,866 0.69
3,800,000 Banco Santander Perpetual (ZP3895189) 3,448,500 2.19
1,000,000 Banco Santander 2.125% 08/02/2028 1,014,095 0.64
800,000 Banco Santander 3.49% 28/05/2030 763,507 0.49
3,000,000 Caixabank VAR 17/04/2030 2,957,865 1.88
1,000,000 Santander Issuances (Series DIP) 3.25% 04/04/2026 1,081,600 0.69
Switzerland 9,736,058 6.18
1,300,000 Credit Suisse Group 02/04/2026 1,441,414 0.92
5,000,000 Credit Suisse Group 09/06/2028 5,554,948 3.52
2,700,000 Credit Suisse Group 01/04/2031 2,739,696 1.74
United Kingdom 28,125,740 17.84
2,000,000 Barclays 07/05/2026 1,872,919 1.19
1,000,000 Barclays 02/07/2028 982,050 0.62
6,000,000 Barclays 22/11/2030 6,695,348 4.25
1,000,000 Barclays Perpetual (UV4299359) 1,112,259 0.71
600,000 HSBC Holdings 4.95% 31/03/2030 643,394 0.41
300,000 HSBC Holdings Perpetual (AO1326237) 284,925 0.18
1,000,000 Legal & General Group Perpetual 1,093,094 0.69
1,000,000 Lloyds Banking Group 15/01/2026 1,102,406 0.70
1,700,000 Lloyds Banking Group 01/04/2026 1,887,280 1.20
1,200,000 Lloyds Banking Group Perpetual (ZQ5986752) 1,217,203 0.77
500,000 Nationwide Building Society Perpetual (BJ9806842) 557,868 0.35
1,500,000 Royal Bank of Scotland Group 6.125% 15/12/2022 1,458,571 0.92
2,000,000 Royal Bank of Scotland Group 01/11/2029 1,846,346 1.17
2,000,000 Royal Bank of Scotland Group 14/08/2030 2,263,423 1.44
600,000 Royal Bank of Scotland Group Perpetual 542,486 0.34
2,000,000 Santander UK Group Holdings 4.75% 15/09/2025 1,934,247 1.23
2,000,000 Standard Chartered 30/01/2026 1,825,194 1.16
800,000 Standard Chartered 01/04/2031 806,727 0.51
United States 11,567,757 7.34
700,000 Bank of America 31/03/2029 838,488 0.53
800,000 Citigroup (Series R) Perpetual 697,545 0.44
400,000 Citigroup 08/04/2026 383,468 0.24
600,000 Citigroup 31/03/2031 636,789 0.41

ALGEBRIS UCITS FUNDS PLC
Algebris IG Financial Credit Fund
Unaudited Schedule of Investments (continued)
as at 30 June 2020
150
Holdings Financial Assets at Fair Value Through Profit or Loss Fair Value % of Net
EUR Asset Value
Fixed Income Securities (continued)
United States (continued)
4,400,000 Citigroup 25/08/2036 2,839,416 1.80
200,000 Goldman Sachs Group (Series R) Perpetual 172,152 0.11
900,000 Goldman Sachs Group 3.375% 27/03/2025 1,004,760 0.64
500,000 Goldman Sachs Group 3.5% 01/04/2025 488,071 0.31
1,750,000 Huntington Bancshares (Series F) Perpetual 1,628,015 1.03
200,000 Morgan Stanley 01/04/2031 203,766 0.13
1,200,000 Voya Financial 23/01/2048 1,006,855 0.64
1,600,000 Wells Fargo & Co 04/05/2030 1,668,432 1.06
Total Fixed Income Securities 122,945,465 78.01
Collective Investment Scheme
Ireland 13,997,680 8.88
76,000 Algebris Financial Credit Fund Class M Accumulating 13,997,680 8.88
Total Collective Investment Scheme 13,997,680 8.88
Options
5 S&P 500 Index 2850 Put 17/07/2020 6,454 -
37 S&P 500 Index 2930 Put 17/07/2020 88,836 0.06
Total Options 95,290 0.06
Forward Contracts*
Buy EUR 23,817,692 Sell GBP 21,244,000 17/07/2020 370,396.00 0.24
Buy USD 4,083,400 Sell EUR 3,590,218 17/07/2020 43,706.00 0.03
Buy USD 3,071,500 Sell EUR 2,700,533 17/07/2020 32,875.00 0.02
Buy EUR 2,492,891 Sell GBP 2,233,000 17/07/2020 28,299.00 0.02
Buy EUR 1,524,763 Sell GBP 1,360,000 17/07/2020 23,712.00 0.02
Buy JPY 409,074,000 Sell EUR 3,352,421 17/07/2020 20,909.00 0.01
Buy EUR 960,825 Sell GBP 858,000 17/07/2020 13,839.00 0.01
Buy EUR 1,159,629 Sell GBP 1,043,000 17/07/2020 8,456.00 0.01
Buy USD 569,100 Sell EUR 500,366 17/07/2020 6,091.00 -
Buy EUR 1,126,026 Sell GBP 1,017,000 17/07/2020 3,549.00 -
Buy EUR 118,842 Sell GBP 106,000 17/07/2020 1,848.00 -
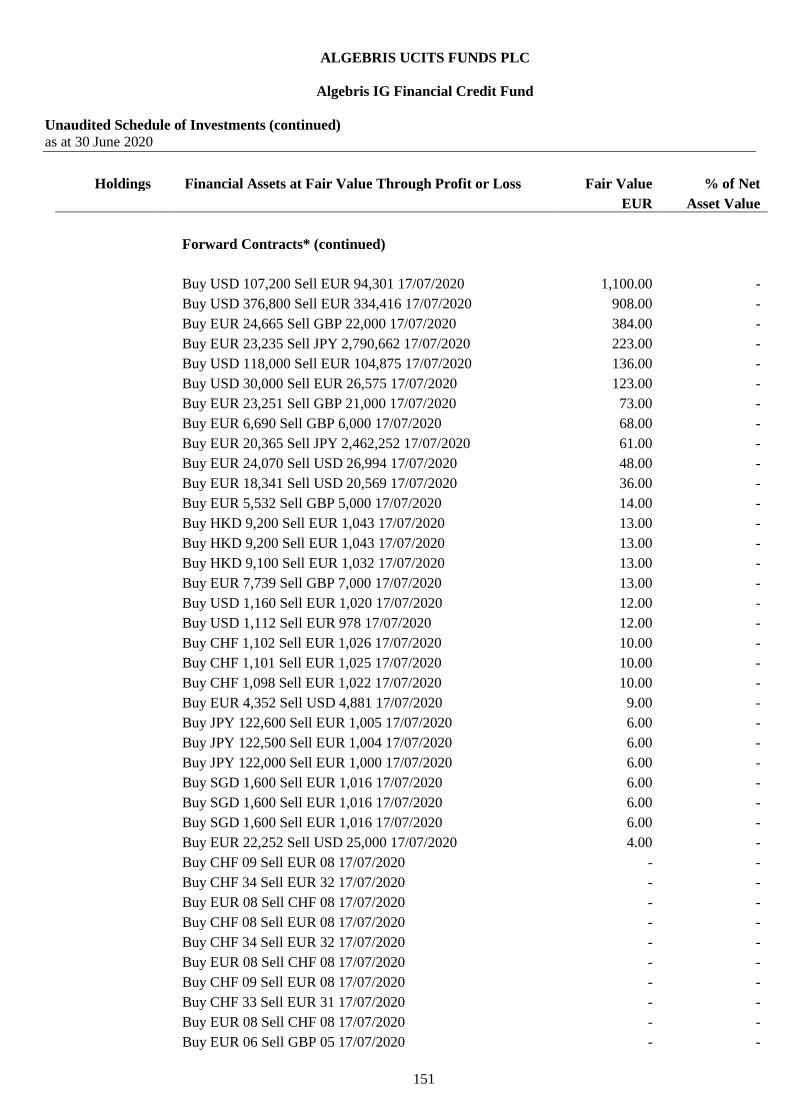
ALGEBRIS UCITS FUNDS PLC
Algebris IG Financial Credit Fund
Unaudited Schedule of Investments (continued)
as at 30 June 2020
151
Holdings Financial Assets at Fair Value Through Profit or Loss Fair Value % of Net
EUR Asset Value
Forward Contracts* (continued)
Buy USD 107,200 Sell EUR 94,301 17/07/2020 1,100.00 -
Buy USD 376,800 Sell EUR 334,416 17/07/2020 908.00 -
Buy EUR 24,665 Sell GBP 22,000 17/07/2020 384.00 -
Buy EUR 23,235 Sell JPY 2,790,662 17/07/2020 223.00 -
Buy USD 118,000 Sell EUR 104,875 17/07/2020 136.00 -
Buy USD 30,000 Sell EUR 26,575 17/07/2020 123.00 -
Buy EUR 23,251 Sell GBP 21,000 17/07/2020 73.00 -
Buy EUR 6,690 Sell GBP 6,000 17/07/2020 68.00 -
Buy EUR 20,365 Sell JPY 2,462,252 17/07/2020 61.00 -
Buy EUR 24,070 Sell USD 26,994 17/07/2020 48.00 -
Buy EUR 18,341 Sell USD 20,569 17/07/2020 36.00 -
Buy EUR 5,532 Sell GBP 5,000 17/07/2020 14.00 -
Buy HKD 9,200 Sell EUR 1,043 17/07/2020 13.00 -
Buy HKD 9,200 Sell EUR 1,043 17/07/2020 13.00 -
Buy HKD 9,100 Sell EUR 1,032 17/07/2020 13.00 -
Buy EUR 7,739 Sell GBP 7,000 17/07/2020 13.00 -
Buy USD 1,160 Sell EUR 1,020 17/07/2020 12.00 -
Buy USD 1,112 Sell EUR 978 17/07/2020 12.00 -
Buy CHF 1,102 Sell EUR 1,026 17/07/2020 10.00 -
Buy CHF 1,101 Sell EUR 1,025 17/07/2020 10.00 -
Buy CHF 1,098 Sell EUR 1,022 17/07/2020 10.00 -
Buy EUR 4,352 Sell USD 4,881 17/07/2020 9.00 -
Buy JPY 122,600 Sell EUR 1,005 17/07/2020 6.00 -
Buy JPY 122,500 Sell EUR 1,004 17/07/2020 6.00 -
Buy JPY 122,000 Sell EUR 1,000 17/07/2020 6.00 -
Buy SGD 1,600 Sell EUR 1,016 17/07/2020 6.00 -
Buy SGD 1,600 Sell EUR 1,016 17/07/2020 6.00 -
Buy SGD 1,600 Sell EUR 1,016 17/07/2020 6.00 -
Buy EUR 22,252 Sell USD 25,000 17/07/2020 4.00 -
Buy CHF 09 Sell EUR 08 17/07/2020 - -
Buy CHF 34 Sell EUR 32 17/07/2020 - -
Buy EUR 08 Sell CHF 08 17/07/2020 - -
Buy CHF 08 Sell EUR 08 17/07/2020 - -
Buy CHF 34 Sell EUR 32 17/07/2020 - -
Buy EUR 08 Sell CHF 08 17/07/2020 - -
Buy CHF 09 Sell EUR 08 17/07/2020 - -
Buy CHF 33 Sell EUR 31 17/07/2020 - -
Buy EUR 08 Sell CHF 08 17/07/2020 - -
Buy EUR 06 Sell GBP 05 17/07/2020 - -
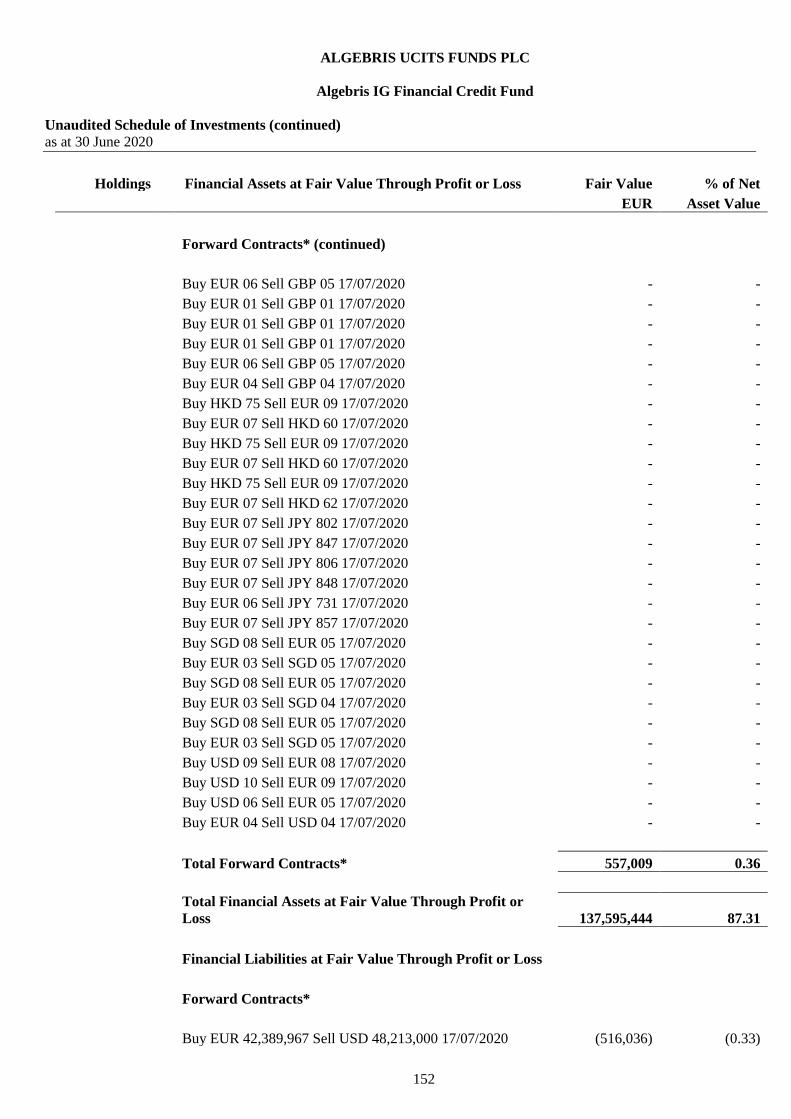
ALGEBRIS UCITS FUNDS PLC
Algebris IG Financial Credit Fund
Unaudited Schedule of Investments (continued)
as at 30 June 2020
152
Holdings Financial Assets at Fair Value Through Profit or Loss Fair Value % of Net
EUR Asset Value
Forward Contracts* (continued)
Buy EUR 06 Sell GBP 05 17/07/2020 - -
Buy EUR 01 Sell GBP 01 17/07/2020 - -
Buy EUR 01 Sell GBP 01 17/07/2020 - -
Buy EUR 01 Sell GBP 01 17/07/2020 - -
Buy EUR 06 Sell GBP 05 17/07/2020 - -
Buy EUR 04 Sell GBP 04 17/07/2020 - -
Buy HKD 75 Sell EUR 09 17/07/2020 - -
Buy EUR 07 Sell HKD 60 17/07/2020 - -
Buy HKD 75 Sell EUR 09 17/07/2020 - -
Buy EUR 07 Sell HKD 60 17/07/2020 - -
Buy HKD 75 Sell EUR 09 17/07/2020 - -
Buy EUR 07 Sell HKD 62 17/07/2020 - -
Buy EUR 07 Sell JPY 802 17/07/2020 - -
Buy EUR 07 Sell JPY 847 17/07/2020 - -
Buy EUR 07 Sell JPY 806 17/07/2020 - -
Buy EUR 07 Sell JPY 848 17/07/2020 - -
Buy EUR 06 Sell JPY 731 17/07/2020 - -
Buy EUR 07 Sell JPY 857 17/07/2020 - -
Buy SGD 08 Sell EUR 05 17/07/2020 - -
Buy EUR 03 Sell SGD 05 17/07/2020 - -
Buy SGD 08 Sell EUR 05 17/07/2020 - -
Buy EUR 03 Sell SGD 04 17/07/2020 - -
Buy SGD 08 Sell EUR 05 17/07/2020 - -
Buy EUR 03 Sell SGD 05 17/07/2020 - -
Buy USD 09 Sell EUR 08 17/07/2020 - -
Buy USD 10 Sell EUR 09 17/07/2020 - -
Buy USD 06 Sell EUR 05 17/07/2020 - -
Buy EUR 04 Sell USD 04 17/07/2020 - -
Total Forward Contracts* 557,009 0.36
Total Financial Assets at Fair Value Through Profit or
Loss 137,595,444 87.31
Financial Liabilities at Fair Value Through Profit or Loss
Forward Contracts*
Buy EUR 42,389,967 Sell USD 48,213,000 17/07/2020 (516,036) (0.33)

ALGEBRIS UCITS FUNDS PLC
Algebris IG Financial Credit Fund
Unaudited Schedule of Investments (continued)
as at 30 June 2020
153
Holdings Financial Liabilities at Fair Value Through Profit or Loss Fair Value % of Net
EUR Asset Value
Forward Contracts* (continued)
Buy EUR 437,853 Sell USD 498,000 17/07/2020 (5,330) (0.01)
Buy EUR 1,751,605 Sell USD 1,974,000 17/07/2020 (5,109) -
Buy EUR 1,432,487 Sell USD 1,612,000 17/07/2020 (2,074) -
Buy EUR 1,237,479 Sell GBP 1,123,000 17/07/2020 (1,991) -
Buy EUR 1,380,491 Sell USD 1,553,000 17/07/2020 (1,564) -
Buy JPY 3,292,777 Sell EUR 27,454 17/07/2020 (301) -
Buy EUR 19,343 Sell USD 22,000 17/07/2020 (235) -
Buy GBP 13,000 Sell EUR 14,558 17/07/2020 (210) -
Buy EUR 14,996 Sell USD 17,000 17/07/2020 (133) -
Buy EUR 5,455 Sell GBP 5,000 17/07/2020 (64) -
Buy EUR 21,284 Sell USD 23,969 17/07/2020 (47) -
Buy USD 22,500 Sell EUR 20,063 17/07/2020 (40) -
Buy EUR 16,234 Sell USD 18,282 17/07/2020 (35) -
Buy USD 44,900 Sell EUR 39,992 17/07/2020 (35) -
Buy EUR 15,097 Sell USD 17,000 17/07/2020 (31) -
Buy EUR 13,223 Sell GBP 12,000 17/07/2020 (21) -
Buy GBP 901 Sell EUR 1,010 17/07/2020 (16) -
Buy GBP 901 Sell EUR 1,010 17/07/2020 (16) -
Buy GBP 898 Sell EUR 1,007 17/07/2020 (16) -
Buy GBP 1,000 Sell EUR 1,114 17/07/2020 (10) -
Buy GBP 1,000 Sell EUR 1,114 17/07/2020 (10) -
Buy GBP 1,000 Sell EUR 1,114 17/07/2020 (10) -
Buy EUR 3,743 Sell USD 4,215 17/07/2020 (8) -
Buy USD 33,686 Sell EUR 29,984 17/07/2020 (6) -
Buy USD 25,124 Sell EUR 22,363 17/07/2020 (4) -
Buy USD 5,463 Sell EUR 4,863 17/07/2020 (1) -
Buy EUR 06 Sell CHF 06 17/07/2020 - -
Buy EUR 05 Sell CHF 05 17/07/2020 - -
Buy EUR 06 Sell CHF 06 17/07/2020 - -
Buy GBP 08 Sell EUR 09 17/07/2020 - -
Buy GBP 32 Sell EUR 36 17/07/2020 - -
Buy EUR 08 Sell GBP 07 17/07/2020 - -
Buy GBP 05 Sell EUR 06 17/07/2020 - -
Buy GBP 31 Sell EUR 34 17/07/2020 - -
Buy EUR 03 Sell GBP 03 17/07/2020 - -
Buy GBP 31 Sell EUR 34 17/07/2020 - -
Buy GBP 05 Sell EUR 06 17/07/2020 - -
Buy EUR 09 Sell HKD 80 17/07/2020 - -

ALGEBRIS UCITS FUNDS PLC
Algebris IG Financial Credit Fund
Unaudited Schedule of Investments (continued)
as at 30 June 2020
154
Holdings Financial Liabilities at Fair Value Through Profit or Loss Fair Value % of Net
EUR Asset Value
Forward Contracts* (continued)
Buy EUR 10 Sell HKD 88 17/07/2020 - -
Buy EUR 02 Sell HKD 19 17/07/2020 - -
Buy JPY 978 Sell EUR 08 17/07/2020 - -
Buy JPY 980 Sell EUR 08 17/07/2020 - -
Buy JPY 953 Sell EUR 08 17/07/2020 - -
Buy EUR 20 Sell SGD 31 17/07/2020 - -
Buy EUR 06 Sell SGD 09 17/07/2020 - -
Buy EUR 20 Sell SGD 32 17/07/2020 - -
Buy EUR 06 Sell SGD 09 17/07/2020 - -
Buy EUR 23 Sell SGD 37 17/07/2020 - -
Buy EUR 06 Sell SGD 09 17/07/2020 - -
Buy EUR 07 Sell USD 08 17/07/2020 - -
Buy EUR 07 Sell USD 08 17/07/2020 - -
Buy EUR 05 Sell USD 06 17/07/2020 - -
Total Forward Contracts* (533,353) (0.34)
Total Financial Liabilities at Fair Value Through Profit or
Loss (533,353) (0.34)
Net Financial Assets and Liabilities at Fair Value Through
Profit or Loss 137,062,091 86.97
Other Net Assets 20,543,405 13.03
Total Net Assets Attributable to Holders of Redeemable
Participating Shares 157,605,496 100.00
% of total
assets
Transferable securities admitted to an official stock
exchange listing or traded in a regulated market 122,945,465 76.85
Investment Funds 13,997,680 8.75
Over the counter financial derivatives 652,299 0.41
Cash and other current assets 22,391,643 13.99
Total Assets 159,987,087 100.00
*The counterparty for all the forward contracts is HSBC Bank plc.
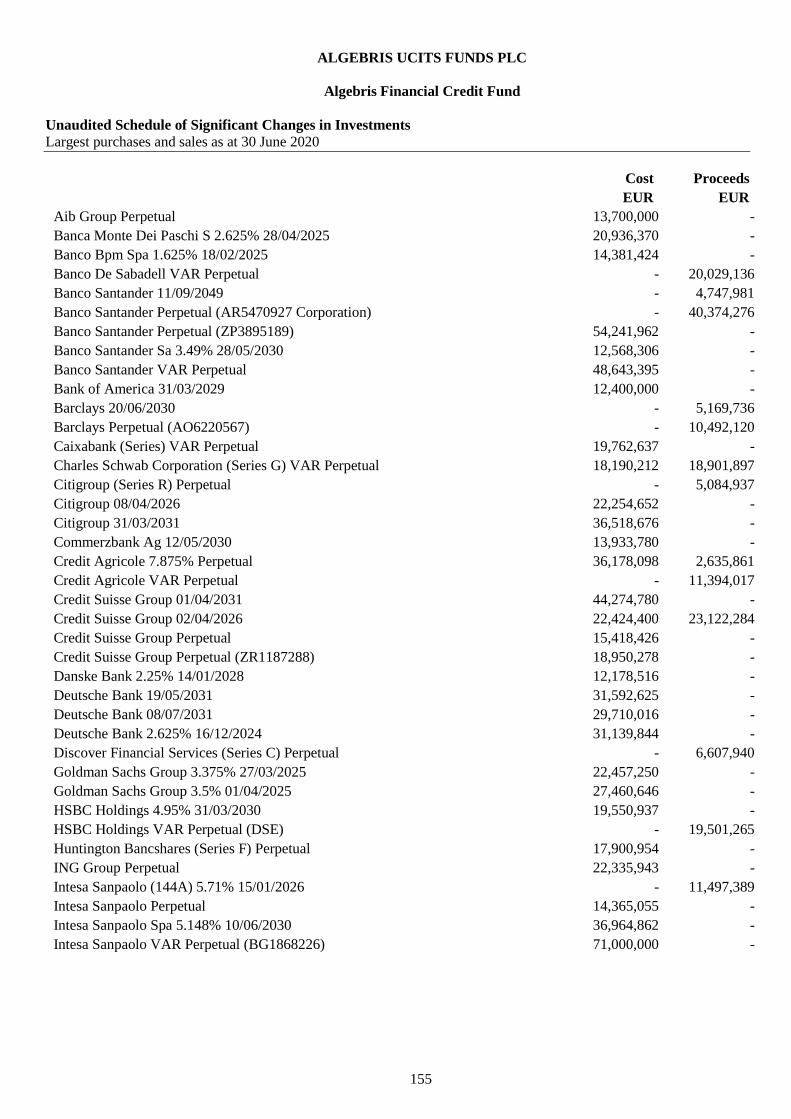
ALGEBRIS UCITS FUNDS PLC
Algebris Financial Credit Fund
Unaudited Schedule of Significant Changes in Investments
Largest purchases and sales as at 30 June 2020
155
Cost Proceeds
EUR EUR
Aib Group Perpetual 13,700,000 -
Banca Monte Dei Paschi S 2.625% 28/04/2025 20,936,370 -
Banco Bpm Spa 1.625% 18/02/2025 14,381,424 -
Banco De Sabadell VAR Perpetual - 20,029,136
Banco Santander 11/09/2049 - 4,747,981
Banco Santander Perpetual (AR5470927 Corporation) - 40,374,276
Banco Santander Perpetual (ZP3895189) 54,241,962 -
Banco Santander Sa 3.49% 28/05/2030 12,568,306 -
Banco Santander VAR Perpetual 48,643,395 -
Bank of America 31/03/2029 12,400,000 -
Barclays 20/06/2030 - 5,169,736
Barclays Perpetual (AO6220567) - 10,492,120
Caixabank (Series) VAR Perpetual 19,762,637 -
Charles Schwab Corporation (Series G) VAR Perpetual 18,190,212 18,901,897
Citigroup (Series R) Perpetual - 5,084,937
Citigroup 08/04/2026 22,254,652 -
Citigroup 31/03/2031 36,518,676 -
Commerzbank Ag 12/05/2030 13,933,780 -
Credit Agricole 7.875% Perpetual 36,178,098 2,635,861
Credit Agricole VAR Perpetual - 11,394,017
Credit Suisse Group 01/04/2031 44,274,780 -
Credit Suisse Group 02/04/2026 22,424,400 23,122,284
Credit Suisse Group Perpetual 15,418,426 -
Credit Suisse Group Perpetual (ZR1187288) 18,950,278 -
Danske Bank 2.25% 14/01/2028 12,178,516 -
Deutsche Bank 19/05/2031 31,592,625 -
Deutsche Bank 08/07/2031 29,710,016 -
Deutsche Bank 2.625% 16/12/2024 31,139,844 -
Discover Financial Services (Series C) Perpetual - 6,607,940
Goldman Sachs Group 3.375% 27/03/2025 22,457,250 -
Goldman Sachs Group 3.5% 01/04/2025 27,460,646 -
HSBC Holdings 4.95% 31/03/2030 19,550,937 -
HSBC Holdings VAR Perpetual (DSE) - 19,501,265
Huntington Bancshares (Series F) Perpetual 17,900,954 -
ING Group Perpetual 22,335,943 -
Intesa Sanpaolo (144A) 5.71% 15/01/2026 - 11,497,389
Intesa Sanpaolo Perpetual 14,365,055 -
Intesa Sanpaolo Spa 5.148% 10/06/2030 36,964,862 -
Intesa Sanpaolo VAR Perpetual (BG1868226) 71,000,000 -

ALGEBRIS UCITS FUNDS PLC
Algebris Financial Credit Fund
Unaudited Schedule of Significant Changes in Investments (continued)
Largest purchases and sales as at 30 June 2020
156
Cost Proceeds
EUR EUR
Jpmorgan Chase & Co VAR 13/05/2031 19,823,993 20,007,162
Morgan Stanley 01/04/2031 14,415,231 -
Nordea Bank Abp Perpetual - 2,041,622
Royal Bank of Scotland Group (BR) 14/08/2030 15,778,916 -
Royal Bank of Scotland Group (Series U) Perpetual 14,340,263 -
Royal Bank of Scotland Group Perpetual 37,328,356 -
Royal Bank of Scotland Group VAR Perpetual - 4,498,340
Societe Generale Perpetual (TRACE) - 3,959,524
Societe Generale VAR Perpetual (EJ9873484) 17,354,895 -
Standard Chartered 01/04/2031 46,600,181 -
Standard Chartered Perpetual (QZ2259237 Corporation) - 9,078,857
UBS Group Perpetual (JK4458820) 23,605,586 -
Unicredit 19/06/2032 23,090,908 -
Unicredit Perpetual - 15,104,423
Unicredit Spa 30/06/2035 29,093,160 -
Voya Financial 23/01/2048 - 11,475,277
The Schedule of Significant Changes in Investments (Unaudited) reflects the aggregate purchases of a security exceeding
one percent of the total value of purchases for the period and aggregate sales of a security exceeding one percent of the
total sales for the period.

ALGEBRIS UCITS FUNDS PLC
Algebris Financial Income Fund
Unaudited Schedule of Significant Changes in Investments
Largest purchases and sales as at 30 June 2020
157
Cost Proceeds
EUR EUR
ABN Amro Bank VAR Perpetual - 9,292,898
ABN AMRO Group 8,798,345 6,046,769
AGNC Investment 6,238,632 -
American International Group 2,205,144 3,007,503
American International Group (Series A-9) 01/04/2048 - 2,634,986
Annaly Capital Management - 4,628,734
Athene Holding 6.15% 03/04/2030 1,921,473 -
Athene Holding Class A 1,489,047 -
Axis Capital Holdings 1,428,178 -
Banco Bilbao Vizcaya ARG Perpetual (AX7516377) - 3,418,214
Banco Bradesco 2,324,690 -
Banco Santander Perpetual (AR5470927 Corporation) - 8,082,712
Banco Santander VAR Perpetual - 5,715,769
Banco Santander VAR Perpetual (ZP3895189) 3,400,000 -
Bank of America Corporation 2,449,233 2,171,761
Bank of New York Mellon Corporation 1,262,746 -
Barclays Perpetual (AO6220567) - 3,063,128
BNP Paribas Perpetual (AX7277939) - 2,686,295
Caixabank Perpetual - 5,196,772
Capital One Financial Corporation 1,260,290 -
Carlyle Group - 6,216,534
China Overseas Land & Investment - 2,459,614
Chubb 1,358,140 -
Citigroup 4,634,403 6,648,692
Citigroup FRN 25/08/2036 - 2,049,718
Citizens Financial Group 2,744,005 4,601,448
Credit Agricole VAR Perpetual - 2,960,401
Credit Suisse Group 10,888,522 6,260,412
Dai-ichi Life Holdings - 2,661,642
Danske Bank Perpetual - 3,052,882
E-Trade Financial Corporation - 3,870,925
Fifth Third Bancorp 2,578,763 2,711,563
First Horizon National Corporation 1,912,481 -
Huntington Bancshares 1,450,590 -
Huntington Bancshares (Series F) VAR Perpetual 1,181,281 -
ING Group 1,847,883 -
Invesco 3,302,459 3,839,119
Investors Bancorp 1,990,223 3,700,096
KBC Groep 2,374,583 114,093
Metlife 3,782,474 -
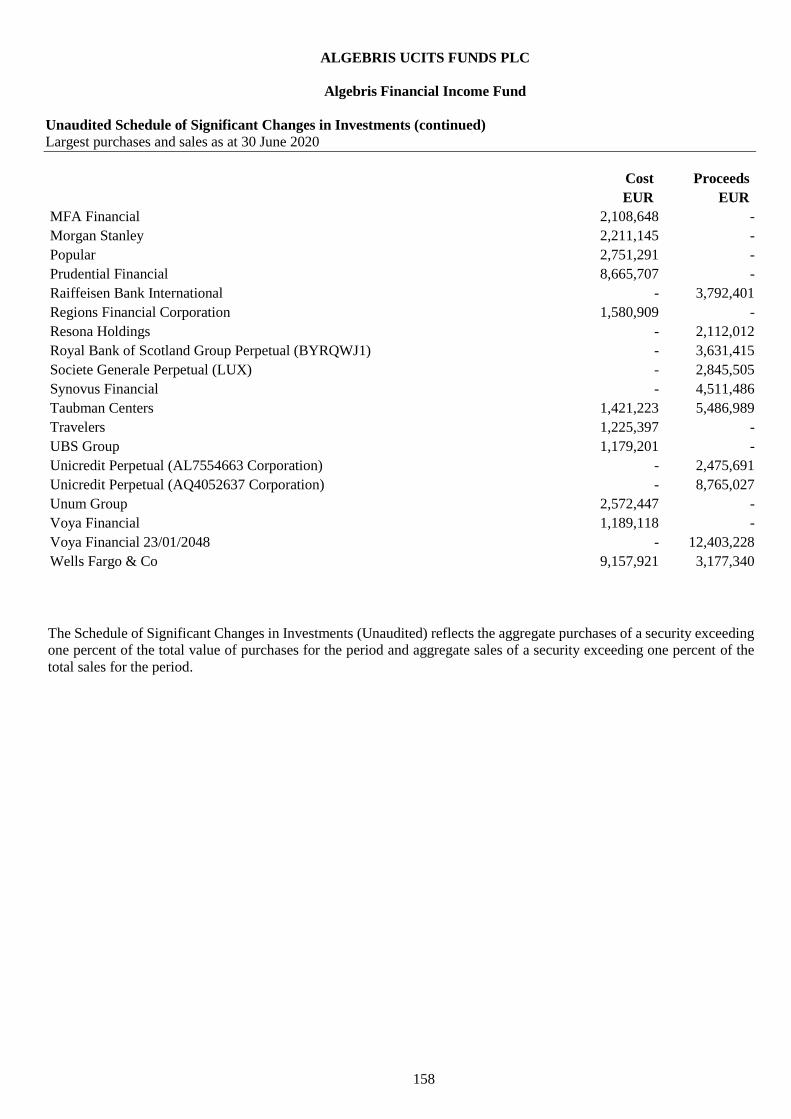
ALGEBRIS UCITS FUNDS PLC
Algebris Financial Income Fund
Unaudited Schedule of Significant Changes in Investments (continued)
Largest purchases and sales as at 30 June 2020
158
Cost Proceeds
EUR EUR
MFA Financial 2,108,648 -
Morgan Stanley 2,211,145 -
Popular 2,751,291 -
Prudential Financial 8,665,707 -
Raiffeisen Bank International - 3,792,401
Regions Financial Corporation 1,580,909 -
Resona Holdings - 2,112,012
Royal Bank of Scotland Group Perpetual (BYRQWJ1) - 3,631,415
Societe Generale Perpetual (LUX) - 2,845,505
Synovus Financial - 4,511,486
Taubman Centers 1,421,223 5,486,989
Travelers 1,225,397 -
UBS Group 1,179,201 -
Unicredit Perpetual (AL7554663 Corporation) - 2,475,691
Unicredit Perpetual (AQ4052637 Corporation) - 8,765,027
Unum Group 2,572,447 -
Voya Financial 1,189,118 -
Voya Financial 23/01/2048 - 12,403,228
Wells Fargo & Co 9,157,921 3,177,340
The Schedule of Significant Changes in Investments (Unaudited) reflects the aggregate purchases of a security exceeding
one percent of the total value of purchases for the period and aggregate sales of a security exceeding one percent of the
total sales for the period.

ALGEBRIS UCITS FUNDS PLC
Algebris Allocation Fund
Unaudited Schedule of Significant Changes in Investments
Largest purchases and sales as at 30 June 2020
159
Cost Proceeds
EUR EUR
Algebris Core Italy Fund Class M Accumulating 246,432 291,708
Algebris Financial Credit Fund Class M Accumulating - 348,834
Algebris Financial Credit Fund Class M USD Accumulating - 45,004
Algebris Financial Equity Fund Class M EUR Shares 208,264 82,340
Algebris Financial Income Fund Class M Accumulating - 242,214
Algebris Global Credit Opportunities Fund Class M Accumulating - 238,137
Algebris IG Financial Credit Fund Class M EUR Accumulating - 300,271
Algebris IG Financial Credit Fund Class M USD Accumulating - 71,556
Algebris Quant Arbitrage Fund Class M Accumulating - 745,085
The Schedule of Significant Changes in Investments (Unaudited) reflects the aggregate purchases of a security exceeding
one percent of the total value of purchases for the period and aggregate sales of a security exceeding one percent of the total
sales for the period.

ALGEBRIS UCITS FUNDS PLC
Algebris Financial Equity Fund
Unaudited Schedule of Significant Changes in Investments
Largest purchases and sales as at 30 June 2020
160
Cost Proceeds
EUR EUR
ABN AMRO Group 1,654,871 -
AGNC Investment 1,000,328 -
Allegheny Corporation 761,925 -
Ally Financial 1,432,278 1,314,223
American International Group 727,550 -
Athene Holding Class A 886,727 1,017,367
Banco Bradesco 707,255 599,923
Bank of America Corporation 679,465 607,569
BAWAG Group 782,096 1,006,505
BGC Partners Class A 620,736 -
Brighthouse Financial 721,526 792,964
Brightsphere Investment Group 773,664 1,851,350
Capital One Financial Corporation 1,479,724 971,247
Carlyle Group - 1,009,934
China Overseas Land & Investment - 1,153,220
Citigroup 1,614,722 1,731,480
Citizens Financial Group 628,755 886,754
Credit Suisse Group 2,426,185 1,269,705
Dai-ichi Life Holdings - 677,621
Erste Group Bank 1,100,552 1,591,900
E-Trade Financial Corporation - 1,273,994
Evercore - 687,924
First Horizon National Corporation 657,447 -
Flagstar Bancorp 982,338 -
Iberiabank Corporation - 804,538
Independent Bank Group 974,750 980,683
ING Group 1,518,125 -
Invesco 757,296 1,378,841
Investors Bancorp - 755,039
KKR & Co - 726,931
Metlife 661,789 -
MGIC Investment Corporation 1,662,654 703,056
National General Holdings - 651,325
OneMain Holdings - 792,287
Popular 1,084,232 -
Prudential Financial 1,515,811 -
Radian Group 1,505,244 -
Resona Holdings - 620,316
Santander Consumer USA Holdings - 1,148,639
Spain Letras Del Tesoro 0% 09/10/2020 5,009,825 -

ALGEBRIS UCITS FUNDS PLC
Algebris Financial Equity Fund
Unaudited Schedule of Significant Changes in Investments (continued)
Largest purchases and sales as at 30 June 2020
161
Cost Proceeds
EUR EUR
Spain Letras Del Tesoro 0% 12/06/2020 10,015,892 10,006,756
Spain Letras Del Tesoro 0% 17/04/2020 2,700,000 2,700,546
Synovus Financial - 956,112
Taubman Centers - 989,755
Texas Capital Bancshares 805,030 -
UBS Group - 558,762
Unum Group - 647,335
Voya Financial 1,144,454 -
Wells Fargo & Co 1,727,254 707,621
The Schedule of Significant Changes in Investments (Unaudited) reflects the aggregate purchases of a security exceeding
one percent of the total value of purchases for the period and aggregate sales of a security exceeding one percent of the
total sales for the period.

ALGEBRIS UCITS FUNDS PLC
Algebris Global Credit Opportunities Fund
Unaudited Schedule of Significant Changes in Investments
Largest purchases and sales as at 30 June 2020
162
Cost Proceeds
EUR EUR
ABN Amro Bank VAR Perpetual 4,581,594 5,012,344
Banca Monte Dei Paschi 2.625% 28/04/2025 7,975,760 8,109,240
Banca Monte Dei Paschi 10.5% 23/07/2029 - 10,980,990
Banco Comerc Portugues Perpetual - 5,056,128
Banco Santander 2.746% 28/05/2025 - 4,610,773
Bank of Ireland Group 19/09/2027 5,222,298 -
Barclays VAR 02/04/2025 4,983,100 5,302,461
BPCE 5.7% 22/10/2023 5,456,893 5,530,499
Buoni Poliennali Del Tesoro 3.85% 01/09/2049 8,603,041 8,603,965
Caixabank Perpetual - 9,557,148
Commerzbank Perpetual 6,400,000 -
Deutsche Bank 19/05/2031 5,674,131 -
Enel Spa (144A) (REG) VAR 24/09/2073 5,759,467 6,247,145
Eni (Series ENI) Convertible 0% 13/04/2022 4,933,500 -
Government of Egypt (Series 7YR) 0% 06/08/2026 - 5,942,756
Ibercaja Banco Perpetual - 5,569,923
Indonesia Government (Series FR65) 6.625% 15/05/2033 4,562,814 -
Indonesia Government (Series FR78) 8.25% 15/05/2029 - 6,773,344
Indonesia Government (Series FR81) 6.5% 15/06/2025 7,353,608 7,691,042
Indonesia Government (Series FR82) 7% 15/09/2030 - 11,486,041
Ing Groep VAR 22/03/2028 - 4,348,368
Intesa Sanpaolo VAR Perpetual - 6,778,547
Intesa Sanpaolo Perpetual (BG1868226) 10,600,000 -
iShares MSCI Emerging Markets 10,415,631 8,170,290
Mex Bonos Desarr Fix Rights (Series M 20) 8.5% 31/05/2029 - 10,632,737
Mex Bonos Desarr Fix Rights (Series M) 7.75% 29/05/2031 - 14,260,767
Mex Bonos Desarr Fix Rights (Series M) 7.75% 13/11/2042 - 5,083,847
Mitsubishi Ufj Investor (Series PRX) 15/12/2050 5,056,758 7,334,815
Petroleos Mexicanos 2.75% 21/04/2027 - 9,803,964
Russia Govt Bond - OFZ (Series 6027) 8.15% 03/02/2027 - 5,716,237
Societe Generale 4.25% 19/08/2026 - 4,402,996
Telecom Italia Spa Convertible 1.125% 26/03/2022 6,088,389 -
Total (Series FP) Convertible 0.5% 02/12/2022 9,857,925 -
Ukraine Government VAR - 5,814,050
Unicredit Perpetual (AQ4052637 Corporation) - 6,900,859
US Treasury Note 1.125% 28/02/2022 36,891,017 -
US Treasury Note 1.125% 28/02/2025 36,371,704 36,855,691
Veolia Environnement Sa Convertible 0% 01/01/2025 6,198,312 -
Vodafone Group Convertible 1.2% 12/03/2021 - 4,445,683
The Schedule of Significant Changes in Investments (Unaudited) reflects the aggregate purchases of a security exceeding
one percent of the total value of purchases for the period and aggregate sales of a security exceeding one percent of the
total sales for the period.

ALGEBRIS UCITS FUNDS PLC
Algebris Core Italy Fund
Unaudited Schedule of Significant Changes in Investments
Largest purchases and sales as at 30 June 2020
163
Cost Proceeds
EUR EUR
Amplifon 1,142,058 837,423
Anima Holding - 685,074
Arnoldo Mondadori Editore - 608,458
ASTM 900,561 910,894
Autogrill 786,641 488,683
Avio - 465,224
Azimut Holding 496,431 500,412
Banca Mediolanum 577,098 -
Banca Popolare di Sondrio 552,157 -
Banco Bpm 1,069,670 1,094,046
Biesse 638,908 -
Brunello Cucinelli 699,861 583,806
Buzzi Unicem 872,093 529,417
Carel Industries 734,266 709,786
CNH Industrial 659,419 -
Datalogic - 502,318
DiaSorin - 550,309
doValue - 710,045
Enel 689,810 750,380
Exor 1,402,014 1,388,969
Ferrari 516,602 466,893
Fiat Chrysler Automobiles 1,402,349 660,911
Fiera Milano - 974,431
FinecoBank Banca Fineco 1,118,868 1,277,963
IMA Industria Macchine Automatiche 686,939 -
Infrastrutture Wireless Italiane 749,540 -
Intesa Sanpaolo 1,663,037 1,770,921
Iren - 842,625
Italgas 490,474 509,651
Leonardo - 827,756
Mediobanca 951,932 1,148,226
Moncler 2,488,913 2,881,752
Nexi 997,994 479,531
OVS - 821,553
Piaggio & C - 533,650
Pirelli & C 977,273 957,080
Poste Italiane 1,660,528 921,656
RAI Way 657,641 1,056,092
Reply - 615,419
Safilo Group 817,334 548,775

ALGEBRIS UCITS FUNDS PLC
Algebris Core Italy Fund
Unaudited Schedule of Significant Changes in Investments (continued)
Largest purchases and sales as at 30 June 2020
164
Cost Proceeds
EUR EUR
Saipem 1,979,448 1,147,984
Salvatore Ferragamo 780,820 848,276
Saras 873,016 814,243
STMicroelectronics 588,028 625,624
Tamburi Investment Partners - 442,549
Telecom Italia/Milano 1,726,440 1,209,113
Telecom Italia/Milano (TIT) 991,683 -
UniCredit 509,633 1,319,926
Unieuro 867,690 525,841
Unione di Banche Italiane 734,778 595,004
UnipolSai Assicurazioni - 441,941
The Schedule of Significant Changes in Investments (Unaudited) reflects the aggregate purchases of a security
exceeding one percent of the total value of purchases for the period and aggregate sales of a security exceeding one
percent of the total sales for the period.
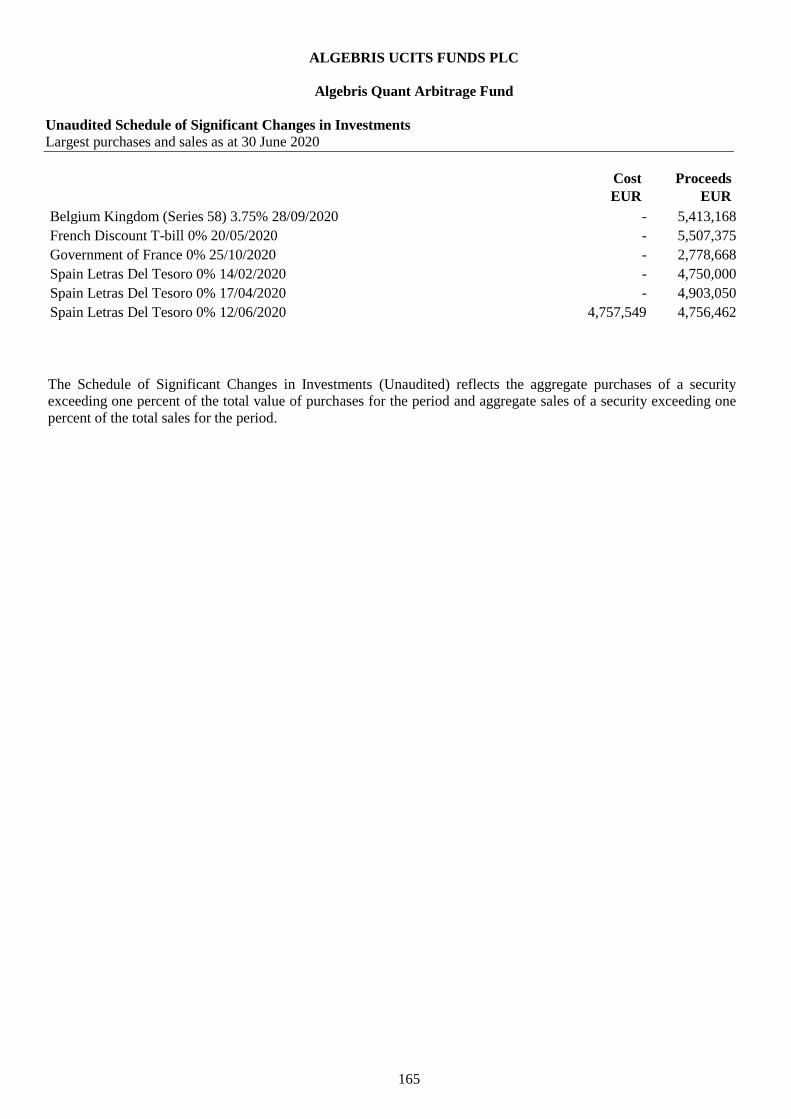
ALGEBRIS UCITS FUNDS PLC
Algebris Quant Arbitrage Fund
Unaudited Schedule of Significant Changes in Investments
Largest purchases and sales as at 30 June 2020
165
Cost Proceeds
EUR EUR
Belgium Kingdom (Series 58) 3.75% 28/09/2020 - 5,413,168
French Discount T-bill 0% 20/05/2020 - 5,507,375
Government of France 0% 25/10/2020 - 2,778,668
Spain Letras Del Tesoro 0% 14/02/2020 - 4,750,000
Spain Letras Del Tesoro 0% 17/04/2020 - 4,903,050
Spain Letras Del Tesoro 0% 12/06/2020 4,757,549 4,756,462
The Schedule of Significant Changes in Investments (Unaudited) reflects the aggregate purchases of a security
exceeding one percent of the total value of purchases for the period and aggregate sales of a security exceeding one
percent of the total sales for the period.

ALGEBRIS UCITS FUNDS PLC
Algebris IG Financial Credit Fund
Unaudited Schedule of Significant Changes in Investments
Largest purchases and sales as at 30 June 2020
166
Cost Proceeds
EUR EUR
ABN Amro Bank 27/03/2028 1,919,984 -
Algebris Financial Credit Fund Class M Accumulating 12,707,445 -
Allianz 08/07/2050 1,500,030 -
Banco Bilbao Vizcaya ARG 22/02/2029 2,191,077 -
Banco De Sabadell VAR 12/12/2028 - 1,107,042
Banco Santander Perpetual (ZP3895189) 3,501,231 -
Banco Santander VAR Perpetual - 2,108,750
Barclays 07/05/2026 1,855,064 -
Barclays 22/11/2030 6,794,633 -
Barclays 4.75% Perpetual - 982,698
Bnp Paribas 13/01/2031 4,120,571 -
Bnp Paribas 4.4% 14/08/2028 3,214,216 -
Caixabank VAR 17/04/2030 2,991,716 -
Charles Schwab Corporation (Series G) VAR Perpetual - 479,877
Citigroup (Series R) Perpetual - 175,658
Citigroup 25/08/2036 3,165,349 -
Commerzbank 05/12/2030 3,549,791 -
Credit Agricole VAR Perpetual 1,688,257 -
Credit Suisse Group 02/04/2026 1,413,156 108,545
Credit Suisse Group 09/06/2028 5,596,141 -
Credit Suisse Group 01/04/2031 2,550,197 -
Danske Bank 2.25% 14/01/2028 5,771,392 -
Deutsche Bank 2.625% 16/12/2024 2,385,462 -
Erste Group Bank Perpetual 1,601,945 -
Huntington Bancshares (Series F) Perpetual 1,590,186 -
Ing Group 22/03/2028 1,894,590 -
Intesa Sanpaolo 2.125% 26/05/2025 3,992,120 -
Intesa Sanpaolo 2.5% 15/01/2030 3,085,085 -
Intesa Sanpaolo SPA 5.148% 10/06/2030 1,724,239 -
JPMorgan Chase & Co VAR 13/05/2031 - 935,108
Lloyds Banking Group 01/04/2026 1,691,891 -
Royal Bank of Scotland Group 01/11/2029 1,512,806 -
Royal Bank of Scotland Group 14/08/2030 2,280,408 -
Royal Bank of Scotland Group 6.125% 15/12/2022 1,420,309 -
Santander UK Group Holdings 4.75% 15/09/2025 1,711,197 -
Standard Chartered 30/01/2026 1,807,164 -
Unicredit 15/01/2032 2,743,168 200,760
Unicredit 19/06/2032 3,733,152 -

ALGEBRIS UCITS FUNDS PLC
Algebris IG Financial Credit Fund
Unaudited Schedule of Significant Changes in Investments (continued)
Largest purchases and sales as at 30 June 2020
167
Cost Proceeds
EUR EUR
Unicredit 30/06/2035 1,591,723 -
Unione Di Banche Italian 12/07/2029 2,479,604 772,742
Unipol Gruppo 3.5% 29/11/2027 3,333,074 -
Wells Fargo & Co VAR 04/05/2030 1,600,000 -
The Schedule of Significant Changes in Investments (Unaudited) reflects the aggregate purchases of a security
exceeding one percent of the total value of purchases for the period and aggregate sales of a security exceeding one
percent of the total sales for the period.

Other Additional Disclosures (Unaudited)
168
Algebris UCITS Funds Plc (the “Company”) is an investment company with variable capital incorporated with limited
liability in Ireland and established as an umbrella fund with segregated liability between sub-funds pursuant to the
Companies Act 2014 and the Central Bank (Supervision and Enforcement Act 2013 (Section 48(1)) (Undertakings for
Collective Investment in Transferable Securities) Regulations 2015 (the “Central Bank UCITS Regulations”).
IMPORTANT NOTICE TO INVESTORS IN GERMANY
The information agent in Germany is ACOLIN Europe GmbH, with registered office at Reichenaustrasse 11a-c, D-78467
Konstanz, Germany.
The basic documents of the Company and the sub-funds, such as the prospectus (in English) and the key investor
information documents (in German), may be obtained free of charge at the registered office of the German information
agent.
IMPORTANT NOTICE TO INVESTORS IN SWITZERLAND
1) The state of the origin of the fund is Ireland.
2) The representative is ACOLIN Fund Services AG, Leutschenbachstrasse 50, CH-8050 Zurich.
3) The paying agent is Bank Vontobel Ltd., Gotthardstrasse 43, CH-8022 Zurich.
4) The prospectus, the Key Investor Information Documents, the fund regulation, the list of purchases and sales as well
as the annual and semi-annual reports may be obtained free of charge from the representative.
5) The total expense ratio (TER) was calculated based on the version currently applicable of the “Guidelines on the
calculation and disclosure of the Total Expense Ratio (TER) of collective investment schemes” of the Swiss Funds &
Asset Management Association (SFAMA).
For the period from 01.07.2019 to 30.06.2020:
Sub-Fund Share class TER
Algebris Financial Credit Fund CHF Class C 1.11%
CHF Class I 1.50%
CHF Class Id 0.92%
CHF Class R 2.05%
CHF Class Rd 2.11%
CHF Class W 1.61%
CHF Class WD 1.61%
CHF Class Z 0.90%
EUR Class C 1.11%
EUR Class Cd 1.11%
EUR Class I 1.50%
EUR Class Id 1.45%
EUR Class M 0.11%
EUR Class Md 0.11%
EUR Class R 2.08%
EUR Class Rd 2.07%
EUR Class W 1.61%
EUR Class Wd 1.61%
EUR Class XXLd 0.61%
EUR Class Z 0.90%
EUR Class Zd 0.90%
GBP Class C 1.11%
GBP Class Cd 1.11%
GBP Class I 1.50%
GBP Class Id 1.46%
GBP Class M 0.11%

Other Additional Disclosures (Unaudited)
169
Total Expense Ratio (continued)
Sub-Fund Share class TER
Algebris Financial Credit Fund GBP Class Md 0.11%
GBP Class R 2.15%
GBP Class Rd 2.14%
GBP Class W 1.61%
GBP Class Wd 1.61%
GBP Class Z 0.90%
GBP Class Zd 0.90%
HKD Class I 1.68%
HKD Class R 2.32%
JPY Class I 1.43%
SGD Class I 1.69%
SGD Class Id 1.36%
SGD Class R 2.33%
SGD Class Rd 2.28%
SGD Class Wd 1.61%
USD Class 12D 0.96%
USD Class A 1.46%
USD Class C 1.11%
USD Class Cd 1.11%
USD Class I 1.75%
USD Class Id 1.69%
USD Class M 0.11%
USD Class Md 0.11%
USD Class R 2.34%
USD Class Rd 2.34%
USD Class W 1.61%
USD Class Wd 1.61%
USD Class XXL 0.61%
USD Class Z 0.90%
USD Class Zd 0.90%
Sub-Fund Share class TER*
Algebris Financial Income Fund CHF Class B 0.69%
CHF Class I 1.09%
CHF Class ID 1.09%
CHF Class R 1.99%
CHF Class Rd 1.99%
EUR Class B 0.69%
EUR Class Bd 0.69%
EUR Class I 1.09%
EUR Class Id 1.09%
EUR Class M 0.19%
EUR Class Md 0.19%
EUR Class R 1.99%
EUR Class Rd 1.99%
GBP Class Bd 0.69%
GBP Class I 1.09%
GBP Class Id 1.09%
GBP Class M 0.19%
GBP Class R 1.99%
GBP Class Rd 1.99%

Other Additional Disclosures (Unaudited)
170
Total Expense Ratio (continued)
Sub-Fund Share class TER*
Algebris Financial Income Fund HKD Class I 1.09%
HKD Class R 1.99%
JPY Class I 1.09%
SGD Class I 1.09%
SGD Class Id 1.09%
SGD Class R 1.99%
SGD Class Rd 1.99%
USD Class A 1.84%
USD Class Bd 0.69%
USD Class I 1.09%
USD Class Id 1.09%
USD Class M 0.19%
USD Class Md 0.19%
USD Class R 1.99%
USD Class Rd 1.99%
Sub-Fund Share class TER
Algebris Allocation Fund CHF Class R 2.10%
EUR Class B 1.48%
EUR Class I 1.30%
EUR Class M 0.50%
EUR Class R 2.10%
JPY Class B 1.49%
USD Class R 2.10%
Sub-Fund Share class TER
Algebris Financial Equity Fund CHF Class B 1.42%
CHF Class R 2.42%
EUR Class B 1.42%
EUR Class Bm 1.42%
EUR Class I 1.67%
EUR Class M 0.42%
EUR Class R 2.42%
EUR Class Rm 2.42%
GBP Class B 1.42%
GBP Class I 3.13%
GBP Class M 0.42%
GBP Class Md 0.42%
GBP Class Mm 0.42%
JPY Class B 2.24%
USD Class B 1.42%
USD Class Bm 1.42%
USD Class I 1.67%
USD Class M 0.42%
USD Class Md 0.42%
USD Class Mm 0.42%

Other Additional Disclosures (Unaudited)
171
Total Expense Ratio (continued)
*The sub-fund portfolio of investments was liquidated into cash on 19 March 2020 and final redemptions were
made as at 5 May 2020.
**Formerly known as Algebris Macro Credit Fund.
Sub-Fund Share class TER
Algebris Global Credit Opportunities Fund** CHF Class B 1.89%
CHF Class Bd 1.30%
CHF Class R 1.90%
EUR Class B 1.98%
EUR Class Bd 1.95%
EUR Class I 2.71%
EUR Class Id 2.50%
EUR Class M 0.23%
EUR Class Md 0.23%
EUR Class R 2.93%
EUR Class Rd 2.86%
GBP Class B 2.27%
GBP Class I 3.50%
GBP Class Id 2.74%
GBP Class M 0.23%
GBP Class Md 0.23%
GBP Class R 3.13%
JPY Class I 2.99%
USD Class B 2.55%
USD Class I 3.83%
USD Class M 0.23%
USD Class Md 0.23%
USD Class R 3.87%
Sub-Fund Share class TER
Algebris Core Italy Fund EUR Class EB 0.98%
EUR Class I 2.21%
EUR Class M 0.48%
EUR Class R 2.17%
GBP Class M 0.48%
JPY Class I 2.23%
USD Class I 2.35%
Sub-Fund Share class TER
Algebris Quant Arbitrage Fund* EUR Class Eb 1.12%
EUR Class I 1.48%
EUR Class M 0.60%
EUR Class R 2.26%
GBP Class Eb 1.43%
GBP Class M 0.60%
JPY Class I 1.57%
USD Class Eb 1.40%
USD Class I 1.77%
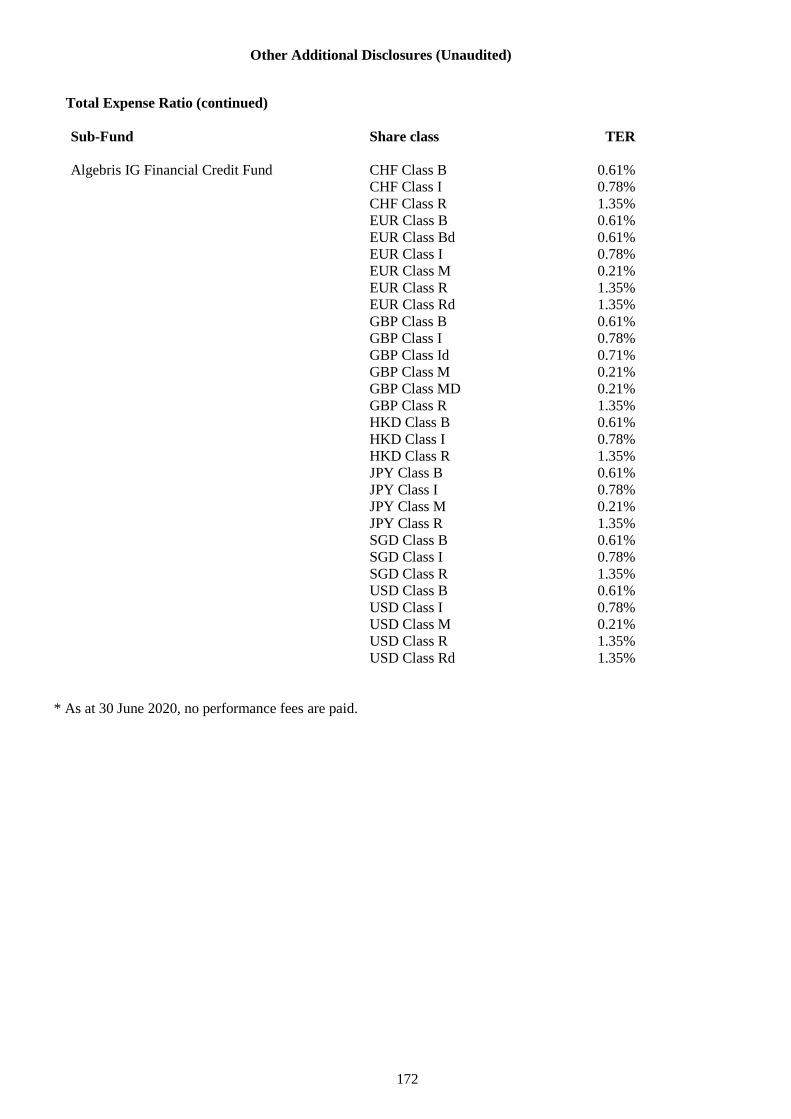
Other Additional Disclosures (Unaudited)
172
Total Expense Ratio (continued)
* As at 30 June 2020, no performance fees are paid.
Sub-Fund Share class TER
Algebris IG Financial Credit Fund CHF Class B 0.61%
CHF Class I 0.78%
CHF Class R 1.35%
EUR Class B 0.61%
EUR Class Bd 0.61%
EUR Class I 0.78%
EUR Class M 0.21%
EUR Class R 1.35%
EUR Class Rd 1.35%
GBP Class B 0.61%
GBP Class I 0.78%
GBP Class Id 0.71%
GBP Class M 0.21%
GBP Class MD 0.21%
GBP Class R 1.35%
HKD Class B 0.61%
HKD Class I 0.78%
HKD Class R 1.35%
JPY Class B 0.61%
JPY Class I 0.78%
JPY Class M 0.21%
JPY Class R 1.35%
SGD Class B 0.61%
SGD Class I 0.78%
SGD Class R 1.35%
USD Class B 0.61%
USD Class I 0.78%
USD Class M 0.21%
USD Class R 1.35%
USD Class Rd 1.35%

Other Additional Disclosures (Unaudited)
173
Securities Financing Transaction
A Securities Financing Transaction (“SFT”) is defined per Article 3(11) of the Securities Financing Transaction
Regulation (“SFTR”) as;
a repurchase transaction or a reverse repurchase transaction;
a securities or commodities lending and securities or commodities borrowing;
a buy-sell back transaction or sell-buy back transaction;
a margin lending transaction.
As at 30 June 2020, the Sub-Funds engaged in two types of SFT’s: Total Return Swaps and Repurchase Agreements.
Algebris Financial Income Fund
The amount of securities and commodities on loan as a proportion of total lendable assets (excluding cash and cash
equivalents) was 0% as at 30 June 2020.
Global data
Absolute amount
EUR % of Net assets
Total Return Swaps 5,048,669 1.75%
Total 5,048,669 1.75%
Concentration data
The following table reflects the counter parties across all Total Return Swaps as at 30 June 2020, is as follows:
Counterparty
Swaps
EUR
HSBC Bank Plc 5,048,669
Total 5,048,669

Other Additional Disclosures (Unaudited)
174
Securities Financing Transaction (continued)
Algebris Financial Income Fund (continued)
Aggregate Transaction Data
Counterparty Type of SFT
Maturity tenor
(SFTs/Total
Return Swaps)
Market
Value
(EUR) MTM (EUR)
Country of
counterparty
establishment
(not collateral)
Settlement
and clearing
HSBC Bank Plc
Total Return
Swap Above one year 5,048,669 UK Bilateral
The Company does not segregate cash collateral received and as such there is no segregation of any reinvestment return
on cash collateral for the period to 30 June 2020.
The Company has no custody accounts in existence specifically for the safekeeping of collateral received.
Safekeeping
Depositary Collateral assets safe-kept
EUR
HSBC Bank Plc 18,889,504
Total 18,889,504
The proportion of collateral held in segregated accounts is 100%.
Data on return and cost for Swap
The following table reflects the return and cost for Swaps broken down between the Sub-Fund, the Investment Manager
and third parties for the period ended 30 June 2020. The returns presented are isolated to the financing transactions
themselves and therefore do not include investment returns on the underlying collateral positions:
Fund Manager
Third
parties
EUR EUR EUR
Total Return Swaps 2,212 - -
Total 2,212 - -
Algebris Financial Equity Fund
The amount of securities and commodities on loan as a proportion of total lendable assets (excluding cash and cash
equivalents) was 0% as at 30 June 2020.
Global data
Absolute amount
EUR % of Net assets
Total Return Swaps 2,348,437 5.00%
Total 2,348,437 5.00%

Other Additional Disclosures (Unaudited)
175
Securities Financing Transaction (continued)
Algebris Financial Equity Fund (continued)
Concentration data
The following table reflects the counter parties across all Total Return Swaps contracts as at 30 June 2020, is as follows:
Counterparty
Swaps
EUR
HSBC Bank Plc 2,346,612
Morgan Stanley & Co International Plc 1,825
Total 2,348,437
Aggregate Transaction Data
Counterparty Type of SFT
Maturity tenor
(SFTs/Total
Return Swaps)
Market
Value
(EUR)
MTM
(EUR)
Country of
counterparty
establishment
(not collateral)
Settlement
and
clearing
HSBC Bank Plc Total Return Swap
Three Months
to one year 2,346,612 UK Bilateral
Morgan Stanley & Co
International Plc Total Return Swap
One Month to
Three Months 1,825 UK Bilateral
The Company does not segregate cash collateral received and as such there is no segregation of any reinvestment return
on cash collateral for the period to 30 June 2020.
The Company has no custody accounts in existence specifically for the safekeeping of collateral received.
Safekeeping
Depositary Collateral assets safe-kept
EUR
HSBC Bank Plc 7,847,544
Morgan Stanley 293,759
Total 8,141,303
The proportion of collateral held in pooled accounts is 4%. The proportion of collateral held in segregated accounts
is 96%
Data on return and cost for Swap
The following table reflects the return and cost for Swaps broken down between the Sub-Fund, the Investment Manager
and third parties for the period ended 30 June 2020. The returns presented are isolated to the financing transactions
themselves and therefore do not include investment returns on the underlying collateral positions:
Fund Manager
Third
parties
EUR EUR EUR
Total Return Swaps 20,970 - -
Total 20,970 - -
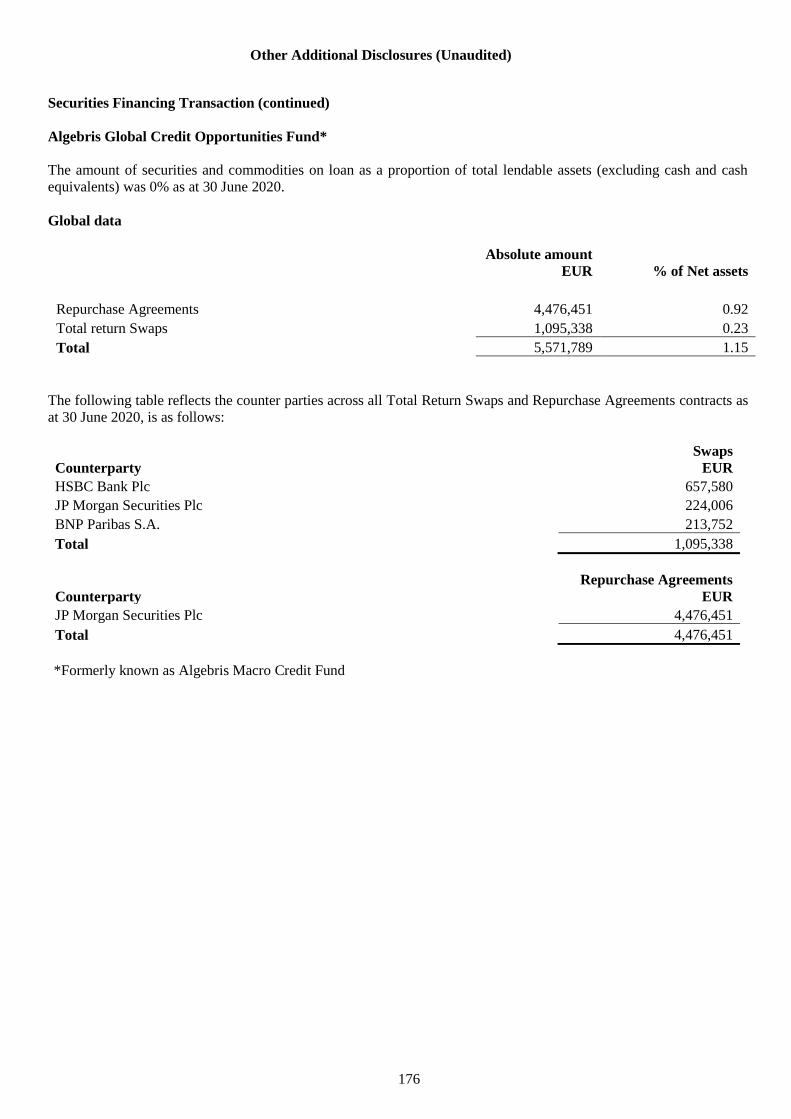
Other Additional Disclosures (Unaudited)
176
Securities Financing Transaction (continued)
Algebris Global Credit Opportunities Fund*
The amount of securities and commodities on loan as a proportion of total lendable assets (excluding cash and cash
equivalents) was 0% as at 30 June 2020.
Global data
Absolute amount
EUR % of Net assets
Repurchase Agreements 4,476,451 0.92
Total return Swaps 1,095,338 0.23
Total 5,571,789 1.15
The following table reflects the counter parties across all Total Return Swaps and Repurchase Agreements contracts as
at 30 June 2020, is as follows:
Counterparty
Swaps
EUR
HSBC Bank Plc 657,580
JP Morgan Securities Plc 224,006
BNP Paribas S.A. 213,752
Total 1,095,338
Counterparty
Repurchase Agreements
EUR
JP Morgan Securities Plc 4,476,451
Total 4,476,451
*Formerly known as Algebris Macro Credit Fund

Other Additional Disclosures (Unaudited)
177
Securities Financing Transaction (continued)
Algebris Global Credit Opportunities Fund* (continued)
Aggregate Transaction Data
Type of SFT
Maturity
tenor
(SFTs/Total
Return
Swaps)
Market
Value
(EUR)
MTM
(EUR)
Country of
counterparty
establishment
(not collateral)
Settlement
and
clearing Quality Currency JP Morgan
Securities Plc
Repurchase
Agreement Open 847,525 UK Bilateral NR EUR
JP Morgan
Securities Plc
Repurchase
Agreement Open 1,799,879 UK Bilateral HY EUR
JP Morgan
Securities Plc
Repurchase
Agreement Open 1,829,047 UK Bilateral IG EUR
JP Morgan
Securities Plc
Cash
Collateral Open 152,872 UK Bilateral EUR
JP Morgan
Securities Plc
Total Return
Swap
Three months
to one year 224,006 UK Bilateral EUR
HSBC Bank
Plc
Total Return
Swap
Three months
to one year 657,580 UK Bilateral USD
BNP Paribas
S.A.
Total Return
Swap
Above one
year 213,752 UK Bilateral USD
The Company does not segregate cash collateral received and as such there is no segregation of any reinvestment return
on cash collateral for the period to 30 June 2020.
The Company has no custody accounts in existence specifically for the safekeeping of collateral received.

Other Additional Disclosures (Unaudited)
178
Securities Financing Transaction (continued)
Algebris Global Credit Opportunities Fund* (continued)
Safekeeping
Depositary Collateral assets safe-kept
EUR
HSBC Bank Plc 2,338,115
BNP Paribas S.A. 694,392
JP Morgan Securities Plc 366,624
Total 3.399,131
The proportion of collateral held in pooled accounts is 100%.
Data on return and cost for Swap and Repurchase Agreements
The following table reflects the return and cost for Swaps broken down between the Sub-Fund, the Investment Manager
and third parties for the period ended 30 June 2020. The returns presented are isolated to the financing transactions
themselves and therefore do not include investment returns on the underlying collateral positions:
Fund
Manager
Third
parties
EUR EUR EUR
Repurchase Agreements 2,097 - -
Total return Swaps 72,242 - -
Total 74,339 - -
Algebris Quant Arbitrage Fund
The Algebris Quant Arbitrage Fund has not engaged in any SFT’s as at 30 June 2020.
Data on return and cost for Swap and Repurchase Agreements
The following table reflects the return and cost for Swaps broken down between the Sub-Fund, the Investment Manager
and third parties for the period ended 30 June 2020. The returns presented are isolated to the financing transactions
themselves and therefore do not include investment returns on the underlying collateral positions:
Fund
Manager
Third
parties
EUR EUR EUR
Total return Swaps 51,108 - -
Total 51,108 - -

Other Additional Disclosures (Unaudited)
179
Securities Financing Transaction (continued)
Algebris Financial Credit Fund
The Algebris Financial Credit Fund has not engaged in any SFT’s for the period ended 30 June 2020.
Algebris Allocation Fund
The Algebris Allocation Fund has not engaged in any SFT’s for the period ended 30 June 2020.
Algebris Core Italy Fund
The Algebris Core Italy Fund has not engaged in any SFT’s for the period ended 30 June 2020.
Algebris IG Financial Credit Fund
The Algebris IG Financial Credit Fund has not engaged in any SFT’s for the period ended 30 June 2020.