alignment of regulatory and lifecycle management
TRANSCRIPT

ALIGNMENT OF REGULATORY AND LIFECYCLE MANAGEMENT STRATEGIES FOR DRUGS SUBMITTED AS NEW DRUG APPLICATIONS
UNDER 505(B)(2) OF THE FOOD, DRUG, AND COSMETIC ACT
by
Margaret VanHeusen
A thesis submitted to Johns Hopkins University in conformity with the requirements for the degree of Master of Science in Biotechnology with a concentration in Regulatory Affairs
Baltimore, MD May, 2017
© 2017 Margaret VanHeusen
All Rights Reserved

ii
I. Abstract
Section 505(b)(2) of the Food, Drug, and Cosmetic Act (FDCA) (“505(b)(2)”), a
component of the 1984 Hatch-Waxman Amendment allows the Food and Drug Administration
(FDA) to rely on evidence not owned by the applicant. When combined with Section 115(a) of
the Food and Drug Administration Modernization Act of 1997 (“Section 115(a)”), which allows
for approvals to be based on one study and confirmatory evidence, clinical development
programs can be streamlined, particularly during the 'Lifecycle' portion of the drug development
program. This term is typically applied to the phase of development following the initial
approval of the active moiety for products that often include modified-release or fixed-dose
combination drugs.
To further understand the strategies used in 505(b)(2) submissions, a database of
informative variables describing the drug, applicant, and development program was created by
abstracting information related to the development programs from publicly available Summary
Basis of Approvals (SBOAs). Analyses were performed using descriptive statistics on the dataset
as a whole, and by investigating intra-class differences, based on variables such as chemical and
therapeutic classification. The findings from this study provide knowledge on critical points in
development programs, and identify potential areas for improvement that may lead to an increase
in efficiency for these processes.
Thesis readers: Dr. Kristina Obom, Dr. Christopher D. Breder, and Jonathan Helfgott

iii
Acknowledgments:
I would like to thank my mentor and committee member Christopher D. Breder, MD PhD, for all
of the time and energy he has dedicated in past years to overseeing and fostering a growth in my
education and depth of knowledge. I would like to thank the head of my thesis committee
Kristina Obom, PhD MPH, for the guidance and feedback throughout this process, especially in the
finalization of the published form. I would also like to thank my final committee member Jonathan
Helfgott, MS, for the time and effort he devoted to providing feedback on my thesis.
Special thank you to my ORISE fellowship team member Xiao Fang, MS. I would like to acknowledge
how grateful I am to have received the support of Dr. ShaAvhree Buckman-Garner (OTS), Drs. Dunn,
and Dr. Unger (ODE1) during my time with the FDA.
Thank you to Meredith Safford, PhD, Beatrice Kondo, PhD, and Lynn Johnson Langer, PhD MBA, for
providing thoughtful academic and career guidance, as well as all of the faculty at Johns Hopkins center
for biotechnology for their part in making the time I have spent in this program incredibly valuable and
fulfilling.
A final thank you to my family and friends for their unwavering support throughout this time.

iv
Table of Contents
I. Abstract ……………………………………………………………………………… ii
II. Introduction ………………………………………………………………………….. 1
III. Literature Review …………………………………………………………………..... 3
IV. Problem Statement …………………………………………………………………... 9
V. Specific Aims ………………………………………………………………………... 9
A. Primary Objective ……………………………………………………………….. 9
B. Secondary Objectives …………………………………………………………... 10
VI. Methods …………………………………………………………………………….. 10
A. Strategy of the Review and Analysis …………………………………………... 10
B. Methodology …………………………………………………………………… 11
1. Data Acquisition ……………………………………………………... 11
2. Analysis ………………………………………………………………. 13
VII. Results and Discussion …………………………………………………………….. 14
A. Database Description …………………………………………………………... 14
1. Year of Approval …………………………………………………….. 14
2. Chemical Class ……………………………………………………….. 15
3. Purpose of 505(b)(2) Application ……………………………………. 16

v
4. ATC2 Code ………………………………………………………….. 18
5. Therapeutic Class …………………………………………………….. 18
B. Characteristics of Drugs Approved Under 505(b)(2) of the Food Drug and
Cosmetic Act …………………………………………………………………… 19
1. Portfolio and Risk Strategy …………………………………………... 19
a) More Information Available on Safety and Efficacy …………... 19
b) Less Resource Expenditure …………………………………….. 20
c) 505(b)(2) and Expedited Program Designation ………………... 21
C. Regulatory Burden . ……………………………………………………………. 22
1. Use of Resources ……………………………………………………... 22
2. Studies Needed for Approval and Their Impact on the Timeline ……. 23
3. Programs Requiring Greater Than Two Clinical Trials ……………… 26
4. Subject Numbers ……………………………………………………... 27
5. Duration of Trials …………………………………………………….. 30
6. Waivers and Post Marketing Requirements ………………………...... 31
7. Timeline and Duration of Development Program …………………… 33
D. Regulatory Review ……………………………………………………………... 35
1. General Observations ……………………………………………….... 35
2. Priority Versus Standard Regulatory Review Cycle …………………. 35

vi
3. Applications Approved Past PDUFA Goal Date .................................. 36
4. Applications Approved Before PDUFA Goal Date .............................. 38
E. Regulatory Outcomes ………………………………………………................... 39
1. Trends in Regulatory Outcomes in Recent Years ……………………. 39
2. Delay Period ……………………………………………….................. 41
a) Complete Response …………………………………………….. 42
b) Review Extension ……………………………………………… 43
c) Refuse to File ………………………………………………....... 44
VIII. Limitations ………………………………………………………………………..... 46
IX. Conclusion ………………………………………………………………………..... 47
References ……………………………………………………………………….................. 50
Appendices ………………………………………………………………………................. 53
Scholarly Life ......................................................................................................................... 67

vii
List of Tables
1. Most commonly Encountered ATC2 Codes …………………………………………… 18
2. Most commonly Encountered Therapeutic Classes ……………………………………. 19
3. Number of Applications Per Reference Type by Nonclinical, Clinical Pharmacology, and Clinical ……………………………………………………………………. 20
4. Average Number of Subjects by Chemical Classification ……………………………... 28
5. Average Duration of Trials by Chemical Classification ……………………………….. 30
6. Nonclinical Post Marketing Approval Agreements ……………………………………. 31
7. Clinical Pharmacology Post Marketing Approval Agreements ………………………... 32
8. Clinical Post Marketing Approval Agreements ………………………………………... 33
9. Average Duration of Lifecycle Development, With and Without Clinical Trials …………………………………………………………………………………... 34
10. Frequency of Encounters with Each Delay Type by Chemical Classification …………………………………………………………………………………… 41
11. Most Common Causes of Encountering a Complete Response ……………………....... 43
12. Most Common Causes of Encountering a Review Extension …………………………. 44
13. Most Common Causes of Encountering a Refuse to File ……………………………… 45

viii
List of Figures
1. Variable Breakdown …………………………………………………………………… 14
2. Distribution of SBOAs by Year of Approval ………………………………………….. 15
3. Percentage of Applications by Chemical Classification ……………………………….. 16
4. Distribution of SBOAs by Purpose of 505(b)(2) Application …………………………. 17
5. Percentage of Total Applications Using a Reference by Nonclinical, Clinical Pharmacology, and Clinical …………………………………………………………... 21
6. Number of Applications Completing at Least One Study by Nonclinical, Clinical Pharmacology, and Clinical …………………………...………………… 23
7. Absolute Number of Applications Relying on Each Type of Pivotal Evidence by Chemical Classification ………………………………………………………….. 24
8. Reasons for an Application Requiring Greater Than Clinical Trials by Chemical Class ……………………………………………………………………………… 26
9. Mean Number of Subjects in Phase 2b/3a Trials ………………………………………. 28
10. Mean Number of Subjects in Whole Program …………………………………………. 29
11. Duration of the Regulatory Review Period …………………………………………….. 35
12. Expected Priority Regulatory Review Versus the Standard Regulatory Review Period, from 100 SBOA Dataset ………………………………………….. 36
13. Average Priority Regulatory Review Versus the Standard Regulatory Review Period from 100 SBOA Dataset ………………………………………………………. 36
14. Visual Representation of Applications Approved the Furthest After Their PDUFA Goal Date ………………………………………………………………………. 37
15. Visual Representation of Applications Approved the Furthest Before Their PDUFA Goal Date ………………………………………………………………………. 38
16. Distribution of the Number of Applications Encountering (Y) or Not Encountering (N) Each Type of Regulatory Delay by Year of Approval ……….......………… 40
17. Absolute Number of Applications Encountering One or More of Each Delaying Regulatory Outcome …………………………………….......………………… 50

1
II. Introduction
The burden of lifecycle development for a drug includes not only the time and resources
to execute pharmacology/toxicology studies, clinical pharmacology studies and clinical trials, but
also that which is needed to support the application and review cycles after submission of the
New Drug Application (NDA)1. The data in the submission must provide evidence of safety and
efficacy for the proposed new drug. These requirements emerged only in the last century, despite
drugs being sold in America since the formation of the colonies (Authentichistory.com, 2012).
The 1938 passage of The Food, Drug, and Cosmetic Act (FD&C Act) marked the first time that
drug manufacturers were required to provide pre-approval safety data. Demonstration of efficacy
and the need for trial replication was not required until the passage of the Kefauver-Harris
Amendments to the FD&C Act in 1962 (U.S. Food and Drug Administration, 1999). This
mounting requirement for data prior to approval for marketing was largely attributed to tragic
episodes. These episodes included the deaths of many children because of the particular vehicle
used in an antimicrobial prior to the FD&C Act, and the malformation of children from the use
of thalidomide during organogenesis, prior to the passage of the Kefauver-Harris Amendments
(Woosley, 2012).
Several regulatory initiatives have served to reduce the workload of the pharmaceutical
industry and expedite the development of drugs, while also maintaining the level of necessary
evidence necessary for approval since the passage of the Kefauver-Harris Amendments. Before
1984, the FDA employed a paper NDA policy allowing approval of a NDA to be granted based
1NDA will be used to generally refer to any premarketing application, whether for a drug or biologic
2
on literature and drug-specific information (this was mostly relevant to generic drugs). The 1984
Hatch Waxman Amendments expanded this policy, allowing for approval of NDAs based on
literature and drug specific information not owned by the applicant (FDA, 1999). In the wake of
the growing AIDS epidemic, the Prescription Drug User Fee Act (PDUFA) was passed in 1992,
to expedite the drug review process. A major goal of PDUFA was to provide a constrained
timeline for the review of marketing applications. In addition to setting timelines for the review
of standard drugs, more recent cycles of PDUFA have given rise to programs to expedite the
development and review cycle, such as Breakthrough Drugs, Priority Review, Accelerated
Approval, and the Fast Track pathway (FDA, 2012). Over a decade later, in 1997, The Food and
Drug Administration Modernization Act (FDAMA) was amended to include that “Substantial
Evidence” of effectiveness may be determined to be adequate based on data from one clinical
trial and confirmatory evidence (Section 115(a) FADAMA). Prior to FDAMA following the
Kefauver-Harris amendments, the required level of evidence, as defined in Section 505(d) of the
Act, stated that investigations (emphasis on the plural "s") were needed, implying that two
adequate and well-controlled trials would be required to replicate the evidence. In the
Modernization Act, Congress amended section 505(d) of the Act to allow that "...substantial
evidence may, where there is a high level of confidence in the scientific validity of the results of
an adequate and well-controlled investigation, consist of data from an adequate and well
controlled investigation and adequate supportive scientific evidence…", the latter often being
termed ‘Contributory evidence’.
Another major change to the development and review process came about in 2008 when
the Food and Drug Administration (FDA) replaced the Approvable/Not Approvable actions with
a Complete Response action at the end of the review period. This allows applications that may

3
have previously been found Not Approvable because of deficiencies, to be resubmitted as a
remedied application and continue to seek approval (FDA, 2008).
The process of submitting an NDA can be confusing, even when using a standard
‘unabridged’ strategy (no Expedited Programs, or 505(b)(2) process). There are few resources
and studies available to aid applicants and regulators that collectively describe the regulatory
precedents, especially the evidence needed to support the approval of 505(b)(2) NDAs. These
requirements for contributory evidence may vary greatly depending on a variety of factors,
including, the results of prior PK, pharmacology and clinical studies and the drug, indication, and
intended population. This study will examine the contributory and substantial evidence needed
for NDAs submitted under 505(b)(2) of the FD&CA. A systematic review of the trends in the
recent regulatory approvals of 505(b)(2) applications will provide a useful and fact-based
foundation for discussion between applicants and the agency.
III. Literature Review
Literature on pharmaceutical regulatory strategy often notes the importance of gathering
information on the drug development lifecycle (Kwok, 2015). Recent publications have focused
on issues such as the duration of approval time, contributing factors to delays in the approval
process, and an overall lack of understanding surrounding the drug development process (Kwok
2015, Agarwal 2014). Furthermore, when considering strategies that capitalize on the regulations
enacted to make the process more efficient, the literature brings forth additional unique
problems, such as what is needed to shorten approval time and whether or not shorter approval
times are beneficial. It also illuminates areas in need of further clarification, such as the level of
substantial evidence required for approval.

4
There has been considerable discussion in the literature on submissions of NDAs that
satisfy the application requirements via pathways other than the ‘traditional’ Nonclinical,
Clinical Pharmacology, and two Adequate and Well-controlled clinical Trials (AWT). Much of
this discourse is aimed at providing further clarification regarding these routes, as they range
from drugs in Expedited Programs, to drugs that reference literature or the Agency’s past safety
and efficacy findings. A review of these non-traditional routes will clarify how these strategies
can help to reduce the cost of development, shorten the approval times, and potentially modify
the burden of lifecycle development.
The FDA has made major contributions to the body of literature surrounding this topic in
the form of guidances that highlight the historical changes in the drug development process.
These guidances clearly outline the evolution of how contributory evidence can support
approval. The FDA Guidance “Providing Clinical Evidence of Effectiveness for Human Drug
and Biological Products” (also known as the “Effectiveness Guidance”) released in 1998,
provides helpful recommendations to the industry regarding criteria for Substantial Evidence. An
essential role of the Effectiveness Guidance was to clarify FDAMA’s modification of Section
505(d) of the Act, by emphasizing that there were instances in which one AWT along with
contributory evidence could be sufficient to provide substantial evidence for effectiveness.
Considering that the costs of trials increase as a drug progresses through the development
lifecycle, it is not surprising that trials used to demonstrate efficacy in an NDA (sometimes
referred to as Phase 3) are so expensive (Sertkaya, 2014). With the average cost of developing a
drug currently estimated to be around 800 million U.S. dollars (DiMasi, 2010) and rising
(Sertkaya, 2014), any cost savings or resource conservation measures that can be implemented to
lower the cost of development have the potential to realize savings that could ultimately reduce

5
the cost of drugs for patients. The Effectiveness Guidance provides great utility to industry by
explaining how to properly interpret the FD&CA amendments to reduce the burden of the
clinical development. Reed (2007) takes a different approach to assessing the increased burden
of drug development by incorporating the resource of drug approval time into the optimization
rule they developed for use by pharmaceutical firms. However, both discussions fail to fully
account for the actual value of the drug, which could lead to an uninformed decision.
Coutant and his colleagues (2010) lay out the following three scenarios for approvals
based on less than two AWTs. 1. Substantial evidence proven via extrapolation from existing
studies or from new comparative PK bioavailability trial (no new AWT required), 2. A single
AWT with independent substantiation from related clinical data, and finally, 3. Reliance on a
single multi-center study, without supporting information (single AWT). Given the inevitable
variations within each of these broad scenarios, the composition of Substantial Evidence must be
unique for each application. Considering that the majority of 505(b)(2) applications employ the
latter two strategies, it is easy to understand why articles on the 505(b)(2) strategy can only give
a vague idea as to the extent to which reference information can be used to support the
application, and what additional information will be needed with it to complete the application.
In his commentary on this issue, Hurley (2004) is left to simply recommending a discussion with
the Agency Division conducting the Applicant’s review.
When considering regulatory strategies, the 505(b)(2) NDA pathway is commonly
utilized for non-New Molecular Entities (non-NMEs). Hurley (2004) notes that, early on, the
505(b)(2) route of approval was unpopular, with only 126 drugs approved via this route between
1984 and 2004. As with the other strategies for expediting development, it has gained popularity
in recent years (Agarwal, 2014). In contrast to the findings of Hurley (2004), consider that

6
Agarwal (2014) found that 132 505(b)(2) New Drug Applications were filed during the three-
year period from January 2010 to December 2012. Agarwal (2014) observed that number of
505(b)(2) NDAs from 2010 to 2012 was higher than the number of New Molecular Entity NDAs
submitted for approval.
The limited body of literature on 505(b)(2) applications consists of primarily papers that
focus on only one of the specific areas of the drug development lifecycle, such as clinical
pharmacology (Agarwal, 2014). Although these papers are helpful in gaining detailed
information and insight into a portion of the process, they fail to reveal the larger picture, often
leaving out the intricate interplay between these factors. Additionally, focus on a single area of
the drug development process can often result in the omission of important factors, such as the
operational aspects of clinical trials or clinical supply chain, which can often be the most
expensive and resource consuming aspect of development (DiMasi, 2010).
The 505(b)(2) pathway has provoked some controversy within the pharmaceutical
industry. There have been lawsuits surrounding patent infringement, similar to what is
encountered with the generic approval process. The best example of this controversy may be the
petitions filed by Pfizer Inc. and Pharmacia Corporation in an attempt to overturn the 505(b)(2)
policy. In response to these petitions, the Generic Pharmaceutical Association (GPhA)
maintained that Section 505(b)(2) was added to incentivize the research and development of
improving current drugs, to eliminate duplicative studies, and to expedite the lifecycle
development of these drugs, potentially reducing their cost.
In response to recent pleas to shorten approval times for new drug applications (NDAs),
new Expedited Programs have been created as recently as 2012. As discussed in the background,
these Expedited Programs can either change what is needed to fulfill the application

7
requirements, as is the case with Orphan designation and Accelerated Approval, or provide a
means to facilitate either the development or the review process, as is the case with the other
Expedited Programs. Although these programs are more commonly utilized via the 505(b)(1)
pathway, they are sometimes also used for a 505(b)(2) NDA. The importance of these programs
is underscored by the rise in popularity of Expedited Programs. Kesselheim (2015) notes that
56% of all New Molecular Entities approved from 2002 to 2013 benefitted from at least one
Expedited Program. The study also notes the increase in the number of New Molecular Entities
benefiting from more than one Expedited Program, beginning at less than 20% in 1987 and rising
to over 40% in 2013.
There has been some debate over the effectiveness of certain Expedited Programs in
shortening the drug development lifecycle. While this is not expected to be an issue that greatly
affects the 505(b)(2) submission route, the data in this study reveal that this is an important topic.
As Sasinowski (2011) reports with respect to the Orphan drug designation, this can be difficult to
substantiate, due to the flexibility in Expedited Programs and the number of factors that must be
considered when evaluating the time to approval. One study found no difference in review time
for Accelerated Approval vs. standard review time (Benson, 2011), while others claim that drugs
within the expedited approval process benefit from shorter review periods, as well as shortened
development periods (Kesselheim 2015, Kwok 2015). An example given by Kesselheim (2015)
is the drug imatinib (Gleevec). This drug reportedly benefited from Fast Track, Accelerated
Approval, and Priority Review designation, leading to the completion of its review in 2.5
months. Kwok’s 2015 review of this issue discusses the many factors that go into the approval
process, and outlines those that can often cause delays in the development lifecycle of drugs
when Expedited Programs are utilized. These factors often arise as unforeseen problems in the

8
production process, such as deficiencies in the inspection of manufacturing sites (Kwok, 2015).
Kwok (2015) also suggests that the rush to complete certain aspects of the development lifecycle
within the auspices of Expedited Programs may cause some of these deficiencies to arise.
A major focus of the drug development literature deals with the duration of the time to
approval, including the duration of the regulatory review period. There is little documented data
on this topic in regards to the 505(b)(2) application route, despite the topic’s importance to the
overall pharmaceutical industry, and its often ill effects on the public opinion of the
pharmaceutical industry and the FDA. One of the more controversial positions discussed in the
literature related to time to approval is that approval times are faster outside than within the
United States. This viewpoint has gained a deal of popularity due to recent legislation, such as
the Speeding Access to Already Approved Pharmaceuticals Act proposed to congress in 2014
(H.R. 4918, 2014) and then again in 2015 (H.R. 4918, 2015). Contrary to the ideas perpetuated
by the majority of the media coverage on this issue, and the pressures put on the FDA by
politicians who pontificate on the need for shorter approval times (Kulynych, 1999), the data
suggest otherwise. Downing et al (2012) study published in the New England Journal of
Medicine compared the regulatory review times of the United States (FDA) with the regulatory
bodies in Europe (EMA) and Canada (Health Canada). The study found that from 2001 to 2010,
the FDA approved more drugs (225) than the EMA (186) or Health Canada (99). Downing et al.
also reported that the FDA approved drugs with shorter average review times (303) than either
the EMA (366) or Health Canada (352). Other studies support these findings by demonstrating
that the FDA approved 63.7%, and 85.7% of drugs faster than Europe or Canada (respectively)
(Kesselheim 2015, Benson 2011).
Shorter review times have given rise to concerns in regards to safety. Kesselheim (2015)
9
reports that studies have found a 35% increase of a black box warning on Orphan drugs. Others,
however, report no inverse correlation between an increase of adverse events and a decrease in
review time. Spielmans and Kirsch (2014) raise the concern that the public is generally unaware
of the relatively low bar for effectiveness that the FDA has set for the approval.
IV. Problem Statement
The Literature Review reveals that little research has focused on the benefits and track
records of development programs that employ the 505(b)(2) pathway. This project will explore
issues relevant to the regulatory burden mentioned in the Literature Review, such as approval
time, causes of delays, and level of evidence required for approval. It will also fill gaps in our
understanding left by the current literature, and allow the reader to grasp a much broader picture
of pharmaceutical lifecycle management. A thorough and comprehensive view of the problem
areas from data collected from individual applications in the pharmacology/toxicology, clinical
pharmacology and clinical reviews provides a perspective unavailable from the current literature.
V. Specific Aims
A. Primary Objective
To identify predictive patterns in demographic factors (e.g., related to the applicant,
regulators, drug, indication) that are associated with different levels of regulatory evidence (e.g.,
# of trials, PK, and pharmacology/toxicology studies) submitted for 505(b)(2) applications for
drugs.
10
B. Secondary Objectives
To identify characteristics of 505(b)(2) programs associated with regulatory success (e.g.,
shorter development times), delays, or failure (e.g., Complete Response actions).
VI. Methods
A. Strategy of the Review and Analysis
A list of NDAs approved by the 505(b)(2) pathway was compiled from the information
available at the NDA and BLA Calendar Year Approval website (FDA, 2016b). Summary Basis
of Approval documents (SBOAs) were downloaded from the Drugs@FDA (FDA, 2016a)
database for 505(b)(2) applications approved between 2010 and 2015. SBOAs were reviewed,
prioritizing the most recently approved applications and including all of the available SBOAs
from 2014 and 2015. The SBOAs were abstracted to identify ‘Demographic Variables’ that
describe the drug (e.g., ATC2 Code) or regulatory process (e.g., Review Division or whether the
program received a Complete Response), and ‘Content Variables’ that describe what was
included in the Nonclinical, Clinical Pharmacology, and Clinical aspects of the application (e.g.,
subject numbers for clinical studies). To gain a perspective on the development programs that
were abstracted, Demographic and Content Variables were summarized in terms of the following
Key Subpopulations:
• Year of approval
• Chemical Classification – the FDA classification system that describes how new the
classified drug is based on whether it itself is a new formulation or it is a new indication
for an existing drug formulation (FDA, 2015)

11
• Purpose of 505(b)(2) application – A classification developed for the purposes of this
project, describing the modification of the drug from any reference drug in terms slightly
more granular than the Chemical Classification
• ATC 2 Code - Part of the Anatomical Therapeutic Chemical Classification System used
to classify active components of a drug, based on the main therapeutic group (WHO
Collaborating Centre for Drug Statistics Methodology, 2013)
• Therapeutic Class – A classification developed for the purposes of this project describing
the therapeutic use of the drug
Of the Key Subpopulations, the Year of Approval was used to assess any evolving trends in the
landscape of 505(b)(2) submissions over time. Chemical Class and Purpose of 505(b)(2)
Application were the best representation of what drove the application (“application drivers”).
ATC2 Code and Therapeutic Class were chosen as the best descriptors of the clinical utility of
the drug.
The Key Subpopulations were used in the primary analyses, forming the foundation of
the analysis plan. Subpopulation analysis with other variables or in addition to the Key
Subpopulations was done to further assess the strategies and outcomes of the Applications and to
explore the associations suggested in the primary analysis.
B. Methodology
1. Data Acquisition
The 505(b)(2) Database was compiled from a listing of 505(b)(2) programs from the
website (FDA, 2016b) Food and Drug Administration / NDA and BLA Calendar Year Approvals
(last access date: 5/1/16) from 2010 to 2015. SBOAs were preferentially reviewed from 2014
and 2015 with random sampling of applications from 2010 to 2013. The focus on the most recent
12
years was to provide a sample with the most up to date and current picture of the information that
was being submitted to and reviewed/approved by the agency. Demographic and outcome
characteristics from drug development programs were first identified. The majority of the
variables were added very early on, or before beginning the data collection process, but to ensure
no new variables were missed, throughout the process when new variables were encountered
they were documented in an “other additional studies” column. During the weekly review
process discussion of the prevalence of certain “other additional studies” occasionally resulted in
the addition of variables to the database, in other words, removing “study x” from the “other
additional studies” and making “study x” its own additional column. Once the demographic and
outcome characteristics from drug development programs were identified they were then entered
into an EXCEL database by a primary reviewer. Certain variables were entered as Y/N, others
were numeral, and others were acronyms (text) or free text (see appendix A for the full list).
Some of the variables pertained to the timeline of the application and were later combined to
create new variables defining the length of time between important drug development milestones
or regulatory actions throughout the application approval process.
All fields of the database were verified during a second review period. Additionally,
weekly progress meetings were held to discuss any concerns or situations needing clarification,
as well as to review the completed work (having had both the first and second review processes
completed) from the week. Any disagreements found between the first and second review
process were discussed and decided during group meetings. Once the review of SBOAs was
completed, an audit of all variables relevant to this analysis was conducted to verify and attempt
to find any missing information. The auditing process ensured consistency in the formatting of
variables, in the cases where one had not previously been decided.
13
2. Analysis
The primary analyses were developed prospectively, prior to the completion of the data
collection. The key endpoints for each of the demographics used in the primary analysis were as
follows:
• Average Number of Studies Required for Substantial Evidence
• Sources of Contributory Evidence
• Subjects in the Phase 2b/3a and Total Development Program
• Complete Responses and Review Extensions
• Waivers and Post-Marketing Requirements
Additional demographic and outcome characteristics in the Nonclinical, Clinical
Pharmacology and Clinical areas of the application were used in further subpopulation analyses
of each of the demographics factors in the first level analysis. Means and standard deviations
were derived from JMP software.
The variables pertaining to date and timeline information collected from the application
were combined to create the following new variables, defining the length of time between
important drug development milestones or regulatory actions throughout the application approval
process. (see appendix A)
- Duration of the Lifecycle Development Program: Approval Date – Initial IND Submit
Date
- Duration of the Regulatory Review Cycle: Approval Date – Final NDA Submit Date
- The Delay Period: Final NDA Submission Date – Initial NDA Submission Date

14
VII. Results and Discussion
A. Database Description
The final dataset included information from 100 SBOAs reviewed for 135 unique
variables and contained 44 ‘demographic’ features and 91 ‘content features’. Of the content
features 31 were Nonclinical, 32, Clinical Pharmacology, and 28, Clinical (Figure 1).
Figure 1, Variable Breakdown
The database consisted of 13,500 unique data cells, of which 150 cells were missing from
11 different variables. Thirty two total data points from eight different variables were marked as
unknown.
Descriptive statistics for the unique variables were further evaluated by performing
subpopulation analyses for the following five key variables:
1. Year of Approval
The final dataset of 100 SBOAs (or N = 100), included all of the available SBOAs from
2014 (N = 32) and 2015 (N = 32). The remaining 36 SBOAs reviewed were from between 2010
and 2013; 18 were from 2013, 9 were from 2012, 3 were from 2011, and 6 were from 2010. The
strategy behind this selection was to review the most recent applications to provide the most up

15
to date and current information on the landscape of the 505(b)(2) applications being submitted
for approval. Additionally, the random sampling from past years was considered an important
tool in tracking the trends of the changing landscape over time.
Figure 2, Distribution of SBOAs by Year of Approval
Total Number of SBOAs reviewed N = 100
2. Chemical Class
Figure 1 displays the distribution of the 100 SBOA database by the variable, Chemical
Classification. The top three Chemical Classes accounted for 81% of the total number of
applications reviewed, New Formulation (33%), New Dosage Form (32%), and New
Combination (16%).

16
Figure 3, Percentage of Applications by Chemical Classification
Total number of applications reviewed, N=100
These groups include previously approved drug products, allowing for extra value to be
generated from the innovator drug for the original applicant, and a portfolio with less regulatory
risk for companies that do not have the resources to bring drugs through discovery to the market.
3. Purpose of 505(b)(2) Application
The variable, Purpose of the 505(b)(2) Application, was developed for this project and
contained ten categories similar to the Chemical Classes, but with increased granularity (Figure
4).

17
Figure 4, Distribution of SBOAs by Purpose of 505(b)(2) Application
Total number of applications reviewed, N = 100
New Formulation was the most popular of these groups, containing 47% of the
applications, more than triple the number of applications represented in any other category.
Combination of 2 Approved (C2A), is one of 4 categories describing different types of
combination drugs (e.g. combination of 1 approved and 1 NCE, CAN; or Combination 3
Approved, C3A) and was the second most common category with 15% of the applications.
Altogether, the four categories describing combination drugs account for over one fifth (21%) of
the applications. The third and fourth most common categories were Modified Release (13%),
and Marketed Unapproved (10%) drugs with the remaining categories representing fewer than
10% of the applications. Notably, three categories representing different iterations of NME or
NCE represent 6% of the applications.
The breakdown of the Purpose of the 505(b)(2) Application helps to identify some major
pathways/themes of utilization of these applications. Beyond identifying the popularity of the
various themes discussed above, the Purpose of the 505(b)(2) Applications categories
demonstrates the types of variation seen within each of these themes. This will be covered in
greater depth later on, during the discussion concerning the utilization and adaptability of the
505(b)(2) application route.
18
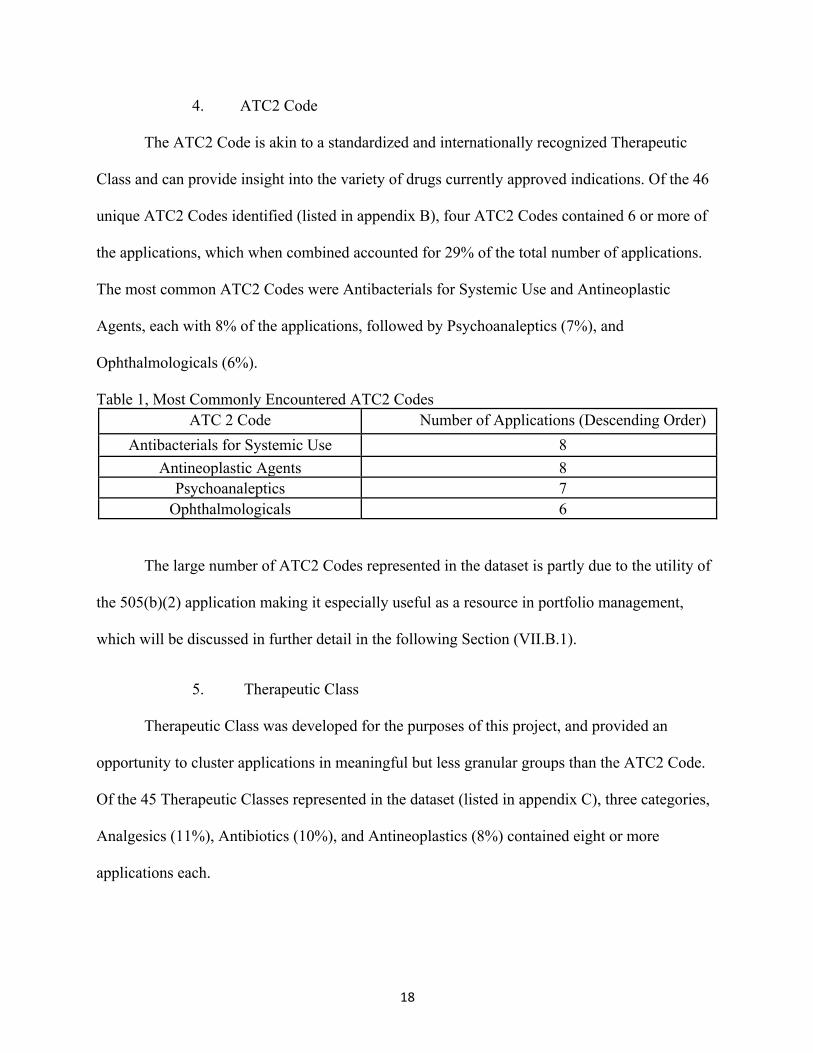
4. ATC2 Code
The ATC2 Code is akin to a standardized and internationally recognized Therapeutic
Class and can provide insight into the variety of drugs currently approved indications. Of the 46
unique ATC2 Codes identified (listed in appendix B), four ATC2 Codes contained 6 or more of
the applications, which when combined accounted for 29% of the total number of applications.
The most common ATC2 Codes were Antibacterials for Systemic Use and Antineoplastic
Agents, each with 8% of the applications, followed by Psychoanaleptics (7%), and
Ophthalmologicals (6%).
Table 1, Most Commonly Encountered ATC2 Codes ATC 2 Code Number of Applications (Descending Order)
Antibacterials for Systemic Use 8 Antineoplastic Agents 8
Psychoanaleptics 7 Ophthalmologicals 6
The large number of ATC2 Codes represented in the dataset is partly due to the utility of
the 505(b)(2) application making it especially useful as a resource in portfolio management,
which will be discussed in further detail in the following Section (VII.B.1).
5. Therapeutic Class
Therapeutic Class was developed for the purposes of this project, and provided an
opportunity to cluster applications in meaningful but less granular groups than the ATC2 Code.
Of the 45 Therapeutic Classes represented in the dataset (listed in appendix C), three categories,
Analgesics (11%), Antibiotics (10%), and Antineoplastics (8%) contained eight or more
applications each.

19
Table 2, Most Commonly Encountered Therapeutic Classes Therapeutic Class Number of Applications (Descending Order)
Analgesics 11
Antibiotic 10
Antineoplastic 8
Similar to what was seen with ATC2 Codes, the absence of a single prevalent
Therapeutic Class application demonstrates the wide range of clinical applications for 505(b)(2)
drugs providing opportunities in all areas of development.
B. Characteristics of Drugs Approved Under 505(b)(2) of the Food Drug and Cosmetic Act
The sections that follow are a systematic description of the results analyzed from the
perspective of the key subpopulation variables.
1. Portfolio and Risk Strategy
A pharmaceutical portfolio is optimized by balancing, financial returns with regulatory
and scientific risk, as well as the timing of resource consumption for assets being developed in
parallel. In this section, data from the database is used to support the concept that integrating
drugs approved by the 505(b)(2) pathway into the portfolio offers certain advantages over a pipeline entirely composed of NCEs utilizing the 505(b)(1) pathway.
a) More Information Available on Safety and Efficacy
The 505(b)(2) application allows for referencing a prior drug approval’s finding of safety
and efficacy. This is the most common type of reference with at least 88% of the applications
using this resource.

20
Table 3, Number of Applications Per Reference Type by Nonclinical, Clinical Pharmacology, and Clinical
Reference Type Nonclinical Clinical Pharmacology Clinical Prior Findings of Safety and Efficacy 65 70 64 Literature + Prior Findings of Safety and Efficacy 15 14 14
Monograph + Prior Findings of Safety and Efficacy 4 4 2
Literature 11 9 10 Literature + Monograph 1 0 0 Monograph 1 1 0 None 1 2 10 *Unknown 2 0 0 **Total Number Referencing Prior Findings of Safety and Efficacy (Alone or in Combination)
84 88 80
*The “Unknown” designation refers to applications for which the information was unable to be determined **This row refers to the total number of applications referencing Prior findings of safety and efficacy, either alone or in combination with another reference type, this row was formulated by adding the number of applications in the first three rows together.
The prevalence of this type of reference speaks to the large amounts of data that has
already been collected on the approved drugs. This type of reference reduces the development
risk considerably because the risk benefit profile is known to a great extent, save for the
contribution of the modification of the innovator drug. Because the reference drug has been on
the market for some length of time already, additional safety data has been accumulated over
what was initially required for drug approval. As an example of the impact of this resource of
information, 40% of the drugs in the Purpose for the 505(b)(2) Application analyses include
combination drugs (Figure 4), and of these, 76% of the applications describe the combination of
previously approved drugs. It is reasonable to infer that in the majority of the cases, the safety
and efficacy of drugs approved by the 505(b)(2) pathway are likely to be better understood than
drugs at the initial stage of their approval.
b) Less Resource Expenditure
21
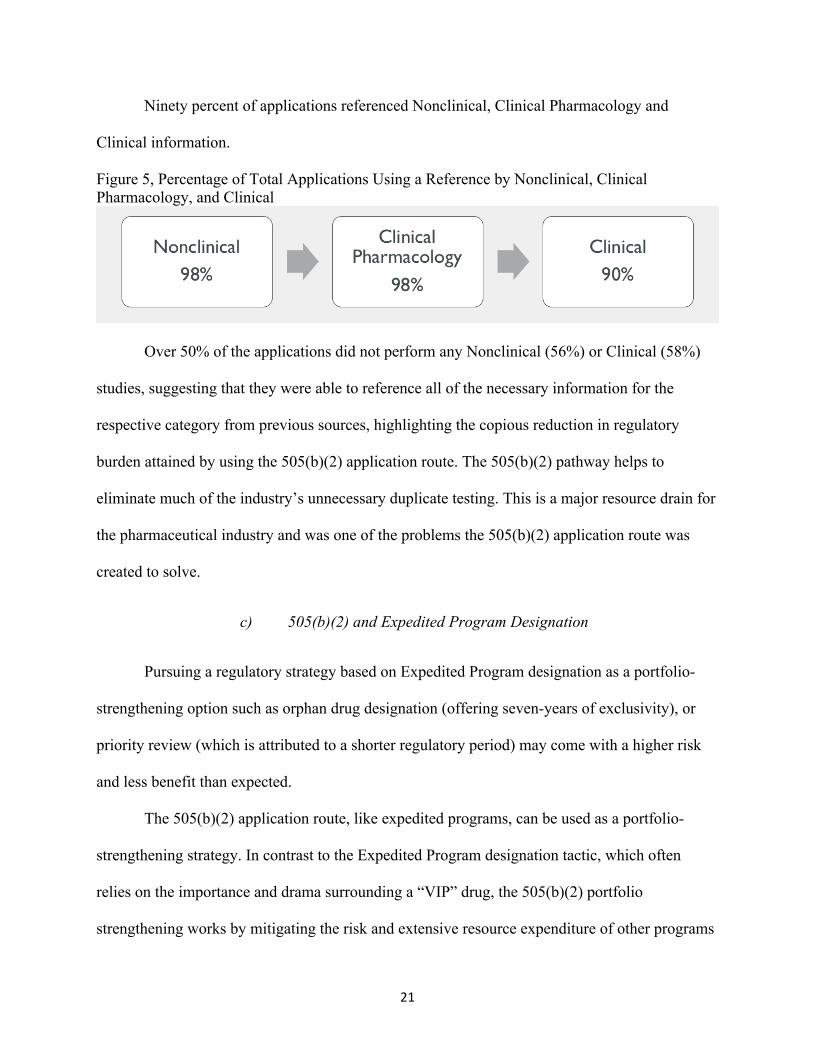
Ninety percent of applications referenced Nonclinical, Clinical Pharmacology and
Clinical information.
Figure 5, Percentage of Total Applications Using a Reference by Nonclinical, Clinical Pharmacology, and Clinical
Over 50% of the applications did not perform any Nonclinical (56%) or Clinical (58%)
studies, suggesting that they were able to reference all of the necessary information for the
respective category from previous sources, highlighting the copious reduction in regulatory
burden attained by using the 505(b)(2) application route. The 505(b)(2) pathway helps to
eliminate much of the industry’s unnecessary duplicate testing. This is a major resource drain for
the pharmaceutical industry and was one of the problems the 505(b)(2) application route was
created to solve.
c) 505(b)(2) and Expedited Program Designation
Pursuing a regulatory strategy based on Expedited Program designation as a portfolio-
strengthening option such as orphan drug designation (offering seven-years of exclusivity), or
priority review (which is attributed to a shorter regulatory period) may come with a higher risk
and less benefit than expected.
The 505(b)(2) application route, like expedited programs, can be used as a portfolio-
strengthening strategy. In contrast to the Expedited Program designation tactic, which often
relies on the importance and drama surrounding a “VIP” drug, the 505(b)(2) portfolio
strengthening works by mitigating the risk and extensive resource expenditure of other programs
22
in the portfolio yet the 505(b)(2) application route may include drugs with Expedited Program
designations, including the orphan drug designation.
Twenty-one percent of applications included in the dataset were awarded at least one type
of Expedited Program designation. Priority review and Orphan drug designation were the most
common designations being awarded with 15%, and 10% of the applications respectively. Five
percent of the applications received fast track designation and 1% received breakthrough
designation.
Concern surrounding uncertainty and risk have always been present in the pharmaceutical
and biotechnology industries (Ebel, 2014), and is only expected to get worse in coming years as
payers demand greater value and the low hanging fruit of G-protein coupled receptor agents is
developed and goes generic. The ability of the 505(b)(2) application route to mitigate risk while
still maintaining the possibility of participating in expedited programs makes this an ideal
strategy to strengthen any pharmaceutical portfolio.
C. Regulatory Burden
1. Use of References
Central to the 505(b)(2) pathway is the referencing of materials not owned by the
applicant. The applicant must consider the use of reference material thoroughly since exclusivity
time may be lost by not fully owning the materials in the NDA. Ninety-eight percent of SBOAs
had Nonclinical and Clinical Pharmacology references, and 90% of SBOAs had Clinical
references. The most common reference type was the Agency’s past safety and efficacy data
across all the content categories. This is in contrast to the references to literature, which was only
referenced by at least 27% of SBOAs, consisting of 27% of Nonclinical, 23% of Clinical
Pharmacology, and 24% of Clinical NDA components (see Table 3 on page 28). The utility of

23
citing the Agency's previous findings is sound regulatory strategy because the data submitted for
previous drug approval has already gone through the rigors of the Agency’s review criteria. The
same claim cannot be made for all literature sources submitted as a reference.
2. Studies Needed for Approval and Their Impact on the Timeline
Performing studies to provide evidence to support an application can greatly change the
burden of the lifecycle development program. The complexity of the studies generally increases
(along with the cost) from Nonclinical to Clinical Pharmacology up to the most complex Clinical
Trials. Forty-four applications completed at least one Nonclinical study, 77 applications
completed at least one Clinical Pharmacology study, and 42 applications completed at least one
Clinical study.
Figure 6, Number of Applications Completing at Least One Study by Nonclinical, Clinical Pharmacology, and Clinical
The high percentage of applications performing Clinical Pharmacology studies is because
a large portion of applications relied on the relative bioavailability study for approval. Often
times this was not only the pivotal study need for approval, it was also the only study in the
development program. This issue is discussed in further detail below. Figure 7 displays the type
of evidence that was considered pivotal to the approval of the application by Chemical
Classification, as specified by the reviewer of the application, 71 of the 100 SBOAs reviewed
contained this information.

24
Figure 7, Absolute Number of Applications Relying on Each Type of Pivotal Evidence by Chemical Classification
Abbreviations: AL: Adequate Literature; AWT: Adequate and Well Controlled Trial; BW: Biowaiver; RB: Relative Bioavailability
Chemical Class 1 drugs (New Molecular Entity) were the most likely to complete at least
one Nonclinical or Clinical study and did so 70% and 73% of the time, respectively. Chemical
Class 2 drugs (New Active) completed a Clinical Pharmacology study 100% of the time. Class 1
and Class 2 drugs generally begin with less known information or studies than other classes of
drugs. Therefore, it would be logical to assume that Class 1 and Class 2 drugs would be the most
likely to perform studies in any of the content categories especially Clinical Trials, where the
least information is likely to exist.
Chemical Class 7 drugs (Marketed Unapproved) were the least likely to complete a
Nonclinical, Clinical Pharmacology or Clinical study doing so 22%, 4% and 0% of the time,
respectively. Marketed Unapproved drugs often have enough study data in the literature to
support safety and efficacy, making this type of entity very attractive to sponsors. Only one of
25
the 100 SBOAs reviewed for this project, a Class 7 drug, was able to rely solely on literature
references for approval (Figure 7).
Overall the most common (21%) Nonclinical study completed by applicants was the
Ames Test for mutagenicity. This is both expected, since the Ames test is one of the core
requirements for submission of Investigational New Drug Applications in the United States, and
surprising since most of the drugs in 505(b)(2) applications have been previously approved. The
most commonly completed Clinical Pharmacology study was a Relative Bioavailability study,
completed by 63% of the applications. The Relative Bioavailability study was the single most
commonly conducted study, across all content categories. Of the 71 applications with
information on pivotal studies over 33% (24 applications total) relied solely on a Relative
Bioavailability study of the test drug and the reference drug for approval (see Figure 7, page 32).
The most common Clinical study was a Phase 3a Clinical Trial (44%). A Phase 3a
clinical study can provide the necessary efficacy information that may be harder to reference
than safety information and, in some cases, the efficacy information may not exist for the
applicant to be able to reference. Phase 2 studies may be less prevalent because the proof of
concept or dose range may be based on prior approvals or the literature.
Of the 100 SBOAs reviewed, there were three SBOAs that completed at least one
Clinical Trial when it was not required (required meaning that it was seen as pivotal to the
approval of the application). All three of the applications were Chemical Class 3 drugs. The two
applications completing one clinical trial each were categorized as their Purpose for the
505(b)(2) Application as Modified Release. The one Class 3 drug that completed two clinical
trials when they were not required was categorized as a formulation change for the Purpose of
the 505(b)(2) Application grouping. As Chemical Class 3 is the second most common Chemical

26
Class application type, further clarification and better communication throughout the pre-NDA
submission may help to eliminate these unnecessary trials.
3. Programs Requiring Greater Than Two Clinical Trials
A central tenant for the approval of new drugs is the replication of evidence supporting
efficacy. Consequently, it is out of the ordinary for more than two trials to be needed unless the
applicant is attempting to incorporate claims for multiple indications or populations in the
labeling. There were nine applications from three different Chemical Classes that completed
greater than two clinical trials that were ‘positive’ in terms of the statistical and clinical review;
three applications clearly identified the reasoning behind additional trials (Figure 8).
Figure 8, Reasons for an Application Requiring Greater Than Two Clinical Trials by Chemical Classification
Abbreviations: CR: Complete Response; MI, MP: Multiple Indications/ Multiple Populations; U: Unknown
In these cases, applicants chose to expand their labeling indication or population. For
example, NDA 205352 Aleve PM (naproxen and diphenhydramine), which completed a total of
27
four Clinical Trials, did so to expand the target population to both adults and children over the
age of 12, as well as to provide signals of efficacy for two indications: 1) for relief of occasional
sleeplessness when associated with minor aches and pains and 2) helps you fall asleep and stay
asleep. Despite the additional development burden, the industry often sees this as a good
resource investment as it will most likely increase the overall value of the drug once it gets to
market.
4. Subject Numbers
The recruitment of subjects in clinical trials is often a slow and expensive process, with
vast expenditures going toward site procedural costs, CRO reimbursements, and recruitment
advertising. Studies that do not spend this money often loose subjects to other, better-supported
trials at the same sites. As a convention, New Chemical Entities that are going to be dosed
chronically require 1500 subjects to be exposed to the drug (Food Drug Administration Center
for Drugs Evaluation Research, 2015). Development programs for where there are prior data
(e.g., 505(b)(2)s) would be expected to require fewer subjects, special circumstances
notwithstanding. Consequently, applicants should study enough subjects to acquire adequate
safety and efficacy support but not burden their programs with studies that do not serve some
purpose of value. Table 4 demonstrates the number of subjects (mean +/- the standard deviation;
median) for the positive Phase 2b/3a studies, and the whole clinical development program, by
test treatment and Chemical Class. In addition, Figure 9 and Figure 10 demonstrate the averages
with the range constructed as error bars.

28
Table 4, Average Number of Subjects by Chemical Classification
Chemical Classification
Number of Subjects in Clinical Trials (Mean ± Standard Deviation; Median)
On Test
Treatment + Ph 2b/3a Trials
Total in +Ph 2b/3a Trials
On Test Treatment in
Whole Program
Total in Whole Program
Class 1 (N = 9) 291 ± 367; 191 639 ± 733; 503 549 ± 473; 618 1,080 ± 959; 1,063
Class 2 (N = 3) 148 ± 256; 0 198 ± 342; 0 307 ± 399; 102 378 ± 522; 102
Class 3 (N = 32) 222 ± 378; 52 382 ± 522; 249 674 ± 985; 173 813 ± 1,124; 221
Class 4 (N = 16) 705 ± 796; 476 1,580 ± 1,503; 1,467
1,511 ± 2,195; 581
2,691 ± 3,521; 1,632
Class 5 (N = 33) 84 ± 179; 0 140 ± 308; 0 150 ± 239; 0 223 ± 386; 0 Class 7 (N = 7) 0; 0 0; 0 5 ± 11; 0 8 ± 19; 0
Abbreviations - 2b=Study used to explore safety and efficacy; 3a=Study used to confirm substantial evidence, a ‘pivotal trial’; Ph=Development Phase
Figure 9, Mean Number of Subjects in Phase 2b/3a Trials

29
Figure 10, Mean Number of Subjects in Whole Program
Chemical Classes 4 and 1 had the highest average number of subject numbers,
respectively, for positive Phase 2b and Phase 3a trials of adequate design and conduct to be
considered as Substantial Evidence. The applications with the 5 highest numbers of participants
were all from Chemical Class 4 drugs. The large number of subjects on the test treatment for
positive trials and the total program participants for Chemical Class 1 can be explained by the
fact that a new molecular entity begins with the least amount of known information. Therefore,
New Chemical Entities frequently require the largest amount of testing and a large number of
subjects to adequately characterize safety and efficacy.
The application with the highest number of study participants was a repurposed drug2,
NDA 200063 Contrave (naltrexone hydrochloride/bupropion hydrochloride), in the Therapeutic
Class of anti-obesity drugs, most likely due to issues surrounding the safety of the new dosing
regimen that required extensive study. This application also received a Review Extension for
safety concerns, and a Complete Response for insufficient cardiovascular safety and
2 A repurposed drug is a drug previously approved for a different indication

30
teratogenicity study data. Obesity has much comorbidity that increase the patient’s risk factor for
many serious conditions, explaining the greater safety concerns surrounding drugs given to this
population.
5. Duration of Trials
One major cost to consider in the clinical development of the drug is the duration of the
clinical trials. This process can be variable, (i.e. extending enrollment periods due to low
enrollment numbers) and requires a great deal of resources (monitoring incoming data, site
inspections, finding sites and clinical investigators etc.). Beyond this variability, there are certain
factors, for example, disease indication and study design (i.e. cross-over versus parallel) that are
used to plan the clinical development program trial duration. The table below shows the average
duration of the trials done for the clinical development program (Phase 2b safety and Phase 3a
efficacy trials). It would be expected that Chemical Classes 1 and 2 would on average have the
longest trial durations, because as previously mentioned, most often New Molecular Entities and
New Active drugs begin clinical development with the least amount of safety and efficacy data.
Table 5 displays the average duration and standard deviation of the pooled Phase 2b and 3a
studies done by Chemical Class.
Table 5, Average Duration of Trials by Chemical Classification
Chemical Classification Duration of Phase 2b/3a Studies
in Weeks (Mean ± Standard Deviation)
Duration of Phase 2b/3a Studies in Weeks (Median)
1 (N = 9) 32.8 ± 51.7 6 2 (N = 3) 61 ± 0 61 3 (N = 32) 11.2 ± 13.8 7 4 (N = 16) 17.5 ± 20.6 8 5 (N = 33) 15.8 ± 11.4 16 7 (N = 7) NA NA

31
The five applications with the longest duration in clinical trials were each in different
Therapeutic Classes and in four different Chemical Classifications, with two applications falling
into the New Combination, Chemical Class 4. The singe defining characteristic of all of these
was that they were all for the treatment of chronic conditions.
6. Waivers, Post Marketing Requirements and Commitments
Waivers or deferrals may be given to applicants to ease the regulatory burden based on
prior evidence suggesting an approval would not need to obtain certain data, in the case of
waivers, or be safe enough, in the case of deferrals, to market the drug prior to obtaining certain
data. Deferrals are given as either studies “required” to be done post marketing or as a
“commitment” for the applicant that they will be done during the post marketing phase of
development. Required post marketing studies have a strict timeline agreed upon at the time of
approval, which is then monitored by the FDA.
Five of the 100 SBOAs received Nonclinical waivers, primarily for carcinogenicity
studies. Eleven applications had Nonclinical Post Marketing Required studies (PMRs) for issues
such as reproductive and development toxicity, antibody resistance, carcinogenicity, and
extractability/leachability. Only two of the programs reviewed had Nonclinical Post Marketing
Commitment studies (PMCs) for issues of impurities and extractability.
Table 6, Nonclinical Post Marketing Approval Agreements
Approval Agreement Type % of Applications Specific NC Tests
Waiver 5 Various Carcinogenicity
PMR 11 Reproductive and Development Toxicity; Antibody Resistance; Carcinogenicity; Extractability/Leachability
PMC 2 Impurities; Extractability *The lists of test are in order, from most common to least common

32
Thirty-eight of the 100 SBOAs received Clinical Pharmacology waivers dealing with
Bioequivalence or thorough QT studies. Nineteen SBOAs had Clinical Pharmacology PMR
studies for a variety of reasons, though pediatric PK and drug interactions were the most
common. Only one SBOA had a Clinical Pharmacology PMC study dealing with dissolution
methodology.
Table 7, Clinical Pharmacology Post Marketing Approval Agreements Approval Agreement
Type % of
Applications Specific CP Tests
Waiver 38 Biowaiver; QT
PMR 19
Pediatric PK; Drug Interaction; Renal Impairment; QT; Alcohol Interaction; Dose Linearity; Bioequivalence; Food Effect; In Vitro ADME; Hepatic Impairment
PMC 1 Dissolution Method *The lists of test are in order, from most common to least common
Sixty-three of the 100 SBOAs received Clinical waivers, almost entirely dealing with the
need for pediatric studies. Full Pediatric waivers were, in most cases, given when the indication
was not present in the pediatric population. Partial pediatric waivers were given in cases where
partial pediatric labeling was able to be included in the referenced material, therefore the waiver
was given for a subset of the pediatric population for which there was no reference information
available. Thirty-five SBOAs had Clinical PMR studies, where pediatrics, again, was the
predominant issue, but with a number of other types of long-term safety issues also resulting in
PMRs. For Pediatric studies under post marketing requirements, most often the cases were
similar to those of clinical waivers, when the pediatric labeling was included in the reference
material but long-term safety and efficacy studies needed to be completed.

33
Table 8, Clinical Post Marketing Approval Agreements
Approval Agreement Type % of Applications Specific Clinical Tests
Waiver 63 Partial Pediatric; Full Pediatric; Maternal Labeling
PMR 35 Pediatric; Long Term Safety and Efficacy; Post Marketing Other; Post Marketing Abuse Liability; Cardiovascular Outcome Trial
PMC 1 Long Term Safety and Efficacy *The lists of test are in order, from most common to least common
Pediatric PMR may have also been indicated for drugs that were ready for approval in
adults but not yet in children. In this this situation, delaying the approval of the drug would be
considered unethical to the adult population. In contrast, post market commitments were rarely
seen. Only one SBOA had a Clinical PMC study for a long-term safety study The most common
Clinical waivers were either Partial Pediatric or Full Pediatric waivers. This is most likely
because post marketing commitments are studies that the applicant has agreed to complete, but
which are not required by law (FDA, 2016c).
7. Timeline and Duration of Development Program
The Duration of the Lifecycle Development Program, for the purpose of this project has
been defined as: Approval Date - Initial IND Submit Date
The duration of the lifecycle development can be used to fully understand both the time
and regulatory burden of a given drug. However, because INDs may begin at vastly different
stages (e.g., at a first-in-human study for a New Chemical Entity and with only a BE study for a
reformulation), interpretation of an analysis of the duration between initial IND submission and
the drug Approval Date can be complicated. It is, at least, more common that drugs of the same
Chemical Class submit their INDs at similar stages and so for the purpose of this study, the
duration of the development program is explained from the perspective of the Chemical Class.

34
Not surprisingly, the average for lifecycle development programs requiring clinical trials
is longer than those programs where no trials were needed. Review Extensions and Complete
Responses seem to be associated with a similarly long lifecycle development period, despite the
three-month extension versus ten-month (plus time to rectify the deficiency) delay period
associated with each. This seems to be because over half of the applications receiving a review
extension (56%) also received a complete response. Table 9 demonstrates the duration (IND
Submit date to Approval Date) ± standard deviation of development programs with or without
clinical trial requirements by regulatory outcome delay type.
Table 9, Average Duration of Lifecycle Development, With and Without Clinical Trials
Duration of Lifecycle Development (Mean Days ± Standard Deviation; Median)
Clinical Trials
All Applications
Refuse to File
Review Extension Complete Response
No Clinical Trials
1,391 ± 940; 1302
1,279 ± 430; 1215
1,567 ± 1,169; 1086
1,384 ± 688; 1159
At Least One Clinical Trial
2,159 ± 1,465; 1850
NA 2,711 ± 2,172; 1972
2,725 ± 1,150; 2669
*See appendix D for graph of the individual applications comprising this data.
There seems to be little to suggest, at this point in the analysis of these data, any single
underlying cause for having a particularly protracted development program. Interestingly, the
applications with the three longest clinical development lifecycles came from three different
Chemical Classes. They each completed between one and two clinical trials, and in addition,
they all received a review extension at some point during their initial NDA submission to their
applications for different reasons. The second and third longest critical lifecycle development
durations were among the applications approved past the PDUFA Goal Date, by 148 and 23
days, respectively. Aside from this, the applications had little in common, being reviewed by
different Divisions, falling into three different Purposes for 505(b)(2) categories, Therapeutic

35
Classes and ATC2 Codes. Further evaluation of this issue should be pursued in the remaining
505(b)(2) SBOAs.
D. Regulatory Review
1. General Observations
The applications with the four shortest review durations, all less than 55 days had each
received a Complete Response prior to the final application submission. The short duration of
their regulatory review is likely because the Agency was able to review the drug rapidly because
they had already reviewed the majority of the material and therefore only needed to review the
additional material that had been submitted with the Complete Response.
Figure 11, Duration of the Regulatory Review Period
*The standard Review Period (270 Days) is given as a point of reference **The timeline is not drawn to scale
The three longest review periods were 542 days, 481 days, and 409 days versus the
standard 270 days for a review for a Standard Review cycle. All three were from different
Therapeutic Classes, ATC2 codes, and reviewed by different Divisions; however, as a single
point in common, they each had a Review Extension for a Major Amendment.
2. Priority Versus Standard Regulatory Review Cycle
When evaluating the Review Cycle for NDAs submitted to the FDA, one should consider
applications with a Priority Designation separately from those with a Standard Review status.
The review designation of Priority was established in the 2007 as an amendment to the Food
Drug and Cosmetic Act to help expedite the review of needed medications. A Priority
designation means that the drug will be reviewed with a 6 month/180 day, versus the Standard

36
application 9 month/270 day review cycle.
Figure 12, Expected Priority Regulatory Review Versus the Standard Regulatory Review Period
*The timeline is not drawn to scale
The average regulatory review cycle (Final NDA Submit Date to Approval Date) is
232.26 days (standard deviation: 89.40) for Priority reviews and 246.74 days (standard
deviation:102.44) for Standard reviews, respectively.
Figure 13, Average Priority Regulatory Review Versus the Standard Regulatory Review Period, from 100 SBOA Dataset
*The timeline is not drawn to scale
The similarity in the mean duration of the regulatory review period for priority and
standard reviews is not what one would expect. This issue should be further explored.
Particularly of interest would be further exploration of the standard applications with the shortest
Regulatory Review duration and the priority applications with the longest Regulatory Review
duration.
3. Applications Approved Past PDUFA Goal Date
Having a Review Cycle run past the PDUFA goal date is highly unusual since the
Agency is accountable to Congress for these metrics and since Application deficiencies would

37
typically result in a Complete Response before such a milestone was missed. Rather, this is more
likely to occur in the setting of an almost certain approval that needed a Class REMS (Risk
Evaluation and Mitigation Strategy) or some other unusual circumstance. Six percent of the
applications reviewed in this project were approved past their PDUFA Goal date. The number of
days that the applications were approved past their goal date ranged from 11 to 238 days.
Figure 14, Visual Representation of Applications Approved the Furthest After Their PDUFA Goal Date
*The five applications highlighted with an orange ring were the approved the latest after their PDUFA goal date **In the above figure “0” days indicates the PDUFA goal date
Three of the drugs approved past their PDUFA goal date belong to the class of extended
release drugs, two of which are also abuse-deterrent. These extended release opioids were also
approved at a time when the FDA was working with Sponsors to develop the Risk Evaluation
and Mitigation Strategy before approving any Extended-Release and Long Acting (ER/LA)
opioids to help combat opioid misuse and diversion (FDA, 2016d). The current and growing
problem of opioid dependence within the United States, has largely been created by the overuse
and over prescribing of opioid pain medication, often for indications not needing such high-

38
strength and long acting opioids. Approving abuse deterrent versions of opiate medications is
one format the FDA is using to combat this problem.
4. Applications Approved Before PDUFA Goal Date
While the reviewer workload, multidisciplinary nature of the review protocol, and
volume of information in a typical NDA preclude finishing review much sooner than the PDUFA
goal date, this can occur on occasion. On at least 5 occasions from the 100 SBOAs reviewed,
drugs were approved significantly sooner (i.e., from 63 days to 166 days) than their Goal Date.
Figure 15, Visual Representation of Applications Approved the Furthest Before Their PDUFA Goal Date
*The five applications highlighted with an orange ring were the applications approved with the greatest amount of time before their PDUFA goal date **In the above figure “0” days indicates the PDUFA goal date
Three drugs approved before their PDUFA Goal date are indicated for emergent and
serious medical conditions. One is a class 5 medication for Cardiac therapy, approved for
Ophthalmologic use, for the indication of pupil dilation. Two of the 5 drugs approved soonest

39
before their Goal date belong to the Therapeutic Class of opioid antagonist and were approved
78 days and 63 days before their Goal date for the indication of emergency treatment of
suspected opioid overdose. Notably, these were the only two of the top five drugs approved
before their Goal date that received both priority and fast track designations for indications
involving the administration of emergency and lifesaving medication. Given this knowledge, it is
reasonable to conclude that often times, 505(b)(2) drugs approved before their PDUFA Goal date
are potentially of high value to society.
E. Regulatory Outcomes
1. Trends in Regulatory Outcomes in Recent Years
During the progression of the most recent period from 2013 to 2015, there was a decrease
in the percent of applications reviewed for this project to date, filed that year, encountering
Refuse to File (7% of all applications), reported as 17%, 9%, and 3% for 2013, 2014 and 2015
respectively. This same trend was identified for Review Extension (32% of all applications),
which adds three months to the Review Period for the application; Review Extension affected
61% of applications in 2013, 28% in 2014, and 13% in 2015.
This dramatic reduction of the percentages of applications encountering Refuse to File and
Review Extension by roughly half that of the previous year could be interpreted as an increased
understanding and better utilization of the 505(b)(2) pathway in recent years.

40
Figure 16, Distribution of the Number of Applications Encountering (Y) or Not Encountering (N) Each Type of Regulatory Delay by Year of Approval
*The numbers labeling the bars correspond to the total number of applications represented in that bar. Because there were uneven samples taken from each of the years (focusing on reviewing the most current data), the graph depicts the inequalities between years.
However, for Complete Responses, the most frequently encountered delaying regulatory
outcome, recent years (2013-2015) do not show this overall trend, with the exception of when
grouped by Chemical Classification in some of the more popular Chemical Classification groups
(e.g. Chemical Class 3). The fact that this trend is not seen for the Complete Response, the most

41
commonly encountered regulatory outcome (38% of all applications) indicates that better
information is needed to understand what can cause Complete Responses and how to avoid them.
This adds upon the information discussed earlier relating to lifecycle development duration and
delaying regulatory outcomes (VII.C.7), and will be discussed in further detail in the section
pertaining to the delay period (VII.E.2).
2. Delay Period
The delay period is defined as:
Final NDA Submission Date - Initial NDA Submission Date (Appendix A)
The delay period was determined for applications having encountered one or more of these three
outcomes: Refuse to File, Review Extension and Complete Response. The number of
applications, of the total 100 SBOA dataset which received a Complete Response was 38, 32
received a Review Extension, and 7 Received a Refuse to file.
Table 10, Frequency of Encounters with Each Delay Type by Chemical Classification Chemical Class
(CC) Complete Response
(CR) Review Extension
(RE) Refuse to File
(RTF) Class 1 1 3 0 Class 2 2 3 0 Class 3 12 12 2 Class 4 6 3 0 Class 5 15 9 3 Class 7 2 2 2
TOTAL 38 32 7
It was not uncommon for applications to encounter more than one type of regulatory
outcome known to cause delays. Over half (53%) of the 100 SBOAs reviewed, were applications
which had encountered at least one delaying regulatory outcome. Of that percentage, almost 36%
(19 applications) were instances where the applications had encountered more than one delaying
regulatory outcome.

42
Figure 17, Absolute Number of Applications Encountering One or More of Each Delaying Regulatory Outcome
*N = 100 SBOA Database, of this 53 applications encountered at lest one type of delaying regulatory outcome and are represented in this figure
a) Complete Response
For the purposes of this study, the delay period from a Complete Response was defined
as the period from an NDA’s initial submission to it’s final submission, for NDAs that had
received a Complete Response, regardless of the number of Complete Response cycles the
application encountered. The average delay for an application receiving a Complete Response
was 781 days (standard deviation: 487; median: 643), versus the average delay period of 16 days
(standard deviation: 80; median: 0) for those applications that did not encounter a Complete
Response.
The four most common causes contributing to a Complete Response action were
chemistry concerns (17 applications), insufficient/inadequate safety or efficacy data (16
applications), tentative approval (8 applications), manufacturing concerns (6 applications).

43
Table 11, Most Common Causes of Encountering a Complete Response Cause of Complete Response Number of Applications with this Cause
Chemistry Concerns 17
Insufficient/Inadequate Safety or Efficacy Data 16
Tentative Approval 8
Manufacturing Concerns 6
The cause associated with the application having the longest delay period were those
involving the combination of manufacturing and chemistry concerns, which was associated with
an average delay period of 1159 days (standard deviation: 841) and was the type of delay that
was most frequently encountered by the Chemical Class 3 and 5 drugs.
b) Review Extension
A Review Extension is a 3-month extension of the review cycle based on receipt of
additional materials that are needed for approval. Review Extensions are generally not given to
programs unless an Approval is anticipated since the Application could simply receive a
Complete Response for deficiencies and would be spared a 3-month delay. The average review
cycle duration for an application encountering a Review Extension was 433 days (standard
deviation: 546; median: 296), versus the average review period for those applications that did not
encounter a Review Extension, 250 days (standard deviation: 441; median: 0), although some of
the programs may have encountered other regulatory outcomes resulting in delays. As mentioned
in the Section pertaining to the Lifecycle Development duration, the fact that over half the
applications encountering Review Extensions also received at least one Complete Response most
likely has an influence on the average delay period duration being greater than the expected 90-
day (3-month) duration.
The four most common causes for review extensions were chemistry concerns (8

44
applications), late submission of new data (11 applications), manufacturing concerns (4
applications), insufficient/inadequate safety or efficacy data (4 applications).
Table 12, Most Common Causes of Encountering a Review Extension Cause of Review Extension Number of Applications with this Cause
Late Submission of New Data 11
Chemistry Concerns 8
Manufacturing Concerns 4
Insufficient/Inadequate Safety or Efficacy Data 4
Causes associated with the longest delay period were those involving safety concerns
related to REMS requirements, which was associated with an average delay period of 791 days
(standard deviation: 187). This type of delay was most frequently encountered by the Purpose of
the 505(b)(2) Application category of Repurposed drugs.
c) Refuse to File
The FDA may refuse to file (review) an NDA that has been submitted based on the
regulations codified in 21CFR314.101(d)(1-9) (Food and Drugs, 2016). This action must take
place within 60 days of the application being filed, and can be for various reasons all of which
aim at avoiding multiple submission cycles and unnecessary review of an incomplete application
or Abbreviated NDAs which were incorrectly submitted as an NDA (Office of New Drugs,
2013). The average duration of the review cycle for an application encountering a Refuse to File
was 615 days (standard deviation: 420; median: 483), versus the average period for those
applications that did not encounter a Refuse to File of 284 days (standard deviation: 480;
median: 0).

45
The three causes for a refuse to file an application were chemistry concerns (3
applications), the applicant not including a fee with their submission (2 applications), and
insufficient/inadequate safety or efficacy data (2 applications).
Table 13, Most Common Causes of Encountering a Refuse to File Cause of Refuse to File Number of Applications with this Cause
Chemistry Concerns 3
No Fee Included 2
Insufficient/Inadequate Safety or Efficacy Data 2
The cause associated with the longest delay period were those in the category involving
insufficient or inadequate data which was associated with an average delay period of 943 days
(standard deviation: 651). This type of delay was most frequently encountered in SBOAs of
Chemical Class 5 drugs.
The applications experiencing the longest delay periods had received at least one
Complete Response. The applications with the first (1943 days) and fourth (1673 days) longest
delays received two complete responses, for manufacturing concerns and insufficient data related
to safety concerns, respectively. The application with the second longest delay period (1793
days) received one Complete Response related to manufacturing concerns. The third longest
delay period (1754 days) received four Complete Responses, related to manufacturing concerns
and chemistry concerns. Additionally, the applications with the third and fourth longest delay
periods each received a review extension in addition to their Complete Responses. Enhancing
communication between the agency and applicant during the pre-NDA stage of the development
lifecycle could help to reduce the frequency of the complete response actions.
The trend seen over the recent years with decreasing percentages of Review Extensions
and Refuse to Files encountered per year could be due to improvement in the industry, although

46
the change could be caused in part by a decreased tendency in the Agency to utilize these severe
regulatory actions and increased pressure to approve drugs (see Figure 16, page 48). Considering
that Complete Responses are associated with a longer duration of time between the initial NDA
submission and the final NDA submission than either Refuse to File or Review Extension, the
pharmaceutical industry should focus its efforts on better understanding the causes of their
Complete Responses and how to decrease the likelihood of receiving Complete Responses.
VIII. Limitations
This study did not take into account the overall value of the drug and how that could
influence the importance of the duration of approval time/review time/delays. Often time the
overall value of a drug can impact all the stakeholders involved, including the Agency and the
Sponsors. The specific effects of these influences are often unknown and unable to be accounted
for, making it difficult to draw a concrete conclusion even with knowledge of this phenomenon.
The data included focuses mainly on the most recently submitted applications. The
majority of the database is composed of applications from the 2014 and 2015. Additionally, of
the 277 505(b)(2) applications, 250 were available for review, due to the time constraints of the
project 100 applications were randomly selected from the available 250, to provide adequate
inferential information. Although the database is not comprehensive, this was chosen as the
preferred method to provide information on the most current and relevant submissions.
The data collected for this study was based on reviewer information. Occasionally,
conflicting information between different departments or reviewers was encountered and best
judgment was used to decide the final information. Additionally, reviews are not all inclusive
documents and in a select number of rare instances, the SBOAs do not include all the standard

47
sections. Lastly within the SBOAs certain information is often blacked out for legal reasons but
in a select handful of applications may have contained one or more of the variables in the
database (most frequently IND submission date).
Not all data could be included in the simple descriptive statistics used in this study. For
example, in certain instances, Chemical Classification can be a combination of two Chemical
Classes, for these cases the representative Chemical Classification was chosen by taking into
account the Purpose of the 505(b)(2) Application categorization. This method was chosen as it
resulted in the representative Chemical Class reflecting the driving of the application. This also
allowed for analysis of the Chemical Classes within variation instead of creating individual
Chemical Class categories based on a very small number of applications.
IX. Conclusion
In this Section, I note what I believe are the most important contributions of the 505(b)(2)
to regulatory strategy as well as some observations I found most unexpected.
Utilization of the 505(b)(2) application as a portfolio strengthening strategy yields many
benefits with few risks. The unique characteristic of the 505(b)(2) application is that is can allow
one to mitigate risk and resource expenditure while maintaining the potential to participate in
Expedited Programs (e.g. the highly coveted Orphan drug exclusivity). In practice, this means
that resources can be allocated elsewhere, in development programs of other drugs with a higher
resource burden. The ability to “play it safe” while still “playing the lottery” makes the 505(b)(2)
a valuable strategy when utilized correctly.
The data suggest that there is little difference in the duration of the Regulatory Review
periods between Standard and Priority applications. This unexpected finding should be explored

48
in much greater detail, beyond the level of encountering at least one type of delaying regulatory
outcome.
Because many regulatory outcomes resulting in delays dealt with the same concerns, it is
reasonable to suggest that Sponsors focus on strengthening their manufacturing practices,
preparing for production facility inspections, and dealing with CMC (Chemistry) issues of novel
formulations. This seems an inherently intuitive rule, but it is particularly important for
applications submitted under 505(b)(2) for approval. Often times, references used by programs
using the 505(b)(2) approval route lessen the burden of providing evidence of safety and
efficacy. Therefore, manufacturing and CMC concerns become the most complex and critical
problems encountered during the development process. The knowledge gained by developing
better CMC and manufacturing practices has the potential to positively impact the development
of drugs outside of the 505(b)(2) pathway.
It is expected that the Agency’s past findings of safety and efficacy are the most common
types of references. As more drugs become approved, the amount of available information to
reference will only increase. This has the potential to greatly increase the utilization of the
505(b)(2) pathway within the pharmaceutical industry.
Given the distinct benefits and potential impact from using the 505(b)(2) regulatory
strategy, the pharmaceutical industry should strive to more efficiently and effectively utilize it.
This can be achieved through better communication and increased collaboration between the
Agency and Sponsors. This could be especially beneficial throughout the duration of the pre-
NDA submission phase of lifecycle development program, leading to benefits for both the
Sponsor and Agency. The chance for the Agency to help Sponsors better understand when and
why they are encountering a particular delaying regulatory outcome could provide the Sponsors

49
more time to prepare and to resolve the problems. This, in turn, could decrease the strain put on
the Agency by multiple review cycles of a drug application. Additionally, increased retrospective
communication, once the application has been approved, between the Agency and Sponsors
could grant the Sponsors a chance to better understand why the delaying regulatory outcome
occurred during the submission process. This would help Sponsors to preempt future delays of
the same type from occurring again.

50
References
Authentichistory.com (2012). Quackery: A Brief History of Quack Medicines & Peddlers. Authentic History website. http://www.authentichistory.com/1898-1913/2-progressivism/8-quackery/. July 21, 2012. Accessed August 24, 2016.
Benson III, A. B. (2011). What Level of Evidence the Elusive Balance in Drug Development. Journal of the National Comprehensive Cancer Network, 9(9)955-58.
Coutant, D., Riggs, D., Van Sant Hoffman, E. (2010). Substantial Evidence: When Is a Single Trial Sufficient for Approval and Promotion? Drug Information Journal, 45(3)253-63.
DiMasi, J., Hansen, R., & Grabowski, H. (2003). The price of innovation: new estimates of drug development costs. Journal of Health Economics, 22(2)151-185.
DiMasi, J. A., Feldman, L., Seckler, A., & Wilson, A. (2010). Trends in Risks Associated With New Drug Development: Success Rates for Investigational Drugs. Clinical Pharmacology and Therapeutics, 87(3)272-7. doi: 10.1038/clpt.2009.295
Downing, N. S. et. Al. (2012). Regulatory Review of Novel Therapeutics — Comparison of Three Regulatory Agencies. N Engl J Med, 2012(366)2284-2293.
Ebel, T., Schrader, U., Shah, K. (2014). Finding Opportunity in Uncertainty A New Paradigm for Pharmaceutical Supply Chains. McKinsey & Company, 2014. Ebook.
Food and Drugs, 21 C.F.R. § 314 (2016).
Hurley, M. E. (2004). The Nuts and Bolts of 505_b_2 Applications. Regulatory Affairs Focus, 2004(May)5-9.
Jaeger, K. D. (2003). Re: Docket Numbers OlP-0323 and 02P-0447: Supplemental Comments by the Generic Pharmaceutical Association in Response to Petitions Filed by Pfizer Inc, and Pharmacia Corporation. Generic Pharmaceutical Association. 9, October, 2013.
Johnston, G., Williams, R. L. 505(b)(2) Applications: History, Science, and Experience. Drug Information Journal, 36 (2002): 319-323.
Kesselheim, A. S. and Darrow, J. J. (2015). FDA Designations for Therapeutics and Their Impact on Drug Development and Regulatory Review Outcomes. Clinical Pharmacology & Therapeutics, 1(97) 29-36.
Kulynych, J. (1999). Will FDA relinquish the gold standard for new drug approval Redefining substantial evidence in the FDA modernization act of 1997. Food and Drug Law Journal, 10(54)127-49.
Kwok, M. et. al. (2015). Expedited Programs for Serious Conditions: An Update on Breakthrough Therapy Designation. Clinical Therapeutics, 37(9). Retrieved from http://dx.doi.org/10.1016/j.clinthera.2015.07.011 0149-2918/$
Mossinghoff, G. J. (1999). Overview of the Hatch-Waxman Act and Its Impact on the Drug Development Process. Food & Drug L.J, 1999 (54)187-94. Retrieved from http://heinonline.org

51
Reed, S.D., Califf, R. M., Schulman, K. A. (2007). Is There a Price to Pay for Short-Term Savings in the Clinical Development of New Pharmaceutical Products?. Drug Information Journal, 2014(41) 491-99.
Sasinowski, F. J. (2011). Quantum of Effectiveness Evidence in FDA’s Approval of Orphan Drugs; Cataloguing FDA’s Flexibility in Regulating Therapies for Persons with Rare Disorders. Drug Information Journal, 46(2).
Section 115(a) of the Food and Drug Administration Modernization Act of 1997 (FDAMA).
Sertkaya, A., Birkenbach, A., Berlind, A., Eyraud, J. (2014). Examination of Clinical Trial Costs and Barriers for Drug Development. Retrieved from U.S. Department of Health and Human Services website: https://aspe.hhs.gov/report/examination-clinical-trial-costs-and-barriers-drug-development
Sheetal Agarwal, PhD, RAC, et. al. (2014). Overview of Recently Approved 505(b)(2) New Drug Applications (2010–2012): Role of Clinical Pharmacology. The Journal of Clinical Pharmacology, 54(12) 1330-36. doi: 10.1002/jcph.350.
Speeding Access to Already Approved Pharmaceuticals Act of 2014, H. R. 4918, 113th Cong. (2014).
Speeding Access to Already Approved Pharmaceuticals Act of 2015, H. R. 4918, 114th Cong. (2015).
Spielmans, G. I., Kirsch, I. (2014). Drug Approval and Drug Effectiveness. Annu. Rev. Clin. Psychol., 2014 (10)741–66. doi: 10.1146/annurev-clinpsy-050212-185533.
U.S. Food and Drug Administration Center for Drugs Evaluation Research (1998). Guidance for Industry: Providing Clinical Evidence of Effectiveness for Human Drug and Biological Products. Washington, D.C: U.S. G.P. O.
U.S. Food and Drug Administration Center for Drugs Evaluation Research (1999). Guidance for Industry: Applications Covered by Section 505(b)(2). Washington, D.C: U.S. G.P. O.
U.S. Food and Drug Administration Center for Drugs Evaluation Research (2015). Guidance for Industry: Premarketing Risk Assessment. Washington, D.C: U.S. G.P. O.
U.S. Food and Drug Administration (2008). FDA Revises Process for Responding to Drug Applications [Press release]. Retrieved from U.S. Food and Drug Administration website: http://www.fda.gov/NewsEvents/Newsroom/PressAnnouncements/2008/ucm116920.htm
U.S. Food and Drug Administration. (2012). PDUFA Lays the Foundation: Launching Into the Era of User Fee Acts. U. S. Food and Drug Administration website. http://www.fda.gov/AboutFDA/WhatWeDo/History/Overviews/ucm305697.htm
U. S. Food and Drug Administration Center for Drug Evaluation and Research (2015). Policy and Procedures: Office of Pharmaceutical Quality NDA Classification Codes (MAPP 5018.2). U. S. Food and Drug Administration/Center for Drug Evaluation and Research. Web. 1 November 2016.

52
U.S. Food and Drug Administration. (2016a). Drugs@FDA: FDA Approved Drug Products. U. S. Food and Drug Administration website. http://www.accessdata.fda.gov/scripts/cder/daf/
U.S. Food and Drug Administration. (2016b). NDA and BLA Calendar Year Approvals. U. S. Food and Drug Administration website. http://www.fda.gov/Drugs/DevelopmentApprovalProcess/HowDrugsareDevelopedandApproved/DrugandBiologicApprovalReports/NDAandBLAApprovalReports/ucm373413.htm
U.S. Food and Drug Administration. (2016c). Postmarketing Requirements and Commitments: Introduction. Food and Drug Administration website. http://www.fda.gov/Drugs/GuidanceComplianceRegulatoryInformation/Post-marketingPhaseIVCommitments/
U.S. Food and Drug Administration. (2016d). Risk Evaluation and Mitigation Strategy (REMS) for Extended-Release and Long-Acting Opioids. Food and Drug Administration website. http://www.fda.gov/Drugs/DrugSafety/InformationbyDrugClass/ucm163647.htm
WHO Collaborating Centre for Drug Statistics Methodology (2013). Guidelines for ATC classification and DDD assignment 2013. Oslo, NOR: Norwegian Institute of Public Health.
Woosley, LR. (2012). One hundred years of drug regulation: where do we go from here? Annu Rev Pharmacol Toxico, 2013(53)255-73. doi: 10.1146/annurev-pharmtox-011112-140159.

53
Appendices
Appendix A: Variable Breakdown
1 APPLICATION NUMBER
2 Priority Standard (P/S)
3 Fast Track (Y/N)
4 Accelerated Approval (Y/N)
5 Orphan Status (Y/N)
6 Breakthrough (Y/N/NA)
7 QIDP (Y/N/NA)
8 Established Name (free text)
9 Trade Name (free text)
*10 Year of Approval (2010/2011/2012/2013/2014/2015)
11 Molecular Class (text)
12 ATC4 Code (text)
*13 Therapeutic Class (text)
*14 ATC2 Code (text)
15 Combination Products (FDC/CDDP/N)
16 Formulation (P/Po/O/S/Sa/T/To)
17 Modified or Immediate Release (C/D/E/I/S)
18 Route of Administration (H/I/IM/O/P/Pa/SQ/Su/T)
19 Indication (free text)
20 Applicant (free text)
21 Division (text)

54
22 IND# (#)
23 IND Submitted (MM/DD/YYYY)
24 Initial NDA Submission (DD/MM/YYYY)
25 Withdrawal or RTF (Y/N)
26 RTF Reason (text)
27 Final NDA/CR Submitted (DD/MM/YYYY)
28 Review Extension? (Y/N)
29 RE Reason (text)
30 Complete Response? (Y/N)
31 # of CRs? (#)
32 Expanded CR Reasons; Reason for Each Cycle (text)
33 CR Reason (text)
34 Initial PDUFA Goal Date (DD/MM/YYYY)
35 Final PDUFA Goal Date (DD/MM/YYYY)
36 Approval Date (DD/MM/YYYY)
37 Was Approval Date After the Final PDUFA? (Y/N)
38 Approval Date – PDUFA Goal Date (in # of days)
39 Reason Approved After PDUFA Goal Date (NA or text)
40 Type of Pediatrics Evidence? (text)
41 Type of Geriatrics Evidence? (text)
*42 Chemical Classification (#)
*43 Purpose of B2 Application (text)
NONCLINICAL

55
44 Referencing Nonclinical? (Y/N)
45 Nonclinical References (L/M/P/NA)
46 Was a Receptor Binding Screen Done? (Y/N)
47 Was a Single Dose Toxicity Study Done? (Y/N)
48 Was a 6 Month Rodent Repeat Dose Toxicity Study Done? (Y/N)
49 Was a 9 Month Rodent Repeat Dose Toxicity Study Done? (Y/N)
50 Complete set of Toxicology Studies (prior 3) Done? (Y/N)
51 If 6MO rodent OR 9 MO non rodent RDT were not done, What was longest Repeat Dose tox
study done? (text)
52 Was an Ames study done? (Y/N)
53 Was a Micronuclease study done? (Y/N)
54 Was a chromosomal aberration study done? (Y/N)
55 Complete set of gene tox studies (prior 3) Done? (Y/N)
56 Was A CV Safety Pharm study done? (Y/N)
57 Was a respiratory safety pharm study done? (Y/N)
58 Was a CNS safety pharm study done? (Y/N)
59 Was a complete set of Safety Pharm studies (prior 3) done? (Y/N)
60 Was a Fertility and early embryonic study (Segment 1) study done? (Y/N)
61 Was a Embryo-fetal development study done (Segment 2) study done? (Y/N)
62 Was a postnatal development study done (segment 3) study done? (Y/N)
63 Complete set of repro tox studies (prior 3) done? (Y/N)
64 Was a CARC program done at all? (Y/N)
65 Carc with 1 or 2 species? (NA/1/2)
56
66 Was a juvenile study done? (Y/N)
67 Were any abuse liability studies done (Animals)? (Y/N)
68 Any other P/T studies? (Y/N)
69 Type of special P/T study (free text)
70 Was there a NC PMR at approval? (Y/N)
71 Type of PMR NC (text)
72 Was there NC PMC at approval? (Y/N)
73 Type of NC PMC (text)
74 NC Waiver? (Y/N)
75 Which P/T Study Waived? (text)
CLINICAL PHARMACOLOGY
76 Referencing Clinical Pharmacology? (Y/N)
77 Clinical Pharmacology References (L/M/P/NA)
78 Was an SAD study done? (Y/N)
79 Was an MAD study done? (Y/N)
80 Was a MTD (maximal tolerated dose) determined? (Y/N)
81 Was a SD study done? (Y/N)
82 Was a MD study done? (Y/N)
83 Was a Relative bioavailability study done? (Y/N)
84 Was a dose proportionality study done? (Y/N)
85 Was a food effect study done? (Y/N)
86 Was a renal impairment study done? (Y/N)
87 Was a hepatic impairment study done? (Y/N)
57
88 Was a Ped Pk study done? (Y/N)
89 Was an elderly study done? (Y/N)
90 Was a gender study done? (Y/N)
91 Was IN VITRO ADME done? (Y/N)
92 Was IN VITRO DDI done? (Y/N)
93 Was IN VIVO DDI done? (Y/N)
94 Was a QT study done? (Y/N)
95 Was a mass balance study done (In vivo)? (Y/N)
96 Was a Population PK study done? (Y/N)
97 What was derived from the PPK (text)
98 Was an Abuse Liability Study Done (Humans)? (Y/N)
99 Was an In vivo Alcohol interaction study done (in humans)? (Y/N)
100 Type of special CP study? (free text)
101 Was there a CP PMR at approval? (Y/N)
102 Type of PMR CP (text)
103 Was there CP PMC at approval? (Y/N)
104 Type of CP PMC (text)
105 CP Waiver? (Y/N)
106 Which CP Study Waived? (text)
CLINICAL
107 Referencing Clinical? (Y/N)
108 Clinical References (L/M/P/NA)
109 Clinical Requirements? (Y/N)
58
110 Was there a C PMR at approval? (Y/N)
111 Type of C PMR (text)
112 Was there C PMC at approval? (Y/N)
113 Type of C PMC (text)
114 # Ph2b Trials Performed (#)
115 # + Ph2b Trials (#) (NA or #)
116 Average Duration of Treatment Period for + Ph2b Trials (weeks) (NA or #)
117 # Ph3a Trials Performed
118 # + Ph3a Trials (NA or #)
119 Total # + Ph2b/Ph3a Trials (NA or #)
120 Average Duration of Treatment Period for + Ph3a Trials (weeks) (NA or #)
121 # OLES or Safety Trials (#)
122 # Other Trials (#)
123 Type of Other Trials (NA or text)
124 Total # subjects in + Ph2b/3a trials (not including OLES)
125 # subjects on test treatment in Ph2b or 3a efficacy program (not including OLES)
126 # subjects on test treatment in whole program (NA or #)
127 # subjects in total program (NA or #)
128 Type of + Ph2b/3a controls (AN/AS/H/P/S)
129 C Waiver? (Y/N)
130 Which C Study Waived? (NA or text)
131 If DS > 2; Comment here. (NA or text)
132 If DS = 0; comment on reason (NA or text)

59
133 Summary Review identified studies essential to approval for efficacy? (Y/N)
134 Types of studies and # (NA or text)
135 Delay? (Y/N)
Timeline Columns Derived from Original Data:
Duration of the Lifecycle Development Program: Approval Date (36) – Initial IND Submit Date
(23)
Duration of the Regulatory Review Cycle: Approval Date (36) – Final NDA Submit Date (27)
The Delay Period: Final NDA Submission Date (27) – Initial NDA Submission Date (24)
*Key subpopulations

60
Appendix B: Full List of ATC2 Codes with Frequencies (46 Total)
1 Agents acting on the renin-angiotensin system: 2
2 Agents acting on the renin-angiotensin system/calcium channel blockers: 1
3 All other therapeutic products: 2
4 Analgesics: 3
5 Analgesics/Analgesics: 1
6 Anti-acne preparations: 1
7 Antibacterials for systemic use: 8
8 Antibacterials for systemic use/antibacterials for systemic use: 1
9 Antidiarrheals, intestinal anti-inflammatory/anti-infective agents: 1
10 Antiepileptics: 4
11 Antifungals for dermatological use: 1
12 Antigout preparations: 1
13 Antihistamines for systemic use/Corticosteroids, dermatological preparations: 1
14 Antiinflammatory and antirheumatic products: 4
15 Antiinflammatory and antirheumatic products/Antihistamines for systemic use: 1
16 Antineoplastic agents: 8
17 Antiobesity preparations, excluding diet products: 1

61
18 Antithrombotic agents: 2
19 Antivirals for systemic use: 2
20 Beta blocking agents: 2
21 Bile and liver therapy: 1
22 Blood Substitutes and perfusion solutions: 1
23 Calcium channel blockers:1
24 Calcium homeostasis: 2
25 Cardiac therapy: 3
26 Contrast media: 1
27 Cough and cold preparations: 4
28 Cough and cold preparations/antihistamines for systemic use: 3
29 Drugs for constipation: 1
30 Drugs for treatment of bone diseases: 1
31 Drugs used in diabetes: 3
32 Mineral supplements: 1
33 Muscle relaxant: 2
34 Nucleoslide: 1
35 Ophthalmologicals: 6

62
36 Other alimentary tract and metabolism products: 1
37 Other dermatological preparations: 1
38 Other nervous system drugs: 2
39 Otologicals: 1
40 Pancreatic hormones: 1
41Psychoanaleptics: 7
42 Psycholeptics: 3
43 Sex hormones and modulators of the genital system: 2
44 Sex hormones and modulators of the genital system/sex hormones and modulators of
the genital system/antianemic preparations: 1
45 Topical products for joint and muscular pain: 1
46 NO ATC2 CODE: 2

63
Appendix C: Full List of Therapeutic Classes with Frequencies (46 Total)
1 Analgesics: 11
2 Anti-acne preparations: 1
3 Antiarrhythmics: 1
4 Antibiotic: 10
5 Anticoagulant: 2
6 Antidepressant: 2
7 Antiepileptics: 4
8 Antifungal: 1
9 Antigout preparations: 1
10 Antihistamine/anti-inflammatory: 1
11 Antihypertensive: 3
12 Antiinflammatory: 1
13Antimuscarinic: 1
14 Antineoplastic: 8
15 Antiobesity drug: 2
16 Antiosteoporotic: 1
17 Antiparasitic: 1

64
18 Antipsychotic: 2
19 Antitussive/antihistamine: 3
20 Antitussive/expectorant: 2
21 Antiviral: 2
22 Beta-adrenergic receptor antagonist: 1
23 Bile acid: 1
24 Blood glucose lowering agents: 4
25 Bone-vitamin D: 2
26 Calcium channel blocker: 1
27 CNS stimulant: 4
28 Cystine depleting agent: 1
29 Gastrointestinal motility inhibitor: 1
30 Hormonal contraception: 1
31 Hormone replacement: 1
32 Hypnotic: 2
33 Laxative: 1
34 Muscle relaxant: 2
35 Neuromuscular blocker inhibitor: 1

65
36 NSAID/Sleep aid: 1
37 Nutrient: 2
38 Ophthalmics: 3
39 Opioid antagonist: 2
40 Opioid replacement therapy: 1
41 Oral solution for GI tract opacification: 1
42 Phosphate binder: 1
43 Replacement therapy: 1
44 Sympathomimetic: 4
45 Vasoconstrictor: 1

66
Appendix D: Duration of Lifecycle Development (in Days) for Applications With (Y) or
Without (N) the Conduction of Clinical Trials by Types Delaying Regulatory Actions

67
Scholarly Life
Margaret VanHeusen was born in Albany, NY in 1991. She
received a B. A. in Psychology from Syracuse University in 2012, and
enrolled in the Krieger School of Arts and Sciences Advanced
Academic Program for Biotechnology in 2014. Her research surrounds
the entire drug development process. In 2015 she completed an
independent research project on Project Management in the
Pharmaceutical Industry. In the summer of 2016 Margaret was awarded
an ORISE Fellowship to work with the FDA’s Center for Drug
Evaluation and Research (CDER), on a project surrounding the
505(b)(2) New Drug Application. Additionally, she has over 2 years of
clinical research experience, and has been working in the clinical setting
for over 6 years.