alior bank sa
TRANSCRIPT

Alior Bank SA2019 Annual Financial Performance
Alior Bank S.A. | February 28th 2020 | Consolidated Group performance

2020 guidance
Credit risk
Financial performance
2
Agenda
Appendix
Operational performance
1 Key highlights
2
3
4
5
6

3
Key highlights

4
Key financial issues
Net profit in 2019 of PLN 253 M (vs. PLN 713 M in 2018). Bottomline under pressure due to ECJ
ruling regarding the reimbursement of costs in the event of early repayment of consumer loans
(PLN -306 M impact on the net result) and credit risk costs in the Agro segment (PLN -345 M
impact on the net result). ROE in 2019 at 3.8% (vs. 11.7% in 2018). Excluding the effect related to the
ECJ ruling, the ROE ratio at 8.4%.
TIER1 ratio at record high level (13.48%) with high TCR ratio (16.20%). Surplus over regulatory
minimums: TIER1 of 198 bps (PLN 980 M) and TCR of 270 bps .
NII increase by 3.1% y/y (7.5% excluding impact of the ECJ ruling). Increase from PLN 3,085 M
in 2018 to PLN 3,181 M in 2019. We consistently improve margins on strategic products.
Operating costs under control - a decrease in operating costs y/y by 4.4% to the level of PLN 1,630
M in 2019 (from PLN 1,705 M in 2018). The C/I ratio in 2019 at 43% (decrease of -0.1 p.p. compared
to 2018).
Significant increase in risk costs to PLN 1,437 M in 2019 (vs. PLN 1,048 M in 2018) caused by
a comprehensive review of business clients' exposures in AGRO segment (+ PLN 389 M of risk costs).
Further consistent improvement in cost of financing.
In Q4’19 COF at the level of 1.12% (vs. 1.20% in Q4’18). MTD COF in December 2019 at 1.08%.

5
2019 key achievements
Increase in the number of individual clients y/y by 117 T to the level of 4.15 M with
a dynamically growing number of new ROR with a systematic inflow of funds (increase by 65% y/y).
Dynamic increase in the number of clients in the Micro segment to over 192 T (vs. 159 T at the
end of 2018). The share of new business accounts opened in remote channels exceeded 40% in
4Q’19.
Sales of strategic products maintained at high level. Cash loan sales remain at the high level
of PLN 1.7 B in Q4'19 despite significant product changes (related to the ECJ ruling).
Increase in new sales of corporate loans to over PLN 1 B in 4Q’19 applying new risk policy.
Sales of current accounts/saving accounts and cash loans in remote channels in 4Q'19 increased
y/y by 56% and 5%, respectively. Dynamic increase in the number of mobile app users - 64%
increase y/y.
Progressive robotization (100 processes already robotized) and own acceleration program
support bank's development.
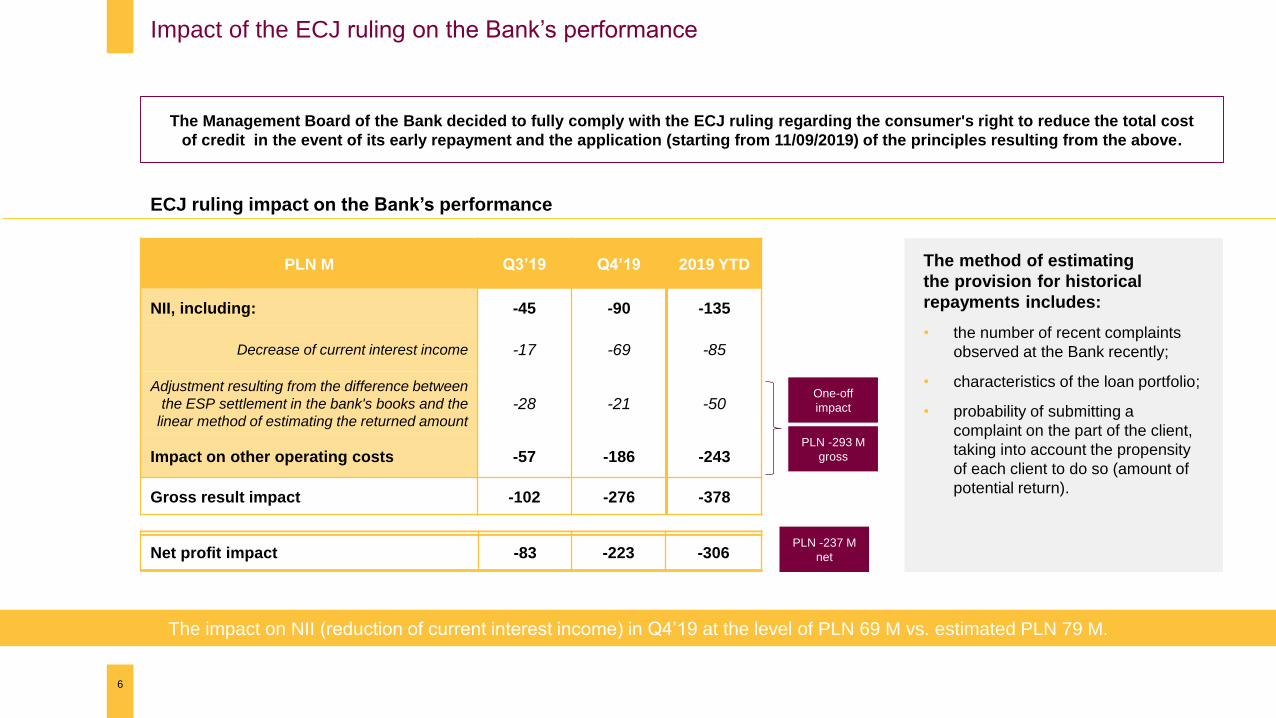
PLN M Q3’19 Q4’19 2019 YTD
NII, including: -45 -90 -135
Decrease of current interest income -17 -69 -85
Adjustment resulting from the difference between
the ESP settlement in the bank's books and the
linear method of estimating the returned amount-28 -21 -50
Impact on other operating costs -57 -186 -243
Gross result impact -102 -276 -378
6
Impact of the ECJ ruling on the Bank’s performance
The method of estimating
the provision for historical
repayments includes:
• the number of recent complaints
observed at the Bank recently;
• characteristics of the loan portfolio;
• probability of submitting a
complaint on the part of the client,
taking into account the propensity
of each client to do so (amount of
potential return).
The Management Board of the Bank decided to fully comply with the ECJ ruling regarding the consumer's right to reduce the total cost
of credit in the event of its early repayment and the application (starting from 11/09/2019) of the principles resulting from the above.
ECJ ruling impact on the Bank’s performance
The impact on NII (reduction of current interest income) in Q4’19 at the level of PLN 69 M vs. estimated PLN 79 M.
PLN -293 M
gross
PLN -237 M
net
One-off
impact
Net profit impact -83 -223 -306
7
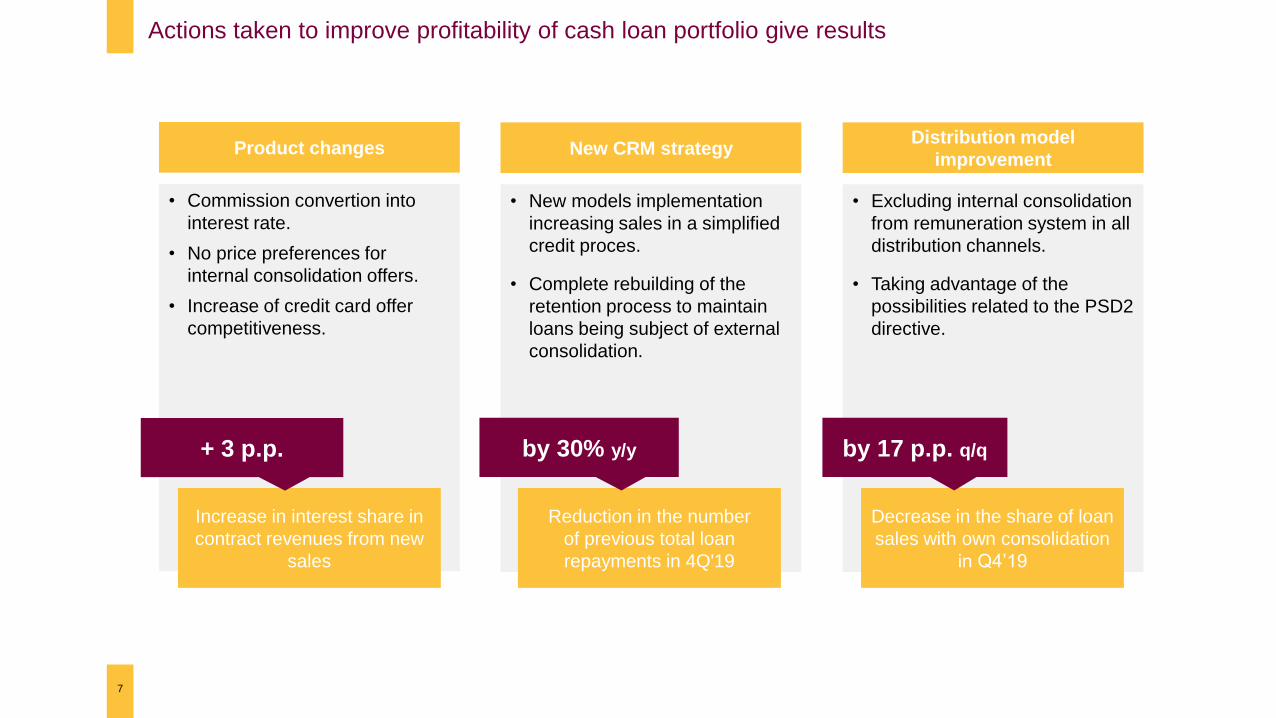
Actions taken to improve profitability of cash loan portfolio give results
Distribution model
improvementNew CRM strategyProduct changes
• Excluding internal consolidation
from remuneration system in all
distribution channels.
• Taking advantage of the
possibilities related to the PSD2
directive.
• New models implementation
increasing sales in a simplified
credit proces.
• Complete rebuilding of the
retention process to maintain
loans being subject of external
consolidation.
• Commission convertion into
interest rate.
• No price preferences for
internal consolidation offers.
• Increase of credit card offer
competitiveness.
Increase in interest share in
contract revenues from new
sales
Reduction in the number
of previous total loan
repayments in 4Q'19
Decrease in the share of loan
sales with own consolidation
in Q4’19
by 30% y/y by 17 p.p. q/q+ 3 p.p.

419 515
629
922
2018 2019
Koszty ryzyka KB
Koszty ryzyka KI
3 085 3 181
710 667161
-54
-378
2018 2019
wpływ wyroku TSUEdotyczącego zwrotu prowizji*
pozostałe przychody
wynik prowizyjny
wynik odsetkowy
713
253
306
2018 2019
rezerwa związanaz wyrokiem TSUE
wynik netto(-65%)
(-22%)
-154
559
-461
1 705 1 630
2018 2019
8
2019 financial results (PLN M)
Net result
General and administrative expenses Cost of risk
(-4.4%)
-75
Revenues
-
ECJ ruling impact
concerning fees
return*
Net result
ECJ ruling impact
concerning fees return*
Other revenues
NFC
NII
COR Business segment
COR Retail segment
*Impact of the ECJ ruling (PLN -378 M gross; PLN -306 M net)
-
(-4.1%)
3 9564 173
(+37%)
+389 1 437
1 048
3 794
+217
(+5.5%)
-161

3,82%
-4.63%
2018 2019
wpływ wyrokuTSUEdotyczącegozwrotu prowizji*
ECJ ruling impact
concerning fees
return*
1.85%2.39%
2018 2019
4.51%
-0.19%
2018 2019
wpływ wyrokuTSUE dotyczącegozwrotu prowizji**
39.1%
3.9%
wpływ wyrokuTSUE dotyczącegozwrotu prowizji*
2019 key financial ratios
9
- 0.1 p.p.
4.63%4.71%
43.1% 43.0%
-7.92 p.p.
11.74%
8.44%
+0.54 p.p.
- 0.12 p.p.
2018 2019
*impact of the ECJ ruling on commission (PLN -378 M gross; PLN - 306 M net)
**impact of the ECJ ruling on NII in 2019 (PLN -135 M gross)
NIM ratio ROE ratio
C/I ratio COR ratio
ECJ ruling impact
concerning fees return*
ECJ ruling impact
ECJ ruling impact
ECJ ruling impact
concerning fees return*

0.63 0.66
0.53
0.43
I kw.'19 II kw.'19 III kw.'19 IV kw.'19
0.38
0.460.49 0.49
I kw.'19 II kw.'19 III kw.'19 IV kw.'19
10
Development of loan volumes in strategic segments (PLN B)(managerial approach)
New micro sales New mortgage loans sales New cash loans sales
...with the growing sales
of mortgage loans...
…and a high level
of cash loan sales…
A decrease in new sales in the
micro segment due to the loan
policy tightening...
0.83
0.68
0.570.61
I kw.'19 II kw.'19 III kw.'19 IV kw.'19
2.03 2.01 2.06
1.73
I kw.'19 II kw.'19 III kw.'19 IV kw.'19
New leasing sales
…as well as leasing sales.
Q1’19 Q2’19 Q3’19 Q4’19 Q1’19 Q2’19 Q3’19 Q4’19 Q1’19 Q2’19 Q3’19 Q4’19 Q1’19 Q2’19 Q3’19 Q4’19

11
We have opened the first branch in a modern format
We plan to open 30 such modern branches in 2020.
The new branch
• The concept of the branch was created in response
to the changing needs of clients as a place
of professional financial consulting.
• Comfortable, sound-proofed rooms provide greater
discretion during finance talks.
• A space of new experiences and education in which
the client can learn about the possibilities of online
and mobile banking.
• A comfortable place for bankers - every room
equipped in all tools needed to perform daily duties.
• A new dimension of ecology - lighting that adapts to
the time of day, recycled materials, products from
local suppliers, filtered water, biodegradable coffee
cups.

11.29%
12.81%
13.48%
10.25%
11.13%11.50%
Współczynnik Tier 1 Tier 1 ratio minimum KNF
13.65%
15.85%16.20%
13.25%
13.13%13.50%
Łączny współczynnik kapitałowy TCR minimum KNF
12
TIER1 ratio at record high level
The level of Tier1 and TCR capital ratios at the end of 2019 leaves the buffer
above regulatory minimums at 198 bps (PLN 980 M) and 270 bps (PLN 1,300 M), respectively.
TIER1 TCR
Tier1 ratio Tier1 ratio PFSA minimum TCR ratio PFSA minimumTCR
198 pbs 270 pbs
Q4’16 Q1’17 Q2’17 Q3’17 Q4’17 Q1’18 Q2’18 Q3’18 Q4’18 Q1’19 Q2’19 Q3’19 Q4’19Q4’16 Q1’17 Q2’17 Q3’17 Q4’17 Q1’18 Q2’18 Q3’18 Q4’18 Q1’19 Q2’19 Q3’19 Q4’19

13
The most important awards and prizes received in 2019
• First place in two categories: "Mobile banking" and „Online banking" in the "Newsweek
Friendly Bank" ranking.
• Second place in traditional banking and third in the 'Mortgage Banking' category
in the "Newsweek Friendly Bank" ranking.
Products & customer service
Business
• First place in the "Company Friendly Bank" ranking organized by the prestigious
business magazine "Forbes".
• The best bank in financing for companies in the "Institution of the Year 2019" ranking.
• The best quality of business client service, the best quality of service in the branch
and the best helpline in the industry ranking "Institution of the Year 2018".
Innovation & technology
• The "Smartphonisation" project with the first place in the "Workforce experience" category
of the EFMA-ACCENTURE competition "Customer Insights and Growth Banking".
• Alior’s R&D department with the "Top Institutional Innovator of the Year" title awarded
by CEE Capital Markets X-Tech Awards.
• RBL_Innovation by Alior Bank among the 25 best innovation laboratories in the world
of finance according to the Global Finance magazine.
• Bancovo.pl with the "Product Innovation of the Year" title awarded as part of the Retail
Banker competition.

14
Operational performance

6.2 7.2 6.9 7.0 7.8 7.4
III kw. 2018 IV kw. 2018 I kw. 2019 II kw. 2019 III kw. 2019 IV kw. 2019
9.3 10.8 9.8 11.9 13.3 12.4
III kw. 2018 IV kw. 2018 I kw. 2019 II kw. 2019 III kw. 2019 IV kw. 2019
26.4 29.5 32.3 30.0 30.7 27.8
III kw. 2018 IV kw. 2018 I kw. 2019 II kw. 2019 III kw. 2019 IV kw. 2019
3.81
4.03
4.15
2017 2018 2019
15
Retail segment: An increase in the number of clients
New clients opening current accounts (T)Number of retail clients (M)
New clients – cash loans (T)
New retail clients from Consumer Finance segment (T)*An increase in the number of clients by 117 T y/y
(including new clients from SKOK Jaworzno).
RETAIL
SEGMENT
+117 T
*Clients who financed the purchase with Alior Bank installment loan max. 36 months
earlier, and in a given quarter they acquired another Bank product for the first time.
Q3’18 Q4’18 Q1’19 Q2’19 Q3’19 Q4’19
Q3’18 Q4’18 Q1’19 Q2’19 Q3’19 Q4’19
Q3’18 Q4’18 Q1’19 Q2’19 Q3’19 Q4’19
-6%
+15%
+4%

16
Building a lasting relationship
• An increase of 61% in the number of accounts with transactions.
• An increase of 65% in the number of accounts with systematic inflows.
14.1 15.4 16.0 17.5 18.824.9
II kw. 2018 III kw. 2018 IV kw. 2018 I kw. 2019 II kw. 2019 III kw. 2019
11.3 12.6 14.5 15.7 16.120.8
II kw. 2018 III kw. 2018 IV kw. 2018 I kw. 2019 II kw. 2019 III kw. 2019
17.821.7 22.2 24.2
27.0 28.3
II kw. 2018 III kw. 2018 IV kw. 2018 I kw. 2019 II kw. 2019 III kw. 2019*
+30%
+61%
+65%
113
142
175
2017 2018 2019
+33 T
Current accounts sales (T)(number of new current accounts for New to Bank and New to Product clients)
Number of new current accounts with regular inflows*** (T)
Number of new current accounts with transactions** (T)
Number of new priority clients (T)
*Clients acquired in Q3’19 according to the segment notice at the end of Q4’19
**Min. 3 transactions excluding transfers - 3 months after opening the current account
***2 months with receipts of at least PLN 1,000 - 3 months after opening the current account
RETAIL
SEGMENT
Q2’18 Q3’18 Q4’18 Q1’19 Q2’19 Q3’19*
Q2’18 Q3’18 Q4’18 Q1’19 Q2’19 Q3’19*
Q2’18 Q3’18 Q4’18 Q1’19 Q2’19 Q3’19

17
The growing importance of digital channels
16.218.6 19.0
15.9
23.4
29.1
III kw. 2018 IV kw. 2018 I kw. 2019 II kw. 2019 III kw. 2019 IV kw. 2019
277320
361 362 387337
III kw. 2018 IV kw. 2018 I kw. 2019 II kw. 2019 III kw. 2019 IV kw. 2019
+5%
+56%
247278
315357
398456
III kw. 2018 IV kw. 2018 I kw. 2019 II kw. 2019 III kw. 2019 IV kw. 2019
+64%
AppStore rating 4.6out of 5
GooglePlay rating 4.3out of 5
• An 64% y/y increase in the number of clients using the AB mobile app.
• Stable level of mobile app user ratings in the AppStore and GooglePlay.
• An increase of 5% y/y in cash loan sales in remote channels.
• An increase of 56% y/y in current accounts sales and online savings
accounts.
Sales of cash loan in remote channels (PLN M)
Online sales of current and saving accounts (T)
Alior Bank Mobile Application users (T)
RETAIL
SEGMENT
Q3’18 Q4’18 Q1’19 Q2’19 Q3’19 Q4’19
Q3’18 Q4’18 Q1’19 Q2’19 Q3’19 Q4’19
Q3’18 Q4’18 Q1’19 Q2’19 Q3’19 Q4’19

75% 79%85%
2017 2018 2019
53%60%
64%
2017 2018 2019
18
Significant growth of clients’ satisfaction
24 pktNPS increase from 2017
NPS own branches
NPS franchise branches Alior is a quality leader in customer service
A secure connection
from mobile banking
WiFi in all branches
Simplifying communication
iKiosks - we transfer
clients to the digital world
SMS communication:
relational and informational
notifications based on events
Unblocking online banking
from www
Changing card PIN
in remote channels
NPS Alior Bank
+16 points2018, y/y
+8 points2019, y/y
Alior Bank among the top banks with the highest increase
in 2017-2019 in the ARC Monitor Satisfaction 2019 study
RETAIL
SEGMENT

Q4'19: Development of remote channels
19
PayU Cash on otomoto.pl -
quick vehicle financing.
Increasing safety and comfort
of online processes by
automatically encrypting the set
of documents sent to the client.
Quick internal consolidation
process available in Alior
Online and Alior Mobile.Possibility to update personal
data in Alior Mobile and Alior
Online.Client satisfaction survey
after a quick cash process
launched in Alior Mobile or
Alior Online.
Promotional offer for
employees of companies
that joined the PPK
offered by PZU.
Implementation of Fitbit Pay
and Garmin Pay payments.
Higher interest rate on the
Mega Savings Account for
clients with regular income
on the current account.
Self unlocking access to Alior
Online and Alior Mobile
banking.
Implementation of PUSH
functionality at Alior Mobile.
Q4'19: Convenient banking
Development of remote channels and convenient bankingRETAIL
SEGMENT

16.921.1
30.5
2017 2018 2019
+45%
48%57% 54% 52% 53% 53%
59% 62%
1 kw. '18 2 kw. '18 3 kw. '18 4 kw. '18 1 kw. '19 2 kw. '19 3 kw. '19 4 kw. '19
50.0 50.2 50.6 52.4 53.9 54.3 55.9 61.9
1 kw. '18 2 kw. '18 3 kw. '18 4 kw. '18 1 kw. '19 2 kw. '19 3 kw. '19 4 kw. '19
5.6 4.7 5.1 7.1 8.4 7.5 7.910.9
1 kw. '18 2 kw. '18 3 kw. '18 4 kw. '18 1 kw. '19 2 kw. '19 3 kw. '19 4 kw. '19
20
Micro segment: Increase in the number of clients and improvement of relationality
New Micro business clients (T)
Number of clients paying ZUS/US (T)
Share of new Micro accounts with a debit card (%)
MIKROMICRO
SEGMENT
Opening of Micro current accounts (T)
• Dynamic increase in the number of Micro account openings up to
30.5 T in 2019, mainly supported by 53% y/y growth in new clients.
• In 4Q’19 a visible increase of 10 p.p. the number of new accounts
with a debit card.
Q1’18 Q2’18 Q3’18 Q4’18 Q1’19 Q2’19 Q3’19 Q4’19
Q1’18 Q2’18 Q3’18 Q4’18 Q1’19 Q2’19 Q3’19 Q4’19
Q1’18 Q2’18 Q3’18 Q4’18 Q1’19 Q2’19 Q3’19 Q4’19
134.9 159.0192.2
2017 2018 2019
+21%
Number of Micro business clients (T)
+53%
+10 p.p.
+18%

0.9 1.1 1.31.6
2.0
2.7
3 kw. '18 4 kw. '18 1 kw. '19 2 kw. '19 3 kw. '19 4 kw. '19
1.6 1.6 1.5 1.52.1
4.4
3 kw. '18 4 kw. '18 1 kw. '19 2 kw. '19 3 kw. '19 4 kw. '19
1.0 0.9 1.01.6 1.3 1.3
2.6
4.7
18.7% 17.5%19.3%
27.2%
22.7% 23.0%
35.2%
40.3%
0,0%
5,0%
10,0%
15,0%
20,0%
25,0%
30,0%
35,0%
40,0%
45,0%
1 kw.'18 2 kw.'18 3 kw.'18 4 kw.'18 1 kw.'19 2 kw.'19 3 kw.'19 4 kw.'19
0
1 000
2 000
3 000
4 000
5 000
6 000
21
Increased efficiency due to significant online client acquisition
Share of online acquisitions in new clients+180%
• The share of new business accounts opened in remote channels
exceeded 40% in Q4’19.
• An increase in sales of Micro business accounts is the effect of
simplifying the product offer (focus on 2 products - iKonto Biznes
Account and 4x4 Account), synchronized marketing activities and
intensive development of online acquisition processes.
Micro clients acquired through the website www.zafirmowani.pl(numer fo new clients in T items)
Q1’18 Q2’18 Q3’18 Q4’18 Q1’19 Q2’19 Q3’19 Q4’19
New Micro clients acquired online(new accounts in items; % of openings online)
Sales of 4x4 accounts in the Micro segment (number of new accounts in T items)
MICRO
SEGMENT
Q3’18 Q4’18 Q1’19 Q2’19 Q3’19 Q4’19
Q3’18 Q4’18 Q1’19 Q2’19 Q3’19 Q4’19

88%92% 92% 93%
1 kw. '19 2 kw. '19 3 kw. '19 4 kw. '19
22
An increase in the quality of new sales
• Increase in new sales guarantee coverage to the level of 93% in Q4’19.
• Updated credit policy and implementation of a new credit system led to increase in the quality of new sales.
• High guarantee level will have a positive impact on COR, RWA and capital ratios.
New Micro sales coverage with BGK guaranteesShare of the portfolio with BGK guarantees
in the total Micro portfolio
MICRO
SEGMENT
45%
49%
52%54%
1 kw. '19 2 kw. '19 3 kw. '19 4 kw. '19Q1’19 Q2’19 Q3’19 Q4’19 I kw.’19 II kw.’19 III kw.’19 IV kw.’19 Q1’19 Q2’19 Q3’19 Q4’19

Automatic opening process of iKonto
Biznes Account and 4x4 Account in
Alior Online.
Possibility of registering a Trusted
Profile in Alior Online and signing
public administration applications with
a Trusted Profile.
Ensuring compliance with applicable
regulations regarding operation of the Split
Payment Mechanism, tax micro-account
(Witraż) and the White List of VAT Taxpayers.
Possibility of processing financing through
a new automatic credit system available
in own network and franchise branches.
Increasing the financing amount to PLN 1 M, while
reducing the waiting time for a credit decision to 20
minutes. Funds are transferred to the company's
account within 24 hours after signing the contract.
23
The most important implementations of 2019MICRO
SEGMENT
In the Business Financial Package, under
one decision, the entrepreneur receives as
many as five forms of financing to choose
from, including leasing and factoring.

35.433.8 32.4
2017 2018 2019
368292
256297
352 379
279335
24
Business segment: Transformation of the business client base into more active and lasting relationships
+13%
171 185 198267 280
509677
837
1 kw. '18 2 kw. '18 3 kw. '18 4 kw. '18 1 kw. '19 2 kw. '19 3 kw. '19
914891
872897
953980 978
960
1 kw. '18 2 kw. '18 3 kw. '18 4 kw. '18 1 kw. '19 2 kw. '19 3 kw. '19
+7 %
+213%
I kw.’18 II kw.’18 III kw.’18 IV kw.’18 I kw.’19 II kw.’19 III kw.’19 IV kw.’19
I kw.’18 II kw.’18 III kw.’18 IV kw.’18 I kw.’19 II kw.’19 III kw.’19 IV kw.’19
I kw.’18 II kw.’18 III kw.’18 IV kw.’18 I kw.’19 II kw.’19 III kw.’19 IV kw.’19*Business clients including Alior Leasing clients
**Integration of the BusinessPro system with clients systems
BankConnect clients**
Clients actively using payroll accounts
Business clients Small/Medium/Large*(number of business clients in T) New business clients
+7%
BUSINESS
SEGMENT
Q1’18 Q2’18 Q3’18 Q4’18 Q1’19 Q2’19 Q3’19 Q4’19
Q1’18 Q2’18 Q3’18 Q4’18 Q1’19 Q2’19 Q3’19 Q4’19
Q1’18 Q2’18 Q3’18 Q4’18 Q1’19 Q2’19 Q3’19 Q4’19
• In 2019, the number of business clients dropped by 4% y/y.
• Growth of new acquisitions with focus on building main
relationship with clients.
-1.4 T
25
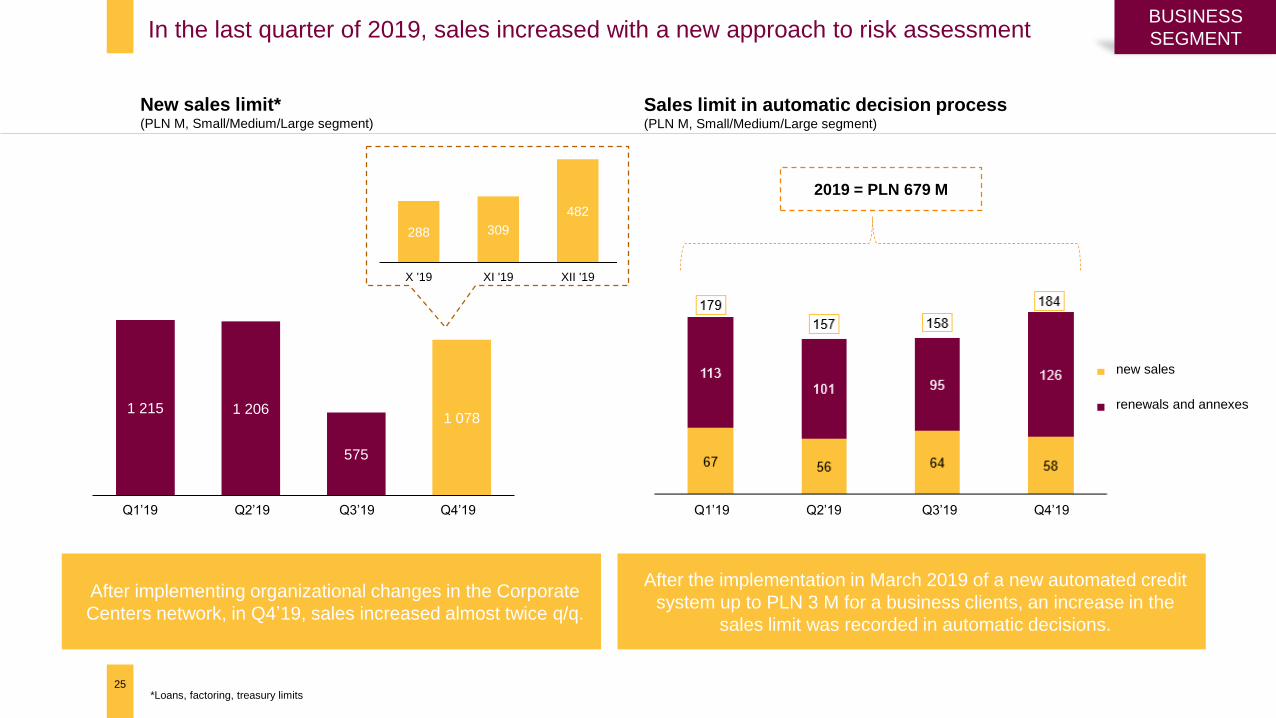
In the last quarter of 2019, sales increased with a new approach to risk assessment
1 215 1 206
575
1 078
I kw. '19 II kw. '19 III kw. '19 IV kw. '19
After implementing organizational changes in the Corporate
Centers network, in Q4’19, sales increased almost twice q/q.
288 309
482
X '19 XI '19 XII '19
2019 = PLN 679 M
After the implementation in March 2019 of a new automated credit
system up to PLN 3 M for a business clients, an increase in the
sales limit was recorded in automatic decisions.
New sales limit*(PLN M, Small/Medium/Large segment)
Sales limit in automatic decision process(PLN M, Small/Medium/Large segment)
BUSINESS
SEGMENT
Q1’19 Q2’19 Q3’19 Q4’19 Q1’19 Q2’19 Q3’19 Q4’19
new sales
renewals and annexes
*Loans, factoring, treasury limits

26
Project successes in the area of transactional products in 2019
26
Virtual Payment Cards for Companies
• One of the first virtual multi-currency card in the world in offer
• On sale from July 2019
• Nomination in the e-COMMERCE POLSKA awards 2019 competition
• Available for clients from December 2019
• The widest range of mobile payments in Alior Bank’s offer for
business clients - Apple Pay, Google Pay, Garmin Pay and Fitbit Pay
• The offer includes virtual debit, credit and multi-currency cards
supporting 23 currencies
• Data confidentiality and a high level of payment security on the Internet
• Access to unique reports in the Mastercard Smart Data service
Smartphone payments with the Garmin Pay and Fitbit Pay
BUSINESS
SEGMENT

We are developing an offer related to EU and public funds in cooperation with BGK
The widest EU funds product offer on the market
27
Since the beginning of the program, we have
granted over 15,000 COSME guarantees -
Sales Leader award from BGK
2nd place in the sale of this guarantee
among 10 banks offering the product
Support for nearly 27 institutions
in the implementation of
Thermomodernization projects
The largest granted volume of the
Agricultural guarantee on the market
ELENA subsidy - allowing investors to get a reimbursement of 90% of the cost of energy audit costs
of technical documentation necessary to obtain a Thermal Modernization Loan. Alior Bank may also
finance the costs of employee remuneration and product promotion.
The first bank in Poland to implement
and grant loans with a Creative
Guarantee
3rd place in the sale of de minimis
guarantees in Poland
BUSINESS
SEGMENT

28
Alior Bank has a successful track record of process automation and robotization
Robot Factory
100 "robotic"
processes
Every quarter, we
improve and
implement a minimum
of 10 new processes
We implement
technologies for partial
automation (RDA) as well
as automation that
does not require
human intervention
(RPA)
Combining technologies
for the comprehensive
automation of business
processes, including:
• 2 robotization platforms
• OCR (text recognition
software)
• tools that allow to build
applications visually
Integration of the
robotization
environment with
the AI platform
Building our own internal
domain of robotic
services - we enable
other systems to call
robots from the catalog
of available services
A strategy for intelligent process automation
INNOVATION

29
2019 acceleration program outcome INNOVATION
The second edition (2019)
FinTechs Partners
Projects outcome
Launching pilot or implementation
projects with 7 program participantsPilot cooperation with 2 program participants
Another successful investment in 2019
• Together with 2 other banks and 2 venture capital funds, Alior Bank has invested in Autenti - an entity
offering a platform for the electronic signing of contracts and digital document circulation.
• In 2019, the bank also continued its investment in PayPo - a Polish fintech offering deferred payments
for online purchases.

30
Financial performance

31
P&L statement – primary data
PLN M 2019 2018 Change y/y Chane y/y (%)
Revenues, including: 3 794 3 956 -161 -4%
Revenue excluding the impact of the ECJ ruling* 4 173 3 956 217 5%
Net interest income 3 181 3 085 97 3%
Net fee and commission income 667 710 -43 -6%
Net trading income and other -54 161 -215 -133%
General administrative expenses,
including:-1 630 -1 705 75 -4%
BGF cost -157 -106 -50 47%
Net expected credit losses, impairment charges and
write-downs, including:-1 443 -1 054 -389 37%
Net expected credit losses, impairment charges
and write-downs excl. AGRO segment**-1 054 -1 054 0 0%
Banking tax -226 -208 -18 9%
Profit before tax 495 988 -493 -50%
Income tax -242 -275 32 -12%
Net profit 253 713 -461 -65%
*Total impact of the ECJ ruling on revenues (PLN -378 M gross)
**Write-offs for the Agro segment (PLN 389 M gross)

0.6 0.6 0.6 0.8 0.6 0.8 1.1 1.40.8 0.9
0.50.8
0.8 0.7
-1.4
I kw.'18 II kw.'18 III kw.'18 IV kw.'18 I kw.'19 II kw.'19 III kw.'19 IV kw.'19
Segment biznesowy
Segment detaliczny
1.51.0
1.61.3 1.5
1.1 0.01.4
32
Volumes
PLN M 2019 2018 Change y/y Change y/y (%)
Loans, including: 55 871 54 246 1 625 3%
Retail segment 31 869 29 443 2 426 8%
Business segment 24 002 24 803 -801 -3%
Deposits, including: 64 999 62 436 2 564 4%
Retail segment 46 603 43 945 2 658 6%
Business segment 18 396 18 491 -95 -1%
L/D ratio 85.96% 86.88% -0.93 p.p.
Increase in gross loans volume in 2019 at the level of PLN 3.9 B.
Increase in gross loan volume (PLN B)
*
Business segment
Retail segment
*Decrease in Q4'19 in the business segment is a consequence of the portfolio review.
Q1’18 Q2’18 Q3’18 Q4’18 Q1’19 Q2’19 Q3’19 Q4’19

-872 -878
3 521 3 620
435 439
3 085 3 181
33
Net interest income (PLN M)
3 956 4 059+103
+2.6%
y/y comparison
*Annualized incremental approach (YTD)
**Quarterly COF (QTD)
-210 -228 -214 -219 -216 -217 -226 -218
843 872 891 914 917 940 912 851
104 119 105 106 103 106 116113
738 763 783 801 804 828 802747
I kw.'18 II kw.'18 III kw.'18 IV kw.'18 I kw.'19 II kw.'19 III kw.'19 IV kw.'19
Pozostałe przychodyodsetkowe
Przychody odsetkowezwiązane z kredytami
Koszty odsetkowe
Wynik odsetkowy
COF**1.17% 1.14%
NIM* 4.70% 4.62%
1.20%
4.70%
NII quarterly
1 0291 0461 020
1.08%
MTD COF
Dec 2019:
1 074 excluding the effect
of the ECJ ruling
1 055excluding the effect
of the ECJ ruling
1.12%
4.51%
4 194excluding the effect
of the ECJ ruling
9651 020996992948
Pożyczkagotówkowa
Kredyty hipoteczne Mikro
+ 0.49 p.p+ 0.37 p.p
+ 1.17 p.p
2018 2019
Increase in interest margin for 2019 new
sales vs. portfolio at the end of 2018
Cash loans Mortgage loans Micro
Q1’19 Q2’19 Q3’19 Q4’19
Interest expenses
Net interest income
Other interest income
Interest income
related to loans
Q1’18 Q2’18 Q3’18 Q4’18 Q1’19 Q2’19 Q3’19 Q4’19

-44 -44 -60 -42 -50-78 -83 -74
-44 -50-45 -60 -47
-50 -49 -68
167 168 178 179 171 178 187 186
20 1917 9
7 65 6
57 62 66 7065
7986 89
21 1523 29
2423
26 27
177 171 179 184170
159173 165
-200
-100
0
100
200
300
400
-200
-150
-100
-50
0
50
100
150
200
250
300
350
I kw.'18 II kw.'18 III kw.'18 IV kw.'18 I kw.'19 II kw.'19 III kw.'19 IV kw.'19
Wynagrodzenie z tyt. pośrednictwasprzedaży ubezpieczeń
Obsługa kart płatniczych i kredytowych
Prowizje maklerskie
Prowizje związane z kredytami, rachunkami,przelewami, wpłatami, wypłatami,pożyczkami i transakcjami FX
Pozostałe koszty prowizyjne
Koszty prowizyjne związane z kartami
Wynik prowizyjny
691 722
66 24
254 320
88100
-190-286
-199
-213
2018 2019
710667
34
Net fee and commission (PLN M)
1 0991 166
-43.4
(-6.1%)
267286
305283 287
-97
-127 -132-103
-389-499
-105
Proforma data for comparability, taking into
account the change described on slide 57.
-94-87
-142
264 265
308
y/y comparison NFC quarterly
Payment cards and credit
cards service
Brokerage commissions
Remuneration for insurance
brokerage
Fees related to loans, accounts,
transfers, FX transactions etc.
Net fee and commission
Fees cost related to cards
Other fees cost
Q1’18 Q2’18 Q3’18 Q4’18 Q1’19 Q2’19 Q3’19 Q4’19
896781
528
445
175
248
106157
2018 2019
Koszty BFG
Amortyzacja
Koszty rzeczowe
Koszty pracownicze
240 234 217 206 224 215 193149
118 136133 141 107 105
106126
4343
45 44 59 6261
66
55 1717 17
122
1212
12
I kw.'18 II kw.'18 III kw.'18 IV kw.'18 I kw.'19 II kw.'19 III kw.'19 IV kw.'19
35
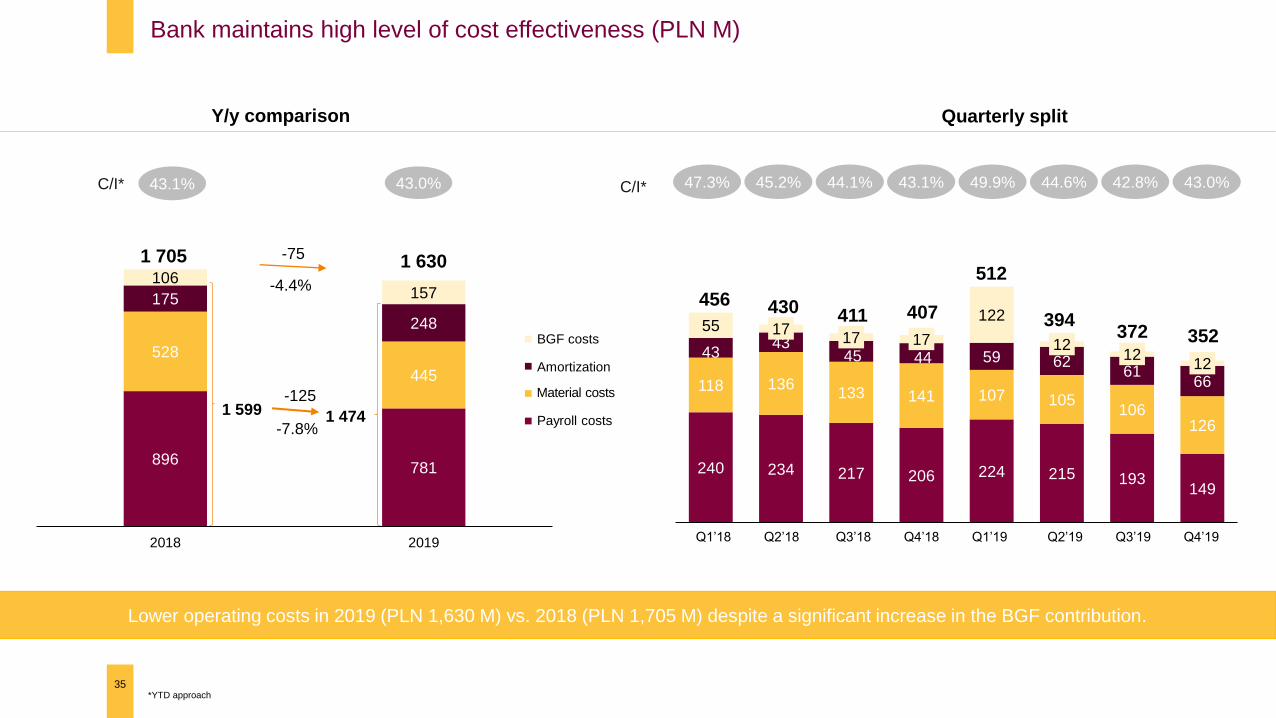
Bank maintains high level of cost effectiveness (PLN M)
512
394372
411 407
Lower operating costs in 2019 (PLN 1,630 M) vs. 2018 (PLN 1,705 M) despite a significant increase in the BGF contribution.
49.9%43.1%44.1% 42.8%44.6%C/I*
*YTD approach
1 705 1 630-75
-4.4%
C/I* 43.1% 43.0%
1 599 1 474-7.8%
-125
352
430456
45.2%47.3% 43.0%
Y/y comparison Quarterly split
Amortization
BGF costs
Material costs
Payroll costs
Q1’18 Q2’18 Q3’18 Q4’18 Q1’19 Q2’19 Q3’19 Q4’19

36
Credit risk

18 948 20 297
10 491 11 402
2 609 2 820
31.12.2018 31.12.2019
Kredyty consumer finance
Kredyty na nieruchomości mieszkaniowe
Kredyty konsumpcyjne
33%
8%
33%
8%
59%32 048 34 519
26 869 26 801
31.12.2018 31.12.2019
Segment detaliczny Segment biznesowy
37
Structure and quality of the loan portfolio
46%
58 91761 320 32 048
34 519
54%
44%
56% 59%
8.71% 8.23%
14.00%
19.50%
14.25%
17.70%
2018 2019
Segment Klienta Indywidualnego
Segment Klienta Biznesowego
Segment Klienta Biznesowego bez AGRO
65.31% 67.22%
44.78% 45.49%
43.96% 43.09%
2018 2019
Segment Klienta Indywidualnego
Segment Klienta Biznesowego
Segment Klienta Biznesowego bez AGRO
5 751 6 223
3 318 2 977
3 687 3 186
6 885 6 764
989 743
4 025 4 888
2 215 2 019
31.12.2018 31.12.2019
Mikro Małe Średnie Duże OZE Alior Leasing AGRO
26 869
18%
3%
25%
12%
11%
23%
26 801
1.35% 1.55%
2.45%
3.43%
2.46%
2.17%
2018 2019Segment Klienta Indywidualnego
Segment Klienta Biznesowego
Segment Klienta Biznesowego bez AGRO
8%
15%
4%
26%
14%
12%
21%
8%
Total loan portfolio (PLN M) Retail client portfolio (PLN M) Business client portfolio* (PLN M)
NPL ratio (%) Coverage ratio (%) Cost of risk ratio (%)*
Retail segment Business segment
Consumer finance loans
Mortgage loans
Consumer loans
Micro Small Medium Large
Retail segment
Business segment
Business segment excl. Agro
Retail segment
Business segment
Business segment excl. Agro
Retail segment
Business segment
Business segment excl. Agro
*Managerial approach

38
Process improvements and risk assessment policies for business segment implemented in 2019
Exposure limits and the level
of acceptable risk
• Tightening cut-off policy for Micro, Small, Midium, Large segments in the business client segment, including Agro
• Lowering the concentration limits on the debtor and the joint risk group
• Introduction of a grid of total and unsecured limits depending on the rating level
Credit analysis and credit
competences
• Structure clients analysis results and transaction as well as standardization of assessment parameters
• Adjusting the structure and limits of credit competences
• Implementation of FAST TRACK - optimization of the process of approving low-risk exposures
Collaterals• Reduction of recovery rates for selected security groups
• Sealing and updating of security monitoring rules
Industry strategy
• Launching in Q2'19 a team of Top Analysts dedicated to assess the risk of the largest clients, including
syndicated loans and structured transactions
• Development of industry and sector competences of Bankers and credit analysts as well as implementation
of sectoral credit strategies under the direction of a dedicated Sector Analysis Team
• Selection of preferred industries and operationalization of credit policy towards preferred industries
Client monitoring
• Implementation of automated EWS signals based on transactional and behavioral data
• Standardization of the results of periodic review and automation of selected processes
• Faster risk identification and more effective implementation of monitoring recommendations
• CRM campaigns for the best clients based on the positive results of periodic monitoring (from Q4'19)
Credit process
• Verification of efficiency parameters and update of bonus system
• Implementation of dedicated assessment and acceptance paths (differentiated in relation to the amount
of exposure and risk profile)
• Automation of reporting processes in the field of quality and effectiveness of the credit process
Internal control system
• Establishment of a central unit to perform the vertical control function in the area of credit risk
• Implementation of the new system control formula of the second degree (automatic and database control rules),
generating a set of alerts and expanding the catalog of transactions directed for individual verification
• Update of bonus systems of Bankers and Credit Analysts

4.2%
0.8%
3.4%
2.2%
-1,00%
0,00%
1,00%
2,00%
3,00%
4,00%
5,00%
6,00%
7,00%
IV kw'18 I kw'19 II kw'19 III kw'19 IV kw'19
Duże Duże bez AGRO KB razem KB razem bez AGRO
3.43%
1.58%
1.27%
0.59%
COR [%] - baza Efekty przeglądu ireklasyfikacji portfela Agro
Aktualizacja polityki wycenyzabezpieczeń oraz wynikprzeglądu zabezpieczeń
portfela KB
COR [%] - wynik
39
Business client risk costs influenced by higher write-offs for the Agro segment
Temporary increase in COR in the business client segment is primarily due to the results
of an in-depth portfolio review and collateral for the Agro industry (PLN +389 M of risk costs).
COR in business client segment COR decomposition in 2019 in business client segment
Large Large excl.
Agro
COR (%) – base COR (%) – resultThe effect of reviewing
the reclassification of the
Agro portfolio
Update of collateral
assessment policy and
results of collateral review
in Business segment
Q4’18 Q1’19 Q2’19 Q3’19 Q4’19
Business
segment
total
Business
segment total
excl. Agro

40
Very good quality of new sales in the business client segment
Portfolio diversification
• Only 3% of new sales was dedicated to major clients (TOP 10 largest groups)
• Lower share of the construction sector and commercial real estate by 5 p.p. (compared to 2018)
• Decrease in average transaction amount by 19% y/y (increase in amount diversification)
• Over 20% quality improvement in new transactions of large enterprises as a result
of changes in lending policy and acquiring better clients (PD parameter - probability of default)
• Dynamic improvement in the quality of new Micro sales – 6M default rate decreased
by 74% from 2017
• Increase in the business client segment coverage by 9 p.p. (y/y) (economic value of collateral)
• New Micro loans coverage increase by 27 p.p (y/y) to the level of 92%
Portfolio quality
Collateral
New sales in the business client segment 2019

41
Increasing diversification of the business client portfolio reduces the bank's sensitivity to unexpected credit losses.
-
New sales in the business client segment
Share of the top 10 common risk groups with no indications
of impairment in the regular portfolio of a business client
Average loan amount for new sale in business client segment
Micro and Small segment (PLN M)
Increasing diversification of the business client segment portfolio
24%
12%
16%17%
3%
28%20%
10%
15%24%
7%
24%MIKRO
SE
MID
LARGE
AGRO
Alior Leasing
13.2%
86.8%
10 największychgrup wspólnegoryzyka
pozostałe KB
10.9%
89.1%
0.21
0.14 0.14
2017 2018 2019
9.628.32
7.37
2017 2018 2019
Average loan amount for new sale in business client segment
Medium and Large segment (PLN M)
10 largest group
of a common risk
business segment
- other
Micro
Small
Medium
Large
AGRO
Alior Leasing
2018 2019
2018 2019

461 567 559
751
892 764
651 724
835 813 694 700
760 799
1.28%0.94% 0.98% 1.12% 1.29%
0.92%0.56% 0.69% 0.55% 0.44% 0.60%
0.25%0.39% 0.33%
0,0%
1,0%
2,0%
3,0%
4,0%
5,0%
6,0%
7,0%
8,0%
0
500
1 000
1 500
2 000
2 500
42
Constant improvement in the quality of new loan sales
*New limits + renewals and increase of existing ones
Sales volume and quality of new cash loan sales (PLN M)
Sales volume* and quality in the micro business client segment (PLN M)
Loan quality in strategic segments (cash loan and micro) has been systematically improving for the past 3 years.
In 2019 this trend was continued by optimizing risk management at every stage of the credit process.
Kwota udzielonych kredytów
DR MOB6 (po 6 mies.
od udzielenia)
Kwota udzielonych kredytów
DR MOB6 (po 6 mies.
od udzielenia)
Q1’16 Q2’16 Q3’16 Q4’16 Q1’17 Q2’17 Q3’17 Q4’17 Q1’18 Q2’18 Q3’18 Q4’18 Q1’19 Q2’19
Amount of granted credits
Default rate MOB6
Amount of granted credits
Default rate MOB6
Q1’16 Q2’16 Q3’16 Q4’16 Q1’17 Q2’17 Q3’17 Q4’17 Q1’18 Q2’18 Q3’18 Q4’18 Q1’19 Q2’19
1 262 1 242 1 269
1 722 1 654 1 755 1 745 1 623 1 707 1 807 1 766 1 942 2 025 2 009
1.91%1.54% 1.31%
1.06% 1.06%0.56% 0.73% 0.60% 0.65% 0.52% 0.52% 0.42% 0.50% 0.47%
0,0%
1,0%
2,0%
3,0%
4,0%
5,0%
0
500
1 000
1 500
2 000
2 500

• Stable LCR level well above the adopted supervisory
limit with the lowest volatility in relation to the market.
• Stable increase in the current account balance of retail
clients with a decrease in the cost of financing in 2019.
• Deposits concentration decrease.
43
Stable and adequate liquidity position
*Average quarterly LCR volatility according to the data between 12.2017 – 09.2019
25%
19%
10%
10%
10%
9%
8%
4%
Bank 1
Bank 2
Bank 3
Bank 4
Bank 5
Bank 6
Bank 7
Alior Bank
Deposit balances (PLN B)LCR ratio
LCR volatility*
133% 135% 133% 138%148%
31.12.2018 31.03.2019 30.06.2019 30.09.2019 31.12.2019
Limit nadzorczy9.3 8.7 9.1 9.1 10.3
28.2 28.8 28.8 30.0 30.4
6.4 6.3 7.8 6.4 5.6
12.7 13.3 13.5 13.3 13.22.7 2.4 2.9 3.1 2.8
Pozostałe depozyty
Detal - terminowe
Biznes - terminowe
Detal - avista
Biznes - avista
Supervisory limit
Other deposits
Retail - term deposits
Business - term deposits
Retail - avista
Business - avista

44
2020 guidance

2019 actual 2020 guidance
4.5% 4.5%
43.0% 43%
2.39% 2.0%
PLN 3.9 B PLN 5 B
45
2020 guidance
NIMnet interest margin
C/I*cost/income
CORcost of risk
Gross loan book growth**(12 months)
*Cost to income ratio (C/I): counter - group operation costs (excluding bank tax); denominator - revenues (net interest income, net fee and commission income, the result on financial assets measured at fair value
through profit or loss and FX result, the result on derecognition of financial assets and liabilities not measured at fair value through profit or loss, result on other operating income and expenses, income from dividends)
**Excluding deductions, NPL sales, Buy-Sell-Back transactions and securitizations, but including portfolio amortization

46
Appendix

47
Number of clients (T)
+149(+3.5%)
4 227 4 224 4 318 4 313
4 376
IV kw.'18 I kw.'19 II kw.'19 III kw.'19 IV kw.'19Q4’18 Q1’19 Q2’19 Q3’19 Q4’19
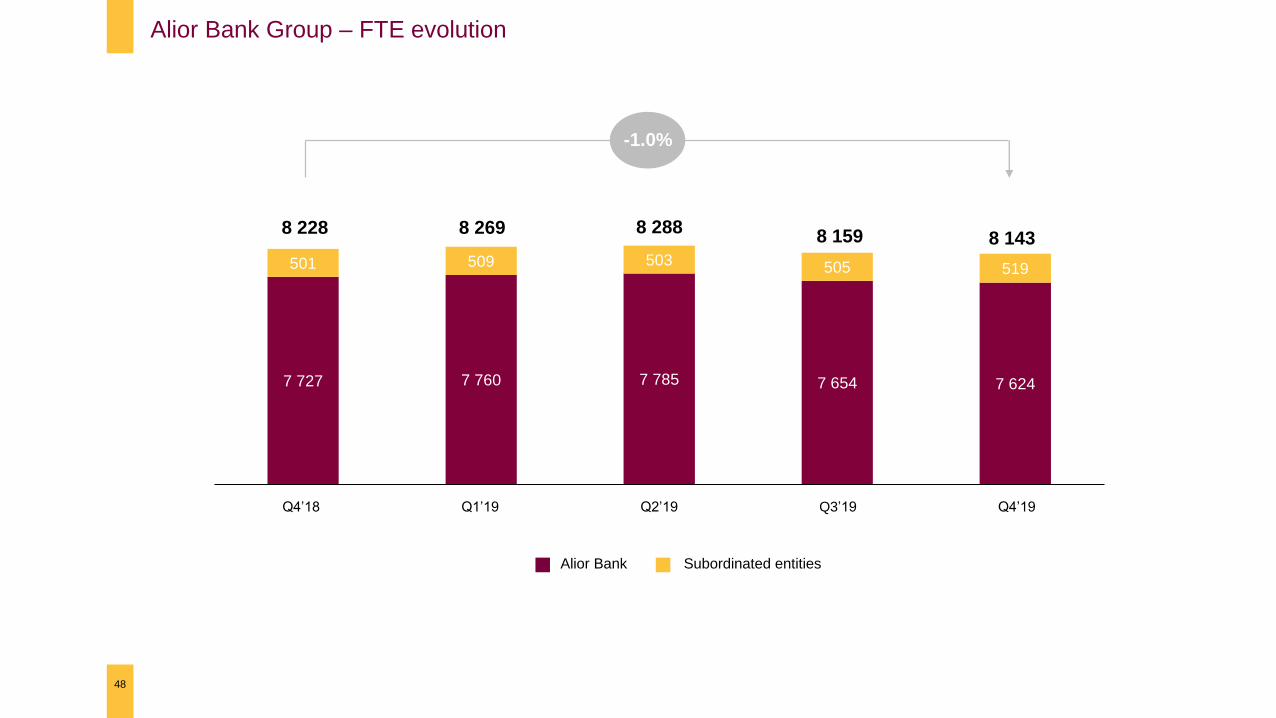
7 727 7 760 7 785 7 654 7 624
501 509 503 505 519
IV kw.'18 I kw.'19 II kw.'19 III kw.'19 IV kw.'19
48
Alior Bank Group – FTE evolution
8 228 8 2888 159 8 143
8 269
-1.0%
Alior Bank Subordinated entities
Q4’18 Q1’19 Q2’19 Q3’19 Q4’19

643 640 644 619 608
218 215 214213 212
IV kw.'18 I kw.'19 II kw.'19 III kw.'19 IV kw.'19
49
Number of branches
820861 855 858 832
Franchise branches Own branches
Q4’18 Q1’19 Q2’19 Q3’19 Q4’19

50
Significant improvement in the credit portfolio structure by 2022
Credit portfolio structure (%)
2016 2017 2018 2019 2020 2021 2022
Cash loans
Mortgage loans
Other
Large
Medium
Small
Micro
Leasing
Retail
segment
Business
segment
1 37 8 10 11 128
910
1111 11 12
77
66
6 6 6
119
7 66 6 615
16 15 1211 10 10
77 6
6 6 6 6
2020 20
21 20 21 21
31 30 29 31 29 28 27

12.81%12.42%
12.92%
13.37% 13.48%
15.85%
15.40%
15.84%16.24% 16.20%
11.13%
11.75% 11.75% 11.75%11.50%
13.13%
13.75% 13.75% 13.75% 13.50%
31.12.2018 31.03.2019 30.06.2019 30.09.2019 31.12.2019
T1 ratio TCR Tier 1 ratio minimum KNF TCR minimum KNF
51
Bank's capital position allows to maintain dynamic loan volume growth
(+) Q2'18 and Q3’18 result count: 72bps
(-) increase in volume in 4Q’18: 1bps
(+) AMA2: 33bps
(-) 2 tranche of IFRS9: 25bps
(-) increase in volume in 1Q’19: 25bps
(-) revaluation reserve: 14bps
(+) portfolio securitization:17bps
(+) Q3’18 result count: 35bps
(-) increase in volume in 2Q’19: 3bps
The increase in the loan volume by PLN 1 B "consumes" 18 bps of Tier1 capital.
The current level of Tier1 capital allows for a further increase in the loan portfolio by PLN 13 B.
Surplus over the
PFSA minimum
2.70%
Surplus over the
PFSA minimum
1.98%
(+) 1H’19 result count: 34bps
(+) decrease in volume in 3Q’19: 26bps
Lowering the OSII buffer for Alior to
0% lowers the minimum PFSA limit
PFSA minimum PFSA minimum

-0.6
2.01.6
2.3
3.5
2016 2017 2018 2019 2020P
52
Macroeconomic outlook
Source: Macroeconomic Analysis division forecast (26.01.2020 r.)
3.1
4.9 5.14.0
3.3
2016 2017 2018 2019 2020P
8.26.6 5.8 5.2 5.2
2016 2017 2018 2019 2020P
1.5 1.5 1.5 1.5 1.5
2016 2017 2018 2019 2020P
GDP growth (% y/y) Inflation (CPI % y/y)
Unemployment rate (%)NBP reference rate (%)
Year averageReal change
End of period End of period
2016 2017 2018 2019 2020F
2016 2017 2018 2019 2020F
2016 2017 2018 2019 2020F
2016 2017 2018 2019 2020F

53
Income statement
PLN M 2019 2018
Interest income* 4 059 3 956
Interest expenses -878 -872
Net interest income 3 181 3 085
Fee and commission income 1 166 1 099
Fee and commission expenses -499 -389
Net fee and commission income 667 710
The result on financial assets measured at fair value through
profit or loss and FX result102 98
The result on derecognition of financial assets and liabilities
not measured at fair value through profit or loss46 78
Other operating income 143 127
Other operating costs -346 -142
Net other operating income -202 -15
General and administrative expenses -1 630 -1 705
Net expected credit losses, impairment allowances and write-downs -1 443 -1 054
Banking tax -226 -208
Profit before tax 495 988
Income tax -242 -275
Net profit 253 713
*Interest income includes income of similar nature

54
Balance sheet
PLN M 31.12.2019 31.12.2018
Cash and balances with the Central Bank 1 379 2 079
Amounts due to banks 213 173
Financial assets 15 799 13 728
Measured at fair value through total income 10 439 7 280
Measured at fair value through P&L 544 515
Measured at amortized cost 4 816 5 932
Derivative hedging instruments 135 112
Loans and advances to clients 55 871 54 246
Assets pledged as collateral 335 333
Property, plant and equipment 764 461
Intangible assets 580 572
Investments in subsidiaries 10 4
Income tax asset 1 165 1 036
Other assets 485 676
Total assets 76 736 73 420
Amounts due to banks 823 593
Amounts due to clients 64 999 62 436
Financial liabilities measured at fair value through profit or loss 437 416
Derivative hedging instruments 41 9
Provisions 409 126
Other liabilities 1 380 1 167
Income tax liabilities 95 268
Subortinated liabilities 1 794 1 918
Total liabilities 69 977 66 934
Equity 6 759 6 486
Total liabilities and equity 76 736 73 420

950 1 103 914 619 853
2 758 2 1181 864
1 4191 598
IV kw'18 I kw'19 II kw'19 III kw'19 IV kw'19
kredytyobrotowe
kredytyinwestycyjne
1 952 2 030 2 010 2 061 1 728
918 557 570 765 1 155
409 378 457
486 489
IV kw.'18 I kw.'19 II kw.'19 III kw.'19 IV kw.'19
Kredyty hipoteczne
Kredyty ratalne
Pożyczka
55
New loans sales (PLN M)
Business loans (new quarterly sales + renewals)*
Retail loans (new quarterly sales)*
3 2792 965 3 037
2 7773 221
3 313
2 038
3 708
*Managerial approach
3 371
2 451
Mortgage loans
Consumer loans
Cash loans
Working capital loans
Investment loans
Q4’18 Q1’19 Q2’19 Q3’19 Q4’19
Q4’18 Q1’19 Q2’19 Q3’19 Q4’19

56
Shareholding of Alior Bank*
The largest free float among Polish financial institutions.
*Based on the number of shares registered at the AGM convened for June 28, 2019 and notifications received from shareholders
48,06%
7,25%
31,91%
7,12%
PZU SA Group
AVIVA OFE
AVIVA Santander
Other Shareholders
5,66%
Nationale-Nederlanden OFE
31.93%
7.25%
7.12%
53.70%

57
Change in the presentation of the transaction margin on FX transactions
Starting from Q1’ 19 Bank changed its presentation in terms of the realized transaction margin on foreign exchange transactions. In earlier periods, it was
presented in the result on instruments measured at fair value through profit and loss and the revaluation result, at present in the fee and commission income.
2018
Before changeChange
2018
After change
Interest income 3 085 3 085
Fee and commission income 436 274 710
The result on financial assets measured at fair value through
profit or loss and FX result372 -274 98
The result on derecognition of financial assets and liabilities not
measured at fair value through profit or loss78 78
Net other general and administrative income and costs -15 -15
General and administrative expenses of the Group -1 705 -1 705
Net expected credit losses, impairment allowances and write-downs -1 054 -1 054
Banking tax -208 -208
Profit before tax 988 988
Income tax -275 -275
Net profit 713 713

Quality of the renewable energy portfolio (RES) and industry perspective
58
Significant improvement in the financial situation of the renewable energy
sector caused by the increase in the prices of Green Certificates and
lowering the property tax.
As a result, the Bank noted an improvement in the financial situation of
RES clients and a decrease in exposure as a result of faster than
scheduled loan repayment. Also:
• The renewable energy portfolio currently has over 775 million
balance sheet commitments and no clients have arrears on 12/2019;
• In 2019 there was only one client late, its involvement is 1.6 million
and currently has no arrears;
• The average recoverable value coverage of collateral in the OZE
portfolio is over 85%.
Positive forecasts for the coming years - according to the Energy and
Climate Policy Scenario of 18/12/2019, it is assumed to achieve a 15%
share of renewable energy in energy consumption in Poland in 2020
and 23% in 2030. The context of the plan agreed within the EU is also
important, which assumes achieving CO2 neutrality by 2050.
Another favorable factor - the observed increase in energy prices, for
which the upward trend is expected to continue.
• Timely service of obligations in 2019.
• Continued reduction of exposures - by 21% in 2019.
• A large number of OZE companies prepay loans,
including clients in NPL.
1 049976
776
2017 2018 2019
RES balance (PLN M)
Forecast vs. actual price of black energy
and green certificates
Electric Power (current forecasts)
Green Certificate (REAL/TGE)
Green Certificate (current forecasts)
Electric Power (REAL/TGE)
Electric Power (REAL/URE)

170.4
15.9
- 4.1
182.3
Q4’18
171.1
- 6.8 - 7.0 - 2.9
154.5
Q1’18
59
Impact of accounting adjustments on net profit 2018 (PLN M)
Net result
reportedSecutiries/
BGF
IFSR 9 EIR
change
Net result
adjusted
Net result
reportedIFSR 9 EIR change Net result
adjusted
Net result
reportedIFSR 9 EIR change Net result
adjusted
Net result
reportedIFSR 9 EIR change Net result
adjusted
195.6
3.3 0.9
199.8
Q2’18
172.9
- 2.1
6.0
176.8
Q3’18

60
Disclaimer
This document has been prepared by Alior Bank S.A. (the “Bank”) solely for use at the Presentation. Any forward looking statements
concerning future economic and financial performance of the Bank contained in this Presentation are based on the Financial Report of the
Alior Bank Group for 2019. The Bank does not accept any responsibility for the use of any such information.
The distribution of this document in certain jurisdictions may be restricted by law. This document may not be used for, or in connection
with, and does not constitute, any offer to sell, or an invitation to purchase, any securities or other financial instruments of the Bank in any
jurisdiction in which such offer or invitation would be unlawful.
Persons in possession of this document are required to inform themselves about and to observe any such restrictions. Any failure to
comply with these restrictions may constitute a violation of the securities laws of any such jurisdiction. The information provided in this
presentation should not be considered as an explicit or implicit statement or the provision of any type submitted by the Bank or persons
acting on behalf of the Bank.
Furthermore, neither the Bank nor the persons acting on behalf of the Bank are under any terms liable for any damage, which may arise,
as a result of negligence or other reasons, in connection with the use of this Presentation or any information contained therein, nor for
injury, which may arise in another way in connection with the information forming part of this Presentation.


62Alior Bank S.A. | 28 lutego 2020 r. | Wyniki skonsolidowane GrupyAlior Bank S.A. | 28.02.2020
Thank you for attention2019 Annual Financial Performance