alive & thrive is a six-year (2009-2014) initiative to
TRANSCRIPT


Alive & Thrive is a six-year (2009-2014) initiative to improve infant and young child feeding practices by increasing rates of exclusive breastfeeding and improving complementary feeding practices. The first two years provide a window of opportunity to prevent child deaths and ensure healthy growth and brain development. Alive & Thrive (A&T) aims to reach more than 16 million children under two years old in Bangladesh, Ethiopia, and Viet Nam through various delivery models. Learning will be shared widely to inform policies and programs throughout the world. Alive & Thrive is funded by the Bill & Melinda Gates Foundation and managed by FHI 360. Other members of the A&T consortium include BRAC, GMMB, International Food Policy Research Institute (IFPRI), Save the Children, University of California-Davis, and World Vision.
Suggested citation:
Ali D, Tedla M, Subandoro A, Bamezai A, Rawat R, Menon P. Alive & Thrive Baseline Survey Report: Ethiopia. Washington, D.C.: Alive & Thrive, 2011.
Alive & Thrive FHI 360 1825 Connecticut Avenue, NW Suite S680 Washington, DC 20009-5721 Tel: (202) 884-8000 Fax: (202) 464-3966
[email protected] www.aliveandthrive.org
iii
Table of Contents
List of Tables ................................................................................................................................................ vi
List of Figures ............................................................................................................................................. viii
List of Annex Tables ..................................................................................................................................... ix
List of Annex Figures ..................................................................................................................................... x
Acronyms .................................................................................................................................................... xii
Executive Summary ..................................................................................................................................... xiv
1. Introduction ............................................................................................................................................. 1
1.1 Brief Overview of the Nutrition Situation in Ethiopia ........................................................................ 1
1.2 Description of Alive & Thrive Program in Ethiopia ............................................................................ 1
1.3 Objectives of the Impact Evaluation .................................................................................................. 4
1.4 Structure of the Report ...................................................................................................................... 4
2. Methods ................................................................................................................................................... 6
2.1 Conceptual Framework ...................................................................................................................... 6
2.2 Evaluation Design ............................................................................................................................... 6
2.2.1 Description of evaluation design ................................................................................................ 6
2.2.2 Sample size .................................................................................................................................. 8
2.2.3 Sampling and selection of eligible households ........................................................................... 8
2.3 Data Collection Methods ................................................................................................................. 10
2.3.1 Design and content of survey questionnaires .......................................................................... 10
2.4 Training of Personnel ....................................................................................................................... 13
2.4.1 Training of interviewers ............................................................................................................ 13
2.4.2 Training and standardization in anthropometric measurements ............................................. 15
2.5 Fieldwork Logistics ........................................................................................................................... 16
2.5.1 Composition of survey team ..................................................................................................... 16
2.5.2 Administration of the household survey and anthropometric measurements ........................ 16
2.5.3 Administration of the community and health staff questionnaires ......................................... 17
2.5.4 Supervision and quality control ................................................................................................ 17
2.5.5 Fieldwork constraints ................................................................................................................ 17
2.5.6 Data management ..................................................................................................................... 18
2.5.7 Data analysis ............................................................................................................................. 18
2.5.8 Limitation of the survey ............................................................................................................ 18
3. Results: Sample Characteristics ............................................................................................................. 20
3.1 Variables ........................................................................................................................................... 20
3.2 Results of Sample Characteristics .................................................................................................... 20

iv
4. Results: Key Impact Indicators ............................................................................................................... 23
4.1 Variables ........................................................................................................................................... 23
4.2 Results: Core A&T Impact Indicators ............................................................................................... 23
4.3 Results: Anthropometric Outcomes................................................................................................. 24
4.3.1 Mean anthropometric indices ................................................................................................... 24
4.3.2 Stunting, underweight, and wasting ......................................................................................... 29
4.4 Results: IYCF Indicators .................................................................................................................... 32
4.4.1 Overall patterns of IYCF ............................................................................................................ 32
4.4.2 Breastfeeding-related practices ................................................................................................ 34
4.4.3 Complementary feeding-related practices ............................................................................... 36
4.5 Chapter Summary ............................................................................................................................ 38
5. Results: IYCF Practices, Challenges, and Child Feeding Knowledge ....................................................... 40
5.1 Variables ........................................................................................................................................... 40
5.2 Breastfeeding Challenges ................................................................................................................. 41
5.3 Complementary Practices and Challenges ....................................................................................... 42
5.4 Knowledge about IYCF Practices ...................................................................................................... 45
5.5 Awareness, Trial, and Adoption of Key IYCF Practices ..................................................................... 50
5.6 Chapter Summary ............................................................................................................................ 51
6. Results: Use of A&T Platform ................................................................................................................. 52
6.1 Variables ........................................................................................................................................... 52
6.2 Community/Health System Platform ............................................................................................... 52
6.3 Exposure to Media ........................................................................................................................... 57
6.4 Access and Use of Markets .............................................................................................................. 59
6.5 Chapter Summary ............................................................................................................................ 60
7. Results: Child, Caregiver, and Household Characteristics That Influence IYCF and Nutrition ............... 62
7.1 Variables ........................................................................................................................................... 62
7.2 Child Characteristics ......................................................................................................................... 64
7.3 Mothers’ Characteristics .................................................................................................................. 70
7.4 Household Characteristics ............................................................................................................... 74
7.5 Chapter Summary ............................................................................................................................ 79
8. Results: Community Characteristics....................................................................................................... 81
8.1 Variables ........................................................................................................................................... 81
8.2 Chapter Summary ............................................................................................................................ 83
9. Results: Frontline Health Workers ......................................................................................................... 84
9.1 Variables ........................................................................................................................................... 84

v
9.2 Health Extension Workers ................................................................................................................ 84
9.3 Volunteer Community Health Promoters ........................................................................................ 88
9.4 Supervisors ....................................................................................................................................... 92
9.5 Chapter Summary ............................................................................................................................ 96
10. Summary and Discussion ..................................................................................................................... 97
10.1 Summary Results ............................................................................................................................ 97
10.2 Conclusions .................................................................................................................................. 104
References ................................................................................................................................................ 106
Annex 1 ..................................................................................................................................................... 108
Annex 2 ..................................................................................................................................................... 110
A2.1 Description of Household Questionnaire Modules ...................................................................... 111
Annex 4 ..................................................................................................................................................... 120
Annex 5 ..................................................................................................................................................... 125
Annex 6 ..................................................................................................................................................... 129
Annex 7 ..................................................................................................................................................... 134
Annex 8 ..................................................................................................................................................... 144
Annex 9 ..................................................................................................................................................... 145

vi
List of Tables
2.1 Number of study subjects in each age group .................................................................................. 9
2.2 Impact, process, and underlying factors captured by household questionnaires (household) .... 12
2.3 Overview of the domains covered in the A&T frontline health worker questionnaires ............... 14
3.1a Household composition, by region ................................................................................................ 20
3.1b Parents’ characteristics, by region ................................................................................................. 21
3.2 Child age and sex distribution, by region ....................................................................................... 22
4.1 Core impact indicators, by region .................................................................................................. 24
4.2a Comparison of nutritional status outcomes, by regions and age-groups ..................................... 25
4.2b Comparison of nutritional status outcomes, by gender ................................................................ 25
4.3 Comparison of nutritional status outcomes, by age group and regions ....................................... 30
4.4 WHO-recommended IYCF indicators (core and optional), by regiona ........................................... 33
4.5 Pre-lacteal feeding, by region ........................................................................................................ 34
4.6a Complementary feeding-related practicesa ................................................................................... 37
4.6b Introduction of different foods and liquids, by age ....................................................................... 37
5.1 Problem when first started breastfeeding ..................................................................................... 41
5.2 Problem when breastfeeding later on (when the child 3-4 months) ............................................ 42
5.3 Problem when first starting to feed semisolid foods, by regions .................................................. 43
5.4 Current problems with IYCF practices, by region and age ............................................................. 44
5.5 Knowledge and perception about breastfeeding, by regions ....................................................... 45
5.6 Knowledge about appropriate time of introduction of CF, by regions .......................................... 46
5.7 Exposure to messages about infant feeding, by regions ............................................................... 48
5.8 Source of information for IYCF messages ...................................................................................... 48
5.9 Awareness, trial, and adoption of key IYCF practices .................................................................... 50
6.1 Access to health services by regions .............................................................................................. 54
6.2 Access to health services, by regions ............................................................................................. 55
6.3 Use of prenatal care when pregnant with the last child ............................................................... 56
6.4 Assistance during delivery and postnatal care, by regions ............................................................ 57
6.5 Exposure to information on health and nutrition, by regions ....................................................... 58
6.6 Exposure to media (TV, radio, community meetings), by regions ................................................. 59
6.7 Access to market, by regions ......................................................................................................... 60
7.1 Prevalence in child morbidity symptoms in the previous two weeks, by region .......................... 65
7.2 Feeding practice during diarrhea ................................................................................................... 66
7.3 Mothers’ perception of child health and appetite ........................................................................ 67

vii
7.4 Child immunization status, by source of information, by region .................................................. 69
7.5 Women’s nutritional status, by region .......................................................................................... 70
7.6 Women's perceived physical and mental well-being, by region ................................................... 71
7.7 Women’s control over household assets, by region ..................................................................... 72
7.8 Women’s control over purchasing household items, by region .................................................... 73
7.9 Women’s decisionmaking power within the households, by region ............................................. 73
7.10 Household economic status, by region .......................................................................................... 74
7.11 Household experiences with food insecurity, by region ............................................................... 76
7.12 Household food dietary diversity, by region ................................................................................. 77
7.13 Economic shocks in the last 12 months, by region ........................................................................ 78
7.14 Food and social assistance, by region ............................................................................................ 79
8.1 Characteristics of the communities, by region .............................................................................. 82
8.2 Health facility-related characteristics of the community, by region ............................................. 83
9.1 General profile of health extension workers, by region ................................................................ 85
9.2 IYCF knowledge of the HEWs ......................................................................................................... 86
9.3 Job motivation among health extension workers (HEWs)............................................................. 87
9.4 Job satisfaction among health extension workers (HEWs) ............................................................ 87
9.5 Training received by the HEWs ...................................................................................................... 88
9.6 General profile of volunteer community health promoters .......................................................... 89
9.7 IYCF knowledge of the VCHPs ........................................................................................................ 90
9.8 Job motivation among VCHPs ........................................................................................................ 91
9.9 Training received by the VCHPs ..................................................................................................... 92
9.10 General profile of the supervisors ................................................................................................. 93
9.11 IYCF knowledge of the supervisors ................................................................................................ 93
9.12 Training received or given by the supervisors, by region .............................................................. 94
9.13 Job motivation among supervisors ................................................................................................ 95
10.1 Baseline results summary matrix, Ethiopia .................................................................................... 97

viii
List of Figures
F1.1 Flowchart showing Alive and Thrive Program in Ethiopia ............................................................... 3
2.1 Conceptual framework of Alive & Thrive program in Ethiopia ........................................................ 7
4.1 Mean anthropometric outcomes, by age groups .......................................................................... 26
4.2 Mean of height-for-age Z-scores (HAZ), by age groups and regions ............................................. 26
4.3 Mean of weight-for-age Z-scores (WAZ), by age groups and regions ........................................... 27
4.4 Mean of weight-for-height Z-scores (WHZ), by age groups and regions ....................................... 27
4.5 Mean of height-for-age Z-scores (HAZ), by age group and gender ............................................... 28
4.6 Mean of weight-for-age Z-scores (WAZ), by age group and gender ............................................. 28
4.7 Mean of weight-for-height Z-scores (WHZ), by age groups and gender ....................................... 29
4.8 Prevalence of stunting, by age group and region .......................................................................... 30
4.9 Prevalence of stunting, underweight, and wasting, by regions..................................................... 31
4.10 Prevalence of underweight, by age group and region ................................................................... 31
4.11 Prevalence of wasting, by age group and region ........................................................................... 32
4.12 Breastfeeding practices, by age ..................................................................................................... 33
4.13 Exclusive breastfeedinga and predominant breastfeeding,b by age .............................................. 36
5.1 Percentage distribution of awareness, trial, and adoption ........................................................... 51
7.1 Prevalence of selected morbidity symptoms in previous two weeks, by age group..................... 66

ix
List of Annex Tables
A1.1 Seven excellent feeding actions ................................................................................................. 109
A2.2 Roles and responsibilities of field staff ...................................................................................... 117
A2.3 List of woredas, EAs, by regions ................................................................................................. 118
A4.1 WHO-recommended IYCF indicators ......................................................................................... 120
A4.2 Food consumed by children in the last 24 hours ....................................................................... 122
A4.3 Food consumed by children in the last 24 hours ....................................................................... 123
A4.4 Mean differences in undernutrition status, by gender .............................................................. 124
A4.5 Mean differences in IYCF practices, by gender .......................................................................... 124
A5.1 Mothers’ CF-related knowledge ................................................................................................. 125
A5.2 Mothers’ knowledge about feeding practice after illness ......................................................... 126
A5.3 Mothers’ knowledge on personal hygiene ................................................................................. 127
A5.4 Mothers’ perception on improving feeding ............................................................................... 128
A6.1 Utilization of healthcare services for the child in last one year, by region ................................ 129
A6.2 Exposure to BF-related messages and other services during last pregnancy, by region ........... 130
A6.3 Child measured during recent health checkup, by region ......................................................... 131
A6.4 Ownership of growth card and child measurement .................................................................. 132
A6.5 Access to complementary foods available in the market .......................................................... 133
A7.1 Feeding advice during illnesses .................................................................................................. 134
A7.2 Self-efficacy of mothers about child feeding practices, by region ............................................. 135
A7.3 Economic quintile, by region ...................................................................................................... 136
A7.4 Household food dietary diversity of any member in last 24 hours, by region ........................... 136
A7.5 Effects of the economic shocks, by region ................................................................................. 137
A7.6 General cleanliness of the mother and child, from observation ............................................... 138
A7.7 General cleanliness of the household and compound, from observation ................................. 138
A7.8 Caregivers’ place of work and child support .............................................................................. 139
A7.9 Household help for the caregivers and the remunerations paid for the help, by region .......... 140
A7.10a Bivariate analyses of nutritional outcomes with key independent characteristics ................... 141
A7.10b Bivariate analyses of nutritional outcomes with key independent characteristics ................... 142
A8.1 Natural disasters in the community, by region .......................................................................... 144
A9.1 Additional IYCF knowledge of the HEW ..................................................................................... 145
A9.2 Supportive supervision received, by HEWs ................................................................................ 146
A9.3 Additional IYCF knowledge of the VCHPs ................................................................................... 146
A9.4 VCHP’s knowledge on feeding after illness ................................................................................ 147

x
A9.5 VCHP’s knowledge on personal hygiene .................................................................................... 148
A9.6 VCHP’s perception on child feeding ........................................................................................... 149
A9.7 Additional IYCF knowledge of the supervisors ........................................................................... 150
A9.8 Supervisors’ knowledge on feeding during illness ..................................................................... 151
A9.9 Supervisors’ knowledge on personal hygiene ............................................................................ 152
A9.10 Supervisors’ perception on improving child feeding ................................................................. 153
List of Annex Figures
A1.1 Alive and Thrive “community conversation” program pathway................................................ 108
A2.1 Stages of sampling ...................................................................................................................... 110
A2.2 Conceptual Framework for Child Undernutrition ...................................................................... 111
A2.3 Field team composition .............................................................................................................. 116
A7.1 Mother’s perception of child’s health, by age ........................................................................... 143
A7.2 Mother’s perception of child’s appetite, by age ........................................................................ 143

xi
Acknowledgments
A survey as large as this one could not be completed without the coordinated efforts of many people. The International Food Policy Research Institute (IFPRI) from Alive and Thrive (A&T) team thanks all those who facilitated every step of this process:
Ellen Piwoz, the Bill & Melinda Gates Foundation, for her support and commitment to this program evaluation.
Jean Baker and Karin Lapping from A&T headquarters for their constant support for our work.
Dr. Teweldebrhan Hailu Abrha, A&T Country Director (Ethiopia) for overall enthusiastic support to this evaluation, comments on questionnaire versions, connecting the evaluation team with the regional authorities for approvals and his tremendous interest in the results.
All the A&T program specialists in Ethiopia for their engagement at various stages of the study, particularly for providing valuable comments on the tools.
Dr Mesfin Beyero, World Vision, for providing substantial inputs on the tools.
Dr. Ferew Lemma, nutritional advisor to the Federal Ministry of Health for providing valuable feedback on the tools.
Integrated Family and Health Program (IFHP)’s central and regional staffs for their contribution on the tools and providing field support.
Dr. Peter Eerens and Dr. Tesfaye Bulto, from IFHP, for taking a special interest in the survey and providing support during preparatory field visits.
Heads of the Regional Health Bureaus (RHB) in Tigray and SNNPR for allowing us to conduct the survey and providing necessary comments on the tools.
All the staffs at the Woreda Health Offices for their support.
Addis Continental Institute of Public Health (ACIPH) for facilitation of administrative, logistical support to the fieldwork.
Kebele administration, community members and health post staffs who guided the survey team to locate households, and who facilitated communication with survey respondents.
The entire survey team, including the research assistant, field supervisors, fieldworkers, and data entry and management team deserve special thanks for their diligent, accurate, and focused work in a certainly less than hospitable geographical environment.
Jay Willis and Nicole Rosenvaigue (IFPRI, Washington) for copy-editing and formatting
Finally, to the women and children that belong to the 3,000 households of two regions who participated in the study, we thank you for your role in making this baseline survey a success. Your contributions of time and information, and your dreams for a more healthy future for your children are the very heart of this project.

xii
Acronyms
A&T ASF
Alive & Thrive Animal source foods
ACIPH Addis Continental Institute of Public Health AED Academy for Educational Development ANC Antenatal care BCC Behavior change communication BF Breastfeeding BMI Body Mass Index CBN Community-based nutrition CF Complementary feeding CSA CHD
Central Statistical Authority Community health day
DALYs Disability adjusted life years EA Enumeration area EBF Exclusive breastfeeding EDHS EOS
Ethiopian Demographic and Health Survey Enhanced outreach strategy
ENA Essential nutrition actions ESHE Essential Services for Health in Ethiopia FANTA Food and Nutrition Technical Assistance FCF Fortified complementary food FHC Family health card FMOH Federal Ministry of Health FHWs Frontline health workers HAZ Height-for-age Z-scores HEP Health Extension Program HEW Health extension worker HFIAS Household Food Insecurity Access Scale HH Household HIV Human immunodeficiency virus HP Health Post HQ Headquarters IEC Information, Education and Communication IFHP Integrated Family Health Program IFPRI International Food Policy Research Institute IPC Interpersonal Communication IRB Institutional Review Board IYCF Infant and young child feeding MLE Measurement, Learning, and Evaluation MOH Ministry of Health NNP National Nutrition Program ORS Oral rehydration salts OTP Outpatient therapeutic program PAHO Pan American Health Organization PIP Program impact pathway

xiii
PPS Probability proportion to size PSNP Productive Safety Net Program PSU REST
Primary sampling unit Relief Society of TigrayJG
RHB RUTF
Regional Health Bureau Ready-to-use therapeutic foods
SES Socioeconomic status SNNPR Southern Nations, Nationalities, and People’s Region SRQ Self Reporting Questionnaire SRS Systematic random sampling TBA Traditional birth attendant TV TSF
Television Targeted supplementary feeding
UNICEF United Nations Children's Fund USAID United States Agency for International Development VAS Visual analogue scale VCHP Voluntary community health promoters WA Women’s Associations WAZ Weight-for- age Z score WHO World Health Organization WHZ Weight-for height Z score

xiv
Executive Summary
Alive & Thrive (A&T) is a six-year initiative (2009-2014), funded by the Bill & Melinda Gates Foundation, aimed at reducing child stunting and death caused by suboptimal infant and young child feeding (IYCF) practices. To this effect, A&T aims to improve infant and young child nutrition by increasing rates of exclusive breastfeeding and improving complementary feeding practices among children less than 2 years of age in Bangladesh, Ethiopia, and Viet Nam.
Ethiopia A&T Country Program Model
The project focuses on improving IYCF-related practices among children under 5 years of age. In each country, A&T operates at a relatively large scale, across multiple provinces, regions, and districts, in order to maximize impact on stunting reduction. In Ethiopia, the A&T program model utilizes the government’s extensive health extension program (HEP) that utilizes a large cadre of health extension workers (HEWs) and community volunteers, to deliver age-appropriate feeding messages and interventions at the community level. Coverage will be achieved through community-based interventions implemented at scale by the U.S. Agency for International Development (USAID)-supported Integrated Family Health Project (IFHP) and other local organizations’ platforms to reach approximately 5.4 million children under 2 years of age in Ethiopia’s four most populous regions, i.e., Amhara; Oromia; Southern Nations, Nationalities, and People’s Region (SNNPR); and Tigray.
Acknowledging the workload of frontline health workers (FHWs) and the volunteers who are responsible for all the government health initiatives, A&T plans to focus its behavior change communications around an abbreviated set of feeding messages. These messages include two exclusive-breastfeeding-specific messages, four complementary feeding-related messages, and one message for feeding of sick children.
To optimize provision of IYCF messages to target populations, multiple platforms and partnerships will be used. Community mobilization is an important feature of the Ethiopia program. Among others, one community model being evaluated centers around “champion kebeles (communities)” that engage a wide range of community members to reach families with children under 2 years of age under the theme “Smart & Strong Family.” Cultivation of champion communities involves workshops, community-set targets, educational activities, and celebrations and certificates of merit to recognize progress in achieving the essential actions promoted by the project. At a broader level, A&T is partnering with community-based organizations like the regional Women’s Associations, along with religious groups and others, to reach families and promote improved feeding practices in their communities.
The A&T program also offers a competitive small grants program to test new approaches for integrating IYCF prevention interventions into social safety net and nutrition rehabilitation programs. In addition, the program is exploring ways to involve private sectors to produce affordable fortified complementary foods (FCF).
One major feature of the A&T program in Ethiopia is the extensive national and regional advocacy work aiming to draw attention to the problem of chronic undernutrition and stunting and the importance of prevention of malnutrition. A&T is producing a video in 2011 that makes the case to federal and regional leaders to fund and support IYCF programs and policies. A&T is also cultivating journalists, both nationally and regionally, to raise their awareness and better equip them to create and cover stories on IYCF and chronic malnutrition. Thus the program seeks to shift the perception of malnutrition from a consequence of emergencies to that of chronic undernutrition.

xv
Evaluation design
To evaluate the impact of A&T’s community-based interventions, delivered through HEP, an adequacy design constituting of pre- and post- assessments only, without a comparison group being applied. In order to ensure maximum exposure to A&T interventions, the evaluation is being conducted in Tigray and SNNPR, two regions where the A&T interventions are being implemented in the first phase, beginning in June 2011.
A repeated cross-sectional pre-post evaluation design is utilized. A baseline survey was conducted between June–August, and an endline survey is planned for June–August 2013, three years later. The primary objective of the evaluation is to measure changes in stunting and IYCF practices over time in the program areas in the two regions (Tigray and SNNPR), and to employ plausibility analyses to attempt to attribute these changes to A&T interventions.
Methods
A baseline survey was conducted between June and August 2010 by the International Food Policy Research Institute (IFPRI) in collaboration with Addis Continental Institute of Public Health (ACIPH). The baseline survey had three separate components: 1) a household survey, 2) a frontline health worker survey, and 3) a community survey. A total of 3,000 households were selected from 75 enumeration areas (EAs) from 56 woredas (19 in Tigray and 37 in SNNPR) for inclusion in the household survey. Selection of households was based on three separate child age ranges, corresponding to the three primary A&T impact indicators. These were 1) presence of a child 0–5.9 months of age for detecting impact on exclusive breastfeeding (EBF); 2) presence of a child 6–23.9 months of age for detecting impact on complementary feeding indicators; and 3) presence of a child 24–59.9 months of age for detecting impact on stunting. The sample size of 3,000 households represented 600 households with a child age 0–5.9 months, 900 households with a child aged 6–23.9 months, and 1,500 households with a child aged 24–59.9 months.
The UNICEF conceptual framework of child undernutrition informed the development of the survey questionnaires. The framework identifies the causes leading to undernutrition as immediate, underlying, and basic, with each level of factors having influence on the others. A multi-module household questionnaire was developed, covering a wide range of information both for assessing the outcomes of interests as well as factors that influence the uptake and adoption of A&T interventions, such as household food security, socioeconomic status, parental characteristics, maternal knowledge and skills about IYCF, exposure to A&T and other IYCF/ nutrition interventions, exposure to media, household gender relationships, and child characteristics.
Health worker staff surveys collected information from three kinds of frontline health workers: volunteer community health promoters, health extension workers, and supervisors of health extension workers. The information included knowledge on IYCF, training received, job motivation, and job satisfaction of these health workers. The community survey was administered to a group of community members to collect information on contextual factors related to each community as well as to understand the differences in the community characteristics across the clusters.
A three-week-long training was arranged by ACIPH for the 60 enumerators selected for data collection. Questionnaires and an interview guide were translated in Amharic and the training was conducted in Amharic. The collected data were managed in three stages; first, a template for data entry was

xvi
developed; then data were entered and cleaned by ACIPH in collaboration with IFPRI; and, finally, the data were analyzed using STATA 11.5 by the IFPRI team.
Results
Anthropometry and IYCF Practices
The key A&T impact indicators are stunting among children 24-59 months of age and the World Health Organization (WHO)-recommended IYCF indicators.
The overall stunting prevalence among children less than 5 years of age in the survey areas was 44.4 percent, with 47 percent in Tigray and 43 percent in SNNPR. In the 24–59-month age group, the overall stunting prevalence was found to be highest at 56 percent. The prevalence of stunting increases consistently during the first two years of life, reaching its peak, and then plateauing at approximately 21–23 months of age (Figure 4.3.9). The overall prevalence of underweight is 24 percent, with a significantly higher prevalence in Tigray compared to SNNPR. In the 24–59.9-month age group, nearly one-third of the children were classified as being underweight. About 7 percent of all the children less than 5 years of age were wasted; wasting was highest in the 0–5.9-month age category, where one in ten children were wasted. Overall, the prevalence of stunting, underweight, and wasting was slightly higher in Tigray compared to SNNPR. Children aged 0–59 months had mean HAZ, WAZ, and WHZ scores that were lower than the median of the reference population standards, with mean HAZ, WAZ, and WHZ scores of -1.69, -1.12, and -0.22, respectively. The Z-scores for all measures were found to be lower in Tigray than in SNNPR. It is evident that, in our survey population, growth faltering appears to occur early in life, with deterioration in anthropometric indices from birth, until approximately 21–23 months of age.
In general, IYCF practices were suboptimal, with breastfeeding-related practices better than complementary feeding-related practices. Breastfeeding was initiated within the first hour of birth for two-thirds of all children, and over 70 percent of children less than 6 months of age were classified as being exclusively breastfed. Breastfeeding through the first year of life was a near universal practice.
Complementary feeding practices were very poor in both regions. One-third of children were being fed solid/semisolid foods in the 6–8.9-month age window in SNNPR, compared to almost half of children in Tigray. In both regions, dietary diversity was very low (6 percent) as was the consumption of iron-rich foods (2 percent). Almost half of all children meet their minimum desired meal frequency, although the percentage consuming a minimally acceptable diet (a composite indicator of diet diversity and meal frequency) was very low, at less than 5 percent.
It is evident that the introduction of complementary foods is delayed in Ethiopia. Overall, only two-thirds of children in the 6–8-month age range had been given grain-based complementary foods, while consumption of other nutrient-rich foods was extremely low, in particular, animal source foods.
IYCF Challenges Reported by Caregivers
Reported challenges related to initiation of breastfeeding, or continuation of breastfeeding, were very low. Only 7 percent of the mothers cited any problems, which included pain in the breast or perceived milk insufficiency. Less than half of these women sought any kind of help to resolve the problem. There were no major differences in the reported problems with breastfeeding at 3-to-4 months of age.

xvii
Frontline health workers and older female members are the primary source of support when women were facing difficulty in breastfeeding. At 3-4 months of age, the role of family members diminished. Reported challenges related to initiation of complementary feeding were also low (8.8 percent). The major problems identified were related to their child being sick and their child refusing to eat. Two-thirds of the mothers reported seeking help for these problems. The major suggestions given to them were related to continuation of breastfeeding, providing smaller meals, and increasing frequency of feeding.
Caregiver Knowledge and Perceptions about IYCF
There were major gaps identified in knowledge of the caregivers about appropriate IYCF practices. Eighty percent of mothers correctly responded that breastfeeding should be initiated within the first hour after delivery. Knowledge regarding the necessity of giving colostrum was significantly lower. Only half of all respondents stated that colostrum should be given to babies immediately after birth, with the remaining respondents saying that it should be thrown away. Two-thirds of the respondents believed that babies should be fed other liquids if the mother feels that their baby is not getting enough breastmilk.
There were major knowledge gaps related to complementary feeding-related practices. In general, very few mothers reported the appropriateness of introducing foods, other than water, before 6 months of age. Plant-based foods were thought to be suitable to be introduced earlier (at 6 months of age) compared to animal source flesh and organ foods. Over 90 percent of the mothers stated that meat, fish, or poultry should not be introduced until the children were 9 months or older. Of note, approximately 65 percent of mothers believed eggs and milk products could be introduced at 6 months of age.
We attempted to understand maternal exposure to selected infant feeding-related messages and the sources of these messages. Exposure to different IYCF messages was found to be quite low. Exposure to messages was somewhat higher among respondents from Tigray compared to their counterparts in SNNPR. Overall, it can be surmised that mothers from the surveyed population had very limited exposure to breastfeeding and complementary feeding-related messages. About 20 percent of mothers reported hearing messages related to 1) feeding extra meals after a child was recovering from an illness, and 2) feeding babies mashed family foods. All other messages were reported to have been heard by less than 15 percent of mothers. Subsequent trial and adoption of the IYCF practices was very low. Overall, HEWs and mothers and mothers-in-law were consistently the main source of information related to IYCF.
Use of A&T Platforms
Health System Knowledge about an HEW was near universal. However, only 32 percent of the respondents were visited by an HEW at their homes in the last six months. Another 20 percent had some contact with an HEW in the last six months within their community. A major focus of these interactions was related to hygiene and sanitation, safe water use, and child immunization. About two-thirds of respondents reported knowing a voluntary community health promoter (VCHP). Less than half of those who knew a VCHP were visited by one at home in the last six months. One-quarter of the respondents had an interaction with a VCHP within the community in the last six months. Immunization outreach and community conversations were the major forums where these interactions happened. Similar to HEWs, the key

xviii
topics discussed during these interactions were hygiene and latrine use, followed by safe water use and immunization.
Utilization of antenatal care during pregnancy at least once at a health facility was 65 percent. In addition, 20 percent of mothers reported being visited at home. The mean number of visits at a health facility was 3.3 times during a pregnancy. Health posts, followed by health centers, were the two most common health facilities visited by mothers for antenatal care. While antenatal visits were common, delivery at facilities were low. Over 90 percent of the mothers delivered at their own home and another 4 percent at their mothers’ home. About 60 percent mentioned being assisted by a friend or a relative during birth. Twenty-one percent of mothers reported being visited by a health professional after birth. HEWs, followed by VCHPs, were the primary health professionals who visited mothers after birth.
Media Exposure to different media outlets was relatively low as reported by respondents. Only 20 percent of the respondents reported having ever heard any health messages on the radio and 17 percent were exposed to messages on women and children through community gatherings. Exposure to other forms of media (television, newspapers, posters, and loudspeakers) was low, at less than 5 percent. In general, exposure to any kind of health messages through different media was reported by a higher percentage of women from Tigray compared to SNNPR.
Markets Nearly 90 percent of mothers said that the most common places for them to shop at were markets in other villages. The majority of mothers reported making daily food purchase-related decisions on their own. Access to markets within a 1-hour commute (by the most common means of transport) was significantly higher in SNNPR than in Tigray. In SNNPR, 70 percent of the mothers stated that they could reach a market within 1 hour using the most common mode of transportation. In Tigray, mothers spent more time reaching markets than SNNPR. Purchase of manufactured complementary foods at these markets was very low, with only 8 percent of respondents reporting having purchased such foods.
Underlying Factors—Child, Caregiver, Household, and Community Factors
We examined several underlying factors that are likely to affect children’s nutritional status. These included child- and maternal-level factors, as well as household- and community-level factors.
Child Characteristics Overall, the prevalence of common childhood illnesses (fever, cold, breathing problems, and diarrhea) during the previous two weeks was quite high. The prevalence of these conditions was 27 percent, 32 percent, 10 percent, and 16 percent for fever, cold, breathing problems, and diarrhea, respectively. All four conditions peaked between 6–23.9 months of age. In SNNPR, the prevalence was slightly higher for all four conditions compared to Tigray. Thirty percent of respondent mothers from SNNPR complained of fever compared to 22 percent of respondents in Tigray. A higher percentage of respondents in Tigray sought treatment for illnesses. The treatment-seeking pattern was similar for all four illnesses, with approximately one-third of respondents seeking treatment. Over 65 percent of respondents reported going to the formal medical sector (doctors, heath centers, hospitals) for treatment, and between 17 to 23 percent of the respondents reported going to the HEWs at the health post. There was a high rate of satisfaction with the treatment sought, with 80 percent of respondents reporting being satisfied.
Immunization against eight preventable diseases was also measured. Overall, child immunization status is low. According to health cards, only 13 percent of the children in this age group received all the

xix
recommended vaccines. According to mothers’ reports, the percentage is only slightly higher, at 20 percent. Thirty-five percent of children received all the required vaccines as per either source. The overall vaccination status of children was much better in Tigray compared to SNNPR.
Maternal Characteristics Approximately 25 percent of mothers were underweight (BMI < 18.5 kg/m2) and 2 percent were overweight (BMI ≥ 25 kg/m2). The prevalence of maternal malnutrition was higher in Tigray compared to SNNPR. Mean height of the mothers was 156.5 centimeters. Only 2 percent of mothers were of short stature, i.e., having a height below 145 centimeters. A little over half of the study mothers perceived their own health to be quite good compared to the other women in the area. However, according to the standardized WHO Self Reporting Questionnaire (SRQ), about 40 percent of the women can be classified as having a high level of mental distress.
Women’s control over household assets was assessed as one measure of maternal empowerment. Most household assets are possessed jointly with their spouse. About 4 percent of the respondents reported solely owning the house where they lived and 80 percent of those reported having the ability to sell these items. Less than 4 percent reported owning any large or small animals alone. Over 70 percent who owned these animals reported having the power to sell them. While nearly half of all respondents reported the ability to purchase small quantities of daily food items, less than half reported having the power to buy larger quantities. Decisionmaking power over larger household and food items was only reported by 20 percent of the women. Over 60 percent of women reported having the power to make decisions on child feeding-related matters. On all other matters, less than 30 percent of women reported being able to make decisions on their own. About 70 percent women were able to make decisions jointly with their husbands.
Household Characteristics Household food insecurity was measured using the Household Food Insecurity Access Scale (HFIAS). Overall, two-thirds of all households experienced some form of food insecurity. One-third of households were classified as food secure—they rarely worried about their household not having enough food. Another third of households fell into the category of being moderately food insecure—they sacrificed quality more frequently by eating a monotonous diet or ate less preferred foods sometimes or often, and/or had started to cut back on quantity rarely or sometimes. Fifteen percent of the households were characterized as being severely food insecure—these households experienced at least one of the most extreme conditions. There was no major regional difference on any of the conditions.
Mean dietary diversity in the household measured through 24-hour recall was very low at 4.1 food groups consumed during the previous day. Forty percent of the household reported having 0-3 food groups the day prior to the survey. Another 47 percent reported having 4-7 food groups. Only around 8 percent reported having 8 or higher food groups.
We explored households’ experiences of an economic shock in the previous 12 months. The most common shocks experienced were 1) loss of crops due to floods, 2) disease, injury, or loss of cattle, and 3) loss of crops due to drought, plant diseases, etc. Between 3 and 8 percent of respondents reported experiencing one of these kinds of economic shocks in the previous 12 months. Overall, 20 percent of all households experienced an economic shock of some kind in the previous 12 months.
Rural households in Ethiopia have historically received food or other forms of social assistance to protect households from falling into the grip of severe poverty. Forty percent of the respondents

xx
reported that at least one family member in the household received some form of social assistance in the past one year. Two-thirds of the respondents from Tigray reported receiving food or other forms of social assistance compared to only 21 percent in SNNPR. The government’s Productive Safety Net Program (PSNP) was by far the largest source of social assistance in both regions, with over two-thirds of respondents reporting this source of assistance.
Community Characteristics In both regions, the major livelihood was agriculture for over 90 percent of respondents. Over 90 percent of the communities reported having a major road connection with the nearest town. However, the accessibility to the community during rainy reason was only 25 percent overall, with 46 percent in Tigray and only 14 percent in SNNPR. Over three fourths of the communities participated in the PSNP with 100 percent of Tigray’s surveyed communities and 65 percent of SNNPR’s surveyed communities. The community-based nutrition (CBN) program had also started in 70 percent and 35 percent of communities in Tigray and SNNPR respectively.
All the surveyed communities were served by the Government’s health extension program (HEP) with most of the communities having a health post.
Frontline Health Workers
IYCF knowledge of HEWs was relatively high. Overall, HEW knowledge of IYCF practices was higher for breastfeeding-related practices, and lower for complementary feeding practices. Over 70 percent of the HEWs received training on breastfeeding or complementary feeding. Training on essential nutrition actions (ENA) was low compared to the 62 percent that received community-based nutrition (CBN) training.
Overall, it can be surmised that HEW satisfaction with their job was relatively high. The most satisfactory aspect of an HEW’s job was that they felt that they were contributing to the improvement of the health of their community. Seventy percent of respondents strongly agreed with this statement.
Conclusions
Results from this baseline survey highlight the very high levels of malnutrition among children less than 5 years of age in Ethiopia. In particular these results demonstrate two key points: 1) the increasing prevalence of stunting, the primary A&T impact indicator, during the first two years of life; and 2) the suboptimal level of IYCF practices, in particular, complementary feeding practices.
Our results suggest that the Ethiopia A&T model aimed at delivering IYCF-related interventions through the Government’s Health Extension Program (HEP) and through social mobilization efforts has the potential to improve knowledge and practices relating to infant feeding. The high level of stunting and very low level of IYCF indicators indicate a scope for the intervention to make a major improvement in these indicators.
The results of this survey highlight several challenging as well as enabling factors that may have implications on the delivery and success of A&T interventions. The overall situation of high poverty, low educational levels, high food insecurity, and low maternal knowledge of IYCF presents challenges to the program. However, the relative high level of interaction with the frontline health workers, their high level of IYCF-related knowledge as well as job motivation and satisfaction, the extensive reach of the

xxi
government’s HEP, and the large network of other platforms for social mobilization and service delivery, offer major potential for the program’s success.

1
1. Introduction
1.1 Brief Overview of the Nutrition Situation in Ethiopia
Ethiopia has one of the highest rates of child malnutrition in Africa. According to the last Ethiopian Demographic Health Survey (EDHS 2005) [1], nearly half (47 percent) of Ethiopian children under 5 years of age was stunted, 11 percent was wasted, and 38 percent was underweight. According to EDHS 2005, there were substantial regional differences. Stunting prevalence is higher than the national average in Southern Nations, Nationalities, and People’s Region (SNNPR) at 51.6 percent compared to 41.1 percent in Tigray. Wasting was higher in Tigray at 11.6 compared to 6.5 percent in SNNPR. Underweight was higher than the national average at 42 percent in Tigray and lower in SNNPR at 34.7 percent. At the same time, according to EDHS 2005, infant and young child feeding practices were suboptimal, and, in particular, complementary feeding practices among children 6-23 months of age were particularly low. Despite the recommendations from the World Health Organization (WHO) to introduce solid or semisolid food at 6 months, only one in two children of 6–8.9 months of age consumed solid or semisolid foods. The majority of children 6–23 months of age consume foods made primarily from grains (70 percent) compared to other types of solid or semisolid foods. While socioeconomic and other contextual factors contribute to this high level of malnutrition, EDHS (2005)[1] and other studies [2,3] have identified gaps in infant and child feeding (IYCF) practices, which likely are major contributing factors.
The Federal Ministry of Health in Ethiopia (FMOH) has made significant progress in the support of IYCF in the last decade. A National Strategy for Infant and Young Child Feeding was developed in 2004 that provides detailed feeding recommendations and guidelines. A National Nutrition Strategy was developed in 2005–06, and a National Nutrition Program for implementing this strategy on a national scale was introduced in July 2008. Additionally, in 2005, under the U.S. Agency for International Development (USAID) bilateral project and the Academy for Educational Development’s (AED) LINKAGES project, key messages on the essential nutrition actions (ENA) to improve the nutrition of women and young children in Ethiopia were developed and implemented. In the backdrop of this favorable environment, with government and nongovernmental organizations already working on IYCF, Alive & Thrive seeks to further strengthen the effort to achieve considerable reduction in childhood chronic malnutrition (stunting) in Ethiopia.
1.2 Description of Alive & Thrive Program in Ethiopia
Alive & Thrive’s six-year mandate is to facilitate change for improved infant and young child feeding (IYCF) practices at scale in Bangladesh, Ethiopia, and Viet Nam; to document how interventions are delivered and their costs and impact; and to disseminate the evidence and lessons learned so that others can adapt and replicate the cost-effective components.
The Alive and Thrive (A&T) project is an initiative funded by the Bill & Melinda Gates Foundation to reduce under nutrition and death caused by suboptimal IYCF practices in three countries (Viet Nam, Bangladesh, and Ethiopia) over a period of six years (2009–2014). It is anticipated that in order to meet the Millennium Development Goals’ (MDGs) 2015 target, intensified program efforts related to nutrition, especially breastfeeding and complementary feeding, are needed.

2
A&T’s overarching model is based on the assumption that sustainable improvements in breastfeeding and complementary feeding can be achieved through strategies to
1. Improve the policy and regulatory environment to support IYCF interventions and practices
2. Create, shape, and support demand for improved IYCF social norms and practices at the community and family levels
3. Increase supply, demand, and use of fortified complementary foods and related products
The A&T Ethiopia Model: Moving from nutrition crisis to nutrition security
The Ethiopia model delivers age-appropriate child feeding messages and interventions at the community level, primarily through the government’s large network of health extension workers (HEWs) and community volunteers. Coverage will be achieved through community-based interventions implemented at scale by the USAID-supported Integrated Family Health Project (IFHP) and other local organizations’ platforms to reach approximately 5.4 million children under 2 years of age in Ethiopia’s four most populous regions, i.e., Amhara, Oromia, SNNPR, and Tigray.
The government-employed HEWs and the community volunteers are responsible for a wide range of community health and sanitation activities; therefore, they have limited time to devote to IYCF. In Ethiopia, A&T will focus its behavior change communications strategy around an abbreviated set of feeding messages that are most likely to have a sustained nutritional impact and to direct many of the messages to fathers, the gatekeepers of information and resources for the family. A&T is also supporting World Vision in conducting operations research to assess if peer mothers can be effective in supplementing the work of HEWs through a targeted counseling approach.
Community mobilization is as an important feature of the Ethiopia program. “Smart & Strong Family” is one community model being evaluated. This model promotes “champion kebeles (communities)”, which engage a wide range of community members to reach families with children under 2 years of age Cultivation of champion communities involves workshops, community-set targets, educational activities, and celebrations and certificates of merit to recognize progress in achieving the essential actions promoted by the project. A&T is also partnering with community-based organizations like the regional Women’s Associations and religious groups to reach families and promote improved feeding practices in their communities. In support of the community-based activities, A&T has developed various IYCF training resources, such as the complementary feeding (CF) protocol, CF training manual, IPC tools, IYCF quick reference book, community interventions operations manual, supportive supervision guidelines, etc. Radio spots, dramas, and videos are just a few examples of the mass media approaches to enhance IYCF. A&T has paid particular attention to the role of the father in making decisions regarding child feeding, an issue that emerged prominently from the formative research, and has thus tailored many of the above materials to fathers.
Ethiopia has historically viewed nutrition primarily as a response to an emergency. A distinguishing feature of A&T’s program in Ethiopia is the significant effort being placed on national and regional advocacy to draw attention to the problem of chronic undernutrition and stunting and the importance of preventing and addressing the problem for the future development of the country (Figure 1.1). A&T is producing a video in 2011 that makes the case to federal and regional leaders to fund and support IYCF programs and policies. A&T is also cultivating journalists, both nationally and regionally, to raise their awareness and better equip them to create and cover stories on IYCF and chronic malnutrition.

3
Figure 1.1 Flowchart showing Alive and Thrive Program in Ethiopia
a See Annex Figure A1.1 and Table A1.1.
Favorable Changes in IYCF practices and behaviors
- TOT - Training of HEWs
and HEW Supervisors
- Strengthen Supervision
- Training on key IYCF messages
Community component
(Interpersonal Communications)-
IFHP platform
Community component
(Social Mobilization independent of IFHP)
Mass Media Development of IYCF training materials and
IPC tools
Regional and Woreda Levels
Alive and Thrive Program in Ethiopia
Policy and Advocacy at All Level
Private sector A&T partners with
local companies
- Liaison with Women’s association (WA)
- Liaison with Religious Leaders
- Schools
- Radio Campaign - Street drama - TV drama
- Market assessment
- Local companies manufacture low cost CF food
Community Level
HEWs - Deliver key
messages on 7 IYCF excellent actions
a
- Distribute calendar with IYCF messages
- WA utilizes VCHPS to deliver key messages
- Religious Leaders preach IYCF messages to men and women
Communities exposed to IYCF messages from
media
Low-cost affordable CF food available at
the local market
Demand created Supply
Contribution to the national stunting reduction initiative

4
Another distinguishing feature of the A&T program in Ethiopia is a competitive small grants program to test new approaches for integrating IYCF prevention interventions into social safety net and nutrition rehabilitation programs. The grants target areas of endemic food insecurity. The grants are being implemented by the Relief Society of Tigray (REST), Concern, and a consortium comprising Save the Children, World Vision Canada, Nutrition Policy and Practice, and the Emergency Nutrition Network.
Private-sector markets are quite limited in Ethiopia. To date, most private food companies have focused on production of emergency/curative food rations, such as ready-to-use therapeutic foods (RUTF) for institutional buyers responding to humanitarian emergencies. Discussions are ongoing with local food companies to identify ways that they can profitably produce fortified complementary foods (FCF). To this end, A&T is supporting a “Willingness to Pay” study that will provide much needed data regarding the viability of a FCF through commercial channels.
A central tenet of A&T is a strong focus on measurement, learning, and evaluation (MLE). A&T’s two major MLE objectives are to
1. Document the impact, cost, and cost-effectiveness of IYCF interventions implemented at scale through A&T activities.
2. Generate learning on how to achieve and replicate A&T’s impact.
Impact and process evaluations have been designed to capture changes in key A&T indicators over time through the projects community-based interventions, and to understand how these changes are achieved. This report presents results from the baseline survey, conducted as part of the overall impact evaluation.
1.3 Objectives of the Impact Evaluation
The broad objective of the impact evaluation in Ethiopia is to measure the impact of A&T’s community-based interventions, delivered through the HEP platform, in the reduction of stunting and improvement of IYCF practices in two regions where the IFHP operates, namely Tigray and SNNPR.
Specific objectives of the baseline survey are
1. To assess the age-appropriate IYCF practices in the program areas
2. To assess the nutritional status (stunting, wasting, and underweight) in the program areas
3. To assess the reach and interaction (coverage) of frontline health workers through the HEP platform in the program areas
4. To understand the interaction between the A&T and IFHP programs and other nutrition focus interventions in the program areas
5. To determine the different level of factors (individual, household, community, and health system) influencing IYCF practice and undernutrition in the program areas
1.4 Structure of the Report
The report is structured as follows. Chapter 1 covers the overall nutrition scenario in Ethiopia, and provides a brief description of the A&T program and the objectives of the impact evaluation and

5
baseline survey. Chapter 2 describes the evaluation design, sampling methodology, the components of the questionnaires, the logistics of the fieldwork, an overview of the data analyses, and discusses some of the challenges in implementing the baseline survey. Chapter 3 presents sample characteristics. Chapter 4 presents findings related to the core A&T impact indicators, anthropometric outcomes, and IYCF practices. Chapter 5 presents details of the challenges and barriers related to breastfeeding and complementary feedings, as well as knowledge regarding IYCF and practice of ICYF-related behaviors. Chapter 6 describes current use of the existing health platform, on which A&T is built. Chapter 7 describes the caregivers’ health and nutritional characteristics, and access to resources, food security, economic status, and experienced shocks, as well as receipt of social assistance. Chapter 8 describes the community characteristics and availability of services. Chapter 9 presents frontline health worker (FHW) information, their knowledge about IYCF and motivation toward the jobs. Chapter 10 summarizes the overall results. The annex provides additional tables from each chapter.

6
2. Methods
2.1 Conceptual Framework
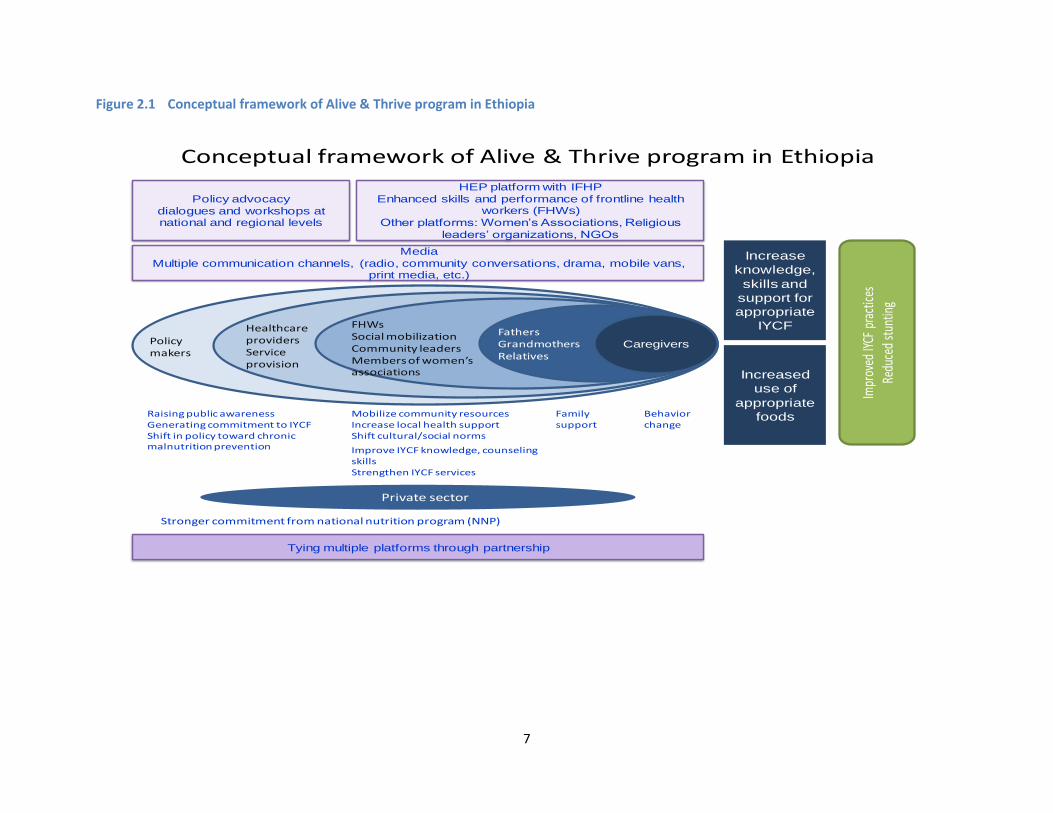
The conceptual framework for the Alive & Thrive interventions in Ethiopia is shown in Figure 2.1. The diagram illustrates all major components of the A&T program in Ethiopia. This conceptual framework highlights behavior change through interpersonal communication between mothers/caregivers and properly trained frontline health workers, which include health extension workers and volunteers. The interactions create awareness and equip mothers/caregivers with skills to take proper care of their children. Family support is an essential element for ensuring proper IYCF practices. Therefore, other elderly family members, particularly fathers and grandmothers, should support mothers/caregivers in IYCF practices. Along with this behavior change communication, social mobilization plays a significant role in building awareness among other household members, such as fathers, in-laws, school-going adolescents, as well as important people in the community, such as religious leaders, members of women’s associations, and other community leaders. They can play an important role in creating a favorable environment for the mothers/caregivers for proper IYCF practices.
Communications using media is another major component of A&T Ethiopia. Behavior change communications using media have been proved to augment behavior change through interpersonal communication. Also, the role of advocacy to formulate and/or implement favorable policy to create enabling policy environment for IYCF is crucial. Government strategies and national programs like the National Nutritional Program also play a critical role. A&T’s mandate is to improve IYCF practices using multiple platforms through improving mothers/caregiver’s knowledge and skills regarding IYCF practices and creating favorable environments for such practices. Mothers acquire knowledge and skills, try new behaviors, and adopt them to improve child growth.
2.2 Evaluation Design
2.2.1 Description of evaluation design
We use an “adequacy design” to evaluate the impact of Alive and Thrive’s (A&T) community-based interventions, delivered through the HEP in Ethiopia. This design constitutes pre- and post-assessments, without a comparison group. The large-scale, government-supported central health extension program does not lend itself to variations in programming, and therefore such an adequacy design, without a comparison group, is the most feasible in this context [4, 5]. Useful program information will be generated on the impact of A&T’s interventions that are built on this large-scale government program using econometric/statistical modeling.
In Ethiopia, A&T is expected to implement activities in four regions (Southern Nations, Nationalities, and People’s Region (SNNPR), Tigray, Amhara, and Oromia). Implementation of A&T interventions will be carried out in a phased manner. In the first year, the program has planned to launch the intervention in Tigray and SNNPR and in the second year move to other regions. The impact evaluation is being carried out in the regions (Tigray and SNNPR) where the program will be implemented in the first phase so as to ensure maximum exposure to A&T interventions. As a part of the impact evaluation, the baseline survey commenced in these two regions in June 2010 and will be followed three years later, in 2013, with an endline survey at exactly the same time of year. The design uses repeated cross-sectional surveys conducted in the same communities.
7
Figure 2.1 Conceptual framework of Alive & Thrive program in Ethiopia
Conceptual framework of Alive & Thrive program in Ethiopia
Caregivers
FathersGrandmothersRelatives
FHWsSocial mobilizationCommunity leaders Members of women’s associations
Healthcare providersService provision
Policy makers
Policy advocacy
dialogues and workshops at national and regional levels
Media
Multiple communication channels, (radio, community conversations, drama, mobile vans, print media, etc.)
HEP platform with IFHP
Enhanced skills and performance of frontline health workers (FHWs)
Other platforms: Women’s Associations, Religious
leaders’ organizations, NGOs
Impr
oved
IYCF
pra
ctice
sRe
duce
d st
untin
g
Increase
knowledge,
skills and
support for
appropriate
IYCF
Increased
use of
appropriate
foods
Tying multiple platforms through partnership
Stronger commitment from national nutrition program (NNP)
Raising public awarenessGenerating commitment to IYCFShift in policy toward chronic malnutrition prevention Improve IYCF knowledge, counseling
skillsStrengthen IYCF services
Mobilize community resourcesIncrease local health supportShift cultural/social norms
Family support
Behavior change
Private sector

8
There are two key objectives of the baseline survey. First, to assess the current status of key A&T impact indicators and gather data on factors that influence these indicators; second, to yield specific information to further shape the program as it evolves. The baseline survey was targeted to generate data on households, communities, and frontline health workers; further details are provided later in this chapter.
2.2.2 Sample size
In accordance with the program’s objectives, the impact evaluation is designed to measure changes in prevalence of stunting and core WHO-recommended indicators of IYCF (Annex A4.1). The sample size estimates for this evaluation were designed to detect changes in three age-specific indicators: 1) rates of exclusive breastfeeding among infants 0–5.9 months of age, 2) complementary feeding practices among children 6–23.9 months of age, and 3) stunting prevalence among children 24–59.9 months of age. The sample size estimates account for clustering at the woreda level.
Our sample size estimates took into account a relatively high level of clustering (rho = 0.01), a total of 75 clusters (enumeration areas [EA]), a one-sided test, a power of 80 percent, and a significance level of α = 0.05. The EDHS 2005 was used to determine current rates of stunting and IYCF practices. Based on these considerations, we arrived at the following estimates:
1,500 children aged 24–59.9 months of age is sufficient to detect a minimum decrease in stunting of 12 percent from 46.5 percent to 41 percent (a 5.5-percentage point decline)
900 children aged 6–23.9 months of age is sufficient to detect a minimum increase in the prevalence of complementary feeding practices by 20 percent (e.g., increasing dietary diversity from 33 percent to 39.5 percent [a 6.5-percentage point increase])
600 infants aged 0–5.9 months age is sufficient to detect a minimum increase in the prevalence of exclusive breastfeeding by 15 percent (from 49 percent to 57 percent [an 8-percentage point increase])
2.2.3 Sampling and selection of eligible households
All 89 woredas where IFHP operates in Tigray (35 woredas) and SNNPR (54 woredas) were included in the sampling frame. No distinctions were made while selecting the woredas with regards to the presence of other nutrition or child health-related programs, especially Community-based Nutrition (CBN), which is a government endeavor to improve nutritional status of children supported by the United Nations Children’s Fund (UNICEF) and the World Bank. However, additional information was collected on the presence of CBN and other nutrition projects in our survey communities; this will be taken into consideration when determining program impact. Because CBN operates in many of the same areas as IFHP, we will attempt to control for the presence of CBN in our statistical analyses as well as use this information in the “evaluation platform” approach that we will attempt to employ in Ethiopia [6]. This evaluation platform approach is most suitable for large-scale programs that are rapidly being scaled up, and is based on continuous monitoring of different levels of indicators, and gathers additional data before, during, and after the period to be assessed by multiple methods. In particular, this evaluation platform approach requires the linking of multiple data sources at the level of interest to permit analysis of program effectiveness.

9
Household sampling
A total of 3,000 children (Table 2.1) between 0 to 59.9 months were selected using two-stage cluster sampling. The primary sampling unit (PSU) or the first cluster is the rural enumeration areas (EA)1 from the IFHP woredas in the selected two regions. The EAs were selected using probability proportion to size (PPS) sampling in relation to the population of the EAs after listing all the EAs in the 89 woredas. The Central Statistical Authority (CSA) is the formal authority that maintains the list and the maps of all EAs in the country. Using the program that the CSA uses for the Demographic Health Survey (DHS), 75 EAs were selected from the targeted woredas. A total of 56 woredas (19 from Tigray and 37 from SNNPR) were covered through 75 EAs. A list of surveyed EA and respective woredas is included in Annex Table A2.3. In the second stage, a complete household listing with the number of children residing in each household in each selected cluster was developed. This listing was followed by identification of all the eligible candidates for the survey (mothers of those children under 60 months of age) that helped in forming three sampling frames: children aged 0–5.9 months, 6–23.9 months, and 24–59.9 months. From each sampling frame, study subjects were selected using systematic random sampling (SRS). Households selected to participate for one age category were not included in the other sampling frames, even if they had eligible children in the other desired age groups.
Table 2.1 Number of study subjects in each age group
Enumeration area (EA)
EAs total population assuming 200 HHs per
EA and HH size of 4 persons
Estimated population size of children
0 to 5.9 months
6–23.9 months
24–59.9 months
Total under 5
75 60,000 780 2,460 5,460 8,700
0.09 0.28 0.63
Actual proportion
600 900 1,500 3,000 Distribution of study sample
8 12 20 40 Study subjects per
EA
Field supervisors, who were trained in SRS, were responsible for the identification of the first participant and accordingly identified all “nth” participants of the survey from the survey sites. In each EA out of the 40 households, in order to meet the target sample size, 8 households in the 0–5.9 month category, 12 households in the 6–23.9 month category, and 20 households in the 24–59.9 month categories were sampled. If, in some EAs, the required number was not met, particularly in the 0–5.9 month category, we compensated for this by oversampling in some EAs. Annex Figure A2.1 shows the flowchart of the sampling strategy and the number of respondents in each age group.
Frontline health worker sampling
In the Health Extension Program (HEP), the key frontline health workers (FHWs) are the health extension workers (HEWs). In addition to HEWs, HEP has invested in developing community volunteers known as Volunteer Community Health Promoters (VCHP), who are trained by HEWs. This volunteer position, although not directly a part of the health system, is nevertheless integral to providing essential health
1 EAs are geographical units devised by the CSA, which consist of 150-200 households. The local administrative officials do
not use this term or geographical boundary. This is the smallest cluster used during DHS surveys.

10
care at the community level. In the health system, each kebele2 has one Health Post (HP) staffed by two HEWs. Each HEW is responsible for overseeing 5-6 VCHPs. At the woreda level, there is a supervisor either based at the woreda health office, or at the health clinic, who monitors and supervises the activities of HEWs. However, in some areas both in Tigray and SNNPR, if no HP is present, the HEWs are linked with the health centers.
In the survey, one HEW and one VCHP from each EA were selected randomly to be interviewed. In addition, the supervisor of the respective HEW was also interviewed. Thus, in total, 225 health workers were interviewed as part of this survey.
2.3 Data Collection Methods
2.3.1 Design and content of survey questionnaires
The UNICEF conceptual framework of child undernutrition (Annex Figure A2.2) informed the development of the survey questionnaires. The framework identifies the causes leading to undernutrition as immediate, underlying, and basic, with each level of factors having influence on the others. According to the framework, inadequate dietary intake and diseases are the immediate causes of undernutrition, which are, in turn, influenced by a range of underlying factors at the household and family levels. These are mainly insufficient or lack of access to food, clean water, and sanitation; health services; and inadequate maternal and childcare. The immediate causes are embedded within the larger societal factors or basic causes, which range from human and social capital, women’s status in society, political and social environment, etc. The impact surveys (both baseline and endline) aim at measuring and controlling for the immediate and some underlying factors, such as household food security, child-care-related support, access to safe water and sanitation, etc., all of which affect the outcomes of interest. Capturing and adjusting for these in analyses of impact help to enhance attribution of impact to the use of A&T interventions, especially in the context of a nonexperimental evaluation design.
At the program level, the community-based intervention is designed and embedded within the operational modality of IFHP. Based on the program impact pathway (PIP) of reaching the ultimate clients (mothers and caregivers) and diffusion of knowledge and skills from the health workers to the caregivers to bring about the desired behavioral changes, the baseline survey also assesses caregivers’ exposure to the program and the quality and frequency of contacts with the frontline health workers, as well as the extent of presence of other programs likely to influence IYCF-related practice of mothers/caregivers. Questions on exposure to A&T interventions as well as other similar interventions (e.g., CBN) were included. This will later enable dose-response and subgroup analyses.
The baseline survey used five separate questionnaires that aimed to capture elements along the program impact pathways. These tools, outlined below, include 1) a household questionnaire, 2) a staff questionnaire of HEWs, 3) a staff questionnaire of supervisors of HEWs, 4) a VCHP), and 5) a community questionnaire.
Household questionnaire
The household questionnaire is administered to the mother or the immediate caretaker of the index child. In order to make the questionnaire context-specific for Ethiopia, the draft version went through
2 Smaller administrative unit under woreda; the number of kebeles varies between woredas depending on the
geographical size of the woreda. In order to form one kebele, 2-5 EAs are required.
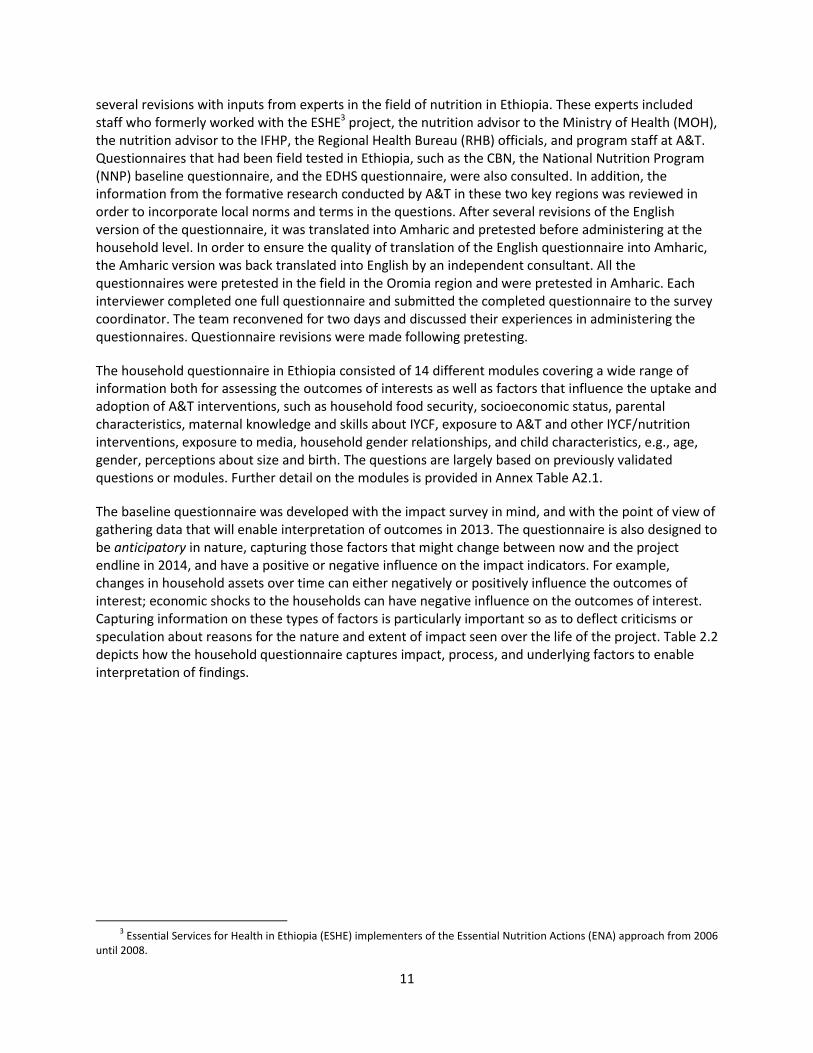
11
several revisions with inputs from experts in the field of nutrition in Ethiopia. These experts included staff who formerly worked with the ESHE3 project, the nutrition advisor to the Ministry of Health (MOH), the nutrition advisor to the IFHP, the Regional Health Bureau (RHB) officials, and program staff at A&T. Questionnaires that had been field tested in Ethiopia, such as the CBN, the National Nutrition Program (NNP) baseline questionnaire, and the EDHS questionnaire, were also consulted. In addition, the information from the formative research conducted by A&T in these two key regions was reviewed in order to incorporate local norms and terms in the questions. After several revisions of the English version of the questionnaire, it was translated into Amharic and pretested before administering at the household level. In order to ensure the quality of translation of the English questionnaire into Amharic, the Amharic version was back translated into English by an independent consultant. All the questionnaires were pretested in the field in the Oromia region and were pretested in Amharic. Each interviewer completed one full questionnaire and submitted the completed questionnaire to the survey coordinator. The team reconvened for two days and discussed their experiences in administering the questionnaires. Questionnaire revisions were made following pretesting.
The household questionnaire in Ethiopia consisted of 14 different modules covering a wide range of information both for assessing the outcomes of interests as well as factors that influence the uptake and adoption of A&T interventions, such as household food security, socioeconomic status, parental characteristics, maternal knowledge and skills about IYCF, exposure to A&T and other IYCF/nutrition interventions, exposure to media, household gender relationships, and child characteristics, e.g., age, gender, perceptions about size and birth. The questions are largely based on previously validated questions or modules. Further detail on the modules is provided in Annex Table A2.1.
The baseline questionnaire was developed with the impact survey in mind, and with the point of view of gathering data that will enable interpretation of outcomes in 2013. The questionnaire is also designed to be anticipatory in nature, capturing those factors that might change between now and the project endline in 2014, and have a positive or negative influence on the impact indicators. For example, changes in household assets over time can either negatively or positively influence the outcomes of interest; economic shocks to the households can have negative influence on the outcomes of interest. Capturing information on these types of factors is particularly important so as to deflect criticisms or speculation about reasons for the nature and extent of impact seen over the life of the project. Table 2.2 depicts how the household questionnaire captures impact, process, and underlying factors to enable interpretation of findings.
3 Essential Services for Health in Ethiopia (ESHE) implementers of the Essential Nutrition Actions (ENA) approach from 2006
until 2008.

12
Table 2.2 Impact, process, and underlying factors captured by household questionnaires (household)
Type of data Questionnaire modules/questions How used
Impact indicators Child anthropometry
WHO-recommended IYCF indicators
Change between baseline and endline used to assess trends in impact indicators
Process data—client outcomes
Maternal IYCF knowledge
Awareness, trial, and adoption of key recommended practices
Helps assess if IYCF knowledge shifted over project period, whether awareness of key recommended behaviors improved.
Process data—client access, exposure, and utilization of services
Antenatal and postnatal care and exposure to key messages
Home visits by HEWs and VCHPs and exposure to key messages
Use of preventive and curative care and exposure to key messages
Exposure to media messages
Use and exposure/access to markets
Helps assess if exposure to intended program channels is as expected. If coverage of services is low, exposure could be lower than expected, and can dilute impact. Will also allow assessment of impact trends by levels of exposure to interventions.
Influencing/underlying factors—child level
Appetite
Child development/milestones
Child illness and health
Helps assess if child-level factors modify influence of exposure to interventions. Child development milestones also function as an outcome/impact indicator in relation to IYCF practices.
Influencing/underlying factors—caregiver/maternal level
Education
Employment patterns, earnings, work hours, availability of childcare
Assets and control over assets
Physical and mental well-being
Caregiver well-being is an important element of intervention success. We would use this data to both control for underlying caregiver factors as well as analyze the influence of caregiver constraints on the ability to benefit from the A&T interventions.
Influencing/underlying factors—household level
Household SES (construction, assets)
Household economic shocks
Household food security
Economic shocks or changes in livelihoods over the course of the project could seriously undermine project impact. Additionally, improvements in SES over time could attribute greater impact to the project than is true. Therefore, data on SES, shocks, and food security are important, both to control for these influences in analyses of change over time, as well as to examine the influence of household-level constraints on the ability to benefit from A&T interventions
Health staff questionnaires
Three types of health staff questionnaires (HEW, VCHP, and supervisors) applied to health staff who are closest to the community or work in the community. These questionnaires were aimed at assessing three major issues: 1) frequency of interactions between health staff and caregivers, and avenues for these interactions; 2) content of the discussion between caregivers and health staff, and the time spent on IYCF-related discussions; and 3) knowledge and training received by the health staff on IYCF. In addition, the frontline health worker questionnaires capture the organizational context within which FHWs deliver their interventions. These are captured by inclusion of questions on perceptions related to their workload and their level of satisfaction with their overall job. This is particularly important to capture volunteer workers who receive no salary.
The roles of the supervisors are somewhat different from the other two types of health staff. They do not come in direct contact with caregivers, yet they are mainly responsible for providing training to the

13
HEWs and monitoring and supervising the training of volunteers, conducted by the HEWs. The questionnaires for supervisors, therefore, aim at capturing these interactions. Together, combining information from the HEW/VCHP questionnaires with those administered to the supervisors of individual staff in the survey will generate valuable data on the organization context for the FHWs prior to the introduction of A&T interventions in the health system.
Table 2.3 provides information on the types of data gathered on FHWs, and the rationale for inclusion of questions related to the different work environment domains.
Community questionnaire
The community questionnaire was administered to a group of community members to gather information on the contextual factors related to each community as well as to understand differences in community characteristics across the clusters (EA). This information at the community level is critical to control for externalities that could influence the outcome of the program. The community questionnaire provided information on the following: 1) general characteristics of the cluster: population, number of households’ languages, livelihood, season of food shortage, topography; 2) infrastructure: access to main road (both during dry and rainy season), electricity, access to clean water; 3) distance from the nearest major town, type of transportation used to reach this town; 4) access to the nearest market; 5) migration pattern; 6) social and food assistance, such as presence of productive safety net program, community-based nutrition program, etc.; 7) natural disaster occurring in the area during the three years before the survey; 8) availability and access to health services: health post, government hospital, private clinic, etc.; 9) availability of education facility: junior and high school, college.
2.4 Training of Personnel
2.4.1 Training of interviewers
IFPRI collaborated with the Addis Continental Institute of Public Health (ACIPH), a national institute with experience in teaching, research, and implementing health and nutrition surveys to conduct the baseline survey. The organization’s credentials include managing two CBN survey rounds for MoH/UNICEF and other large-scale surveys in the area of reproductive health and infectious disease. ACIPH also has several faculty members with public health, epidemiology, and bio-statistics background who contributed to fine-tuning the proposal and in developing the sampling strategy. In addition, ACIPH facilitated the process of obtaining in-country IRB clearance, formatting and translating the questionnaires, hiring and training of the data enumerators, developing the sampling frame and identifying the clusters, creating the household lists, identifying the households for data collection, and data entry and cleaning. The overall activities were closely monitored and supervised by the IFPRI MLE coordinator based in Addis Ababa and the IFPRI MLE team.
A total of 60 data enumerators and 15 supervisors were chosen by ACIPH for the survey. Most of these data collectors had been working with ACIPH for two to three years and had taken part in similar household surveys.
A three-week-long training program was arranged by ACIPH to train the enumerators and supervisors. There were four trainers (two from ACIPH faculty, two independent consultants who worked with ACIPH on CBN training). The director of ACIPH and the IFPRI MLE coordinator supervised the overall training process. The training was conducted in Amharic and a detail training manual based on the questionnaire was developed in Amharic and translated into English. In addition to the training manual, a detailed field

14
manual was developed in Amharic and English, which covered preparation for fieldwork, roles of field data collectors, roles of the supervisors, EA demarcation, listing and identification of households, procedures for contacting households, details on anthropometric measurements, completion of questionnaire, etc.
Table 2.3 Overview of the domains covered in the A&T frontline health worker questionnaires
Domain/type of data collected Rationale for inclusion How used in evaluation
Demand for services
Demand for services of the FHW partially influences coverage and reach of the interventions
Establish baseline for demand; evaluate shifts in demand for services as part of documenting program impact pathways
Workload and time commitments (actual and perceived)
Information on workload and time commitments are needed for three purposes: (1) to understand demands made by A&T on workload and time commitments; (2) to understand how perceptions of workload, in addition to actual workload, influence FHW motivation and performance; and (3) to use data on time commitments, and shifts in time commitments and activities due to the interventions in the costing studies.
Establish baseline. Used in costing component to estimate changes in time allocations due to A&T
Time on the job and training
Training and time on the job are both influencers of job performance. In particular, training is known to be a motivating influence on FHWs.
Establish baseline, and document exposure of FHWs to training for process evaluation.
Motivation and job satisfaction
A number of factors influence FHW motivation. These include factors that are extrinsic to the FHW as well as intrinsic motivators. Motivation is strongly related to job performance; therefore, capturing perceptions related to motivation and motivators is important both at baseline and endline as well as in the interim (process evaluation). Job satisfaction is also an influence on job performance, and therefore important to capture.
Establish baseline; document shifts in motivation/job satisfaction due to A&T inputs such as training, incentives, supportive supervision.
Technical knowledge and skills
A basic prerequisite for delivering the franchise model successfully is knowledge of FHWs about the core topics to be covered in A&T that they implement in the field. We included the same IYCF knowledge assessments for FHWs and caregivers in our questionnaires. Empirical evidence indicates that the amount of correct knowledge that is shared by FHWs and beneficiaries influences the probability that beneficiaries will try new behaviors.
Establish baseline; document improvements/shifts in technical knowledge due to A&T inputs
Self-efficacy and confidence
Self-efficacy and confidence is a basic driver of job motivation and job performance.
Establish baseline; document improvements/shifts due to A&T inputs and assess role of confidence/self-efficacy in performance of FHWs
Supervisory support (actual and perceived)
Supportive supervision is documented to be critical in FHW performance, motivation and training.
Establish baseline; document improvements/shifts due to A&T inputs and assess/document role of supervisory support in performance of FHWs implementing A&T interventions
Basic demographics
Factors such as age, education, prior experience, etc., influence worker performance and effectiveness. In addition, since FHWs are often voluntary positions, ensuring adequate information on their sources of income and other employment helps shed light on socio-demographic and economic constraints to their performance.
Control for basic demographics in analyses of factors, including A&T inputs that lead to changes in FHW performance.

15
The participants were divided into two groups and trained separately by two sets of trainers in order to provide more personal attention to each trainee. Participants role-played each module after being trained in three consecutive modules. There were two types of role plays or mock interviews. First, all trainees were paired—one took the role of the interviewer and the other, the interviewee. Second, a pair played the roles of the caregiver and the interviewer in front of the class, while the rest of the participants observed. After each role-playing session, there were discussion sessions with comments from the audience and participants as well as the trainers. At the end of the training, all enumerators took part in role-playing and mock interviews together in order to ensure consistency.
Special training was conducted for the field supervisors covering the staff and community questionnaires. In addition, the supervisors received training and guidance on how to conduct field supervision. An expert within ACIPH who has worked with CSA conducted a session on demarcation of EAs. The supervisors were mainly responsible for demarcation of EAs. They were given specific guidelines on demarcation procedures. Demarcation of EAs is especially critical, as in some areas, specifically in the Tigray region, houses are sparsely placed and can extend over a wide area of a mountainous region. A statistician from ACIPH covered a session on sampling, household listing, and choosing households with identification of an index child.
After training of the data enumerators and pretesting of questionnaires, the team reconvened at the training center for two days and shared their field experiences from the pretest. The roles and responsibilities of the data enumerators and supervisors are included in Annex Table A2.2.
2.4.2 Training and standardization in anthropometric measurements
The supervisors were experienced in taking anthropometric measurements, particularly because they had recently been involved in CBN survey rounds. Nevertheless, they underwent a full standardization process to ensure precision and reliability of anthropometric measurements using the FANTA protocol [7]. For weight measurement, UNICEF provided SECA scales. For length and height measurement, UNICEF also provided boards, which were locally made. In addition, ACIPH had height boards made for mothers’ height measurements. At the training center, supervisors practiced taking measurements on dummies. The research coordinator at ACIPH took the measurement first and against his measurements, other supervisor’s anthropometric measures were compared for precision and accuracy.
During the pretesting of the questionnaire in the field, a standardization exercise was conducted using children in the three different age groups that were sampled in the survey. During this process, the research coordinator, trainers, and the supervisors first took measurements to set up standards. The enumerators were divided into four groups and took part in the standardization process. Each data collector took measurements of six children (two from each age group) and submitted their data to the survey coordinator of ACIPH. The data were entered into a spreadsheet and, using FANTA’s methods, accuracy and precision of each data collector was estimated. Based on this result, a pool of data enumerators (30) with the right precision were selected to take anthropometry measurements in the field.

16
2.5 Fieldwork Logistics
2.5.1 Composition of survey team
Before the field data enumerators left for the field, ACIPH worked on the team composition (Annex Figure A2.3). Annex Table A2.2 lists the responsibilities of each person involved in the survey, discussed below.
The fieldwork started on June 13, 2010, in Tigray region. After being in Tigray for three weeks and completing the data collection in 26 EAs, the field team returned to Addis Ababa. After recuperating and taking part in a reorientation with the headquarters (HQ) team at ACIPH, the field team started the second phase of data collection on August 8, 2010, in SNNPR. Data collection was completed on September 24, 2010.
2.5.2 Administration of the household survey and anthropometric measurements
The fieldwork consisted of two phases: 1) a preparatory phase and 2) a data collection phase. The preparatory phase included liaising with the RHBs and woreda or zonal health offices, selection of translators,4 identification of a guide to take the team to the EA, demarcation of the EA and introduction and rapport building with the community leaders, household listing, constructing a household sampling frame and choosing households. Prior to leaving for data collection, an introductory letter from A&T, signed by the Senior Country Director and addressed to the RHBs in both regions, was given to ACIPH. In addition, the RHBs were informed ahead of time of the data collection and were provided with a list of EAs.
During the data collection phase, the supervisors guided the interviewers on how to find the houses to be interviewed. The interviewers were instructed to visit all the households they were responsible for. The interviewer made every attempt to reach the mother of the index child, or the primary caregiver if the mother was away for a long period of time or if she were deceased. If no one was at home, the interviewers had specific guidelines on how many visits (three visits were recommended before marking “not home”) to make and when to make them. The field guide also provided instructions related to the interviews (such as where to probe, recording multiple responses, correction of mistakes, checking the completeness of the questionnaires before leaving the house, etc.).
Anthropometric measurements were only taken by the assigned enumerators with assistance from supervisors. One SECA scale, one length board for children, and one height board for the mothers were available for each team. If the child was unable to stand still on the scale on its own, or was frightened or upset, the mother was first weighed alone and then weighed while holding the child in her arms. The scale automatically computed the child’s weight, after taking the mother’s weight alone. Extra scales were available with the supervisors’ in case of breakdown, loss, or theft. Length measurements for children under 2 years of age was taken in recumbent position and height measurements were taken standing up for children 2 years of age or older.
4 In the rural areas, people do not speak Amharic. Thus, a free translator was used to translate the questions to the
mother. The field supervisors with assistance from the woreda officials chose the translators based on a set of criteria.

17
2.5.3 Administration of the community and health staff questionnaires
A group of community leaders were interviewed to complete the community questionnaire. In each EA, the group consisted of a kebele leader, a women’s representative, a religious leaders, etc. In total, 75 community groups were interviewed, one from each community.
One HEW and one VCHP from each EA were selected randomly to be interviewed. In addition, the supervisor of the respective HEW was also interviewed. Thus, in total, 225 health workers were interviewed for this survey.
2.5.4 Supervision and quality control
There were two levels of supervisors, ensuring quality of the data collection: field supervisors and expert supervisors (researchers). The field supervisors were responsible for observing interviewers throughout the surveys and carrying out field editing. By checking the interviewers’ work regularly, the field supervisor could ensure that the quality of the data collection remained high throughout the data collection period. Every evening, the supervisors checked the questionnaires for completeness of the questionnaires and specifically checked a number of critical questions. If it was determined that there were gaps, the interviewers were sent back to the households before leaving the EA. Each field supervisor observed at least four interviews per EA and noted down any problems, and later on discussed these with the enumerators. Each supervisor paid special attention to 1) if the enumerator asked for the date of birth of the child? Did s/he ask to see written documentation (i.e., birth certificate)? If no written documentation, did s/he use the local calendar to make sure the age is accurate? 2) Did s/he follow the skip patterns and question sequences correctly? 3) Did s/he probe for more information when directed? The supervisors also monitored the anthropometric measurement as much as possible and randomly spot-checked and remeasured a subgroup of children to compare measurements. The expert supervisors of the study also got out in the field for supervision. Based on the EA list, the expert supervisors made random supervision of the field survey sites. At least 20 percent of the enumeration areas were covered for expert supervision. During this period, expert supervisors made sure that the survey was going as planned and standards were being followed.
2.5.5 Fieldwork constraints
There were some challenges common to both regions during the data collection process that required prompt action and thus have been overcome in a timely fashion so that the data collection process would not be severely hampered.
1. The time needed to complete the household questionnaire was long, especially at the beginning of the survey. Mothers were observed to be a bit uncomfortable to be interviewed in the middle of their household chores. The interviewers waited until the mothers finished the chores.
2. Some EAs were quite remote and data enumerators could not come back to the town to spend the night or to have food, thus they had to camp out inside the EAs and the supervisors returned to the town every three or four days to get food and other necessary items.
3. Taking height measurement for children less than two years of age often proved to be difficult. The teams had been well trained and were instructed on how to measure these children, and how to establish an environment conducive to taking these measurements.

18
4. Mothers who worked in the fields or on market days (once or twice a week) needed to be reached early or late in the day.
5. On occasions (e.g., a funeral, market days, and Christian holidays), all the mothers from an EA would be absent for at least half a day, resulting in delays in data collection.
6. There were circumstances when the survey teams had to replace the selected EA while undertaking the fieldwork in the two regions. The major reasons were 1) inaccessibility; if an EA was an hour-on-foot walk off the road and more than a one-hour drive from the woreda center, and 2) security; one selected site was near the Ethiopia-Eritrea border. In Tigray, two selected EAs were replaced by new EAs based on these criteria. In SNNPR, one EA was replaced due to
tribal wars, which resulted in migration of many of the households.
2.5.6 Data management
The data management consisted of three stages: 1) developing a data entry template; 2) entering and cleaning data; and 3) data analysis.
Developing a data entry template: A data entry template was developed by ACIPH data management experts. This was based on the Amharic version of the questionnaire using EPI-Info. The data entry program was shared with the IFPRI team and reviewed at IFPRI HQ.
Date entry and cleaning: After all the parties reached an agreement on the template, the data entry started with the Tigray questionnaires after completion of data collection in that region. Data entry clerks participated in a five-day data entry training. As a quality control measure, the data were double entered and the two data sets were matched, using the report produced by the software. Based on this report, the data were cleaned at ACIPH. The cleaned data were later imported into STATA for analysis. Cleaned raw data were sent to IFPRI HQ for further review of consistency and for logical and range checks. Clarifications were sought from ACIPH in an ongoing manner, and corrections made to the dataset based on further review of questionnaires or other data entry checks, as needed.
2.5.7 Data analysis
The response rate was very high, at over 98 percent. After data cleaning, select variables were created to capture the key A&T impact indicators. For anthropometric outcomes and for IYCF practices, WHO-recommended methods were used to create the impact indicators. Means and proportions were estimated from individual-level data, and results were generated for the entire sample as well as for the two survey regions, Tigray and SNNPR. No statistical testing was carried out comparing baseline results in Tigray and SNNPR. The evaluation design pools data from both regions to estimate program impact. Statistical testing will be carried out to compare changes between endline results and baseline results. All analyses were done using Stata 11.
2.5.8 Limitation of the survey
This study has a number of limitations. First, this is a repeated cross-sectional study that does not ensure tracking of the IYCF practices and child growth over time; however, it is the most realistic approach to evaluation in the context of large-scale programs. Second, information collected from respondent mothers/caregivers was based on their recall for various time periods. Longer recall period might introduce bias, particularly for age, infant feeding practices, or other retrospective data relying on memory of a past event. Third, the sample was drawn only from IFHP woredas in two regions of the

19
country, thus the survey was not even representative of those regions. Fourth, data on EBF and introduction of complementary food were collected by 24-hour recall. If something else was followed beyond the recall period, it was not captured in this study. Fifth, findings suggest that there has been a big gap between knowledge and practice of IYCF. As practice data were collected by recall, it is likely that some memory loss potentially biased the findings downward.

20
3. Results: Sample Characteristics
3.1 Variables
This section describes the distribution of sample population, household member characteristics, and the age and sex distribution of the target children within the household. It is important to re-emphasize here that the survey was conducted in areas selected from IFHP sites. Thus, the distribution may not be representative of the region as a whole in terms of many of the characteristics. We collected information on all members of the household, including their relationship to the respondent mother, age, sex, marital status, occupation, education, and religion. From this information, we present household demographic composition, including mean household member in different age groups as well as parent’s key characteristics. Distribution of the age and sex of the children in the surveyed households are also presented, with child age shown in six-month age groups.
3.2 Results of Sample Characteristics
Tables 3.1a and 3.1b present the household demographic composition of the two surveyed regions. The regions were similar in terms of household size and mean number of household members in different age groups. The average household size of 6 is higher than what was reported in EDHS 2005 (5 people per household); 2.5 household members were of working age.
Table 3.1a Household composition, by region
Tigray SNNPR All
(n = 1,040) (n = 1,952) (n = 2,992)
Characteristics Mean SD Mean SD Mean SD
Age of household head 40.0 10.7 35.1 8.9 36.8 9.8 Household size 6.1 2.0 5.9 2.0 6.0 2.0 Number of adults (≥ 18 years) 2.4 0.8 2.3 0.7 2.3 0.7 Number of children < 18 years of age 3.7 1.7 3.7 1.8 3.7 1.8 Number of children < 5 years of age 1.4 0.6 1.5 0.6 1.5 0.6 Number of dependents
a 3.4 1.5 3.4 1.6 3.4 1.5
Number of working age membersb 2.7 1.0 2.5 1.0 2.5 1.0
Dependency ratioc 1.4 0.7 1.5 0.8 1.4 0.7
Percent Percent Percent
Female-headed householdsd 14.0 6.2 8.9
Respondent mother-headed householdse 10.2 5.5 7.1
a Dependents = household members less than 15 years of age or over 64 years of age.
b Working age members = household members between 15 and 64 years of age.
c Dependency ratio = number of household members < 15 or > 64) / number of members 15-64 years.
d Any female member of the household, including respondent mothers as the household heads
e Only respondent mothers as the household head.
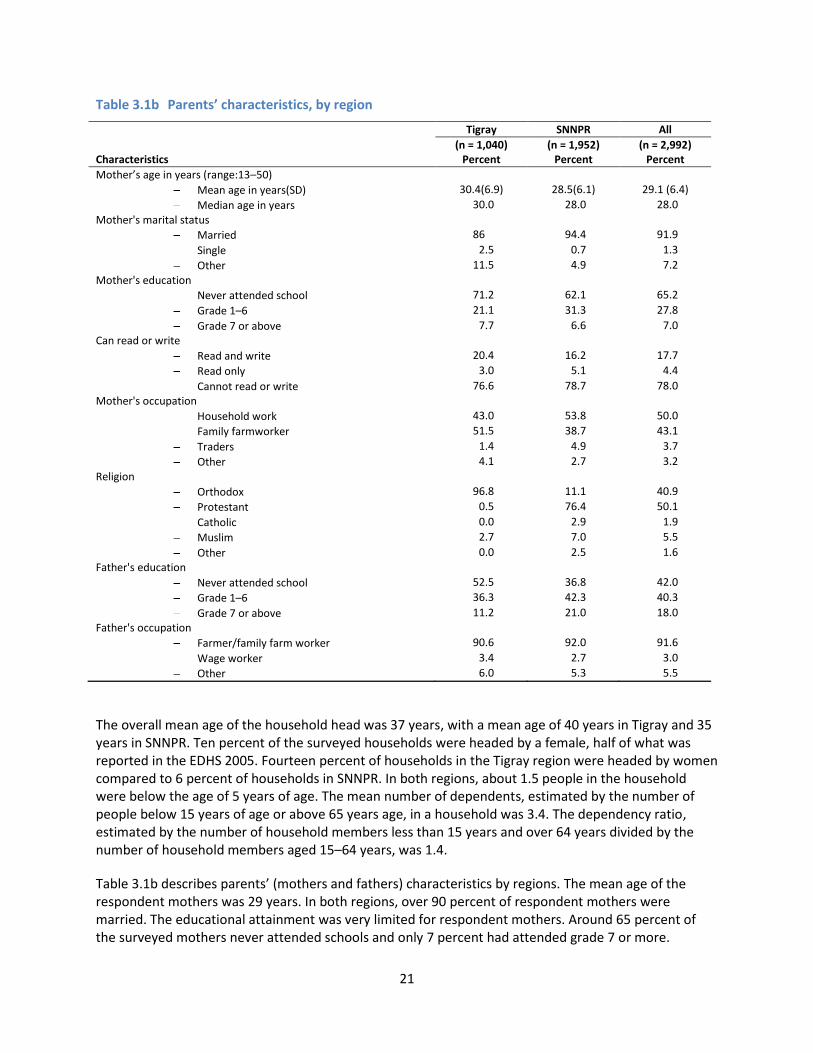
21
Table 3.1b Parents’ characteristics, by region
Tigray SNNPR All
(n = 1,040) (n = 1,952) (n = 2,992) Characteristics Percent Percent Percent
Mother’s age in years (range:13–50)
Mean age in years(SD) 30.4(6.9) 28.5(6.1) 29.1 (6.4)
Median age in years 30.0 28.0 28.0
Mother's marital status
Married 86 94.4 91.9
Single 2.5 0.7 1.3
Other 11.5 4.9 7.2
Mother's education
Never attended school 71.2 62.1 65.2
Grade 1–6 21.1 31.3 27.8
Grade 7 or above 7.7 6.6 7.0
Can read or write
Read and write 20.4 16.2 17.7
Read only 3.0 5.1 4.4
Cannot read or write 76.6 78.7 78.0
Mother's occupation
Household work 43.0 53.8 50.0
Family farmworker 51.5 38.7 43.1
Traders 1.4 4.9 3.7
Other 4.1 2.7 3.2
Religion
Orthodox 96.8 11.1 40.9
Protestant 0.5 76.4 50.1
Catholic 0.0 2.9 1.9
Muslim 2.7 7.0 5.5
Other 0.0 2.5 1.6
Father's education
Never attended school 52.5 36.8 42.0
Grade 1–6 36.3 42.3 40.3
Grade 7 or above 11.2 21.0 18.0
Father's occupation
Farmer/family farm worker 90.6 92.0 91.6
Wage worker 3.4 2.7 3.0
Other 6.0 5.3 5.5
The overall mean age of the household head was 37 years, with a mean age of 40 years in Tigray and 35 years in SNNPR. Ten percent of the surveyed households were headed by a female, half of what was reported in the EDHS 2005. Fourteen percent of households in the Tigray region were headed by women compared to 6 percent of households in SNNPR. In both regions, about 1.5 people in the household were below the age of 5 years of age. The mean number of dependents, estimated by the number of people below 15 years of age or above 65 years age, in a household was 3.4. The dependency ratio, estimated by the number of household members less than 15 years and over 64 years divided by the number of household members aged 15–64 years, was 1.4.
Table 3.1b describes parents’ (mothers and fathers) characteristics by regions. The mean age of the respondent mothers was 29 years. In both regions, over 90 percent of respondent mothers were married. The educational attainment was very limited for respondent mothers. Around 65 percent of the surveyed mothers never attended schools and only 7 percent had attended grade 7 or more.

22
Mothers were asked if they could write or read in their own languages; only 18 percent of mothers could. While one-half of all mothers reported being a housewife, a large percentage (51.5 percent in Tigray and 38.7 percent in SNNPR) of mothers also reported working as farmers. A very small percentage of mothers (3.7 percent) reported working as a trader.
Educational level of the fathers was also low, with 52.5 percent in Tigray and 36.8 percent in SNNPR reporting never attending school. Over 90 percent of fathers reported farming as their main occupation.
The two regions were very different in terms of mothers’ religion. Over 95 percent of the respondents reported their religion as Orthodox Christian in Tigray, while only 11 percent of the respondents in SNNPR were Orthodox. Seventy-six percent of the respondents in SNNPR were protestant. Five percent of the total respondents were Muslim.
The target children of this survey were 0-59.9 month of age. Table 3.2 shows the distribution of the children in the surveyed population by age and sex. Twenty percent of the total children were under six months of age. The reason for this higher representation in the lowest age group is because the survey was designed to over-represent this particular group in order to observe exclusive breastfeeding practice in infants less than 6 months of age. Thirty percent of children were aged 6-23 months, and an additional 50 percent were aged 24-59 months. A little over half of the children in the surveyed households were male.
Table 3.2 Child age and sex distribution, by region
Tigray SNNPR All
(n = 1,040) (n = 1,952) (n = 2,992) Age group (months) Percent Percent Percent
0–5.9 19.8 20.6 20.3 6-11.9 9.9 11.7 11 12-17.9 12.6 11 11.6 18-23.9 7.5 6.7 6.9 24-29.9 11.6 10.9 11.1 30-35.9 9.7 8.9 9.2 36-41.9 11.2 11 11.1 42-47.9 6.4 7.2 6.9 48-53.9 6.5 7 6.8 54-59.9 4.7 4.7 4.7 Sex
Male 53.6 50.4 51.5 Female 46.4 49.6 48.5

23
4. Results: Key Impact Indicators
4.1 Variables
Child feeding practices are described using the WHO-recommended IYCF indicators. These indicators are widely accepted and used to capture optimal feeding practices in populations [8]. Optimal IYCF practices captured by these indicators cover a range of practices, and criteria to assess the adequacy of those practices. This includes age-appropriate breastfeeding practices (timing, duration, and exclusivity), and timely and adequate consumption of high quality complementary foods. The eight core IYCF indicators as well as six optional indicators are calculated based on the WHO guidelines [8].
Children’s weight and height measurements were used to derive Z-scores by comparing each child’s anthropometric measurements to the 2006 WHO child growth standards reference for his/her age and gender. The three indicators created were height-for-age Z-score (HAZ), weight-for-age Z-score (WAZ), and weight-for-height Z-score (WHZ). Stunting is defined as HAZ < -2 Z-scores; underweight is defined as WAZ < -2 Z-scores; and wasting was defined as WHZ < -2 Z-scores [9].
Results on means and proportions were generated for the entire survey sample as well as separately for each region. All analyses were done using Stata 11 (StataCorp LP, Texas, USA).
In this set of results, we first present data on the core A&T impact indicators, using age groups appropriate to each indicator. We then present further descriptive analysis on the anthropometric outcomes as well as IYCF practices.
4.2 Results: Core A&T Impact Indicators
The status of the key A&T impact indicators, i.e., stunting among children 24 months and above, and the eight WHO recommended IYCF indicators, is shown in Table 4.1. The definition of the core WHO-recommended IYCF indicators is presented in Annex Table A4.1. Results are shown for the entire baseline sample as well as for the two survey regions, Tigray and SNNPR.
Stunting
The results reinforce the EDHS 2005, which shows that the levels of stunting are high in both regions, with over 50 percent of children stunted. In our survey, 56 percent of children aged 24–59.9 months of age are stunted.
Core A&T Impact Indicators
WHO IYCF core indicators are also presented in Table 4.1, and Annex Table A4.1 presents detailed descriptions of these indicators. IYCF practices were suboptimal; breastfeeding-related practices were better than complementary feeding-related practices. Breastfeeding was initiated within the first hour of birth for two-thirds of all children, and over 70 percent of children less than 6 months of age were classified as being exclusively breastfed. Breastfeeding through the first year of life was a near universal practice. Complementary feeding practices were very poor in both regions. Only a little over one-third of children were being fed any solid or semisolid foods in the 6–8.9 months age window. Dietary diversity was very low (6.3 percent) as is the consumption of iron-rich foods (2 percent). Almost half of all children met their minimum desired meal frequency, although the percentage consuming a minimally

24
acceptable diet (a composite indicator of diet diversity and meal frequency) was very low at less than 5 percent. There were slight variations across regions in all key A&T indicators. Most notably, a significantly higher proportion of children initiated breastfeeding within the first hour after birth in SNNPR, and significantly higher proportion of children were fed solid or semisolid foods in the 6–9.9 months age group in Tigray.
Table 4.1 Core impact indicators, by region
Age-group (months) Tigray SNNPR All
Nutritional status of children Prevalence of stunting among children (n = 1,482) 24–59.9 60.4 53.5 55.9
Core IYCF indicators Early in initiation of breastfeeding (within I hour of birth) (n = 1,481) 0-23.9 52.4 74.3 66.7 Exclusive breastfeeding among children under 6 months (n = 606) 0–5.9 68.5 74.5 72.4 Continued breastfeeding at 1 year (12-15 months) (n = 209) 12-15.9 98.6 97.8 98.1 Introduction of solid, semisolid food or soft foods (between 6-8.9 months) (n = 171) 6-8.9 48.4 31.2 37.4 Minimum dietary diversity (≥ 4 food groups) (n = 875) 6–23.9 4.9 7.0 6.3 Minimum meal frequency
a (n = 875) 6–23.9 51.8 42.3 45.6
Minimum acceptable dietb
(n = 875) 6–23.9 4.2 4.8 4.6 Consumption of iron-rich food
c (n = 875) 6–23.9 2.9 1.6 2.1
a Minimum is defined as: 2 times for breastfed infants 6–8 m; 3 times for breastfed children 9–23 m; 4 times for non-breastfed
children 6–23 m. “Meals” include both meals and snacks and frequency is based on caregiver report. b Acceptable diet is defined for who had at least the minimum dietary diversity and the minimum meal frequency during the
previous day c Iron-rich or iron-fortified foods include flesh foods, commercially fortified foods especially designed for infants and young
children which contain iron, or foods fortified in the home with a micronutrient powder containing iron
In subsequent analyses, we will explore the data on household diet diversity and maternal diet diversity to assess the extent to which poor child diets are attributable to household food availability and household diets versus to food and feeding choices made by caregivers for their infants and children.
4.3 Results: Anthropometric Outcomes
4.3.1 Mean anthropometric indices
Tables 4.2a and 4.2b present mean HAZ, WAZ, and WHZ scores by region. Overall, children had mean HAZ, WAZ, and WHZ scores that were lower than the median of the reference population standards, with mean HAZ, WAZ, and WHZ scores of -1.69, -1.12, and -0.22, respectively. The Z-scores for all the measures were found to be lower in Tigray than in SNNPR (Figures 4.1 – 4.4).
Anthropometric indices by region
Table 4.2a also shows HAZ, WAZ, and WHZ by different age groups relevant for specific IYCF indicators. It is evident from Figure 4.1 that growth faltering appears to occur early in life. The mean HAZ of children less than 3 months of age is -0.3 Z-scores, and a rapid deterioration in nutritional status continued until approximately 21–23 months of age, at which point HAZ plateaus at approximately -2.1 Z-scores (Table 4.2a and Figure 4.1). Mean WAZ and WHZ also declined rapidly with age during the first 6–11 months of life. WAZ continued to decrease slightly after the first year of life. There is a gradual improvement in WHZ between the first and second years of life.

25
Anthropometric indices by gender
Table 4.2b compares HAZ, WAZ, and WHZ between male and female children in different age groups. There exists a noticeable gender difference in the anthropometric indicators (Figures 4.5 – 4.7). In general, male children had slightly worse nutritional status compared to their female counterparts; mean HAZ and WAZ were lower in males than females for most of the period of infancy and early childhood. A similar pattern was not observed for WHZ. Annex Table A4.4 shows that the differences between genders in terms of HAZ and WAZ were statistically significant.
Table 4.2a Comparison of nutritional status outcomes, by regions and age groups
Tigray (n = 1,040)
SNNPR (n = 1,952)
ALL (n = 2,992)
Nutritional status indicator Mean SD Mean SD Mean SD
Height-for-age Z-score (HAZ)
All -1.8 1.5 -1.6 1.7 -1.7 1.7
0–5.9 months -0.5 1.4 -0.5 1.9 -0.5 1.7
6–23.9 months -1.8 1.5 -1.6 1.6 -1.7 1.6
24-59 months -2.2 1.2 -2.1 1.6 -2.1 1.5
Weight-for-age Z-score (WAZ)
All -1.4 1.2 -1.0 1.3 -1.1 1.3
0–5.9 months -0.6 1.3 -0.2 1.3 -0.3 1.3
6–23.9 months -1.6 1.2 -1.0 1.3 -1.2 1.3
24-59 months -1.6 1.0 -1.3 1.3 -1.4 1.2
Weight-for-height Z-score (WHZ)
All -0.6 1.2 -0.1 1.3 -0.2 1.3
0–5.9 months -0.4 1.5 0.2 1.7 0.0 1.6
6–23.9 months -0.8 1.2 -0.2 1.2 -0.4 1.3
24-59 months -0.5 1.1 -0.1 1.1 -0.2 1.1
Table 4.2b Comparison of nutritional status outcomes, by gender
Male (n = 1,117)
Female (n = 2,123)
All (n = 2,992)
Nutritional status indicator Mean SD Mean SD Mean SD
Height-for-age Z-score (HAZ)
All -1.8 1.7 -1.6 1.6 -1.7 1.7
0–5.9 months -0.5 1.8 -0.5 1.6 -0.5 1.7
6–23.9 months -1.8 1.6 -1.5 1.5 -1.7 1.6
24-59 months -2.2 1.4 -2.1 1.5 -2.1 1.5
Weight-for-age Z-score (WAZ)
All -1.2 1.3 -1.0 0.4 -1.1 1.3
0–5.9 months -0.4 1.4 -0.3 1.3 -0.3 1.3
6–23.9 months -1.3 1.2 -1.0 1.3 -1.2 1.3
24-59 months -1.5 1.2 -1.3 1.2 -1.4 1.2
Weight-for-height Z-score (WHZ)
All -0.3 1.3 -0.2 1.3 -0.2 1.3
0–5.9 months 0.0 1.7 0.0 1.6 0.0 1.6
6–23.9 months -0.4 1.2 -0.4 1.3 -0.4 1.3
24-59 months -0.3 1.1 -0.2 1.1 -0.2 1.1
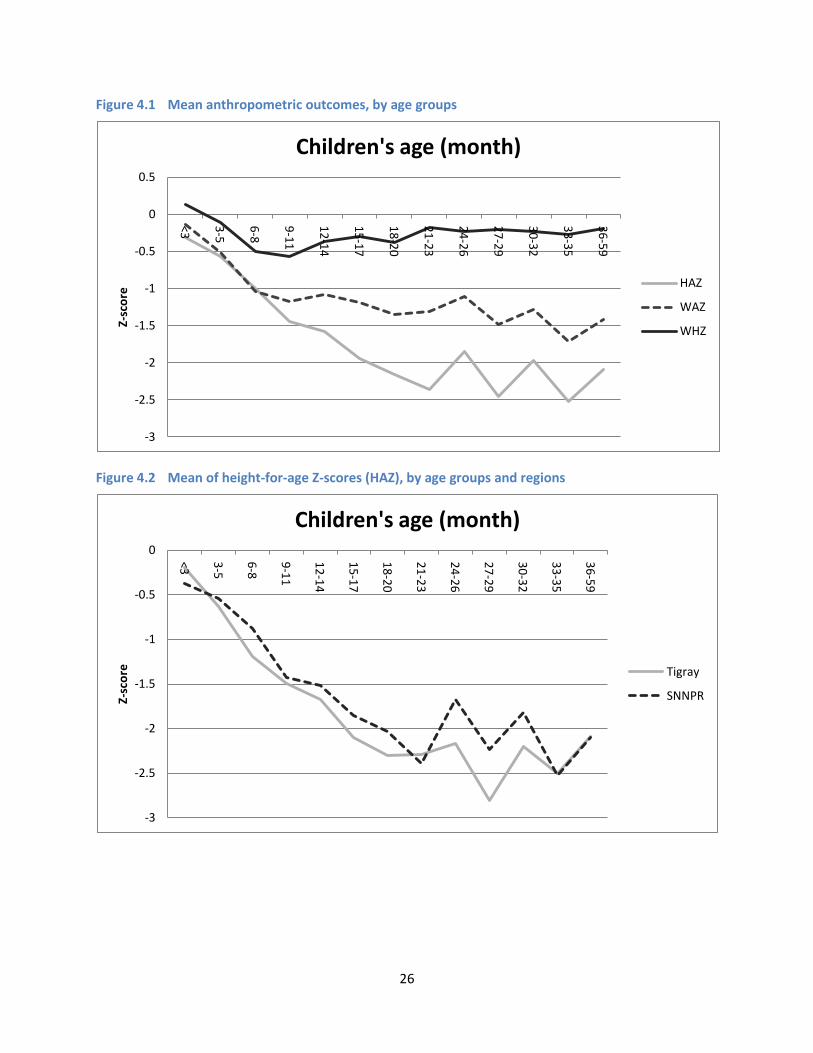
26
Figure 4.1 Mean anthropometric outcomes, by age groups
Figure 4.2 Mean of height-for-age Z-scores (HAZ), by age groups and regions
-3
-2.5
-2
-1.5
-1
-0.5
0
0.5
<3
3-5
6-8
9-1
1
12
-14
15
-17
18
-20
21
-23
24
-26
27
-29
30
-32
33
-35
36
-59
Z-sc
ore
Children's age (month)
HAZ
WAZ
WHZ
-3
-2.5
-2
-1.5
-1
-0.5
0 <3
3-5
6-8
9-1
1
12
-14
15
-17
18
-20
21
-23
24
-26
27
-29
30
-32
33
-35
36
-59
Z-sc
ore
Children's age (month)
Tigray
SNNPR

27
Figure 4.3 Mean of weight-for-age Z-scores (WAZ), by age groups and regions
Figure 4.4 Mean of weight-for-height Z-scores (WHZ), by age groups and regions
-3
-2.5
-2
-1.5
-1
-0.5
0
0.5
<3
3-5
6-8
9-1
1
12
-14
15
-17
18
-20
21
-23
24
-26
27
-29
30
-32
33
-35
36
-59
Z-sc
ore
Children's age (month)
Tigray
SNNPR
-3
-2.5
-2
-1.5
-1
-0.5
0
0.5
<3
3-5
6-8
9-1
1
12
-14
15
-17
18
-20
21
-23
24
-26
27
-29
30
-32
33
-35
36
-59
Z-sc
ore
Children's age (month)
Tigray
SNNPR

28
Figure 4.5 Mean of height-for-age Z-scores (HAZ), by age group and gender
Figure 4.6 Mean of weight-for-age Z-scores (WAZ), by age group and gender
-3
-2.5
-2
-1.5
-1
-0.5
0 <3
3-5
6-8
9-1
1
12
-14
15
-17
18
-20
21
-23
24
-26
27
-29
30
-32
33
-35
36
-59
Z-sc
ore
Children's age (month)
Male
Female
-3
-2.5
-2
-1.5
-1
-0.5
0
0.5
<3 3-5 6-8 9-11 12-14
15-17
18-20
21-23
24-26
27-29
30-32
33-35
36-59
Z-sc
ore
Children's age (month)
Male
Female
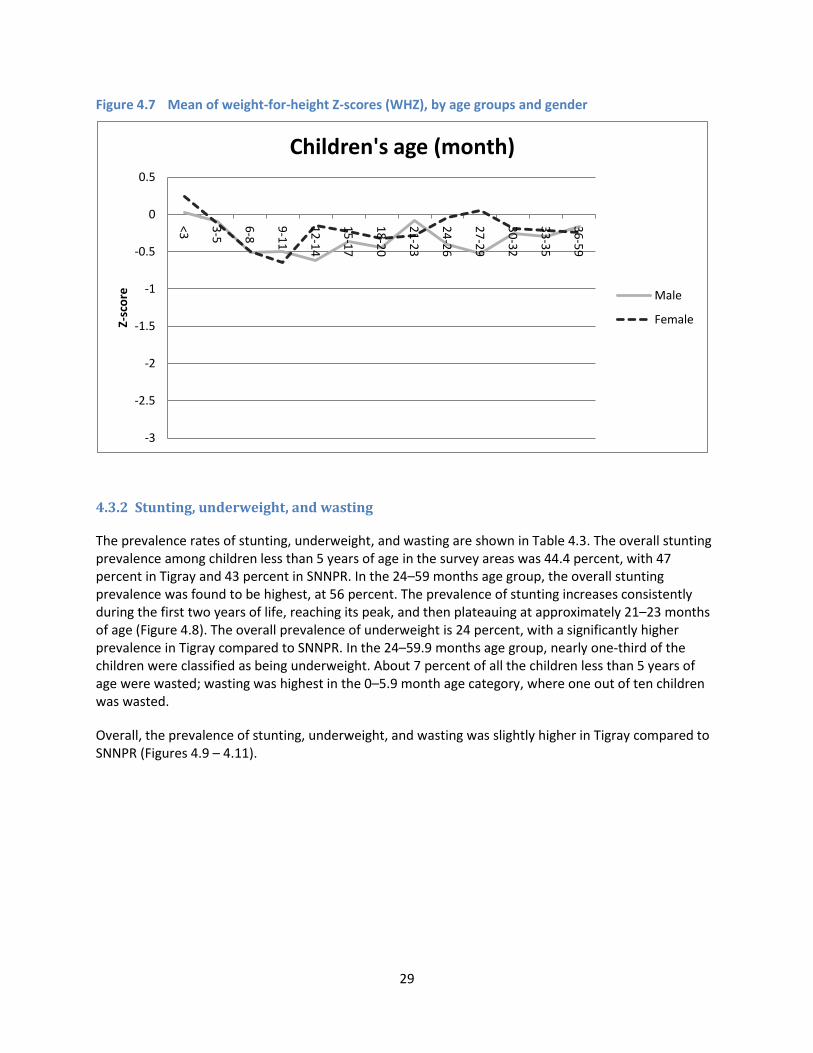
29
Figure 4.7 Mean of weight-for-height Z-scores (WHZ), by age groups and gender
4.3.2 Stunting, underweight, and wasting
The prevalence rates of stunting, underweight, and wasting are shown in Table 4.3. The overall stunting prevalence among children less than 5 years of age in the survey areas was 44.4 percent, with 47 percent in Tigray and 43 percent in SNNPR. In the 24–59 months age group, the overall stunting prevalence was found to be highest, at 56 percent. The prevalence of stunting increases consistently during the first two years of life, reaching its peak, and then plateauing at approximately 21–23 months of age (Figure 4.8). The overall prevalence of underweight is 24 percent, with a significantly higher prevalence in Tigray compared to SNNPR. In the 24–59.9 months age group, nearly one-third of the children were classified as being underweight. About 7 percent of all the children less than 5 years of age were wasted; wasting was highest in the 0–5.9 month age category, where one out of ten children was wasted.
Overall, the prevalence of stunting, underweight, and wasting was slightly higher in Tigray compared to SNNPR (Figures 4.9 – 4.11).
-3
-2.5
-2
-1.5
-1
-0.5
0
0.5
<3
3-5
6-8
9-1
1
12
-14
15
-17
18
-20
21
-23
24
-26
27
-29
30
-32
33
-35
36
-59
Z-sc
ore
Children's age (month)
Male
Female

30
Table 4.3 Comparison of nutritional status outcomes, by age group and regions
Tigray (n = 1,040)
SNNPR (n = 1,952)
ALL (n = 2,992)
Prevalence outcome Percent Percent Percent
Stunting
All 46.9 43.0 44.4
0–5.9 months 13.7 18.2 16.7
6–23.9 months 44.5 40.4 41.8
24–59.9 months 60.4 53.5 55.9
Underweight
All 29.2 20.7 23.8
0–5.9 months 11.4 8.0 9.1
6–23.9 months 32.3 17.9 22.9
24–59.9 months 35.0 27.5 30.1
Wasting
All 9.2 5.4 6.7
0–5.9 months 15.1 7.4 10.1
6–23.9 months 12.2 6.4 8.5
24–59.9 months 5.3 4.0 4.4
Figure 4.8 Prevalence of stunting, by age group and region
0
20
40
60
80
100
<3
3-5
6-8
9-1
1
12
-14
15
-17
18
-20
21
-23
24
-26
27
-29
30
-32
33
-35
36
-59
Pe
rce
nt
Children's age (month)
Tigray SNNPR All

31
Figure 4.9 Prevalence of stunting, underweight, and wasting, by regions
Figure 4.10 Prevalence of underweight, by age group and region
0
20
40
60
80
100
Tigray SNNPR All
Pe
rce
nt
Stunting
Underweight
Wasting
0
20
40
60
80
100
<3
3-5
6-8
9-1
1
12
-14
15
-17
18
-20
21
-23
24
-26
27
-29
30
-32
33
-35
36
-59
Pe
rce
nt
Children's age (month)
Tigray SNNPR All

32
Figure 4.11 Prevalence of wasting, by age group and region
4.4 Results: IYCF Indicators
This section presents further details on the IYCF practices in the study samples, going beyond the core WHO-recommended IYCF indicators to provide a better understanding of patterns of breastfeeding and complementary feeding.
4.4.1 Overall patterns of IYCF
The overall patterns of IYCF practices in the first two years of life are presented in Figure 4.12. It depicts the percent distribution of children under two years of age by breastfeeding status. The figure shows that not all the children under 6 months were exclusively breastfed. As expected, the exclusive breastfeeding rate declines sharply with age increases and after 8 months, only a small percent of children still continue to exclusively breastfeed. Giving children plain water alone with breastmilk appears to be a common practice that starts as early as birth.
Table 4.4 presents data also on additional optional IYCF indicators. As noted in the section on core IYCF indicators, other than continued breastfeeding at 1 year of life, a variety of other IYCF practices are suboptimal in our study sample. Gender differences in IYCF practices are also tested and no significant differences are found in IYCF practices by gender (Annex Table A4.5).
0
20
40
60
80
100
<3
3-5
6-8
9-1
1
12
-14
15
-17
18
-20
21
-23
24
-26
27
-29
30
-32
33
-35
36
-59
Pe
rce
nt
Children's age (month)
Tigray SNNPR All

33
Figure 4.12 Breastfeeding practices, by age
Table 4.4 WHO-recommended IYCF indicators (core and optional), by regiona
Tigray (n = 1,040)
SNNPR (n = 1,952)
All (n = 2,992)
IYCF indicators Percent Percent Percent
Core indicators Early initiation of breastfeeding (n = 1,481) 52.4 74.3 66.7
Exclusive breastfeeding under 6 months (n = 606) 68.5 74.5 72.4 Continued breastfeeding at 1 year (n = 209) 98.6 97.8 98.1 Introduction of solid, semisolid food, or soft food (n = 171) 48.4 31.2 37.4 Minimum diet diversity (n = 875) 4.9 7.0 6.3 Minimum meal frequency (n = 875) 51.8 42.3 45.6 Minimum acceptable diet (n = 875) 4.2 4.8 4.6 Consumption of iron-rich food (n = 875) 2.9 1.6 2.1
Optional indicators Children ever breastfed (n = 1,713) 91.4 91.7 91.6
Continued breastfeeding at 2 years (n = 213) 82.0 83.8 83.1 Age-appropriate breastfeeding (n = 1,713) 70.4 70.3 70.3 Predominant breastfeeding under 6 months (n = 645) 89.3 86.8 87.6 Bottle feeding (n = 1,713) 2.0 1.5 1.6 Milk feeding frequency for non-BF (n = 75) 5.0 24.2 17.0 Median duration of breastfeeding in months
b (n = 2,324) 28.5 – 30.6
a Full definition of IYCF indicators calculated based on WHO recommendation was in Annex Table A 4.1.
b Median duration of breastfeeding could not be calculated for SNNPR due to data insufficiency.

34
4.4.2 Breastfeeding-related practices
Initiation of breastfeeding and pre-lacteal feeding
Although the practice of breastfeeding is universal in Ethiopia, there remains scope for improvement in breastfeeding-related practices (Table 4.4). Overall, the percentage of children for whom breastfeeding was initiated in a timely manner (i.e., within 1 hour after birth) is around 67 percent, with 52 percent in Tigray and 74 percent in SNNPR. This finding is similar to the EDHS 2005.
We include data here on pre-lacteal feeding and early breastfeeding practices. Respondents were asked about feeding babies immediately following birth, and whether colostrums and other liquids were provided to the baby prior to initiating breastfeeding, and through the first three days after birth. Table 4.5 presents data on pre-lacteal and early breastfeeding practices in the two regions. Less than two-thirds of babies were given colostrum after birth. In Tigray, this practice was slightly higher than SNNPR (67.4 percent vs. 59.6 percent). Overall, the majority (67.4 percent) of those who reported not giving colostrum believed that colostrum was not good for their baby. Almost 25 percent reported “tradition” as their reason for not giving colostrum. Pre-lacteal feeding was also practiced in both regions with a relatively higher percentage in Tigray (13.5 percent vs. 7.4 percent). Further analysis to show the type of pre-lacteal liquids was conducted among only those who reported giving any pre-lacteal liquid. The most common pre-lacteal liquid was plain water, followed by raw butter. The practice of giving raw butter as a pre-lacteal food was higher in Tigray compared to SNNPR. Close elderly family members, such as mothers or mothers-in-law, were mainly responsible for feeding liquids other than breastmilk immediately after birth. Almost 45 percent of mothers were checked to see if their baby was suckling properly once the baby was put to her breast; in most cases where the mothers reported having been checked, the mothers or mothers-in-law were the ones who checked their statuses.
Table 4.5 Pre-lacteal feeding, by region
Characteristics
Tigray (N = 1,040)
SNNPR (N = 1,952)
ALL (n = 2,992)
Percent Percent Percent
Time of initiation of breastfeeding Immediately 35.3 47.2 43.1
1 hour 16.6 27.6 23.8
1-2 hours 13.5 11.5 12.2
2-24 hours 24.9 11.8 16.3
More than 24 hours 9.7 1.9 4.6 Colostrum given 67.4 59.6 62.3 Reasons for not giving colostrum (n = 1,127)a
Not good for the baby 70.5 66.1 67.4
Baby was thirsty 0.9 1.1 1.1
It was yellow 3.0 1.4 1.9
It is the tradition 17.1 26.8 23.9
Told to do so 5.9 8.0 7.4
Others 10.3 4.2 6.0 Any pre-lacteal given 13.5 7.4 9.5 Liquids other than breastmilk given immediately (n = 284)2
Honey 0.7 0.0 0.4
Plain water 11.4 80.6 46.3
Sugar/glucose water 17.0 3.5 10.2
Tea 0.7 0.0 0.4
Milk other than breastmilk 3.6 0.0 1.8
Raw butter 52.5 6.9 29.5
(continued)

35
Characteristics
Tigray (N = 1,040)
SNNPR (N = 1,952)
ALL (n = 2,992)
Percent Percent Percent
Ersho 2.8 0.0 1.4
Abish water 0.7 1.4 1.1
Water with rue, thyme 0.0 2.8 1.4
Others 19.9 6.3 13.0 Someone who gave this to the baby (n = 284)b
Doctor 0.7 0.0 0.4
Midwife/nurse/physician assistant 0.0 2.1 1.1
TBA 2.8 8.3 5.6
Mother/Mother-in-law 50.4 30.6 40.4
Other family members 2.1 6.9 4.6
Neighbors/friends 16.3 18.8 17.5
Self 26.2 31.9 29.1
Others 2.1 1.4 1.8 Someone helped to put the baby on the breast after birth 44.4 30.9 35.3 The person who helped to put the baby on the breast after birth
Self/nobody 56.9 70.6 65.8
Family members 22.6 15.1 17.7
Friends and neighbors 9.9 7.9 8.6
TBA/VCHP/HEW 7.1 4.8 5.6
Health professional and others 3.5 1.6 2.3 Baby was cleaned before putting to breast
Before cleaning baby 10.5 13.9 12.7
After cleaning baby 89.1 86.1 87.2
Do not know/remember 0.4 0.0 0.1 Mother was cleaned before putting to breast
Before mother was cleaned 22.5 32.8 29.2
After mother was cleaned 77.3 67.2 70.7
Do not know/remember 0.2 0.1 0.1 Someone checked if the baby was suckling 55.4 37.8 43.9 The person who checked if the baby was suckling (n = 1,311)c
Doctor 0.4 0.8 0.6
Midwife/nurse/physician assistant 4.2 3.4 3.8
TBA 2.3 8.4 5.7
Mother/mother-in-law 44.3 30.7 36.6
VCHP 7.0 0.3 3.2
HEW 5.3 1.4 3.2
Other family members 3.7 5.8 4.9
Neighbors/friends 20.2 20.0 20.1
Self 23.0 40.4 32.9
Others 1.4 1.0 1.2 Liquids given to the baby the first three days after birth
Breastmilk 88.3 95.9 93.3
Honey 0.2 0.0 0.1
Plain water 1.3 5.2 3.8
Sugar/glucose water 2.0 0.2 0.8
Tea 0.0 0.1 0.0
Milk (other than breastmilk) 1.2 0.7 0.9
Infant formula 0.1 0.2 0.1
Raw butter 6.1 0.5 2.4
Abish water 0.2 0.2 0.2
Water with rue, thyme, other herbal extract 0.0 0.5 0.3
Others 5.2 2.3 3.3 a The categories are shown among those who did not give colostrums. b Among those who said "yes" to pre-lacteal (note that this category is small). c Among those who said "yes" to having being checked if the baby is suckling.

36
Exclusive breastfeeding, predominant breastfeeding, age-appropriate breastfeeding, bottle-feeding
The overall exclusive breastfeeding rate was found to be relatively high at 72 percent; this is substantially higher than what was seen in the EDHS 2005. Continued breastfeeding at one year was also very high at 98 percent, and bottle feeding was very low, with only 1.6 percent of all infants below the age of 24 months being bottle fed (Table 4.4). Median duration of breastfeeding is 30.2 months (Table 4.4).
Figure 4.13 shows exclusive breastfeeding and predominant breastfeeding by age. Nearly 100 percent and over 90 percent children were exclusively breastfed and predominantly breastfed at one month of age, respectively. After the second month, both rates start falling. At 6 months of age, only half of the children are exclusively breastfed, while over 70 percent children were still predominantly breastfed.
Figure 4.13 Exclusive breastfeedinga and predominant breastfeeding,b by age
a Exclusive BF: Proportion of infants 0–5 months of age who are fed exclusively with breastmilk.
b Predominant BF: Proportion of infants 0–5 months of age who received breastmilk as the predominant source of nourishment during the previous day. Predominant BF “allows” ORS, vitamin and/or mineral supplements, ritual fluids, water and water-based drinks, and fruit juice. Other liquids, including nonhuman milks and food-based fluids, are not allowed, and no semisolid or solid foods are allowed.
4.4.3 Complementary feeding-related practices
Complementary feeding practices are very poor in both regions. Only a little over one-third of children were being fed solid/semisolid foods in the 6–8.9 months age window in SNNPR, compared to almost half of children in Tigray. In both regions, dietary diversity is very low (6 percent) as is the consumption of iron-rich foods (2 percent). Almost half of all children meet their minimum desired meal frequency, although the percentage consuming a minimally acceptable diet (a composite indicator of diet diversity and meal frequency) is very low, at less than 5 percent. These practices are similar to what was found in the EDHS 2005.
0
20
40
60
80
100
1 2 3 4 5 6
%
Age in months
EBF
Predominant BF

37
Table 4.6a and 4.6b present findings on the introduction of complementary foods in the surveyed population in the two regions. As per WHO recommendations, complementary foods should be introduced to the children at 6 months of age. The results in Table 4.6a show the proportion of children 6–8 months old fed different food groups, and highlights the suboptimal state of complementary feeding for children who are in a very vulnerable age group. Overall, only two-thirds of children had even been given grain-based complementary foods, and consumption of other nutrient-rich foods was extremely low. Nearly 26 percent started semisolid foods after 9 months of age.
Table 4.6a Complementary feeding-related practicesa
Tigray
(n = 76) SNNPR
(n = 139) All
(n = 215)
Complementary food Percent Percent Percent
Grains, roots, and tubers 65.8 69.1 67.9
Legumes and nuts 9.2 7.9 8.4
Dairy (milk, yogurt, cheese) 34.2 54.0 47.0
Flesh foods (meat, fish, poultry, and liver/organ meats) 4.0 1.4 2.3
Eggs 27.6 30.2 29.3
Vitamin A-rich fruits and vegetables 4.0 9.4 7.4
Other fruits and vegetables 19.7 28.1 25.1 a The sample includes those between 6–8.9 months, thus estimating the proportion of children 6–8.9 months old
who consumed foods from different food groups.
The results in Table 4.6b are based on recalled age of introduction of different foods, and show that the patterns of introduction of complementary food tend toward being delayed in Ethiopia, with the exception of water. The introduction of water before the age of 6 months is fairly common, at around 40 percent. Introduction of other liquids, such as tea or fruit juice, before 6 months of age was not as high as water.
Table 4.6b Introduction of different foods and liquids, by age
All (n = 2,992)
Early introductiona
(n = 606) Timely introduction
b
(n = 215) Late introduction
c
(n = 2,171)
Foods/liquids Percent Percent Percent
Water 50.3 45.3 4.4 Other non-breastmilk liquids 21.3 61.5 17.2 Cow/goat milk 21.9 63.4 14.7 Gruel from grain or teff 18.3 68.9 12.8 Semi solid foods 5.5 60.9 33.7 Solid foods 2.8 47.0 50.3 Fish 0.0 20.0 80.0 Meat 0.3 8.7 91.0 Eggs 4.2 62.0 33.8 Legumes 3.2 40.2 56.6 Green vegetables 1.1 24.5 74.4 Fruits 2.9 47.0 50.1 Snacks 1.5 23.4 75.1 a Early: Introduction of complementary food before 6 months.
b Timely: Introduction of complementary food between 6–8.9 months.
c Late: introduction of complementary food after 9 months.

38
The practice of giving liquids other than breastmilk before the age of 6 months was more common in Tigray compared to SNNPR (see Annex Table A4.3). While giving other liquids was practiced before the age of 6 months, timely introduction of complementary feeding between 6–8 months of age was also low. The reported introduction of gruels made of rice or teff, and other semisolid foods and solid foods at 6 to 8 months was around 30 to 40 percent. Egg is the most commonly animal source food introduced at 6–8 months.
In addition to the tables presented above, Annex Tables A4.2 and A4.3 show details of the food items consumed by the children in the last 24 hours by different age groups. Over half of the children between 6–59 months of age consumed injera and products like breads, pasta, and noodles. Twenty-eight percent consumed gruel made of grain or teff. Twelve percent consumed any yellow or orange colored vegetables and 24 percent consumed dark leafy vegetable. One quarter of the children were reported to eat lentil or pulses in this age group, but less than 3 percent consumed any meats and only 8 percent were reported to consume eggs.
In the 6-12 months of age group, 35 percent consumed gruel and a similar percentage ate injera and pasta. Consumption of vegetables (orange colored or green) was much lower in this age group. Consumption of meat products was almost nonexistent and only 6.8 percent consumed eggs. Consumption of pulses and lentils was also very low.
Overall, the predominant findings in relation to complementary feeding in this survey sample are those of delayed introduction of complementary foods, very low diversity of diets, and extremely low consumption of flesh foods by children. These findings link well with those seen in the Ethiopia DHS surveys.
In further analyses, we will explore the role of factors that determine IYCF challenges, such as late introduction of complementary foods, poor diversity, and low consumption of animal source foods. These will also be paid close attention to in the process evaluation of A&T interventions in Ethiopia.
4.5 Chapter Summary
The key impact indicators are stunting (height-for-age) and WHO-recommended IYCF indicators. In addition, we explored two important key undernutrition variables; wasting and underweight. The results showed that the stunting level was quite high (56 percent in 24–59.9 months and 44.4 percent in 0–59.9 months). No major differences were observed between regions in overall percentages. Overall wasting among young children less than 5 years of age was 6.7 percent. Wasting among young children (0–5.9 months of age) was high at 10.1 percent. Underweight was also high at 30 percent in 24–59.9 months. All three indicators started to rise immediately after birth. Stunting rates kept on increasing until 2 years of age before stabilizing and continuing to be high through 59 months, clearly indicating the best time for the program to intervene was before 2 years of age.
We estimated the current level of WHO-recommended IYCF indicators in these two regions. The situation with respect to breastfeeding was found to be relatively better compared to the situation related to complementary feeding. Breastfeeding was practiced universally at 12–15 months of age at 98 percent and the exclusive breastfeeding rate was high (72. 4 percent). However, early initiation of breastfeeding was less than optimal, at 67 percent. The baseline survey also yielded that babies were given water as early as before 2 months of age. Timely introduction of complementary food at 6–8 months was very low, at 37 percent, and only 6 percent had minimum dietary diversity (≥ 4 food groups)

39
in their meals. Forty-five percent met minimum meal frequency. Consumption of iron-rich food was almost nonexistent at 2.1 percent. These extremely low levels of recommended complementary feeding practices pose major challenges for the program.
Among other IYCF practices, the practice of giving colostrum immediately after birth was somewhat high, at 62.3 percent. Nearly one out of ten babies was given pre-lacteal feeding, with family members and neighbors being influential in this practice. At 6 months, 70 percent of the children were still predominantly breastfed.
In summary, while there are some gaps in breastfeeding-related practices, complementary feeding-related practices indicate major gaps as per most of the IYCF indicators.

40
5. Results: IYCF Practices, Challenges, and Child Feeding Knowledge
5.1 Variables
Child-feeding difficulties and issues
In order to characterize the issues and challenges mothers faced with IYCF practices, we asked the mothers several questions on feeding difficulties they encountered at different stages of their child’s life. These included questions such as what problems they had with breastfeeding when they started breastfeeding, what feeding problems they encountered when their child was 3–4 months old, and what their challenges were when they first started feeding their child complementary foods. In addition, we also asked if mothers sought help when they encountered issues with feeding their children and from whom they often sought help. Finally, we asked about current problems with child feeding that mothers were facing, and analyzed these data by child age. Together, this set of questions provides a clear picture of the types of common problems encountered by mothers that are likely to compromise efforts to improve IYCF practices.
Child-feeding knowledge
In our survey, we assessed caregiver knowledge related to infant feeding practices, focusing on knowledge of ideal breastfeeding practices and appropriate introduction and feeding frequency of complementary foods. Specifically, in order to obtain knowledge about appropriate introduction of complementary foods, we asked mothers questions about their knowledge related to the introduction of 14 common kinds of food. Data on the age of introduction of individual food were then recoded based on current WHO guidelines in two categories: appropriate introduction (between 6 and 8.9 months of age) and inappropriate introduction (either too early—before 6 months of age or too late—9 months or older). Knowledge of appropriate feeding frequency was assessed by asking six questions on maternal knowledge about frequency of feeding meals and snacks to children in three different age groups (6–8.9 months, 9–11.9 months, and 12–23.9 months). The reported frequencies were then compared to the WHO recommendations for breastfed and non-breastfed children. These data were also combined to create an overall scale that assessed the knowledge of appropriate feeding frequency.
We further asked mothers whether they were exposed to different IYCF messages and if so, what, and who the most probable sources (such as family members, volunteers, health extension workers) of these messages were. This information has programmatic implications as to reaching mothers with correct messages through the most credible channels.
Awareness, trial, and adoption of key practices
We asked mothers questions about their awareness, trial, and adoption of a few key “sentinel” practices that are likely to be recommended by the A&T program5 in order to assess whether knowledge gets translated into trial of new practices and whether behaviors that are tried are then sustained. In previous research on BCC programs, data on these types of questions have helped to identify practice-specific facilitators and barriers.
5 The behaviors asked here were decided based on discussions with the A&T program team on the types of IYCF practices
that should be included in this module of the questionnaire.

41
5.2 Breastfeeding Challenges
We present data on difficulties mothers faced when beginning to breastfeed (Table 5.1) and after 3-4 months of breastfeeding (Table 5.2). A very small percentage of mothers reported having any problems when they started breastfeeding. The major problem cited was pain in the breasts. Forty percent of those who reported having problems sought some kind of help to resolve the problem. When mothers were asked if they had any problem breastfeeding the child at 3-4 months of age, an even smaller percentage reported having any problems (4 percent). Pain and their child not sucking well were the major problems reported. Approximately half of all mothers who cited problems breastfeeding sought help. Healthcare staffs were primarily sought for help with breastfeeding at 3–4 months of age. One notable difference between regions is in the advice given to mothers who sought help; 44 percent of the mothers in Tigray who sought any help reported being advised to feed their babies formula milk, and only 6.5 percent were advised the same in SNNPR.
Table 5.1 Problems when first started breastfeeding
Characteristics
Tigray (N = 1,040)
SNNPR (N = 1,952)
ALL (N = 2,992)
Percent Percent Percent
Reported having problemsa 7.2 6.4 6.7
Type of problem (n = 199)b
Problems with breast (pain) 50.7 59.4 56.1
Child not suck well 13.3 20.3 17.7
Cracked nipples 8.0 5.7 6.6
Felt not enough breastmilk 24.0 8.1 14.1
Others 6.7 8.1 7.6 Reported seeking help to address these problems
b 38.6 43.0 41.4
To whom mother seeks help (n = 79)c
Doctor 3.6 3.9 3.8
Midwife/nurse/physician assistant 25.0 38.5 33.8
HEW 10.7 9.6 10.0
Mother/mother-in-law 44.0 11.1 22.9
Other family members 7.1 5.8 6.3
Neighbors/friends 14.3 13.5 13.8
Traditional healer 0.0 15.4 10.0
Others 10.7 11.5 11.3 Type of support received (n = 79)
c
Showed how to position the baby 14.3 1.9 6.3
Showed how baby’s mouth should be when feeding 7.4 5.8 6.3
Told to express milk 3.7 5.8 5.1
Advised to feed other foods 3.7 3.9 3.8
Advised to feed other milk/formula 0.0 9.6 6.3
Referred to doctor 22.2 21.2 21.5 a Note that the percentage who reported this is low.
b Among those who said "yes" to having problem.
c Among those who said "yes" to seeking help.

42
Table 5.2 Problems when breastfeeding later on (when the child 3-4 months)
Characteristics
Tigray (N = 1,040)
SNNPR (N = 1,952)
ALL (N = 2,992)
Percent Percent Percent
Reported having problems 3.7 4.6 4.3 Type of problems (n = 117)
a
Problems with breast (pain) 44.4 50.0 48.3
Child not suck well 33.3 33.8 33.6
Cracked nipples 2.8 5.0 4.3
Felt not enough breastmilk 16.7 3.8 7.8
Others 5.6 10.0 8.6 Seek help for breastfeeding continuation problem
a 50.0 57.5 55.2
To whom mother seeks help (n = 64)b
Doctor 0.0 6.5 4.7
Midwife/nurse/physician assistant 55.6 50.0 51.6
HEW 33.3 19.6 23.4
Mother/mother-in-law 5.6 2.2 3.1
Other family members 5.6 2.2 3.1
Neighbors/friends 0.0 4.4 3.1
Traditional healer 0.0 15.2 10.9
Others 0.0 4.4 3.1 Type of support received (n = 64)
b
Showed how to position the baby 5.6 2.1 3.1
Showed how baby’s mouth should be when feeding 5.6 4.4 4.8
Told to express milk 11.1 2.2 4.8
Advised to feed other foods 16.7 8.9 11.1
Advised to feed other milk 16.7 2.2 6.4
Referred to doctor 22.2 15.6 17.5
Others 33.3 68.9 58.7 Formula suggested (n = 64)
b 44.4 6.5 17.2
a Among those who said "yes" to having problems.
b Among those who said "yes" to seeking help.
5.3 Complementary Practices and Challenges
Table 5.3 presents the problems or difficulties mothers faced when they first started complementary feeding and what they did to resolve these difficulties. Less than 10 percent of the mothers reported ever facing any problem. Out of the reported problems, child’s refusal to eat and child being sick were the major concerns. About 50 percent of mothers reported the child being sick. Sixty-five percent of those mothers reporting having difficulties regarding introduction of complementary feeding sought some help. Health professionals were the major source of support (51 percent). Around 20 percent of the mothers reported seeking help from the HEWs. Mothers received multiple suggestions, including continuing to breastfeed, increasing meal frequency, and providing smaller but more frequent meals.

43
Table 5.3 Problems when first starting to feed semisolid foods, by regions
Variables
Tigray (N = 834)
SNNP (N = 1,552)
ALL (N = 2,386)
Percent Percent Percent
Reported having problems 9.4 8.5 8.8 Type of problems (n = 203)
a
Child refusal or child spits it out 51.3 41.1 45.0
Child sick 43.4 55.7 51.0
Child's poor appetite 10.5 5.7 7.5
Mother does not have time to prepare/feed 1.3 0.8 1.0
Family does not have resources 1.3 0.8 1.0
Family members discouraged certain foods/practices 1.3 0.0 0.5
Other 5.3 4.0 4.5 Reported seeking help to address these problems (n = 203)
a 65.8 63.7 64.5
To whom mother seeks helpb
Doctor 6.0 6.3 6.2
Midwife/nurse/physician assistant 56.0 48.1 51.2
HEW 16.0 21.5 19.4
Mother/mother-in-law 4.0 8.9 7.0
Other family members 6.0 5.1 5.4
Neighbors/friends 14.0 6.3 9.3
Others 4.0 5.1 4.7 Suggestions received regarding this problem (n = 129)
b
Try one type of food/fruit that baby likes 2.0 2.5 2.3
Give mashed family foods two times a day 4.0 1.3 2.3
Stop giving liquids 2.0 5.1 3.9
Continue breastfeeding 26.0 11.4 17.1
Start with small quantity and gradually increase the quantity 20.0 22.8 21.7
Increase frequency of meal 0.0 2.5 1.6
Try multiple foods 28.0 21.5 24.0
Give traditional medicine or herbal extract 2.0 11.4 7.8
Referred to doctor 10.0 8.9 9.3
Other 44.0 35.4 38.8 Suggested formula (n = 129)
b 14.3 10.1 11.7
a Among those who said "yes" to having problems.
b Among those who said "yes" to seeking help.
Respondent mothers were asked if they encountered any problem regarding feeding their children at the time of the survey. Table 5.4 shows these findings in three age groups (0–5.9, 6–23.9, and 24–59.9 months). Problems or concerns reported by mothers were quite low. Only 4 percent, 7 percent, and 6 percent from three respective age groups reported having encountered any problems. As was reported earlier regarding initiation of breastfeeding and continuation of breastfeeding, the problem with pain in the breast and not enough milk to feed were the major complaint. In the older age groups, poor appetite was the major concern expressed by the respondent mothers. Around 30 percent of the mothers from all the age groups reported having sought help for the problems.

44
Table 5.4 Current problems with IYCF practices, by region and age
0–5.9 6–23.9 24–59
Tigray (n = 206)
SNNPR (n = 400)
All (n = 606)
Tigray (n = 307)
SNNPR (n = 568)
All (n = 875)
Tigray (n = 518)
SNNPR (n = 964)
All (n = 1,482)
Characteristics Percent Percent Percent Percent Percent Percent Percent Percent Percent
Reported having concerns/difficulties 3.4 4.3 4.0 8.1 6.3 7.0 10.0 3.7 5.9 Type of concerns/difficulties (n = 175)
a
Problems with breast 50.0 35.3 40.0 12.0 13.9 13.1 9.4 5.6 7.9
Child did not suck well 12.5 0.0 4.0 8.0 5.6 6.6 3.8 2.8 3.4
Not able to breastfeed well 12.5 5.9 8.0 24.0 5.6 13.1 5.7 0.0 3.4
Not enough time to feed 0.0 0.0 0.0 4.0 0.0 1.6 1.9 2.8 2.3
Cracked nipples 0.0 5.9 4.0 0.0 2.8 1.6 0.0 2.8 1.1
Felt not enough breastmilk 37.5 5.9 16.0 24.0 5.6 13.1 11.3 8.3 10.1
Poor appetite 0.0 11.8 8.0 36.0 33.3 34.4 32.1 41.7 36.0
Child did not like solid foods 0.0 0.0 0.0 4.0 11.1 8.2 5.7 8.3 6.7
Child sick 0.0 29.4 20.0 12.0 16.7 14.8 18.9 13.9 16.9
Others 0.0 11.8 8.0 8.0 25.0 18.0 26.4 25.0 25.8 Reported seeking help to address these concerns
a 12.5 35.3 28.0 36.0 27.8 31.2 37.7 25.0 32.6
To whom mother seeks help (n = 56)b
Doctors 0.0 16.7 14.3 11.1 40.0 5.3 5.0 55.6 3.5
Midwives/nurses 0.0 33.3 28.6 44.4 0.0 42.1 25.0 22.2 34.5
VCHP 0.0 0.0 0.0 0.0 0.0 0.0 15.0 0.0 10.3
HEW 0.0 0.0 0.0 22.2 20.0 21.1 25.0 0.0 24.1
Other family members 100.0 16.7 28.6 11.1 10.0 10.5 20.0 11.1 17.2
Neighbors/friends 0.0 16.7 14.3 11.1 0.0 5.3 25.0 11.1 20.7
Others 0.0 33.3 28.6 0.0 20.0 10.5 10.0 11.1 10.3 Reported given suggestion for baby food/formula (n = 56)
b 0.0 0.0 0.0 0.0 0.0 0.0 20.0 12.5 17.9
a Among those who said "yes" to having problems.
b Among those who said "yes" to seeking help.

45
5.4 Knowledge about IYCF Practices
This section discusses the mothers’ knowledge regarding IYCF practices. The findings presented in Table 5.5 show considerable gaps in the knowledge of IYCF practice. When mothers were asked about the correct timing of initiation of breastfeeding, around 80 percent of the mothers said that breastfeeding should be initiated within an hour of delivery. Knowledge regarding the necessity of giving colostrum was much lower. Only half of the respondents mentioned that colostrum should be given immediately after birth to the babies, and the rest of the respondents said that it should be thrown away. Over 30 percent of the mothers expressed the view that women with small breasts might have difficulties in breastfeeding. About 63 percent of the mothers mentioned that babies should be given other liquids or food, while only 23 percent of the mothers mentioned increasing the frequency of breastfeeding if the mother perceived that the baby was not getting enough breastmilk. Sixty-nine percent of the mothers believed that breastfed babies should be given water in hot weather.
Table 5.5 Knowledge and perception about breastfeeding, by regions
Tigray (n = 1,040)
SNNPR (n = 1,952)
ALL (n = 2,992)
Percent Percent Percent
Putting the baby on breast immediately 74.6 88.9 82.7 Giving only colostrum until breastmilk 48.5 52.8 50.9 Small breasts can produce milk 66.0 65.0 65.4 Not well-fed mothers can produce milk 8.9 8.4 8.6 Baby should be breastfed whenever wants 51.2 38.6 51.6 Baby should NOT be given water in hot weather 25.1 34.8 31.4 Continuation of breastfeeding if the mother is ill 56.9 50.4 52.7 Increase frequency of breastfeeding if the baby is not getting
enough milk 23.5 23.3 23.1 Give other liquids if the baby is not getting enough milk 54.0 57.2 63.3 Continuation of breastfeeding if the mother is pregnant 28.1 31.1 30.0 At six months babies should
Receive water and other liquids in addition to breastmilk 57.4 56.4 56.7
Receive food in addition to breastmilk 64.1 42.7 50.2
Knowledge related to appropriate timing of introduction of complementary food also showed major gaps. Mothers were asked questions related to the appropriate timing of introduction of 15 different foods (Table: 5.6). In general, very few mothers reported the appropriateness of introducing foods, other than water, before 6 months of age. Approximately 50 percent of women believed it was appropriate to introduce water before 6 months of age. Plant-based foods were thought to be suitable to be introduced earlier (at 6 months of age) compared to animal source foods. Over 90 percent of the mothers stated that meat, fish, or poultry should not be introduced until the children were 9 months or older. Approximately 65 percent of mothers believed eggs and milk products can be introduced at 6 months of age. Further knowledge about complementary feeding-related practices is presented in Annex Table A5.1.
In addition to mothers’ knowledge about breastfeeding and complementary feeding practices, the survey also collected information about knowledge about feeding practices during illness, maintaining personal hygiene, and perceptions on improving feeding of the child. These findings are presented in Annex Tables A5.2, A5.3, and A5.4.

46
Table 5.6 Knowledge about appropriate time of introduction of CF, by regions
Tigray (n = 1,040)
SNNPR (n = 1,952)
ALL (n = 2,992)
Characteristic (time to start the following foods) Percent Percent Percent
Water 0-2.9 months 16.4 11.5 13.2
3-5.9 months 35.7 29.8 31.8
6-8.9 months 45.3 52.8 50.2
9 or more months 2.7 6.0 4.9
Injera 0-2.9 months 0.2 0.1 0.1
3-5.9 months 5.2 3.0 3.7
6-8.9 months 62.1 52.8 56.1
9 or more months 32.5 44.1 40.1
Legume 0-2.9 months 0.3 0.1 0.1
3-5.9 months 4.2 2.1 2.8
6-8.9 months 54.7 48.3 50.5
9 or more months 40.8 49.6 46.5
Green leafy vegetables like kale, spinach 0-2.9 months 0.1 0.1 0.1
3-5.9 months 1.4 1.4 1.4
6-8.9 months 29.2 27.4 28.0
9 or more months 69.3 71.2 70.5
Vegetables such as pumpkins, orange yam, orange red fleshed sweet potatoes, carrots
0-2.9 months 0.0 0.2 0.1
3-5.9 months 1.7 1.8 1.8
6-8.9 months 38.9 42.9 41.5
9 or more months 59.4 55.1 56.6
Ripe papaya mango 0-2.9 months 0.0 0.2 0.1
3-5.9 months 2.6 1.7 2.0
6-8.9 months 37.4 48.8 44.9
9 or more months 60.0 49.3 53.0
Bananas 0-2.9 months 0.0 0.1 0.0
3-5.9 months 2.9 2.2 2.4
6-8.9 months 42.3 53.1 49.3
9 or more months 54.8 44.7 48.2
Meat such as beef/goat 0-2.9 months 0.1 0.1 0.1
3-5.9 months 0.2 0.3 0.3
6-8.9 months 8.0 3.9 5.4
9 or more months 91.7 95.7 94.3
Chicken or poultry 0-2.9 months 0.1 0.1 0.1
3-5.9 months 0.2 0.3 0.3
6-8.9 months 8.0 3.8 5.3
9 or more months 91.7 95.8 94.4
(continued)
Fish (big)

47
Tigray (n = 1,040)
SNNPR (n = 1,952)
ALL (n = 2,992)
Characteristic (time to start the following foods) Percent Percent Percent
0-2.9 months 0.0 0.0 0.0
3-5.9 months 0.3 0.2 0.2
6-8.9 months 3.1 2.2 2.5
9 or more months 96.6 97.6 97.3
Fish (small) 0-2.9 months 0.0 0.0 0.0
3-5.9 months 0.3 0.1 0.2
6-8.9 months 3.0 2.5 2.6
9 or more months 96.7 97.4 97.2
Eggs 0-2.9 months 0.3 0.1 0.2
3-5.9 months 4.8 3.6 4.0
6-8.9 months 68.7 66.0 66.9
9 or more months 26.3 30.3 28.9
Peanuts, groundnuts 0-2.9 months 0.2 0.0 0.1
3-5.9 months 1.4 0.9 1.1
6-8.9 months 23.7 20.9 21.8
9 or more months 74.7 78.3 77.0
Milk (cow, goat, or powdered) 0-2.9 months 2.0 1.4 1.6
3-5.9 months 13.9 12.8 13.1
6-8.9 months 61.6 67.4 65.4
9 or more months 22.5 18.4 19.9
Purchased snacks 0-2.9 months 0.0 0.1 0.0
3-5.9 months 1.4 0.9 1.1
6-8.9 months 19.1 20.7 20.2
9 or more months 79.4 78.3 78.7
Tables 5.7 and 5.8 present the exposure of mothers to infant feeding-related messages and sources of these messages. A number of selected messages are listed here. Exposure to different messages was found to be quite low. Exposure to IYCF messages was somewhat better among respondents from Tigray compared to their counterparts in SNNPR. For example, 48 percent of the mothers from Tigray reported having heard about giving colostrum to their babies as opposed to only 28 percent of mothers from SNNPR. This partially explains the low level of IYCF-related knowledge among the respondents. Only 30 percent of the mothers reported hearing a specific message related to not feeding water or any other liquids to their babies younger than 6 months of age. Overall, it can be surmised that mothers from the surveyed population had very limited exposure to breastfeeding and complementary feeding-related messages. Overall, HEWs and mothers and mothers-in-law were consistently the main source of information related to IYCF (Table 5.8).

48
Table 5.7 Exposure to messages about infant feeding, by regions
Tigray (n = 1,040)
SNNPR (n = 1,952)
ALL (n = 2,992)
Characteristic: Proportion reported having heard of the following in the past Percent Percent Percent
Putting the baby on breast immediately 62.5 40.9 48.4
Giving only colostrum until breastmilk 47.7 28.3 35.0
No pre-lacteals (honey, water, glucose, etc.) 29.9 18.1 22.2
Feed only breastmilk up to 6 months 59.3 45.3 50.2
Not giving the child any water or other liquids up to 6 months 36.7 30.3 32.5
How to hold the baby at the breast so s/he can breastfeed 40.3 21.0 27.7
How to put the baby's mouth at the breast so that s/he can feed easily 37.7 18.9 25.4
Emptying one breast before giving the other side 33.9 17.1 22.9
Feeding mashed family food after 6 months 40.7 28.9 32.6
Feeding eggs, meat, fish, and other animal source foods to children older than 6 months 44.5 25.5 32.1
Cooking children's food with oil 44.1 19.4 28.0
Washing hands with water and soap before prep/feeding 65.7 45.4 52.3
How to help your child eat better 47.0 28.0 34.5
How to feed your child when s/he is sick 43.5 27.9 33.3
Feeding the child an extra meal or food after illness 39.7 25.1 30.2
Table 5.8 Source of information for IYCF messages
Tigray SNNPR All
Source of informationa Percent Percent Percent
Putting baby to breast (n = 1,448) Health extension workers 35.5 50.1 43.5
Volunteer community health workers 12.1 4.8 8.0
Nurse/midwife 13.0 6.8 9.6
Mother/mother-in-laws 24.0 17.6 20.4
Friend/family 7.1 9.8 8.6 Giving colostrum (n = 1,048)
Health extension workers 37.9 51.7 45.2
Volunteer community health workers 13.4 6.7 9.9
Nurse/midwife 11.1 6.2 8.5
Mother/mother-in-laws 24.1 14.3 19.0
Friend/family 6.9 10.7 8.9 No pre-lacteal (n = 665)
Health extension workers 38.1 49.4 44.1
Volunteer community health workers 17.4 6.5 11.6
Nurse/midwife 11.3 7.4 9.2
Mother/mother-in-laws 21.3 17.9 19.5
Friend/family 4.8 10.5 7.9 Only breastmilk first six months (n = 1,500)
Health extension workers 45.1 58.7 53.2
Volunteer community health workers 12.8 6.4 9.0
Nurse/midwife 13.0 8.8 10.5
Mother/mother-in-laws 16.2 9.6 12.3
Friend/family 5.4 8.0 6.9 Not giving the child any liquid up to 6 months (n = 973)
Health extension workers 47.4 59.4 54.7
Volunteer community health workers 12.6 7.3 9.4
Nurse/midwife 13.4 7.3 9.7
Mother/mother-in-laws 16.2 10.3 12.6
(continued)
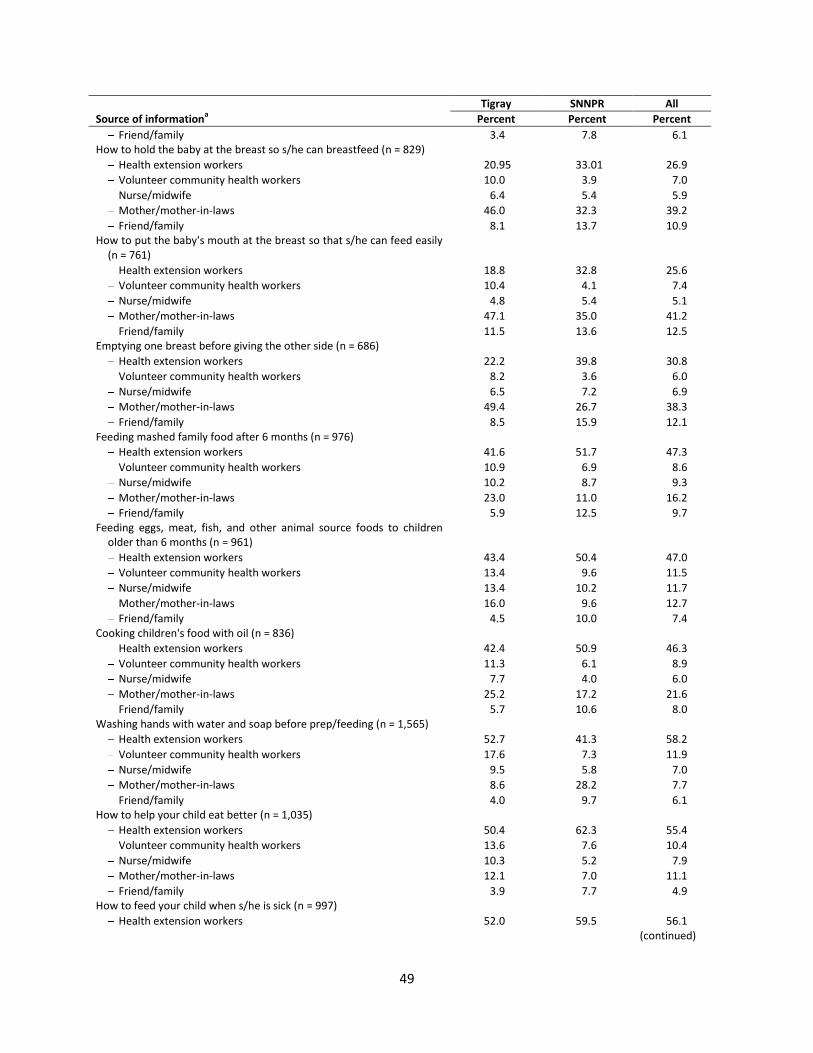
49
Tigray SNNPR All
Source of informationa Percent Percent Percent
Friend/family 3.4 7.8 6.1 How to hold the baby at the breast so s/he can breastfeed (n = 829)
Health extension workers 20.95 33.01 26.9
Volunteer community health workers 10.0 3.9 7.0
Nurse/midwife 6.4 5.4 5.9
Mother/mother-in-laws 46.0 32.3 39.2
Friend/family 8.1 13.7 10.9 How to put the baby's mouth at the breast so that s/he can feed easily
(n = 761) Health extension workers 18.8 32.8 25.6
Volunteer community health workers 10.4 4.1 7.4
Nurse/midwife 4.8 5.4 5.1
Mother/mother-in-laws 47.1 35.0 41.2
Friend/family 11.5 13.6 12.5 Emptying one breast before giving the other side (n = 686)
Health extension workers 22.2 39.8 30.8
Volunteer community health workers 8.2 3.6 6.0
Nurse/midwife 6.5 7.2 6.9
Mother/mother-in-laws 49.4 26.7 38.3
Friend/family 8.5 15.9 12.1 Feeding mashed family food after 6 months (n = 976)
Health extension workers 41.6 51.7 47.3
Volunteer community health workers 10.9 6.9 8.6
Nurse/midwife 10.2 8.7 9.3
Mother/mother-in-laws 23.0 11.0 16.2
Friend/family 5.9 12.5 9.7 Feeding eggs, meat, fish, and other animal source foods to children
older than 6 months (n = 961) Health extension workers 43.4 50.4 47.0
Volunteer community health workers 13.4 9.6 11.5
Nurse/midwife 13.4 10.2 11.7
Mother/mother-in-laws 16.0 9.6 12.7
Friend/family 4.5 10.0 7.4 Cooking children's food with oil (n = 836)
Health extension workers 42.4 50.9 46.3
Volunteer community health workers 11.3 6.1 8.9
Nurse/midwife 7.7 4.0 6.0
Mother/mother-in-laws 25.2 17.2 21.6
Friend/family 5.7 10.6 8.0 Washing hands with water and soap before prep/feeding (n = 1,565)
Health extension workers 52.7 41.3 58.2
Volunteer community health workers 17.6 7.3 11.9
Nurse/midwife 9.5 5.8 7.0
Mother/mother-in-laws 8.6 28.2 7.7
Friend/family 4.0 9.7 6.1 How to help your child eat better (n = 1,035)
Health extension workers 50.4 62.3 55.4
Volunteer community health workers 13.6 7.6 10.4
Nurse/midwife 10.3 5.2 7.9
Mother/mother-in-laws 12.1 7.0 11.1
Friend/family 3.9 7.7 4.9 How to feed your child when s/he is sick (n = 997)
Health extension workers 52.0 59.5 56.1
(continued)

50
Tigray SNNPR All
Source of informationa Percent Percent Percent
Volunteer community health workers 11.7 6.6 8.9
Nurse/midwife 9.3 7.5 8.3
Mother/mother-in-laws 13.3 9.5 11.2
Friend/family 4.0 6.2 5.2 Feeding the child an extra meal or food after illness (n = 902)
Health extension workers 50.7 59.8 55.7
Volunteer community health workers 11.7 6.9 9.1
Nurse/midwife 9.9 7.4 8.5
Mother/mother-in-laws 14.3 9.6 11.8
Friend/family 3.6 6.1 5.0 a The sample includes those who said “yes” to exposure to the respective messages.
5.5 Awareness, Trial, and Adoption of Key IYCF Practices
Table 5.9 presents maternal exposures to a number of selected IYCF messages, subsequent trial of what they heard, and uptake of the practice. The type of IYCF messages/practices asked about were discussed together with the A&T program team to ensure that the baseline survey would capture the types of practices the program was most likely to promote.
Overall, the proportion of women who reported having heard any of the selected messages was low (Figure 5.1). About 20 percent of mothers reported hearing messages related to 1) feeding extra meals after a child was recovering from an illness, and 2) feeding babies mashed family foods. All other messages were reported to have been heard by less than 15 percent of mothers.
The drop-off from awareness of a practice to trying it at least once was greater than from trial to adoption of a practice. There were no dramatically different patterns of these drop-offs across practices. In further analyses, we will also examine data on the reasons for non-trial of practices that mothers might have heard about.
Overall, for A&T, to the extent that these types of messages are included in the program communications strategies, continuing to document and understand awareness, trial, and adoption of key practices will help strengthen our understanding of what it takes to improve practices related to IYCF in this context.
Table 5.9 Awareness, trial, and adoption of key IYCF practices
Ever heard Ever trieda Adopteda
Percent Percent Percent
Tigray SNNPR All Tigray SNNPR All Tigray SNNPR All
(n = 1040) (n = 1952) (n = 2,992) (n = 1,040) (n = 1,952) (n = 2,992) (n = 1040 (n = 1,952) (n = 2,992)
- Adding vegetables to child’s gruel/porridge 18.8 10.5 13.3 9.2 6.9 7.7 6.2 5.9 6.0
- Feeding baby mashed foods from family food 29.5 19.9 23.3 23.9 14.7 17.9 19.1 13.8 15.7
- Preparing special foods like mashed meat/fish 10.8 4.6 6.7 3.7 1.2 2.1 2.2 0.8 1.3
- Feeding child extra meal after they recovered from illness 31.4 15.8 21.2 19.5 9.9 13.2 NA NA NA
- Feeding child vitamin and mineral supplements 17.7 8.1 11.4 7.4 4.5 5.5 4.4 3.1 3.5
- Feeding your child mashed fruit 17.6 12.2 14.1 9.9 8.5 9.0 7.6 7.3 7.4 a The trial and adoption analyses were conducted on a full sample instead of those who only said “yes” to awareness, in order to clearly demonstrate the drop-off from awareness to trial and adoption.

51
Figure 5.1 Percentage distribution of awareness, trial, and adoption
5.6 Chapter Summary
In this chapter, we presented the findings on the IYCF practices and related challenges and the knowledge of the caregivers about IYCF. The reported problems related to breastfeeding and complementary feeding were low. Only seven percent of the caregivers reported having any problem when starting breastfeeding; similar percentage mentioned facing problems at 3-4 months of age. When first beginning to breastfeed, frontline health workers and older female family members were the primary source of support. At 3-4 months of age, the role of family members appeared to diminish. The challenges related to initiation of complementary feeding were also low. Two-thirds of the mothers who mentioned any problems reported seeking help from others.
There are major gaps in knowledge of appropriate IYCF practices. Knowledge was high on certain aspects of breastfeeding (time of initiation of BF, EBF) while it was low on others (giving colostrum, baby not needing water in hot weather, or giving other milk or liquids if mother perceived that the baby was not getting enough breastmilk). There were also major knowledge gaps related to complementary feeding, including on time of introduction of foods, which was early for water, and inappropriately late for most complementary foods. Exposure to different IYCF-related messages was low; exposure to breastfeeding-related information was higher than complementary feeding information. The key sources of information were HEWs followed by older female family members (mothers and mothers-in-law). Exposure to sentinel messages was also very low. Trial and adoption were even lower.
In sum, this chapter has highlighted the major issues facing mothers of young children as they attempt to navigate the continuum of IYCF.
0
20
40
60
80
100
Adding vegetables to
child’s gruel/porridge
Feeding baby mashed foods
from family food
Preparing special foods like
mashed meat/ fish
Feeding child extra meal after they recovered
from illness
Feeding child vitamin and
mineral supplements
Feeding your child mashed
fruit
%
Awareness Tried Adoption

52
6. Results: Use of A&T Platform
6.1 Variables
Contact with the health system
This section presents findings related to the health extension program (HEP), which is the key platform for delivering A&T’s community-based interventions. The major focus of this section is to understand the interactions and the contacts between all tiers of the health system, especially the frontline health workers and the target A&T population.
While HEWs are the key health providers to the population, volunteers at the villages play a key, often complementary, role in delivering basic health care to the population. We attempted to get a clearer understanding of this system and, as such, mothers were asked extensively about their interactions with frontline heath workers. We asked the mothers through three separate sets of questions (home, community, and health-post interaction) about their contacts with the HEWs and volunteers, frequencies of these interactions, and exposure to nutrition-related contents, specifically IYCF messages through these interactions.
In addition to community interactions, we assessed utilization of antenatal, delivery, and postnatal care services through the HEP.
Exposure to health information and media
Another major component of the A&T program in Ethiopia focuses on raising awareness regarding IYCF practices using different media outlets. As such, exposure to different media and health-related messages through these media has programmatic importance. Mothers’ exposure to newspapers, radios, TVs, loudspeakers, posters, and community forums was assessed. In addition, mothers were asked if they had seen or received any health or nutrition-related messages through these media.
Access to markets
A&T in Ethiopia also plans to employ the private sector in order to make affordable high quality complementary foods available to its target population. In this respect, it is also important that we understand women’s access to the market. In the survey, therefore, mothers were asked about access to and utilization of local markets.
6.2 Community/Health System Platform
Health extension workers (HEWs) work at the health posts as well as in the communities in close collaboration with volunteer community health workers (VCHPs). The complementary role of the volunteers is a key component of the HEP in creating awareness and improving knowledge regarding common health-related issues. It is expected from the functioning modality of the health extension program that the community would be familiar with the work of the frontline health workers and also be in regular interaction with them.
Table 6.1 presents contacts between respondent mothers and frontline health workers. We find that over 90 percent of the mothers reported knowing at least one HEW compared to around 65 percent who reported knowing a volunteer. The finding is somewhat unexpected, as the volunteers are chosen

53
from within the communities themselves and thus were expected to be more recognized by mothers residing in these communities. Reported contact with HEWs or volunteers was low. Between one-third to one-half of mothers reported having had a home visit by an HEW or a VCHP in the last six months. Percentages of frequencies of home visits mentioned by the mothers were similar for HEWs and VCHPs.
When mothers were asked if the health workers or the volunteers during their recent home visit discussed nutrition or infant feeding, nearly 20 percent of mothers reported that HEWs discussed infant feeding during their recent home visits and around 10 percent received information on breastfeeding. Volunteers were less likely than HEWs to discuss issues related to IYCF practices during their home visits. The most common topic of discussion during home visits was related to hygiene and sanitation, safe water use, family planning, and immunizations.
Table 6.2 presents the finding from questions related to respondent mothers’ contacts with frontline health-care workers outside their home but within the community. Between 20-25 percent of respondent mothers reported having come in contact with an HEW or a VCHP in the community during the last six months. The percentage of community contact was significantly higher for both HEWs and VCHPs in Tigray compared to SNNPR. Key points at which contact was made with either a HEW or a VCHP were immunization outreach activities, followed by community conversations. Only 7 percent of the mothers mentioned growth monitoring (GM) sessions as a contact point with health workers. Topics covered during these contact points in the community were similar to topics covered during home visits, with a major focus on hygiene and sanitation, and family planning discussion about child feeding was relatively higher in Tigray compared to SNNPR. Nearly 26 percent of mothers reported attending child feeding-related discussions held by HEWs in Tigray compared to only 16 percent in SNNPR. Similarly, about 18 percent mothers in Tigray reported feeding-related discussions by VCHPs compared to only 4.6 percent in SNNPR.
Annex Table A6.1 in the annex presents utilization of healthcare services for the child in the past year and exposure to feeding-related advice during the visit.
Table 6.3 describes the use of antenatal care during pregnancy with their youngest child. Only 19 percent of mothers reported being visited by frontline health worker at home while pregnant. The frontline health worker most likely to visit mothers at home is the HEW. Mothers were most likely to be visited for the first time at 4-6 months of their pregnancy. A little over 50 percent of mothers, who reported to have received home visits, mentioned being visited 2-3 times during their pregnancy.
Around 80 percent of the respondents from Tigray and 58 percent from SNNPR reported visiting a health facility while pregnant. Mothers were most likely to visit the health center for the first time during 4-6 months of pregnancy. Health centers and health posts made up the vast majority of facilities visited, with a greater proportion of pregnant women visiting health posts. The mean number of antenatal care visit at the health facilities was 3.3. Around 55 percent of mothers consulted an HEW and 40 percent consulted a nurse or midwife at the health facility.
Annex Table A6.2 presents mothers’ exposure to breastfeeding-related information during pregnancy and sources of such information.
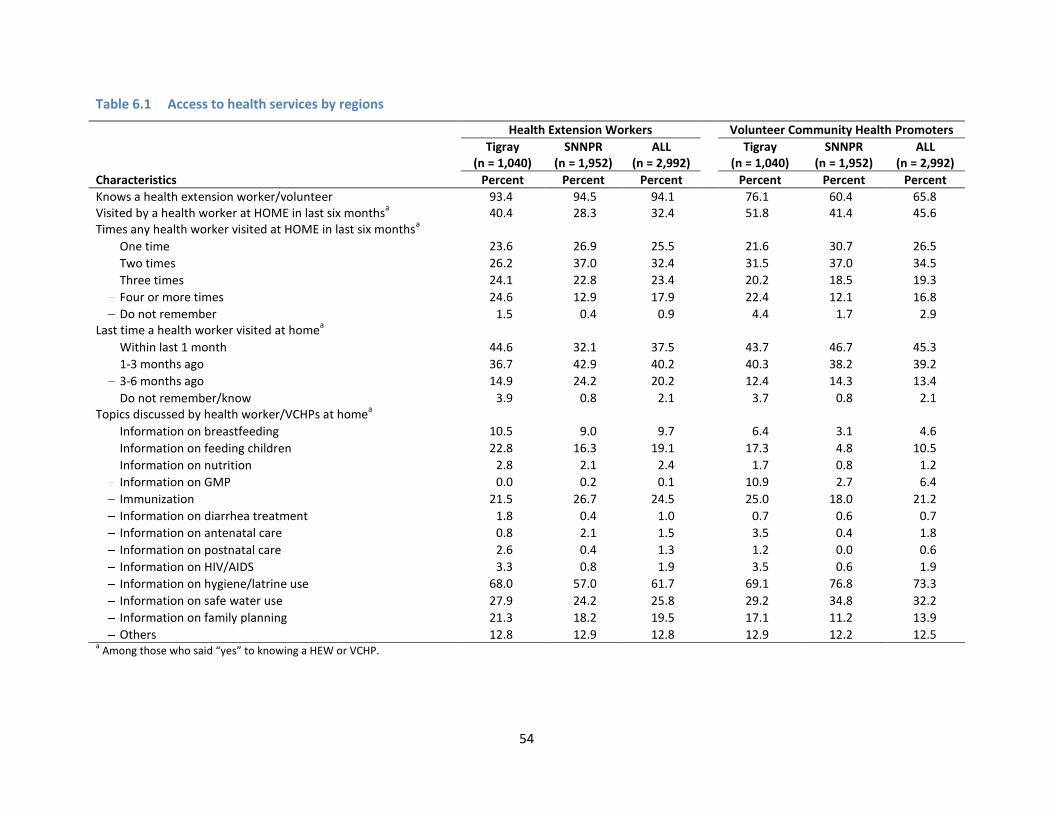
54
Table 6.1 Access to health services by regions
Health Extension Workers Volunteer Community Health Promoters
Tigray (n = 1,040)
SNNPR (n = 1,952)
ALL (n = 2,992)
Tigray (n = 1,040)
SNNPR (n = 1,952)
ALL (n = 2,992)
Characteristics Percent Percent Percent Percent Percent Percent
Knows a health extension worker/volunteer 93.4 94.5 94.1 76.1 60.4 65.8 Visited by a health worker at HOME in last six months
a 40.4 28.3 32.4 51.8 41.4 45.6
Times any health worker visited at HOME in last six monthsa
One time 23.6 26.9 25.5 21.6 30.7 26.5
Two times 26.2 37.0 32.4 31.5 37.0 34.5
Three times 24.1 22.8 23.4 20.2 18.5 19.3
Four or more times 24.6 12.9 17.9 22.4 12.1 16.8
Do not remember 1.5 0.4 0.9 4.4 1.7 2.9 Last time a health worker visited at home
a
Within last 1 month 44.6 32.1 37.5 43.7 46.7 45.3
1-3 months ago 36.7 42.9 40.2 40.3 38.2 39.2
3-6 months ago 14.9 24.2 20.2 12.4 14.3 13.4
Do not remember/know 3.9 0.8 2.1 3.7 0.8 2.1 Topics discussed by health worker/VCHPs at home
a
Information on breastfeeding 10.5 9.0 9.7 6.4 3.1 4.6
Information on feeding children 22.8 16.3 19.1 17.3 4.8 10.5
Information on nutrition 2.8 2.1 2.4 1.7 0.8 1.2
Information on GMP 0.0 0.2 0.1 10.9 2.7 6.4
Immunization 21.5 26.7 24.5 25.0 18.0 21.2
Information on diarrhea treatment 1.8 0.4 1.0 0.7 0.6 0.7
Information on antenatal care 0.8 2.1 1.5 3.5 0.4 1.8
Information on postnatal care 2.6 0.4 1.3 1.2 0.0 0.6
Information on HIV/AIDS 3.3 0.8 1.9 3.5 0.6 1.9
Information on hygiene/latrine use 68.0 57.0 61.7 69.1 76.8 73.3
Information on safe water use 27.9 24.2 25.8 29.2 34.8 32.2
Information on family planning 21.3 18.2 19.5 17.1 11.2 13.9
Others 12.8 12.9 12.8 12.9 12.2 12.5 a Among those who said “yes” to knowing a HEW or VCHP.

55
Table 6.2 Access to health services, by regions
HEW VCHP
Tigray
(n = 1,040) SNNPR
(n = 1,952) All
(n = 2,992) Tigray
(n = 1,040) SNNPR
(n = 1,952) All
(n = 2,992)
Percent Percent Percent Percent Percent Percent
Contact at the community in the last six months
a 33.1 12.6 19.6 43.3 13.7 25.2
Times any health worker/VCHP visited at the community in last six months
b
1 33.9 37.4 35.4 30.3 19.6 27.1
2 22.7 33.5 27.3 26.5 46.0 32.4
3 or more 39.3 28.7 34.8 38.8 27.0 35.3
Do not remember 4.2 0.4 2.6 4.4 7.4 5.3 Contact points at the community
b
Immunization outreach 46.7 45.3 46.1 39.3 24.5 34.9
Community conversation 19.1 23.3 20.8 25.8 35.1 28.6
EOS/child days 4.4 6.0 5.1 8.7 8.6 8.7
Growth monitoring session 8.3 5.6 7.1 9.0 2.7 7.1
Women's group meeting 2.2 6.0 3.8 1.7 3.3 2.2
Coffee ceremony 0.0 0.0 0.0 2.3 4.0 2.8
Others 19.4 13.8 17.0 13.2 21.9 15.8 Topics discussed by health worker/VCHPs
at the communityb
Information on breastfeeding 8.3 11.5 9.7 6.6 2.9 4.6
Information on feeding children 25.6 16.3 21.6 17.6 4.6 10.6
Information on nutrition (vitamin A, iron) 2.4 2.0 2.2 1.8 0.8 1.3
Information on GMP 13.4 6.8 10.5 10.9 2.5 6.4
Immunization 48.5 46.0 47.5 25.6 18.2 21.6
Information on hygiene/latrine use 44.6 43.7 44.2 69.0 76.4 73.0
Information on safe water use 7.7 10.3 8.8 28.3 34.6 31.7
Information on family planning 16.1 27.8 21.1 16.7 11.1 13.6 a
Mothers were asked whether they came in contact with the frontline health workers at the community outside their homes. b Among those who said “yes” to coming in contact with any HEW or VCHP in the last six months.
In addition, Annex Tables A6.3 and A6.4 present child growth monitoring information. Less than 10 percent of the mothers reported taking their children for a health check-up in the last one year. Of those who had a health check-up, 22 and 40 percent reported their child’s height and weight having been measured. In Tigray, the proportion of children weighed was much higher compared to SNNPR (62.7 percent vs. 23.9 percent). Half of all mothers reported being told about their child’s growth, and the same proportion were given advice related to child growth.
Twenty-three percent of mothers in Tigray and 15 percent in SNNPR reported having growth cards. Nearly 20 percent of the children were weighed in the last three months, which was much higher in Tigray, at 37 percent, compared to 10.4 percent in SNNPR. A little over half of the mothers reported being told if the child had gained or lost weight. Half of them were give some sort of advice and 15 percent were given food. The most common food given after the child was weighed was corn soya blend, “fafa”.

56
Table 6.3 Use of prenatal care when pregnant with the last child
Tigray
(n = 1,040) SNNP
(n = 1,952) All
(n = 2,992)
Characteristics Percent Percent Percent
Visit at home Health personnel or community health worker visited at home during
pregnancy 23.9 16.4 19.0 The person who visited
HEW 70.8 90.9 82.1
VCHP 44.4 17.6 29.4
TBA 1.6 2.8 2.3
Others 1.6 0.7 Months pregnant when first visited
1-3 months 11.3 10.8 11.0
4-6 months 73.6 58.2 64.9
7-8 months 13.4 27.9 21.6
9 months 1.7 3.2 2.5 Times visited by a health worker
Only once 20.4 19.7 20.0
2-3 times 52.1 59.4 56.3
More than three times 27.5 20.9 23.8 Visit at the health facility
Visited a health facility 79.4 58.1 65.5 The facility visited at
Government hospital 3.2 5.6 4.6
Health Center 46.4 30.9 37.4
Health Post 49.9 63.3 57.7
Outreach 0.1 0.1 0.1
NGO health facility - 1.8 1.0
Private health facility 0.1 0.5 0.4
Other 3.2 1.1 2.0 The health personnel who provided the services
Doctor 3.1 1.2 2.0
Nurse/midwife 41.7 37.7 39.4
HEW 49.9 59.3 55.4
Other health worker 2.2 1.0 1.5
Others 0.1 0.1 0.1
Do not remember 3.0 0.7 1.7 Mean number of visits 3.4(1.6) 3.3(1.5) 3.3(1.6) Months pregnant when first visited
1-3 months 16.9 10.0 12.9
4-6 months 71.1 66.7 68.6
7-8 months 11.7 21.6 17.5
9 months 0.3 1.7 1.1
Table 6.4 presents the findings related to assistance received during delivery and postnatal care. Despite a relatively high percentage of contact with frontline health workers and/or a visit to a health facility during pregnancy, a very small percentage of mothers delivered at a health facility. Ninety percent of mothers delivered at their homes, with another 4 percent at their mother’s home. Sixty percent of the home deliveries were assisted by someone who was a relative or a friend. Seven percent of respondents in Tigray and 20 percent in SNNPR reported being assisted by traditional birth attendants. Twenty percent of mothers reported being visited by a health professional immediately after birth. Of these mothers, 70 percent were visited by an HEW and 38 percent reported a visit by a volunteer. A visit by an

57
HEW was reported by more mothers in SNNPR, while, in Tigray, reported visits by volunteers was almost twice as high as in SNNPR. Only 20 percent of the mothers reported having received vitamin A and 30 percent mentioned having discussions regarding breastfeeding immediately after birth.
Table 6.4 Assistance during delivery and postnatal care, by regions
Tigray
(n = 1,040) SNNPR
(n = 1,952) All
(n = 2,992)
Percent Percent Percent
Place of birth
Own home 83.8 94.2 90.6
Mother’s home 7.8 2.0 4.0
Government hospital 2.4 1.9 2.1
Government clinic/health centre 3.7 1.1 2.0
Private hospital 0.0 0.2 0.1
Private clinic 0.0 0.2 0.1
Other public 0.5 0.0 0.2
Others 1.8 0.6 1.0 The person assisted in the birth
No one 2.2 14.4 10.2
Doctor 1.9 0.9 1.2
Nurse/midwife 5.1 2.6 3.5
Auxiliary midwife 0.4 0.1 0.2
Health Extension Worker 6.1 1.6 3.2
Traditional birth attendant 7.3 20.1 15.6
Community Health Volunteer 7.4 0.6 3.0
Relative/friend 67.9 56.7 60.6
Others 4.8 6.1 5.7 Visited by a health professional after birth 28.2 17.4 21.1 The person who visited after birth
HEW 60.4 81.0 71.8
VCHP (CBRHA, CHP) 53.0 25.3 37.7
Traditional birth attendant 1.1 3.9 2.7
Others 3.3 0.9 2.0 Receive vitamin A at birth or soon after 35.8 13.0 20.9 Anyone help you with breastfeeding 32.9 18.8 23.7 The help in breastfeeding
Talking to you about breastfeeding 34.4 26.0 30.0
Showing you ways to breastfeed properly 45.8 41.5 43.6
Both 19.8 32.5 26.4
6.3 Exposure to Media
Exposure to different media outlets was relatively low as reported by the respondents. Other than radio, community meetings are important platforms for sharing information on health in rural Ethiopia (Table 6.5). Only 20 percent of the respondents reported having ever heard any health messages on the radio and 17 percent were exposed to messages on women and children through community gatherings. Exposure to other forms of media (television, newspapers, posters, and loudspeakers) was low, at less than 5 percent. In general, exposure to any kind of health messages through different media was reported by a higher percentage of women from Tigray compared to SNNPR.

58
Of those ever hearing any health-related message on the radio, 33 percent of respondents from Tigray and 23 percent from SNNPR reported hearing health-related messages on radio in the last seven days. In both Tigray and SSNPR, of those who have ever heard health messages for women and children through community gatherings, approximately 16 percent reported hearing these messages within the last 7 days.
Table 6.5 Exposure to information on health and nutrition, by regions
Tigray
(n = 1,040) SNNPR
(n = 1,952) All
(n = 2,992)
Characteristics Percent Percent Percent
Ever seen:
Seen any message for women or children on paper 5.0 2.4 3.3
Heard health message for women or children on radio 23.0 18.2 19.9
Seen/heard any health message for women or children on TV 5.0 3.8 4.3
Seen any health message for women or children on poster 6.5 5.0 5.5
Heard any health message for women or children on loudspeaker 4.8 1.8 2.8
Heard any health message for women or children on community gathering (Edir, Equb) 25.4 13.3 17.5
In last seven daysa:
Seen any message for women or children on paper 17.0 19.6 18.2
Heard any health message for women or children on radio 32.6 22.8 26.8
Seen/heard any health message for women or children on TV 34.6 13.3 22.1
Seen any health message for women or children on poster 27.9 15.5 20.6
Heard any health message for women or children on loudspeaker 18.0 17.1 17.7
Heard any health message for women or children on community gathering (Edir, Equb
b) 15.7 16.9 16.3
a Among those who said “yes” to ever seeing or hearing the respective messages.
b Edir is local insurance, mostly funeral; Equb is community bank.
Respondents were probed about their general exposure to TV, radio, and community social meetings (Table 6.6). Regular exposure (more than once per week) to radio (44 percent) was significantly higher than TV (11 percent). Between 40–50 percent of respondents reported attending a monthly village social meeting.

59
Table 6.6 Exposure to media (TV, radio, community meetings), by regions
Tigray (n = 1,040)
SNNPR (n = 1,952)
All (n = 2,992)
Characteristics Percent Percent Percent
Ever watched/listened/attended TV 30.6 35.9 34.0
Radio 51.4 52.4 52.1
Village social meeting 44.1 43.9 44.0 Frequency of watching TV
Daily (7 days a week) 3.5 1.7 2.3
2-6 days a week 1.3 0.9 1.0
Once a week 9.8 7.1 8.0
Once every two weeks 2.8 2.2 2.4
Once a month 9.2 8.7 8.9
Rarely 73.5 79.4 77.5 Frequency of listening to radio
Daily (7 days a week) 23.3 17.1 19.3
2-6 days a week 16.1 15.7 15.8
Once a week 8.6 8.8 8.7
Once every two weeks 3.1 3.5 3.4
Once a month 9.0 6.9 7.7
Rarely 40.0 48.0 45.2 Frequency of attending village social meetings
Daily (7 days a week) 1.2 1.9 1.7
2-6 days a week 1.2 6.2 4.5
Once a week 5.8 21.2 15.7
Once every two weeks 10.7 9.7 10.1
Once a month 50.6 41.9 45.0
Rarely 30.5 19.1 23.2
6.4 Access and Use of Markets
Table 6.7 provides results on access to market, by region. Nearly 90 percent of the mothers said that the most common places for them to shop were at markets in other villages. The majority of mothers reported making daily food purchase-related decisions on their own. Access to markets within a 1-hour commute (by the most common means of transport) was significantly higher in SNNPR than in Tigray. In SNNPR, 70 percent of the mothers stated that they could reach a market within 1 hour, using the most common mode of transportation. In Tigray, mothers spent more time reaching markets than in SNNPR. The mean distance to the nearest market was 5.4 kilometers in SNNPR and 8.8 kilometers in Tigray. About 27 percent of the respondents said that they bought special food for their children and 63 percent of those mothers said that they were the ones who usually bought special foods for their children.
Annex Table A6.5 presents the purchasing patterns of complementary foods available at the market. The respondents were asked if they had ever purchased any of the prepared complementary products available at the market. Only 8 percent of the respondents reported ever purchasing any of these products. For those who used the purchase of products, Fafa was the most common. Only half of those who reported ever purchasing the products were also currently purchasing these.

60
Table 6.7 Access to market, by regions
Tigray (n = 1,040)
SNNPR (n = 1,952)
All (n = 2,992)
Characteristics Percent Percent Percent
Most common place to shop Market in other village 90.8 83.5 86.0
Neighborhood shop 1.6 0.5 0.9
Village market 7.6 16.2 13.2
Wholesale market 4.0 5.2 4.8 Person who purchases most of the food
Husband/ partner 26.4 7.3 14.0
Self 52.4 76.4 68.0
Both 16.8 12.4 14.0
Someone else 4.4 3.7 3.9 Distance to the nearest market by the most common mode of transportation
Within 1 hour 30.7 68.9 54.0
1-2 hours 31.7 23.0 26.3
More than 2 hours 37.6 8.6 19.7 Mean travel time in hours (SD) 2.3(1.3) 1.4(0.7) 1.7 (1.1) Mean distance to the market in kilometers (SD) 8.8(5.3) 5.4(3.5) 6.5(4.4) Special food purchases for children 30.8 24.7 26.8 Person who purchases these child foods
Husband/ partner 24.3 12.8 17.4
Self 51.1 70.8 63.0
Both 21.1 12.4 15.9
Someone else 3.5 3.9 3.8
6.5 Chapter Summary
In this chapter we presented findings related to interactions between the survey respondents and the health extension program’s (HEP) workers and volunteers. The reach of the HEP was found to be widespread, at least in terms of respondent knowledge of HEP staff. Almost all respondents reported knowing an HEW and two-thirds knew a volunteer. Although a high percentage of the respondents mentioned knowing an HEW, only about a third of respondents were visited at home by an HEW in the last six months at home and twenty percent had met an HEW at the community level in the last six months. Major focus topics of the respondent-HEP staff interactions were on hygiene and sanitation, child immunization, and safe water use. Although a lower percentage of the mothers mentioned knowing a VCHP, interaction with a VCHP was higher compared to HEWs. Nearly 45 percent of the respondents were visited by a VCHP at home in the last six months and 1 in 4 interacted with a VCHP in the community. Immunization outreach and community conversations were two key platforms for these interactions. The major topics of these interactions were issues related to hygiene and sanitation and child immunization.
Healthcare utilization during pregnancy and at the time of delivery was also assessed. Sixty-five percent of women visited a health facility for antenatal care but over 90 percent of women delivered at home with assistance from friends or family members. Twenty-one percent of the respondents were visited by a health worker immediately after birth, mainly by a HEW.

61
Exposure to media was very low. Radio and community meetings were the most important platforms for sharing information on health. About one in four women had heard health messages for women or children on radio in the last seven days and sixteen percent had heard any health message for women or children at a community gathering in the last seven days. Market access was moderate, although the distance was significant. The mean distance to the nearest market was 6.5 kilometers but mean travel time is 1.7 hours, and the survey respondents, the mothers, were mainly responsible for food shopping.
To sum up, this chapter has highlighted the positive findings on the reach of HEP, and, thus, the potential for the HEP to serve as an outreach platform for IYCF as well as the other core topic areas of the HEP. At the same time, the potential for media interventions to support more direct and interpersonal interventions could be somewhat limited because of low access.

62
7. Results: Child, Caregiver, and Household Characteristics That Influence IYCF and Nutrition
7.1 Variables
Child characteristics
The nutritional status and IYCF-related indicators of the surveyed children are presented in earlier sections. In this section we present two other important characteristics most closely related to child’s nutritional status and overall well-being: 1) morbidity and 2) immunization status.
The prevalence of the four most common childhood illnesses, fever, cough/cold, fast breathing/shortness of breath, and diarrhea, were estimated from mother’s recall of the symptoms in the two weeks prior to the survey. The prevalence of the illnesses was compared in three age groups (0–5.9 months, 6–23.9 months, and 24–59.9 months). Mothers were then asked questions to elicit the care seeking pattern for these illnesses.
Mothers/caregivers’ characteristics
Information on mothers’/caregivers’ mean age, education, working status, and civil status is presented in Table 3.1b. In addition to the general characteristics, maternal nutritional status was measured by taking height and weight. Two indicators of nutritional status are presented here: mothers’ height and body mass index (BMI). The height of a woman is associated with past socioeconomic status and nutrition during childhood and adolescence [1]. BMI indicates chronic energy deficiency of the mothers. BMI is defined as weight in kilograms divided by height squared in meters (kg/m2). A cut-off point of < 18.5 is used to define acute undernutrition, between 18.5 and 24.9 is normal, and a BMI of ≥ 25 or above indicates obesity.
Mothers’ physical and mental health
In addition to maternal nutritional status, mothers’ physical and mental health was assessed. Mothers are asked to assess their own health compared to women in their surroundings, using a visual analogue scale (VAS). Mothers chose their own health status from this scale, which was divided into three categories: bad health, good health, and very good health.
In addition, maternal distress was measured through a 20-item Self Reporting Questionnaire (SRQ-20) [10]. Each item is coded as 0 for “no” and 1 for “yes.” A summative scale was constructed from all 20 items. A higher score means more mental distress. A cut-off point of 7 was used to show the level of distress in terms of high and low. This cut-off score has been applied based on literature available for Ethiopia [11,12]. Studies have found association between maternal mental disorder and infant development and morbidity.
Mothers’ control over household assets and decisionmaking ability
In this survey, we collected information on mothers’ control of household assets. Control was measured by asking if the mother owned a particular item and if the mother had the right to sell that item if needed. The survey also assessed women’s ability to purchase household items. In addition to

63
purchasing ability, respondents’ decisionmaking power either alone or jointly was assessed through a set of questions that covered issues such as buying important things for the family, and seeing a doctor.
Household characteristics
Household socioeconomic status This survey collected data on a number of variables to measure socioeconomic conditions of the surveyed population. The variables included quality of housing (ownership of house, garden, materials used for construction of the house), access to services (electricity, cooking facility, type of toilet facilities), ownership of livestock (number of cows, sheep, etc.), ownership of household goods (radio, telephone, bed, jewelry, etc.).
Household food insecurity Household food insecurity was measured applying FANTA/USAID’s Household Food Insecurity Access Scale (HFIAS) [13]. There are nine questions that the respondents were asked to reflect three different domains of food insecurity (access). The domains are 1) anxiety and uncertainty about the household food supply, 2) insufficient quality, and 3) insufficient food intake and its physical consequences. The questions refer to a period of 30 days prior to the survey. Each question represents an increasing level of severity of food insecurity, thus coded as never, rarely, sometimes, and often). A HFIAS score constructed from the nine questions is a continuous measure of the degree of food insecurity (access) in the household during the past 30 days. The maximum score for a household is 27 and the minimum is 0. The higher the score, the more food insecure was the household. In addition to HFIAS score, four HFIA categories were constructed from the nine questions in a way in which a household can only fall into one category. These are “food secure,” “mildly food insecure,” “moderately food insecure,” and “severely food insecure.” A food-secure household experiences none of the food security (access) conditions, or just experiences worry very rarely. A mildly food-insecure (access) household worries about not having enough food sometimes or often, and/or is unable to eat preferred food, and/or eats a monotonous diet or less preferred foods, but only rarely. A moderately food-insecure household sacrifices quality more frequently, eating a monotonous diet or less-preferred foods sometimes or often, and/or has started to cut back on quantity by reducing size of means or number of meals, rarely or sometimes. A severely food-insecure household has to cut back on meal size or number of meals often, and/or experience any of the three most severe conditions (going a whole day without eating, going to bed hungry, or running out of food), even as infrequently as rarely. There is clear rationale for inclusion of this information, as studies have found an association between household food security and child’s feeding practice [14].
Household food dietary diversity In addition to children’s dietary diversity, in the baseline survey we collected data to understand the dietary diversity of the adults in the household. The respondents were asked to recall what kinds of food they and another adult family member ate on the previous day of the survey from a list of 15 different types of foods. If the previous day was a holiday or a special day, the information was collected for the day before. A mean dietary diversity score was constructed using these 15 different questions for the respondents and another adult in the household. In addition, data were categorized into four different diet diversity groups based on the number of foods consumed.

64
Economic shocks
We collected data on experienced economic shocks during the previous 12 months. We asked questions on 13 different shocks and estimated the proportion of households that experienced any of these 13 shocks in the previous 12 months. Studies have found an association between economic shocks and nutritional attainments of the children in Ethiopia [15,16].
Social and food assistance
We collected data on receipt of social assistance at the time the survey was being conducted. We further asked who in the household the primary beneficiary of such assistance was, and what type of assistance this was.
7.2 Child Characteristics
Table 7.1 presents the prevalence of four common childhood illnesses over the last two weeks for children 0–59 months of age. The illnesses include fever, cold, breathing problems, and diarrhea. The prevalence of these conditions was 27 percent, 32 percent, 10 percent, and 16 percent for fever, cold, breathing problems, and diarrhea, respectively. In SNNPR, the prevalence was slightly higher for all four conditions compared to Tigray. Thirty percent of respondent mothers from SNNPR complained of fever compared to 22 percent in Tigray. Reported cold was also higher in SNNPR compared to Tigray. However, a higher percentage of respondents in Tigray sought treatment for illnesses.
The treatment-seeking pattern was more or less similar for all four illnesses, with approximately one-third of respondents seeking treatment. Over 65 percent of respondents reported going to the formal medical sector (doctors, heath centers, hospitals) for treatment, and between 17 to 23 percent of the respondents reported going to the HEWs at the health post. There was a high rate of satisfaction with the treatment sought, with 80 percent reported being satisfied.
Figure 7.1 presents the prevalence of different illnesses by age groups. All four conditions peaked in the middle age group of 6–23.9 months of age. Fever and cold are the two most common illnesses among children under 5 years of age. Over 30 percent and 20 percent of the mothers reported that their children suffered from colds and diarrhea, respectively, in this age group in the last two weeks. The prevalence of cold was also higher than 30 percent in the 6–23.9 months age group. There were no major differences in the prevalence of shortness of breath among the age groups.
Table 7.2 presents feeding practices reported by the caregivers during the recent bout of diarrhea. Only 21 percent said that they increased babies fluid intake during the illness and 14 percent reported stopping liquids altogether during diarrhea. Only 15 percent of those who had started having semisolid/solid foods were also given more than the usual quantity of food. Only 25 percent mentioned giving an oral rehydration solution during diarrhea. Annex Table A7.1 presents feeding advice received during the reported illnesses.

65
Table 7.1 Prevalence in child morbidity symptoms in the previous two weeks, by region
Fever Cold Breathing problem Diarrhea
Tigray (n = 1,040)
SNNPR (n = 1,952)
All (n = 2,992)
Tigray (n = 1,040)
SNNPR (n = 1,952)
All (n = 2,992)
Tigray (n = 1,040)
SNNPR (n = 1,952)
All (n = 2,992)
Tigray (n = 1,040)
SNNPR (n = 1,952)
All (n = 2,992)
Percent Percent Percent Percent Percent Percent Percent Percent Percent Percent Percent Percent
Suffered from 21.6 29.7 26.9 25.1 35.6 31.9 7.6 10.6 9.6 13.0 17.4 15.9 Sought treatment for 38.1 30.7 32.8 30.6 24.5 26.2 37.2 27.7 30.6 36.8 30.3 32.2 Who provided the treatment
Formal medical sector 70.0 66.9 67.9 63.8 67.1 66.0 65.8 67.2 66.7 66.7 65.7 66.0
Health Extension Worker at the Health Post 17.8 18.0 17.9 21.3 18.5 19.4 15.8 20.7 18.8 25.9 21.0 22.6
Traditional healer 1.1 4.5 3.4 1.3 2.9 2.4 2.6 0.0 1.0 1.9 5.7 4.4
VCHP 0.0 0.0 0.0 1.3 0.0 0.4 2.6 0.0 1.0 0.0 0.0 0.0
Pharmacy 2.2 9.6 7.1 2.5 9.3 7.1 2.6 10.3 7.3 1.9 6.7 5.0
Family neighbor, others 2.2 0.6 1.1 1.3 1.7 1.6 5.3 1.7 3.1 0.0 1.0 0.6
Neighbor/friend 2.2 0.0 0.8 2.5 0.0 0.8 0.0 0.0 0.0 3.7 0.0 1.3
Other 4.4 0.6 1.9 6.3 0.6 2.4 5.3 0.0 2.1 0.0 0.0 0.0 Satisfied with the treatment 78.9 84.7 82.7 78.1 79.7 79.1 82.9 81.4 81.9 78.2 78.1 78.1

66
Figure 7.1 Prevalence of selected morbidity symptoms in previous two weeks, by age group
Table 7.2 Feeding practice during diarrhea
Tigray (n = 141)
SNNPR (n = 334)
All (n = 475)
When the child had diarrhea. . . Percent Percent Percent
How much drink was the child given Much less 10.6 8.1 8.8
A little bit less 31.9 31.4 31.6
About the same 14.2 26.4 22.7
More 27.7 18.3 21.1
Nothing to drink 14.9 14.7 14.7
Do not know 0.7 1.2 1.1 How much food was the child given
Much less 16.4 9.9 12.0
A little bit less 39.8 45.8 43.9
About the same 21.1 26.9 25.0
More 21.1 12.1 15.1
Stopped giving food 0.8 4.6 3.3
Do not know 0.8 0.8 0.8 Oral saline solution/Lem Lem given 30.5 22.8 25.1
Mothers were asked about their perception of their own children’s health and their appetite for eating (Table 7.3). Over half of mothers thought their child’s health was very good. Only 9 percent perceived their child’s health to be not good. Mothers’ perception of their child’s health was also positive overall (Annex Figure A7.1). More than 60 percent of the mothers reported their children having a very good
0
10
20
30
40
Fever Cold Shortness of breath
Diahrrea
%
Illnesses
0-5.9m
6-23.9m
24-59.9m

67
appetite as opposed to only around 8 percent reporting their child’s appetite as not good (Annex Figure A7.2).
The same table (Table 7.3) also shows that over 65 percent of the mothers reported taking some kind of action, such as forcing, caressing, etc., if the child refuses to eat. The most commonly adopted technique to encourage a child to eat was trying with other kinds of food, playing with the child, and caressing the child. If the child refused to eat for several days, then mothers were likely to consult an HEW or take the child to a health facility. About 10 percent of the mothers said that they did nothing if the child refused to eat for several days.
Table 7.3 Mothers’ perception of child health and appetite
Tigray (n = 1,040)
SNNPR (n = 1,952)
All (n = 2,992)
Percent Percent Percent
Perception of child’s health Health is not good 11.7 7.0 8.6
Health is good 39.5 31.1 34.0
Health is very good 48.8 61.9 57.3 Perception about child’s appetite
Not good 9.9 6.7 7.8
Good 36.1 29.7 31.9
Very good 54.0 63.6 60.2 Does something when child refuses to eat 70.2 66.2 67.6 Encourage the child to eat (n = 2,023)
a
Force her/him to eat 3.3 7.8 6.2
Caress 32.8 39.9 37.3
Play with her/him 33.3 38.1 36.4
Give other types of food 47.5 30.3 36.5
Threaten 2.6 1.9 2.1
Beat 0.7 0.4 0.5
Other 8.1 2.7 0.5 If encouragement fails (n = 2,023)
a
Force her/him to eat 3.3 5.6 4.8
Caress 20.2 19.3 19.6
Play with her/him 28.7 30.1 29.6
Give other types of food 45.3 48.4 47.3
Threaten 3.6 1.7 2.4
Beat 1.1 1.7 1.5
Other 4.4 1.9 2.8 No appetite for some days, then
Give tea 5.7 2.2 3.4
Give vitamins 0.2 0.0 0.1
Take to the clinic (hospital, dispensary, health center, doctors, etc.) 46.8 43.4 44.6
Take to traditional doctor 1.0 2.6 2.0
HEW/health post 28.8 30.9 30.2
Other 2.7 1.0 1.6
Do nothing 9.1 11.9 10.9
Child always has appetite 5.9 8.0 7.3 Eat by her/himself
Eats alone 52.4 48.4 49.8
Someone feeds him 47.6 51.7 50.2
(continued)
The child gets help to eat solid/semi solid from

68
Tigray (n = 1,040)
SNNPR (n = 1,952)
All (n = 2,992)
Percent Percent Percent
Nobody—she/he eats alone 52.4 49.0 50.2
Another child 2.9 3.2 3.1
Mother 20.8 22.9 22.1
Another adult 0.6 0.4 0.5
Does not eat yet 23.4 24.5 24.1 The child gets help to drink liquid foods from
Nobody—she/he eats alone 47.8 46.2 46.7
Another child 4.0 3.2 3.5
Mother 22.1 25.4 24.2
Another adult 0.5 0.4 0.4
Does not eat yet 25.6 24.9 25.1 Foods that can be held in hand
Nobody—she/he eats alone 53.5 52.0 52.5
Another child 1.9 2.0 2.0
Mother 12.6 19.4 17.0
Another adult 0.3 0.4 0.4
Does not eat yet 31.7 26.3 28.2 a Among those who said "yes" to doing something if the child refuses to eat.
Immunization against six major preventable diseases is considered to be a key component of a health system. In Ethiopia, vaccines are provided against tuberculosis (BCG), measles, poliomyelitis, diphtheria, tetanus, pertussis, hepatitis b, and hemophilus influenza. Pentavalent (PENTA)6 (also see footnote at Table 7.4) consists of five vaccines. The immunization status of children is estimated in the subsample of children aged 12–23 months and reported in Table 7.4. This is standard practice for reporting immunization coverage. Information was collected on the immunization of all the surveyed children from two sources: from vaccination cards shown to the surveyor and from the mothers’ verbal reports. If the card was available, the interviewer noted the status of different vaccinations based on the card. If the card was not available, or in the card, a certain vaccine was not recorded, the interviewer asked the respondent to recall if the vaccine was given to the child. Since data from health cards are most valid, in Table 7.4 the vaccination status is reported from both sources and from either source.
Overall, child immunization status is low. According to health cards, only 13 percent of children in this age group received all the recommended vaccines. According to mothers’ reports, the percentage is only slightly higher, at 20 percent. Thirty-five percent of children received all the required vaccines as per either source. In Tigray, about 22 percent received all the vaccines compared to only 8 percent in SNNPR, according to the card data. The overall vaccination status of children was much better in Tigray compared to SNNPR. The percentage of children who received vaccination against BCG in Tigray is 60 percent, compared to 30 percent in SNNPR. Similarly, over 50 percent of the children received Polio3 and PENTA3 compared to less than 25 percent children in SNNPR.
6 Pentavalent is a multi-dose vaccine consisting of the following five vaccines: Diphtheria, Tetanus Toxoid, Pertussis,
Hepatitis B, and Hemophilus Influenzae (Hib).

69
Table 7.4 Child immunization status, by source of information, by region
Percentage of children age 12-23 months who received specific immunizations at any time before the survey, by source of information (immunization card or mother's report)
BCG
Polio PENTAa
Measles All
vaccinated No
vaccination No. of
children
0 1 2 3 1 2 3
Tigray (n = 207)
Vaccination at any time before the survey (12-23 months)
Vaccination card 60.9 27.5 59.9 56.5 52.7 57.0 55.6 52.7 47.3 22.2 – 207 Mother's report 22.2 21.3 32.9 32.4 29.0 29.5 29.0 27.1 24.2 13.0 – 207 Either sources 83.1 48.8 92.8 88.9 81.6 86.5 84.5 79.7 71.5 35.8 4.4 207
Received vitamin A in the last six months 74.2
SNNPR (n = 343)
Vaccination at any time before the survey (12-23 months)
Vaccination card 30.9 11.4 26.8 24.5 19.8 30.6 29.2 25.1 21.6 7.9 – 343 Mother's report 44.9 37.3 49.3 46.7 43.4 44.0 42.3 39.4 37.9 25.4 – 343 Either sources 75.8 48.7 76.1 71.1 63.3 74.6 71.4 64.4 59.5 33.8 14.0 343
Received vitamin A in the last six months 57.3
All (n = 550)
Vaccination at any time before the survey (12-23 months)
Vaccination card 42.2 17.5 39.3 36.6 32.2 40.6 39.1 35.5 31.3 13.3 – 550 Mother's report 36.4 31.3 43.1 41.3 38.0 38.6 37.3 34.7 32.7 20.7 – 550 Either sources 78.6 48.7 82.4 77.8 70.2 79.1 76.4 70.2 64.0 34.6 10.4 550
Received vitamin A in the last six months 63.1 a Pentavalent is a multi-dose vaccine consisting of the following five vaccines: diphtheria, tetanus toxoid, pertussis, hepatitis B, and hemophilus influenza (Hib).

70
According to the WHO guideline, children are considered fully vaccinated if a child has received BCG, three doses of PENTA and polio vaccines, and a measles vaccination by the age of 12 months. In this survey, the date of immunization was not collected, and as a result this indicator could not be estimated.
7.3 Mothers’ Characteristics
Maternal or caregivers’ nutritional status is presented in Table 7.5. Approximately 25 percent of mothers were underweight (BMI < 18.5 kg/m2) and 2 percent were overweight. More women in Tigray were malnourished as per this standard compared to the women from SNNPR. Mean height of the mothers was 156.5 centimeters. Only 2 percent of the mothers were of short stature, below 145 centimeters.
Table 7.5 Women’s nutritional status, by region
Tigray
(n = 1,040) SNNPR
(n = 1,952) All
(n = 2,992)
Percent Percent Percent
Height below 145 cm 1.8 2.7 2.4 Body mass index categories
Underweight (< 18.5) 32.5 20.2 24.5
Normal (18.5-24.9) 66.5 76.7 73.2
Overweight (> 25) 0.7 2.7 2.0
Mean (SD)
Range Mean (SD)
Range Mean (SD)
Range
Body mass index 19.5 (2.0) (14.4-35.8)
20.2 (2.3) (14.3-49.0)
20 (2.2) (14.2-49.0)
Height in cm
156.5(8.4) (48.4-176.1)
156.6(8.6) (50.9-188.0)
156.6 (8.5) (48.4-188.0)
We assessed mothers’ overall health according to their own perception compared to the health of other women in their surroundings (Table 7.6). A little over half of the study mothers perceived their health as quite good compared to the other women in the area. Only around 4 percent of mothers thought that their health was bad.
We also assessed mental distress of mothers using the WHO-self reporting questionnaire (SRQ) and used the cut-off point, 7, on a range of 1–20. The mean stress level was 6.0. According to this scale, about 40 percent of women had a high mental distress level as per this cut-off.
Table 7.7 presents women’s control over household assets. Items are mostly possessed jointly with their spouse. About 4 percent of the respondents reported owning the house where they lived by themselves and 80 percent of those had the ability to sell these items. Less than 4 percent reported owning any large or small animals alone. Over 70 percent who owned the animals reported having the power to sell them.

71
Table 7.6 Women's perceived physical and mental well-being, by region
Tigray
(n = 1,040) SNNPR
(n = 1,952) All
(n = 2,992)
Percent Percent Percent
Women's self reported health compared to other women in the area:
Bad health 4.3 3.0 3.4
Health not bad 46.5 37.8 40.8
Good health 49.1 59.2 55.7 Stress:
Do you often have headaches? 47.5 51.7 50.3
Is your appetite poor? 32.2 40.9 37.9
Do you sleep badly? 58.1 65.6 63.0
Do you easily get frightened? 32.4 34.0 33.4
Do your hands shake? 11.8 12.6 12.3
Do you feel nervous? 34.6 40.7 38.5
Is your digestion poor? 0.1 30.2 19.8
Do you have trouble thinking clearly? 15.3 20.5 18.7
Do you feel unhappy? 28.4 30.2 29.6
Do you cry more than usual? 11.3 18.1 15.7
Do you find it difficult to enjoy your daily activities? 20.7 25.1 23.5
Do you find it difficult to make decisions? 22.4 29.2 26.9
Is your daily work suffering? 24.1 29.6 27.7
Are you unable to play a useful part in life? 13.9 18.1 16.6
Have you lost interest in things? 22.1 26.4 24.9
Do you feel that you are a worthless person? 11.5 12.1 11.9
Has the thought of ending your life been on your mind? 9.4 9.8 9.7
Do you feel tired all the time? 51.9 53.4 52.9
Do you have uncomfortable feelings in your stomach? 29.2 41.7 37.4
Do you easily get tired? 47.6 50.8 49.7 High mental stress score (≥ 7)
a 34.0 41.8 39.0
Mean (SD) Mean (SD) Mean (SD)
Mean of stress scale (range: 0-20 ) 5.2 (4.1) 6.4 (5.0) 6.0 (4.7) a Cut-off point for maternal mental stress is 7 or above (based on literature).
Table 7.8 presents women’s ability to purchase certain household items. While nearly half of respondents reported the ability to buy a small amount of rice, vegetables, or beans, less than 20 percent reported having the power to buy a larger quantity of these items. Only around 30 percent of women could buy clothes or medicine for themselves or their children. Less than 30 percent of women reported the power to buy special foods for children. The mean purchasing power was 2.7, based on a scale of 0–8.
Further decisionmaking power of women within the household was explored and is presented in Table 7.9. Over 60 percent of women said they have the power to make decisions on child feeding-related matters. On all other matters, less than 30 percent of women reported being able to make decisions alone. Many of the decisions were made jointly in the households. Around 70 percent of women said they made joint decisions on matters related to family planning, sending the child to school, what to do if the child was sick, or disciplining the children.

72
Table 7.7 Women’s control over household assets, by region
Tigray (n = 1,040)
SNNPR (n = 1,952)
All (n = 2,992) Tigray SNNPR All
Percent Percent Percent Percent Percent Percent
Respondents who reported possessing
Respondents who reported ability to sell
b
Landa
- Yes, alone 17.7 3.8 8.6 - Yes, together 60.2 90.9 88.9 - Do not have 22.1 5.3 11.1
House where live House where live (n = 132) - Yes, alone 6.9 3.1 4.4 - Yes 80.6 82.8 81.5 - Yes, together 73.4 94.1 86.9 - No 19.4 17.2 18.5 - Do not have 19.7 2.8 8.7
Animal like cows, horses, donkeys
Animal like cows, horses, donkeys (n = 106)
- Yes, alone 5.3 2.6 3.6 - Yes 72.7 80.0 76.2 - Yes, together 69.9 75.5 73.5 - No 27.3 18.0 22.9 - Do not have 24.9 21.9 22.9
Small animals like hens, ducks, chickens
Small animals like hens, ducks, chickens (n = 110)
- Yes, alone 5.8 2.6 3.7 - Yes 79.7 77.6 78.7 - Yes, together 62 53.4 56.4 - No 13.6 16.3 14.8 - Do not have 32.2 44 39.9
Gold jewelry Gold jewelry (n = 267) - Yes, alone 15 5.8 9 - Yes 47.4 48.2 47.7 - Yes, together 14.8 6.8 9.6 - No 52.6 50.0 51.5 - Do not have 70.3 87.4 81.5
a Among those who possess alone.
b Not allowed to sell an empty land.

73
Table 7.8 Women’s control over purchasing household items, by region
Tigray (n = 1,040)
SNNPR (n = 1,952)
All (n = 2,992)
Percent Percent Percent
Decision to buy the following -Small amount of rice, vegetables, and beans 48.1 48.2 48.5 -Bigger amount of food like bag of wheat 23.2 16.4 18.8 -Clothes for yourself 34.2 27.7 30.0 -Medicine for yourself 38.9 26.7 31.0 -Toilet articles for yourself 65.0 66.5 66.0 -Clothes for the children 29.3 23.2 25.3 -Medicine for the children 32.3 21.7 25.4 -Special food for children 33.3 24.0 27.2
Mean (SD) Mean (SD) Mean (SD)
Mean purchasing control (range: 0-8) 3.1 (2.9) 2.5 (2.5) 2.7 (2.6)
Table 7.9 Women’s decisionmaking power within the households, by region
Tigray (n = 1,040)
SNNPR (n = 1,952)
All (n = 2,992)
Percent Percent Percent
Respondent reported: Making decision alone Buying important things for the family 24.1 16.4 19.1
What food prepared every day 65.4 69.8 66.9
If she has to work to earn money 15.1 8.7 10.9
Visiting other family members or relatives 29.0 17.4 21.5
Seeing a doctor when pregnant 36.8 22.9 27.8
Use of family planning methods 23.0 11.8 15.7
Sending children to school 14.7 5.4 8.6
What to do when a child is ill 17.6 8.5 11.7
How to make children listen or obey them 18.3 6.2 10.4
Having another child or not 19.0 7.2 11.3
Whether or not to breastfeed the children and when to wean the child 67.8 68.8 68.5
What and how to feed the infant in his first year of life 60.2 60.3 60.2 Making decision jointly with husband
Buying important things for the family 39.5 48.9 45.6
What food prepared every day 16.4 24.5 21.7
If she has to work to earn money 46.6 54.4 51.7
Visiting other family members or relatives 46.0 61.9 56.3
Seeing a doctor when pregnant 47.3 61.2 56.4
Use of family planning methods 62.9 75.8 71.3
Sending children to school 63.7 74.3 70.6
What to do when a child is ill 68.1 78.8 75.1
How to make children listen or obey them 63.9 77.9 73.0
Having another child or not 67.6 80.6 76.1
Whether or not to breastfeed the children and when to wean the child 25.2 28.0 27.0
What and how to feed the infant in his first year of life 31.2 35.8 34.2

74
In addition, Annex Table A7.2 in the annex presents self-efficacy of mothers, particularly related to child feeding practices. The findings on this maternal capacity indicate that mothers believed strongly in most statements, except for those related to community-wide practice of EBF, adding eggs or greens to children’s food and the ability of all families in the community to prevent malnutrition among children. Overall, maternal convictions were positively inclined towards feeding children well. In further analyses, we will investigate the associations between these variables and actual feeding behaviors.
7.4 Household Characteristics
Table 7.10 presents household economic status by regions. The survey was conducted in the rural areas. Almost all respondents lived in houses owned by them. The houses were made of natural earth. There were regional differences in the materials used for the walls and the roof. While most of the houses in SNNPR had rudimentary walls and roofs, in Tigray, these were finished. This difference was mainly due to topography in the two regions. In Tigray, rocks are abundant and, thus, regularly used for building houses, regardless of the socioeconomic status of the household. Similarly ownership of gardens varies between the regions because of topography. Most respondents had less than 0.5 hectares of cultivable land. Access to services was also minimal across the two regions. A majority of respondents used wood, straw, or cow dung for cooking; only 4.8 percent had electricity; 40 percent had access to piped water; and nearly 19 percent did not have any toilet facilities on the premises. With regard to ownership of livestock, half the respondents reported having between two to five cows or oxen. Among household items, a radio was the most common item. Using most of the items in Table 7.10, we constructed economic tertiles (Annex Table: A7.3).
Table 7.10 Household economic status, by region
Tigray (n = 1,040)
SNNPR (n = 1,952)
All (n = 2,992)
Percent Percent Percent
Ownership of house 85.5 97.7 93.5 Type of floor
Natural earth 99.0 97.0 97.7
Concrete 1.0 1.5 1.3
Wood/bamboo 0.0 1.5 1.0 Type of wall
Rudimentary wall 24.3 94.5 70.1
Finished wall 74.7 3.3 28.1
Others 1.0 2.3 1.8 Type of roof
Rudimentary roof 22.5 77.1 58.1
Finished roof 77.5 22.9 41.9 Ownership of garden 20.9 71.9 54.2 Ownership of cultivated land (hectares)
< 0.5 68.8 62.6 64.7
0.5-1 22.4 22.4 22.4
1.2 8.3 10.5 9.7
> 2 0.6 4.6 3.2 Access to services
Type of fuels used for cooking Wood, straw, or animal dung 90.7 99.3 96.3
Charcoal 9.3 0.4 3.5
Electricity, LPG, or kerosene 0.0 0.3 0.2 Has electricity 8.1 3.1 4.8 Water source (for drinking)

75
Tigray (n = 1,040)
SNNPR (n = 1,952)
All (n = 2,992)
Percent Percent Percent
Piped sources 49.1 35.4 40.2
Open springs 13.2 18.1 16.4
Rivers 11.9 13.0 12.6
Wells 15.2 8.6 10.9
(continued)
Other sources 9.2 11.5 10.7
Closed springs 1.4 13.4 9.2 Toilet facility
Traditional pit toilet 74.4 82.4 79.6
No facility 20.9 17.5 18.7
Ventilated improved pit and others 4.7 0.1 1.7 Toilet facility that children are using
Traditional pit toilet 51.3 61.7 58.1
No facility 41.9 36.7 38.5
Ventilated improved pit and others 6.8 1.6 3.41 Livestock
Own cows/oxen 0 21.2 22.3 21.9
1 14.2 21.7 19.1
2-5 60.5 49.0 53.0
> 5 4.1 7.0 6.0 Own sheep/goats
0 57.3 66.4 63.3
1-10 38.8 33.3 35.2
> 10 3.9 0.3 1.6 Own chicken/ducks
0 32.0 46.6 41.5
1-10 67.1 51.8 57.2
> 10 0.9 1.5 1.3 Own donkeys/horses/mules
0 69.0 86.8 80.7
1-10 22.9 10.8 15.0
> 10 8.1 2.4 4.4 Household items
Has radio 35.9 29.3 31.6 Has telephone 3.5 6.5 5.5 Has leather bed 3.5 3.3 3.3 Has jewelry 26.5 9.4 15.4 Has chairs
0 99.8 90.3 93.6
1-3 chairs 0.2 5.2 3.4
> 3 0.0 4.5 2.9 Has modern table 0.3 7.1 4.7
Table 7.11 presents findings on households’ experience related to food insecurity in the last 30 days. Over 50 percent of households fell into the category in which they said “yes” to conditions such as worrying about not having enough food, not being able to eat food they preferred to eat, eating just a few kinds of food day after day. These conditions occurred often in around 20 percent of the surveyed households. Around 10 percent of the households reported having experienced at least once extreme conditions such as not having food at all, going to sleep hungry at night, or spending a whole day without eating. We constructed the Household Food Insecurity Access Scale (HFIAS) using all nine

76
questions, which is a continuous measure of severity of food insecurity. The score ranges from 0 to 27. The mean HFIAS score is around 6.7. From the data, we also calculated HFIA access prevalence of four conditions (food secure, mild insecure, moderately insecure, and severely insecure). Overall, two-thirds of all households experienced some form of food insecurity. One-third of households were food secure—they rarely worried about their household not having enough food. Another third of households fell into the category of being moderately food insecure—they sacrificed quality more frequently by eating a monotonous diet or ate less preferred foods sometimes or often, and/or had started to cut back on quantity rarely or sometimes. Fifteen percent of the households were characterized as being severely food insecure—these households experienced at least one of the most extreme conditions. There was no major regional difference on any of the conditions.
Table 7.11 Household experiences with food insecurity, by region
Tigray (n = 1,040)
SNNPR (n = 1,952)
All (n = 2,992)
Percent Percent Percent
Access-related conditions Households experiencing condition at any time during the
recall period (30 days) Worried about not having enough food 55.6 56.1 55.9
Not able to eat the kinds of foods they preferred 53.2 55.8 54.9
Ate just a few kinds of food day after day 57.5 57.4 57.4
Ate food that they preferred not to eat 34.0 40.2 38.1
Ate a smaller meal than he/she felt was needed 42.2 46.2 44.9
Ate fewer meals in a day 37.8 39.7 39
No food at all 11.4 14.4 13.3
Went to sleep at night hungry 8.8 12.1 10.5
Spent a whole day without eating anything 6.6 8.4 7.8 Households experiencing condition often
Worried about not having enough food 21.1 19.1 19.8
Not able to eat the kinds of foods they preferred 20.4 18.7 19.3
Ate just a few kinds of food day after day 25.1 24.4 24.7
Ate food that they preferred not to eat 11.0 12.8 12.2
Ate a smaller meal than he/she felt was needed 12.2 11.9 12.0
Ate fewer meals in a day 9.6 10.1 9.9
No food at all 2.5 1.9 2.1
Went to sleep at night hungry 2.0 1.4 1.6
Spent a whole day without eating anything 1.7 1.3 1.4 Access-related domains
Households experiencing condition at any level of severity in each domain
Anxiety and uncertainty 55.6 56.1 55.9
Insufficient quality 62.3 62.0 62.1
Insufficient food intake 46.0 47.5 47.0
Access Scale Score (range: 0-27)a Mean (SD) Mean (SD) Mean (SD)
6.5 (6.5) 6.8 (6.9) 6.7 (6.7)
HFIA Access Prevalenceb
Food secure 33.0 35.2 34.4
Mildly food insecure 18.5 15.0 16.2
Moderately food insecure 34.4 33.9 34.1
Severely food insecure 14.1 15.9 15.3

77
a Sum of the nine food security-related questions presented above with frequency of occurrence (0-never to 3-often). The
higher the score, the more food security the household experienced. b Households are categorized into four mutually exclusive categories.
Table 7.12 presents the dietary diversity in the food consumed by the respondent during the last 24 hours. A majority of respondents (48 percent) reported having 0-3 food groups the day prior to the survey. Another 45 percent reported having 4-7 food groups. Only around 6 percent reported having eight or higher food groups. In Tigray, more women reported having less than four groups compared to that of SNNPR. Similar findings were seen regarding overall household dietary diversity. In general, consumption of animal source foods is low. Annex Table A7.4 presents household dietary diversity (the respondent or any other member in the household).
Table 7.12 Household food dietary diversity, by region
Tigray
(n = 1,040) SNNPR
(n = 1,952) All
(n = 2,992)
Percent Percent Percent
Dietary diversity experience in 24 hours Mother of the index child Cereals 81.4 78.3 79.4
Vitamin A-rich vegetables and tubers 11.1 27.1 21.5
White tubers and roots or other starchy foods 7.9 38.3 27.5
Dark green leafy vegetables 18.8 36.4 30.3
Other vegetables 31.1 41.0 37.6
Vitamin A-rich fruits 2.8 10.0 7.5
Other fruits 6.6 17.2 13.5
Meat, poultry 12.0 7.3 9.0
Eggs 14.4 6.1 9.0
Fish and seafood 0.0 0.0 0.5
Pulses/legumes/beans 66.4 34.6 45.7
Milk and Milk products 16.1 27.3 23.5
Oil/fats 75.1 64.2 68.0
Sugar/honey 11.0 2.8 5.6
Spices, condiments 76.1 87.6 83.6 Household food diversity category
0-3 food groups 54.0 45.1 48.2
4-7 food groups 41.1 47.4 45.3
8-11 food groups 4.7 7.2 6.3
> = 12 food groups 0.1 0.3 0.2
Mean (SD) Mean (SD) Mean (SD)
Mean dietary diversity of the respondent (range: 0-14)a 3.6 (2.1) 4.1 (2.2) 3.9 (2.2)
a Dietary Diversity was estimated using all the food groups except spices/ condiment.
Table 7.13 presents household experiences of economic shocks in the previous 12 months. The most common shocks experienced were 1) loss of crops due to floods, 2) disease, injury, or loss of cattle, and 3) loss of crops due to drought, plat diseases etc. Between 3 and 8 percent of respondents reported experiencing one of these kinds of economic shocks in the previous 12 months. Overall, 20 percent of all households experienced an economic shock of some kind in the previous 12 months.
Respondents were then asked if these shocks had any effect in the household and how large the effects were. Although a very small percentage reported a death of a household-earning member, a large

78
proportion (70 percent) of these respondents reported that this shock had a large impact. Forty-five percent of those who reported having crop loss reported this having a large effect as a result. Around 30 percent reported loss of cattle as having a large effect on their household. Annex Table A7.5 presents the effects of different economic shocks at the household level.
Table 7.13 Economic shocks in the last 12 months, by region
Economic shock
Tigray (n = 1,040)
SNNPR (n = 1,952)
All (n = 2,992)
Percent Percent Percent
Death of main income-earning household member 1.0 0.7 0.8 Death of other income-earning household member 0.3 0.2 0.2 Disease or injury of any household member 1.5 2.2 1.9 Loss of employment of any household member 1.4 0.2 0.6 Divorced by husband/wife 2.0 0.5 1.0 Loss of crop due to flood 3.9 9.8 7.7 Loss of crop due to drought, plant disease, etc.) 3.0 2.8 2.9 Disease or injury, loss of cattle 5.6 6.1 5.9 Any damage to the house or any productive asset 0.6 1.3 1.0 Any theft or loss to the food stock 0.2 0.5 0.4 Any loss of business 0.3 0.2 0.2 Any conflict, dispute, legal issue 0.9 1.4 1.2 Any other shocks 0.2 0.3 0.2 Household encountered any shock 17.6 21.8 20.4
Mean (SD) Mean (SD) Mean (SD)
Total number of shocks (range: 0-4) 0.2 (0.5) 0.3 (0.5) 0.2 (0.5)
Table 7.14 presents the findings on food and social assistance that the surveyed households received at the time of the survey. Forty percent of respondents reported that at least one family member in the household received food or social assistance in the past one year. Two-thirds of respondents from Tigray mentioned receiving food/social assistance, compared to only 21 percent in SNNPR. The person who was most likely to receive assistance was the husband (38 percent), followed by respondent mothers (34 percent). The government’s productive safety net program (PSNP) was by far the largest source of social assistance in both regions, with over two-thirds of respondents reporting this source of assistance. Food rations were received by over half of all recipients of social assistance, and 20 percent reported receiving cash.
In Annex Tables A7.6 and A7.7, we present the general cleanliness of the mothers and households elicited from observation during the data collection process. In addition, we included the caregivers’ place of work and child support available to the caregivers (Annex Tables A7.8 and A7.9). Annex Tables 7.10a and 7.10b present bivariate analyses of nutritional status-related impact indicators with key independent characteristics.

79
Table 7.14 Food and social assistance, by region
7.5 Chapter Summary
In this chapter we presented the findings related to the child’s overall well-being, which includes immunization status, recent morbidity, and feeding practices during illness. In addition, we discussed maternal nutritional status and the different types of resources available to the surveyed respondents.
We find that childhood illness was high, with cough/cold and fever being the most prevalent illness symptoms (25–30 percent) followed by diarrhea at 16 percent. These morbidities are most prevalent in children 6–23.9 months of age. In addition, feeding practices during illness were suboptimal; more than two thirds of mothers did not increase fluid intake when the children were ill with diarrhea, a majority
Tigray (n = 1,040)
SNNPR (n = 1,952)
All (n = 2,992)
Characteristics Percent Percent Percent
Anyone in the family received food or social assistance 66.4 21.1 36.9 Who in the family received food or social assistance
a (n = 1,103)
Respondent mother/ caregiver 36.2 29.4 34.1
Husband 31.6 52.5 38.1
Son or daughter 9.1 7.1 8.5
Son in-law or daughter-in-law 7.6 4.7 6.7
Grandson or granddaughter 6.4 3.6 5.5
Father or mother 4.4 1.1 3.3
Father or mother-in-law 2.4 0.4 1.8
Brother or sister 1.7 0.7 1.4
Brother or sister-in-law 0.4 0.4 0.4
Uncle or aunt 0.2 0.0 0.1
Grandparent 0.2 0.0 0.1
Other relatives (including cousins) 0.0 0.2 0.1 Type of food or social assistance received
a (n = 1,103)
Productive safety net program (PSNP) 78.5 58.2 72.2
Direct Support (Gratuitous) 18.3 14.3 15.5
Other Food Security Program (OFSP) 7.5 12.3 9.0
Other 0.9 10.5 3.8 Kind of food ration/cash received
a (n = 1,103)
Emergency food rations 22.7 13.6 16.5
Safety net food rations 61.4 40.9 55.1
TSF food rations 18.1 18.9 18.4
Cash 18.4 19.3 18.7 Type of food/cash this person received
a (n = 1,103)
Wheat 76.5 57.3 70.6
Maize 1.4 6.2 2.8
Sorghum 15.9 5.4 12.7
Lentil 7.0 1.3 5.2
Oil 26.5 15.8 23.2
FAFA 8.9 7.6 8.5
Plumpy nut 0.0 0.7 0.2 a Among those who said “yes” to receiving food assistance.

80
did not increase food intake, and only a fourth of the children who had diarrhea were given oral rehydration solution. Full immunization coverage was also low. A little over a third of children 12-23 months had received all the vaccines required for that age group. Sixty-three percent received vitamin A in the last six months.
Parental resources for care are stretched in the Ethiopian context. Education levels were very low, with 65 percent of the mothers and 42 percent of the fathers having never attended schools. Twenty-five percent of the mothers were underweight, with BMI < 18.6 kg/m2. Maternal mental distress was also high at 40 percent. Women had very little or sole control over their assets. With regard to decisionmaking power of women, just about 50 percent of women expressed their ability to make decisions regarding the purchase of daily food items, small articles for personal use and/or food to be made at home. However, decisionmaking power over large household items and bulk food purchases was only seen in 20 percent of the women.
In addition to these personal resources/capacities, household-level resources available to the respondent mothers were also quite inadequate. Most of the respondents lived in rural poor households, with 19 percent of households without any latrine facility in the households and 40 percent having access to piped water sources. The level of food insecurity is high. Thirty-four percent of households were moderately food insecure and 15 percent were severely food insecure in the last 30 days. Possibly as a result of the food insecurity, the household dietary diversity of the mother was low, with only 3.9 food groups consumed during the previous 24 hours. There were no differences between mothers and other household members. Almost forty percent of households received food or social assistance. Two in three households in Tigray and one in five households in SNNPR were under some type of social protection program, most commonly the government’s productive safety net program (PSNP).
Overall, there is a lack of resources and capacities at multiple levels, most prominently for mothers and their households. Unpacking the implications of the different types of resource constraints for use and adoption of IYCF-related recommendations will be important in this context.

81
8. Results: Community Characteristics
8.1 Variables
We collected information from each sampling cluster by administering a separate community questionnaire that collected information from a group of community leaders. In this section we present the general characteristics of the communities, the access to different services (electricity, latrine facilities), and access to healthcare services.
Major community-level characteristics are presented in Table 8.1. In both regions, the major livelihood was agriculture for over 90 percent of respondents. Over two-thirds of the communities in SNNPR were in a malarious zone, compared to 58 percent in Tigray. Over 90 percent of communities reported having a major road connection with the nearest town. However, the accessibility to the community during the rainy reason was only 25 percent overall, with 46 percent in Tigray and only 14 percent in SNNPR. Twenty percent of communities in Tigray have electricity compared to less than 10 percent in SNNPR. Dry pit latrines are the most common type of latrines, with 4 percent of the communities reporting having no facilities. Most communities have at least one primary school in the area. Thirty-six percent of communities have fruit and vegetable markets, but less than 30 percent of communities have larger markets selling fruits, meats, and vegetables together in a single place. Over three-fourths of communities participated in the PSNP, with 100 percent participation of Tigray’s surveyed communities. The community-based nutrition (CBN) program has also started in 70 percent and 35 percent of communities in Tigray and SNNPR, respectively.
Table 8.2 presents the availability of health facilities in the communities. Ninety percent of communities have no hospital, and 70 percent have no health center. Ninety percent of communities have a health post in the community. All communities are served by the health extension program (HEP). The distance to the nearest health post was about 3 kilometers. The mean number of HEWs in each community is 1.9 and the mean number of volunteers is 23.4.
Annex Table A8.1 presents natural disaster experienced by the community in the last three years.

82
Table 8.1 Characteristics of the communities, by region
Tigray (n = 26)
SNNPR (n = 49)
All (n = 75)
Characteristics Mean (SD) Mean (SD) Mean (SD)
Estimated mean population (SD) 5,838 (2,239.1) 5,464 (2,297.8) 5,590 (2,269.8)
Percent Percent Percent
Language Tigrainya 100.0 0.0 –
Sidama 0.0 28.6 –
Welayta 0.0 16.3 –
Hadyia 0.0 8.2 –
Arigna 0.0 8.2 –
Gofa 0.0 8.2 –
Others 0.0 30.6 – Major livelihoods
Agriculture 92.3 93.9 93.3
Mixed farminga 7.7 6.1 6.7
Malarious zone 57.7 77.6 70.7 Physical communication
Any major road to the nearest town 96.0 89.8 91.9
Well accessibility by roads in rainy season 45.8 14.0 25.4 Electricity available 23.1 8.2 13.3 Most important source of water
Piped water 19.2 16.7 17.6
Wells/boreholes 38.5 12.5 21.6
Spring 19.2 31.3 27.0
River 19.2 25.0 23.0
Other 3.9 14.6 10.8 Major type of latrine in the area
No facility 8.0 2.2 4.2
Dry pit latrine 92.0 97.8 95.8 At least one primary school in the area
None 0.0 8.2 5.4
One 40.0 69.4 59.5
Two 44.0 22.5 29.7
Three 16.0 0.0 5.4 Number of agricultural cooperations
None 0.0 7.1 4.4
One 92.3 83.3 86.8
Two 3.9 2.4 2.9
Three 3.9 7.1 5.9 Any vegetable/fruit market in the community 46.2 30.6 36.0 Any market selling meat/poultry in the community 24.5 34.6 28.0 Any big market with fruit, meat, vegetables in the community 26.3 18.4 21.3 Community participates in PSNP 100.0 64.6 77.0 Community-based nutrition activities started in the area 69.2 34.7 46.7 a Farming and livestock rearing.

83
Table 8.2 Health facility-related characteristics of the community, by region
Tigray (n = 26)
SNNPR (n = 49)
All (n = 75)
Characteristics Percent Percent Percent
Health Extension Program 100.0 100.0 100.0 Number of government hospital
None 100.0 91.8 90.7
One 0.0 6.1 7.0
Two 0.0 2.0 2.3 Number of health centre in the community
None 69.2 73.5 72.0
One 30.8 24.5 26.7
Two
2.0 1.3 Number of health post in the community
None 8.0 4.2 5.5
One 84.0 91.7 89.0
Two 8.0 4.2 5.5
Mean (SD) Mean (SD) Mean (SD)
Distance to the nearest health post (km) (range 0–15) 3.8 (4.1) 2.5 (2.3) 2.9 (3.1) Health Extension Workers in the area (range 1–4) 1.7 (0.5) 2.1 (0.7) 1.9 (0.6) VCHP in the area (range 3–62) 29.9 (17.0) 20.2 (12.9) 23.4 (14.8)
8.2 Chapter Summary
The communities were similar in terms of main occupation of the residents. All communities have a health extension program (HEP). Most communities had at least one health post, but the presence of a health center or hospital was rare. Each community was served by approximately 2 HEWs and 2 to 3 VCHPs. All communities were farming communities, with most communities having at least one agricultural cooperative agency. Seventy-seven percent of communities participate in PSNP and 47 percent of communities had the CBN program. The presence of both PSNP and CBN was more prominent in Tigray compared to SNNPR.
The data on community characteristics reinforce the positive findings from the previous chapters on the exposure to and use of the Health Extension Program. In addition, the findings on the social safety net programs support the findings on the household food security and economic status that are depicted in the previous chapters.

84
9. Results: Frontline Health Workers
9.1 Variables
The frontline health workers’ (FHW) surveys covered topics such as IYCF-related knowledge, training received, IYCF-related activities covered in their jobs, job motivation and satisfaction, and perceptions about supervision. Three types of frontline health workers were interviewed in the survey: Health Extension Workers (HEW), Volunteer Community Health Promoters (VCHP) and HEW Supervisors. HEWs are the key service providers at the health posts and also in the communities. The volunteers support the HEWs in delivering community-based health services and the supervisors play a critical role in maintaining the quality of the services provided by the HEWs and volunteers. Therefore, as part of this survey, we interviewed the complementary service providers (HEWs and volunteers) as well as supervisors.
In this section we present the following information from each type of frontline workers separately.
General characteristics
IYCF knowledge
Motivation and satisfaction related to job
Training received
9.2 Health Extension Workers
Table 9.1 presents the general characteristics of the interviewed HEWs. The mean age of HEWs is 25 years. Over 60 percent of HEWs are married and 35 percent have one child under the age of 5. Over half of respondents reported having received technical or vocational training after completing high school and another 37 percent have completed high school. Most HEWs live in the same kebele as the health post. HEWs have worked in their current job for approximately 3.7 years.
Table 9.2 presents HEW’s knowledge on selected IYCF-related issues. In general, knowledge of HEWs on IYCF was found to be good. With regards to breastfeeding, most HEWs knew about early initiation of breastfeeding, feeding only colostrum until the breastmilk flows (89 percent), that mothers with small breasts can produce adequate amounts of milk (96 percent), and that babies do not need extra water if they are breastfed even in hot weather. However, there remain some gaps in the knowledge related to breastfeeding. Only 45 percent knew that increasing frequency of breastfeeding would result in producing more milk and 60 percent said that babies should be breastfed whenever they want. Approximately 30 percent said that a mother needed to stop breastfeeding if she became pregnant.
Approximately 97 percent of HEWs correctly reported that babies should start complementary foods at 6 months of age. As a complementary food, gruel is very common in rural areas of Ethiopia. About 50 percent of HEWs rightly thought the gruel was too thin, while 25 percent thought there was no problem with the gruel. Over 90 percent of HEWs thought that a 12-month old could not eat alone and should not just eat the same food as the rest of the family. Thirty-seven percent thought that a 6-9 month old needed to be fed meals and snacks five or more times per day. For 12–23 month old children, the total meal frequency of five or more was reported by 46 percent of HEWs.

85
Table 9.1 General profile of health extension workers, by region
Tigray (n = 25)
SNNPR (n = 48)
All (n = 73)
Characteristics Percent Percent Percent
Mean age 26.5 (5.3) 23.7(3.2) 24.7 (4.3) Marital status
Married 72.0 57.5 62.5
Single 20.0 42.6 34.8
Other 8.0 0.0 2.7 Number of under 5 children
0 22.7 47.4 38.3
1 54.6 23.7 35.0
2 18.2 21.1 20.0
3+ 4.6 7.9 6.7 Highest level of education
Technical/vocational 52 60.4 57.5
High school completed 44.0 33.3 37.0
Secondary school completed 4.0 2.1 2.7
Primary school completed 0.0 4.2 2.7 Live in the same kebele of the HP 92.0 72.3 79.2
Mean (SD) Mean (SD) Mean (SD)
Years working as an HEW (range: 1–6) 4.5 (0.9) 3.3 (1.2) 3.7 (1.2)
Additional results on the FHWs’ knowledge regarding IYCF practices of sick children and basic hygiene are presented in Annex Table A9.1. Twenty-two percent of interviewed HEWs thought that when sick, children need to get an extra meal per day for less than one week and another 22 percent reported that children should be given an extra meal per day for one week while recovering from sickness. Eighty-two percent said that children should be given lem/lem (ORS) if they had diarrhea. Forty percent said that they should be fed more than usual and 34 percent said they should breastfeed more often. Over 90 percent of HEWs said that hands were to be washed before eating, but only 60 percent mentioned washing hands before feeding the child. Only 51 percent mentioned washing hands after cleaning a child who defecated. When HEWs were asked about ways to protect a child from getting worms, over 83 percent mentioned washing the child’s hand, 27 percent mentioned cutting nails, and 33 percent mentioned giving them treated water.
Tables 9.3 and 9.4 present results on job motivation and satisfaction among the health extension workers with their job as HEW. Over 33 percent of HEWs mentioned enjoying working all the time and about 36 percent mentioned feeling overwhelmed sometimes. Nearly 40 percent of HEWs said that they always felt proud to be part of the government health system. Over 45 percent of HEWs expressed the feeling of being connected with other HEWs in the area all the time. Less than 3 percent said that they always thought of leaving the job.
The most satisfactory aspect of an HEW’s job appeared to be that they felt they were contributing to the improvement of the health of the community. Seventy percent of respondents strongly agreed with this statement. Most respondents agreed with the statement that they received adequate training to perform their jobs. On the other hand, nearly 50 percent of respondents also strongly believed that their workload was increasing and over half of respondents (60 percent) expressed strong dissatisfaction about the salary they were receiving. Overall, however, it can be surmised that HEW satisfaction with their job is relatively high.

86
Table 9.2 IYCF knowledge of the HEWs
Tigray (n = 25)
SNNPR (n = 48)
All (n = 73)
Characteristics Percent Percent Percent
Putting the baby on breast immediately Immediately 84.0 91.7 89.0
Less than 1 hour after birth 16.0 8.3 11.0 Giving only colostrum until breastmilk 88.0 89.6 89.0 Mothers with small breast can breastfeed 88.0 100.0 95.8 Baby should be breastfed whenever s/he wants 64.0 58.3 60.3 Increase frequency of breastfeeding if the baby is not getting enough milk 52.0 41.7 45.2 Frequent breastfeeding at night and day increase milk 100.0 83.3 89.0 Not breastfeeding enough—reason to have a full breast 72.0 75.0 74.0 Water should not be given even in hot weather 92.0 91.5 91.7 Mothers should not stop breastfeeding if she becomes pregnant 84.0 62.5 69.9 Mothers can give expressed milk if she needs to leave the baby to go away 44.0 33.3 37.0 At 6 months the babies first start to receive foods 96.0 97.9 97.3 Different foods are required for different age of a child 100.0 93.8 95.9 Problem with gruel
Too thin 64.0 43.8 50.7
Too thick 8.0 20.8 16.4
No problem 28.0 22.9 24.7
Other 0.0 2.1 1.4
Do not know 0.0 10.4 6.9 Special foods to complement breastmilk
Enriched porridge with breastmilk 20.0 14.9 16.7
Enriched porridge with other kinds of milk 20.0 27.7 25.0
Enriched porridge with egg 20.0 14.9 16.7
Enriched porridge with other ingredients 48.0 48.9 48.6
Others 16.0 14.9 15.3 A 12-months-old child cannot eat alone 80.0 97.9 91.8 A 12-months-old child should not eat only the same foods as the rest of the
family 96.0 95.8 95.9 Times per day a 6–9-months-old child eats
3 or more meals 48.0 29.2 35.6
2 or more snacks 28.0 12.5 17.8
5 or more overall 52.0 29.2 37.0 Times per day a 12–23-months-old child eats
3 or more meals 60.0 22.9 35.6
2 or more snacks 32.0 12.5 19.2
5 or more overall 60.0 39.6 46.6

87
Table 9.3 Job motivation among health extension workers (HEWs)
Tigray (n = 25) SNNPR (n = 48) All (n = 73)
Characteristics 1 2 3 4 5 1 2 3 4 5 1 2 3 4 5
Enjoys work as an HEW 36.0 20.0 28.0 12.0 4.0 31.3 27.1 20.8 20.8 0.0 32.9 24.7 23.3 17.8 1.4 Does not feel overwhelmed with activities 12.0 20.0 32.0 16.0 20.0 12.5 16.7 37.5 20.8 12.5 12.3 17.8 35.6 19.2 15.1 Feels connected with other HEWs 48.0 40.0 8.0 4.0 0.0 45.8 35.4 10.4 4.2 2.1 46.6 37.0 9.6 4.1 1.4 Feels supported by other HEWs 36.0 28.0 16.0 16.0 4.0 35.4 33.3 18.8 8.3 2.1 35.6 31.5 17.8 11.0 2.7 Can always get help from other HEWs 4.0 28.0 16.0 36.0 16.0 25.0 22.9 29.2 16.7 4.2 26.0 20.6 31.5 16.4 2.7 Does not think of leaving this job 56.0 12.0 20.0 8.0 4.0 52.1 14.6 29.2 4.2 0.0 53.4 13.7 26.0 2.7 2.7 Does not feel responsible for more work compared to colleagues 12.0 4.0 20.0 20.0 44.0 10.4 8.3 14.6 43.8 20.8 11.0 6.9 16.4 35.6 28.8 Proud to be a part of government health system 48.0 24.0 20.0 0.0 8.0 35.4 27.1 20.8 12.5 4.2 39.7 26.0 20.6 8.2 5.5
Notes: 1 = Always; 2 = Often; 3 = Sometimes; 4 = Rarely; 5 = Never.
Table 9.4 Job satisfaction among health extension workers (HEWs)
Tigray (n = 25) SNNPR (n = 48) All (n = 73)
Percent Percent Percent
1 2 3 4 5 1 2 3 4 5 1 2 3 4 5
Contributing to improvement the health of the community 0.0 0.0 4.0 20.0 76.0 0.0 2.1 8.3 22.9 66.7 0.0 1.4 6.9 21.9 69.9
Receiving adequate training to meet current responsibility 0.0 12.0 36.0 32.0 20.0 6.3 12.5 31.3 27.1 22.9 4.1 12.3 32.9 28.8 21.9
Receiving refresher training often 0.0 8.0 28.0 32.0 32.0 10.4 8.3 31.3 29.2 20.8 6.9 8.2 30.1 30.1 24.7 Involved personally in the job 0.0 0.0 8.7 21.7 69.6 2.2 2.2 2.2 43.5 50.0 1.5 1.5 4.4 36.2 56.5 Increasing workload 0.0 0.0 16.0 20.0 64.0 2.1 10.4 22.9 25.0 39.6 1.4 6.9 20.6 23.3 48.0 Job is motivating and enjoyable 0.0 0.0 16.0 40.0 44.0 2.1 0.0 22.9 39.6 35.4 1.4 20.6 0.0 39.7 38.4 Community values the work of HEWs 0.0 4.2 0.0 37.5 58.3 4.2 6.3 16.7 29.2 43.8 2.8 5.6 11.1 31.9 48.6 Satisfied with the salary HEWs get 64.0 16.0 12.0 4.0 4.0 56.3 18.8 10.4 8.3 6.3 58.9 17.8 11.0 6.9 5.5 Feel secure about the job 12.0 16.0 8.0 32.0 32.0 12.5 18.8 27.1 16.7 25.0 12.3 17.8 20.6 21.9 27.4 Community values the effort as to improve
their lives 0.0 0.0 12.0 48.0 40.0 0.0 2.1 22.9 47.9 27.1 0.0 1.4 19.2 48.0 31.5 Notes: 1 = Strongly disagree; 2 = Disagree; 3 = Somewhat agree; 4 = Agree; 5 = Strongly agree.

88
Table 9.5 presents the training that HEWs received to perform their jobs. All respondents received in-service training in addition to their pre-service training. Pre-service is a mandatory 10-month long training that all HEWs receive prior to joining the service. In-service training is service-specific training given to HEWs once they join their service. Eighty percent of HEWs reported attending an in-service training for a month, while the rest reported training for more than 1 month. Most (74.2 percent) received this in-service training in the past 2–3 years. Over 70 percent reported receiving training on breastfeeding and complementary feeding during in-service training. Half the respondents reported receiving training on the management of malnutrition. In addition to the pre-service and in-service training, HEWs were asked whether they received any nutrition-specific training, such as training on essential nutrition action (ENA) and community-based nutrition (CBN). Twenty percent of HEWs reported receiving training from IFHP cluster officers. Only 16 percent of respondents reported receiving training on ENA, while 62 percent reported receiving training on CBN. Most of those who received CBN training got the training in the last six months. Annex Table A9.2 presents data on supportive supervision received by HEWs.
Table 9.5 Training received by the HEWs
Tigray (n = 25)
SNNPR (n = 48)
All (n = 73)
Characteristics Percent Percent Percent
Received any in-servicea training 100.0 97.9 98.6
In the past one year 31.8 22.7 25.8
In the past 2-3 years 68.2 77.3 74.2 Duration of in-service training
1 month 90.9 73.8 79.8
More than 1 month 9.1 23.8 18.8 During in-service training, received
BF 76 69.6 71.8
CF 80 72.3 75
Maternal nutrition 76 60.9 66.2
Management of malnutrition 56 46.7 50 Received any training in the last one year
Received training from IFHP (CLO)b 40 10.4 20.5
Essential nutrition action (ENA) 12.0 18.8 16.4 Community-based nutrition 100.0 41.7 61.6
In last six months 82.6 60.0 72.1
More than six months ago 17.4 40.0 27.9 a In-service training is service-specific training arranged for the HEWs after they join the services.
b CLO means cluster officers of IFHP based at the sub-woreda level.
9.3 Volunteer Community Health Promoters
Table 9.6 presents the general characteristics of the VCHPs surveyed. The mean age of the VCHP is 33.5 years of age. Most of them are married (78 percent) and 32 percent have at least one child under the age of five years of age. Thirty-seven percent have attended between grades 5-8 and another 30 percent have completed between grades 9-12. Since VCHPs are volunteers, they were not bound to work five days a week like regular paid positions. One-third of respondents worked as volunteers one day per week and 38 percent worked as volunteers two days per week.

89
Table 9.6 General profile of volunteer community health promoters
Tigray
(n = 25) SNNPR (n = 48)
All (n = 73)
Characteristics Percent Percent Percent
Mean (SD) Mean (SD) Mean (SD)
Mean age of the volunteer 35.8 (10.9) 32.3(9.1) 33.5 (9.8)
Married 73.1 80.9 78.1 Number of under 5 children
0 42.3 40.0 40.9
1 38.5 28.9 32.4
2 19.2 31.1 26.8 Highest level of education
Grade 9-12 19.2 34.7 29.3
Grade 5-8 38.5 36.7 37.3
Grade 1-4 23.1 24.5 24.0
Can barely read or write 11.5 2.0 5.3
Not able to read or write 7.7 2.0 4.0 Days a week work as a volunteer
Less than 1 day/week 8.0 8.3 8.2
1 day/week 40.0 27.1 31.5
2 days/ week 36.0 39.6 38.4
3 days/week 12.0 20.8 17.8
Other/ spare time 4.0 4.2 4.1
Table 9.7 presents the knowledge of VCHPs related to IYCF practices. It appears that knowledge on IYCF is at a lower level than HEWs. Early initiation of breastfeeding knowledge was near universal, however, giving colostrum to children was lower at 87 percent. About three-quarters of respondents know that mothers with small breasts can produce an adequate amount of milk but only 29 percent of the surveyed volunteers reported that by increasing the frequency of breastfeeding, more milk can be produced. About a third of respondents thought it was appropriate to give other liquids to a baby if they are not getting enough milk or to give water to a baby less than 6 months of age if the weather was hot. Forty percent of volunteers thought that mothers should not breastfeed if they are pregnant. Three-fourths of respondents correctly report that complementary foods should be introduced at 6 months of age. Additional knowledge of VCHPs and their perceptions on feeding are presented in Annex Tables A9.3, A9.4, A9.5, and A9.6.
Table 9.8 presents reported motivation and satisfaction of respondents as volunteers. Half of respondents said that they enjoy the work of the volunteer all the time and another 35 percent reported enjoying their work quite often. However, over forty percent of respondents did mention feeling overwhelmed either always or often with their work. Interestingly, despite feeling overwhelmed, only less than 5 percent of respondents reported the desire to leave their job. Nearly half of respondents always or often feel pride being part of the government health system.

90
Table 9.7 IYCF knowledge of the VCHPs
Tigray (n = 25)
SNNPR (n = 48)
All (n = 73)
Characteristics Percent Percent Percent
Putting the baby on breast immediately 92.3 100.0 97.3 Giving only colostrum until breastmilk 84.6 87.8 86.7 Small breast can produce milk 76.9 73.5 74.7 Increase frequency of breastfeeding if the baby is not getting enough milk 19.2 34.7 29.3 Baby should NOT be given water in hot weather 69.3 71.4 70.7 Breastfeeding should continue if the mother is ill 38.5 32.7 34.7 Breastfeeding should continue if the mother is pregnant 57.7 63.3 61.3 Leaving breastmilk for babies < 6 months when mother is away 30.8 10.2 17.3 Introduction of complementary food at 6 months 76.0 72.9 74.0
Table 9.9 presents results on the trainings received by the volunteer specifically on nutrition. All respondents surveyed reported receiving some sort of training. Nearly 90 percent of the volunteers reported that their training included topics on breastfeeding, while two-thirds of respondents reported receiving training related to complementary feeding. Only 5 percent received training on ENA and 53 percent on CBN. The training on CBN had occurred in the six months prior to the survey.

91
Table 9.8 Job motivation among VCHPs
Notes: 1 = Always; 2 = Often; 3 = Sometimes; 4 = Rarely; 5 = Never.
Tigray SNNPR All
1 2 3 4 5 1 2 3 4 5 1 2 3 4 5
Characteristics Percent Percent Percent Enjoys work as VCHP 61.5 30.8 7.7 0.0 0.0 51.0 34.7 6.1 4.1 4.1 51.0 34.7 6.1 4.1 4.1 Does not feel overwhelmed with responsibilities 16.0 16.0 20.0 20.0 28.0 16.7 14.6 27.1 25.0 16.7 16.4 15.1 24.7 23.3 20.6 Connected with other VCHPs 61.5 23.1 7.7 7.7 0.0 32.7 55.1 12.2 0.0 0.0 42.7 44.0 10.7 2.7 0.0 Feel well supported by HEWs in the area 46.2 42.3 7.7 3.9 0.0 40.8 40.8 14.3 2.0 2.0 42.7 41.3 12.0 2.7 1.3 Can get help from other VCHPs 26.9 38.5 15.4 3.9 11.5 24.5 44.9 14.3 12.2 0.0 25.3 42.7 14.7 9.3 4.0 Does not think of leaving the job often 73.1 7.7 15.4 0.0 3.9 0.0 59.2 14.3 20.4 4.1 64.0 12.0 18.7 2.7 1.3 Part of government health system 25.0 16.7 12.5 29.2 16.7 18.4 28.6 22.5 10.2 20.4 20.6 24.7 19.2 16.9 19.2

92
Table 9.9 Training received by the VCHPs
Tigray (n = 26)
SNNPR (n = 49)
All (n = 75)
Characteristics Percent Percent Percent
Received any training 100.0 100.0 100.0
In the past six months 30.8 32.7 32.0
6 months–1 year 42.3 36.7 38.7
Past 2-3 years 23.1 28.6 26.7
Other 3.9 2.0 2.7 The training included
Breastfeeding 96.2 85.7 89.3
Complementary feeding 61.5 69.6 66.7
Maternal nutrition 61.5 68.8 66.2
Identification of malnourished children 69.2 55.1 60.0
Referral of malnourished children 68.0 38.8 48.7 Essential nutrition action (ENA) 3.9 6.1 5.3 Community-based nutrition (CBN) 80.8 38.8 53.3
In last six months 57.1 66.7 61.5
More than six months ago 42.9 33.3 38.5
9.4 Supervisors
Table 9.10 presents the general profile of supervisors who provide supportive supervision to HEWs. Mean age of supervisors is 28 years and a little less than half are married. Over two-thirds of them hold diplomas in nursing. Nearly 40 percent of them are based at the woreda health offices and another 43 percent at the health centers. The mean number of health posts they are responsible for supervising is 5.6.
Table 9.11 presents the knowledge of supervisors. As expected, overall, IYCF knowledge among supervisors is significantly higher than both HEWs and VCHPs. In general, they have high IYCF-related knowledge. Correct knowledge was reported by over 90 percent of respondents for all practices, except feeding a baby whenever they want (51 percent), increasing frequency of breastfeeding if the baby is not fed well (61 percent), and expressing and leaving milk for babies less than 6 months of age when the mother is away (64 percent). Additional knowledge on IYCF of the supervisors is presented in Annex Tables A9.7, A9.8, A9.9, and A9.10.
Table 9.12 presents training on nutrition received by or given by the supervisors. Eighteen percent report never receiving any training on health and nutrition. Seventy-two percent report having received such training in the past one year. Nearly three-fourths of those who received training on health and nutrition mentioned receiving training on breastfeeding and 78 percent received training on complementary feeding. Over 85 percent received training on management of malnutrition. Supervisors were asked if they had conducted training on ENA, growth monitoring, or any other nutrition-related topics. The training they provided on nutrition mostly covered growth monitoring, identification of malnourished children, and malnutrition case management. The supervisors were also asked whether their recent supervisory visit included nutrition and other health-related observations. Less than 30 percent of supervisors reported that their visits did not include an observation of nutrition-related topics. Most visits consisted of observing sanitary/hygiene counseling sessions followed by immunization.

93
Table 9.10 General profile of the supervisors
Tigray (n = 25)
SNNPR (n = 47)
All (n = 72)
Characteristics Percent Percent Percent
Mean (SD) Mean (SD) Mean (SD)
Mean age of the supervisors 32.8 (7.8) 26.1 (4.3) 28.4 (6.6)
Married 72.0 27.7 43.1 Education
Diploma nurse 60.0 76.6 70.8
BSC Nurse 0.0 2.1 1.4
College complete 8.0 2.1 4.2
High school completed 12.0 12.8 12.5
Other 6.9 4.3 12.0 Location of the supervisor
Woreda health office 28.0 44.7 38.9
Health centre 56.0 36.2 43.1
Other 16.0 19.2 18.1
Mean (SD) Mean (SD) Mean (SD)
Mean number of HP responsible for supervision (range 2–18) 4.5 (1.7) 6.2(2.6) 5.6 (2.4)
Table 9.11 IYCF knowledge of the supervisors
Tigray (n = 25)
SNNPR (n = 47)
All (n = 72)
Characteristics Percent Percent Percent
Putting the baby on breast immediately 92.0 89.4 90.3 Giving only colostrum until breastmilk 92.0 97.9 95.8 Small breast can produce milk 100.0 97.9 98.6 Baby should be breastfed whenever wants 56.0 63.8 61.1 Increase frequency of breastfeeding if baby is not fed well 56.0 48.9 51.4 Baby should not be given water in hot weather 96.0 89.4 91.7 Breastfeeding should continue when mother is ill 88.0 91.5 90.3 Breastfeeding should continue when mother is pregnant 84.0 91.5 88.9 Leaving breastmilk for babies < 6 months when mother is away 72.0 59.6 63.9 Introduction of complementary food at six months 100.0 95.7 97.1

94
Table 9.12 Training received or given by the supervisors, by region
Tigray (n = 25)
SNNPR (n = 47)
All (n = 72)
Characteristics Percent Percent Percent
Received training on health and nutrition In the past 1 year 87.5 63.8 71.8
In the past 2-3 years 8.3 10.6 9.8
Never 4.2 25.5 18.3 The training include following
Breastfeeding 82.6 68.6 74.1
Complementary feeding 78.3 77.1 77.6
Maternal nutrition 90.9 62.9 73.7
Management of malnutrition 95.7 80.0 86.2 Conducted trainings for HEWs/VCHPs in last three months 68.0 57.5 61.1 Conducted the following trainings
ENA 41.2 3.7 18.2
Growth monitoring (GM) 29.4 37.0 34.1
Identification of malnourished children 47.1 37.0 40.9
Management of severe acute malnourished children 35.3 29.6 31.8 Recent community visit includes
Observe ANC session 60.0 21.3 34.7
Observe BF counseling session 16.0 23.4 20.8
Observe complementary feeding counseling session 48.0 17.0 27.8
Observe growth monitoring session 36.0 25.5 29.2
Observe immunization session 40.0 40.4 40.3
Observe sanitary/hygiene counseling session 76.0 68.1 70.8
Table 9.13 presents results on job motivation and satisfaction among supervisors. We report the proportion of supervisors who “agree” or “strongly agree” with statements regarding their motivation, job satisfaction, and adequacy of their training. Overall, job satisfaction is very high. A high proportion of all supervisors reported feeling as though their work contributed to improving health in the community (88 percent), feeling personally involved in their jobs (83 percent), and found their job motivating and enjoyable (76 percent). More than two-thirds of all supervisors felt that the program management valued the work they did, and a similar proportion reported feeling as though the community valued their efforts. Two-thirds of supervisors reported experiencing an increased workload, while over half of all respondents reported receiving adequate training to meet their current responsibilities (57 percent), and receiving adequate refresher training (56 percent). A significantly smaller proportion felt satisfied with their compensation (approximately 20 percent) and over half of all respondents (55 percent) reported feeling secure about their job.

95
Table 9.13 Job motivation among supervisors
Tigray SNNPR All
1 2 3 4 5 1 2 3 4 5 1 2 3 4 5
Percent Percent Percent
Contributing to improvement of the health of the community 0.0 0.0 0.0 30.8 69.2 0.0 0.0 16.2 32.4 51.4 0 0 12 32 56
Receiving adequate training to meet current responsibility 12.0 0.0 20.0 28.0 40.0 6.4 6.4 36.2 34.0 17.0 8.3 4.2 30.6 31.9 25.0
Receiving refresher training often 12.0 16.0 8.0 40.0 24.0 6.4 6.4 36.2 36.2 14.9 8.3 9.7 26.4 37.5 18.1 Involved personally in the job 0.0 8.0 12.0 32.0 48.0 2.1 0.0 12.8 23.4 61.7 1.4 2.8 12.5 26.4 56.9 Increasing workload 0.0 20.0 16.0 24.0 40.0 4.3 12.8 19.2 19.2 45.0 2.8 15.3 18.1 20.8 43.1 Job is motivating and enjoyable 0.0 16.0 12.0 24.0 48.0 4.3 4.3 12.8 29.8 48.9 2.8 8.3 12.5 27.8 48.6 Program management values work we do 0.0 12.0 16.0 36.0 36.0 4.3 2.1 29.8 29.8 34.0 2.8 5.6 25.0 31.3 34.7 Satisfied with the salary 28.0 16.0 8.0 28.0 20.0 51.1 8.5 19.2 12.8 8.5 43.1 11.1 15.3 18.1 12.5 Feel secure about the job 32.0 16.0 0.0 24.0 28.0 23.4 8.5 10.6 29.8 27.7 26.4 11.1 6.9 27.8 27.8 Community values the effort as to
improving their lives 4.0 0.0 16.0 44.0 36.0 2.1 4.3 21.3 34.0 38.3 2.8 2.8 19.4 37.5 37.5 Notes: 1 = Strongly disagree; 2 = Disagree; 3 = Somewhat agree; 4 = Agree; 5 = Strongly agree.

96
9.5 Chapter Summary
The frontline health worker assessments in this baseline survey contribute tremendously to an understanding of health system capacity to address IYCF and nutrition. The results indicate that health extension workers had a better level of IYCF knowledge compared to the volunteer community health promoters. Supervisors of HEWs also had better knowledge than both HEWs and VCHPs. However, some lingering gaps in knowledge include topics such as how long a child should be given an extra meal after illness.
The findings on training indicate that over 70 percent of the HEWs received training on breastfeeding and complementary feeding during in-service training. Training on Essential Nutrition Actions (ENA) was low compared to Community-Based Nutrition (CBN) program training. Only 16 percent of HEWs received training on ENA and over 60 percent received training on community-based nutrition (CBN). Over half of VCHPs received training on CBN but only 5 percent reported receiving training on ENA.
Overall, motivation and satisfaction with work are generally high among frontline health workers interviewed, as are perceived value of work. However, feelings of being overwhelmed and not being adequately compensated for their work could contribute to lower levels of motivation, especially if work burdens continue to increase.
In summary, the data on FHWs in this context shed light on the characteristics, capacities and work environment of the key frontline service delivery providers in the context of the Health Extension Program.

97
10. Summary and Discussion
The baseline survey had two broad objectives. The first objective was to gather data on the primary impact indicators of the evaluation, prior to implementation of any A&T interventions, to establish a baseline against which changes would be measured. The second objective was to assess different factors that may influence the outcomes of interest, and thus shape the impact of the primary impact indicators. These factors were determined at five different levels: 1) child, 2) maternal/caregiver, 3) household, 4) community, 5) health care providers, 6) health system. These factors will also provide useful information to interpret the results of the impact evaluation and also signal key issues to pay attention to in the process evaluation.
We present in this summary chapter an overview of the core impact indicators and a detailed summary of all baseline results. We conclude this chapter, and the report, with some of the major implications of the baseline findings for A&T interventions, and the evaluation.
10.1 Summary Results
In this section, we present a brief summary of results from all sections of this report. Table 10.1 also presents the same results, with additional numerical details.
Table 10.1 Baseline results summary matrix, Ethiopia
DOMAIN MAJOR RESULTS
KEY IMPACT INDICATORS (Chapter 4)
- Anthropometric outcomes Stunting (55.9 percent among children 24–59.9 months of age, 44.4 percent overall). No major difference between regions in overall percentage. In 24–59.9 months of age; Tigray—60.4 percent, SNNPR—53.5 percent.
Wasting among young children (0–5.9 months of age) is high—10.1 percent. Overall wasting rate among children less than 5 years of age is 6.7 percent.
Stunting prevalence increases rapidly during the first two years of life, plateauing at approximately 18-23 months of age.
Wasting prevalence increases during the first 6-8 months of life, and then gradually decreases after 1 year of age.
- WHO-recommended IYCF practices
Overall, IYCF practices are mixed; breastfeeding-related practices are comparatively better than complementary feeding-related practices.
Breastfeeding-related practices are relatively high:
Early initiation of breastfeeding is practiced by 67 percent.
EBF is high at 72 percent, and higher than anticipated based on EDHS 2005.
Continued breastfeeding at 12-15 months is universal (98 percent).
There are significant gaps in all complementary-related practices:
Solid and semi solid foods are introduced late (37 percent introduce these foods at the appropriate time).
Diet diversity is very low (6 percent) as is consumption of iron-rich foods (2 percent).

98
DOMAIN MAJOR RESULTS
- Other IYCF practices A majority of babies are fed colostrum (62.3 percent). Approximately 10 percent of the babies are given pre-lacteal feeding. Family members and neighbors are influential in providing pre-lacteals.
At 6 months of age, 70 percent of children are predominantly breastfed; exclusive breastfeeding at this age is 50 percent.
In general, complementary foods are introduced late. Overall, only one-third of children are being introduced to solid/semi solid foods at 6–8.9 months of age.
Animal source foods, in particular, are introduced late (after 9 months of age). Of the ASFs, eggs are most frequently given at 6–8.9 months of age (29 percent).
IYCF PRACTICES, CHALLENGES, AND CAREGIVER’S KNOWLEDGE (Chapter 5)
- IYCF Challenges (Breastfeeding)
Only 7 percent of mothers report any problems when they start breastfeeding; problems cited included pain in the breasts and perceived milk insufficiency. Forty percent of these women sought some kind of help to resolve the problem. There are no major differences in problems with breastfeeding at 3-4 months of age; at this age, babies not sucking well were also a reported problem.
When first beginning to breastfeed, frontline health workers and older female family members are the primary source of support. At 3-4 months of age, the role of family members diminishes.
- IYCF Challenges (Complementary Feeding)
Reported challenges related to initiation of complementary feeding were low (8.8 percent). The major complaints were related to their child being sick (> 50 percent), and their child refusing to eat (45 percent).
Two-thirds of mothers reported seeking help. The major advice given was related to continuing to breastfeed (17 percent), providing smaller meals (21 percent), and increasing the frequency of feeding (24 percent).
- IYCF knowledge There are major gaps in knowledge of appropriate IYCF practices. Knowledge is high on certain aspects of breastfeeding (time of initiation of BF, EBF) while low on others (giving colostrum, baby not needing water in hot weather, or giving other milk or liquids if mother perceived the baby was not getting enough breastmilk).
Major knowledge gaps related to complementary feeding, including on timing of introduction of foods—early for water, and inappropriately late for most complementary foods.
- Exposure to messages and sources of information
Exposure to different IYCF messages is low. In general, exposure to breastfeeding-related information is higher than complementary feeding information.
The key sources of information are HEWs, followed by older female family members (mothers and mother- in-laws).
- Awareness, trial, and adoption of key practices
Exposure to sentinel messages was very low—in most cases, far below 20 percent. Trial and adoption was even lower.
USE OF A&T PLATFORMS (Chapter 6)
- HEALTH SYSTEM Interaction with HEWs
The HEP is present in all woredas. Knowledge of an HEW is high (98 percent), although only 32 percent of respondents were visited by an HEW in last six months at home. Twenty percent had contacts with an HEW at the community in the last six months (33 percent in Tigray and 12.6 percent in SNNPR). The major focus of these interactions was related to child immunization, hygiene and sanitation, and safe water use.

99
DOMAIN MAJOR RESULTS
- HEALTH SYSTEM Interaction with VCHP
Knowledge of a VCHP is lower than an HEW (66 percent); however, 45 percent of respondents were visited by a VCHP at home in last six months.
Immunization outreach and community conversation were two key platforms for these interactions with the respondents in the community.
The major focus of these interactions were on issues related to hygiene and sanitation, and child immunization.
- HEALTH SYSTEM Utilization of ANC, delivery and PNC
Sixty-five percent of women visited a health facility at least once for antenatal care. Home delivery was very high at 91 percent, with friends or family members most often (65 percent) assisting during delivery. TBAs assisted at only 15 percent of all births. Visits by HEWs immediately after birth is high (72 percent), but low among volunteers (38 percent).
- Exposure to media Exposure to media is low overall.
Radio and community meetings are the most important platforms for sharing information on health. Twenty-six percent of women heard health message for women or children on radio in last seven days; 16 percent heard any health message for women or children on community gathering in last seven days.
- Access to market Market access is high, although it appears to be at a significant distance/time away.
Mean distance to the nearest market was 6.5 km (in Tigray—8.8 km and in SNNPR—5.4 km).
Mean travel time to nearest market was 1.7 hours.
Mothers were primarily responsible for purchasing foods (almost 70 percent).
CHILD, CAREGIVER, AND HOUSEHOLD CHARACTERISTICS (Chapter 7)
CHILD CHARACTERISTICS
- Illness Overall, child illness was high. Cough/cold and fever are the most prevalent morbidity symptoms (25-30 percent). Both were most prevalent in the 6–23.9 months of age group. Feeding practices during illness is suboptimal. Almost 65 percent of mothers did not increase fluid intake when babies were ill with diarrhea, and 80 percent did not increase food intake.
- Immunization Full immunization coverage is low. Only 35 percent of 12–23 months of age received all the vaccines required for that age group.
Sixty-three percent received vitamin A in last six months.
CAREGIVER’S RESOURCES
- Parental level of education Parental education level is very low: 65 percent of mothers and 42 percent of fathers never attended schools.
- Maternal nutritional status Twenty-five percent of mothers are underweight (BMI < 18.5 kg/m2).
- Mental stress Maternal mental distress is high (40 percent).
- Control over assets; decisionmaking power
Women have very little sole control over assets.
Almost 50 percent of women have the ability to make decisions regarding purchasing daily food rations and small items for personal use, as well as what food should be made at home.
Decisionmaking power over larger household and food items is only held by 20 percent of women.
HOUSEHOLD RESOURCES
- Assets, infrastructures, access to services
Most of the respondents live in rural poor households; 19 percent of the households do not have access to a latrine; 40 percent had water from piped sources.
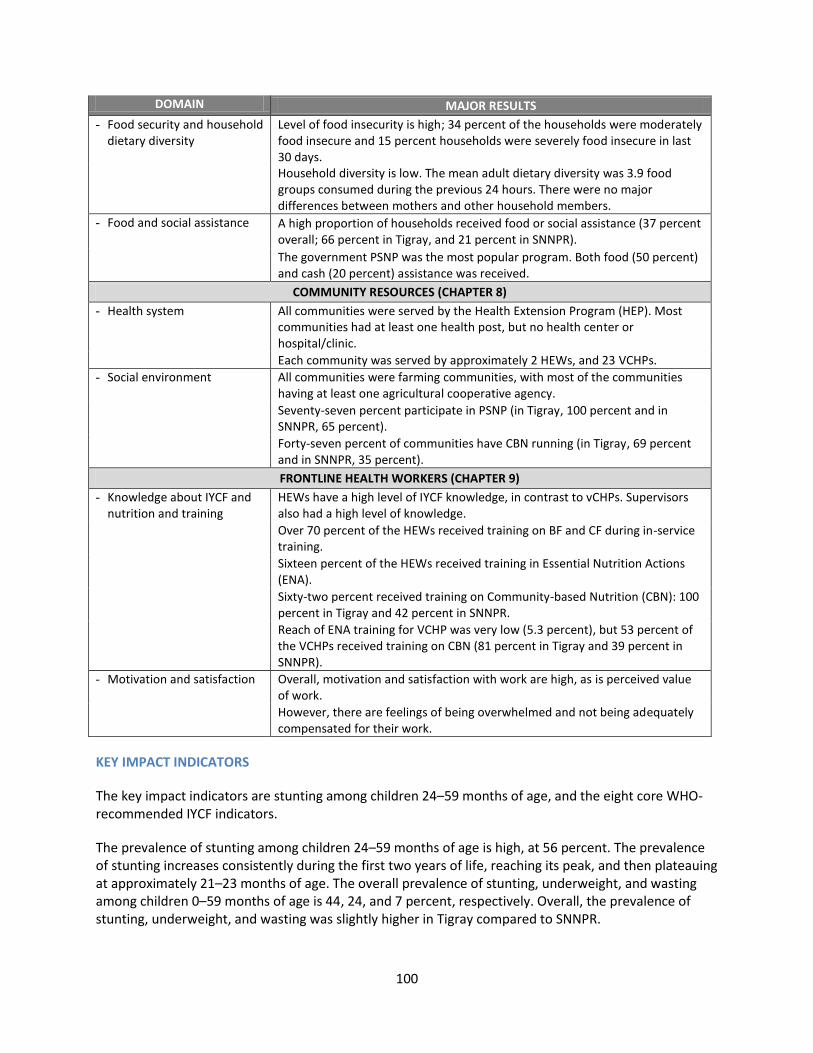
100
DOMAIN MAJOR RESULTS
- Food security and household dietary diversity
Level of food insecurity is high; 34 percent of the households were moderately food insecure and 15 percent households were severely food insecure in last 30 days. Household diversity is low. The mean adult dietary diversity was 3.9 food groups consumed during the previous 24 hours. There were no major differences between mothers and other household members.
- Food and social assistance A high proportion of households received food or social assistance (37 percent overall; 66 percent in Tigray, and 21 percent in SNNPR).
The government PSNP was the most popular program. Both food (50 percent) and cash (20 percent) assistance was received.
COMMUNITY RESOURCES (CHAPTER 8)
- Health system All communities were served by the Health Extension Program (HEP). Most communities had at least one health post, but no health center or hospital/clinic.
Each community was served by approximately 2 HEWs, and 23 VCHPs.
- Social environment All communities were farming communities, with most of the communities having at least one agricultural cooperative agency.
Seventy-seven percent participate in PSNP (in Tigray, 100 percent and in SNNPR, 65 percent).
Forty-seven percent of communities have CBN running (in Tigray, 69 percent and in SNNPR, 35 percent).
FRONTLINE HEALTH WORKERS (CHAPTER 9)
- Knowledge about IYCF and nutrition and training
HEWs have a high level of IYCF knowledge, in contrast to vCHPs. Supervisors also had a high level of knowledge.
Over 70 percent of the HEWs received training on BF and CF during in-service training.
Sixteen percent of the HEWs received training in Essential Nutrition Actions (ENA).
Sixty-two percent received training on Community-based Nutrition (CBN): 100 percent in Tigray and 42 percent in SNNPR.
Reach of ENA training for VCHP was very low (5.3 percent), but 53 percent of the VCHPs received training on CBN (81 percent in Tigray and 39 percent in SNNPR).
- Motivation and satisfaction Overall, motivation and satisfaction with work are high, as is perceived value of work.
However, there are feelings of being overwhelmed and not being adequately compensated for their work.
KEY IMPACT INDICATORS
The key impact indicators are stunting among children 24–59 months of age, and the eight core WHO-recommended IYCF indicators.
The prevalence of stunting among children 24–59 months of age is high, at 56 percent. The prevalence of stunting increases consistently during the first two years of life, reaching its peak, and then plateauing at approximately 21–23 months of age. The overall prevalence of stunting, underweight, and wasting among children 0–59 months of age is 44, 24, and 7 percent, respectively. Overall, the prevalence of stunting, underweight, and wasting was slightly higher in Tigray compared to SNNPR.

101
In general, appropriate breastfeeding-related practices were higher than appropriate complementary feeding-related practices. Breastfeeding was universally practiced with an exclusive breastfeeding rate of 72.4 percent. Early initiation of breastfeeding was at 66 percent. Timely introduction of complementary foods at 6–8 months of age was low at 37.4 percent. Among children 6–23 months of age, only 6 percent consumed diets that met the minimum recommended diversity (≥ 4 food groups), 45 percent met minimum meal frequency, and 2 percent consumed iron-rich foods.
Overall, the findings on the core WHO-recommended indicators of IYCF practices are broadly similar to the EDHS 2005, with the notable exception of exclusive breastfeeding, which was found to be substantially lower in this survey [1].
IYCF PRACTICES AND CHALLENGES
Sixty-two percent of newborns were fed colostrum immediately after birth. Nearly one in 10 babies was given pre-lacteals, with family members and neighbors being influential in this practice. These findings are in line with results from formative research undertaken during the early program design phase of the A&T project [17]. At six months, 70 percent of children were still predominantly breastfed. In general, timely introduction of complementary food was low, with only a third of the children within 6-8.9 months of age being introduced to solid or semisolid foods. Animal source foods, in particular, are introduced late (after 9 months of age). Of the ASFs, eggs are most frequently given at 6–8.9 months of age (29 percent).
IYCF CHALLENGES REPORTED BY CAREGIVERS
Reported problems related to breastfeeding and complementary feeding were low. Only 7 percent of caregivers reported having any problem when starting to breastfeed; the problems cited were pain in the breasts, insufficient milk, etc. A similar percentage reported facing problems at 3–4 months of age. When first beginning to breastfeed, frontline health workers and older female family members were the primary source of support. At 3–4 months of age, the role of family members diminished. The challenges related to initiation of complementary feeding were also low (8.8 percent). Two-thirds of those mothers that reported facing feeding problems reported seeking help. Key messages provided when help was sought were continuing with breastfeeding, providing smaller meals, and increasing the frequency of feeding.
CAREGIVER KNOWLEDGE AND PERCEPTIONS ABOUT IYCF AND NUTRITION
There were major gaps in knowledge of appropriate IYCF practices. Knowledge was high on certain aspects of breastfeeding (time of initiation of BF, EBF) while low on others (giving colostrum, baby not needing water in hot weather, or giving other milk or liquids if mother perceived that the baby was not getting enough breastmilk). There were also major knowledge gaps related to complementary feeding, including appropriate age of introduction of complementary foods. Exposure to different IYCF-related messages was low. Exposure to breastfeeding-related information was higher than complementary feeding information. Key sources of information were HEWs, followed by older female family members (mothers and mothers-in-law). Exposure to sentinel messages was very low; subsequent trial and adoption of these sentinel messages were even lower.

102
USE OF A&T PLATFORMS
Health system
The foundation on which A&T interventions are built is the government HEP system and its frontline health workers, including volunteers. The HEP programs’ reach was found to be widespread in terms of knowing an HEW and community volunteer. Knowledge of an HEW was near universal (98 percent), with knowledge of a volunteer lower (66 percent). Although a high proportion of respondents reported knowing an HEW, only 32 percent of mothers were visited by an HEW at their home in the last six months. Twenty percent of respondents reported having contacts with an HEW within their community in the last six months. These interactions focused around key messages related to hygiene and sanitation, child immunization, and safe-water use. Although a lower percentage of the mothers reported knowing a VCHP, their interaction with these frontline health volunteers was higher than that for HEWs. Nearly 45 percent of the respondents were visited by a VCHP at home in the last six months and 25 percent interacted with a VCHP in the community. Immunization outreach and community conversations were two key platforms for these interactions.
Antenatal care
Health care utilization during pregnancy and at the time of delivery was also investigated. Sixty-five percent of women visited a health facility at least once during their pregnancy for antenatal care. Over 90 percent of women delivered at home with assistance from friends or family members. Twenty-one percent of respondents were visited by a health worker immediately after work, with mainly an HEW.
Exposure to media and access to markets
Exposure to media was very low. Radio and community meetings appear to be the main media channels through which health and nutrition messages are delivered. Twenty-six percent of women heard health messages for women or children over the radio in the last seven days. Sixteen percent heard health messages for women or children at a community gathering in the last seven days. Although market access was high, the distance to these markets was significant. The mean distance to the nearest market was 6.5 kilometers, with a mean travel time of 1.7 hours.
UNDERLYING FACTORS: CHILD, CAREGIVER, HOUSEHOLD, and COMMUNITY FACTORS
Child characteristics
Illness is a common occurrence among children in the survey population. The prevalence of four common childhood illnesses, i.e., fever, colds, breathing problems, and diarrhea, was 27, 32, 10, and 16 percent, respectively. The prevalence of all four conditions peaked in the 6-23 month age range. Fevers and colds were the two most common illnesses among children under 5 years of age. Feeding practices during illness were suboptimal. Almost two-thirds of mothers did not increase their babies’ fluid intake when they were ill with diarrhea. Eighty percent did not increase food intake. Only 25 percent reported giving oral rehydration saline during diarrhea. The high illness burden could compromise a preventive approach to IYCF. A critical need for improvement is related to appropriate feeding during child illness.
Full immunization coverage was also low. Only 35 percent of 12–23 months old children received all vaccines required for that age group. Sixty-three percent received a vitamin A supplement in the last six

103
months. The overall vaccination status of children was higher in Tigray compared to SNNPR. The percentage of children who received vaccination against BCG in Tigray is 60 percent, compared to 30 percent in SNNPR. Similarly, over 50 percent of children received Polio3 and PENTA5 in Tigray as compared to less than 25 percent children in SNNPR.
Mothers were asked about their perception of their own children’s health and their appetite for eating. Over half of mothers thought their child’s health was very good. More than 60 percent of the mothers reported their children having a very good appetite as opposed to only around 8 percent reporting their child’s appetite as not good.
Caregiver characteristics
Respondent mothers in this survey had a mean age of 29 years. In both regions, over 90 percent of respondent mothers were married. While one-half of all mothers reported being a housewife, a large proportion also reported working as farmers. Over 90 percent of fathers reported farming as their main occupation. The parental education level was low, with 65 percent of the mothers and 42 percent of the fathers not having ever attended school.
Twenty-five percent of the mothers were underweight, with BMI < 18.6 kg/m2. More women in Tigray were malnourished using this standard compared to the women from SNNPR. We assessed mothers’ overall health according to their own perception compared to the health of other women in their surroundings. A little over half of the respondent mothers in this survey perceived their health as quite good compared to the other women in the area. Maternal mental distress according to the SRQ scale was also high, at 40 percent. This is likely to have association with child feeding practice [18].
Women had little sole control over household assets. With regard to decisionmaking power of women, almost 50 percent of women expressed the ability to make decisions regarding purchasing daily food items and small articles for personal use, as well as that food that should be made at home. However, decisionmaking power over large household and food items was only held by 20 percent of the women. Positive empowerment related to daily food purchases suggests that women are likely in a key position to implement IYCF recommendations at home.
Household characteristics
Ten percent of the surveyed households were headed by a female, half of what was reported in the EDHS 2005. Fourteen percent of households in the Tigray region were headed by women compared to 6 percent of households in SNNPR. The average household size was 6 members. In both regions, about 1.5 people in the household were below the age of 5 years of age.
The majority of the respondents lived in rural poor households. One in five households had no latrine facility in their home and only 40 percent had access to piped water. Two-thirds of the population reported having less than 0.5 hectares of cultivatable land, with minimum access to electricity and cooking fuel.
The level of food insecurity among the household in this survey was high. One-third of households were classified as being moderately food insecure and 15 percent were classified as being severely food insecure. Mean household dietary diversity was low at 3.9 food groups consumed during the previous 24 hours; 40 percent of households reported consuming 0-3 food groups during the previous day. A high

104
proportion of households, 37 percent, reported having received food or other forms of social assistance. The government productive safety net program (PSNP) was the common source of social assistance.
Community characteristics
Agriculture was the primary source of livelihood for over 90 percent of respondents. Over 90 percent of communities reported having a major road connection with the nearest town. Seventy-seven percent of surveyed communities participate in the PSNP and 47 percent have the CBN program running.
The health system network is instrumental for A&T to implement many of its community-based interventions. The existing health system serves the community well. All surveyed communities were served by the health extension of program. Ninety percent of the communities had at least one health post, 26 percent had at least one health center, and 7 percent had a government hospital. On average, there were 2.9 health workers and 23 volunteers in each community. However, even though there appears to be adequate FHWs in each community, it is important to recognize that these FHWs are responsible for all health-related needs in the community. The presence of CBN in most of the communities indicates the need for A&T to work closely with CBN.
FRONTLINE HEALTH WORKERS
This survey assessed knowledge levels of several frontline health workers. We found that IYCF knowledge was relatively high for HEWs and supervisors compared to VCHPs. Overall, breastfeeding-related knowledge was higher than complementary feeding-related knowledge. Over 70 percent of the HEWs received training on BF and CF during in-service training. Sixteen percent received training on essential nutrition action (ENA) and 62 percent received training on community-based nutrition (CBN). Reach of ENA training for VCHP was very low at 5.3 percent, but 53 percent of the VCHPs received training on CBN. Overall, motivation and satisfaction with work was high as was perceived value of work. However, the feeling of being overwhelmed was also highlighted in the data.
10.2 Conclusions
This report lays out the results of the baseline survey conducted as a part of the impact evaluation of A&T’s interventions in Ethiopia. This report documents the high levels on stunting in Ethiopia, and the rapid deterioration in child nutritional status during the first two years of life. Furthermore, we document suboptimal IYCF practices, in particular, low appropriate complementary feeding practices. These practices, in addition to other contextual factors outlined in this report, warrant urgent interventions to reduce overall stunting rates in Ethiopia.
Our results indicate a clear need for interventions that address, among other elements, the immediate determinants of IYCF practices, including maternal/caregiver knowledge regarding appropriate IYCF practices. In particular, there is a knowledge gap in relation to complementary feeding practices, both among mothers as well as frontline health workers. At the household level, the families in our survey sample are rural poor families, who are also beneficiaries of social protection programs, high levels of food insecurity, and who consume diets of very low diversity.
The relatively high level of interaction with frontline health workers and the extensive reach of the government’s health extension program highlights the potential of using this platform to deliver A&T interventions. Although exposure to media is low, there is a high level of social cohesion at the

105
community level through community meetings and other social platforms, further supporting efforts to focus on community-based social mobilization efforts as another platform to deliver behavior change communications interventions of A&T.
In summary, we interpret these baseline findings to note that the status of the key A&T impact indicators, as well as the context for IYCF in Ethiopia, offer significant potential for success through A&T’s combined strategies of interpersonal communication through frontline health workers and through social mobilization efforts. Further statistical analyses of the baseline data will help unpack the relationships between child undernutrition and the different domains reported here.

106
References
1. Measure DHS. Demographic and Health Survey. Ethiopia; 2005. Available from: http//www.measuredhs.com/pubs/pdf/FR179/FR179.pdf.
2. Kanjilal B, Mazumdar PG, Mukherjee M, Rahman MH. Nutritional status of children in India: household socioeconomic condition as the contextual determinant. Int J Equity Health. 2010;9(1):19.
3. Hatløy A, Hallund J, Diarra MM, Oshaug A. Food variety, socioeconomic status and nutritional status in urban and rural areas in Koutiala (Mali). Public Health Nutr. 2000; 3(1):57-65.
4. Developing and evaluating complex interventions: new guidance. Available from: www.mrc.ac.uk/complexinterventionsguidance.
5. Campbell M, Fitzpatrick R, Haines A, Kinmonth AL, Sandercock P, Spiegelhalter D, Tyrer P. Framework for design and evaluation of complex interventions to improve health. BMJ. 2000 Sep 16; 321(7262):694-6.
6. Victora CG, Black RE, Boerma JT, Bryce J. Measuring impact in the Millennium Development Goal era and beyond: a new approach to large-scale effectiveness evaluations. Lancet. 2011 Jan 1;377(9759):85-95.
7. Cogill B. Anthropometric Indicators Measurement Guide. Food and Nutrition Technical Assistance Project, Academy for Educational Development. Washington, DC; 2003.
8. World Health Organization. Indicators for assessing infant and young child feeding practices. Geneva; 2008.
9. World Health Organization. The WHO Child Growth Standards; 2010. Available from: http://www.who.int/childgrowth/standards/en/.
10. World Health Organization. A user's guide to the self reported questionnaire (SRQ). Geneva; 1994.
11. Youngmann R, Zilber N, Workneh F, Giel R. Adapting the SRQ for Ethiopian populations: a culturally-sensitive psychiatric screening instrument. Transcult Psychiatry. 2008 Dec;45(4):566-89.
12. Hanlon C, Medhin G, Alem A, Araya M, Abdulahi A, Hughes M, Tesfaye M, Wondimagegn D, Patel V, Prince M. Detecting perinatal common mental disorders in Ethiopia: validation of the self-reporting questionnaire and Edinburgh Postnatal Depression Scale. J Affect Disord. 2008 Jun;108(3):251-62.
Household Food Insecurity Access Scale (HFIAS) for Measurement of Food Access: Indicator Guide.Available from: http://www.fantaproject.org/downloads/pdfs/HFIAS_v3_Aug07.pdf.
14. Saha KK, Frongillo EA, Alam DS, Arifeen SE, Persson LA, Rasmussen KM. Household food security is associated with infant feeding practices in rural Bangladesh. J Nutr 2008;138(7):1383-90.
15. Woldehanna T. Economic shocks and early childhood nutritional achievements: a case in 20 villages of rural and urban Ethiopia. Paper presented at: CSAE Conference 2010 on Economic Development in Africa; 2009 Mar 21-23; Oxford, UK.
16. Alderman H, Christiaensen L, Yamano T. Child growth, shocks, and food aid in rural Ethiopia. Amer J Agr Econ. 2005;87(2):273-288.
17. Alive & Thrive. Practices, IYCF practices, beliefs, and influences in SNNP region, Ethiopia. Addis Ababa, Ethiopia; 2010.

107
18. Falceto OG, Giugliani ER, Fernandes CL. Influence of parental mental health on early termination of breast-feeding: a case-control study. J Am Board Fam Pract 2004;17(3):173-83.
19. United Nations Children Fund. The States of the World’s Children. Focus on Nutrition;1998. Available from: http://www.unicef.org/sowc98/silent4.htm

108
Annex 1
Figure A1.1 Alive and Thrive “community conversation” program pathway

109
Table A1.1 Seven excellent feeding actions
1. Mothers, begin breastfeeding within one hour of your baby’s birth. This will protect your baby from illness.
2. Mothers, exclusively breastfeed your baby for the first six months. This is the best way to show your love for your baby.
3. Mothers, at six months, feed your baby thick porridge. Thick porridge fills your baby’s stomach and so baby cries less.
4. Mothers, at six months, add a special food to baby’s porridge. Special foods protect baby from illness and gives your baby the energy she (or he) needs.
5. Fathers, it’s your job to make sure that baby has special foods added to his porridge. Special foods will keep baby healthy and strong.
6. Mothers and fathers, at 6 months, in addition to breastfeeding, make sure that your baby finishes three meals every day. Three full meals will help baby to grow well and stay healthy.
7. Mother and fathers, when your baby is sick, continue to breastfeed and give your baby extra food. After your baby is better, give an extra meal every day for at least 7 days. Extra food during and after illness helps your baby get back to full strength faster.

110
Annex 2
Figure A2.1 Stages of sampling
-1 community/ EA --1 HEW/ EA --1 VCHP/ EA --1 HEW supervisor/ EA
75 EAs (PPS) 1
st stage of sampling
EA selection
Tigray SNNPR
26 EAs (1040 respondents)
49 EAs (1952)
2nd
stage of sampling (HH selection) – 40HH/
EA -HH listings
- 3 sampling frames
0-5.9 months (214) 0–5.9 months (431)
6-23.9 months (370) 6-23.9 months (698)
24–59.9 months (523) 24–59.9 months (968)

111
Figure A2.2 UNICEF conceptual framework of child undernutrition [19]
Child malnutrition, death and disability
Inadequate dietary intake
Insufficient access to food
Inadequate maternal and
child care
Poor water/ sanitation & inadequate
health services
Quantity and quality of actual health resources-human, economic and organizational- and the way they are controlled
Potential resources: environment,
technology and people
Disease
Outcome
Immediate causes
Underlying causes at he
household and family level
Basic causes at the societal level
Inadequate and/or inappropriate knowledge and discriminatory attitudes limit
household access to actual resources
Political, cultural, religious, economic and social systems
including women’s status, limit utilization of potential
resources
A2.1 Description of Household Questionnaire Modules
Module 1: Household COMPOSITION
This module is the household composition, which is standard for any household survey. This provides us with the information about the household size, the gender of the household head, the occupation and education of the household members. This background information is important for describing the survey population, comparing the survey population to other surveys, and assessing changes in the survey population composition itself, if any, between baseline and endline.
Module 2: CIVIL STATUS, EDUCATION, EMPLOYMENT OF MOTHER AND SPOUSE, AND CHILDCARE ARRANGEMENTS
This module gathers detailed information on the occupation and employment characteristics of the respondent and her spouse. Key issues included access to steady income, cash flow, education, as well as social support for household work, etc. Some of the information is important for the purpose of describing the survey population and to compare our survey population with other representative surveys, like EDHS. Additionally, data from this module are instrumental for analyses, as these are the factors that will be controlled for when looking into the association between the independent variables (such as exposure to the program) and outcome (IYCF feeding practices). Women’s work and work characteristics are known to be associated with IYCF and anthropometric outcomes because of the implications of women’s work for childcare and child feeding. We gather data on these elements as part of this survey module.

112
Module 3: IYCF PRACTICES (INDEX AND NON-INDEX)
This module is directly related to Alive and Thrive major objectives and thus measures the outcomes of the overall initiative. This module, therefore, covers an array of breastfeeding and complementary feeding history in detail to enable computation of the WHO-recommended IYCF indicators as well as to assess IYCF practices in greater detail than just the eight WHO-recommended indicators. This is a standard module for any nutrition and feeding-related survey and DHS also collects similar information but not in as much detail. From this information, we will be able to estimate all the WHO-recommended IYCF indicators such as early initiation of breastfeeding, exclusive breastfeeding, continuation of breastfeeding, introduction of complementary feeding, dietary diversity, etc.
This section will also help to identify areas where programmatic intervention is needed, over and above information provided by the formative research. For example, if it is found in the baseline survey that the mothers are discouraged from giving colostrum, the program will need to develop messages and intervention addressing that.
Module 4: Use of Sprinkles—NA (not included in Ethiopia questionnaire)
Module 5: CHILD IMMUNIZATION, HEALTH HISTORY, AND APPETITE (INDEX AND NON-INDEX)
Child immunization and history of recent disease are an integral part of any child health and nutrition survey. In nutrition surveys, this information has added importance as nutritional status of a child is influenced by infectious diseases. Therefore, immunization status is important to capture. Both preventive care and timely curative management (such as additional feeding, continuation of breastfeeding) are key to addressing this issue.
This module also captures information on child appetite, which is important to assess in relation to overall child feeding, but also in relation to parental responsiveness to poor appetite and other feeding problems.
Module 6: NA (not included in Ethiopia questionnaire)
Module 7: PREGNANCY AND POSTNATAL CARE (YOUNGEST CHILD)
Child nutrition is influenced by a mother’s exposure to prenatal care and nutrition inputs during pregnancy. In addition, maternal exposure to information about infant feeding, particularly breastfeeding, begins at the pregnancy period. This module will provide information about the nature and extent of contacts mothers are having with the health care system, during pregnancy and the postnatal period. Also, this module will collect information on kinds of support and advise that mothers receive after childbirth to ensure that they are able to successfully breastfeed their infants exclusively in the first six months of life. This information is crucial from the perspective of Alive and Thrive’s goals to improve early and exclusive breastfeeding.
Module 8: MOTHER’S IYCF KNOWLEDGE, ATTITUDES, PRACTICES, AND PERCEPTION
Alive and Thrive aims at improving mothers’ knowledge as a route to improving IYCF practices and child nutrition. Mothers’ knowledge and attitudes about IYCF are critical factors in the pathway toward adopting better IYCF-related practices. Changes between baseline and endline in the knowledge,

113
attitude, and practice, after controlling for other factors such as background characteristics, education, and economic status, will indicate the effects of the intervention.
In this module, we also include a novel approach of assessing whether new knowledge gets translated into trial of new practices and whether behaviors that are tried are further sustained. This approach generates understanding of the barriers that lie between awareness and trial of a new behavior, as well as between trial and adoption of the same behavior. It has proven to be very useful in previous evaluation research that we have undertaken on improving IYCF practices.
Module 9: USE OF A&T COMMUNITY COMPONENT PROGRAM SERVICES
A&T will be working within the IFHP platform, which operates through the HEP system. HEWs and VCHPs are the primary contacts within the HEP who will provide key health- and nutrition-related services, including IYCF counseling to mothers, community conversations about IYCF, and other interactions. As such, these services are a primary program platform for A&T to reach the community. This module is, therefore, instrumental to measure the level of exposure of the mother to the program components at baseline and at endline. Since there is no comparison group in this study, it is absolutely essential that we capture the exposure to the health system in as much detail as possible in order to elucidate the pathways to impact for the intervention through IFHP support to the HEP. In addition, this module is intended to gather enough data on exposure to assess whether program impact varies by program exposure.
Module 10: MARKET ACCESS AND USE OF INFORMATION
Gathering data on market access and exposure/use of media information is important because A&T plans to use multiple communication channels to deliver IYCF-related messages to mothers and to mobilize civil society in relation to IYCF and nutrition. Furthermore, one of A&T’s objectives is to improve complementary feeding practices, including the use of fortified foods, by the mothers. Alive and Thrive will also be encouraging the private sector to make affordable, complementary food. With this in mind, this module is intended to provide data both on exposure to different media channels, and awareness of current health/nutrition messages of the media. In addition, given that A&T is aiming to improve the availability of fortified complementary foods and/or other fortified supplements in the market, it is important to know whether mothers have adequate access to markets.
Module 11: WOMAN’S CONDITION AND DECISIONMAKING POWER
Research demonstrates clearly that women’s control over assets and women’s status, more broadly, is an important determinant of child nutrition. Research globally, and in other countries, has also demonstrated that participation in credit groups and community/social networks empowers women and enhances their capability to make better decisions regarding child welfare. Women’s decisionmaking power in matters related to household issues and child health, as well as ownership of assets and control over purchasing, are the main focus of this module.
Module 12: PHYSICAL AND MENTAL WELL-BEING OF MOTHERS
Women’s own well-being is a critical resource for ensuring that women are able to care for their children. In addition, previous research has shown that household food security has influences on women’s well-being, which, in turn, influences their ability to care for their children, and feed them appropriately. We include in this module validated measures of mental well-being and physical well-

114
being. The purpose of including this module is to understand the role of women’s well-being in relation to IYCF in this context, and more important, to ensure that there are no negative changes in well-being over the life of the project that could lead to lowered impacts of the program interventions.
Module 13: HOUSEHOLD WATER, SANITATION, AND HYGIENCE SPOT-CHECK
Access to clean water and sanitation has been identified as one of the major underlying determinants of child nutrition status. There are actually two different types of implications related to access to clean water. In rural Ethiopia, it is not only hard to get access to clean water; mothers often have to travel a distance to get water for their daily use. While not having clean water affects the child’s health, the time and effort a mother puts to get water often happens at the expense of childcare, affecting child feeding practices. Thus it is very important that this survey addresses these issues.
Given the strong association between such illnesses as diarrhea, and cholera and nutritional status, it is critical that A&T carefully examine the hygiene and sanitation environment at the household level; this will allow the evaluation team to capture a critical underlying determinant of child nutritional status.
The spot-check method has been used extensively in the past. Reviews of studies carried out in various contexts have confirmed that spot-checks are a promising alternative to structured observations, because these are less intrusive, less time-consuming, more economical, and less reactive.
Module 14: SOCIOECONOMIC STATUS AND ECONOMIC SHOCKS
Socioeconomic status (SES) is an underlying determinant of child nutrition status. It can be measured in different ways, including the use of a full economic consumption-expenditure survey module, which is often more precise than asset-based measures. However, given that consumption-expenditure modules are very lengthy and can take more than an hour to administer, we have chosen to include in this questionnaire a more asset-based approach to assessing SES. The detailed information on household assets here will be used to create factor-analysis-based scales of household SES. In addition to the basic household assets, we also include questions on ownership of assets and control over assets. Knowing about the baseline situation both on overall household assets and construction, as well as women’s control over these assets, will help the evaluation team capture critical underlying factors that might influence the effect of the program inputs.
It is important to note that having detailed data on SES will enable interpretation of any negative changes between the baseline and endline survey.
It is reasonable to believe that during the life of the program, a household or community may experience an economic shock, which, in turn, may influence child nutritional status. Capturing information on such economic shocks is therefore critical to any assessment of impact. If, indeed, households in the A&T program areas experience economic shocks, this may explain any lack of a positive impact on IYCF practices or nutritional status that may be observed.
Module 15: HOUSEHOLD FOOD SECURITY, DIET DIVERSITY, AND SOCIAL AND FOOD ASSISTANCE
Household food security has been shown to be associated with 1) growth of infants and young children, and 2) infant feeding practices, which are the main impact indicators for Alive and Thrive. The Household Food Security module (HFIAS) is a validated measure of food security that has been developed by Food and Nutrition Technical Assistance (FANTA) project. It is possible to reduce the HFIAS

115
scale, which consists of nine questions, to three questions, which reflect the forthcoming Household Hunger Scale being developed by FANTA.
The household dietary diversity module, also a validated FANTA module, is a proxy measure of household food access, which is the ability of a household to acquire sufficient quality and quantity of food to meet all household members’ nutritional requirement for productive lives. A more diversified diet is associated with a number of improved outcomes, including child anthropometric status and micronutrient status, desired A&T program impacts.
It is important to understand how such household factors mediate the impact of A&T in the program areas in Ethiopia, and both scales can be administered in a short duration (~10 minutes).
Module 16: ANTHROPOMETRY
This module is directly related to the main impact indicator of Alive and Thrive, which is prevention of stunting.

116
Figure A2.3 Field team composition
M&E Coordinator (IFPRI)/ ACIPH Director
Survey coordinator
Expert supervisor (1)
Expert supervisor (1)
Expert supervisor (1)
Expert supervisor (1)
Field supervisors
(3/4)
Field supervisors
(3/4)
Field supervisors
(3/4)
Field supervisors
(3/4)
Data collector (4) and 1/2 for
anthropometric measurement
Survey team (4) and 1/2 for
anthropometric measurement
Survey team (4) and 1/2 for
anthropometric measurement
Survey team (4) and 1/2 for
anthropometric measurement

117
Table A2.2 Roles and responsibilities of field staff
Staff category Responsibility
Study Coordinator Coordination of overall study implementation along with the PI
Researchers Ensure quality of the study in their respective area of expertise: design, tool adaptation, anthropometry measurement, data quality
Participate in training, pre-test and field supervision
Field Supervisors Identify the clusters to be surveyed Coordinate interviewers’ work schedule
Supervise interviewers as they perform the survey, ensure that the interviewers follow
instructions Answer interviewers’ questions as they arise Complete at least four observations/EA and provide feedback to enumerators Complete at least two reinterviews/EA to assess quality of interviews Control data quality by checking that forms are completed fully and correctly Review each questionnaire in the field and at the end of the day to ensure completeness
and internal consistency Ensure that all the necessary survey supplies and forms are collected before leaving to
field and each day before going out to the field for data collection Receive completed forms regularly and store securely Preparing debriefing notes for the survey coordinator on the problems encountered and
lessons learned in the field (prepare reporting format)
Field enumerators Demarcation of EAs and enumeration of HHs in EAs Locate households assigned in the sample and complete a Household Questionnaire for
each Obtain consent of the mother/caregiver Interview the mother/caregiver using the appropriate questionnaire Check completed interviews to be sure that all the questions were asked and the
responses are neatly and legibly recorded Return to households to interview respondents who were absent during the previous
visit Make every effort to ensure confidentiality of the interviews and safety of the
respondents Preparing debriefing notes for the field supervisor on the problems encountered, if any Forwarding to the supervisor all completed questionnaires the same day
Local Coordinator Conduct community study Participate in selection of households Inform local authorities about the study Facilitate the survey process through obtaining/writing supportive letters
Local Guide Ensure the smooth progress of interview in each household Carry the weight scale and height board
Driver Ensure the safety of fieldworkers by driving safely and conducting mechanical checkup Keep the fieldwork time as ordered by the field supervisor Ensure the safety of properties loaded on the vehicle

118
Table A2.3 List of woredas, EAs, by regions
Region Woreda Enumeration Area name
Tigray Mereb Leha Woreda Mywedi Amberaye Tigray Ahiferom Woreda Ziban Guyila Tigray Ahiferom Woreda Dibdibo Tigray Wereilehi Woreda Zongi Tigray Wereilehi Woreda Azmera Tigray Adwa Woreda Mariyam Shewit Tigray Nader Adet Woreda Adi Serawit Tigray Nader Adet Woreda Shenako Tigray Kola Temben Woreda Getsikim Laslay Tigray Degua Temben Woreda Arebayi Tigray Degua Temben Woreda Mizane Birihan Tigray Tanqua Abergele Woreda Hibiret Tigray Gulo Meheda Woreda Kisadimai Tigray Saesi Tsadamba Woreda Gula Abina Tigray Ganta Afeshum Woreda Sasun Betehawariyat Tigray Hawzen Woreda Maykado Tigray Hawzen Woreda Koraro Tigray Klite Awlalo Woreda Mesanu Tigray Atsbi Wonberta Woreda Kal Amin Tigray Enderta Woreda Darega Ajeni Tigray Enderta Woreda Didiba Tigray Alage Woreda Tehia Tigray Endamehone Woreda Nikah Tigray Alamata Woreda Selen Weha Tigray Ofla Woreda Hegumberda Tigray Ofla Woreda Hayalo SNNPR Misha Woreda Shiro SNNPR Lemmo Woreda Massbira SNNPR Shashago Woreda Shayanbe Wanchikota SNNPR Duna Woreda Duenmera SNNPR Timbaro Woreda Gaecha SNNPR Timbaro Woreda Wero SNNPR Kacha Bira Woreda Eta SNNPR Hadaro Tunito Woreda Boha Tora SNNPR Shebedino Woreda Murancho Kutala SNNPR Shebedino Woreda Midire Genet SNNPR Arbegona Woreda Wala Kawado SNNPR Arbegona Woreda Shemetento SNNPR Aleta Wondo Woreda Shoicha SNNPR Boricha Woreda Onogo Bonkicha SNNPR Boricha Woreda Etawo Dawale SNNPR Boricha Woreda Chirko Bore SNNPR Malga Woreda Borena SNNPR Wensho Woreda Barabalcho SNNPR Wensho Woreda Hayilo SNNPR Loko Abaya Woreda Argeda Haro Dimtu SNNPR Chuko Woreda Rufo Chancho SNNPR Chuko Woreda Lelawemerera SNNPR Yirgachefe Woreda Wegeda
(continued)

119
Region Woreda Enumeration Area name
SNNPR Yirgachefe Woreda Kededa SNNPR Dilazuria Woreda Asshotum Hafero SNNPR Bolossa Sore Woreda Gara Godo SNNPR Bolossa Sore Woreda Dubo SNNPR Damot Gale Woreda Wegera SNNPR Damot Woyide Woreda Munido Jabeke SNNPR Ofa Woreda Okotosere SNNPR Damot Pulasa Woreda Busha SNNPR Deguna Fanigo Woreda Danido Koyisha Humibo SNNPR South Ari Woreda Oldamer SNNPR South Ari Woreda Dordora SNNPR South Ari Woreda Alga SNNPR Gelila Woreda Zifite Akocha SNNPR Bena Tsemay Woreda Kako SNNPR Melekoza Woreda Gerigeda SNNPR Denibu Gofa Woreda Kolta Kelcha SNNPR Deramalo Woreda Dere SNNPR Zala Woreda Barza SNNPR Uba Debretsehay Woreda Hoshele Shembera SNNPR Geze Gofa Woreda Ankozuza SNNPR Tocha Woreda Dhaki Doba SNNPR Basketo Woreda Mote Kesaaeizeka SNNPR Konta Special Wereda Ofa Shatera SNNPR Alaba Special Woreda Huletegna Koncha SNNPR Alaba Special Woreda Langaw Mekala SNNPR Hawassa City Administration Shemena Midregenet

120
Annex 4
Table A4.1 WHO-recommended IYCF indicators
Indicator name Definition Numerator Denominator
Early initiation of breastfeeding
Proportion of children born in the last 24 months who were put to the breast within 1 hour of birth
Children born in the last 24 months who were put to the breast within 1 hour of birth
Children born in the last 24 months
Exclusive breastfeeding under 6 months
Proportion of infants 0–5 months of age who are fed exclusively with breastmilk
Infants 0–5 months of age who received only breastmilk during the previous day
Infants 0–5 months
Continued breastfeeding at 1 year
Proportion of children 12–15 months of age who are fed breastmilk
Children 12–15 months who received breastmilk during the previous day
Children 12–15 months
Introduction of solid, semisolid, or soft foods
Proportion of infants 6–8 months of age who receive solid, semisolid, or soft foods
Children 6–8 months of age who received solid, semisolid, or soft foods during the previous day
Children 6–8 months
Minimum dietary diversity (≥ 4 food groups)
Proportion of children 6–23 months of age who receive foods from 4 or more food groups
Children 6–23 months of age who received foods from ≥ 4 food groups during the previous day
Children 6–23 months
Minimum meal frequency
Proportion of breastfed and non-breastfed children 6–23 months of age who receive solid, semisolid, or soft foods (but also including milk feeds for non-breastfed children) the minimum number of times or more
Breastfed or non-breastfed children 6–23 months of age who received solid, semisolid, or soft foods the minimum number of times or more during the previous day
Breastfed or non-breastfed children 6–23 months of age
Minimum acceptable diet
Proportion of children 6–23 months of age who receive a minimum acceptable diet (apart from breastmilk)
Breastfed children 6–23 months who had at least the minimum dietary diversity and the minimum meal frequency during the previous day
Breastfed children 6–23 months of age
Non-breastfed children 6–23 months of age who received at least 2 milk feedings and had at least the minimum dietary diversity, not including milk feeds and the minimum meal frequency during the previous day
Non-breastfed children 6–23 months of age
Consumption of iron-rich or iron-fortified foods
Proportion of children 6–23 months of age who receive an iron-rich food or iron-fortified food that is especially designed for infants and young children, or that is fortified in the home
Children 6–23 months of age who received an iron-rich food or a food that was especially designed for infants and young children and was fortified with iron during the previous day
Children 6–23 months
Children ever breastfed
Proportion of children born in the last 24 months who were ever breastfed
Children born in the last 24 months who were ever breastfed
Children born in the last 24 months
Continued breastfeeding at 2 years (20–23 months)
Proportion of children 20–23 months of age who are fed breastmilk
Children 20–23 months of age who received breastmilk during the previous day
Children 20–23 months
Age appropriate breastfeeding
Proportion of children 0–23 months of age who are appropriately breastfed
Infants 0–5 months who received only breastmilk during the previous day
Infants 0–5 months of age
Children 6–23 months of age who received breastmilk, as well as solid, semisolid, or soft foods, during the previous day
Children 6–23 months of age (continued)

121
Indicator name Definition Numerator Denominator
Predominant breastfeeding among children under 6 months
Proportion of infants 0–5 months of age who are predominantly breastfed
Infants 0–5 months of age who received breastmilk as the predominant source of nourishment during the previous day
Children 0–5 months
Duration of breastfeeding
Median duration of breastfeeding among children 0–35 months of age
Children 0–35 months
Bottle feeding Proportion of children 0–23 months of age who are fed with a bottle
Children 0–23 months of age who were fed with a bottle during the previous day
Children 0–23 months
Milk feeding frequency for non-breastfed children
Proportion of non-breastfed children 6–23 months of age who receive at least 2 milk feedings
Non-breastfed children 6–23 months of age who received at least 2 milk feedings during the previous day
Non-breastfed children 6–23 months

122
Table A4.2 Food consumed by children in the last 24 hours
6-59 months 6-12 months
Percent Percent Percent Percent Percent Percent
Tigray (n = 903)
SNNPR (n = 1,692)
All (n = 2,595)
Tigray (n = 100)
SNNPR (n = 225)
All (n = 325)
Ate the following food in last 24 hours
Porridge or gruel (made from grain other than teff) 35.8 27.8 30.6 36.0 35.1 35.4
Bread, pasta, rice noodles, etc. 59.6 55.1 56.7 38.0 28.0 31.1
Any food made from teff like injera 82.9 44.0 57.5 50.0 21.3 30.2
Any white potatoes, white yams, Bulla, Kocho, kasava, or any other food made from roots 7.5 51.6 36.3 4.0 20.9 15.7
Any pumpkin, carrot, squash, or sweet potato that is yellow or orange inside 4.4 16.6 12.4 5.0 8.0 7.1
Dark green leafy vegetables (example: Kale, spinach, or Amaranth leaves) 11.9 30.3 23.9 2.0 7.1 5.6
Any other vegetables (starchy vegetables: plantain) 2.4 5.5 4.4 1.0 5.8 4.3
Any liver, kidney, heart, or organ meats 0.7 0.1 0.3 0.0 0.0 0.0
Any beef, pork, lamb, goat, rabbit, or wide game meat, such as antelope or deer 3.8 1.4 2.2 0.0 0.0 0.0
Any chicken, ducks, or other birds 0.2 0.1 0.1 0.0 0.0 0.0
Any eggs 13.0 5.8 8.3 10.0 5.3 6.8
Any food made from beans, peas, lentil, or pulses 47.6 15.3 26.5 20.2 5.3 9.9
Any nuts or seeds, such as peanuts, sesame, sunflower seeds 4.7 1.0 2.3 5.0 0.9 2.2
Any milk product, like cheese, yogurt 7.1 12.6 10.7 4.0 7.6 6.5
Any food made from oil, fat, or butter 55.6 35.0 42.1 25.0 14.7 17.9
Milk (nonhuman milk—cow, goat, or powder) 14.9 36.1 28.7 10.0 36.2 28.1
Any other solid or semisolid food 33.8 21.6 25.8 15.0 12.4 13.2
Water 94.1 94.5 94.4 83.0 77.3 79.1

123
Table A4.3 Food consumed by children in the last 24 hours
Tigray
(n = 1,040) SNNPR
(n = 1,952) All
(n = 2,992)
Percent Percent Percent
Characteristics < 6
months 6-8
months > 8
months Not yet < 6
months 6-8
months > 8
months Not yet < 6
months 6-8
months > 8
months Not yet
Water 47.6 35.6 2.7 14.1 39.1 38.5 4.9 17.5 42.1 37.5 4.1 16.3 Other liquids 18.7 43.5 11.5 26.3 12.2 39.1 13.4 35.4 14.4 40.6 12.7 32.3 Other milk 14.7 41.6 10.7 33.1 11.5 38.2 11.3 39.0 16.4 43.3 10.3 30.0 Rice gruel 10.3 46.3 12.8 30.5 13.9 46.8 8.3 30.9 12.7 46.7 9.9 30.8 Semisolid food 5.0 40.6 26.0 28.4 3.4 40.7 26.5 29.2 3.9 40.8 26.3 29.0 Solid foods 3.2 33.1 39.5 24.2 1.4 30.2 40.3 28.8 2.0 31.2 40.0 26.7 Fish 0.7 3.7 0.9 94.8 0.6 0.0 2.3 97.1 0.6 2.8 0.3 96.3 Meat 0.2 4.5 46.8 48.5 0.1 2.3 35.1 62.5 0.1 3.1 39.1 57.7 Eggs 3.2 41.8 22.5 32.4 2.4 35.5 24.1 38.1 2.7 37.7 23.6 36.1 Legumes 1.0 17.0 18.8 63.2 1.1 10.9 19.6 68.4 1.1 13.0 19.3 66.6 Vegetables 0.7 10.7 45.6 43.1 0.6 13.8 46.3 39.3 0.6 12.7 46.0 40.6 Fruits 1.6 22.1 30.4 45.9 1.9 30.1 34.1 33.9 1.8 27.4 32.9 38.0

124
Table A4.4 Mean differences in undernutrition status, by gender
Characteristics Male Female Difference
[mean(male) – mean(female)]
Height-for-age Z-score (HAZ) -1.79 -1.59 0.20**
Weight-for-age Z-score (WAZ) -1.20 -1.03 0.16***
Weight-for-height Z-score (WHZ) -0.26 -0.18 0.08 Notes: t statistics in parentheses; * p < 0.05,
** p < 0.01,
*** p < 0.001.
Table A4.5 Mean differences in IYCF practices, by gender
Characteristics Male Female Difference
[[mean(female) – mean(male)]
Early in initiation of breastfeeding (within I hour of birth) 0.66 0.67 0.01
Exclusive breastfeeding among children under 6 months 0.72 0.73 0.01
Continued breastfeeding at 1 year (12–15 months) 1.00 0.96 -0.04 Introduction of solid, semisolid food, or soft foods
(between 6–8.9 months) 0.38 0.37 -0.02 Minimum dietary diversity (≥ 4 food groups) 0.06 0.07 0.01 Minimum meal frequency 0.46 0.46 0.00 Minimum acceptable diet 0.04 0.05 0.02 Consumption of iron-rich food 0.02 0.02 0.01 Notes: t statistics in parentheses; * p < 0.05, ** p < 0.01, *** p < 0.001.

125
Annex 5
Table A5.1 Mothers’ CF-related knowledge
Tigray SNNPR All
Percent Percent Percent
Gruel being too thin is the most common problem Too thin 11.5 8.8 9.7
Too thick 8.4 9.3 9.0
No problem 1.5 2.2 1.9
Other 73.6 75.1 74.5
Do not know 5.1 4.7 4.8 Special foods to complement breastmilk
Enriched porridge with breastmilk 3.0 1.3 1.9
Enriched porridge with other kinds of milk 21.9 18.5 19.7
Enriched porridge with egg 22.0 16.2 18.2
Enriched porridge with other ingredients 30.2 35.9 33.9
Others 34.9 35.4 35.2 A 12-month-old child cannot eat alone 11.3 4.4 6.8 Times per day a child of 7–8 months old eats
3 or more meals 34.2 22.3 26.5
2 or more snacks 19.2 8.1 12.0
5 or more overall 15.2 12.1 13.2 Times per day a child of 13–24 months old eats
3 or more meals 35.9 24.2 28.3
2 or more snacks 18.1 9.5 12.5
5 or more overall 18.5 12.4 14.5

126
Table A5.2 Mothers’ knowledge about feeding practice after illness
Tigray (n = 25)
SNNPR (n = 48)
All (n = 73)
Percent Percent Percent
The steps to take if the child has diarrhea Give lemlem/home-prepared solution 11.3 8.2 9.2
Feed less than usual 0.5 1.3 1.0
Feed as much food as usual 4.9 4.8 4.8
Feed more than usual 11.7 8.4 9.5
Give less liquids than usual 2.5 1.3 1.7
Give as much liquids as usual 19.7 11.2 14.2
Give more liquids than usual 10.5 6.4 7.8
Continue breastfeeding 6.0 2.1 3.4
Breastfeed more often 3.4 1.4 2.1
Give syrups 5.5 5.0 5.2
Give traditional medicine 15.6 29.5 24.7
Give treated water 0.9 0.7 0.8
Give carrot juice or rice water 1.3 0.4 0.7
Give zinc 0.3 0.1 0.2
Others 29.7 21.6 24.5 The steps to take when the child is recovering from diarrhea/illness
Feed less than usual 2.6 2.6 2.6
Feed as much food as usual 20.7 22.6 22.0
Feed more than usual 26.4 19.2 21.7
Feed an extra meal every day for 2 weeks 35.5 31.3 32.8
Give more liquids than usual 20.7 19.7 20.1
Continue breastfeeding 10.7 10.7 10.7
Others 4.8 0.7 2.1 How long do children need to be breastfed after being sick
Less than 1 week 34.2 38.3 36.9
1 week 13.4 15.2 14.6
2 week 16.2 11.7 13.2
More than 2 weeks 11.5 7.3 8.8
Do not think they need an extra meal 24.7 27.5 26.5

127
Table A5.3 Mothers’ knowledge on personal hygiene
Tigray SNNPR All
Percent Percent Percent
Wash hands Before eating 91.4 86.3 88.1
After using the toilet 56.7 59.0 58.2
Before feeding the child 61.1 64.3 63.2
After cleaning a child who has defecated 31.3 24.3 26.7
Other 19.5 13.6 15.7 Protecting the child from getting worms
Wash hands of child 57.2 47.9 51.1
Wash hands before preparing food and feeding child 57.6 55.5 56.2
Cut nails 11.0 4.2 6.6
Children should wear pants 3.5 2.8 3.1
Wash fruits and vegetables 1.4 1.6 1.5
Children should wear sandals 2.8 1.0 1.6
Give them treated water 11.5 6.3 8.1 Making drinking water safe
Boil water 46.5 33.6 38.1
Treat with chlorine 6.3 19.4 14.9
Other 22.9 31.7 28.6

128
Table A5.4 Mothers’ perception on improving feeding
Tigray SNNPR All
Percent Percent Percent
Encouraging the child to eat Feed slowly and patiently 39.1 40.6 38.3
Talk to the child 8.1 7.9 8.3
Force the child 3.0 2.3 3.3
Reduce distractions 4.1 3.7 4.3
Feed other foods 42.2 44.1 41.3
Change flavor of the food 44.2 44.5 44.1
Other 1.1 2.2 0.5 Foods needed to grow < 24 months
Gruels/bread/rice/other carbs 26.9 31.9 24.3
Gruel with milk 13.9 19.5 10.9
Animal foods such as meat or chicken 13.2 13.4 13.2
Fish 2.0 2.5 1.7
Eggs 61.9 58.8 63.6
Fruits 29.8 14.6 37.9
Vegetables 35.6 28.6 39.4
Milk 43.9 44.0 43.9
Peas/beans (dried, pureed, flour) 7.9 8.4 7.6
Other 7.1 8.1 6.6 Reasons for being malnourished
Don’t eat enough food/poor appetite 24.1 27.9 22.1
Don’t eat frequently 20.9 22.7 20.0
Child is ill (diarrhea, infection, etc.) 7.1 8.7 6.3
Child is weaned abruptly 0.8 1.4 0.5
Child is not fed with affection 1.6 2.0 1.4
Unbalanced meals 32.3 32.5 32.2
Insufficient quantity of food 67.3 61.9 70.2
Other 1.4 2.1 1.0
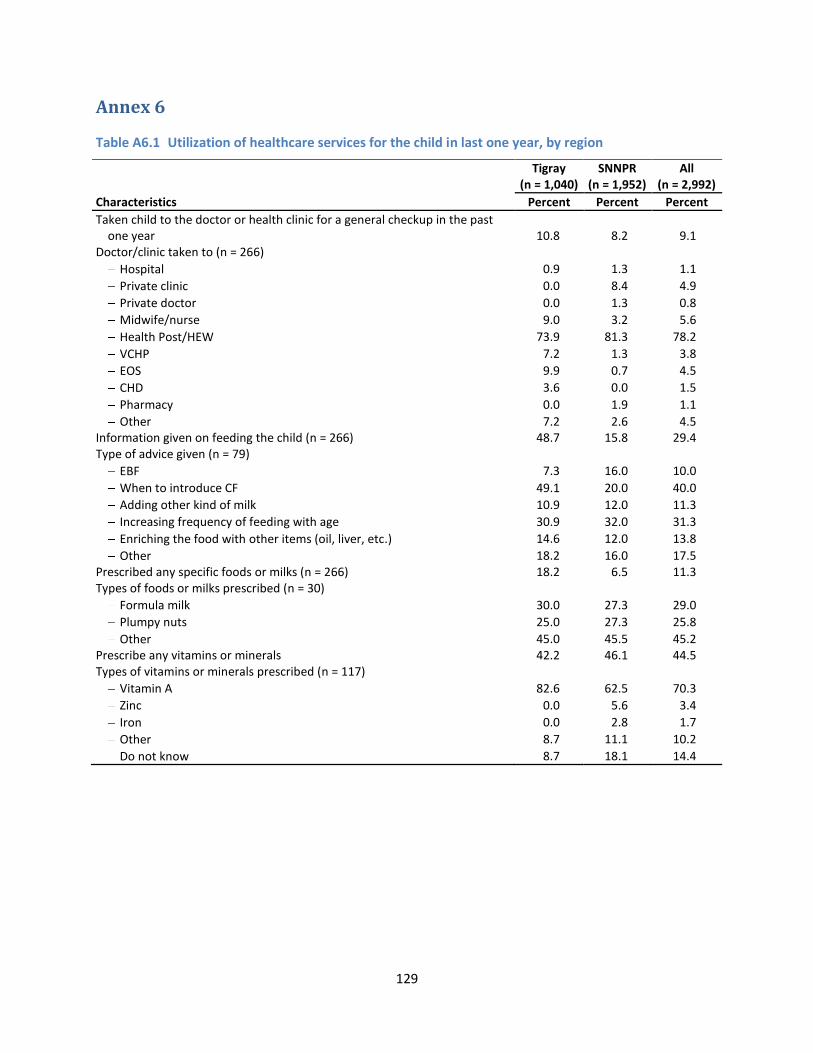
129
Annex 6
Table A6.1 Utilization of healthcare services for the child in last one year, by region
Tigray (n = 1,040)
SNNPR (n = 1,952)
All (n = 2,992)
Characteristics Percent Percent Percent
Taken child to the doctor or health clinic for a general checkup in the past one year 10.8 8.2 9.1
Doctor/clinic taken to (n = 266) Hospital 0.9 1.3 1.1
Private clinic 0.0 8.4 4.9
Private doctor 0.0 1.3 0.8
Midwife/nurse 9.0 3.2 5.6
Health Post/HEW 73.9 81.3 78.2
VCHP 7.2 1.3 3.8
EOS 9.9 0.7 4.5
CHD 3.6 0.0 1.5
Pharmacy 0.0 1.9 1.1
Other 7.2 2.6 4.5 Information given on feeding the child (n = 266) 48.7 15.8 29.4 Type of advice given (n = 79)
EBF 7.3 16.0 10.0
When to introduce CF 49.1 20.0 40.0
Adding other kind of milk 10.9 12.0 11.3
Increasing frequency of feeding with age 30.9 32.0 31.3
Enriching the food with other items (oil, liver, etc.) 14.6 12.0 13.8
Other 18.2 16.0 17.5 Prescribed any specific foods or milks (n = 266) 18.2 6.5 11.3 Types of foods or milks prescribed (n = 30)
Formula milk 30.0 27.3 29.0
Plumpy nuts 25.0 27.3 25.8
Other 45.0 45.5 45.2 Prescribe any vitamins or minerals 42.2 46.1 44.5 Types of vitamins or minerals prescribed (n = 117)
Vitamin A 82.6 62.5 70.3
Zinc 0.0 5.6 3.4
Iron 0.0 2.8 1.7
Other 8.7 11.1 10.2
Do not know 8.7 18.1 14.4
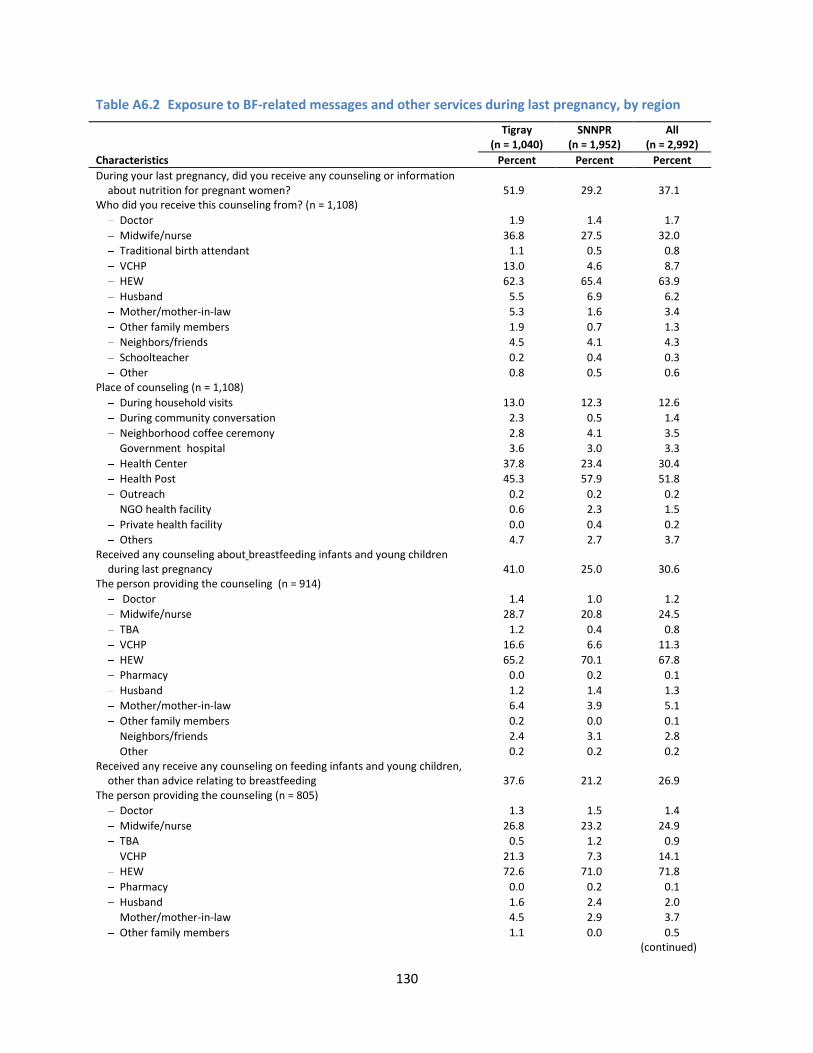
130
Table A6.2 Exposure to BF-related messages and other services during last pregnancy, by region
Tigray (n = 1,040)
SNNPR (n = 1,952)
All (n = 2,992)
Characteristics Percent Percent Percent
During your last pregnancy, did you receive any counseling or information about nutrition for pregnant women? 51.9 29.2 37.1
Who did you receive this counseling from? (n = 1,108) Doctor 1.9 1.4 1.7
Midwife/nurse 36.8 27.5 32.0
Traditional birth attendant 1.1 0.5 0.8
VCHP 13.0 4.6 8.7
HEW 62.3 65.4 63.9
Husband 5.5 6.9 6.2
Mother/mother-in-law 5.3 1.6 3.4
Other family members 1.9 0.7 1.3
Neighbors/friends 4.5 4.1 4.3
Schoolteacher 0.2 0.4 0.3
Other 0.8 0.5 0.6 Place of counseling (n = 1,108)
During household visits 13.0 12.3 12.6
During community conversation 2.3 0.5 1.4
Neighborhood coffee ceremony 2.8 4.1 3.5
Government hospital 3.6 3.0 3.3
Health Center 37.8 23.4 30.4
Health Post 45.3 57.9 51.8
Outreach 0.2 0.2 0.2
NGO health facility 0.6 2.3 1.5
Private health facility 0.0 0.4 0.2
Others 4.7 2.7 3.7 Received any counseling about breastfeeding infants and young children
during last pregnancy 41.0 25.0 30.6 The person providing the counseling (n = 914)
Doctor 1.4 1.0 1.2
Midwife/nurse 28.7 20.8 24.5
TBA 1.2 0.4 0.8
VCHP 16.6 6.6 11.3
HEW 65.2 70.1 67.8
Pharmacy 0.0 0.2 0.1
Husband 1.2 1.4 1.3
Mother/mother-in-law 6.4 3.9 5.1
Other family members 0.2 0.0 0.1
Neighbors/friends 2.4 3.1 2.8
Other 0.2 0.2 0.2 Received any receive any counseling on feeding infants and young children,
other than advice relating to breastfeeding 37.6 21.2 26.9 The person providing the counseling (n = 805)
Doctor 1.3 1.5 1.4
Midwife/nurse 26.8 23.2 24.9
TBA 0.5 1.2 0.9
VCHP 21.3 7.3 14.1
HEW 72.6 71.0 71.8
Pharmacy 0.0 0.2 0.1
Husband 1.6 2.4 2.0
Mother/mother-in-law 4.5 2.9 3.7
Other family members 1.1 0.0 0.5
(continued)

131
Tigray (n = 1,040)
SNNPR (n = 1,952)
All (n = 2,992)
Characteristics Percent Percent Percent
Neighbors/friends 1.8 3.4 2.7
Other 0.3 0.2 0.3 Received any counseling on the need for pregnant women to get sufficient
rest during their pregnancy 54.0 29.5 38.0 The person providing the counseling (n = 1,137)
Doctor 1.3 1.4 1.3
Midwife/nurse 29.4 22.0 25.6
TBA 0.4 0.5 0.5
VCHP 17.8 5.6 11.6
HEW 60.1 65.4 62.8
Husband 8.1 10.5 9.3
Mother/mother-in-law 10.7 4.6 7.5
Other family members 1.8 1.1 1.4
Neighbors/friends 7.5 8.2 7.9
Nobody/Never need advice 0.4 0.0 0.2
Other 0.6 0.7 0.6 The size of the baby at birth
Very big 6.9 18.9 14.8
Bigger than average 8.8 17.0 14.2
Average 40.4 34.1 36.2
Smaller than average 10.0 10.5 10.4
Very small 24.5 16.0 18.9
Does not know 9.5 3.5 5.6 Had caesarian section 9.0 25.4 16.3 Suffered from night blindness during last pregnancy 24.8 34.6 31.2 Took any iron/folic acid supplements during last pregnancy 43.5 19.5 27.9
Mean (SD) Mean (SD) Mean (SD)
Total days of taking iron/folic acid during last pregnancy 32.6 (37.7) 24.1 (28.0) 28.7 (33.8)
Table A6.3 Child measured during recent health checkup, by region
Tigray (n = 1,040)
SNNPR (n = 1,952)
All (n = 2,992)
Height Weight Height Weight Height Weight
Characteristics Percent Percent Percent Percent Percent Percent
In the past one year, the child went for health checkup 10.8 8.2 9.1
Child measured at the checkup 34.3 62.7 13.9 23.9 22.1 39.8 Told about the child’s weight/height 35.0 64.4 37.5 58.3 35.7 62.4 Told about the child’s growth in weight/height 30.0 51.4 25.0 44.4 28.6 49.1 Given any specific advise after the child was
measured 28.8 50.7 38.1 42.9 31.3 48.2
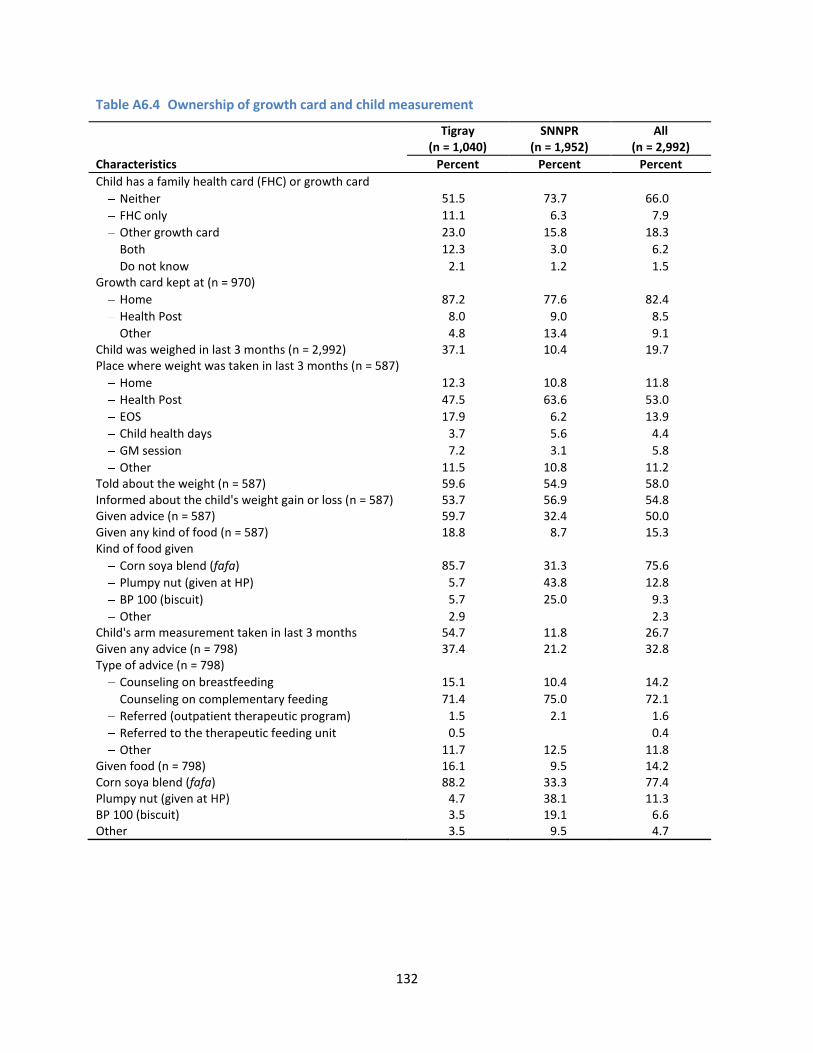
132
Table A6.4 Ownership of growth card and child measurement
Tigray (n = 1,040)
SNNPR (n = 1,952)
All (n = 2,992)
Characteristics Percent Percent Percent
Child has a family health card (FHC) or growth card Neither 51.5 73.7 66.0
FHC only 11.1 6.3 7.9
Other growth card 23.0 15.8 18.3
Both 12.3 3.0 6.2
Do not know 2.1 1.2 1.5 Growth card kept at (n = 970)
Home 87.2 77.6 82.4
Health Post 8.0 9.0 8.5
Other 4.8 13.4 9.1 Child was weighed in last 3 months (n = 2,992) 37.1 10.4 19.7 Place where weight was taken in last 3 months (n = 587)
Home 12.3 10.8 11.8
Health Post 47.5 63.6 53.0
EOS 17.9 6.2 13.9
Child health days 3.7 5.6 4.4
GM session 7.2 3.1 5.8
Other 11.5 10.8 11.2 Told about the weight (n = 587) 59.6 54.9 58.0 Informed about the child's weight gain or loss (n = 587) 53.7 56.9 54.8 Given advice (n = 587) 59.7 32.4 50.0 Given any kind of food (n = 587) 18.8 8.7 15.3 Kind of food given
Corn soya blend (fafa) 85.7 31.3 75.6
Plumpy nut (given at HP) 5.7 43.8 12.8
BP 100 (biscuit) 5.7 25.0 9.3
Other 2.9
2.3 Child's arm measurement taken in last 3 months 54.7 11.8 26.7 Given any advice (n = 798) 37.4 21.2 32.8 Type of advice (n = 798)
Counseling on breastfeeding 15.1 10.4 14.2
Counseling on complementary feeding 71.4 75.0 72.1
Referred (outpatient therapeutic program) 1.5 2.1 1.6
Referred to the therapeutic feeding unit 0.5
0.4
Other 11.7 12.5 11.8 Given food (n = 798) 16.1 9.5 14.2 Corn soya blend (fafa) 88.2 33.3 77.4 Plumpy nut (given at HP) 4.7 38.1 11.3 BP 100 (biscuit) 3.5 19.1 6.6 Other 3.5 9.5 4.7

133
Table A6.5 Access to complementary foods available in the market
Tigray (n = 1,040)
SNNPR (n = 1,952)
All (n = 2,992)
Characteristics Percent Percent Percent
Never bought any food from the market 88.2 94.6 92.4 Bought the following foods (n = 226)
Fafa 76.4 69.5 73.3
Cerifam 10.6 1.9 6.6
Famix 0.0 1.0 0.4
Edget milk 9.8 1.9 6.1
Dube flour 21.1 34.3 27.2
Favena 0.0 1.0 0.4
Berta 6.5 14.3 10.1
Other 76.4 69.5 73.3 Frequency of purchase (n = 226)
Bimonthly 14.5 44.1 27.9
Monthly 33.9 33.3 33.6
Every two months 27.4 11.8 20.4
Other 24.2 10.8 18.1 Last time to purchase the food (n = 226)
0-3 months 60.5 71.6 65.5
3-6 months 14.5 10.8 12.8
> 6 months 21.0 16.7 19.0
Do not know 4.0 1.0 2.7 The place to purchase the foods (n = 226)
Ordinary shop 18.6 31.7 24.4
Cooperative shop 12.9 11.9 12.4
Open market 66.1 53.5 60.4
Others 2.4 3.0 2.7 Currently purchasing (n = 226) 43.2 57.4 49.6 Reasons for stop purchasing (n = 93)
High price 31.0 25.7 29.0
Low income 36.2 28.6 33.3
Not available in the market 0.0 8.6 3.2
Substituting with homemade foods 14.0 25.0 18.3
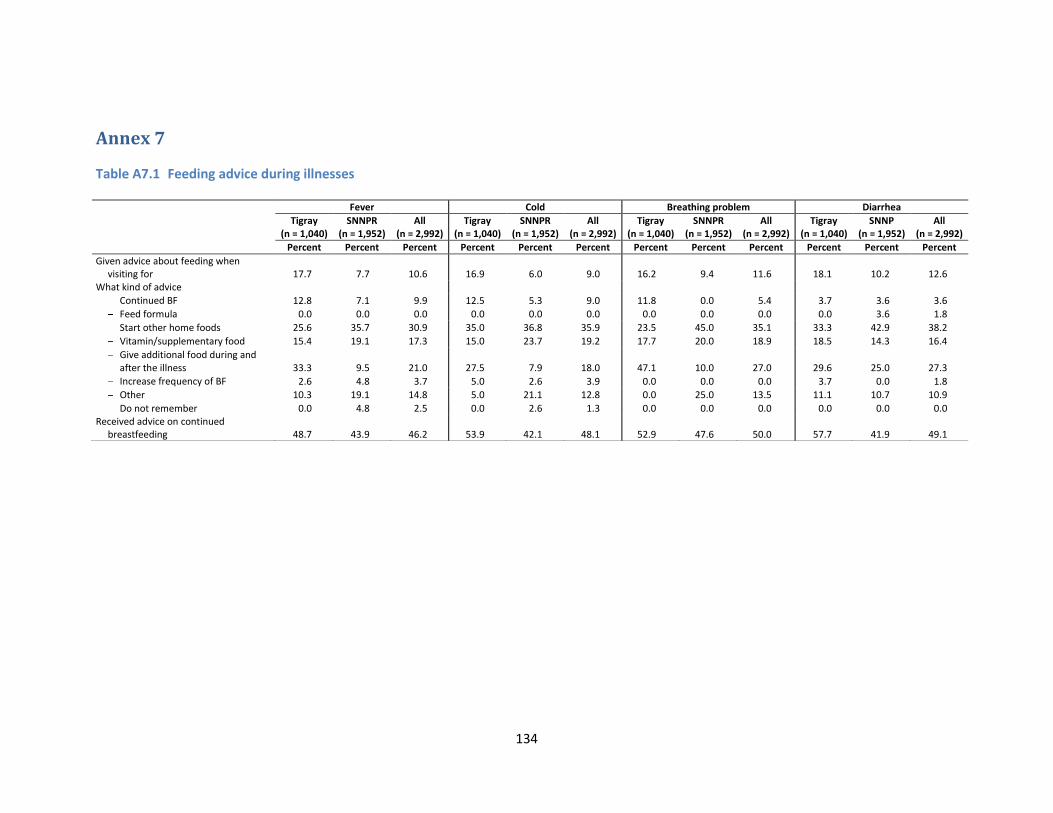
134
Annex 7
Table A7.1 Feeding advice during illnesses
Fever Cold Breathing problem Diarrhea
Tigray (n = 1,040)
SNNPR (n = 1,952)
All (n = 2,992)
Tigray (n = 1,040)
SNNPR (n = 1,952)
All (n = 2,992)
Tigray (n = 1,040)
SNNPR (n = 1,952)
All (n = 2,992)
Tigray (n = 1,040)
SNNP (n = 1,952)
All (n = 2,992)
Percent Percent Percent Percent Percent Percent Percent Percent Percent Percent Percent Percent
Given advice about feeding when visiting for 17.7 7.7 10.6 16.9 6.0 9.0 16.2 9.4 11.6 18.1 10.2 12.6
What kind of advice Continued BF 12.8 7.1 9.9 12.5 5.3 9.0 11.8 0.0 5.4 3.7 3.6 3.6
Feed formula 0.0 0.0 0.0 0.0 0.0 0.0 0.0 0.0 0.0 0.0 3.6 1.8
Start other home foods 25.6 35.7 30.9 35.0 36.8 35.9 23.5 45.0 35.1 33.3 42.9 38.2
Vitamin/supplementary food 15.4 19.1 17.3 15.0 23.7 19.2 17.7 20.0 18.9 18.5 14.3 16.4
Give additional food during and after the illness 33.3 9.5 21.0 27.5 7.9 18.0 47.1 10.0 27.0 29.6 25.0 27.3
Increase frequency of BF 2.6 4.8 3.7 5.0 2.6 3.9 0.0 0.0 0.0 3.7 0.0 1.8
Other 10.3 19.1 14.8 5.0 21.1 12.8 0.0 25.0 13.5 11.1 10.7 10.9
Do not remember 0.0 4.8 2.5 0.0 2.6 1.3 0.0 0.0 0.0 0.0 0.0 0.0 Received advice on continued
breastfeeding 48.7 43.9 46.2 53.9 42.1 48.1 52.9 47.6 50.0 57.7 41.9 49.1

135
Table A7.2 Self-efficacy of mothers about child feeding practices, by region
Tigray (n = 1,040)
SNNPR (n = 1,952)
All (n = 2,992)
Percent Percent Percent
Characteristics 1 2 3 4 5 6 1 2 3 4 5 6 1 2 3 4 5 6
If I add meat or egg to my child’s meal, the baby will grow strong and smart 0.0 1.6 0.3 45.9 51.5 0.7 0.4 0.5 1.2 52.3 45.4 0.2 0.2 0.9 0.9 50.1 47.5 0.3
In my household, I get support if I feed my child who is 6-24 months old before giving food to other members of the household 0.5 3.9 2.6 58.1 34.4 0.6 0.1 2.4 2.3 57.4 37.5 0.4 0.2 2.9 2.4 57.6 36.4 0.4
Most mothers in our community give only breastmilk until the baby is 6 months old 19.1 42.5 9.5 17.1 7.6 4.3 17.6 41.2 14.6 16.7 6.3 3.6 18.1 41.6 12.8 16.9 6.8 3.9
Taking time to talk with and encourage my child to eat more makes me feel like a loving mother 0.9 1.6 2.6 56.1 38.2 0.6 0.6 1.3 2.9 61.7 33.4 0.2 0.7 1.4 2.8 59.8 35.0 0.3
When I give only my breast—and no other food or drink—to my baby under 6 months, I know that I am doing the best for my child 2.6 9.9 3.6 47.1 36.2 0.6 1.1 6.3 6.5 51.7 34.4 0.1 1.6 7.5 5.5 50.1 35.0 0.3
Because I have so much work to do, I do not have time to sit with my child and encourage him/her to eat more 23.0 55.3 6.3 12.3 2.3 0.9 28.8 55.3 5.1 8.1 2.4 0.4 26.7 55.3 5.5 9.5 2.4 0.6
I believe I can give my child an extra meal each day for the two weeks after s/he has been sick 0.3 2.9 6.7 63.1 25.0 2.0 0.5 1.5 13.1 61.2 20.6 3.2 0.4 2.0 10.9 61.8 22.1 2.8
I believe I am able to nourish my child adequately with only my breastmilk through 6 months of age 2.0 10.8 4.2 53.2 29.1 0.7 1.0 6.9 8.3 52.5 31.0 0.3 1.4 8.3 6.8 52.7 30.4 0.4
I believe I could refuse to feed my child anything other than breastmilk immediately after s/he is born [pre-lacteals] 1.8 11.1 4.6 45.7 36.3 0.6 1.3 6.9 5.1 49.7 36.6 0.3 1.5 8.4 4.9 48.3 36.5 0.4
I can add an egg to my child’s meal at least once a week 4.6 13.7 18.6 42.4 19.5 1.3 3.7 11.6 18.7 46.3 18.5 1.2 4.0 12.3 18.6 44.9 18.9 1.3
I can add green vegetables to my child’s meal at least once a week 4.9 16.0 18.2 42.7 16.3 2.0 2.3 9.7 18.4 50.4 18.6 0.7 3.2 11.9 18.3 47.7 17.8 1.2
If an HEW suggests an improved feeding practice, I am likely to try it out 0.2 0.6 2.3 44.6 51.5 0.9 0.2 1.2 6.0 43.4 49.3 0.1 0.2 1.0 4.7 43.8 50.0 0.3
It is possible for all families in our community to prevent malnutrition among our infants and young children 7.7 19.0 20.8 35.1 11.2 6.3 8.3 22.7 21.6 29.6 11.2 6.5 8.1 21.4 21.3 31.5 11.2 6.4
The most important time to make sure children are well-nourished is during their first 2 years 1.8 7.5 5.2 55.6 29.0 0.9 1.3 7.1 5.9 54.2 31.2 0.4 1.5 7.2 5.7 54.7 30.4 0.5
Notes: 1=Strongly disagree; 2=Disagree; 3=Not sure; 4=Agree; 5=Strongly agree; 6=Do not know.

136
Table A7.3 Economic quintile, by region
Table A7.4 Household food dietary diversity of any member in last 24 hours, by region
Tigray (n = 1,040)
SNNPR (n = 1,952)
All (n = 2,992)
Percent Percent Percent
Any member in household Food groups (percent of households) Cereals 84.1 80.3 81.6
Vitamin A-rich vegetables and tubers 12.0 28.2 22.6
White tubers and roots or other starchy foods 8.3 40.1 29.1
Dark green leafy vegetables 20.4 37.3 31.5
Other vegetables 31.9 41.7 38.3
Vitamin A-rich fruits 3.3 11.1 8.4
Other fruits 6.3 18.9 14.5
Meat, poultry 12.9 7.9 9.7
Eggs 16.1 7.7 10.6
Fish and seafood 0.0 0.0 0.2
Pulses/legumes/beans 70.2 35.6 47.6
Milk and milk products 17.6 33.3 28.0
Oil/fats 78.0 65.8 70.0
Sugar/honey 11.5 3.9 6.5
Spices, condimentsa 77.7 89.4 85.4
Household food diversity category 0-3 food groups 53.0 41.0 45.2
4-7 food groups 41.3 49.9 46.9
8-11 food groups 5.8 8.9 7.8
> = 12 food groups 0.0 0.3 0.2
Mean (SD) Mean (SD) Mean (SD)
Mean dietary diversity of any member (range:0-13) 3.7 (2.1) 4.3 (2.2) 4.1 (2.2) a Dietary diversity scale was estimated by summing all the food groups except spices/condiments.
Tigray
(n = 1,040) SNNPR
(n = 1,952) All
(n = 2,992)
SES Categories Percent Percent Percent
Lower 21.1 39.9 33.4 Middle 38.9 30.3 33.3 Higher 40.0 29.8 33.3

137
Table A7.5 Effects of the economic shocks, by region
Tigray (n = 1,040)
SNNPR (n = 1,952)
All (n = 2,992)
No effect Small effect Large effect No effect Small effect Large effect No effect Small effect Large effect
Percent Percent Percent Percent Percent Percent Percent Percent Percent
Death of main income-earning household member (n = 23) 20.0 10.0 70.0 30.8 0.0 69.2 26.1 4.4 69.6 Death of other income earning household member (n = 7) 33.3 66.7 0.0 25.0 75.0 0.0 28.6 71.4 0.0 Disease or injury of any household member (n = 58) 43.8 25.0 31.3 14.3 35.7 50.0 22.4 32.8 44.8 Loss of employment of any household member (n = 20) 20.0 53.3 26.7 0.0 40.0 60.0 15.0 50.0 35.0 Divorced by husband/wife (n = 14) 36.4 27.3 36.4 12.5 12.5 75.0 30.0 23.3 46.7 Loss of crop (n = 228) 35.0 32.5 32.5 16.5 35.6 47.9 19.7 35.1 45.2 Loss of crop due to disease, draught (n = 84) 6.5 48.4 45.2 5.7 37.7 56.6 6.0 41.7 52.4 Disease or injury or loss of cattle (n = 172) 41.1 28.6 30.4 23.3 42.2 34.5 29.1 37.8 33.1 Any damage to the house or any productive asset (n = 31) 33.3 50.0 16.7 16.0 32.0 52.0 19.4 35.5 45.2 Any theft or loss to the food stock (n = 11) 50.0 50.0 0.0 33.3 44.4 22.2 36.4 45.5 18.2 Any loss of business (n = 6) 33.3 33.3 33.3 33.3 0.0 66.7 33.3 16.7 50.0 Any conflict, dispute, legal issues (n = 38) 60.0 30.0 10.0 17.9 32.1 50.0 29.0 31.6 39.5 Any other shocks (n = 6) 0.0 66.7 33.3 33.3 0.0 66.7 16.7 33.3 50.0

138
Table A7.6 General cleanliness of the mother and child, from observation
Tigray (n = 1,040)
SNNPR (n = 1,952)
All (n = 2,992)
Percent Percent Percent
Cleanliness of the mother Hands clean 66.8 64.3 65.2
Hair clean 61.1 58.0 59.1
Clothes clean 41.0 38.9 39.6
Face clean 81.7 82.5 82.2 Cleanliness of the child
Hands clean 62.9 60.1 61.0
Hair clean 71.2 65.8 67.7
Clothes clean 44.4 38.5 40.5
Face clean 69.9 69.8 69.8
Table A7.7 General cleanliness of the household and compound, from observation
Tigray (n = 1,040)
SNNPR (n = 1,952)
All (n = 2,992)
Percent Percent Percent
Clean general appearance of the compound 43.4 61.7 55.4 Area around the house does not need cleaning 31.4 50.7 44.0 Human feces not around 81.4 88.1 85.7 Animal feces not around 41.3 75.5 63.6 No garbage in the compound 47.1 64.0 58.2 Clean interior of house 51.8 53.5 52.9 Clean floor 46.0 49.8 48.5 Covered drinking water 63.9 53.7 57.2 No piles of dirty clothes 28.8 31.2 30.3
Mean (SD) Mean (SD) Mean (SD)
General cleanliness (range:0-9) 4.3 (2.4) 5.3 (2.5) 4.9 (2.5)

139
Table A7.8 Caregivers’ place of work and child support
Tigray (n = 1,040)
SNNPR (n = 1,952)
All (n = 2,992)
Percent Percent Percent
Work place Home 45.8 56.3 52.6
Away from home 21.7 20.1 20.7
Both 32.5 23.6 26.7 Number of days a week one works outside the home
1-2 days 13.0 12.8 12.9
3-4 days 52.2 43.0 46.7
5-7 days 34.8 44.3 40.5 Number of hours away from home during work
1-3 hours 8.6 21.4 16.3
4-6 hours 38.2 58.6 50.5
7-10 hours 53.3 20.0 33.1 Leave or bring the child to work
Always brings with her 50.7 20.7 32.6
Always leaves with someone else 34.3 68.2 54.7
Both 15.0 11.1 12.7 Leave or bring the child to market
Always brings with her 46.5 17.9 28.1
Always leaves with someone else 39.8 71.3 60.1
Both 13.7 10.9 11.9 Days a week a child is left
1-2 days 53.7 58.2 57.1
3-4 days 28.4 25.4 26.1
5-7 days 17.9 16.5 16.8 Who the child in left with
Relative within the household (adult > 15 years) 39.5 26.8 30.2
Relative outside the household (adult > 15 years) 21.1 18.2 19.0
Nonrelative within the household (adult > 15 years) 0.8 1.4 1.2
Nonrelative outside the household (adult > 15 years) 4.0 2.7 3.0
Relative within the household (child < 15 years) 32.9 46.3 42.7
Relative outside the household (child < 15 years) 1.3 3.7 3.0
Nonrelative within the household (child < 15 years) 0.6 0.6 0.6
Nonrelative outside the household (child < 15 years) 0.0 0.3 0.3
Other 0.0 0.1 0.1
Mean (SD) Mean (SD) Mean (SD)
Number of days a week on works outside the home (range 1-7) 4.0 (1.7) 4.2 (1.4) 4.1 (1.5) Number of hours away from home in a week (range 1-14) 6.8 (2.3) 5.1 (1.9) 5.8 (2.2) Days a week a child is left (range 1-7) 2.7 (1.6) 2.7 (1.6) 2.7 (1.6)

140
Table A7.9 Household help for the caregivers and the remunerations paid for the help, by region
Tigray (n = 1,040)
SNNPR (n = 1,952)
All (n = 2,992)
Characteristics Percent Percent Percent
Someone in the household helping the caregivers To cook 30.7 27.4 28.6
To wash clothes 31.7 30.2 30.7
To fetch water 44.5 42.7 43.3
To fetch fuel 37.2 37.7 37.5
To clean the house and around the house 42.8 39.0 40.4
To take care of the youngest child 40.6 38.1 39.0
To feed the youngest child 33.1 29.4 30.7
To bathe the youngest child 29.0 23.4 25.3
To go to the market to buy food for the house 41.7 29.6 33.8 The domestic help gets paid for
Cooking (n = 854) 0.0 0.6 0.4
Washing clothes (n = 919) 0.0 1.0 0.7
Fetching water (n = 1,296) 0.2 0.5 0.4
Fetching fuel (n = 1,121) 0.3 0.7 0.5
Cleaning the house and around the house (n = 1,207) 0.0 0.5 0.3
Taking care of the youngest child (n = 1,165) 0.0 0.5 0.3
Feeding the youngest child (n = 917) 0.0 0.5 0.3
Bathing the youngest child (n = 758) 0.0 0.4 0.3
Going to the market to buy food for the house (n = 1,011) 0.5 0.7 0.6

141
Table A7.10a Bivariate analyses of nutritional outcomes with key independent characteristics
Stunting
(n = 2,992) Underweight
(n = 2,992) Wasting
(n = 2,992)
Characteristics Percent Percent Percent
Region
Tigray 47.0 29.5 9.2
SNNPR 43.0 20.7 5.4 Mother's education
No education 47.4 25.8 7.0
Grade 1-6 39.8 21.3 6.3
Grade 7 and above 32.3 16.0 5.6 Mother's age
< 20 26.7 20.7 8.5
20-29 42.3 22.9 6.5
30-39 48.6 24.3 6.8
40-49 44.1 28.4 6.9 Immunization status
Fully immunized 25.0 25.0 6.9
Not fully immunized 50.0 23.2 0.0 Food security
Food secure 39.3 19.6 6.5
Mildly food insecure 44.5 24.1 6.6
Moderately food insecure 47.1 25.0 6.7
Severely food insecure 49.7 30.3 7.3 Mothers’ BMI
Underweight 46.9 30.5 9.5
Normal 44.0 21.8 5.8
Overweight 34.5 10.2 0.0 Perceived birth size
Very big 39.6 18.6 4.6
Bigger than average 42.7 18.6 5.5
Average 44.0 23.4 7.0
Smaller than average 40.7 23.2 5.3
Very small 52.1 32.4 10.3
Do not know 49.0 27.3 4.5 Mental stress
High 45.8 26.9 7.5
Low 43.5 21.8 6.2

142
Table A7.10b Bivariate analyses of nutritional outcomes with key independent characteristics
Stunting (n = 2,992)
Underweight (n = 2,992)
Wasting (n = 2,992)
Characteristics Percent Percent Percent
Household dietary diversity 0-3 food groups 45.5 26.0 7.1
4-7 food groups 43.2 22.2 6.2
8-11 food groups 45.6 20.2 7.3
12 food groups 25.0 20.0 0.0 By food and social assistance
Yes 45.7 27.0 8.4
No 43.7 21.9 5.8 Ever watched
TV 45.5 24.7 7.3
Radio 43.6 23.0 6.7
Village social meeting 43.6 23.1 6.1 Exposure to health workers
Visited by an HEW in the last 6 months 44.6 24.3 7.0
Visited by an VCHP in the last 6 months 45.6 23.7 6.9 Use of prenatal care 43.6 23.4 6.9
None 46.3 24.7 6.1
1-3 visits 40.0 22.4 7.7
> 3 visits 44.7 23.7 6.7 Suffered from
Fever Yes 46.5 29.2 8.6
No 43.5 21.7 6.0 Cold
Yes 45.5 25.0 7.2
No 43.8 23.1 6.5 Breathing problem
Yes 47.3 28.6 5.6
No 44.0 23.1 6.8 Diarrhea
Yes 44.6 29.1 9.3
No 44.4 22.7 6.2 SES category
Lower 46.3 24.6 5.5
Middle 42.1 23.2 7.1
Higher 45.0 23.4 7.6

143
Figure A7.1 Mother’s perception of child’s health, by age
Figure A7.2 Mother’s perception of child’s appetite, by age

144
Annex 8
Table A8.1 Natural disasters in the community, by region
Tigray
(n = 26) SNNPR (n = 49)
All (n = 75)
Percent Percent Percent
The community suffered from Drought 76.0 56.3 63.0
How long ago 0-12 months 76.5 40.7 54.6
More than 12 months 23.5 59.3 45.5 Received any support
None 26.3 40.7 34.8
Money 10.5 3.7 6.5
Food 63.2 55.6 58.7 Excessive rain 19.2 49.0 38.7
How long ago 0-12 months 80.0 70.8 72.4
More than 12 months 20.0 29.2 27.6 Received any support (none) 50.0 75.0 71.4
Animal disease 36.0 53.1 47.3 How long ago
0-12 months 75.0 69.2 70.6
More than 12 months 25.0 30.8 0.0 Received any support
None 55.6 38.5 42.9
Medicine 44.4 53.9 51.4
Food 0.0 3.9 2.9
Other 0.0 3.9 2.9 Crop failure 38.5 45.8 43.2
How long ago 0-12 months 66.7 59.1 61.3
More than 12 months 33.3 40.9 Received any support
None 44.4 59.1 54.8
Medicine 11.1 22.7 19.4
Money 11.1 9.0 9.7
Food 33.3 9.0 16.1

145
Annex 9
Table A9.1 Additional IYCF knowledge of the HEW
Tigray (n = 25)
SNNPR (n = 48)
All (n = 73)
Characteristics Percent Percent Percent
How long do children need to get extra meal after being sick Less than 1 week 20.0 22.9 21.9
1 week 24.0 20.8 21.9
2 week 20.0 25.0 23.3
More than 2 weeks 24.0 22.9 23.3
Do not think they need an extra meal 4.0 0.0 1.4
Others 8.0 8.3 8.2 The steps to take if the child has diarrhea
Give lemlem/home-prepared solution 76.0 85.4 82.2
Feed as much food as usual 4.0 0.0 1.4
Feed more than usual 56.0 31.3 39.7
Give less liquids than usual 0.0 2.1 1.4
Give as much liquids as usual 4.0 6.3 5.5
Give more liquids than usual 60.0 56.3 57.5
Continue breastfeeding 48.0 27.1 34.3
Breastfeed more often 36.0 33.3 34.3
Give syrups 0.0 8.3 5.5
Give traditional medicine 0.0 4.2 2.7
Give treated water 12.0 8.3 9.6
Give carrot juice or rice water 20.0 6.3 11.0
Others 20.0 22.9 21.9 The steps to take when the child is recovering from diarrhea/illness
Feed less than usual 0.0 2.1 1.4
Feed as much food as usual 0.0 6.3 4.1
Feed more than usual 96.0 77.1 83.6
Feed an extra meal every day for 2 weeks 36.0 27.1 30.1
Give more liquids than usual 44.0 39.6 41.1
Continue breastfeeding 40.0 25.0 30.1 When to wash hands
Before eating 100.0 89.6 93.2
After using the toilet 92.0 85.4 87.7
Before feeding the child 72.0 54.2 60.3
After cleaning a child who has defecated 56.0 47.9 50.7
Other 4.0 8.3 6.9 Ways to protect the child from getting worms
Wash hands of child 92.0 79.2 83.6
Wash hands before preparing food and feeding child 72.0 64.6 67.1
Cut nails 36.0 22.9 27.4
Children should wear pants 8.0 18.8 15.1
Wash fruits and vegetables 28.0 12.5 17.8
Children should wear sandals 16.0 18.8 17.8
Give them treated water 28.0 35.4 32.9
Other 8.0 8.3 8.2 Ways to make the drinking water safe
Boil water 100.0 87.5 91.8
Treat with chlorine 68.0 66.7 67.1
Other 24.0 22.9 23.3

146
Table A9.2 Supportive supervision received, by HEWs
Tigray (n = 25)
SNNPR (n = 48)
All (n = 73)
Characteristics Percent Percent Percent
Received any supportive supervision During last month 68.0 56.3 60.3
About 1-3 months ago 20.0 18.8 19.2
About 3-6 months ago 8.0 6.3 6.9
More than 6 months 4.0 14.3 11.0
Never 0.0 4.2 2.7 Informed about supportive supervision 64.0 69.6 67.6 Supportive supervision visit included the following
Supplies 82.6 66.7 72.1
Record keeping 75.0 87.0 82.9
Client observation 75.0 69.6 71.4
Provide written feedback 83.3 62.2 69.6
Provide encouragement 58.3 60.9 60.0
Provides updates on administrative/technical issues 66.7 56.5 60.0
Discuss problems 87.5 79.6 85.4
Plan follow-up actions 83.3 67.4 72.9
Conduct household visits 87.5 84.8 85.7
Review work plans 84.0 80.4 81.7
Discuss community volunteer activities 92.0 80.4 84.5
Table A9.3 Additional IYCF knowledge of the VCHPs
Tigray
(n = 25) SNNPR (n = 48)
All (n = 73)
Percent Percent Percent
Gruel being too thin is the most common problem Too thin 32.0 39.6 37.0
Too thick 12.0 22.9 19.2
No problem 44.0 25.0 31.5
Other 4.0 4.2 4.1
Do not know 8.0 8.3 8.2 Special foods to complement breastmilk
Enriched porridge with breastmilk 20.0 10.2 13.5
Enriched porridge with other kinds of milk 28.0 28.6 28.4
Enriched porridge with egg 12.0 4.1 6.8
Enriched porridge with other ingredients 32.0 40.8 37.8
Other 24.0 26.5 25.7 A 12-month-old child cannot eat alone 92.0 93.8 93.2 A 12-month-old child should not eat only the same foods as the rest of the family 88.0 91.8 90.5 Times per day a 6-11-month-old child should eat
3 or more meals 86.7 75.0 81.5
2 or more snacks 61.5 41.7 52.0
5 or more overall 37.5 33.3 34.7 Times per day a 12-23-month-old child should eat
3 or more meals 93.3 100.0 96.4
2 or more snacks 42.9 38.5 40.7
5 or more overall 75.0 36.2 49.3

147
Table A9.4 VCHP’s knowledge on feeding after illness
Tigray (n = 25)
SNNPR (n = 48)
All (n = 73)
Percent Percent Percent
The steps to take if the child has diarrhea Give lemlem/home-prepared solution 61.5 61.2 61.3
Feed less than usual 3.9 0.0 1.3
Feed as much food as usual 0.0 2.0 1.3
Feed more than usual 30.8 24.5 26.7
Give less liquids than usual 11.5 0.0 4.0
Give as much liquids as usual 11.5 2.0 5.3
Give more liquids than usual 26.9 38.8 34.7
Continue breastfeeding 15.4 2.0 6.7
Breastfeed more often 0.0 18.4 12.0
Give syrups 7.7 8.2 8.0
Give traditional medicine 3.9 12.2 9.3
Give treated water 15.4 4.1 8.0
Give carrot juice or rice water 3.9 2.0 2.7
Other 30.8 30.6 30.7 The steps to take when the child is recovering from diarrhea/illness
Feed less than usual 0.0 0.0 0.0
Feed as much food as usual 15.4 0.0 5.3
Feed more than usual 84.6 79.6 81.3
Feed an extra meal every day for 2 weeks 23.1 20.4 21.3
Give more liquids than usual 30.8 40.8 37.3
Continue breastfeeding 7.7 8.2 8.0
Other 3.9 2.0 2.7 How long do children need to be breastfed after being sick
Less than 1 week 20.0 14.3 16.2
1 week 20.0 24.5 23.0
2 week 36.0 24.5 28.4
More than 2 weeks 4.0 28.6 20.3
Other 20.0 4.1 9.5

148
Table A9.5 VCHP’s knowledge on personal hygiene
Tigray (n = 25)
SNNPR (n = 48)
All (n = 73)
Percent Percent Percent
When to wash hands Before eating 0.0 85.7 90.7
After using the toilet 84.6 87.8 86.7
Before feeding the child 69.2 42.9 52.0
After cleaning a child who has defecated 53.9 26.5 36.0
Other 19.2 8.2 12.0 How to protect the child from getting worms
Wash hands of child 69.2 63.3 65.3
Wash hands before preparing food and feeding child 76.9 55.1 62.7
Cut nails 11.5 12.2 12.0
Children should wear pants 15.4 8.2 10.7
Wash fruits and vegetables 15.4 2.0 6.7
Children should wear sandals 11.5 14.3 13.3
Give them treated water 34.6 20.4 25.3
Other 7.7 14.3 12.0 How to make drinking water safe
Boil water 84.6 77.6 80.0
Treat with chlorine 26.9 44.9 38.7
Other 23.1 20.4 21.3
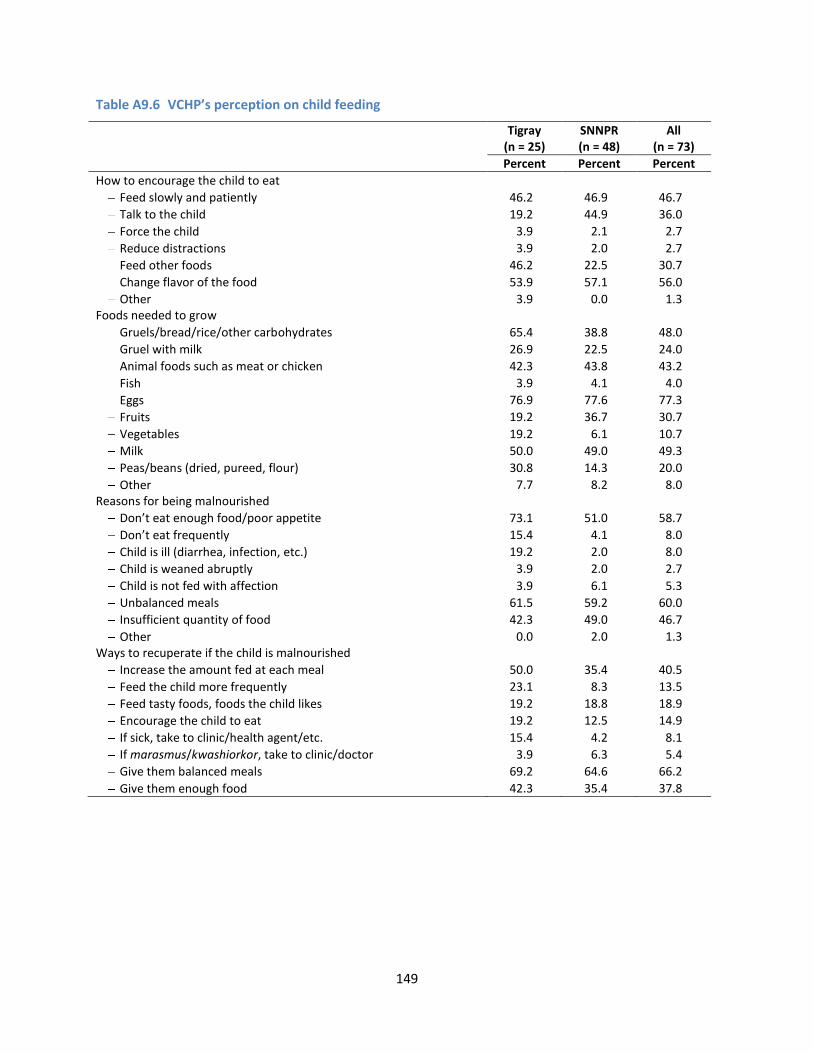
149
Table A9.6 VCHP’s perception on child feeding
Tigray (n = 25)
SNNPR (n = 48)
All (n = 73)
Percent Percent Percent
How to encourage the child to eat Feed slowly and patiently 46.2 46.9 46.7
Talk to the child 19.2 44.9 36.0
Force the child 3.9 2.1 2.7
Reduce distractions 3.9 2.0 2.7
Feed other foods 46.2 22.5 30.7
Change flavor of the food 53.9 57.1 56.0
Other 3.9 0.0 1.3 Foods needed to grow
Gruels/bread/rice/other carbohydrates 65.4 38.8 48.0
Gruel with milk 26.9 22.5 24.0
Animal foods such as meat or chicken 42.3 43.8 43.2
Fish 3.9 4.1 4.0
Eggs 76.9 77.6 77.3
Fruits 19.2 36.7 30.7
Vegetables 19.2 6.1 10.7
Milk 50.0 49.0 49.3
Peas/beans (dried, pureed, flour) 30.8 14.3 20.0
Other 7.7 8.2 8.0 Reasons for being malnourished
Don’t eat enough food/poor appetite 73.1 51.0 58.7
Don’t eat frequently 15.4 4.1 8.0
Child is ill (diarrhea, infection, etc.) 19.2 2.0 8.0
Child is weaned abruptly 3.9 2.0 2.7
Child is not fed with affection 3.9 6.1 5.3
Unbalanced meals 61.5 59.2 60.0
Insufficient quantity of food 42.3 49.0 46.7
Other 0.0 2.0 1.3 Ways to recuperate if the child is malnourished
Increase the amount fed at each meal 50.0 35.4 40.5
Feed the child more frequently 23.1 8.3 13.5
Feed tasty foods, foods the child likes 19.2 18.8 18.9
Encourage the child to eat 19.2 12.5 14.9
If sick, take to clinic/health agent/etc. 15.4 4.2 8.1
If marasmus/kwashiorkor, take to clinic/doctor 3.9 6.3 5.4
Give them balanced meals 69.2 64.6 66.2
Give them enough food 42.3 35.4 37.8

150
Table A9.7 Additional IYCF knowledge of the supervisors
Tigray (n = 25)
SNNPR (n = 48)
All (n = 73)
Percent Percent Percent
Gruel being too thin is the most common problem Too thin 64.0 44.7 51.4
Too thick 16.0 29.8 25.0
No problem 4.0 10.6 8.3
Other 12.0 6.4 8.3
Do not know 4.0 8.5 6.9 Special foods to complement breastmilk
Enriched porridge with breastmilk 28.0 31.9 30.6
Enriched porridge with other kinds of milk 44.0 44.7 44.4
Enriched porridge with egg 28.0 12.8 18.1
Enriched porridge with other ingredients 56.0 42.6 47.2
Other 12.0 21.3 18.1 A 12-month-old child cannot eat alone 100.0 100.0 100.0 A 12-month-old child should not eat only the same foods as the rest of the family 88.0 95.6 92.9 Times per day a 6-11-month-old child eats
3 or more meals 76.9 82.4 80.0
2 or more snacks 66.7 26.7 44.4
5 or more overall 37.5 33.3 34.8 Times per day a 12-23-month-old child eats
3 or more meals 92.9 100.0 96.7
2 or more snacks 58.3 31.3 42.9
5 or more overall 56.5 40.0 45.6
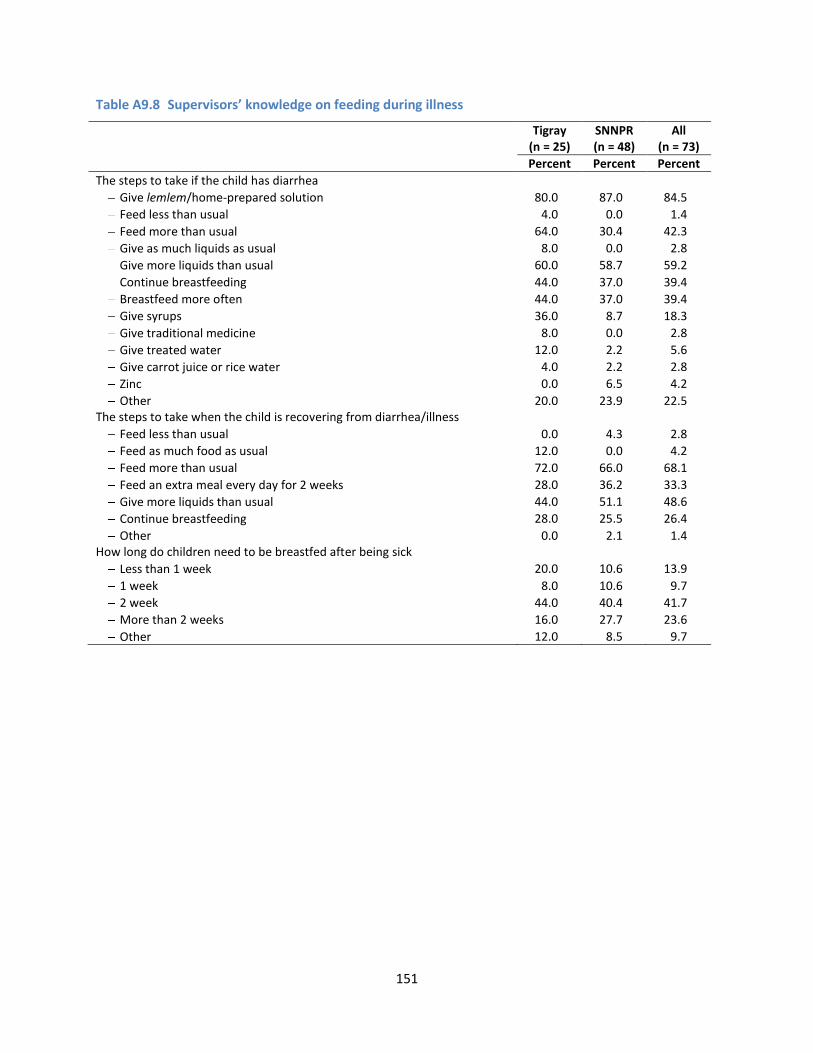
151
Table A9.8 Supervisors’ knowledge on feeding during illness
Tigray (n = 25)
SNNPR (n = 48)
All (n = 73)
Percent Percent Percent
The steps to take if the child has diarrhea Give lemlem/home-prepared solution 80.0 87.0 84.5
Feed less than usual 4.0 0.0 1.4
Feed more than usual 64.0 30.4 42.3
Give as much liquids as usual 8.0 0.0 2.8
Give more liquids than usual 60.0 58.7 59.2
Continue breastfeeding 44.0 37.0 39.4
Breastfeed more often 44.0 37.0 39.4
Give syrups 36.0 8.7 18.3
Give traditional medicine 8.0 0.0 2.8
Give treated water 12.0 2.2 5.6
Give carrot juice or rice water 4.0 2.2 2.8
Zinc 0.0 6.5 4.2
Other 20.0 23.9 22.5 The steps to take when the child is recovering from diarrhea/illness
Feed less than usual 0.0 4.3 2.8
Feed as much food as usual 12.0 0.0 4.2
Feed more than usual 72.0 66.0 68.1
Feed an extra meal every day for 2 weeks 28.0 36.2 33.3
Give more liquids than usual 44.0 51.1 48.6
Continue breastfeeding 28.0 25.5 26.4
Other 0.0 2.1 1.4 How long do children need to be breastfed after being sick
Less than 1 week 20.0 10.6 13.9
1 week 8.0 10.6 9.7
2 week 44.0 40.4 41.7
More than 2 weeks 16.0 27.7 23.6
Other 12.0 8.5 9.7

152
Table A9.9 Supervisors’ knowledge on personal hygiene
Tigray (n = 25)
SNNPR (n = 48)
All (n = 73)
Percent Percent Percent
When to wash hands Before eating 96.0 93.6 94.4
After using the toilet 92.0 89.4 90.3
Before feeding the child 76.0 63.8 68.1
After cleaning a child who has defecated 56.0 31.9 40.3
Other 8.0 2.1 4.2 How to protect the child from getting worms
Wash hands of child 72.0 74.5 73.6
Wash hands before preparing food and feeding child 96.0 76.6 83.3
Cut nails 24.0 27.7 26.4
Children should wear pants 20.0 12.8 15.3
Wash fruits and vegetables 28.0 21.3 23.6
Children should wear sandals 28.0 23.4 25.0
Give them treated water 28.0 36.2 33.3
Other 32.0 4.3 13.9 How to make drinking water safe
Boil water 88.0 83.0 84.7
Treat with chlorine 96.0 76.6 83.3
Other 20.0 29.8 26.4

153
Table A9.10 Supervisors’ perception on improving child feeding
Tigray (n = 25)
SNNPR (n = 48)
All (n = 73)
Percent Percent Percent
How to encourage the child to eat Feed slowly and patiently 60.0 66.0 63.9
Talk to the child 44.0 42.6 43.1
Reduce distractions 56.0 10.6 26.4
Feed other foods 24.0 42.6 36.1
Change flavor of the food 64.0 57.5 59.7
Other 8.0 4.3 5.6 Foods needed to grow
Gruels/bread/rice/other carbs 68.0 45.7 53.5
Gruel with milk 36.0 47.8 43.7
Animal foods such as meat or chicken 52.0 54.4 53.5
Fish 24.0 34.8 31.0
Eggs 76.0 63.0 67.6
Fruits 48.0 47.8 47.9
Vegetables 40.0 26.1 31.0
Milk 72.0 54.4 60.6
Peas/beans (dried, pureed, flour) 56.0 37.0 43.7
Other 8.0 2.2 4.2 Reasons for being malnourished
Don’t eat enough food/poor appetite 60.0 52.2 54.9
Don’t eat frequently 48.0 10.9 23.9
Child is ill (diarrhea, infection, etc.) 36.0 32.6 33.8
Child is weaned abruptly 24.0 10.9 15.5
Child is not fed with affection 4.0 4.4 4.2
Unbalanced meals 64.0 80.4 74.7
Insufficient quantity of food 40.0 52.2 47.9
Other 16.0 8.7 11.3 Ways to recuperate if the child is malnourished
Increase the amount fed at each meal 64.0 41.3 49.3
Feed the child more frequently 44.0 30.4 35.2
Feed tasty foods, foods the child likes 24.0 10.9 15.5
Encourage the child to eat 16.0 8.7 11.3
If sick, take to clinic/health agent/etc. 24.0 17.4 19.7
If marasmus/kwashiorkor, take to clinic/doctor 24.0 28.3 26.8
Give them balanced meals 76.0 80.4 78.9
Give them enough food 24.0 45.7 38.0
Other 12.0 4.4 7.0