alkyne lipid probes and azide detection reagents for in vitro...
TRANSCRIPT
Alkyne lipid probes
and azide detection reagents
for in vitro enzymatic assays
and highly sensitive lipid imaging
Dissertation zur
Erlangung des Doktorgrades (Dr. rer. nat.) der
Mathematisch-Naturwissenschaftlichen Fakultät der
Rheinischen Friedrich-Wilhelms-Universität Bonn
vorgelegt von
Anne Gäbler
aus
Stendal
Bonn, 2015

i
Angefertigt mit Genehmigung der Mathematisch-Naturwissenschaftlichen Fakultät
der Rheinischen Friedrich-Wilhelms-Universität Bonn
1. Gutachter:
Herr Prof. Dr. Christoph Thiele
2. Gutachter:
Herr Prof. Dr. Thorsten Lang
Tag der Promotion: 06.07.2015
Erscheinungsjahr: 2015
ii
Selbständigkeitserklärung
Hiermit versichere ich, dass ich die vorliegende Dissertation selbständig und
ausschließlich mit Hilfe der angegebenen Quellen und Hilfsmittel angefertigt habe.
Die aus anderen Quellen direkt oder indirekt übernommenen Daten und Konzepte
sind unter Angabe der Quellen kenntlich gemacht. Die Arbeit wurde bisher weder in
Teilen noch im Ganzen als Prüfungsleistung zur Begutachtung an einer Hochschule
vorgelegt. Die Promotionsordnung der Mathematisch-Naturwissenschaftlichen
Fakultät der Rheinischen Friedrich-Wilhelms-Universität Bonn ist mir bekannt. Für
die vorliegende Dissertation wurde keine fremde Hilfe, insbesondere keine
entgeltliche Hilfe in Anspruch genommen.
Meine Person betreffend erkläre ich hiermit, dass keine früheren erfolglosen
Promotionsverfahren stattgefunden haben.
Bonn, den
Unterschrift

iii
Erklärung
Teile dieser Arbeit wurden bereits vorab veröffentlicht (siehe auch die dem Kapitel 3
vorangestellte Erklärung):
Gaebler, A., R. Milan, L. Straub, D. Hoelper, L. Kuerschner, and C. Thiele (2013). Alkyne lipids as substrates for click chemistry-based in vitro enzymatic assays. J. Lipid Res. 54, 2282-2290.
Hofmann, K., C. Thiele, H. Schott, A. Gaebler, M. Schoene, Y. Kiver, S. Friedrichs, D. Lutjohann, and L. Kuerschner (2014). A novel alkyne cholesterol to trace cellular cholesterol metabolism and localization. J. Lipid Res. 55, 583-591.
Table of contents
iv
Table of contents
Abstract ..................................................................................................................... 1
Zusammenfassung ................................................................................................... 2
List of abbreviations ................................................................................................. 4
List of figures ............................................................................................................ 9
List of tables ............................................................................................................ 11
1 Introduction ....................................................................................................... 12 1.1 Lipid probes and their versatile applications ....................................................... 12
1.1.1 Lipid labeling strategies ...................................................................................... 12 1.1.2 Click chemistry and the impact of click labeling on lipid biology ........................ 14 1.1.3 In vitro enzymatic assays to study enzymes of lipid metabolism ....................... 18 1.1.4 Probes and detection reagents in click labeling for lipid imaging ....................... 19
1.2 Label-free methods and super-resolution techniques in lipid imaging ............. 22 1.3 Lipid droplets and lipid droplet heterogeneity ..................................................... 27 1.4 Intracellular cholesterol trafficking and homeostasis ......................................... 31 1.5 Excess cholesterol and the liver ........................................................................... 33
2 Aims of this thesis ............................................................................................ 36
3 Alkyne lipids as substrates for click chemistry-based in vitro enzymatic assays (Part I) ......................................................................................................... 37
Declaration concerning chapter 3 .................................................................................. 38 3.1 Materials and Methods (Part I) ............................................................................... 40
3.1.1. Chemical synthesis of alkyne lipids ................................................................... 40 3.1.2 Methods ............................................................................................................. 45
3.2 Results and Discussion (Part I) ............................................................................. 50 3.2.1 Assay setup and method of quantification ......................................................... 50 3.2.2 LPAAT assay with alkyne-OLPA or alkyne-oleoyl-CoA ..................................... 51 3.2.3 LPCAT assay with alkyne-OLPC or PLpPC ....................................................... 54 3.2.4 Ceramide synthase assay with alkyne-sphinganine .......................................... 55 3.2.5 Cholesterol oxidase assay with alkyne-cholesterol ............................................ 58 3.2.6 Application of the method in assays for other lipid modifying enzymes ............. 59 3.2.7 Scope and limitations of the method .................................................................. 61

Table of contents
v
4 Highly sensitive alkyne lipid imaging (Part II) ................................................ 63 4.1 Materials and Methods (Part II) .............................................................................. 64
4.1.1 Materials ............................................................................................................. 64 4.1.1.1 Alkyne lipids and azide detection reagents ..................................................... 64 4.1.1.2 Primers and plasmids ...................................................................................... 69 4.1.1.3 Other materials ................................................................................................ 69 4.1.2 Methods ............................................................................................................. 70 4.1.2.1 Cell biological methods ................................................................................... 70 4.1.2.2 Molecular biology methods ............................................................................. 71 4.1.2.3 Lipid extraction, ethanolic click reaction and thin layer chromatography ........ 72 4.1.2.4 Aqueous click reaction and sample preparation for microscopy ..................... 72 4.1.2.5 Microscopy ...................................................................................................... 73 4.1.2.6 Image processing and data analysis ............................................................... 74
4.2 Results (Part II) ........................................................................................................ 76 4.2.1 A highly sensitive protocol for alkyne lipid imaging in fixed cells ....................... 76 4.2.1.1 Increased lipid imaging sensitivity by modulation of the azide detection
reagent ........................................................................................................................ 76 4.2.1.2 Simultaneous click labeling with two different reagents to validate detection
with APpic2Btn ............................................................................................................... 83 4.2.1.3 Influence of the fixation buffer on the click labeling ......................................... 84 4.2.2 Alkyne-cholesterol localization to lipid droplets and associated endoplasmic
reticulum in HuH7 cells .................................................................................................. 86 4.3 Discussion (Part II) ............................................................................................... 113
4.3.1 Highly sensitive imaging of alkyne lipids in biological membranes .................. 113 4.3.2 Alkyne-cholesterol on its way into the lipid droplet ........................................... 121 4.3.2.1 Click labeling of lipids in and on lipid droplets ............................................... 121 4.3.2.2 A super-resolved view on alkyne-cholesterol at the interface of lipid droplets
and the endoplasmic reticulum .................................................................................... 123 4.3.2.3 Trafficking of exogenous alkyne-cholesterol in hepatocytes towards its storage
in lipid droplets ............................................................................................................. 128 4.3.2.4 Esterification of exogenous alkyne-cholesterol and lipid droplet heterogeneity
in hepatocytes .............................................................................................................. 130
5 Conclusion and Outlook ................................................................................. 134
6 References ....................................................................................................... 136
7 Acknowledgements/ Danksagung ................................................................. 152

Abstract
1
Abstract
Click chemistry has emerged as a powerful tool for the sensitive and specific labeling
of biomolecules in various applications. For the design of lipid probes, a small and
non-interfering tag is important to prevent substantial influence on the characteristics
of the lipid. The copper-catalyzed azide-alkyne cycloaddition (CuAAC) allows the
bioorthogonal detection of alkyne lipids with azide bearing reporter molecules.
In vitro enzymatic assays are a major source of information about the properties of
enzymes and have so far been carried out mainly with radiolabeled or fluorescent
probes. In this thesis, various click chemistry based in vitro enzymatic assays were
established and the kinetic characteristics of alkyne lipid substrates were analyzed.
All enzymes tested displayed the same affinity to alkyne lipids as to their natural or
radiolabeled counterparts. Thus, alkyne lipids are versatile substrates for in vitro
enzymatic assays.
The demand to study the intracellular localization of lipids has led to recent progress
in microscopy imaging of alkyne lipids. However, their detection is crucially
dependent on the appropriate azide detection reagent. It should favor a fast and
efficient click reaction and therefore a sensitive detection of the lipids. For this
purpose, biotinylated azide reporters with different polyethylene spacer components
were synthesized in this study and their suitability for lipid imaging in fixed cells was
tested. The introduction of a copper-chelating picolyl moiety strongly increased the
signal intensity derived from the alkyne lipids, allowing the highly sensitive imaging of
the metabolites of alkyne-oleate, propargylcholine and alkyne-cholesterol.
With the improved protocol, alkyne-cholesterol was detected at the endoplasmic
reticulum (ER) and the surface of lipid droplets (LDs) in HuH7 hepatocarcinoma cells.
Using stimulated emission depletion (STED) microscopy, alkyne-cholesterol positive
membrane contacts between the two organelles were identified. Loading of the HuH7
cells with unlabeled lipids affected the storage of esterified alkyne-cholesterol in LDs.
The cholesterol esterification step inside hepatocytes might play an important role in
the maintenance of hepatic cholesterol homeostasis and the prevention of
hepatocellular lipotoxicity, and will be investigated further.

Zusammenfassung
2
Zusammenfassung
Alkinlipidsonden und Azidnachweisreagenzien für in vitro-Enzymassays und die hochempfindliche Mikroskopie von Lipiden
Die Click-Chemie hat sich zu einem wichtigen Werkzeug bei der sensitiven und
spezifischen Markierung von Biomolekülen entwickelt. Für die Markierung von
Lipiden sollten besonders kleine Markergruppen verwendet werden, die die
Eigenschaften des Lipids möglichst wenig verändern. Die kupferkatalysierte 1,3-
Cycloaddition zwischen einem Azid und einem terminalen Alkin kann genutzt
werden, um Alkinlipide mit azidmarkierten Nachweisreagenzien in einer
bioorthogonalen Reaktion zu verknüpfen.
In vitro-Enzymassays liefern wichtige Informationen über die Eigenschaften von
Enzymen und wurden bisher häufig mit radioaktiv oder fluoreszenzmarkierten
Lipidsonden durchgeführt. In der vorliegenden Arbeit wurden mehrere auf Click-
Chemie basierende in vitro-Enzymassays etabliert und die kinetischen
Eigenschaften von Alkinlipidsubstraten untersucht. Alle getesteten Enzyme besaßen
die gleiche Affinität zu Alkinlipiden wie zu den entsprechenden radioaktiv markierten
oder unmarkierten Gegenstücken. Alkinlipide sind somit geeignete Substrate für in
vitro-Enzymassays.
Der Bedarf an Erkenntnissen über die genaue Lokalisation von Lipiden innerhalb der
Zelle treibt die Entwicklung der Mikroskopie von Alkinlipiden voran. Deren
mikroskopischer Nachweis hängt jedoch entscheidend von einem geeigneten
Azidnachweisreagenz ab, das eine schnelle und effiziente Click-Reaktion und damit
einen sensitiven Lipidnachweis ermöglicht. Zu diesem Zweck wurden in der
vorliegenden Arbeit mehrere biotinylierte Azidnachweisreagenzien synthetisiert, in
denen Biotin und die Azidgruppe durch unterschiedliche polyethylenglykolbasierte
Linker verbunden waren. Die Verwendung einer kupferchelierenden Picolylgruppe im
Linker führte zu einem starken Anstieg der Signalintensität beim Nachweis von
Alkinlipiden und ermöglichte so die hochempfindliche Mikroskopie der Metabolite von
Alkinölsäure, Propargylcholin und Alkincholesterin.
Zusammenfassung
3
Mit dem verbesserten Protokoll wurde Alkincholesterin im endoplasmatischen
Retikulum und an der Oberfläche von Lipidtröpfchen in HuH7-Leberkarzinomzellen
nachgewiesen. Unter dem hochauflösenden STED-Mikroskop wurden direkte
Membrankontakte zwischen den beiden Organellen beobachtet. Das Beladen der
Zellen mit unmarkierten Lipiden beeinflusste die Speicherung von
Alkincholesterinestern in Lipidtröpfchen. Der Teilschritt der Veresterung von
Cholesterin in Hepatozyten, der möglicherweise eine wichtige Rolle bei der
Aufrechterhaltung der Cholesterinhomöostase in der Leber und bei der Vermeidung
einer toxischen Wirkung von freiem Cholesterin spielt, wird Gegenstand
weiterführender Versuche sein.
Abbreviations
4
List of abbreviations
3T3-L1 mouse fibroblast cell line
A172 glioblastoma cell line
ACAT acyl-coenzyme A:cholesterol acyltransferase
alkyne-1-OMAG 1-(nonadec-9-cis-en-18-ynoyl)-monoacylglycerol
alkyne-cholesterol (25R)-25-ethinyl-26-nor-3β-hydroxycholest-5-en (structure see Fig. 16)
alkyne-oleoyl-CoA nonadec-9-cis-en-18-ynoyl coenzyme A
alkyne-OLPA 1-(nonadec-9-cis-en-18-ynoyl)-sn-glycero-3-phosphate
alkyne-OLPC 1-(nonadec-9-cis-en-18-ynoyl)-sn-glycero-3-phosphocholine
alkyne-OOPA 1,2-di-(nonadec-9-cis-en-18-ynoyl)-sn-glycero-3-phosphate
alkyne-OOPC di-(nonadec-9-cis-en-18-ynoyl)-sn-glycero-3-phosphocholine
alkyne-oleate nonadec-9-cis-en-18-ynoic acid
alkyne-palmitate 16-heptadecynoic acid
alkyne-PAPA 1-(16-heptadecanoyl)-2-((5Z,8Z,11Z,14Z)-5,8,11,14-eicosatetraenoyl)-sn-glycero-3-phosphate
alkyne-sphinganine (2S,3R)-2-aminooctadec-17-yn-1,3-diol
ANOVA analysis of variance
AP3Btn azido-PEG3-biotin (structure see Fig. 16)
AP6Btn azido-PEG6-biotin (structure see Fig. 16)
APpic2Btn azidopicolyl-PEG2-biotin (structure see Fig. 16)
Arf1 ADP-ribosylation factor 1
ASBDP 8-(5-azidopentyl)-4,4-difluor-1,3,5,7- tetramethyl-4-bora-3a,4a-s-indacene-2,6-disulfonic acid disodium salt (structure see Fig. 16)
azido-coumarin 3-azido-7-hydroxycoumarin
BDP boron-dipyrromethene
BMP bis-(monoacylglycerol)-phosphate
Boc tert-butyloxycarbonyl protective group
BSA bovine serum albumin
Btn biotin
CARS coherent anti-Stokes Raman scattering
CCD charge-coupled device
CDCl3 deuterated chloroform

Abbreviations
5
CDI 1,1-carbonyldiimidazole
CE cholesterol ester
CerS ceramide synthase
CGN cis-Golgi network
Cideb cell death-inducing DFF45-like effector protein b
CO cholesterol oxidase
CoA coenzyme A
COPI/II coat-protein complexes I/II
CP-113,818 (-)-N-(2,4-bis(methylthio)-6-methylpyridin- 3-yl)-2-(hexylthio)decanoic amide
CuAAC copper-catalyzed azide-alkyne cycloaddition
CuTFB tetrakis(acetonitrile)copper(I) fluoroborate
DABCO 1,4-diazabicyclo[2.2.2]octane
DAG diacylglycerol
DAGL diacylglycerol lipase
DAPI 4',6-diamidino-2-phenylindole
DCC dicyclohexylcarbodiimide
DCM dichloromethane
dhCer dihydroceramide
DHE dehydroergosterol
DMAP 4-dimethylaminopyridine
DMEM Dulbecco‘s modified Eagle medium
DMF dimethylformamide
DMSO dimethylsulfoxide
DPPC dipalmitoylphosphatidylcholine
EGFP enhanced green fluorescent protein
ER endoplasmic reticulum
ERAD endoplasmic reticulum-associated protein degradation
ERC endosomal recycling compartment
ERGIC ER/Golgi intermediate compartment
ESI electrospray ionization
ESR electron spin resonance
EtOH ethanol
FAAH fatty acid amide hydrolase
FCS fetal calf serum
Abbreviations
6
FRET Förster resonance energy transfer
FWHM full width at half maximum
GFP green fluorescent protein
HDL high-density lipoprotein
HEPES 4-(2-hydroxyethyl)-1-piperazineethanesulfonic acid
HMG-CoA 3-hydroxy-3-methylglutaryl-CoA
HuH7 hepatocarcinoma cell line
Km Michaelis-Menten constant
LAL lysosomal acid lipase
LB Luria broth
LD lipid droplet
LD540 4,4-difluoro-2.3,5.6-bis-tetramethylene-4-bora-3a,4a-diaza-s-indacene
LDL low density lipoprotein
LPA lysophophatidic acid
LPAAT lysophosphatidic acid acyltransferase
LPC lysophosphatidylcholine
LPCAT lysophosphatidylcholine acyltransferase
LTP lipid transfer protein
LUT lookup table
MAGL monoacylglycerol lipase
MeOH methanol
MGAT monoacylglycerol acyltransferase
MOPS 3-(N-morpholino)propansulfonic acid
mRFP monomeric red fluorescent protein
MS mass spectrometry
MSI mass spectrometry imaging
MTP microsomal triglyceride transfer protein
NAAA acylethanolamine-hydrolyzing acid amidase
NAFLD non-alcoholic fatty liver disease
NASH non-alcoholic steatohepatitis
NBD nitrobenzoxadiazole
NCS N-chlorosuccinimide
NHS N-hydroxysuccinimide
Abbreviations
7
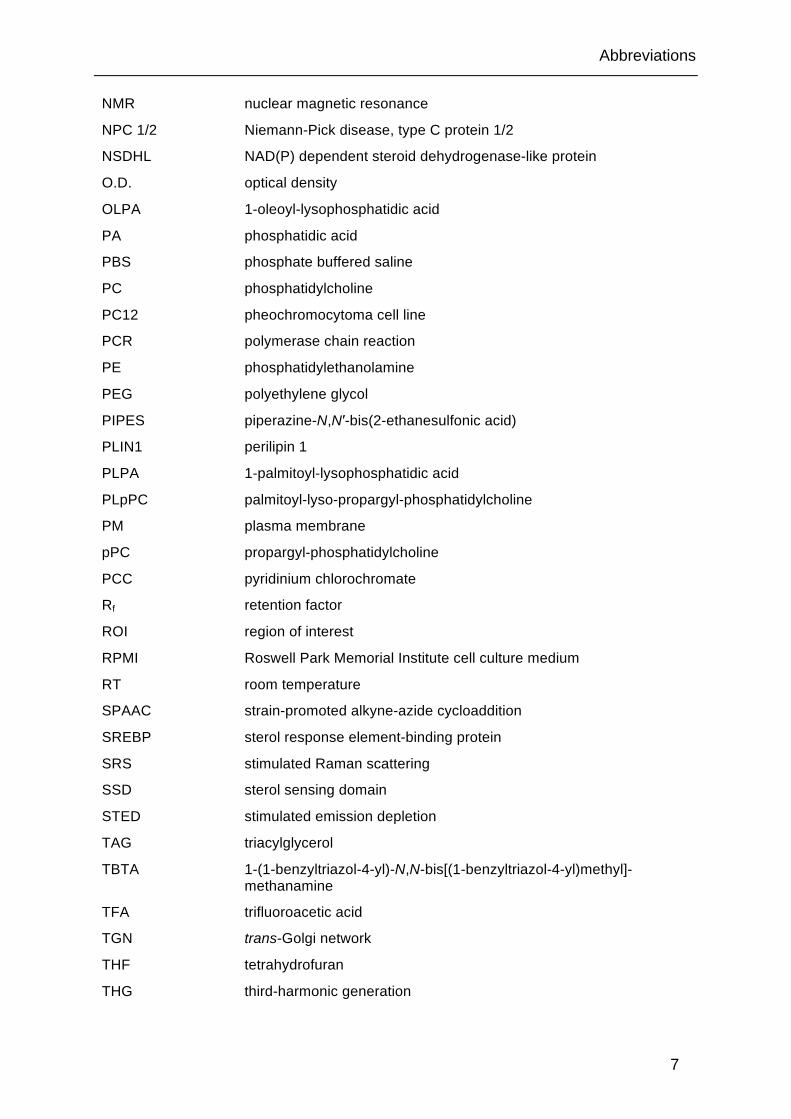
NMR nuclear magnetic resonance
NPC 1/2 Niemann-Pick disease, type C protein 1/2
NSDHL NAD(P) dependent steroid dehydrogenase-like protein
O.D. optical density
OLPA 1-oleoyl-lysophosphatidic acid
PA phosphatidic acid
PBS phosphate buffered saline
PC phosphatidylcholine
PC12 pheochromocytoma cell line
PCR polymerase chain reaction
PE phosphatidylethanolamine
PEG polyethylene glycol
PIPES piperazine-N,N′-bis(2-ethanesulfonic acid)
PLIN1 perilipin 1
PLPA 1-palmitoyl-lysophosphatidic acid
PLpPC palmitoyl-lyso-propargyl-phosphatidylcholine
PM plasma membrane
pPC propargyl-phosphatidylcholine
PCC pyridinium chlorochromate
Rf retention factor
ROI region of interest
RPMI Roswell Park Memorial Institute cell culture medium
RT room temperature
SPAAC strain-promoted alkyne-azide cycloaddition
SREBP sterol response element-binding protein
SRS stimulated Raman scattering
SSD sterol sensing domain
STED stimulated emission depletion
TAG triacylglycerol
TBTA 1-(1-benzyltriazol-4-yl)-N,N-bis[(1-benzyltriazol-4-yl)methyl]-methanamine
TFA trifluoroacetic acid
TGN trans-Golgi network
THF tetrahydrofuran
THG third-harmonic generation
Abbreviations
8
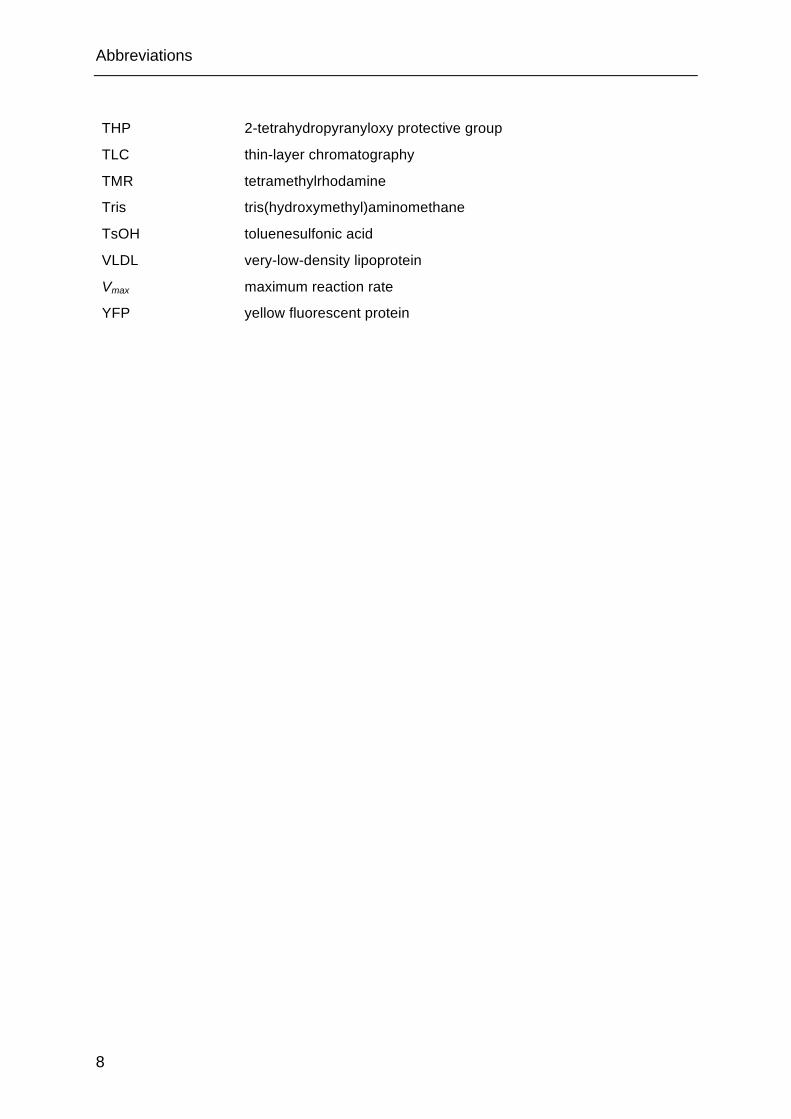
THP 2-tetrahydropyranyloxy protective group
TLC thin-layer chromatography
TMR tetramethylrhodamine
Tris tris(hydroxymethyl)aminomethane
TsOH toluenesulfonic acid
VLDL very-low-density lipoprotein
Vmax maximum reaction rate
YFP yellow fluorescent protein
Figures and Tables
9
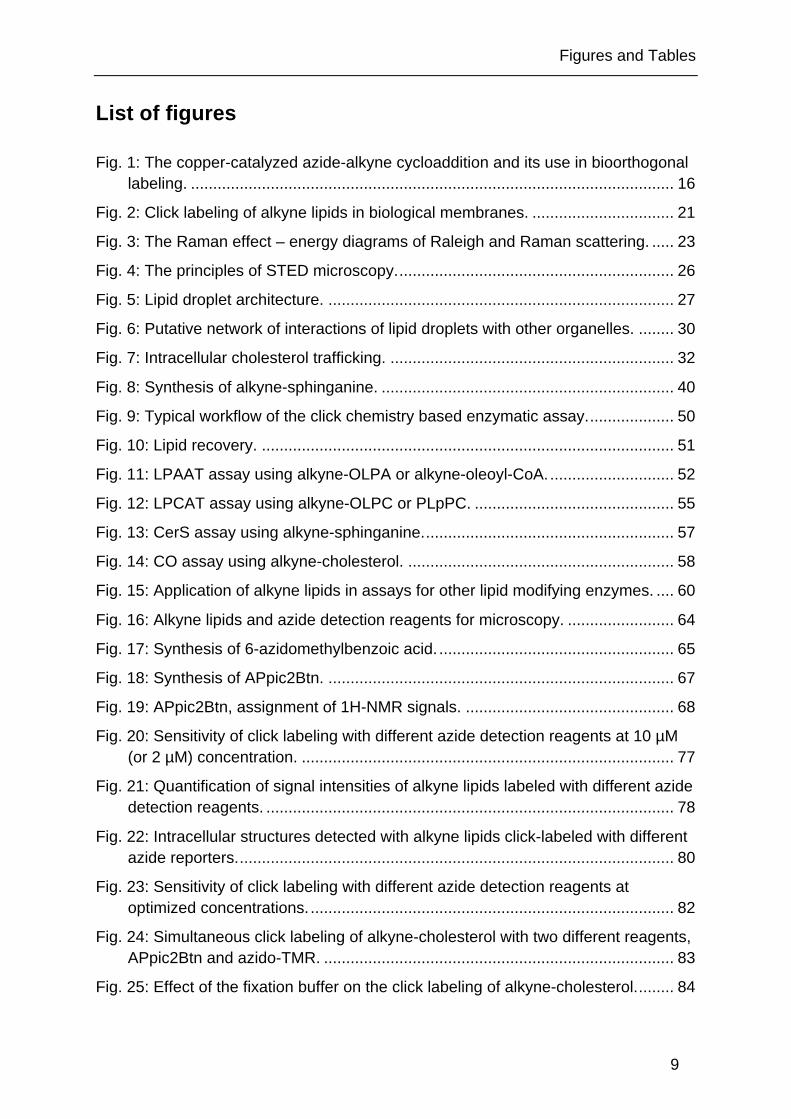
List of figures
Fig. 1: The copper-catalyzed azide-alkyne cycloaddition and its use in bioorthogonal labeling. ............................................................................................................. 16
Fig. 2: Click labeling of alkyne lipids in biological membranes. ................................ 21
Fig. 3: The Raman effect – energy diagrams of Raleigh and Raman scattering. ..... 23
Fig. 4: The principles of STED microscopy. .............................................................. 26
Fig. 5: Lipid droplet architecture. .............................................................................. 27
Fig. 6: Putative network of interactions of lipid droplets with other organelles. ........ 30
Fig. 7: Intracellular cholesterol trafficking. ................................................................ 32
Fig. 8: Synthesis of alkyne-sphinganine. .................................................................. 40
Fig. 9: Typical workflow of the click chemistry based enzymatic assay. ................... 50
Fig. 10: Lipid recovery. ............................................................................................. 51
Fig. 11: LPAAT assay using alkyne-OLPA or alkyne-oleoyl-CoA. ............................ 52
Fig. 12: LPCAT assay using alkyne-OLPC or PLpPC. ............................................. 55
Fig. 13: CerS assay using alkyne-sphinganine. ........................................................ 57
Fig. 14: CO assay using alkyne-cholesterol. ............................................................ 58
Fig. 15: Application of alkyne lipids in assays for other lipid modifying enzymes. .... 60
Fig. 16: Alkyne lipids and azide detection reagents for microscopy. ........................ 64
Fig. 17: Synthesis of 6-azidomethylbenzoic acid. ..................................................... 65
Fig. 18: Synthesis of APpic2Btn. .............................................................................. 67
Fig. 19: APpic2Btn, assignment of 1H-NMR signals. ............................................... 68
Fig. 20: Sensitivity of click labeling with different azide detection reagents at 10 µM (or 2 µM) concentration. .................................................................................... 77
Fig. 21: Quantification of signal intensities of alkyne lipids labeled with different azide detection reagents. ............................................................................................ 78
Fig. 22: Intracellular structures detected with alkyne lipids click-labeled with different azide reporters. .................................................................................................. 80
Fig. 23: Sensitivity of click labeling with different azide detection reagents at optimized concentrations. .................................................................................. 82
Fig. 24: Simultaneous click labeling of alkyne-cholesterol with two different reagents, APpic2Btn and azido-TMR. ............................................................................... 83
Fig. 25: Effect of the fixation buffer on the click labeling of alkyne-cholesterol. ........ 84
Figures and Tables
10
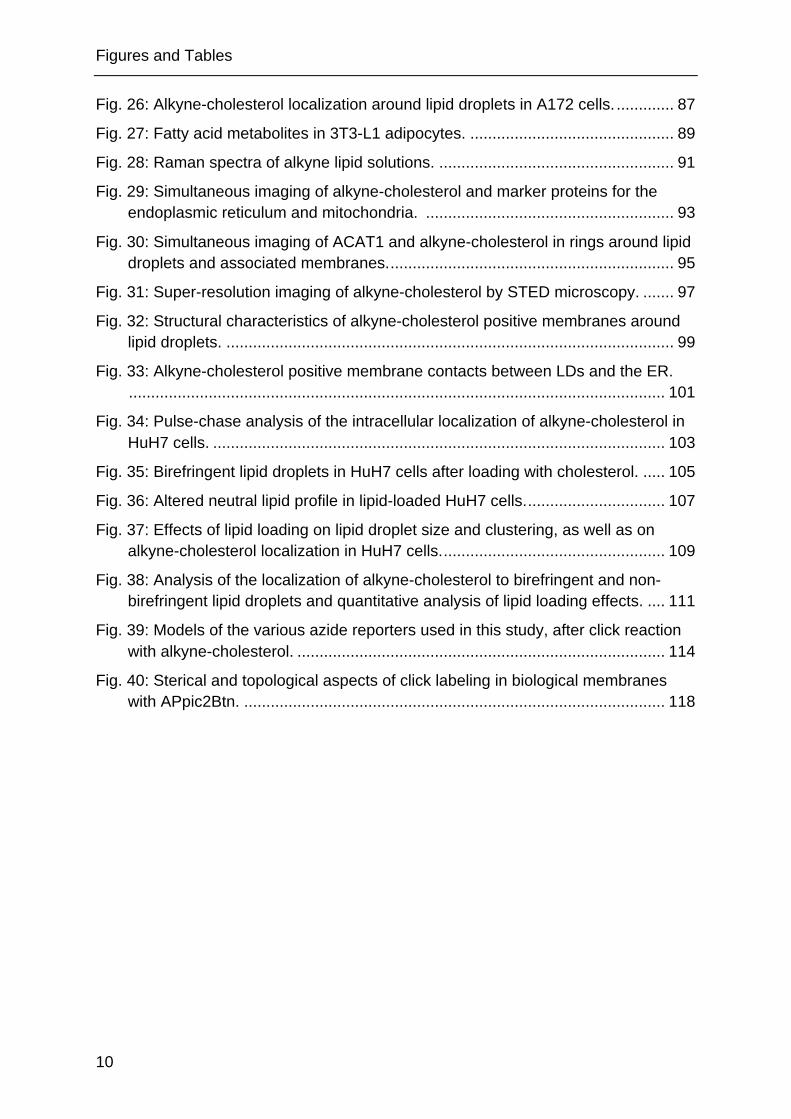
Fig. 26: Alkyne-cholesterol localization around lipid droplets in A172 cells. ............. 87
Fig. 27: Fatty acid metabolites in 3T3-L1 adipocytes. .............................................. 89
Fig. 28: Raman spectra of alkyne lipid solutions. ..................................................... 91
Fig. 29: Simultaneous imaging of alkyne-cholesterol and marker proteins for the endoplasmic reticulum and mitochondria. ........................................................ 93
Fig. 30: Simultaneous imaging of ACAT1 and alkyne-cholesterol in rings around lipid droplets and associated membranes. ................................................................ 95
Fig. 31: Super-resolution imaging of alkyne-cholesterol by STED microscopy. ....... 97
Fig. 32: Structural characteristics of alkyne-cholesterol positive membranes around lipid droplets. ..................................................................................................... 99
Fig. 33: Alkyne-cholesterol positive membrane contacts between LDs and the ER. ......................................................................................................................... 101
Fig. 34: Pulse-chase analysis of the intracellular localization of alkyne-cholesterol in HuH7 cells. ...................................................................................................... 103
Fig. 35: Birefringent lipid droplets in HuH7 cells after loading with cholesterol. ..... 105
Fig. 36: Altered neutral lipid profile in lipid-loaded HuH7 cells. ............................... 107
Fig. 37: Effects of lipid loading on lipid droplet size and clustering, as well as on alkyne-cholesterol localization in HuH7 cells. .................................................. 109
Fig. 38: Analysis of the localization of alkyne-cholesterol to birefringent and non-birefringent lipid droplets and quantitative analysis of lipid loading effects. .... 111
Fig. 39: Models of the various azide reporters used in this study, after click reaction with alkyne-cholesterol. ................................................................................... 114
Fig. 40: Sterical and topological aspects of click labeling in biological membranes with APpic2Btn. ............................................................................................... 118
Figures and Tables
11
List of tables
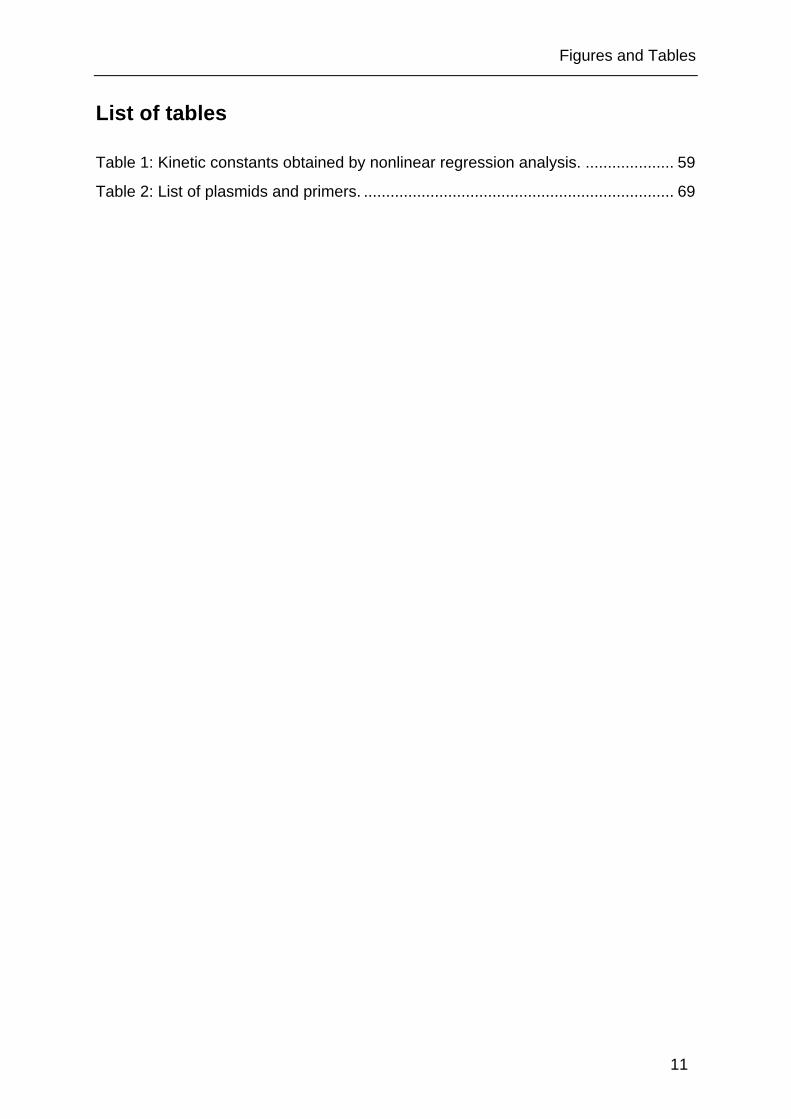
Table 1: Kinetic constants obtained by nonlinear regression analysis. .................... 59
Table 2: List of plasmids and primers. ...................................................................... 69

Introduction
12
1 Introduction
Lipids are major constituents of membrane bilayers and energy storage depots in all
cells. Their fundamental structural functions are intertwined with their multiple roles
in membrane microdomain formation, shaping and fusion as well as transport and
signaling processes (van Meer et al., 2008).
The diverse functions of lipids are accomplished by a plethora of lipid species, which
can be assigned to several lipid classes and sub-categories (Fahy et al., 2005; Fahy
et al., 2009). Complexity in the pool of cellular lipids is generated by the action of
enzymes that generate lipid molecules with a broad range of chemical connections
and functionalities from a variety of building blocks. Distinct steric and
physicochemical characteristics of the lipid category, but also the particular lipid
species (e.g. phosphatidylcholine (PC) species with different fatty acids) arise.
Structural diversity thus is created in a different way than for large biomolecules like
proteins and nucleic acids, and the multi-faceted lipid-lipid and lipid-protein
interactions largely depend on the fine-tuning of the lipid chemical structure.
1.1 Lipid probes and their versatile applications
1.1.1 Lipid labeling strategies
The exploration of lipid-lipid and lipid-protein interactions, of lipid metabolism,
intracellular localization and trafficking strongly relies on the use of labeled lipid
analogues. Because lipids are small structures, the label should also be small and
structurally non-interfering, i.e. the tag should not be bulky, neither too hydrophobic
nor hydrophilic and should not alter the charge of the lipid. The prospective
application of the probe also has to be taken into account for its design. For instance,
the correct enzymatic affinities toward the labeled substrate or the prevention of
background signal in microscopy need special consideration (see chapters 1.1.3 and
1.1.4). Highly sensitive and fast detection as well as easy synthetic or commercial
accessibility of the probe are also desirable. The requirement of specialized
instrumentation or expert knowledge for its detection, or strict regulations for its use
can hamper the wide-spread application of a probe. Lipids with defined molecular
Introduction
13
structure are now readily accessible through a variety of synthetic routes, or through
chemical or enzymatic modification of lipids from natural or synthetic sources (see
for instance (D’Arrigo and Servi, 2010) for a review about (lyso)phospholipid
synthesis). This has also enabled the synthesis of a great variety of functionalized
lipids.
Various modifications have been used as reporters in lipids to facilitate their
detection. Labeling with radioactive isotopes (3H, 14C, 32P) preserves all the
characteristics of the parent lipid and enables a sensitive detection of the probe.
They are used since decades for in vitro and in vivo studies of lipid metabolism
(Kornberg and Pricer, 1953). However, the handling and detection of radioactive
probes requires special equipment and safety precautions. Strict regulations apply
for the purchase of the substances and the disposal of waste. Altogether, this makes
the method quite costly and laborious, which is why radiolabeling, after decades of
inevitability, is now replaced in many applications by other labeling strategies.
Fluorescent lipid probes provide a convenient alternative to radiolabeling in a variety
of applications (Maier et al., 2002). They also enable the visualization of lipid
dynamics (Sezgin and Schwille, 2011). Typically, the introduction of a fluorescent
dye into the lipid structure allows its fast and sensitive detection, but it can have
considerable impact on the probe’s characteristics. Compared to the small lipid
structure, commonly used dyes based on structures like boron-dipyrromethene
(BDP), rhodamine, nitrobenzoxidiazole (NBD) and coumarin are bulky and can
influence or even dominate the properties of the labeled lipid. Consequently, the
suitability of a probe has to be validated thoroughly for every application. Polyene
lipids (Kuerschner et al., 2005) are fluorescent lipid probes with a particularly subtle
alteration of the lipid structure obtained by introducing five conjugated double bonds
into the hydrocarbon chain of a fatty acid. This label generates only minimal impact
on the lipid properties and can be used for live cell imaging, although due to photo-
bleaching and low quantum yield it may require a more sophisticated microscopy
setup than conventional fluorescent dyes.
Stable isotopes (13C, 2H) are also used for lipid labeling, and can be detected by
nuclear magnetic resonance (NMR, Ho et al., 2002) or mass spectrometry (MS, Li et
al., 2013) for lipidomic studies, or used for Raman-based imaging (Matthäus et al.,
2012). Spin-labeling with nitroxide moieties introduces an unpaired electron into the

Introduction
14
lipid structure which can be detected by electron spin resonance (ESR)
spectroscopy. The technique has been applied to study membrane dynamics
(Devaux et al., 2002). Gold is conjugated to lipids for detection in electron
microscopy (Brewer et al., 2004).
Although lipid probes with relatively spacious labels like fluorescent dyes have
proven powerful tools in many studies, the interference of the tag with the lipid
structure prohibits their use in other applications. In these cases, label free
techniques should be taken into consideration, like MS to identify and quantify lipid
species (Harkewicz and Dennis, 2011), solid-state nuclear magnetic resonance
(NMR) to investigate lipid-protein interactions (Huster, 2014) or Raman spectroscopy
based techniques for lipid imaging (Yu et al., 2014). In the last years, the advent of
click labeling techniques has added further versatile methods of lipid labeling with
small and non-interfering tags.
1.1.2 Click chemistry and the impact of click labeling on lipid biology
Click chemistry was postulated as a powerful concept for organic synthesis, to
generate ”diverse chemical function from a few good reactions” by Sharpless, Kolb
and Finn (Kolb et al., 2001). It describes that chemical syntheses, like for instance
the construction of a large pool of drug candidates, can be facilitated by joining
together smaller modules, similar to the synthesis of biomolecules in nature. The
reactions used should fulfill criteria like modularity and wide scope, high
thermodynamic driving force (“spring-loaded reactions”), high yields with only
inoffensive byproducts, high atom economy, stereospecificity and simple reaction
conditions. Reactions creating carbon-heteroatom bonds (e.g. cycloadditions, ring
opening nucleophilic substitutions and thiol-ene reactions) tend to meet these
principles better than carbon-carbon couplings.
In addition to its widespread use in the synthesis of drug-like molecules, the concept
and most notably one reaction have proven fruitful for a plethora of bioorthogonal
applications (Best, 2009; Thirumurugan et al., 2013). The copper-catalyzed azide-
alkyne cycloaddition (CuAAC, Fig. 1A), often simply referred to as “the click
reaction”, is the Cu(I)-catalyzed version of the long known Huisgen [3+2]-
cycloaddition. In the presence of Cu(I) ions, the reaction proceeds rapidly under
Introduction
15
physiological conditions. It was discovered in 2002 independently by the groups of
Sharpless (Rostovtsev et al., 2002) and Meldal (Tornoe et al., 2002). Recent studies
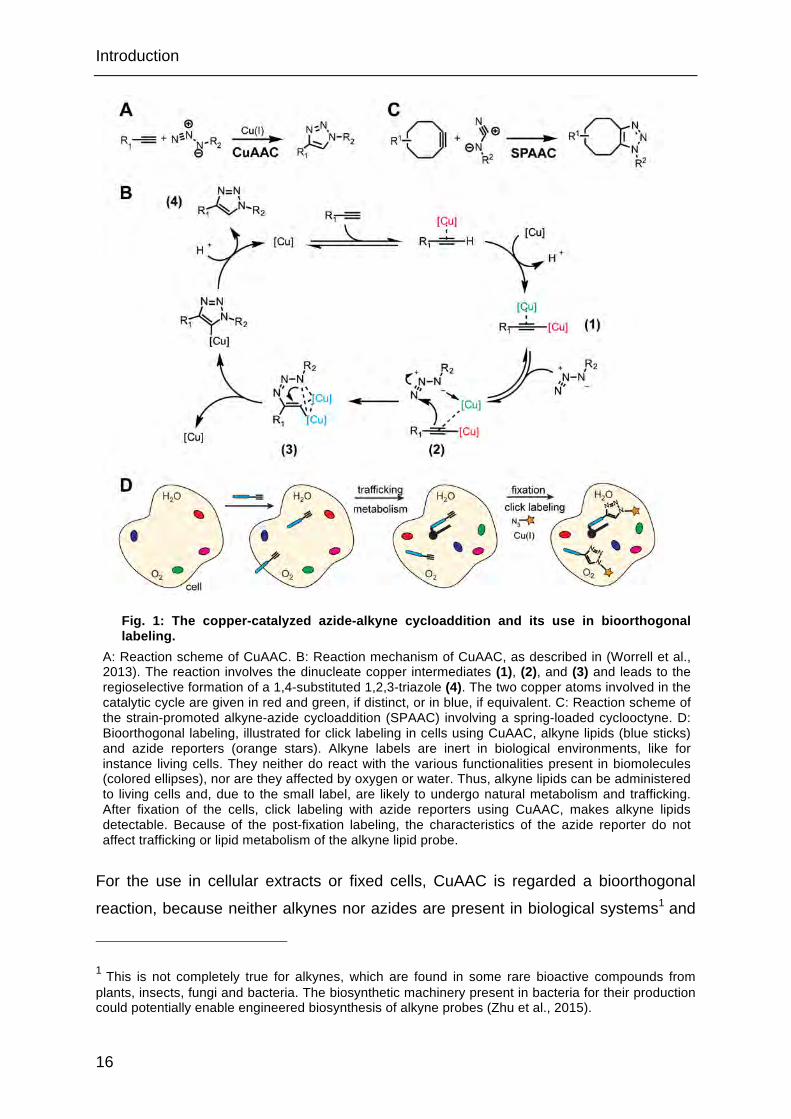
on the mechanism of CuAAC (Worrell et al., 2013) demonstrated that it involves the
formation of a σ-electron bound copper(I)-acetylide which binds a second copper by
π-electrons (Fig. 1B, (1)), followed by the coordination of the azide to the complex.
The nucleophilic attack of the carbon-bound nitrogen of the azide (2) initiates the
cycloaddition reaction via an intermediate with two equivalent copper atoms (3) to
regioselectively form a 1,4-substituted 1,2,3-triazole (4).
Bioorthogonal reactions feature abiotic reagents and can proceed swiftly in biological
environments, or even living cells and organisms, without the interference with or
from the biological milieu (Boyce and Bertozzi, 2011). This allows the investigator to
find the “needle in the haystack”, i.e. to react a probe to a detection reagent in a very
complex environment (Fig. 1D). After the Staudinger reaction, the first example of a
bioorthogonal reaction described by Bertozzi and colleagues (Saxon and Bertozzi,
2000), several faster proceeding reactions were added to the concept, including
CuAAC.
The increasing success of click labeling with CuAAC and alkyne lipids is based on its
modularity and versatility due to the two-step labeling and detection process applied
here (Fig. 1D), and generally in bioorthogonal labeling (Prescher and Bertozzi,
2005): As the alkyne tag is small and non-perturbing in biological systems, alkyne
lipids are very similar to the unlabeled parent lipids. They are taken up by living cells
and undergo metabolism and trafficking. Subsequently to the events of interest and
fixation of the sample, click labeling is performed. The azide reporter thus does not
interfere with metabolism and localization of the probe. Furthermore, the modular
labeling procedure allows for the characterization of lipid metabolism, of enzymatic
activities and of intracellular localization with the same alkyne lipid probe. Hence, a
direct correlation of key information from different experiment types, i.e. high-content
data, can be obtained.
Introduction
16
Fig. 1: The copper-catalyzed azide-alkyne cycloaddition and its use in bioorthogonal labeling.
A: Reaction scheme of CuAAC. B: Reaction mechanism of CuAAC, as described in (Worrell et al., 2013). The reaction involves the dinucleate copper intermediates (1), (2), and (3) and leads to the regioselective formation of a 1,4-substituted 1,2,3-triazole (4). The two copper atoms involved in the catalytic cycle are given in red and green, if distinct, or in blue, if equivalent. C: Reaction scheme of the strain-promoted alkyne-azide cycloaddition (SPAAC) involving a spring-loaded cyclooctyne. D: Bioorthogonal labeling, illustrated for click labeling in cells using CuAAC, alkyne lipids (blue sticks) and azide reporters (orange stars). Alkyne labels are inert in biological environments, like for instance living cells. They neither do react with the various functionalities present in biomolecules (colored ellipses), nor are they affected by oxygen or water. Thus, alkyne lipids can be administered to living cells and, due to the small label, are likely to undergo natural metabolism and trafficking. After fixation of the cells, click labeling with azide reporters using CuAAC, makes alkyne lipids detectable. Because of the post-fixation labeling, the characteristics of the azide reporter do not affect trafficking or lipid metabolism of the alkyne lipid probe.
For the use in cellular extracts or fixed cells, CuAAC is regarded a bioorthogonal
reaction, because neither alkynes nor azides are present in biological systems1 and
1 This is not completely true for alkynes, which are found in some rare bioactive compounds from plants, insects, fungi and bacteria. The biosynthetic machinery present in bacteria for their production could potentially enable engineered biosynthesis of alkyne probes (Zhu et al., 2015).

Introduction
17
in a cellular environment they only react with each other (Hang et al., 2011).
However, in living cells or organisms, the use of CuAAC is limited by the toxicity of
the copper catalyst. More biocompatible copper catalysts (Soriano Del Amo et al.,
2010) or ligands (Kennedy et al., 2011) and copper-free variants of the reaction, like
SPAAC (Boyce and Bertozzi, 2011), have been developed for that purpose. SPAAC
(Fig. 1C) involves cyclooctynes as spring-loaded variants of the alkyne reactant.
SPAAC’s compatibility with living systems is better than that of CuAAC with non-
chelated copper ions, but not perfect (van Geel et al., 2012). Reaction rates of
SPAAC with unmodified cyclooctynes are significantly slower than of CuAAC. The
modification of cyclooctynes led to a significant increase in reaction rate, but the
cyclooctyne-tagged probes are still laborious in synthesis (Sletten et al., 2014). In the
special case of lipid modification it has to be noted that the cyclooctyne moiety,
especially with additional modifications that enhance the reaction rate, is
considerably bulkier and more prone to interfere with the structure of the lipid than
the terminal alkyne.
Using CuAAC, alkyne lipids can be detected with azide bearing reporters, or vice
versa. Both strategies were applied successfully in many fields of lipid biology
(reviewed in (Best, 2013)). This study focuses on the application of click labeling in
enzymatic assays and lipid imaging (see chapters 1.1.3 and 1.1.4). In these
applications alkyne lipids are more commonly used than azido-lipids, which might be
due to a less interfering nature of alkyne compared to azide substitution at the
terminal position of the hydrocarbon chain (Kuerschner and Thiele, 2014). Alkyne
lipids have also been employed to study protein lipidation (Charron et al., 2009),
lipid-protein interactions (Smith et al., 2009), and to trace fatty acid metabolism
(Thiele et al., 2012).
Dual labeling of biomolecules with CuAAC and a second reaction (bioorthogonal,
and orthogonal to CuAAC) has been demonstrated with photoinitialized thiol-ene
reactions (Mahmoud et al., 2011). This strategy using mutually bioorthogonal
reactions will hopefully enable the simultaneous detection of multiple lipid species in
the future.
Unlike radiolabeling of lipids, the synthetic introduction of the small alkyne moiety
into the lipid structure can be performed rather easily. For a sensitive and convenient
detection of alkyne probes, the development of individual labeling protocols with the

Introduction
18
appropriate azide reporters, copper catalysts and, in several cases, chelating ligands
to accelerate the reaction, is also necessary and has been achieved for many
applications in the last years. For example, click labeling of lipids for detection after
their chromatographic separation, has benefitted strongly from the use of fluorogenic
azide reporters (Sivakumar et al., 2004; Thiele et al., 2012). In lipid imaging, the
feasibility of click labeling inside biological membranes has implications on the
design of the detection reagents (see chapter 1.1.4).
1.1.3 In vitro enzymatic assays to study enzymes of lipid metabolism
For the understanding of lipid metabolism, knowledge about the enzymes involved is
crucial. In vitro enzymatic assays provide information about the functional
parameters of enzymatic reactions in well-defined systems. The determination of
properties like substrate affinities and turnover of these enzymes sharpen our view
on lipid metabolism. The description of these properties was made possible by the
development of mathematical relations for enzyme kinetics, of which the model of
Michaelis and Menten (Michaelis and Menten, 1913) is probably the best-known and
still widely applied. It assumes the formation of a complex of the enzyme and the
substrate prior to the formation of the product, and a constant concentration of this
complex in a steady-state equilibrium. The kinetic constants associated with the
concept are Vmax, the maximum reaction rate of the system, and Km, the substrate
concentration at half of Vmax, also called the Michaelis-Menten constant.
To obtain accurate measurements of kinetic parameters, the choice of the assay
conditions is crucial, as is the use of the right lipid substrates. Since label-free
detection of the product lipids is often laborious, labeled lipids are applied frequently.
Radiolabeled substrates (Weiss et al., 1960) are still appreciated for their perfect
representation of the natural lipids, but assays with fluorescent reporters are often
more convenient and less expensive. However, the suitability of these substrates
especially for enzymatic assays needs to be evaluated thoroughly. For example,
Bandhuvula and colleagues used NBD- and BDP-labeled sphingosine-1-phosphate
for a sphingosine-1-phosphate lyase assay (Bandhuvula et al., 2007; Bandhuvula et
al., 2009). Their results showed that the BDP probe was more photostable and less
polar than the NBD substrate, however its Km was elevated compared to the natural

Introduction
19
or NBD substrate. The higher Km of the enzyme to the BDP probe may be tolerable
in some applications, but not in others, where concentrations or kinetic parameters
are measured.
To overcome the cumbersome handling of radioactivity on one hand and the
limitations of fluorescent probes on the other hand, a small, non-radioactive tag that
is universally applicable is desirable. Therefore, in this study (chapter 3), the
feasibility of a click-based method using alkyne lipids for in vitro enzymatic assays of
lipid modifying enzymes from the families of lysophosphatidic acid acyltransferases
(LPAATs), lysophosphatidylcholine acyltransferases (LPCATs), ceramide synthases
(CerSs) and cholesterol oxidases (CO) was tested.
1.1.4 Probes and detection reagents in click labeling for lipid imaging
Microscopy imaging provides valuable information about the complex processes on
the subcellular level and has greatly contributed to our understanding of the
physiology of cells and organisms. Despite the advances in microscopy and the
labeling of biomolecules, observing the intracellular localization and spatiotemporal
dynamics of lipids remains a technical challenge. Due to the small and hydrophobic
nature of their structure, the development of probes for lipid imaging is particularly
difficult. Meticulous care has to be taken in the design of the probe as well as the
interpretation of the data because inadequate labels are prone to create artifacts in
lipid localization, trafficking and targeting to organelles. Furthermore, in membranes
lipids are organized in domains with other lipids and proteins which are held together
mainly by non-covalent interactions. These interactions contribute to the subtle
regulation of membrane domains and the distribution of a lipid species among
different endomembranes (van Meer et al., 2008). Tags only slightly too bulky, rigid,
hydrophobic or hydrophilic, charged, basophilic or acidophilic can easily alter the
behavior of the labeled lipid inside membranes by disturbing this delicate network.
Furthermore, the fixation of lipids with chemical reagents like aldehydes is not
achieved to a similar degree as for other biomolecules because lipids often lack
reactive functionalities. The preservation of the subcellular lipid morphology during
the preparation of fixed samples for microscopy thus does strongly depend on an

Introduction
20
appropriate, gentle labeling protocol, as fixation cannot completely abolish lipid
mobility (Tanaka et al., 2010).
Recently, click labeling has been introduced as a tool to label lipids for microscopy
imaging in fixed and living samples. If click labeling is performed in a living sample,
SPAAC with cyclooctyne-tagged lipids is used to avoid the cytotoxic effects of
copper(I) ions (Neef and Schultz, 2009; Haberkant et al., 2013). Concerns regarding
lipid fixation are thus avoided. However, the resulting click-labeled lipid is rather
strongly altered by the detection reagent and the improvement of labeling sensitivity
by the synthesis of alternate octynes is laborious. CuAAC provides the possibility to
introduce lipids or precursors with the smaller terminal alkyne tag into living cells.
After fixation and subsequent click labeling the lipids can be detected (Jao et al.,
2009; Hofmann et al., 2014). Therewith, an altered metabolism or trafficking of click-
labeled lipids is prevented, but the copper-catalyzed click labeling reaction after
fixation particularly depends on an optimized, detergent-free protocol to preserve
lipid and membrane morphology. As the interest in lipid imaging is growing and
enormous improvements to click labeling have been made in the last years, the
limitations to both SPAAC and CuAAC will hopefully be overcome in the near future.
This study focuses on the application of alkyne lipids and azide detection reagents
for CuAAC in fixed cells. A fundamental obstacle for a sensitive and morphology-
preserving click labeling for microscopy is the fact that the reaction has to take place
inside an intact biological membrane (Fig. 2). For a sensitive labeling, the azide
detection reagent as well as the copper catalyst have to penetrate the membrane to
gain access to the alkyne label (marked with yellow circles in Fig. 2) which for most
alkyne lipids is buried deeply inside the membrane because of its position at the
terminus of alkyl chains of e.g. cholesterol (Fig. 2, left) or fatty acids (Fig. 2, right).
The design of the azide detection reagent can directly influence labeling sensitivity
and should prevent the mobilization and extraction of the lipid upon click labeling.
Azido-fluorophores have been used, as well as azido-biotin reporters that enable the
subsequent detection by a fluorophore-avidin conjugate. The modularity of the latter
strategy allows the choice from a wide spectrum of fluorophores, which is
advantageous for co-imaging studies with other cell stains or fluorescent proteins
whose emission spectrum cannot be altered.
Introduction
21
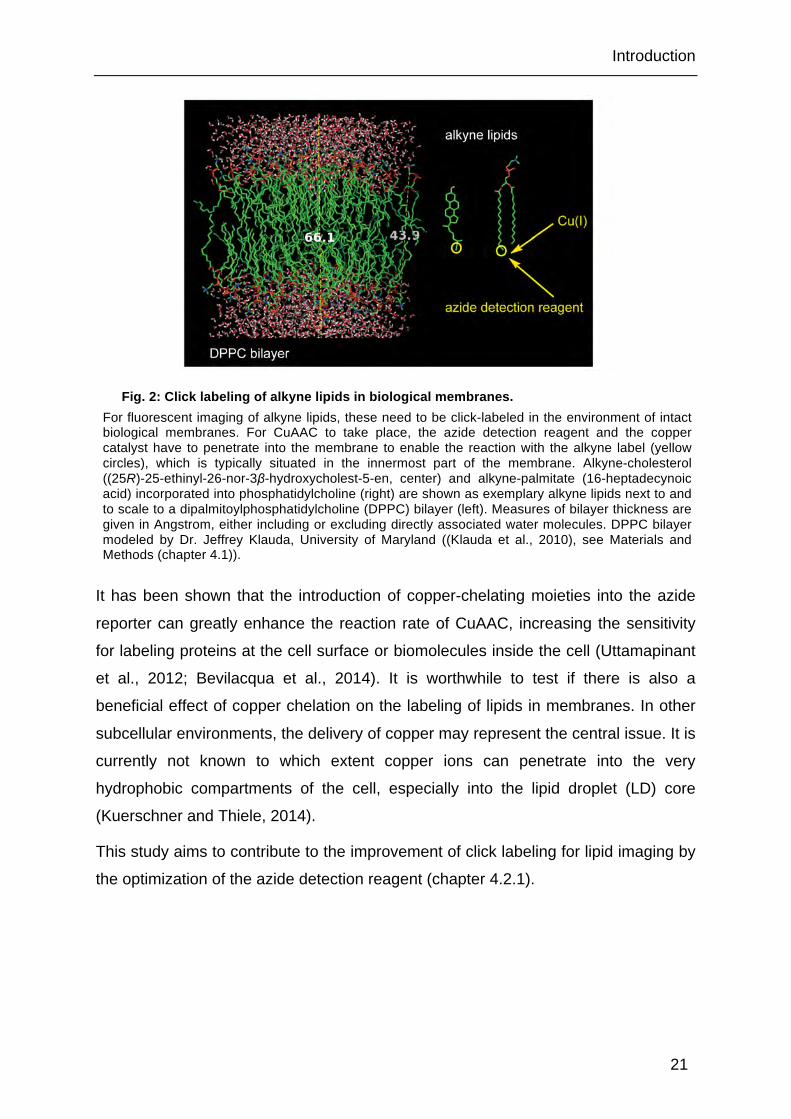
Fig. 2: Click labeling of alkyne lipids in biological membranes. For fluorescent imaging of alkyne lipids, these need to be click-labeled in the environment of intact biological membranes. For CuAAC to take place, the azide detection reagent and the copper catalyst have to penetrate into the membrane to enable the reaction with the alkyne label (yellow circles), which is typically situated in the innermost part of the membrane. Alkyne-cholesterol ((25R)-25-ethinyl-26-nor-3β-hydroxycholest-5-en, center) and alkyne-palmitate (16-heptadecynoic acid) incorporated into phosphatidylcholine (right) are shown as exemplary alkyne lipids next to and to scale to a dipalmitoylphosphatidylcholine (DPPC) bilayer (left). Measures of bilayer thickness are given in Angstrom, either including or excluding directly associated water molecules. DPPC bilayer modeled by Dr. Jeffrey Klauda, University of Maryland ((Klauda et al., 2010), see Materials and Methods (chapter 4.1)).
It has been shown that the introduction of copper-chelating moieties into the azide
reporter can greatly enhance the reaction rate of CuAAC, increasing the sensitivity
for labeling proteins at the cell surface or biomolecules inside the cell (Uttamapinant
et al., 2012; Bevilacqua et al., 2014). It is worthwhile to test if there is also a
beneficial effect of copper chelation on the labeling of lipids in membranes. In other
subcellular environments, the delivery of copper may represent the central issue. It is
currently not known to which extent copper ions can penetrate into the very
hydrophobic compartments of the cell, especially into the lipid droplet (LD) core
(Kuerschner and Thiele, 2014).
This study aims to contribute to the improvement of click labeling for lipid imaging by
the optimization of the azide detection reagent (chapter 4.2.1).

Introduction
22
1.2 Label-free methods and super-resolution techniques in lipid imaging
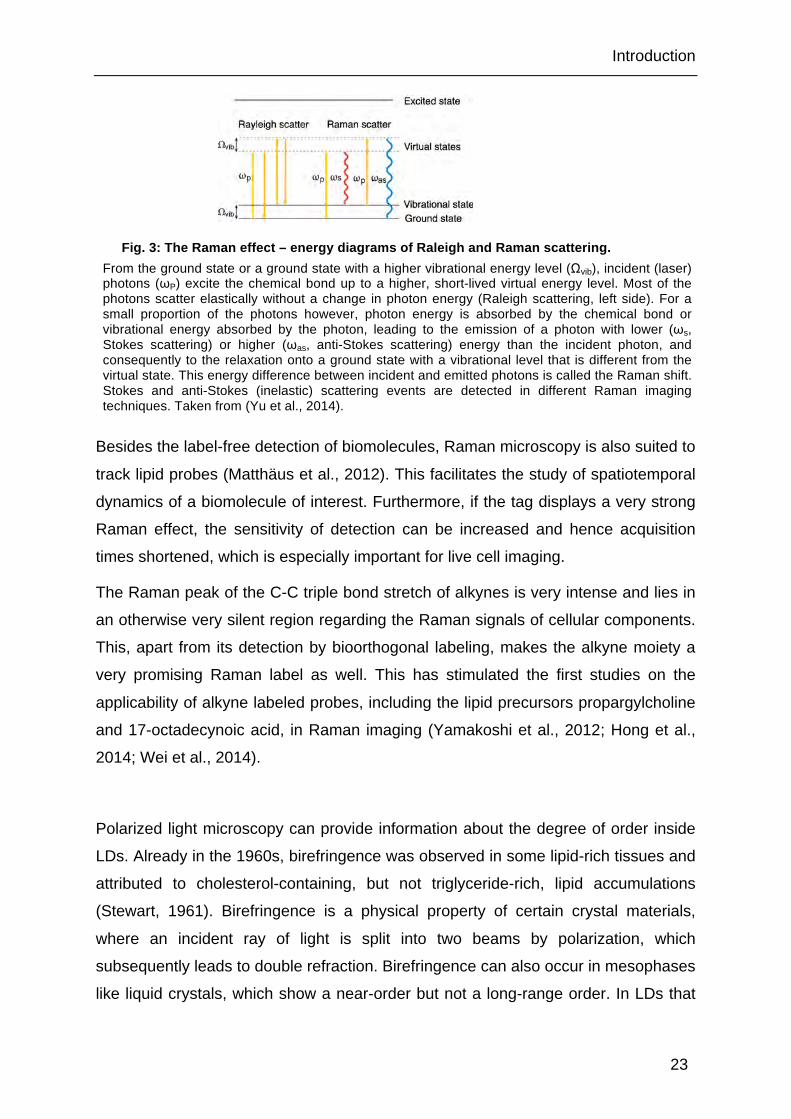
Different characteristics of lipids can be used for their label-free detection in
microscopy. Raman imaging observes the inelastic scattering of photons (Fig. 3, see
figure legend for details). The Raman shift is characteristic for a given vibration of a
functional group, and the many different chemical bonds of a molecule define its
unique Raman spectrum. Thus Raman spectroscopy can detect functional groups or
identify molecules. Strong Raman signals derive from vibrations of chemical bonds
with large changes in polarizability of the molecule. This accounts for strong peaks of
multiple bonds in Raman spectra, whereas the vibrations of highly polar bonds
usually give weak Raman signals. Lipids generally display abundant C-C and C-H
vibrations of alkyl chains.
High-resolution lipid imaging is possible with spontaneous Raman scattering
microscopy. It can precisely identify the different lipid species in the excited area and
also measure the concentrations of molecules on the microscopic scale, like, for
instance, of fatty acids with different length and degree of saturation (Wu et al., 2011;
Hosokawa et al., 2014). However, since spontaneous Raman scattering is a rare
event, signal intensities are generally weak.
Lipid imaging is also performed with a variety of advanced Raman spectroscopy
techniques, including coherent ones like CARS (coherent anti-Stokes Raman
scattering) and SRS (stimulated Raman scattering). These use two coherent pulse
lasers for excitation (at ω P and ω s, see Fig. 3), so that the difference in their
frequencies matches the energy of the desired chemical bond vibration (Ωvib). This
non-linear excitation leads to a strong amplification of the signal (Yu et al., 2014).
Coherent Raman techniques are now more widely applied in lipid imaging than
spontaneous Raman microscopy, because they display greatly enhanced sensitivity.
However due to the non-linear excitation, special methods have to be employed for
signal quantification and lipid composition analysis (Day et al., 2011).
Introduction
23
Fig. 3: The Raman effect – energy diagrams of Raleigh and Raman scattering. From the ground state or a ground state with a higher vibrational energy level (Ωvib), incident (laser) photons (ωP) excite the chemical bond up to a higher, short-lived virtual energy level. Most of the photons scatter elastically without a change in photon energy (Raleigh scattering, left side). For a small proportion of the photons however, photon energy is absorbed by the chemical bond or vibrational energy absorbed by the photon, leading to the emission of a photon with lower (ωs, Stokes scattering) or higher (ωas, anti-Stokes scattering) energy than the incident photon, and consequently to the relaxation onto a ground state with a vibrational level that is different from the virtual state. This energy difference between incident and emitted photons is called the Raman shift. Stokes and anti-Stokes (inelastic) scattering events are detected in different Raman imaging techniques. Taken from (Yu et al., 2014).
Besides the label-free detection of biomolecules, Raman microscopy is also suited to
track lipid probes (Matthäus et al., 2012). This facilitates the study of spatiotemporal
dynamics of a biomolecule of interest. Furthermore, if the tag displays a very strong
Raman effect, the sensitivity of detection can be increased and hence acquisition
times shortened, which is especially important for live cell imaging.
The Raman peak of the C-C triple bond stretch of alkynes is very intense and lies in
an otherwise very silent region regarding the Raman signals of cellular components.
This, apart from its detection by bioorthogonal labeling, makes the alkyne moiety a
very promising Raman label as well. This has stimulated the first studies on the
applicability of alkyne labeled probes, including the lipid precursors propargylcholine
and 17-octadecynoic acid, in Raman imaging (Yamakoshi et al., 2012; Hong et al.,
2014; Wei et al., 2014).
Polarized light microscopy can provide information about the degree of order inside
LDs. Already in the 1960s, birefringence was observed in some lipid-rich tissues and
attributed to cholesterol-containing, but not triglyceride-rich, lipid accumulations
(Stewart, 1961). Birefringence is a physical property of certain crystal materials,
where an incident ray of light is split into two beams by polarization, which
subsequently leads to double refraction. Birefringence can also occur in mesophases
like liquid crystals, which show a near-order but not a long-range order. In LDs that
Introduction
24
consist to a very high percentage of cholesterol esters (CE), stiff, rod-like molecules,
such liquid crystals can form, and they are probably smectic, i.e. CE is orientated in
concentric layers with the rods orientated along the radii of the spherical droplet
(Engelman and Hillman, 1976). This leads to an anisotropy (directionally dependent
property) of the CE-rich LDs in the passage of polarized light. In polarized light
microscopy, a polarizer is put into the light beam before the specimen, so that
linearly polarized light passes through the sample. Anisotropic (liquid) crystals refract
the light and split it into two rays with different polarization, vibrating perpendicular to
each other. In addition, retardation of one ray compared to the other is observed. By
using a second polarizer positioned after the specimen, orientated perpendicular to
the first one, only the delayed (extraordinary) ray is detected. Together with the liquid
crystal geometry, this setup creates a bright formée cross pattern on birefringent LDs
whereas LDs with lower CE content remain dark under polarized light (Weller, 1967).
The threshold between birefringent and non-birefringent LDs probably lies at over
90 % CE (Kellner-Weibel et al., 2001).
Polarized light microscopy is applied to detect birefringent LDs, especially in tissues
and cells that accumulate CE, like macrophages (Kellner-Weibel et al., 2001; Lada et
al., 2002), or Kupffer cells in steatotic livers (Ioannou et al., 2013). With little
additional equipment necessary, the method is fast and inexpensive, but also
provides limited information. It is suited to distinguish between LDs that are very rich
in CE, and those that contain less CE. A more sophisticated identification of the LD
composition has recently been described by polarized third-harmonic generation
(THG) microscopy (Bautista et al., 2014).
Mass spectrometry imaging (MSI) can be used for spatial mapping of biomolecules,
including lipids on biological surfaces (Gode and Volmer, 2013). Precise information
about the lipid species is available, but absolute quantification is still limited. MSI
also offers the opportunity to detect the specific metabolites of lipid probes labeled
with stable isotopes (Lechene et al., 2006) or potentially with other small tags like
terminal alkynes.

Introduction
25
Several super-resolution techniques are currently enlightening fluorescence-based
imaging of subcellular structures at resolutions unparalleled in conventional light
microscopy, and they have recently been awarded with the Nobel Prize in Chemistry
(Mockl et al., 2014). Different strategies were developed to overcome the diffraction
limit of optical microscopy (Hell, 2009) and have already triggered many applications
in cell biology, microbiology and neurobiology (reviewed in (Huang et al., 2010;
Owen and Gaus, 2013)).
Stimulated emission depletion (STED) microscopy (Klar et al., 2000) uses two laser
beams to generate very narrow fluorescent focal spots (Fig. 4A). A Gaussian beam
excites the fluorophore in the sample. A second beam (STED beam, doughnut
beam), which is sent through a phase plate, is intense around the focal point of the
excitation laser, but dark within (Fig. 4B). The wavelength of the STED laser is
slightly longer than that of spontaneous fluorescence. The intense STED laser forces
the excited fluorophores to return to the ground state under emission of fluorescent
light at the red-shifted STED laser wavelength (stimulated emission). Thus, emission
of light with the original wavelength of spontaneous fluorescence is depleted. The
intensity of the STED laser determines the efficiency of depletion; a saturated
depletion with high intensities is necessary. The depletion of fluorescence in the
lateral and axial surrounding creates a focal point with dimensions multiple times
smaller than the diffraction limit (Fig. 4C).
Since the publication of the first working setup for STED (Klar et al., 2000),
considerable improvements have further enhanced the lateral and axial resolution
and reduced the necessary laser intensity (Vicidomini et al., 2011), making live-cell
and multi-color imaging feasible (Tonnesen et al., 2011). STED microscopy has
provided insight into lipid-protein interactions, lipid dynamics and organization of the
plasma membrane (PM, Sieber et al., 2007; Mueller et al., 2011; Honigmann et al.,
2014; Saka et al., 2014).

Introduction
26
Fig. 4: The principles of STED microscopy. A: Instrumental setup to create small focal points for fluorescence microscopy. B: Measured point-spread functions for the excitation laser (left) and STED laser (right) in the x-z plane. C: Comparison of focal spots of STED and confocal microscopy. Surface plots of an x-z section for a confocal or STED setup. In this original setup, the FWHM (full width at half maximum) of the intensity profile along the z-axis was reduced from 490 nm to 97 nm. Slightly modified from (Klar et al., 2000). Copyright: National Academy of Sciences of the United States of America.
Introduction
27
1.3 Lipid droplets and lipid droplet heterogeneity
LDs are the primary intracellular organelles of lipid storage. They are evolutionarily
highly conserved, and are found in almost all of the diverse mammalian cell types.
Long regarded passive drops of fat, their dynamic nature and multiple functions have
begun to be revealed since a few years.
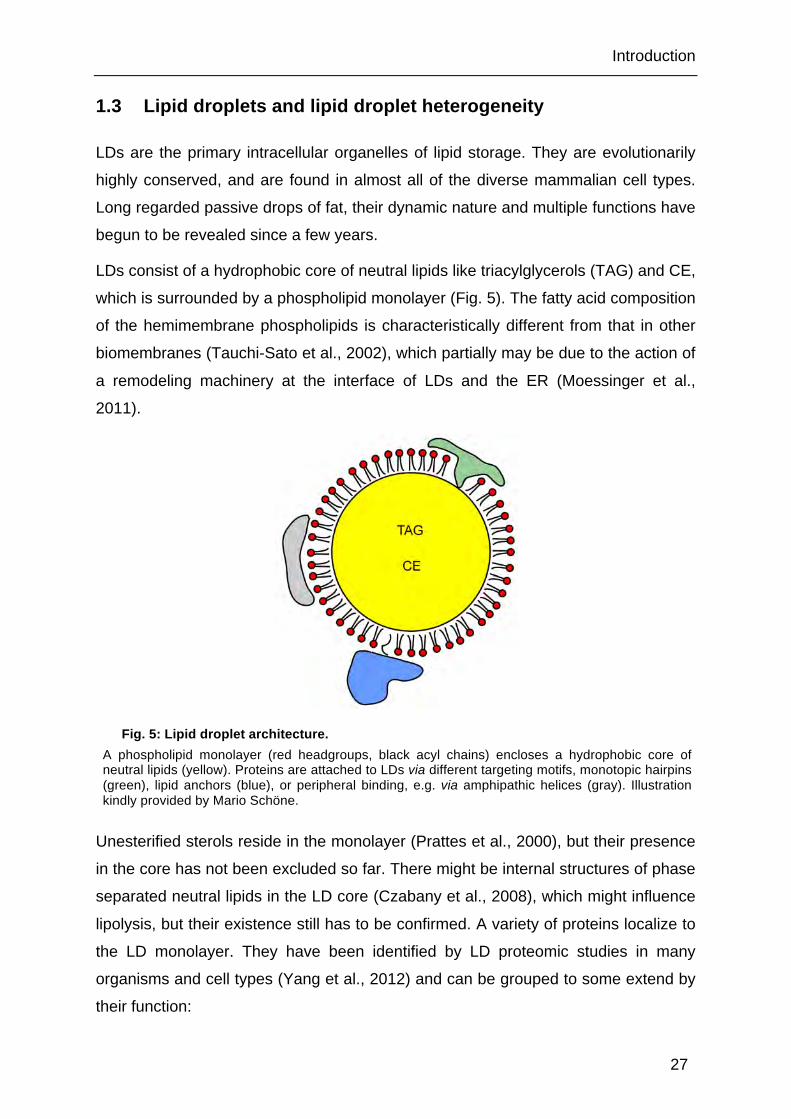
LDs consist of a hydrophobic core of neutral lipids like triacylglycerols (TAG) and CE,
which is surrounded by a phospholipid monolayer (Fig. 5). The fatty acid composition
of the hemimembrane phospholipids is characteristically different from that in other
biomembranes (Tauchi-Sato et al., 2002), which partially may be due to the action of
a remodeling machinery at the interface of LDs and the ER (Moessinger et al.,
2011).
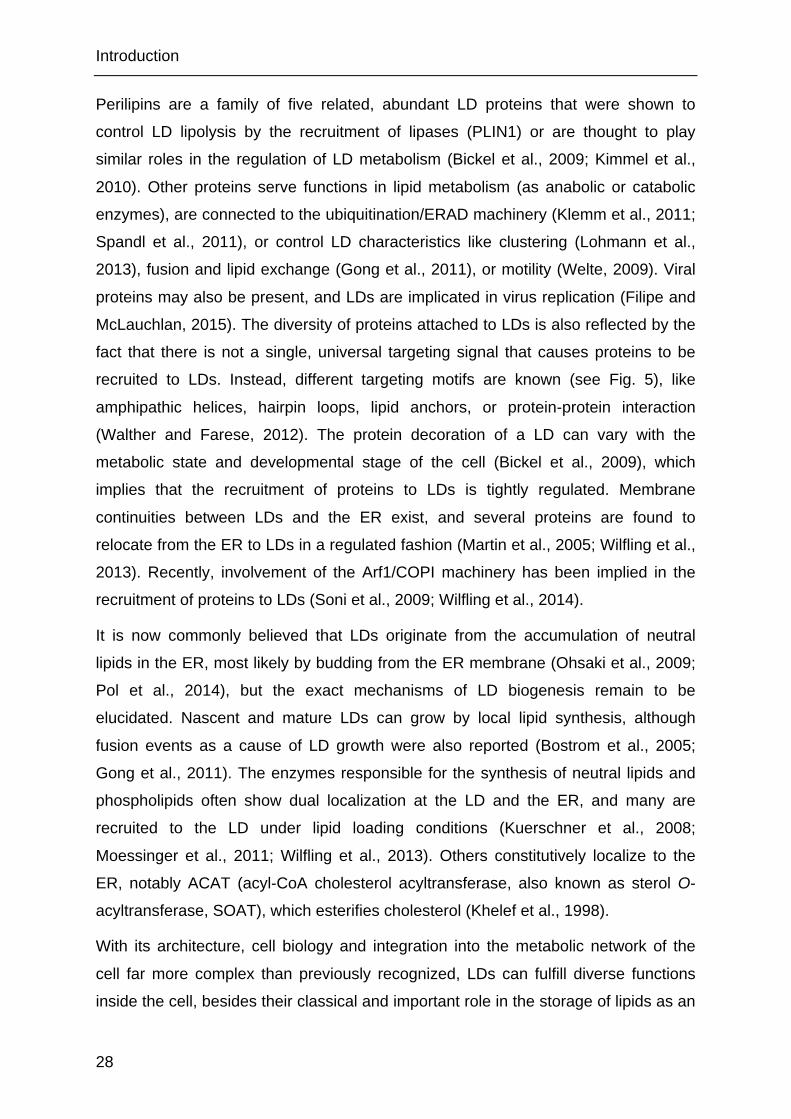
Fig. 5: Lipid droplet architecture. A phospholipid monolayer (red headgroups, black acyl chains) encloses a hydrophobic core of neutral lipids (yellow). Proteins are attached to LDs via different targeting motifs, monotopic hairpins (green), lipid anchors (blue), or peripheral binding, e.g. via amphipathic helices (gray). Illustration kindly provided by Mario Schöne.
Unesterified sterols reside in the monolayer (Prattes et al., 2000), but their presence
in the core has not been excluded so far. There might be internal structures of phase
separated neutral lipids in the LD core (Czabany et al., 2008), which might influence
lipolysis, but their existence still has to be confirmed. A variety of proteins localize to
the LD monolayer. They have been identified by LD proteomic studies in many
organisms and cell types (Yang et al., 2012) and can be grouped to some extend by
their function:
Introduction
28
Perilipins are a family of five related, abundant LD proteins that were shown to
control LD lipolysis by the recruitment of lipases (PLIN1) or are thought to play
similar roles in the regulation of LD metabolism (Bickel et al., 2009; Kimmel et al.,
2010). Other proteins serve functions in lipid metabolism (as anabolic or catabolic
enzymes), are connected to the ubiquitination/ERAD machinery (Klemm et al., 2011;
Spandl et al., 2011), or control LD characteristics like clustering (Lohmann et al.,
2013), fusion and lipid exchange (Gong et al., 2011), or motility (Welte, 2009). Viral
proteins may also be present, and LDs are implicated in virus replication (Filipe and
McLauchlan, 2015). The diversity of proteins attached to LDs is also reflected by the
fact that there is not a single, universal targeting signal that causes proteins to be
recruited to LDs. Instead, different targeting motifs are known (see Fig. 5), like
amphipathic helices, hairpin loops, lipid anchors, or protein-protein interaction
(Walther and Farese, 2012). The protein decoration of a LD can vary with the
metabolic state and developmental stage of the cell (Bickel et al., 2009), which
implies that the recruitment of proteins to LDs is tightly regulated. Membrane
continuities between LDs and the ER exist, and several proteins are found to
relocate from the ER to LDs in a regulated fashion (Martin et al., 2005; Wilfling et al.,
2013). Recently, involvement of the Arf1/COPI machinery has been implied in the
recruitment of proteins to LDs (Soni et al., 2009; Wilfling et al., 2014).
It is now commonly believed that LDs originate from the accumulation of neutral
lipids in the ER, most likely by budding from the ER membrane (Ohsaki et al., 2009;
Pol et al., 2014), but the exact mechanisms of LD biogenesis remain to be
elucidated. Nascent and mature LDs can grow by local lipid synthesis, although
fusion events as a cause of LD growth were also reported (Bostrom et al., 2005;
Gong et al., 2011). The enzymes responsible for the synthesis of neutral lipids and
phospholipids often show dual localization at the LD and the ER, and many are
recruited to the LD under lipid loading conditions (Kuerschner et al., 2008;
Moessinger et al., 2011; Wilfling et al., 2013). Others constitutively localize to the
ER, notably ACAT (acyl-CoA cholesterol acyltransferase, also known as sterol O-
acyltransferase, SOAT), which esterifies cholesterol (Khelef et al., 1998).
With its architecture, cell biology and integration into the metabolic network of the
cell far more complex than previously recognized, LDs can fulfill diverse functions
inside the cell, besides their classical and important role in the storage of lipids as an
Introduction
29
energy source. In cooperation with the ER and other organelles, LDs contribute to
the synthesis of specific lipids and thus provide building blocks for membranes (see
above). They actively contribute to lipid and energy homeostasis (Konige et al.,
2014) and to the protection of the cell against lipotoxicity (Herms et al., 2013). LDs
are further involved in temporal protein storage (Li et al., 2012), protein degradation
pathways (Klemm et al., 2011; Spandl et al., 2011), as well as intracellular signaling
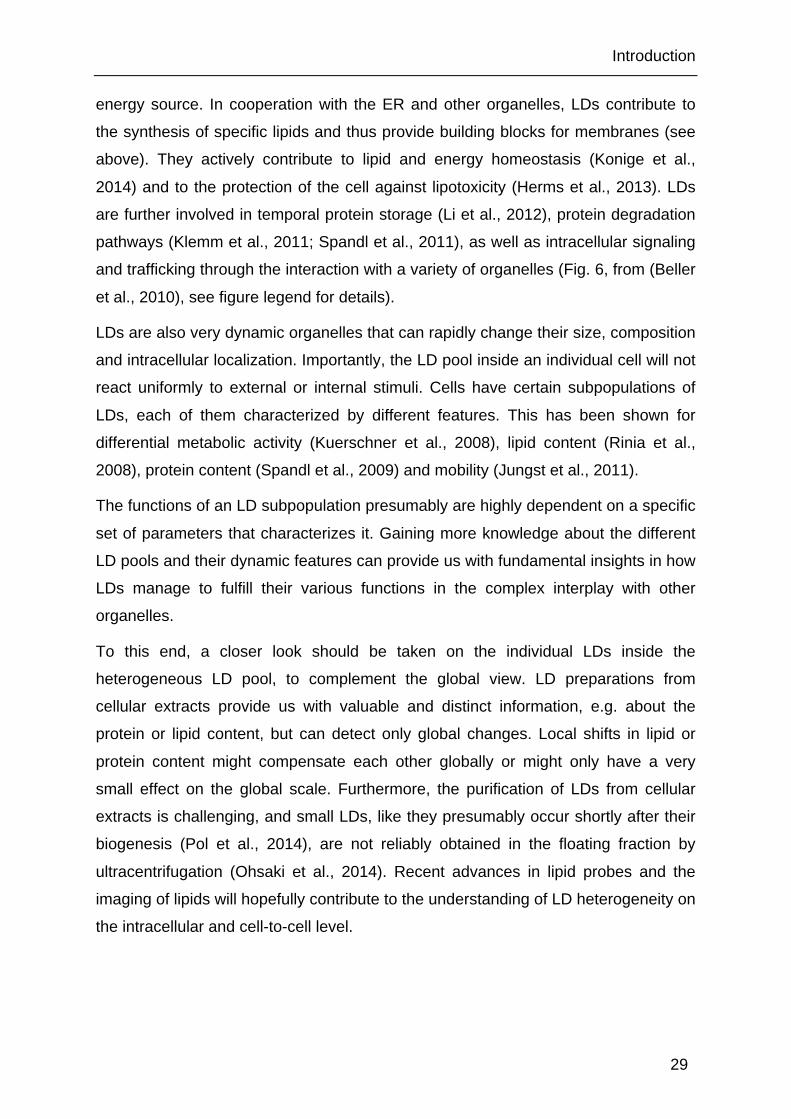
and trafficking through the interaction with a variety of organelles (Fig. 6, from (Beller
et al., 2010), see figure legend for details).
LDs are also very dynamic organelles that can rapidly change their size, composition
and intracellular localization. Importantly, the LD pool inside an individual cell will not
react uniformly to external or internal stimuli. Cells have certain subpopulations of
LDs, each of them characterized by different features. This has been shown for
differential metabolic activity (Kuerschner et al., 2008), lipid content (Rinia et al.,
2008), protein content (Spandl et al., 2009) and mobility (Jungst et al., 2011).
The functions of an LD subpopulation presumably are highly dependent on a specific
set of parameters that characterizes it. Gaining more knowledge about the different
LD pools and their dynamic features can provide us with fundamental insights in how
LDs manage to fulfill their various functions in the complex interplay with other
organelles.
To this end, a closer look should be taken on the individual LDs inside the
heterogeneous LD pool, to complement the global view. LD preparations from
cellular extracts provide us with valuable and distinct information, e.g. about the
protein or lipid content, but can detect only global changes. Local shifts in lipid or
protein content might compensate each other globally or might only have a very
small effect on the global scale. Furthermore, the purification of LDs from cellular
extracts is challenging, and small LDs, like they presumably occur shortly after their
biogenesis (Pol et al., 2014), are not reliably obtained in the floating fraction by
ultracentrifugation (Ohsaki et al., 2014). Recent advances in lipid probes and the
imaging of lipids will hopefully contribute to the understanding of LD heterogeneity on
the intracellular and cell-to-cell level.
Introduction
30
Fig. 6: Putative network of interactions of lipid droplets with other organelles. LD biogenesis occurs at the ER (1,3). Membrane bridges to the ER can remain (4) and lipids and proteins could be shuttled this way. LDs can also lose connection to the ER and grow by local synthesis and presumably fusion (2), and shrink by the action of lipases. Mitochondria associate with LDs and the ER (5). The association of LDs with peroxisomes could help to channel fatty acids into the latter organelle (6). LDs are found to localize between the ER and the Golgi (at the ERGIC, ER/Golgi intermediate compartment), and might interact with COPI/ COPII vesicles, or their machinery components (9). LD interaction with early endosomes has been shown in vitro (8). Caveolins associate with LDs. They might travel there from the PM by vesicular pathways, or via direct membrane contacts of the organelles (7). Abbreviations: CGN, cis-Golgi network, COPI/II, coat protein complexes I/II, TGN, trans-Golgi network. Illustration taken from (Beller et al., 2010).

Introduction
31
1.4 Intracellular cholesterol trafficking and homeostasis
Cholesterol is an essential constituent of mammalian cells. Its backbone structure
consists of four condensed rings, rendering this part of the molecule very rigid.
Through interactions with phospho- and sphingolipids, preferably those with
saturated acyl chains (Ali et al., 2007) and with large headgroups that shield the
hydroxy group from water ions (Huang and Feigenson, 1999; DiNitto et al., 2003), it
regulates the ordering of lipids in the membrane. Thereby it controls membrane
fluidity and water permeability (Simons and Vaz, 2004) and contributes to the
establishment of membrane microdomains (van Meer et al., 2008). It has been
proposed that the differential phospholipid composition of cellular membranes
contributes to the establishment of cholesterol gradients between organelles by the
varying cholesterol complexation potential. Excess cholesterol that exceeds this
threshold and does not interact tightly with its lipid neighbors is thought to be more
chemically active and displays an enhanced tendency to leave the membrane (Steck
and Lange, 2010). This likely facilitates the trafficking of cholesterol between
different membranes, through membrane continuities, spontaneous desorption and
diffusion or with the help of membrane proteins or cytosolic lipid transfer proteins
(LTPs). Several LTPs have been shown to bind cholesterol, and to transfer it
between artificial membranes (Prinz, 2007) but in many cases the capacity and
relevance of these transport processes for intracellular cholesterol trafficking are not
established and it is not clear if the binding of the sterol rather serves a function in its
sensing at different membranes.
Besides through these non-vesicular transport processes, cholesterol can traffic in
the cell via vesicular pathways, like the endosomal trafficking pathway that follows
the endocytosis of lipoproteins and provides cholesterol for cellular needs in addition
to its endogeneous synthesis (Ikonen, 2008). The question whether vesicular or non-
vesicular pathways prevail in cholesterol trafficking is not yet settled. Only few
proteins in the complex intracellular cholesterol transport processes have yet been
assigned defined functions. Information about lipid-protein and especially protein-
protein interactions in the pathways are still very limited, as is the understanding of
the regulation of the pathways. Nevertheless, several models of intracellular
cholesterol trafficking have been proposed. In Fig. 7 (from (Mesmin and Maxfield,

Introduction
32
2009)), an overview of current concepts of cholesterol trafficking via vesicular and
non-vesicular pathways is displayed (see figure legend for details).
Fig. 7: Intracellular cholesterol trafficking. Low density lipoprotein (LDL) particles containing free and esterified cholesterol bind to the LDL receptor that mediates their endocytosis (1). The particles are transported to sorting endosomes (2). The receptor is then recycled via the endosomal recycling compartment (ERC, 4) whereas the lipids continue their journey in the vesicular pathway (membrane transport, black arrows) in late endosomes and lysosomes (3). Acid lipases (LAL) hydrolyze CE to free cholesterol, which can exit the endosomal system by a process that involves the proteins NPC1 and NPC2, and can then take a non-vesicular pathway to the PM (5). From endosomal compartments, cholesterol reaches the ER on vesicular pathways via the Golgi, or on non-vesicular routes. Excess cholesterol in the ER is esterified by ACAT and stored in LDs (8). Membrane contact sites between organelles, like the ER and the PM (7), can bypass the secretory pathway through the Golgi (9). Cholesterol in the PM can be transported to the ERC in a non-vesicular process (6). The transport from the ERC to the PM occurs in vesicular and non-vesicular pathways. Abbreviations: BMP, bis-(monoacylglycerol)-phosphate; NPC, Niemann-Pick type C protein; SSD, sterol-sensing domain. Taken from (Mesmin and Maxfield, 2009).
Trafficking studies have long been hampered by a lack of suitable cholesterol
probes, but considerable progress in their development has been made in the last
years (Maxfield and Wustner, 2012; Windsor et al., 2013; Hofmann et al., 2014),
which will be of great value for the elucidation of cholesterol trafficking pathways and
the identification of the proteins involved.
Introduction
33
Although cholesterol travels quickly between different organelles, it is distributed
heterogeneously among cellular membranes. It is enriched about 5-10-fold at the
PM, in comparison to the ER, where cholesterol synthesis takes place (Maxfield and
van Meer, 2010). This demonstrates that newly synthesized cholesterol is exported
swiftly out of the ER (Ikonen, 2008). Despite the observation that it undergoes fast
flip-flop translocation between bilayers (Steck et al., 2002), cholesterol is also
described to preferentially localize to one leaflet of different biological membranes,
most notably of the PM (Mondal et al., 2009). Solid methods for a precise
quantification of the inter-organelle and transbilayer distribution of cholesterol are still
lacking.
Cellular cholesterol homeostasis is tightly regulated on multiple levels. The
cholesterol concentration in the ER governs several regulatory processes (Maxfield
and van Meer, 2010). Cholesterol synthesis takes place there, including the key step
catalyzed by HMG-CoA-reductase. If the cholesterol concentration in the ER is high,
the SREBP (sterol response element-binding protein) pathway is inhibited and genes
for the synthesis of cholesterol and lipoprotein uptake are down-regulated (Ikonen,
2008). HMG-CoA-reductase levels are also posttranscriptionally controlled. High
cholesterol levels lead to the targeting of the enzyme for ERAD, the ER-associated
proteasomal degradation (Sharpe et al., 2014). Parts of the machinery might be
located at LDs (Ohsaki et al., 2014). The ER is also the site of cholesterol
esterification by ACAT, which enables the storage of excess cholesterol as CE in the
LDs (Buhman et al., 2000). Presumably, an increased cholesterol concentration in
the ER also leads to higher levels in mitochondria, where this triggers the synthesis
of 27-hydroxycholesterol and multiple subsequent responses (Mesmin and Maxfield,
2009). The efflux of lipoprotein-bound cholesterol is a further control level of cellular,
tissue and whole-body cholesterol homeostasis (Ikonen, 2008).
1.5 Excess cholesterol and the liver
The liver has a central role in general lipid and cholesterol metabolism. Hepatocytes
are the main cholesterol-synthesizing cells of the body and the main platform for the
handling of lipoproteins. This leads to a specialized cholesterol trafficking inside
hepatocytes, compared to other cell types. Influx and efflux of cholesterol in a variety
Introduction
34
of lipoproteins, cholesterol synthesis and lipoprotein assembly in the ER, as well as
esterification of cholesterol and ester hydrolysis have to be carefully controlled by the
hepatocyte to maintain its own cholesterol homeostasis and to fulfill the multiple
functions in whole-body lipid homeostasis.
VLDL (very low density lipoprotein) particles are assembled in the ER of hepatocytes
for the delivery of lipids to extrahepatic tissues. Its apoprotein (ApoB) is lipidated
cotranslationally with the help of the microsomal triglyceride transfer protein (MTP) to
form a primordial lipoprotein particle, which is then further lipidated (Ikonen, 2008;
Ohsaki et al., 2009), probably with the contribution of LDs that provide the lipids (Ye
et al., 2009). The VLDL particles are then secreted via the Golgi apparatus and
supply cholesterol from dietary sources or synthesis in hepatocytes in the forward
cholesterol transport pathway to peripheral tissues.
LDL and chylomicron remnants bind to the LDL receptor or via several other
receptors of the hepatocyte, respectively, and are endocytosed and broken down.
Hepatocytes also synthesize ApoA1 and can assemble high-density lipoproteins
(HDL) from it. In the reverse cholesterol transport, hepatocytes receive lipids on HDL
from peripheral tissues.
Cholesterol esterification at the ER is catalyzed by two enzymes, ACAT1 and
ACAT2. Both ACATs are expressed in the liver, but controversial data have been
published regarding their cellular distribution in this organ. ACAT1, which is
expressed quite ubiquitously throughout the human body, is present in Kupffer cells
(Sakashita et al., 2000), the resident macrophages of the liver, and was also found in
hepatocytes (Chang et al., 2000). In human hepatocytes, ACAT1 is most likely
present at low constitutive levels, whereas the expression of ACAT2 can be induced
in this cell type to very high levels under several circumstances, like in the fetal liver
or in patients with gallstones (Chang et al., 2000; Parini et al., 2004; Chang et al.,
2009). It is hypothesized that the main role of ACAT2 is the esterification of
cholesterol for export as lipoproteins, whereas ACAT1 primarily esterifies cholesterol
for intracellular storage in LDs, a more general process that can also take place in
non-lipoprotein producing cells (Buhman et al., 2000). Data from several studies
support this hypothesis (Liang et al., 2004; Temel et al., 2007), but so far have not
explained the mechanisms behind the differential roles of the enzymes.

Introduction
35
Non-alcoholic fatty liver disease (NAFLD) affects about one in five adults (Chalasani
et al., 2012) and ranges from simple liver steatosis, over non-alcoholic
steatohepatitis (NASH) to liver fibrosis, cirrhosis and hepatocellular carcinoma.
Whereas simple steatosis alone is considered relatively benign and reversible, a
small proportion of NAFLD patients develop NASH, which proceeds to other
aggressive, non-reversible inflammatory liver conditions. Advances in the
understanding of NASH and NAFLD pathogenesis are needed to improve the
prevention and treatment of these diseases.
Regarding the progression of NAFLD, different theories exist. The two-hit hypothesis
states that simple steatosis progresses to NASH upon inflammatory stimuli like
oxidative stress or proinflammatory cytokines (Day and James, 1998). On the other
hand, simple steatosis and NASH might be two separate diseases, because recent
data suggest that steatosis is not a prerequisite for inflammation (multi-parallel
model, Tilg and Moschen, 2010; Wouters et al., 2008). Lipotoxicity has been
proposed to contribute to the development of NASH. Free fatty acids and their
derivatives have been the chief suspect in the search for the hepatotoxic agents
(Neuschwander-Tetri, 2010), but growing evidence exists that the hepatic
accumulation of cholesterol may also be cytotoxic (Van Rooyen et al., 2011; Arteel,
2012). Several intracellular effects of elevated hepatic cholesterol have been
accounted for its toxicity and for NASH progression (reviewed in (Musso et al.,
2013)), like mitochondrial oxidative injury, ER stress and the generation of toxic
oxysterols. By the release of inflammatory signals from apoptotic and necrotic
hepatocytes (Gan et al., 2014), Kupffer cells might be activated, leading to NASH,
which is characterized by the “ballooning” of hepatocytes (Hubscher, 2006) and
crown-like structures around them, formed by Kupffer cells incorporating the lipids of
the dead hepatocytes (Ioannou et al., 2013).
This study addresses the effects of excess cholesterol on hepatocytes. It seeks to
investigate the esterification of excess cholesterol and its storage on LDs as a
protective action against cytotoxicity (chapter 4.2.2).
Aims of this thesis
36
2 Aims of this thesis
The general aim of this thesis was to contribute to the understanding of lipid
metabolism, localization and trafficking through the development and application of
labeled alkyne lipid probes and azide detection reagents. The thesis consists of two
main sections, which are referred to as “Part I” and “Part II”:
Part I: Alkyne lipids as substrates for click chemistry-based in vitro enzymatic assays
• Development of assays for key enzyme families of lipid metabolism, including
several acyltransferases and hydrolases
• Evaluation of the alkyne lipid substrates: Determination of the kinetic
characteristics of alkyne lipids and comparison to the natural substrates
Part II: Highly sensitive alkyne lipid imaging
• Synthesis of azide detection reagents of variable length and with or without
copper chelating potential of the linker, and evaluation of click labeling
sensitivity with the novel reagents
• Validation and optimization of the click labeling protocol for epifluorescence
microscopy and super-resolution imaging using STED
• Application of the novel click labeling protocol for the imaging of alkyne-
cholesterol to investigate its transport to and storage on LDs in HuH7 cells
Part I
37
3 Alkyne lipids as substrates for click chemistry-based in vitro enzymatic assays (Part I)

Part I
38
Declaration concerning chapter 3
The following section of the thesis (chapter 3) was previously published as:
Gaebler, A., R. Milan, L. Straub, D. Hoelper, L. Kuerschner, and C. Thiele (2013). Alkyne lipids as substrates for click chemistry-based in vitro enzymatic assays. J. Lipid Res. 54, 2282-2290.
This publication is cited literally here. Minor modifications were made to enhance the
intelligibility of the text in the context of the thesis and to include one additional figure
(Fig. 10). The layout and numbering of the figures were adjusted to fit into the format
of the thesis, as was the introduction of abbreviations. Synthetic procedures included
in the supplementary information of the publication were moved to the main text of
Material and Methods.
Furthermore, the cholesterol oxidase assay (Fig. 14) that was not part of the
publication given above was included into the chapter. The cholesterol oxidase
assay was published in:
Hofmann, K., C. Thiele, H. Schott, A. Gaebler, M. Schoene, Y. Kiver, S. Friedrichs, D. Lutjohann, and L. Kuerschner (2014). A novel alkyne cholesterol to trace cellular cholesterol metabolism and localization. J. Lipid Res. 55, 583-591.
Literal citations from these two publications, and text added during the preparation of
this thesis are highlighted in chapter 3 as follows:
• Original text from (Gaebler et al., 2013) and the supplementary text thereto
are written in Arial font, without annotation.
• Text from (Hofmann et al., 2014) is written in Arial font, the paragraphs are
annotated with a footnote.
• New text is written in Cambria font.
Contributions of the PhD candidate to the published papers given above:
The experiments cited here in chapter 3 from the publications given above were
designed and performed by myself, with the exception of alkyne lipid syntheses,
which were kindly performed by Prof. Christoph Thiele. I thankfully acknowledge
Part I
39
assistance in the experiments for the establishment of the CerS assay by Robin
Milan (Fig. 13B) and contributions to the syntheses by Dominik Hoelper (alkyne-
OOPC) and by Leon Straub (PLpPC). Alkyne-oleoyl-CoA was synthesized by myself.
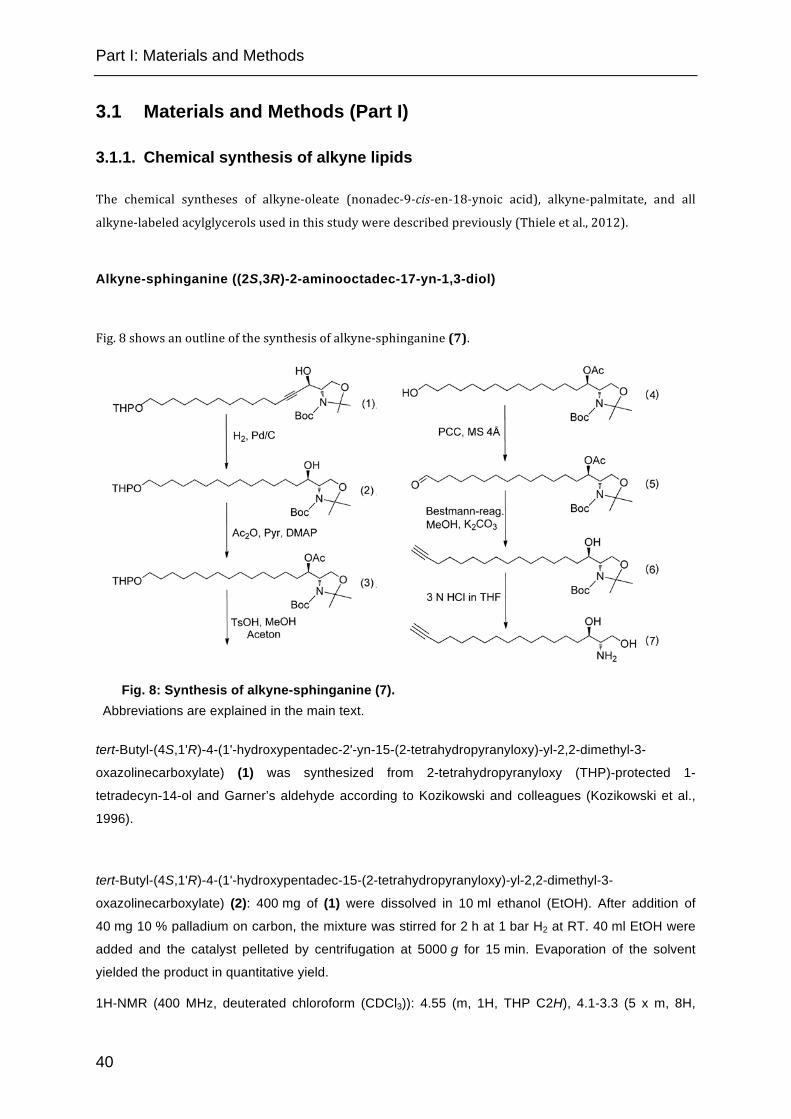
Part I: Materials and Methods
40
3.1 Materials and Methods (Part I)
3.1.1. Chemical synthesis of alkyne lipids
The chemical syntheses of alkyne-‐oleate (nonadec-‐9-‐cis-‐en-‐18-‐ynoic acid), alkyne-‐palmitate, and all
alkyne-‐labeled acylglycerols used in this study were described previously (Thiele et al., 2012).
Alkyne-sphinganine ((2S,3R)-2-aminooctadec-17-yn-1,3-diol)
Fig. 8 shows an outline of the synthesis of alkyne-‐sphinganine (7).
Fig. 8: Synthesis of alkyne-sphinganine (7). Abbreviations are explained in the main text.
tert-Butyl-(4S,1'R)-4-(1'-hydroxypentadec-2'-yn-15-(2-tetrahydropyranyloxy)-yl-2,2-dimethyl-3-
oxazolinecarboxylate) (1) was synthesized from 2-tetrahydropyranyloxy (THP)-protected 1-
tetradecyn-14-ol and Garner’s aldehyde according to Kozikowski and colleagues (Kozikowski et al.,
1996).
tert-Butyl-(4S,1'R)-4-(1'-hydroxypentadec-15-(2-tetrahydropyranyloxy)-yl-2,2-dimethyl-3-
oxazolinecarboxylate) (2): 400 mg of (1) were dissolved in 10 ml ethanol (EtOH). After addition of
40 mg 10 % palladium on carbon, the mixture was stirred for 2 h at 1 bar H2 at RT. 40 ml EtOH were
added and the catalyst pelleted by centrifugation at 5000 g for 15 min. Evaporation of the solvent
yielded the product in quantitative yield.
1H-NMR (400 MHz, deuterated chloroform (CDCl3)): 4.55 (m, 1H, THP C2H), 4.1-3.3 (5 x m, 8H,

Part I: Materials and Methods
41
C4H, C5H2, C1'H, C15'H2, C6H2), 1.8 and 1.68 (2 x m, 2H, THP C3H2), 1.6-1.36 (m, b, 23H, C2'H2,
C14'H2, THP C4H2, THP C5H2, 5 x methyl-CH3) 1.36-1.1 (m, b, 22H, C3'-13'H2).
tert-Butyl-(4S,1'R)-4-(1'-acetoxypentadec-15-hydroxy)-yl-2,2-dimethyl-3-oxazolinecarboxylate (4): 370 mg of (2) were dissolved in 5 ml dichloromethane (DCM). After addition of 0.5 ml pyridine (Pyr),
250 µl acetic anhydride (Ac2O) and 40 mg 4-dimethylaminopyridine (DMAP), the mixture was stirred
for 30 min at RT. After addition of 20 ml hexane/ethyl acetate 1/1 and 20 ml brine, the organic phase
was collected and dried to give the acetylated product in high purity and yield. The residue (3) was
dissolved in a mixture of 6 ml acetone, 2 ml methanol (MeOH) and 30 mg toluenesulfonic acid
(TsOH). After stirring at RT for 2 h, 20 ml hexane/ethyl acetate 1/1 and 10 ml saturated aqueous
NaHCO3 were added. The organic layer was separated, evaporated and the residue purified by silica
gel chromatography (solvent gradient hexane/ethyl acetate 3/1 to 1/1) to give 230 mg pure (4).
1H-NMR (400 MHz, CDCl3): 5.33 (m, 1H, C1'H), 4.1-3.8 (3 x m, 3H, C4H, C5H2), 3.61 (t, 2H, C15'H2),
2.04 (s, 3H, acetyl CH3), 1.6-1.38 (m, b, 19H, C2'H2, C14'H2, 5 x methyl-CH3) 1.38-1.1 (m, b, 22H,
C3'-13'H2).
tert-Butyl-(4S,1'R)-4-(1'-hydroxyhexadec-15-yn)-yl-2,2-dimethyl-3-oxazolinecarboxylate (6):
a) Pyridinium chlorochromate (PCC) oxidation to the aldehyde: 200 mg of (4) were dissolved in 5 ml
DCM. After addition of 200 mg powdered molecular sieves (MS 4 Å) and 220 mg PCC, the mixture
was stirred for 30 min at RT. The solvent was evaporated and the residue extracted with 3 x 10 ml
hexane/ethyl acetate 3/1. The extracts were evaporated and the aldehyde (5) isolated by silica gel
chromatography (solvent hexane/ethyl acetate 1/1).
b) Bestmann-Ohira reaction: the aldehyde was stirred with 140 mg dimethyl (1-diazo-2-
oxopropyl)phosphonate (Bestmann-Ohira reagent) and 200 mg potassium carbonate in 6 ml MeOH
for 30 min at RT. TLC (thin layer chromatography) control showed formation of the alkyne and a weak
band of lower mobility. Upon prolonged stirring (3 h at RT, 1h at 45 °C) more than 90 % of the
material was found in the lower band. After addition 20 ml hexane/ethyl acetate 1/1 and 20 ml brine,
the organic phase was collected and dried and the residue purified by silica gel chromatography
(solvent hexane/ethyl acetate 3/1) to give 130 mg pure (6)
1H-NMR (400 MHz, CDCl3): 4.1-3.4 (m, 4H, C1'H, C4H, C5H2), 2.16 (dt, J = 7.2 Hz, 2.7 Hz, 2H,
C14'H2), 1.92 (t, J = 2.7 Hz, 1H, C16'H), 1.6-1.37 (m, b, 19H, C2'H2, C13'H2, 5 x methyl-CH3) 1.37-1.1
(m, b, 20H, C3'-12'H2).
(2S,3R)-2-Aminooctadec-17-yn-1,3-diol (7): 100 mg of (6) were dissolved in 4 ml tetrahydrofurane
(THF) and 1 ml concentrated HCl and stirred for 2 h at RT. The solvent was evaporated in vacuo, the
residue dissolved in 10 ml water and the aqueous phase extracted with 10 ml hexane/diethyl ether
4/1. The aqueous phase was brought to pH 10 by addition of NaOH and extracted with 4 x 5 ml of

Part I: Materials and Methods
42
DCM. The pooled DCM phases were evaporated and the residue purified by silica gel
chromatography (solvent CHCl3/MeOH/aq. NH3 40/10/1) to give 47 mg pure (7).
1H-NMR (400 MHz, CD3OD): 3.72 (dd, 1H, C1aH), 3.50 (m, J = 7.2, 1H, C3H), 3.46 (dd, 1H, C1bH),
2.71 (ddd, 1H, C2H), 2.15 (m, 3H, C16H2, C17H), 1.6-1.45 (m, b, 4H, C4H2, C15H2) 1.45-1.2 (m, b,
20H, C5-14H2).
13C-NMR (400 MHz, CDCl3 + 10 % CD3OD): 84.75 ppm (C17), 73.88 (C3), 67.97 (C18), 63.05 (C1),
55.65 (C2), C4-C16: 33.66, 29.60, 29.54 (large signal), 29.51, 29.41, 29.02, 28.67, 25.95, 18.28.
Dihydroceramides (N-stearoyl-D-erythro-sphinganine, 18:0-dhCer and N-nervonoyl-D-erythro-sphinganine, 24:1-dhCer)
The dihydroceramides were synthesized from alkyne-sphinganine and stearic acid or nervonic acid.
The acid was transformed to the N-hydroxysuccinimide (NHS) ester with N-chlorosuccinimide (NCS)
and dicyclohexylcarbodiimide (DCC) and alkyne-sphinganine was added to the reaction mix. The
crude products were purified by preparative TLC.
ESI-MS for N-stearoyl-D-erythro-sphinganine: calculated for C36H69NO3: 564.6 [M+H]+, 586.5
[M+Na]+, found: 564.6 [M+H]+, 586.5 [M+Na]+. ESI-MS for N-nervonoyl-D-erythro-sphinganine:
calculated for C42H79NO3: 668.6 [M+Na]+, found: 668.6 [M+Na]+.
Alkyne-PAPA (1-(16-heptadecynoyl)-2-arachidonyl-sn-glycerol-3-phosphate)
Alkyne-PAPA was prepared by phosphorylation (Stowell and Widlanski, 1995) of 1-(heptadec-16-
ynoyl)-2-arachidonyl-sn-glycerol, which was synthesized by sequential acylation of protected glycerol
using the procedure described by Neef and Schultz (Neef and Schultz, 2009) with minor
modifications. Trimethylphosphite (67 mg, 0.54 mmol) was dissolved in 1.5 ml DCM and reacted with
124 mg (0.49 mmol) iodine. The mixture was then added dropwise with stirring at 0 °C to a solution of
282 mg (0.45 mmol) 1-(heptadec-16-ynoyl)-2-arachidonyl-sn-glycerol and 142 µl pyridine in 5 ml
DCM. After 2 h, the reaction was allowed to come to RT, the solvents were evaporated in vacuo and
the residue subjected to silica column chromatography (hexane/ethyl acetate 2/1 to 1/1) to obtain the
protected PA. For deprotection, the material (about 300 mg) was dissolved in 1 ml DCM and treated
with 300 µl bromotrimethylsilane for 2 h. After drying in vacuo, the residue was stirred with 5 ml CHCl3
and 400 µl 25 % NH3 for 30 min. After drying in vacuo, the residue was subjected to silica column
chromatography (CHCl3/MeOH/5 % aq. NH3 65/24/5) to obtain 240 mg of Alkyne-PAPA.
Alkyne-OLPA (1-(nonadec-9-cis-en-18-ynoyl)-sn-glycerol-3-phosphate)
Alkyne-OLPA was synthesized by selective acylation of sn-glycerol-3-(diethylphosphate) and
subsequent deprotection.
sn-glycerol-3-(diethylphosphate): A mixture of 1.24 g (4.9 mmol) iodine and 900 mg (5.4 mmol)
triethylphosphite in 15 ml DCM was slowly added to a solution of D-isopropylideneglycerol (sn-3-OH;
Part I: Materials and Methods
43
594 mg, 4.5 mmol) and 1.42 ml pyridine in 25 ml DCM. After stirring for 1 h, the pyridinium salt was
pelleted by centrifugation and the solvent was evaporated in vacuo. The residue was subjected to
silica column chromatography (hexane/ethyl acetate/EtOH 50/50/3). 1.1 g of the protected
intermediate were dissolved in 100 ml MeOH followed by addition of 100 µl acetyl chloride. The
mixture was stirred for 16 h, 100 µl triethylamine were added and the solvent evaporated in vacuo.
The residue was dissolved in 10 ml ethyl acetate, centrifuged and the supernatant evaporated to
obtain 900 mg product.
1H-NMR (400 MHz, CDCl3/CD3OD 2/1): 4.43 (s, 2H, -OH by exchange with MeOD), 4.15 (m, 4H,
ethyl-CH2), 4.0-3.9 (m, 2H, C2H + C1H), 3.77 (m, 1H, acetyl C1H), 3.52 (m, 2H, C3H2), 1.28 (2 x t,
6H, ethyl-CH3).
Alkyne-OLPA: Alkyne-oleic acid (150 mg, 0.5 mmol) was stirred with 2 ml thionylchloride at 65 °C for
2 h. Excess thionylchloride was evaporated in vacuo and the residue (i. e. the acyl chloride) dissolved
in 2 ml DCM. This solution was slowly added at -78 °C to a stirred solution of 145 mg (0.6 mmol) sn-
glycerol-3-(diethylphosphate) and 140 µl (1.2 mmol) 2,6-lutidine in 3 ml DCM. After stirring for 2 h
at -78 °C and 30 min at RT, 100 µl MeOH were added and the solvents evaporated in vacuo. The
residue was subjected to silica column chromatography (hexane/ethyl acetate/MeOH 50/50/3) to
obtain 149 mg of the protected alkyne-OLPA. For removal of the ethyl groups, 120 mg were treated
with 500 µl DCM, 200 µl N,O-bis-trimethylsilylacetamide and 400 µl bromotrimethylsilane for 1 h. After
removal of all solvent, the residue was dissolved in 5 ml 5 % water in MeOH and stirred for 30 min.
100 ml 25 % aq. NH3 were added, the solvents removed in vacuo, and the residue subjected to silica
column chromatography (CHCl3/MeOH/H2O 40/50/10) to obtain 50 mg of alkyne-OLPA.
1H-NMR (400 MHz, CDCl3/CD3OD 2/1): 5.32 ppm (m, 2H, olefinic CH), 4.64 (s, broad 6H, -OH and
NH3 by exchange with MeOD), 4.2-3.7 (5 x m, 5H, glycerol CH), 2.33 (t, 2H, C2H2), 2.18 (dt, 2H,
C17H2), 2.08-1.95 (m, b, 5H, C8,11H2, C19H), 1.62 (m, 2H, C3H2), 1.52 (m, 2H, C16H2), 1.43-1.25
(m, b, 16H, C4-7,12-15H2).
Alkyne-oleoyl-CoA (nonadec-9-cis-en-18-ynoyl coenzyme A) The synthetic procedure was adapted from Kawaguchi and colleagues (Kawaguchi et al., 1981),
purification from Taylor and colleagues (Taylor et al., 1990). Alkyne-oleate (3 mg) was dissolved in
100 µl dry THF and a solution of carbonyldiimidazole (1.8 mg) in 100 µl THF was added. After
incubation at RT for 30 min, the solvent was evaporated and the residue dissolved in 200 µl THF/H2O
2/1 After the addition of coenzyme A (8.2 mg) in 0.5 ml THF/H2O 2/1, the pH of the reaction mix was
adjusted to 7.0-7.5 with 1 N NaOH and the reaction was incubated under Ar for 4 h. THF was
evaporated and 3-(N-morpholino)propansulfonic acid (MOPS) buffer (pH 7.4) added to a
concentration of 100 mM. The reaction mix was loaded directly on a Sep-Pak C18 column, which had
been activated with MeOH and equilibrated with MOPS buffer. After application of the reaction mix,
the column was washed/eluted with 0.5 ml of 100 mM MOPS pH 7.4, 1 ml MeOH/H2O 1/1 and 10 ml
MeOH, consecutively. Fractions were analyzed by TLC (H2O/n-butanol/acetic acid 30/50/20), and the
product containing fractions combined and evaporated. Residual alkyne-oleate was removed by
Part I: Materials and Methods
44
extraction: To the methanolic crude product solution the same volume of an aqueous solution of HCl
(pH 3.5) was added and the aqueous phase extracted three times with 200 µl hexane. Removal of
alkyne-oleate was monitored by TLC. The aqueous phase was evaporated to yield alkyne-oleoyl-CoA
(0.6 mg). Yield and purity of the product were determined by click reaction and TLC.
pPC (propargyl-phosphatidylcholine)
pPC was synthesized by transphosphatidylation of egg yolk phosphatidylcholine: A mixture of 6.72 g
of propargylcholine bromide and 168 U [µmol/h] phospholipase D (Streptomyces spec.) in 170 ml of
acetate buffer (100 mM sodium acetate, pH 5.6, 40 mM CaCl2) was added to a solution of 4.8 g egg
yolk PC in 1.3 l diethylether. After vigorous stirring for 24 h, the organic phase was separated and the
solvent evaporated. The residue was separated by silica column chromatography (CHCl3/MeOH/H2O
65/25/2) to yield 3.2 g product.
1H-NMR (400 MHz, CDCl3): 5.32 (m, 4H, fatty acid olefinic H), 5.19 (m, 1 H, C2H), 4.70 (d, 2H,
propargyl-CH2) 4.38 (m, 2H, POCH2), 4.35 (m, 1 H, C1H), 4.11 (m, 1H, C1H), 3.98 (m, 4H, C3H2 and
NCH2), 3.43 (s, 6H, N(CH3)2), 2.92 (t, 1H, propargyl-CCH), 2.27 (m, 4H, fatty acid C2H2), 2.00 (m, 4H,
fatty acid allylic CH2), 1.55 (m, 4H, fatty acid C3H2), 1.17-1.30 (m, 42H, fatty acid CH2), 0.85 (t, 6H,
fatty acid CH3).
PLpPC (palmitoyl-lyso-propargyl-PC) PLpPC by PLA2 cleavage of pPC: Crotalus atrox snake venom (5 mg) was dissolved in 5 ml buffer
(0.1 M Tris-HCl, pH 8.0, 20 mM CaCl2) and stirred with a solution of 1.0 g phosphatidyl-
propargylcholine in 40 ml diethyl ether for 2 h at RT. The solvent was evaporated and the residue
subjected to silica gel chromatography using CHCl3/MeOH/H2O 65/35/8 as a solvent to yield 0.73 g
product.
1H-NMR (400 MHz, D2O): 4.35 (d, 2 H, propargyl-CH2) 4.29 (m, 2H, POCH2), 4.14 (m, 1H, C1H), 4.05
(m, 1H, C1H), 3.97 (m, 2H, C2H2), 3.87 (m, 1H, C3H), 3.75 (m, 2H, NCH2), 3.65 (t, 1H, propargyl-
CCH), 3.25 (s, 6H, N(CH3)2), 2.32 (m, 2H, fatty acid C2H2), 1.55 (m, 2H, fatty acid C3H2), 1.17-1.30
(m, 25H, fatty acid CH2), 0.82 (t, 3H, fatty acid CH3).
Alkyne-OLPC (1-(nonadec-9-cis-en-18-ynoyl)-sn-glycerol-3-phosphocholine)
Di-(alkyne-oleoyl)-PC (alkyne-OOPC) was prepared by acylation of sn-3-glycerophosphocholine with
alkyne-oleate: Alkyne-oleate (200 mg) and 1,1-carbonyldiimidazole (CDI, 133 mg) were dissolved in
0.5 ml THF. 120 mg of a CdCl2 adduct of sn-3-glycerophosphocholine and 6.69 mg DMAP in 1 ml
dimethylformamide (DMF) were added. The reaction mixture was incubated in an ultrasound bath for
4.5 h, then at 40 °C for approximately 48 h. To the reaction mixture 8 ml CHCl3 and 3 ml MeOH were
added. The solution was washed with H2O and with MeOH/H2O 1/2. The crude product was purified
over a mixed bed ion exchange column (Amberlite® MB-150 Resin, Supelco) with CHCl3/MeOH/H2O
Part I: Materials and Methods
45
5/4/1, and by chromatography on silica gel with CHCl3/MeOH/H2O (65/25/4) to yield alkyne-OOPC
(46 mg).
Alkyne-OLPC: PLA2 cleavage of alkyne-OOPC was performed analogously to the protocol for pPC
cleavage to PLpPC.
Alkyne-palmitoylethanolamide (N-(16-heptadecynoyl)ethanolamine) and alkyne-oleoylethanolamide (N-( nonadec-9-cis-en-18-ynoyl)ethanolamine)
Alkyne-palmitate or alkyne-oleate was reacted with DCC and NCS to yield the NHS-ester, to which 2-
aminoethanol was added without prior isolation of the ester. The crude products were purified by silica
gel chromatography.
1H-NMR of alkyne-palmitoylethanolamide (400 MHz, CDCl3): 5.91 (b, 1H, NH), 3.70 (m, 2H, C1’H2),
3.41 (m, 2H, C2’H2), 2.7-2.5 (b, 1H, OH), 2.16 (2x t, 4H, C2H2 and C15H2), 1.92 (t, 1H, C17H), 1.61
(m, 2H, C3H2), 1.50 (m, 2H, C14H2), 1.4-1.2 (m, 20H, C4-13H2).
1H-NMR of alkyne-oleoylethanolamide (400 MHz, CDCl3): 6.00 (b, 1H, NH), 5.32 (m, 2H, C9H and
10H), 3.70 (m, 2H, C1’H2), 3.40 (m, 2H, C2’H2), 2.8-2.6 (b, 1H, OH), 2.16 (m, 4H, C2H2 and C17H2),
1.99 (t, 4H, C8H2 and C11H2), 1.92 (t, 1H, C19H), 1.61 (m, 2H, C3H2), 1.50 (m, 2H, C16H2), 1.4-1.2
(m, 16H, C4-7H2, C12-15H2).
3.1.2 Methods
E. coli culture and preparation of microsomal fractions
E. coli (strain RosettaTM 2 pLysS, Merck Millipore) cultured in Luria Broth at 37 °C to an O.D.600 of 1.6
were harvested by centrifugation at 3000 g for 10 min. Microsomal fractions were prepared according
to Lewin and colleagues (Lewin et al., 1999), frozen in liquid nitrogen and stored at -80 °C. The
protein concentration in the microsomes was determined with the BioRad Bradford Assay Kit using
bovine serum albumin (BSA) as a standard.
Cell culture and preparation of cell lysate
HuH7 cells were grown in RPMI 1640 (PAN Biotech #P04-17500) supplemented with 10 mM HEPES
buffer (4-(2-hydroxyethyl)-1-piperazineethanesulfonic acid), 0.1 mM non-essential amino acids, 2 mM
L-Glutamine, 10 % fetal calf serum (FCS), at 5 % CO2. Cells were washed, scraped into ice-cold
buffer (20 mM HEPES/NaOH, pH 7.0, 200 mM sucrose) and homogenized in a cooled EMBL cell
cracker (HGM, Heidelberg, Germany) with 5 double strokes and a maximum clearance of 18 µm. The
lysate was centrifuged at 500 g for 5 min at 4 °C, the supernatant frozen in liquid nitrogen and stored
at -80 °C. The protein content of the lysate was determined with the bicinchoninic acid assay kit
(Pierce) using BSA as a standard.

Part I: Materials and Methods
46
Animals and preparation of tissue microsomal fractions
Membrane fraction samples were prepared of the brain, liver and kidneys of C57BL/6 wild-type (+/+)
and CerS2-deficient mice (-/-) (one individual each, littermates, 13 to 14 weeks old) according to the
protocol described by Imgrund and colleagues (Imgrund et al., 2009), frozen in liquid nitrogen and
stored at -80 °C. A total lysate of wild-type liver was also prepared. The protein content of the
microsomal fractions, and of liver lysate was determined with the bicinchoninic assay kit (Pierce)
using BSA as a standard.
Enzymatic assays
All assays were performed in 1.5 ml glass vials (CO assay) or plastic reaction reaction tubes (all other
assays) in a total volume of 100 µl. The reaction was started by addition of the pre-warmed reaction
mix to the enzyme preparation and the tubes were incubated in a heating block (Eppendorf
Thermomixer comfort) under shaking (1100 rpm). Incubation times and the amount of enzyme
preparation were optimized for each assay (data not shown) to ensure substrate saturation and
linearity of the reaction rate with regard to time and enzyme amount.
LPAAT assay For the kinetic studies, different concentrations of alkyne-OLPA and 50 µM oleoyl-CoA, or various
concentrations of PLPA (1-palmitoyl-lysophosphatidic acid, Avanti Polar Lipids #830855) and 50 µM
alkyne-oleoyl-CoA were incubated with 2.06 µg (protein) E. coli microsomes in LPAAT buffer
(Moessinger et al., 2011; 60 mM Tris/HCl, pH 7.5, 3 mM MgCl2, 0.6 mg/ml lipid-free BSA (Applichem
#A0848)) for 5 min at 30°C. For the measurement of the acyl-CoA specificity (Fig. 11D, 5 min
incubation) and the TLC displayed in the results section (Fig. 11C, 10 min incubation), 4 µM alkyne-
OLPA and 100 µM acyl-CoA were used.
LPCAT assay
For the kinetic studies, different concentrations of alkyne-OLPC or PLpPC and 150 µM oleoyl-CoA
were incubated with 5 µg (protein) HuH7 lysate for 15 min at 30 °C in LPCAT buffer (60 mM Tris/HCl,
pH 7.4, 3 mM MgCl2, 0.6 mg/ml lipid-free BSA). For the TLC that shows the setup of the assay (Fig.
12B), 20 µM lysophosphatidylcholine, 50 µM oleoyl-CoA and 5 µg (protein) HuH7 lysate were
incubated for 30 min.
CerS assay
The kinetic measurements were performed with different concentrations of alkyne-sphinganine,
50 µM nervonoyl(24:1)-CoA and 5 µg (protein) mouse wild-type liver microsomes. The assay was
incubated for 20 min at 37 °C in CerS buffer (20 mM HEPES/KOH, pH 7.4, 25 mM KCl, 250 mM
sucrose, 2 mM MgCl2, 0.34 mg/ml lipid-free BSA; Imgrund et al., 2009). For the TLC that shows the
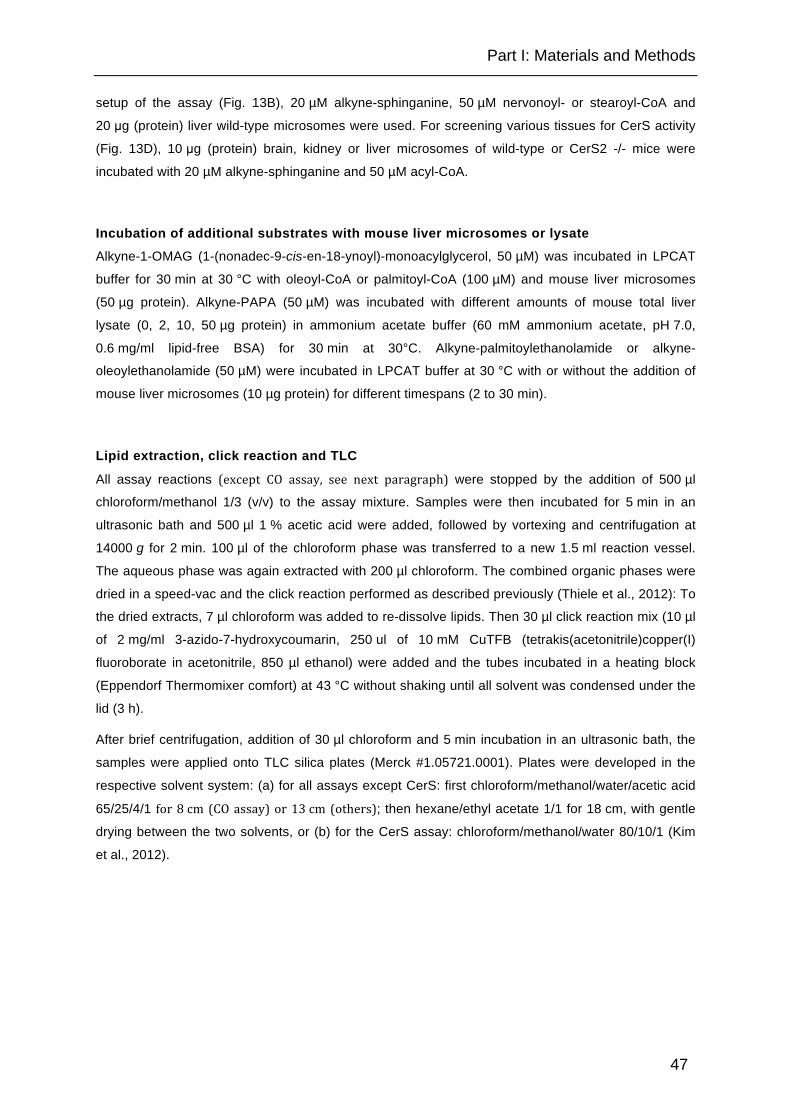
Part I: Materials and Methods
47
setup of the assay (Fig. 13B), 20 µM alkyne-sphinganine, 50 µM nervonoyl- or stearoyl-CoA and
20 µg (protein) liver wild-type microsomes were used. For screening various tissues for CerS activity
(Fig. 13D), 10 µg (protein) brain, kidney or liver microsomes of wild-type or CerS2 -/- mice were
incubated with 20 µM alkyne-sphinganine and 50 µM acyl-CoA.
Incubation of additional substrates with mouse liver microsomes or lysate
Alkyne-1-OMAG (1-(nonadec-9-cis-en-18-ynoyl)-monoacylglycerol, 50 µM) was incubated in LPCAT
buffer for 30 min at 30 °C with oleoyl-CoA or palmitoyl-CoA (100 µM) and mouse liver microsomes
(50 µg protein). Alkyne-PAPA (50 µM) was incubated with different amounts of mouse total liver
lysate (0, 2, 10, 50 µg protein) in ammonium acetate buffer (60 mM ammonium acetate, pH 7.0,
0.6 mg/ml lipid-free BSA) for 30 min at 30°C. Alkyne-palmitoylethanolamide or alkyne-
oleoylethanolamide (50 µM) were incubated in LPCAT buffer at 30 °C with or without the addition of
mouse liver microsomes (10 µg protein) for different timespans (2 to 30 min).
Lipid extraction, click reaction and TLC
All assay reactions (except CO assay, see next paragraph) were stopped by the addition of 500 µl
chloroform/methanol 1/3 (v/v) to the assay mixture. Samples were then incubated for 5 min in an
ultrasonic bath and 500 µl 1 % acetic acid were added, followed by vortexing and centrifugation at
14000 g for 2 min. 100 µl of the chloroform phase was transferred to a new 1.5 ml reaction vessel.
The aqueous phase was again extracted with 200 µl chloroform. The combined organic phases were
dried in a speed-vac and the click reaction performed as described previously (Thiele et al., 2012): To
the dried extracts, 7 µl chloroform was added to re-dissolve lipids. Then 30 µl click reaction mix (10 µl
of 2 mg/ml 3-azido-7-hydroxycoumarin, 250 ul of 10 mM CuTFB (tetrakis(acetonitrile)copper(I)
fluoroborate in acetonitrile, 850 µl ethanol) were added and the tubes incubated in a heating block
(Eppendorf Thermomixer comfort) at 43 °C without shaking until all solvent was condensed under the
lid (3 h).
After brief centrifugation, addition of 30 µl chloroform and 5 min incubation in an ultrasonic bath, the
samples were applied onto TLC silica plates (Merck #1.05721.0001). Plates were developed in the
respective solvent system: (a) for all assays except CerS: first chloroform/methanol/water/acetic acid
65/25/4/1 for 8 cm (CO assay) or 13 cm (others); then hexane/ethyl acetate 1/1 for 18 cm, with gentle
drying between the two solvents, or (b) for the CerS assay: chloroform/methanol/water 80/10/1 (Kim
et al., 2012).

Part I: Materials and Methods
48
CO assay2
Purified cholesterol oxidase from Brevibacterium sp. (Sigma #C8868) was dissolved in phosphate
buffer (50 mM KH2PO4; pH 7.5; 1 mg/ml lipid-free BSA) and stored in aliquots at -80 °C. Incubation
time, buffer composition and the amount of enzyme in the assay were optimized to ensure linearity of
the reaction rate in the kinetic studies. Alkyne-cholesterol was incubated at 25 °C with 2 ng enzyme in
glass vials containing a total volume of 100 µl phosphate buffer supplemented with 0.1 % (v/v) Triton
X-100 while shaking (1100 rpm) for 5 min. The reaction was stopped with 500 µl
choloroform/methanol 3/1 (v/v) and 500 µl 1 % acetic acid, the vials centrifuged (500 g, 5 min) and the
lower phase transferred to a reaction tube. The aqueous phase was washed with 200 µl chloroform
and the combined chloroform phases were evaporated. Lipids were redissolved in 7 µl chloroform and
reacted as above but using a triple-concentrated click reaction mix (15 µl of 44.5 mM 3-azido-7-
hydroxycoumarin, 500 µl of 10 mM CuTFB in acetonitrile, 2 ml ethanol).
Extraction efficiency experiments
Diluted solutions (0.5 µM) of alkyne-OOPA (1,2-di-(nonadec-9-cis-en-18-ynoyl)-sn-glycero-3-
phosphate), alkyne-18:0-dhCer, alkyne-PC, pPC and alkyne-‐cholesterol in ethanol were prepared
freshly, 10, 20 or 40 µl of this solution added to a plastic reaction vessel or glass vial, the solvent
evaporated and the lipids dissolved in the appropriate assay buffer (see above). After the addition of
heat-inactivated enzyme preparation the reaction mix was incubated according to the respective
assay protocol and subjected to extraction, click reaction and TLC. Quantification against alkyne-
oleate was performed as given below, using the same molar amounts of alkyne-oleate as for the
extracted lipids.
Detection and quantification Shortly before fluorescence detection, the dry TLC was soaked for 5 s in 4 % (v/v) N,N-
diisopropylethylamine in hexane and excess solvent was allowed to evaporate in a hood. The system
used for the imaging of the TLC plates and image quantification was described earlier (Thiele et al.,
2012). Briefly, standard LEDs (10 x 1 W 420 nm LEDs, Roithner Lasertechnik, Vienna, Austria),
filtered through a colored glass filter (HEBO V01, Hebo Spezialglas) were used for excitation. Images
were acquired with a Rolera MGI plus EMCCD (charge-coupled device) camera (Decon Science
Tec), equipped with a 494/20 (channel for detection of the coumarin fluorescence) and 572/28
(channel for detection and correction of background fluorescence) bandpass emission filter wheel, all
under control of GelPro analyzer (Media Cybernetics) software. Note that the high sensitivity of the
EMCCD camera (which is part of our ECL western blot detection system) is not necessary to record
the images, which typically can be seen already by visual inspection, but its large dynamic range is
advantageous for image quantification. We also use a system with a much simpler CCD camera with
2 This paragraph is cited from (Hofmann et al., 2014).
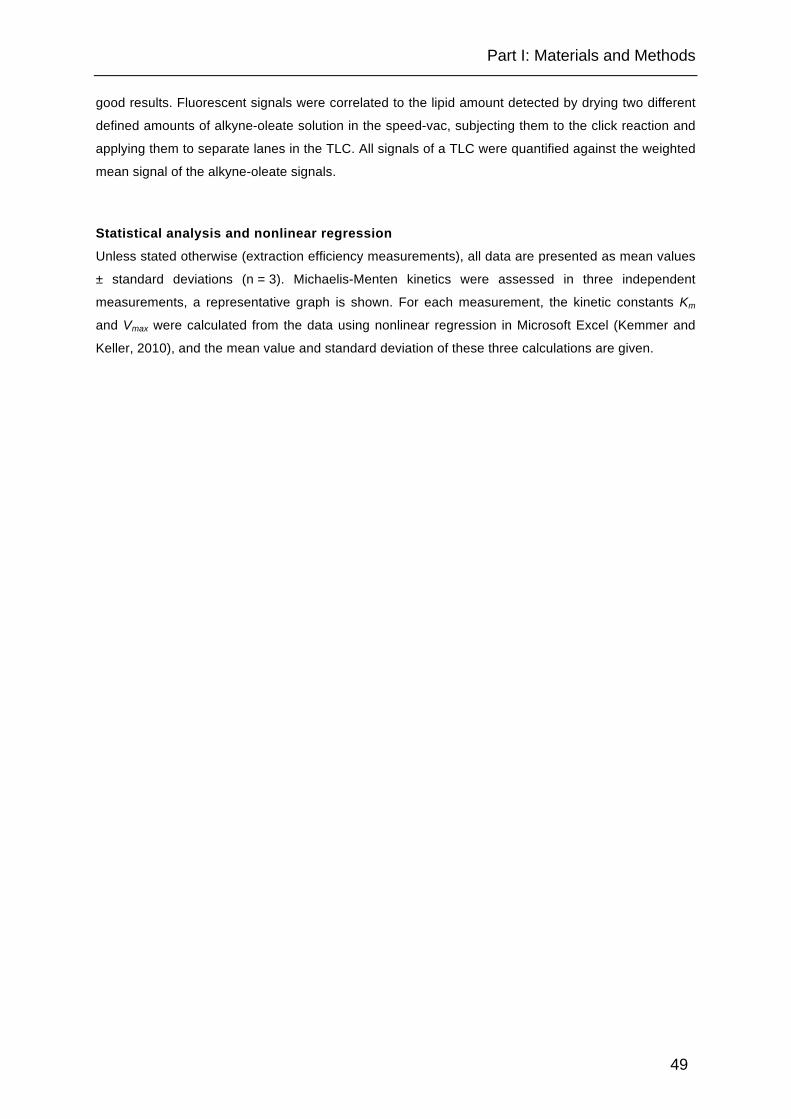
Part I: Materials and Methods
49
good results. Fluorescent signals were correlated to the lipid amount detected by drying two different
defined amounts of alkyne-oleate solution in the speed-vac, subjecting them to the click reaction and
applying them to separate lanes in the TLC. All signals of a TLC were quantified against the weighted
mean signal of the alkyne-oleate signals.
Statistical analysis and nonlinear regression
Unless stated otherwise (extraction efficiency measurements), all data are presented as mean values
± standard deviations (n = 3). Michaelis-Menten kinetics were assessed in three independent
measurements, a representative graph is shown. For each measurement, the kinetic constants Km
and Vmax were calculated from the data using nonlinear regression in Microsoft Excel (Kemmer and
Keller, 2010), and the mean value and standard deviation of these three calculations are given.
Part I: Results and Discussion
50
3.2 Results and Discussion (Part I)
3.2.1 Assay setup and method of quantification
The general workflow, as outlined in Fig. 9, consists of the enzymatic reaction using
alkyne substrate, lipid extraction and reaction of the alkyne moieties with the
fluorogenic dye 3-azido-7-hydroxycoumarin in a quantitative, copper(I)-catalyzed
cycloaddition. After separation by TLC, lipids are analyzed by fluorescence
detection.
Fig. 9: Typical workflow of the click chemistry based enzymatic assay. Alkyne lipids were used as substrates in enzymatic assays. After lipid extraction the alkyne moiety was quantitatively click-reacted with the fluorogenic dye 3-azido-7-hydroxycoumarin (symbolized as a star) to yield fluorescently labeled lipids. These were separated by TLC and analyzed by fluorescence detection.
The high sensitivity and wide linear dynamic range of this procedure regarding the
click reaction, TLC and imaging were established earlier (Thiele et al., 2012) and are
comparable to methods using [3H]-labeled lipids. For an accurate quantification of
the assay products, a reliable and near complete recovery is necessary. To
determine the efficiency of the lipid extraction protocol, defined amounts of alkyne
lipids that represent products of the LPAAT, LPCAT or CerS assay were subjected to
the standard procedures (in vitro enzymatic reaction, extraction, click reaction,
detection), but using heat-inactivated enzyme preparations. The extraction
procedure was evaluated by quantification of fluorescent signal against that of
defined amounts of alkyne-oleate that had not been subjected to assay incubation
and extraction.
The recovery rate was measured for every lipid under conditions appropriate for the
respective assay (vessel material, temperature, duration of incubation, extraction
Part I: Results and Discussion
51
protocol). High recovery rates were determined for all tested lipids (Fig. 10), with
good to very good reproducibility. This demonstrates the applicability of the
extraction protocols for the assays performed in this study, and of the quantification
method. Thus, an exact correlation of fluorescent signal to the amount of lipid
produced in the assay is achieved.
Fig. 10: Lipid recovery. Lipid recovery was determined for every enzymatic assay by subjecting defined amounts of the product lipid to the standard procedures (in vitro enzymatic reaction in plastic or glass vials, extraction, click reaction, detection) of the respective assay, but using heat-‐inactivated enzyme preparations. The recovery was evaluated by quantification of the fluorescent signal against that of defined amounts of alkyne lipid that had not been subjected to assay incubation and extraction. Extracted alkyne-‐phospholipids and alkyne-‐dhCer (dark gray columns) were quantified against alkyne-‐oleate; extracted alkyne-‐cholesterol (light gray column, in lieu of the unavailable alkyne-‐cholestenone) was quantified against non-‐extracted alkyne-‐cholesterol. Columns represent weighted means of three different lipid concentrations, error bars refer to weighted standard deviations.
3.2.2 LPAAT assay with alkyne-OLPA or alkyne-oleoyl-CoA
In Escherichia coli, the conversion of lysophosphatidic acid (LPA) to phosphatidic
acid (PA) is catalyzed by the gene product of plsC, 1-acyl-sn-glycero-3-phosphate
acyltransferase (Coleman, 1992). Its activity has been assessed with [32P]-LPA
(Coleman, 1990). To the best of our knowledge, kinetic constants have not been
determined for this enzyme.

Part I: Results and Discussion
52
We established a LPAAT assay with alkyne-OLPA (Fig. 11A), the labeled analogue
of sn-1-oleoyl-lysophosphatidic acid, using E. coli microsomes (Fig. 11B) and
determined the constants Vmax and Km for this substrate (Fig. 11C and Table 1).
Fig. 11: LPAAT assay using alkyne-OLPA or alkyne-oleoyl-CoA.
Alkyne-OLPA (structure in panel A) or alkyne-oleoyl-CoA were used as labeled substrates in a LPAAT assay with E. coli microsomes. B: Fluorescent TLC image of the LPAAT assay with alkyne-OLPA. Product PA was identified using co-migrating synthetic alkyne-OOPA. For assay details, see Materials and Methods. C: Michaelis-Menten kinetics measured for alkyne-OLPA (squares) and PLPA (triangles). Oleoyl-CoA was the acyl chain donor for alkyne-OLPA, whereas alkyne-oleoyl-CoA was used to detect enzymatic activity towards PLPA. Line graphs show the reaction rates v calculated with the Michaelis-Menten equation using the values for Vmax and Km obtained by nonlinear regression fitting. Data are mean ± standard deviation of triplicate determinations. D: Acyl-CoA specificity of the E. coli LPAAT using alkyne-OLPA. The monounsaturated 18:1-CoA is favored over the saturated acyl-CoAs (16:0 and 18:0).
Conversely, by applying alkyne-oleoyl-CoA as an acyl chain donor, we measured
Vmax and Km for PLPA. The apparent Km for alkyne-OLPA (0.53 ± 0.18 µM) was
significantly lower than for PLPA (3.64 ± 0.24 µM). Also, Vmax was apparently

Part I: Results and Discussion
53
increased for alkyne-OLPA compared to PLPA, but the differences did not reach
statistical significance due to large variations between different enzyme preparations.
In other organisms, Km had previously been determined for LPAAT enzymes using
radio-labeled substrates. A similar acyl chain specificity in the acceptor was found in
Spinacia oleracea (Hares and Frentzen, 1987): With oleoyl-CoA as the donor, a Km
of 5.3 µM was measured for [14C]-OLPA, and of 3.0 µM for [14C]-PLPA. For the
human LPAAT-α, a Km of 6.49 µM towards OLPA with [14C]-palmitoyl-CoA as the
acyl chain donor (Yamashita et al., 2007), and of 6.0 µM with [3H]-oleoyl-CoA
(Agarwal et al., 2011), respectively was reported. For human LPAAT-β Km values in
the same range were measured towards OLPA with the acyl-chain donor oleoyl-CoA
(2.0 µM (Hollenback et al., 2006), and 8.29 µM (Agarwal et al., 2011)). For both
human isoforms, a preference of OLPA over PLPA as the acceptor was detected as
well (Hollenback et al., 2006; Agarwal et al., 2011). Compared to palmitate and
stearate, oleate is preferred by the E. coli enzyme also as the donor acyl-CoA (Fig.
11D) for the incorporation at the sn-2 position, in accordance with previous findings
(Weier et al., 1998).
Our results demonstrate that alkyne-OLPA and alkyne-oleoyl-CoA are good
substrates for the E. coli LPAAT. They indicate that the bacterial enzyme may have a
lower Km for lysophosphatidic acids (especially OLPA) than the plant or mammalian
enzymes investigated so far.
The two alkyne substrates described above represent the two strategies that are
available for an acyltransferase assay with alkyne lipids, i.e. labeling of the acyl
chain acceptor or the acyl chain donor. While the latter is the more general
approach, enabling the investigation of all acyltransferase reactions with a relatively
small set of labeled alkyne-acyl-CoAs, it suffers from the limited storage stability of
acyl-CoAs and the frequent observation of significant amounts of labeled side
products arising from both enzymatic and non-enzymatic conversion of the acyl-
CoAs. In our experiments, the use of alkyne-oleoyl-CoA led to a few fluorescent
signals derived from side reactions of the reactive compound including the hydrolysis
to oleate. The labeled acceptors on the other hand expressed high specificity for the
enzymatic reactions of interest. They essentially gave one or two strong product
signals besides the fluorescent educt (Figs. 11B, 12B, 13B), which might be

Part I: Results and Discussion
54
beneficial for automated image analysis. In addition, alkyne labeled acyl acceptors
show better stability for long-term storage.
3.2.3 LPCAT assay with alkyne-OLPC or PLpPC
Lysophosphatidylcholine (LPC) is converted to PC by lysophosphatidylcholine
acyltransferases. In mammals, four isoforms (LPCAT1-4) are known. HuH7 cells
express LPCAT1 and LPCAT3, but not LPCAT2 (Zhao et al., 2008; Moessinger et
al., 2011). We synthesized two alkyne-labeled LPC species, i. e. side chain labeled
alkyne-OLPC and head-group labeled PLpPC (Fig. 12A). Note that, since PLpPC is
derived by enzymatic head group exchange from egg yolk PC, it containes a mixture
of fatty acids at sn-1, dominated by palmitate (Schreiner et al., 2006).
Fig. 12B shows the application of the two substrates in a LPCAT assay on HuH7
lysate using oleoyl-CoA as the acyl chain donor. The Km value we measured (Fig.
12C, Table 1) for alkyne-OLPC (2.46 ± 1.62 µM) was very similar to that determined
for palmitoyl-LPC with [14C]-palmitoyl-CoA for murine recombinant LPCAT1 (2.3 µM,
Nakanishi et al., 2006). PLpPC had a higher apparent Km (5.46 ± 2.23 µM), which
might reflect a somewhat stronger effect of the alkyne label when incorporated in the
headgroup of a phospholipid rather than at the terminus of an acyl chain. However,
the differences between the Km values for alkyne-OLPC and PLpPC were not
statistically significant and the differential acyl chains at the sn-1 positions have to be
taken into account. In addition, we observed a significant difference (P < 0.05) in
activity (Vmax) for the two substrates, 0.51 ± 0.08 nmol/(mg*min) for alkyne-OLPC
compared to 0.30 ± 0.07 nmol/(mg*min) for PLpPC. On the basis of these results,
alkyne-OLPC may be considered as the substrate of first choice for enzymatic
assays compared to PLpPC. Nevertheless, the latter also displayed near to natural
kinetic constants and allows for the direct combination of enzyme kinetics with
microscopic imaging after labeling with propargylcholine (Jao et al., 2009).
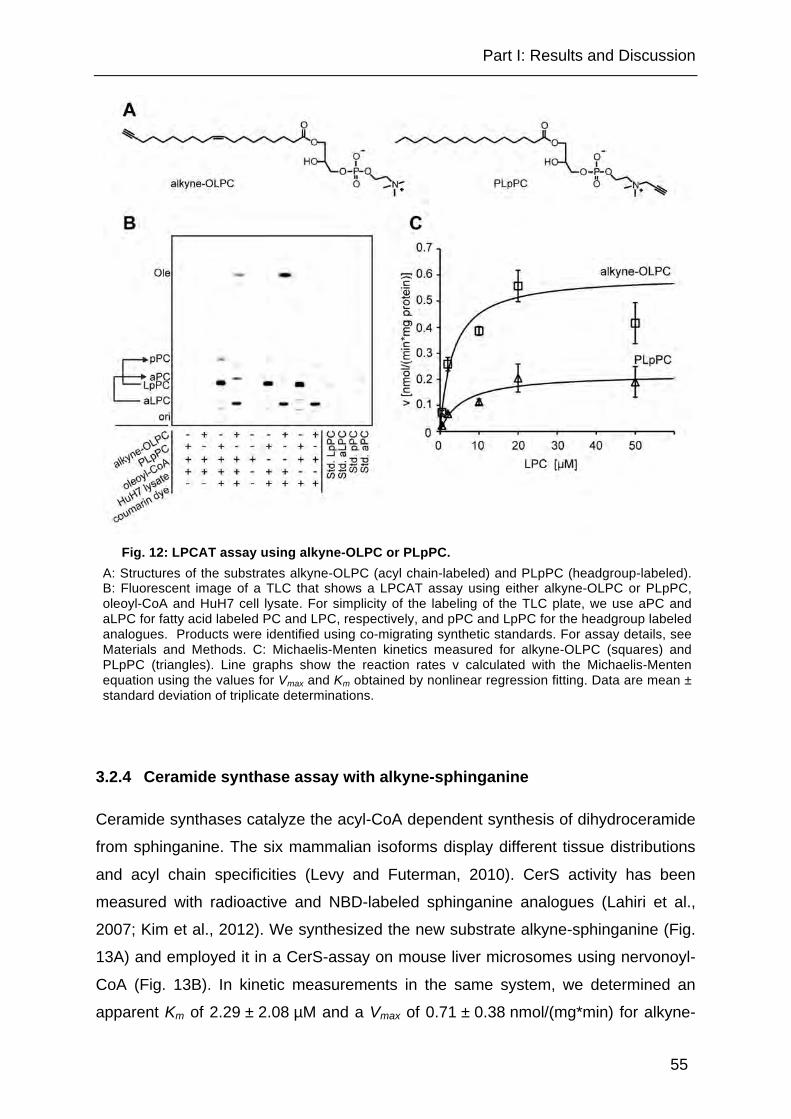
Part I: Results and Discussion
55
Fig. 12: LPCAT assay using alkyne-OLPC or PLpPC.
A: Structures of the substrates alkyne-OLPC (acyl chain-labeled) and PLpPC (headgroup-labeled). B: Fluorescent image of a TLC that shows a LPCAT assay using either alkyne-OLPC or PLpPC, oleoyl-CoA and HuH7 cell lysate. For simplicity of the labeling of the TLC plate, we use aPC and aLPC for fatty acid labeled PC and LPC, respectively, and pPC and LpPC for the headgroup labeled analogues. Products were identified using co-migrating synthetic standards. For assay details, see Materials and Methods. C: Michaelis-Menten kinetics measured for alkyne-OLPC (squares) and PLpPC (triangles). Line graphs show the reaction rates v calculated with the Michaelis-Menten equation using the values for Vmax and Km obtained by nonlinear regression fitting. Data are mean ± standard deviation of triplicate determinations.
3.2.4 Ceramide synthase assay with alkyne-sphinganine
Ceramide synthases catalyze the acyl-CoA dependent synthesis of dihydroceramide
from sphinganine. The six mammalian isoforms display different tissue distributions
and acyl chain specificities (Levy and Futerman, 2010). CerS activity has been
measured with radioactive and NBD-labeled sphinganine analogues (Lahiri et al.,
2007; Kim et al., 2012). We synthesized the new substrate alkyne-sphinganine (Fig.
13A) and employed it in a CerS-assay on mouse liver microsomes using nervonoyl-
CoA (Fig. 13B). In kinetic measurements in the same system, we determined an
apparent Km of 2.29 ± 2.08 µM and a Vmax of 0.71 ± 0.38 nmol/(mg*min) for alkyne-

Part I: Results and Discussion
56
sphinganine (Fig. 13C, Table 1). In the liver, CerS2 is the dominant isoform with
activity towards long-chain acyl-CoAs; hence the activity we measured in this assay
may almost solely be attributed to CerS2 (Laviad et al., 2008). The Km value is in
agreement with recent studies: using tritiated sphinganine, Lahiri and colleagues
(Lahiri et al., 2007) reported Km values in the range of 2 to 5 µM for all six (murine or
human) CerS isoforms, even for those which use multiple acyl-CoAs. That study
reported a Km of 4.8 ± 0.4 µM for human Cers2 with lignoceroyl (24:0)-CoA. Kim and
colleagues (Kim et al., 2012) developed a fluorescent assay with NBD-sphinganine
and nervonoyl-CoA and found Km to be comparable to natural sphinganine
(3.61 ± 1.86 µM vs. 3.05 ± 0.81 µM, respectively). However, Vmax was elevated for
the NBD derivative.
CerS2 is expressed in various tissues besides the liver, with high mRNA levels in the
kidney and moderate levels in the brain (Levy and Futerman, 2010). Imgrund and
colleagues (Imgrund et al., 2009) created a CerS2-deficient mouse and measured
the CerS activity towards tritiated sphinganine and various acyl-CoAs (16:0, 18:0,
20:0, 22:0, 24:1) in brain and liver microsomes. To demonstrate that alkyne-
sphinganine can be used as a convenient alternative substrate for such applications,
we performed a similar small screen with brain, liver and kidney microsomes and
several acyl-CoAs (16:0, 18:0, 18:1 and 24:1). Fig. 13D shows fluorescent images of
the TLC plates of this pilot study. Like Imgrund and colleagues (Imgrund et al., 2009)
we observed a strong activity towards 24:1-CoA in the wild-type liver and a weak one
in the brain. We also measured a strong 24:1-activity in kidney microsomes. For all
tissues, 24:1-CoA was not converted to dhCer in the CerS2-deficient samples. For
the acyl-CoAs of shorter chain length, the CerS activity was similar for wild-type and
-/- mice, reflecting that it was not derived from CerS2, but other isoforms. We
detected activity towards 16:0-CoA in kidney (moderate) and liver (weak), but not in
brain. Weak activity was also found for 18:0-CoA in brain and liver, both in wild-type
and -/- mice. 18:1-CoA was converted to dhCer in kidney and very little in liver. Since
we show here that alkyne-sphinganine is a useful substrate to screen for CerS
activity in tissue samples, more detailed quantitative investigations can be carried
out in the future.
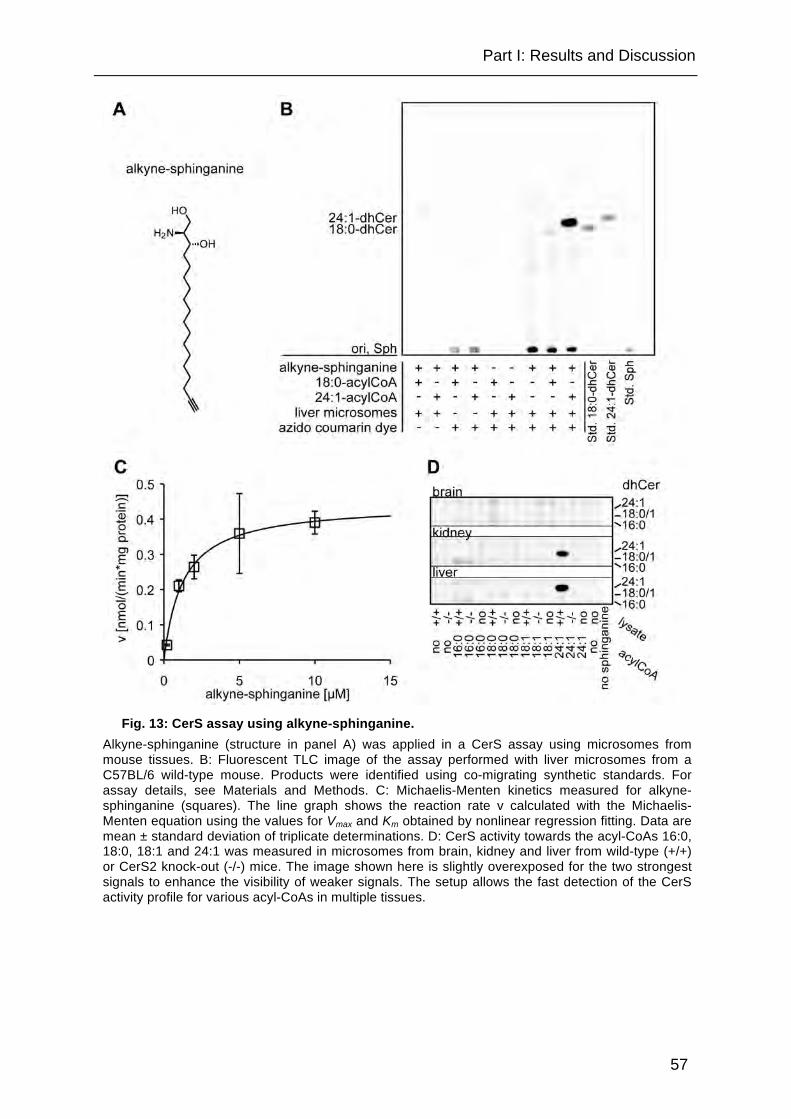
Part I: Results and Discussion
57
Fig. 13: CerS assay using alkyne-sphinganine.
Alkyne-sphinganine (structure in panel A) was applied in a CerS assay using microsomes from mouse tissues. B: Fluorescent TLC image of the assay performed with liver microsomes from a C57BL/6 wild-type mouse. Products were identified using co-migrating synthetic standards. For assay details, see Materials and Methods. C: Michaelis-Menten kinetics measured for alkyne-sphinganine (squares). The line graph shows the reaction rate v calculated with the Michaelis-Menten equation using the values for Vmax and Km obtained by nonlinear regression fitting. Data are mean ± standard deviation of triplicate determinations. D: CerS activity towards the acyl-CoAs 16:0, 18:0, 18:1 and 24:1 was measured in microsomes from brain, kidney and liver from wild-type (+/+) or CerS2 knock-out (-/-) mice. The image shown here is slightly overexposed for the two strongest signals to enhance the visibility of weaker signals. The setup allows the fast detection of the CerS activity profile for various acyl-CoAs in multiple tissues.
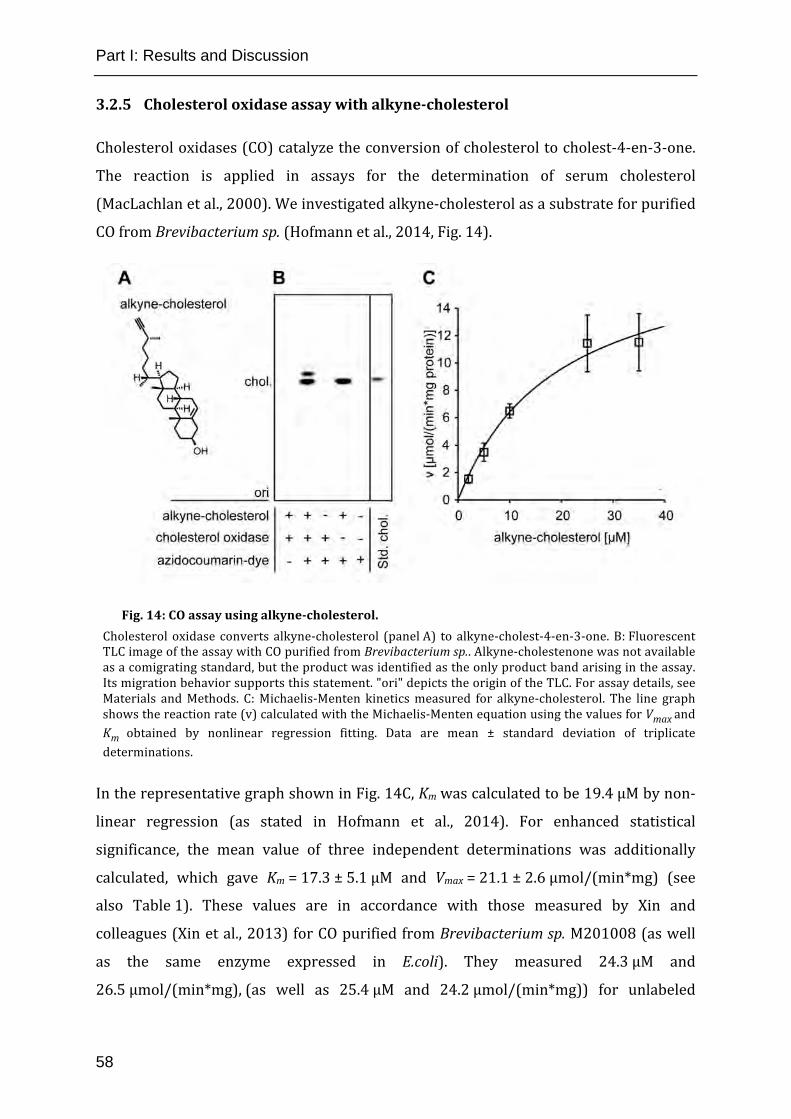
Part I: Results and Discussion
58
3.2.5 Cholesterol oxidase assay with alkyne-‐cholesterol
Cholesterol oxidases (CO) catalyze the conversion of cholesterol to cholest-‐4-‐en-‐3-‐one.
The reaction is applied in assays for the determination of serum cholesterol
(MacLachlan et al., 2000). We investigated alkyne-‐cholesterol as a substrate for purified
CO from Brevibacterium sp. (Hofmann et al., 2014, Fig. 14).
Fig. 14: CO assay using alkyne-‐cholesterol. Cholesterol oxidase converts alkyne-‐cholesterol (panel A) to alkyne-‐cholest-‐4-‐en-‐3-‐one. B: Fluorescent TLC image of the assay with CO purified from Brevibacterium sp.. Alkyne-‐cholestenone was not available as a comigrating standard, but the product was identified as the only product band arising in the assay. Its migration behavior supports this statement. "ori" depicts the origin of the TLC. For assay details, see Materials and Methods. C: Michaelis-‐Menten kinetics measured for alkyne-‐cholesterol. The line graph shows the reaction rate (v) calculated with the Michaelis-‐Menten equation using the values for Vmax and Km obtained by nonlinear regression fitting. Data are mean ± standard deviation of triplicate determinations.
In the representative graph shown in Fig. 14C, Km was calculated to be 19.4 μM by non-‐
linear regression (as stated in Hofmann et al., 2014). For enhanced statistical
significance, the mean value of three independent determinations was additionally
calculated, which gave Km = 17.3 ± 5.1 μM and Vmax = 21.1 ± 2.6 μmol/(min*mg) (see
also Table 1). These values are in accordance with those measured by Xin and
colleagues (Xin et al., 2013) for CO purified from Brevibacterium sp. M201008 (as well
as the same enzyme expressed in E.coli). They measured 24.3 μM and
26.5 μmol/(min*mg), (as well as 25.4 μM and 24.2 μmol/(min*mg)) for unlabeled

Part I: Results and Discussion
59
cholesterol with an indirect read-‐out from the conversion of a fluorescent substrate by
hydrogen peroxide produced in the enzymatic reaction. Therefore, the affinity of CO to
alkyne-‐cholesterol appears to be unchanged compared to the natural substrate.
Table 1: Kinetic constants obtained by nonlinear regression analysis.
assay substrate Km (µM)a Vmax (nmol/(min*mg))a
LPAAT alkyne-OLPA 0.53 ± 0.18 b 6.83 ± 4.39 c
LPAAT PLPA 3.64 ± 0.24 b 2.05 ± 0.21 c
LPCAT alkyne-OLPC 2.46 ± 1.62 d 0.51 ± 0.08 e
LPCAT PLpPC 5.46 ± 2.23 d 0.30 ± 0.07 e
CerS alkyne-sphinganine 2.29 ± 2.08 0.71 ± 0.38
CO alkyne-‐cholesterol 17.3 ± 5.1 21.1*103 ± 2.6*103 a Mean values and standard deviations from three independent triplicate determinations. Enzyme preparations, acyl chain donors and further assay conditions used are given in the text.
b P < 0.0001, c P = 0.1327, d P = 0.1325, e P = 0.0267 (These P-values refer to the comparison of different substrates in the same enzymatic assay; two-tailed P-values from Student’s unpaired t-test).
3.2.6 Application of the method in assays for other lipid modifying enzymes
We utilized mouse liver microsomes or mouse liver lysate to demonstrate the
principal feasibility of assays with four additional examples of alkyne-labeled
substrates (Fig. 15). All substrates were converted by one or more enzymes in the
liver fractions to alkyne-labeled products.
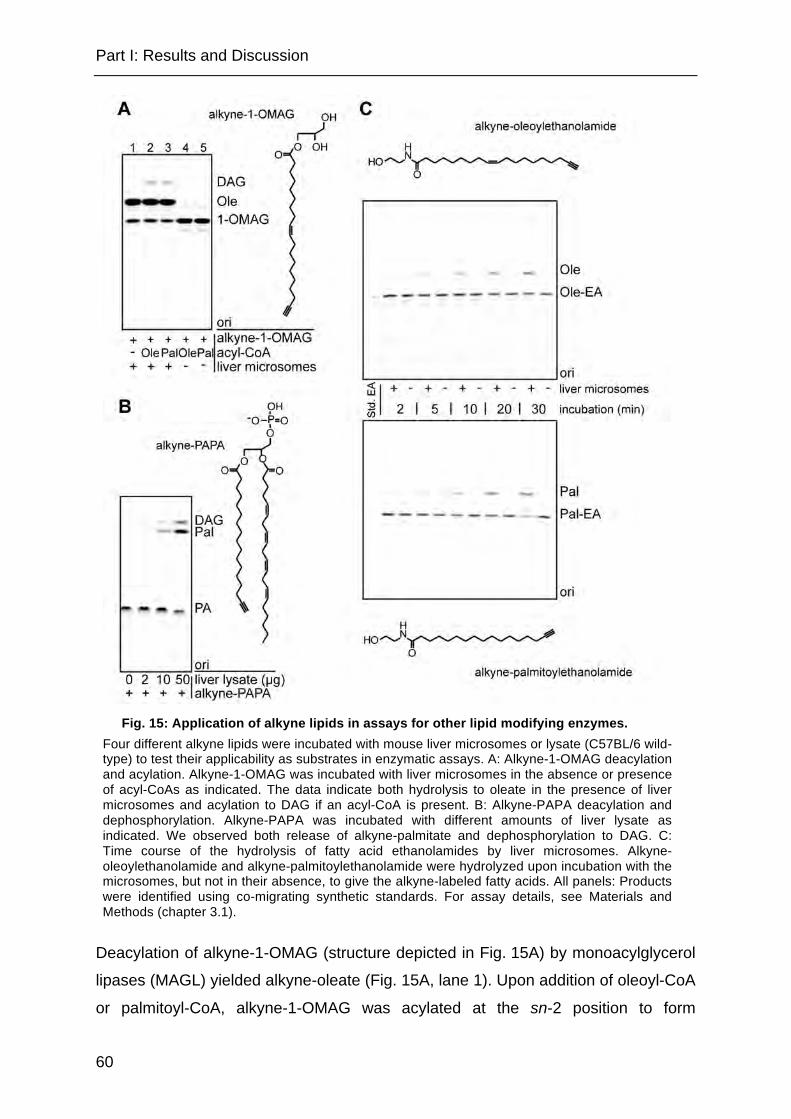
Part I: Results and Discussion
60
Fig. 15: Application of alkyne lipids in assays for other lipid modifying enzymes.
Four different alkyne lipids were incubated with mouse liver microsomes or lysate (C57BL/6 wild-type) to test their applicability as substrates in enzymatic assays. A: Alkyne-1-OMAG deacylation and acylation. Alkyne-1-OMAG was incubated with liver microsomes in the absence or presence of acyl-CoAs as indicated. The data indicate both hydrolysis to oleate in the presence of liver microsomes and acylation to DAG if an acyl-CoA is present. B: Alkyne-PAPA deacylation and dephosphorylation. Alkyne-PAPA was incubated with different amounts of liver lysate as indicated. We observed both release of alkyne-palmitate and dephosphorylation to DAG. C: Time course of the hydrolysis of fatty acid ethanolamides by liver microsomes. Alkyne-oleoylethanolamide and alkyne-palmitoylethanolamide were hydrolyzed upon incubation with the microsomes, but not in their absence, to give the alkyne-labeled fatty acids. All panels: Products were identified using co-migrating synthetic standards. For assay details, see Materials and Methods (chapter 3.1).
Deacylation of alkyne-1-OMAG (structure depicted in Fig. 15A) by monoacylglycerol
lipases (MAGL) yielded alkyne-oleate (Fig. 15A, lane 1). Upon addition of oleoyl-CoA
or palmitoyl-CoA, alkyne-1-OMAG was acylated at the sn-2 position to form

Part I: Results and Discussion
61
diacylglycerol (DAG, Fig. 15A, lane 2+3) by monoacylglycerol acyltransferase
(MGAT) activities, presumably the murine MGAT1 and lysophosphatidylglycerol
acyltransferase 1 (Hiramine et al., 2010).
Alkyne-PAPA (structure depicted in Fig. 15B) was converted to DAG in the presence
of liver lysate (Fig. 15B), presumably by phosphatidate phosphatases (Donkor et al.,
2007). In parallel, we observed the release of alkyne-palmitate from the sn-1
position, either by a phospholipase 1 activity acting on the labeled PA, or by a DAG-
lipase (DAGL) activity acting on the released DAG.
N-oleoylethanolamide and N-palmitoylethanolamide are bioactive lipids that are
cleaved by the enzymes fatty acid amide hydrolase (FAAH, Ueda et al., 2000) and
N-acylethanolamine-hydrolyzing acid amidase (NAAA, Tsuboi et al., 2007) yielding
the corresponding fatty acids. Both the lipids and the enzymes have gained
increasing interest as therapeutic targets for the control of pain, inflammation or food
intake (Thabuis et al., 2008; Petrosino et al., 2010). We were able to survey the
hydrolysis of the fatty acid amides alkyne-oleoylethanolamide and alkyne-
palmitoylethanolamide in a time-course experiment (Fig. 15C) upon incubation with
mouse liver microsomes. Several enzymatic assays are reported to follow this
reaction (see (Ueda et al., 2000) for a review and (Huang et al., 2007)). We will
conduct further studies concerning the kinetic properties of these alkyne labeled
substrates, which would expand the existing techniques by a very convenient and
direct assay procedure.
The various substrates discussed above therefore demonstrate how the scope of the
assay can be extended to more acyltransferases (MGAT), lipases (MAGL,
phospholipases A1 and A2) and other hydrolases (PA phosphatase, FAAH). This
general applicability will prove useful for the kinetic characterization of many
enzymes in lipid metabolism.
3.2.7 Scope and limitations of the method
All alkyne lipids that we tested in this pilot study were used as substrates by lipid
modifying enzymes. No substantial shift in affinity (Km) of the enzymes compared to
the natural substrates was detected in our kinetic studies. We thus introduce
Part I: Results and Discussion
62
enzymatic assays with alkyne lipids as a reliable and convenient alternative to
fluorescent or radioactive assays.
As with the latter two methods, the TLC separation in our assay does not achieve
species resolution of the lipids. This can however be overcome by a subsequent
mass-spectrometric analysis (compare (Thiele et al., 2012)). Depending on the
location of the alkyne label in the molecule, not all reactions can be followed with
every alkyne lipid. β-oxidation of fatty acids leads to the loss of the label (Thiele et
al., 2012), as does the headgroup cleavage of pPC to PA by phospholipase D.
Our studies suggest that the alkyne label does generally not interfere with the affinity
of enzymes to the substrates, especially if the alkyne label is attached to the
terminus of the alkyl chain. Such fatty acids of different length and unsaturation are
synthetically available (Milne et al., 2010; Thiele et al., 2012) and can serve as a
basis of a versatile toolbox of tailor-made lipid substrates with the acyl chain(s) of
choice at defined sn-positions, including phospholipids, lysophospholipids, acyl-
CoAs and acylglycerols, using standard chemical and enzymatic procedures. Similar
to this strategy, alkyne-sphingolipids can be synthesized from alkyne-sphinganine.
Hence, we expect alkyne lipids to become more and more commercially available in
the next years, both as substrates for enzymatic assays as well as standards for
identification after TLC separation. The migration behavior of lipids coupled to the
coumarin dye is shifted, but, in general, the separation is possible with the same
solvent mixes as for radio-labeled lipids or slightly adapted versions thereof and the
retention factors of the substances usually are in the regular order. The adaptation of
radiolabeled assays to the use of alkyne lipid substrates should therefore be neither
costly nor overly time-consuming.
Alkyne lipids are promising substrates for the use in in vitro enzymatic assays, as
they are inexpensive, versatile, convenient and, as we show here for the first time,
display the kinetic characteristics of the natural substrates.
Part II
63
4 Highly sensitive alkyne lipid imaging (Part II)

Part II: Materials and Methods
64
4.1 Materials and Methods (Part II)
4.1.1 Materials
4.1.1.1 Alkyne lipids and azide detection reagents
The alkyne lipids used in this study and the azide reporter ASBDP (8-(5-azidopentyl)-4,4-difluor-
1,3,5,7-tetramethyl-4-bora-3a,4a-s-indacene-2,6-disulfonic acid disodium salt) were available in the
lab (Thiele et al., 2012; Hofmann et al., 2014). AP3Btn (# 762024) and azido-TMR (# 760757) were
obtained from Sigma Aldrich. Like AP3Btn, the azide detection reagents AP6Btn, AP10Btn and
APpic2Btn contained polyethylene glycol (PEG) moieties as linkers between the azide and the biotin
reporter. They were synthesized by the formation of an amide bond between the azido-PEG-amine
linker and CDI-activated biotin (Vundyala et al., 2008). Molecular structures are displayed in Fig. 16.
Fig. 16: Alkyne lipids and azide detection reagents for microscopy. Structures of A: Alkyne lipids and B: azide detection reagents used in the microscopy study (chapter 4). Abbreviations are explained in the main text.
AP6Btn and AP10Btn
In a 50 ml roundbottom flask, biotin (122 mg, 0.5 mmol, 1 eq) was dissolved under Ar in 3 ml dry DMF
at 80 °C. Then CDI was added (89 mg, 0.55 mmol, 1 eq) and the mixture stirred at RT for 4 h. A
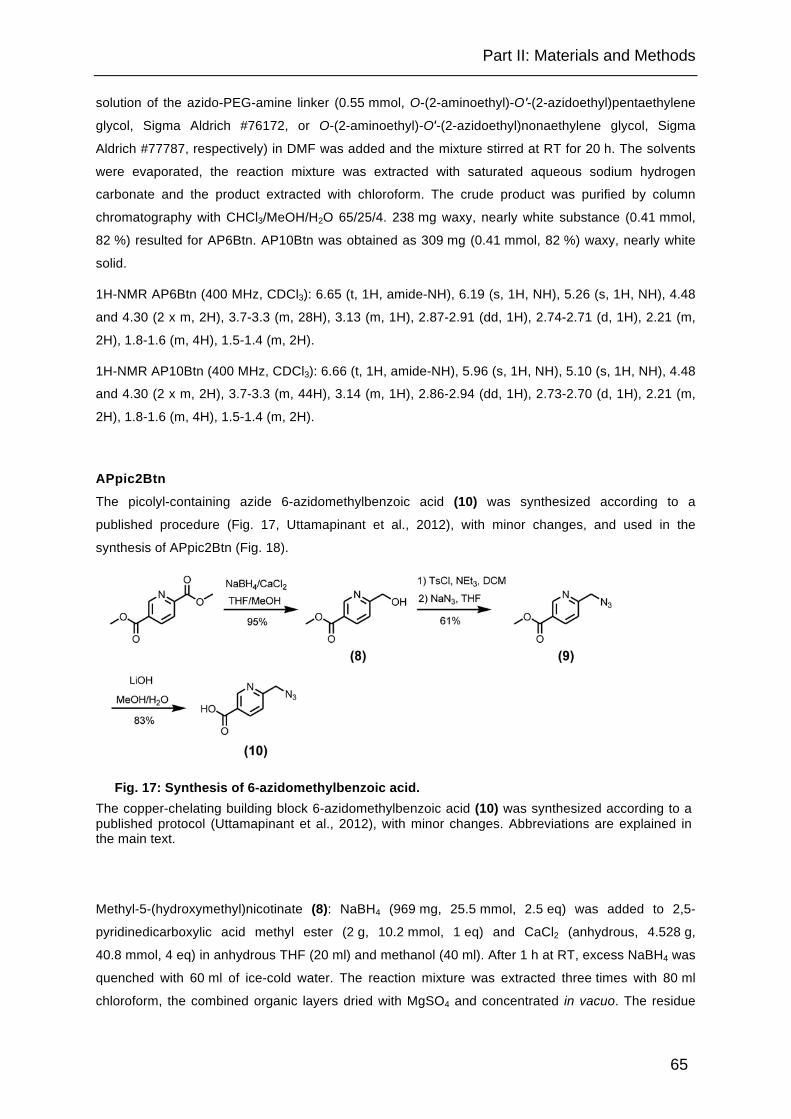
Part II: Materials and Methods
65
solution of the azido-PEG-amine linker (0.55 mmol, O-(2-aminoethyl)-O′-(2-azidoethyl)pentaethylene
glycol, Sigma Aldrich #76172, or O-(2-aminoethyl)-O′-(2-azidoethyl)nonaethylene glycol, Sigma
Aldrich #77787, respectively) in DMF was added and the mixture stirred at RT for 20 h. The solvents
were evaporated, the reaction mixture was extracted with saturated aqueous sodium hydrogen
carbonate and the product extracted with chloroform. The crude product was purified by column
chromatography with CHCl3/MeOH/H2O 65/25/4. 238 mg waxy, nearly white substance (0.41 mmol,
82 %) resulted for AP6Btn. AP10Btn was obtained as 309 mg (0.41 mmol, 82 %) waxy, nearly white
solid.
1H-NMR AP6Btn (400 MHz, CDCl3): 6.65 (t, 1H, amide-NH), 6.19 (s, 1H, NH), 5.26 (s, 1H, NH), 4.48
and 4.30 (2 x m, 2H), 3.7-3.3 (m, 28H), 3.13 (m, 1H), 2.87-2.91 (dd, 1H), 2.74-2.71 (d, 1H), 2.21 (m,
2H), 1.8-1.6 (m, 4H), 1.5-1.4 (m, 2H).
1H-NMR AP10Btn (400 MHz, CDCl3): 6.66 (t, 1H, amide-NH), 5.96 (s, 1H, NH), 5.10 (s, 1H, NH), 4.48
and 4.30 (2 x m, 2H), 3.7-3.3 (m, 44H), 3.14 (m, 1H), 2.86-2.94 (dd, 1H), 2.73-2.70 (d, 1H), 2.21 (m,
2H), 1.8-1.6 (m, 4H), 1.5-1.4 (m, 2H).
APpic2Btn
The picolyl-containing azide 6-azidomethylbenzoic acid (10) was synthesized according to a
published procedure (Fig. 17, Uttamapinant et al., 2012), with minor changes, and used in the
synthesis of APpic2Btn (Fig. 18).
Fig. 17: Synthesis of 6-azidomethylbenzoic acid. The copper-chelating building block 6-azidomethylbenzoic acid (10) was synthesized according to a published protocol (Uttamapinant et al., 2012), with minor changes. Abbreviations are explained in the main text.
Methyl-5-(hydroxymethyl)nicotinate (8): NaBH4 (969 mg, 25.5 mmol, 2.5 eq) was added to 2,5-
pyridinedicarboxylic acid methyl ester (2 g, 10.2 mmol, 1 eq) and CaCl2 (anhydrous, 4.528 g,
40.8 mmol, 4 eq) in anhydrous THF (20 ml) and methanol (40 ml). After 1 h at RT, excess NaBH4 was
quenched with 60 ml of ice-cold water. The reaction mixture was extracted three times with 80 ml
chloroform, the combined organic layers dried with MgSO4 and concentrated in vacuo. The residue
Part II: Materials and Methods
66
was purified by column chromatography with CHCl3/MeOH 10/1 supplemented with 0.5 %
triethylamine to yield 1.6 g white solid (8) (95 %).
1H-NMR (400 MHz, CDCl3): 9.16 (d, 1H), 8.33 (dd, 1H), 7.41 (d, 1H), 4.85 (s, 2H), 3.95 (s, 3H), 3.1
(broad, 1H, OH).
Methyl-5-(azidomethyl)nicotinate (9): To a solution of (8) (600 mg, 3.6 mmol, 1 eq) in DCM (80 ml)
was added p-toluenesulfonyl chloride (TsCl, 1.04 g, 5.4 mmol, 1.5 eq) and triethylamine (2.5 ml,
18 mmol, 5 eq). The mixture was stirred for 2 h, DCM was removed in vacuo, and the residue
dissolved in THF (40 ml), and NaN3 was added (2.4 g, 36 mmol, 10 eq). The reaction was stirred for
three days at RT, after which ethyl acetate and water were added. The aqueous layer was extracted
with ethyl acetate three times. The combined organic layers were washed with brine, dried over
Na2SO4, and concentrated in vacuo, and the residue purified by silica chromatography (hexanes/ethyl
acetate 4/1 to 1/1) to afford 427 mg (9) (61 %) as a white waxy solid, retention factor Rf (in
hexanes/ethyl acetate 4/1) = 0.2.
1H-NMR (400 MHz, CDCl3): 9.17 (d, 1H), 8.31 (dd, 1H), 7.45 (d, 1H), 4.56 (s, 2H), 3.94 (s, 3H).
6-azidomethylnicotinic acid (10): To methyl-5-(azidomethyl)nicotinate (9) (427 mg, 2.22 mmol, 1 eq) in
methanol (10 ml) was added a solution of LiOH in water (1.0 M, 7 ml, 7 mmol, 3.16 eq) and the
mixture was stirred for 30 min and then neutralized with acetic acid. The concentrated crude product
was loaded onto a silica column equilibrated with ethyl acetate supplemented with 1 % acetic acid
and eluted with the same solvent to afford (10) as a yellow solid (326 mg, 1.84 mmol, 83 %).
1H-NMR (400 MHz, CD3OD): 9.10 (dd, 1H), 8.38 (dd, 1H), 7.58 (dd, 1H), 4.58 (s, 2H).
Mono-protection of diamino-3,6-dioxaoctane (Favre et al., 2012): Diamino-3,6-dioxaoctane (5.92 g,
5.92 ml, 40 mmol) was dissolved in DCM (400 ml), cooled to 0 ºC and di-tert-butyl dicarbonate
(Boc2O, 1.31 g, 6 mmol, 0.15 eq) was added. The mixture was stirred for 5 h, warmed to RT and
stirred for another 16 h. The organic phase was washed with water until complete removal of the
diamine educt. After drying (MgSO4) and concentration under vacuum, pure 1-Boc-amino-8-amino-
3,6-dioxaoctane (11) (804 mg, 3.2 mmol, 54 % regarding Boc2O) was obtained.
1H-NMR (400 MHz, CDCl3): 3.5 and 3.6 (m, 8H), 5.1 (br s, 1H), 3.30 (br, 2H), 2.85 (t, 2H), 1.42 (s,
9H).
Coupling of (11) to biotin (Btn-PEG2-NHBoc, (12)): Biotin (122 mg, 0.5 mmol) was dissolved under Ar
in 3 ml DMF at 80 ºC. Then CDI was added (214 mg, 1.32 mmol) and the mixture stirred at RT for 4 h.
To this was added a solution of (11) (124 mg, 0.5 mmol) in 1 ml DMF and the mixture stirred at RT for

Part II: Materials and Methods
67
16 h. The solvent was removed in vacuo and the residue purified by silica gel chromatography
(chloroform/methanol/water 65/25/4) to yield 174 mg (12) (0.38 mmol, 76 %, Rf = 0.58).
1H-NMR (400 MHz, CDCl3, for atom labels see Fig. 19): 4.48 (m, 1H, Hb), 4.31 (m, 1H, Ha), 3.7-3.4
(m, 12H, Hj, Hk, Hl, Hm, Hn, Ho), 3.14 (m, 1H, He), 2.9 (m, 1H, Hc), 2.73 (m, 1H, Hd), 2.22 (t, 2H, Hi),
1.67 (m, 4H, Hh and Hf), 1.46 (m, 2H, Hg), 1.43 (s, 9H, Boc-H).
Fig. 18: Synthesis of APpic2Btn (14). Compound (10) was coupled to biotin via a diamino PEG linker in two CDI-activated amide formations. Mono-protection of the linker was necessary to prevent the conversion of both amines in the first amidation step. Abbreviations are explained in the main text.
Deprotection and coupling to (10): The mono-protected linker (12) was dissolved in 500 µl dry DCM.
450 µl trifluoro acetic acid (TFA) was added and the mixture stirred until deprotection to (13) was
completed (monitored by TLC, 1 h). Solvent and excess TFA were evaporated.
Compound (10) (68 mg, 0.38 mmol, 1 eq) was dissolved in 1 ml DMF. CDI (62 mg, 0.38 mmol, 1 eq)
was added under Ar atmosphere and the mixture stirred for 4 h. The deprotected linker (13) (142 mg,
0.38 mmol, 1 eq), dissolved in DMF (1 ml) and triethylamine (105 µl, 0.76 mmol, 2 eq), was slowly
added to the activated carboxylic acid and the reaction mix stirred over night. The solvents were

Part II: Materials and Methods
68
evaporated and the residue purified over a silica gel column with CHCl3/MeOH 3/1 to yield 80 mg
APpic2Btn (14) as a colorless semisolid (0.15 mmol, 40 %, Rf = 0.67).
1H-NMR (400 MHz, CDCl3, for atom labels see Fig. 19): 9.06 (m, 1H, Hp), 8.22 (dd, 1H, Hq), 7.84 (m,
1H, Hr), 4.50 (s, 2H, Hs), 4.47 (m, 1H, Hb), 4.28 (m, 1H, Ha), [3.7-3.6 (m, 8H) and 3.54 (t, 2H) and 3.38
(m, 2H): 12H, Hj, Hk, Hl, Hm, Hn, Ho], 3.10 (m, 1H, He), 2.9 (m, 1H, Hc), 2.73 (m, 1H, Hd), 2.17 (t, 2H,
Hi), 1.62 (m, 4H, Hh and Hf), 1.40 (m, 2H, Hg).
MS (ESI +): 557.3 ([M+Na]+, calculated: 557.227), 535.3 ([M+H]+, calculated: 535.245).
Fig. 19: APpic2Btn (14), assignment of 1H-NMR signals. Small letters designate hydrogen atoms in synthesis products (12) and (14), for use with the 1H-NMR peak lists given above.
Part II: Materials and Methods
69
4.1.1.2 Primers and plasmids
Plasmids used in the colocalization studies were obtained by subcloning the respective templates into
the parent vector pmRFP1 (Campbell et al., 2002) and therefore confer kanamycin resistance (Table
2).
Table 2: List of plasmids and primers.
name alias primers and template, or source description of coding sequence, restriction sites
mRFP-ER pLK14 Lars Kuerschner mRFP1 fused to human Sec61 via a linker (LYKYSDLELKLPRVRRQRLATLISN)
mRFP-mito pLK16 Lars Kuerschner MLRAALSTARRGPRLSRLLSAAATSAVPAPNQQPEV from rat alcohol dehydrogenase (ALDH) followed by the linker LVPVAT, and mRFP1
mRFP-
ACAT1
pAG47 SOAT1-mRFP forward: GACGGATCCTCAACCGGTCGAAACACGTAACGACAAGTCC SOAT1-mRFP reverse: CCTGTACAGCGCTAGCATGGTGGGTGAAGAGAAGATG template: I.M.A.G.E. EST clone # 4991365
mRFP1 fused to full length ACAT1 (SOAT1) via a linker (LYSAS) BsrGI, BamHI
mRFP-
NSDHL
pAG49 3primer nsdhl: GACGGATCCTCAACCGGTCGCTTGACCCTCCGCAGGTG 5primer nsdhl: CCTGTACAGCGCTAGCATGGAACCAGCAGTTAGCGAG template: pDL247 (containing full length NSDHL)
mRFP1 fused to full length NSDHL via a linker (LYSAS) BsrGI, BamHI
pLK14 and pLK16 were kindly supplied by Lars Kuerschner (Kuerschner et al., 2005; Hofmann et al.,
2014), pDL247 by Daniel Lohmann. The generation of pAG47 and pAG49 was partially performed by
Jennifer Zablocki. The sequences of all constructs were verified (GATC Biotech AG, Germany).
4.1.1.3 Other materials
Delipidated FCS was prepared by solvent extraction as described previously (Thiele et al., 2000).
The β-cyclodextrin complex of cholesterol was prepared by slowly adding 1.5 ml of a 10 mg/ml
solution of cholesterol in isopropanol to a warm solution of 1 g β-cyclodextrin in 20 ml H2O under
vigorous stirring. Aliquots were stored at -80 °C.
Avasimibe was from Sigma (#PZ0190). CP-113,818 ((-)-N-(2,4-bis(methylthio)-6-methylpyridin-3-yl)-
2-(hexylthio)decanoic amide) was kindly donated by Kai Simons, Max Planck Institute of Molecular
Cell Biology, Dresden, Germany.
Part II: Materials and Methods
70
4.1.2 Methods
4.1.2.1 Cell biological methods
Cell culture HuH7 cells (Japanese Collection of Research Bioresources #JCRB0403) were grown in RPMI 1640
(PAN Biotech #P04-17500) supplemented with 10 mM HEPES, 0.1 mM non-essential amino acids,
2 mM L-Glutamine, 10 % FCS, at 5 % CO2. A172 cells (ATCC #CRL-1620) and undifferentiated 3T3-
L1 fibroblasts (ATCC #CL-173) were cultured in DMEM (Gibco #31966), with 10 % FCS (Gibco
#10270).
Differentiation of 3T3-L1 cells The murine fibroblast cell line 3T3-L1 was grown to 100 % confluency and at Day0 the growth
medium was exchanged for differentiation medium I (medium plus 5 µM insulin, 10 µM
dexamethasone and 0.5 mM 3-isobutyl-1-methylxanthine). On Day3 and Day5, the medium was
exchanged for differentiation media II (medium plus 5 µM insulin), and on Day7, for standard growth
medium. Differentiated cells were incubated over night with 10 µM alkyne fatty acids from Day8,
followed by fixation and microscopy sample preparation (see chapter 4.2.2). Differentiation was kindly
performed by Mario Lauterbach.
Transfection with plasmid DNA
Cells seeded on glass coverslips in 24-well plates were grown to 70 % confluency. For each well,
100 µl transfection mix was prepared: 1 µl of the cholesterol-free transfection reagent (an equimolar
mixture of N1,N4-dioleyl-N1,N4-di-[2-hydroxy-3-(N-aminopropyl)]diaminobutane and dioleoyl-
phosphatidylethanolamine (Chu et al., 2008; Hofmann et al., 2014)) was diluted in 50 µl Opti-MEM
(Gibco #31985). In a second reaction tube, 1 µg plasmid DNA was mixed with 50 µl Opti-MEM. After
5 min, the diluted DNA and transfection reagent were unified and the transfection mix incubated for
20 min. The cells were washed with pre-warmed Opti-MEM and 100 µl of the transfection mix were
added. After 2 h, 1 ml normal growth medium was added. Cells were fixed after 24 h.
Lipid delivery to mammalian cells
Cells were cultured to the desired cell density, the normal culture medium removed and replaced by
lipid-supplemented medium. Lipid dissolution in the media was achieved by adding an ethanolic lipid
solution or, in the case of unlabeled cholesterol, the β-cyclodextrin complex, to the cell culture
medium. Unless otherwise stated, lipids were delivered in full medium (standard growth medium for
the respective cell line, supplemented with serum, as decribed above under “Cell culture”).
Part II: Materials and Methods
71
For the pulse-chase study in HuH7 (Fig. 34), the pulse medium was RPMI without added FCS,
supplemented with 1 % lipid-free BSA (Applichem #A0848) and 10 µM alkyne-cholesterol. The chase
was performed in full medium, without added alkyne lipid.
For the lipid-loading experiments (Fig. 35 to Fig. 38), HuH7 cells were incubated with unlabeled lipids
and ACAT inhibitors (avasimibe or CP-113,818), as indicated, in full medium for two days, after which
the medium was replaced for medium containing the unlabeled lipid and, if indicated, ACAT inhibitor,
and 10 µM alkyne-cholesterol and the cells incubated for further 17 h, followed by fixation or lipid
extraction.
4.1.2.2 Molecular biology methods
Cultivation of E.coli
E.coli were cultured in LB (Luria Broth) medium (5 g/l yeast extract, 10 g/l NaCl, 10 g/l tryptone) or on
LB agar plates containing kanamycin (50 µg/ml) at 37 °C with shaking at 180 rpm (liquid medium) or
without shaking (agar plates).
Preparation of chemical competent E.coli E.coli strain DH5-α was grown in 250 ml SOB medium containing 0.5 % yeast extract, 2 % tryptone,
10 mM NaCl, 2.5 mM KCl, 10 mM MgCl2 and 10 mM MgSO4 at 19 °C to O.D. 0.5. After incubation on
ice for 10 min, the cells were pelleted by centrifugation (4000 g, 10 min, 4 °C) and resuspended in
16 ml transformation buffer (10 mM piperazine-N,N′-bis(2-ethanesulfonic acid) (PIPES), 250 mM KCl,
15 mM CaCl2, 55 mM MnCl2, pH 6.7). After centrifugation, the pellet was resuspended again in
20 mM transformation buffer supplemented with 1.4 ml dimethylsulfoxide (DMSO). Aliquots of 100 µl
were snap-frozen in liquid nitrogen and stored at -80 °C.
Transformation of E.coli
Chemical competent E.coli were thawed on ice, mixed with plasmid DNA and incubated on ice for
5 min. After a heat-shock of 45 s at 42 °C, 0.5 ml LB medium was added and the cells incubated at
37 °C for 60 min. Bacteria were pelleted, the pellet resuspended in LB medium and the cells were
plated on LB agar plates supplemented with kanamycin.
DNA preparation from E.coli
DNA preparation was performed as Mini or Midi preparations according to the protocols provided by
the manufacturer (Macherey-Nagel, Düren, Germany). DNA concentrations were measured at a
NanoDrop spectrometer (Peqlab, Erlangen, Germany).
Part II: Materials and Methods
72
DNA amplification by PCR, agarose gels, restriction digest, ligation
Polymerase chain reaction (PCR) was performed using the standard protocols to amplify DNA. PCR
samples were purified on agarose gels, which were prepared with 1 % agarose in TAE buffer (50x
TAE: 100 ml 0.5 M Na2EDTA pH 8.0, 242 g Tris base, 57.1 ml glacial acetic acid, H2O up to 1000 ml).
DNA was extracted from the gels according to the protocol of the manufacturer (Qiagen) and digested
with the appropriate restriction enzymes (New England Biolabs). After purification on agarose gels,
the digested products were ligated into appropriate digested plasmids.
4.1.2.3 Lipid extraction, ethanolic click reaction and thin layer chromatography
Lipid extracts were generated from HuH7 cells grown in 6 cm-dishes by on-dish extraction. After
washing the cells with PBS supplemented with 1 % lipid-free BSA, and again with PBS, 1 ml of
chloroform/methanol 5/1 was added, the dish agitated gently for 30 s and the solvent mixture was
transferred to a centrifugation tube. The dish was rinsed again with 1 ml isopropanol. To the pooled
extracts, 500 µl chloroform were added, the solution mixed, and the tube centrifuged (4000 g, 5 min).
The supernatant was decanted from the cell pellet. After the addition of 4 ml water, the sample was
mixed and centrifuged again (4000 g, 10 min). The lipid extract was obtained as the lower phase. For
click labeling of extracted lipids, an appropriate proportion of the lipid extract was transferred to a new
reaction tube, solvents were evaporated and the lipids redissolved in 10 µl chloroform. 30 µl click
reaction mix (10 µl of 2 mg/ml 3-azido-7-hydroxycoumarin, 250 µl of 10 mM CuTFB in acetonitrile,
850 µl ethanol) were added and the tubes incubated at 43 °C for 3 h (see chapter 3.1). After the
addition of 20 µl chloroform, ultrasonication and thorough mixing, the samples were applied onto TLC
silica plates and developed with the following solutions: chloroform/methanol/water/acetic acid
65/25/4/1 for 5 cm, followed by gentle drying of the plates and hexane/ethyl acetate 5/1 for 18 cm.
4.1.2.4 Aqueous click reaction and sample preparation for microscopy
Formaldehyde fixation of cells for microscopy
Cells were washed with PBS containing 1 % delipidated FCS and again with PBS. Then 3.7 %
formaldehyde in PBS was added and the cells were fixed for at least 17 h at 4 °C. To test the effect of
the fixation buffer on the labeling (Fig. 25), different fixation buffers were used, based on PBS or click
buffer (50 mM HEPES/KOH, pH 7.4) by adding different concentrations of calcium chloride.
Click labeling of fixed samples with azide detection reagents
After fixation, the samples were washed two times with PBS, one time with 155 mM ammonium
acetate and two times with click buffer. For these and all subsequent wash steps, the samples were
incubated with the buffer for 10 min while gently agitating. The coverslips were then incubated in a 24-
Part II: Materials and Methods
73
well plate on a heated shaker (Thermomix, Eppendorf, Germany) at 43 °C and 300 rpm. The buffer
was removed and 800 µl of a pre-warmed solution of the azide detection reagent in click buffer was
added, followed instantly by the injection of 16 µl CuTFB in acetonitrile into the reagent solution. After
15 min incubation, another 8 µl copper catalyst solution were added. See figure legends in chapter
4.2 for the concentrations of the reagents and CuTFB catalyst used for click labeling in the individual
experiments. Samples were incubated under continuous shaking at 300 rpm during the click reaction,
except for 3T3-L1 adipocytes, which were shaken for 2 min after copper addition only. After another
15 min, the reagent solution was removed and the samples were washed with click buffer two times.
Samples with biotinylated azide reagents were then washed sequentially with PBS, PBS
supplemented with 2 % BSA, and then incubated upside-down on parafilm in a 30 µl drop of 1:120
streptavidin-Alexa488 (Dianova) in PBS/ 2 % BSA for 60 min, followed by two wash steps with PBS/
2 % BSA, whereas these steps were left out for samples with ASBDP. Finally, all samples were
washed with PBS again six times.
Staining of lipid droplets and nuclei, mounting of samples for microscopy
LDs were stained by adding LD540 (Spandl et al., 2009) at a concentration of 100 ng/ml in the
penultimate wash step (10 min incubation). Nuclei were stained by adding 4',6-diamidino-2-
phenylindole (DAPI, 1:1000) in the last wash step and incubating for 20 min. Coverslips were
mounted with 7 µl (3T3-L1 adipocytes: 15 µl) Mowiol/DABCO (6 g glycerol, 2.4 g mowiol, 6 ml H2O,
12 ml 0.2 M Tris pH 8.5, 0.1 % 1,4-diazabicyclo[2.2.2]octane). Samples for STED microscopy were
mounted with 7 µl ProLong Gold (Life Technologies).
4.1.2.5 Microscopy
Epifluorescence microscopy
For epifluorescence detection, a Zeiss Observer.Z1 microscope (Carl Zeiss) was used together with a
CoolSNAP K4 (Photometrics) or OrcaFlash 4.0 (Hamamatsu) camera, a Polychrome V 150 W xenon
lamp (Till Photonics) and a Plan-Apochromate 63x (1.40 NA) DIC Oil or a Fluar 40x Oil (1.30 NA)
objective (Zeiss). Optical sectioning was performed using structured illumination with Zeiss ApoTome.
For brightfield polarized light microscopy, two polarization filters were included in the light path, before
and after the sample. Image acquisition was performed using the AxioVision or Zen 2012 Blue
Software (Zeiss).
STED microscopy
Super-resolution microscopy using stimulated emission depletion (STED) was performed in
cooperation with Dr. Jan-Gero Schlötel at the Light Microscopy Facility of the DZNE (German Center
for Neurodegenerative Diseases) on a Leica TCS SP8 microscope equipped with a pulsed white light

Part II: Materials and Methods
74
laser, depleted with a 592 nm STED laser and a 100x oil immersion (1.40 NA) objective. Detection
and gating were conducted with a Leica high dynamic range detector (HyD).
LD540 was excited at 534 nm and 0.35 % laser power, emitted light was collected from 544 – 604 nm
for confocal imaging. Alexa488 was imaged at 488 nm excitation and 498-541 nm emission at 200
gain; the excitation laser was adjusted to 1 % power in confocal mode and 10 to 20 % power for
STED mode, whereas the depletion laser was used at 25 to 50 % power. In STED mode, pictures
where calculated from multiple frame-averages. The pixel size in the STED mode was 20 nm or
30 nm. Scans were performed with 400 to 600 Hz scanning speed. For sequential scans (Z stacks),
all Z layers were scanned for one channel before continuing with the next channel.
To compare confocal and STED images of the same region of interest (ROI), the following routine
was used: (i) Confocal imaging of LD540, (ii) confocal imaging of Alexa488, (iii) STED-imaging of
Alexa488, single frame to bleach LD540 and therefore remove anti-Stokes fluorescence due to this
dye, (iv) STED-imaging of Alexa488, multiple frames for averaging.
Raman microspectroscopy
Measurements of the Raman spectra of alkyne lipid solutions were performed at the Waseda
University, Tokyo, Japan in collaboration with Rimi Miyaoka and the group of Professor Haruko
Takeyama, and Masahiro Ando. Alkyne-oleate (100 mM), alkyne-palmitate (100 mM) and alkyne-
cholesterol (10 mM) were dissolved in ethanol. Homopropargylglycine was prepared as a 30 mM
solution in DMSO/H2O 2/1. Solutions were dropped on a slide and covered with a coverslip (#1.0),
followed by sealing with nail polish. Images were acquired at a laboratory-built confocal Raman
microspectrometer with a 100x (1.40 NA) objective, a spectrometer, a CCD detector and 532 nm laser
excitation (Hosokawa et al., 2014; Miyaoka et al., 2014). The resolution of the Raman imaging system
(size of the focus point) was 0.3 µm (lateral) and 2.6 µm (axial), respectively.
4.1.2.6 Image processing and data analysis
Images were processed using Fiji (Schindelin et al., 2012) or Adobe Photoshop 6.0. Maximum
intensity projections were calculated from Z-stacks in Fiji or Zeiss AxioVision. The pixel values of the
maximum image projections are the maximum value over all images in the stack at the particular pixel
location. Intensity profiles and 3D surface plots were calculated from line and rectangular selections,
respectively using Fiji.
For comparing the sensitivity of the different azide detection reagents (Fig. 21 and 23B), all images
were taken at the same exposure times and post-processed in the same way in Fiji. Images were
corrected for illumination by dividing pixel values by those of an image displaying illumination
inhomogeneities of the microscope setup. Cell outlines were marked as ROIs and the mean alkyne
lipid signal of every cell was measured. Per sample, a total of 50 to 100 cells in six images taken at
defined positions of the coverslip was used for quantification.

Part II: Materials and Methods
75
In a similar approach, quantification of the influence of lipid loading on alkyne-cholesterol intracellular
localization (Fig. 38C) used 10 images per sample, taken at defined positions on the coverslip with
the same exposure times. After marking the cell outlines as ROIs, the signal integral for alkyne-
cholesterol and LD540 was measured for 150 to 180 individual cells per sample, and the number of
birefringent objects was determined visually for each cell.
Deconvolution of STED images was performed using the Huygens deconvolution software (SVI
Scientific Volume Imaging).
Calculations and statistical analysis were carried out in Microsoft Excel 2011 and Graphpad Prism 6.
One-way ANOVA (analysis of variance) and Kruskal-Wallis tests were performed to determine if
values were different from each other with statistical significance. Asterisks refer to P values
computed for the data: ****, P<0.0001, extremely significant; ***, 0.0001<P<0.001 extremely
significant; **, 0.001<P<0.01, very significant; *, 0.01<P<0.05, significant; n.s., P>0.05, not significant
(asterisk scheme and wording from the GraphPad Prism online guide).
Molecular structures were drawn using ChemDraw (CambridgeSoft Corporation, Version 8.0 Ultra), or
Chem Doodle (iChemLabs, Version 7.0). To obtain 3D models of molecules, structures were
energetically optimized in Chem3D (CambridgeSoft Corporation, Version 8.0 Ultra), using the MM2
force-field protocol to minimize energy. Optimized structures were visualized and intramolecular
distances measured with PyMOL (Schrödinger, LLC). The DPPC bilayer model was provided by
Jeffrey Klauda, University of Maryland, as a free download file (323.15 K, 72 lipids, CHARMM36 force
field simulation, tensionless ensemble (NPT), (Klauda et al., 2010)).
Part II: Results
76
4.2 Results (Part II)
4.2.1 A highly sensitive protocol for alkyne lipid imaging in fixed cells
4.2.1.1 Increased lipid imaging sensitivity by modulation of the azide detection reagent
Based on the current protocol developed in our lab to click-label alkyne lipids in fixed
cells for fluorescent imaging (Hofmann et al., 2014), we intended to enhance the
sensitivity of the method, especially for challenging alkyne lipids that give low signal,
such as alkyne-cholesterol.
To this end, a set of different azide detection reagents was successfully synthesized
in good yields. They were designed to investigate the influence of spacer length and
intrinsic copper chelation on the sensitivity of the method (see chapter 4.3.1 for
details and models). The new reagents (AP6Btn, AP10Btn and APpic2Btn) were
tested, and compared to reagents that were used routinely (AP3Btn and ASBDP).
A172 cells were incubated with 10 µM alkyne lipid, fixed and subjected to the
standard click labeling protocol using the various azide reagents (Fig. 20) at a
relatively low concentration (10 µM) and 200 µM CuTFB (instead of 2 mM) to create
a challenging setup for the analysis of labeling sensitivity. Please note that in Fig. 20,
for better visibility of the micrographs with low signal, the pictures of each sample
and its corresponding control (without alkyne lipid) are adjusted to the same display
levels (columns), but different reagents (rows) have different contrast settings, so
these images cannot be compared directly.
In general, the signal of click-labeled alkyne-oleate (Fig. 20A) was stronger than that
of the other lipids, so different exposure times were used, 50 ms for alkyne-oleate,
100 ms for alkyne-cholesterol and propargylcholine (Fig. 20B). Alkyne-oleate
showed the highest signal-to-noise ratios, whereas alkyne-cholesterol gave the least
signal, proving itself as the most challenging lipid of those tested. The choice of the
azide reagent greatly influenced the signal-to-noise ratio. APpic2Btn in general gave
the brightest staining; a sample with a lower concentration of the reagent (2 µM) was
therefore included and also gave very bright labeling. The background signal in
samples with no added alkyne lipid, originating from unspecifically bound azide
reagent or streptavidin-fluorophore conjugate was generally low. It nevertheless

Part II: Results
77
became relevant for samples with very low signal, namely alkyne-cholesterol in
combination with most reagents.
Fig. 20: Sensitivity of click labeling with different azide detection reagents at 10 µM (or 2 µM) concentration.
A172 cells were incubated with medium supplemented with 10 µM alkyne-oleate, alkyne-cholesterol or propargylcholine, or in medium without lipid supplementation for 16 h. After fixation, cells were click-labeled using 10 µM (or 2 µM) azide detection reagent and 200 µM CuTFB. Epifluorescence images were taken with 50 ms (alkyne-oleate, panel A) or 100 ms (alkyne-cholesterol or propargylcholine, panel B) exposure. To demonstrate signal-to-noise ratios, the micrographs shown here are adjusted to the same display level in every column (control lacking alkyne lipid compared to lipid-incubated sample), but not in every row. Color-coding of the samples corresponds to Fig. 21 and Fig. 22.
For the quantitative evaluation of sensitivity, the click labeling signal of all individual
cells in six images, taken at defined positions of the sample, was measured (Fig. 21).
Alkyne-oleate (Fig. 21A) was detected very sensitively with 2 or 10 µM APpic2Btn,
resulting in a signal statistically highly significant above background (compared to
the signal in control samples lacking alkyne lipid). The use of the other Btn-based
reagents (AP3Btn, AP6Btn, AP10Btn) as well as the fluorophore ASBDP resulted in
a much lower signal and hence lower detection sensitivity.
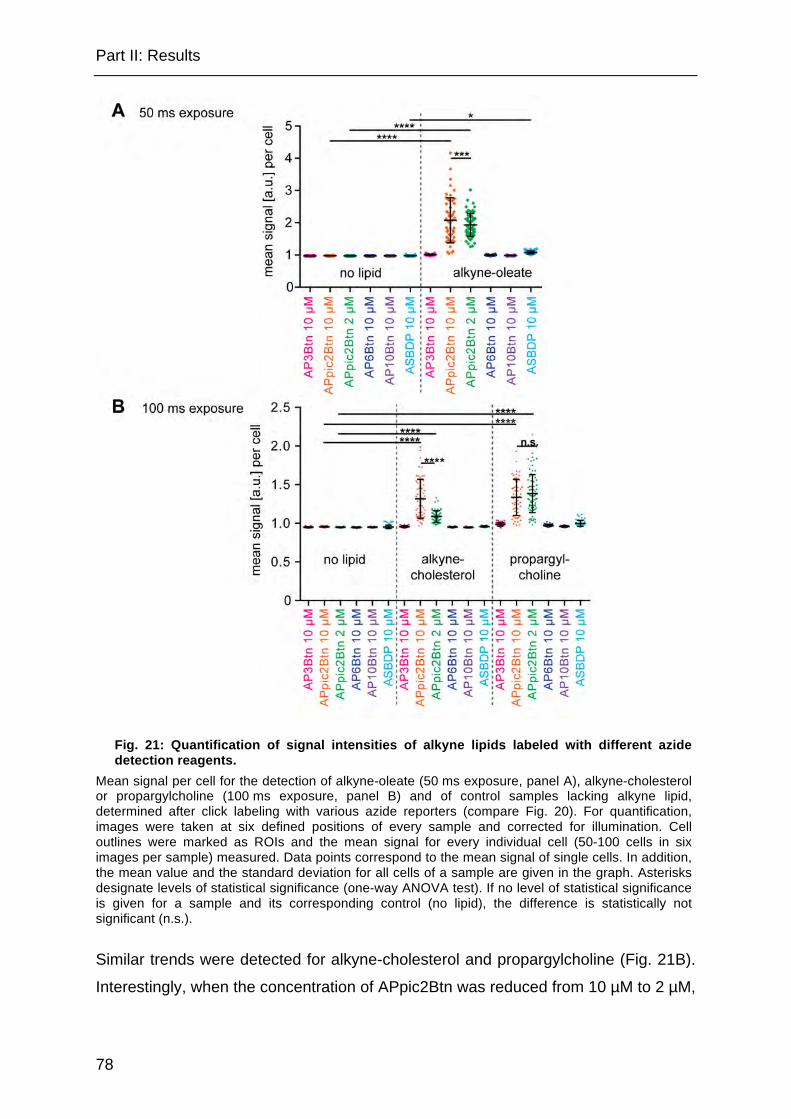
Part II: Results
78
Fig. 21: Quantification of signal intensities of alkyne lipids labeled with different azide detection reagents.
Mean signal per cell for the detection of alkyne-oleate (50 ms exposure, panel A), alkyne-cholesterol or propargylcholine (100 ms exposure, panel B) and of control samples lacking alkyne lipid, determined after click labeling with various azide reporters (compare Fig. 20). For quantification, images were taken at six defined positions of every sample and corrected for illumination. Cell outlines were marked as ROIs and the mean signal for every individual cell (50-100 cells in six images per sample) measured. Data points correspond to the mean signal of single cells. In addition, the mean value and the standard deviation for all cells of a sample are given in the graph. Asterisks designate levels of statistical significance (one-way ANOVA test). If no level of statistical significance is given for a sample and its corresponding control (no lipid), the difference is statistically not significant (n.s.).
Similar trends were detected for alkyne-cholesterol and propargylcholine (Fig. 21B).
Interestingly, when the concentration of APpic2Btn was reduced from 10 µM to 2 µM,

Part II: Results
79
the effect on the labeling of propargylcholine was minor, but for alkyne-oleate and
alkyne-cholesterol, a significant signal decrease resulted.
Under the challenging imaging conditions applied here, most of the azide reporters
apart from APpic2Btn did not show a significant difference in signal between alkyne
lipid incubated cells and controls (Fig. 21). However, a highly structured intracellular
staining was visible for all combinations of lipids and reagents, but not for control
samples lacking alkyne lipids (Fig. 20). To investigate the intracellular localization of
the alkyne lipid metabolites more closely, images of samples supplemented with
alkyne-oleate or alkyne-cholesterol were taken using higher exposure times (Fig.
22). Excellent to very good (alkyne-oleate, Fig. 22A) and excellent to acceptable
(alkyne-cholesterol, Fig. 22B) signal-to-noise ratios were observed after click labeling
with 10 µM azide reagent, and with imaging under optimized conditions. Reagents
with longer PEG-spacers (AP6Btn and AP10Btn) gave lower signal than AP3Btn for
both lipids, but the effect was stronger for alkyne-cholesterol. Apparently, the effect
of increasing the spacer length on sensitivity was detrimentral rather than beneficial,
especially for the detection of challenging lipids (see chapter 4.3.1 for discussion of
reagent design). On the other hand, the introduction of a picolyl moiety in the
structure of the reporter, as in APpic2Btn, led to a strong increase in sensitivity,
compared to that with the similarly sized AP3Btn. This allowed for a much lower
exposure time necessary to obtain high contrast pictures (see yellow numbers in Fig.
22). Labeling with ASBDP resulted in nearly the same sensitivity, compared to
AP3Btn, but a higher background in cellular membranes was visible and membrane-
blebbing was observed occasionally (see ASBDP + alkyne-cholesterol in Fig. 22).
Morphologically, all reagents stained endomembranes, as expected for cholesterol
and the metabolites of oleate. For alkyne-oleate, the PM staining, in relation to the
signal in endomembranes, was more prominent when using AP10Btn and ASBDP,
but due to a lower total signal with these reagents, a diminished staining of
endomembranes rather than an enhanced labeling of the PM is likely the reason.

Part II: Results
80
Fig. 22: Intracellular structures detected with alkyne lipids click-labeled with different azide reporters.
A172 cells were incubated with medium supplemented with 10 µM alkyne-oleate (panel A) or alkyne-cholesterol (panel B) for 16 h. After fixation, cells were click-labeled using 10 µM (or 2 µM) azide detection reagent and 200 µM CuTFB. Maximum intensity projections of Z-stacks acquired with structured illumination (ApoTome) are shown. Exposure times were optimized for each combination of alkyne lipid and reagent (see yellow numbers). Color-coding of the samples corresponds to Fig. 20 and Fig. 21.
Part II: Results
81
In our lab, the conventional azide reporter AP3Btn is routinely used at 50 µM
concentration (see (Hofmann et al., 2014)), which is five times higher than in the
sensitivity screen shown above (10 µM, Fig. 20). Therefore, the sensitivity of click
labeling was re-examined using an optimized concentration for each detection
reagent, but otherwise the same conditions (Fig. 23). In this less challenging setup,
the sensitivity of all reagents was increased. All reporters were used at 50 µM
concentration, except for the very potent APpic2Btn, which was used at 10 µM or
2 µM. For all reporters, an exposure time of 400 ms was chosen to achieve optimal
signal-to-noise ratios (squares in Fig. 23A). However, for labeling with APpic2Btn this
sometimes led to overexposed images, in which case imaging was performed at
200 ms exposure (triangles in Fig. 23A).
Micrographs (Fig. 23A) and their quantitative analysis (Fig. 23B) revealed that a
sensitive detection of alkyne-oleate (i.e. a mean signal significantly higher than that
of the control) was achieved with all reagents tested, AP3Btn, APpic2Btn, AP6Btn
and AP10Btn, under optimized conditions. For propargylcholine detection, AP3Btn,
APpic2Btn and AP10Btn met this criterion. With alkyne-cholesterol, only APpic2Btn
led to a signal that was about as strong as for the other lipids and statistically
significant from controls. Interestingly, AP6Btn gave lower signal than AP10Btn. In
summary, compared to the standard protocol of our lab for alkyne lipid detection by
microscopy, the application of APpic2Btn led to a substantial increase in the
sensitivity of the method, especially in the detection of alkyne-cholesterol.
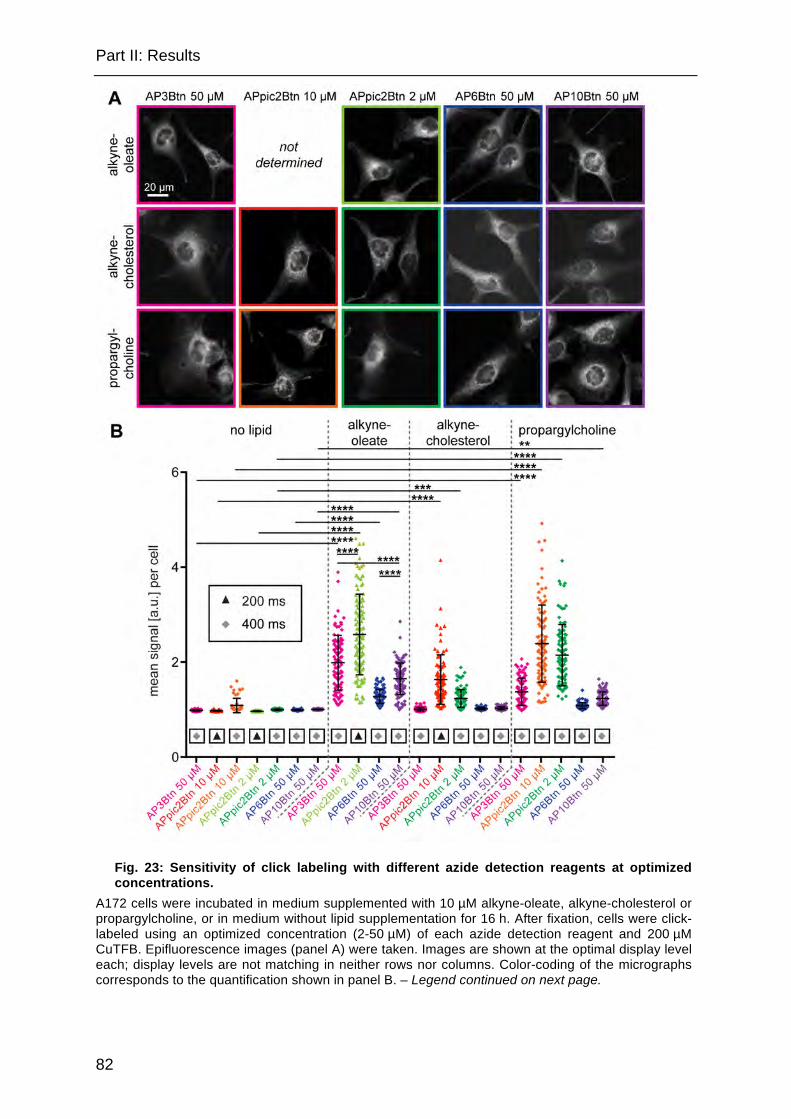
Part II: Results
82
Fig. 23: Sensitivity of click labeling with different azide detection reagents at optimized concentrations.
A172 cells were incubated in medium supplemented with 10 µM alkyne-oleate, alkyne-cholesterol or propargylcholine, or in medium without lipid supplementation for 16 h. After fixation, cells were click-labeled using an optimized concentration (2-50 µM) of each azide detection reagent and 200 µM CuTFB. Epifluorescence images (panel A) were taken. Images are shown at the optimal display level each; display levels are not matching in neither rows nor columns. Color-coding of the micrographs corresponds to the quantification shown in panel B. – Legend continued on next page.
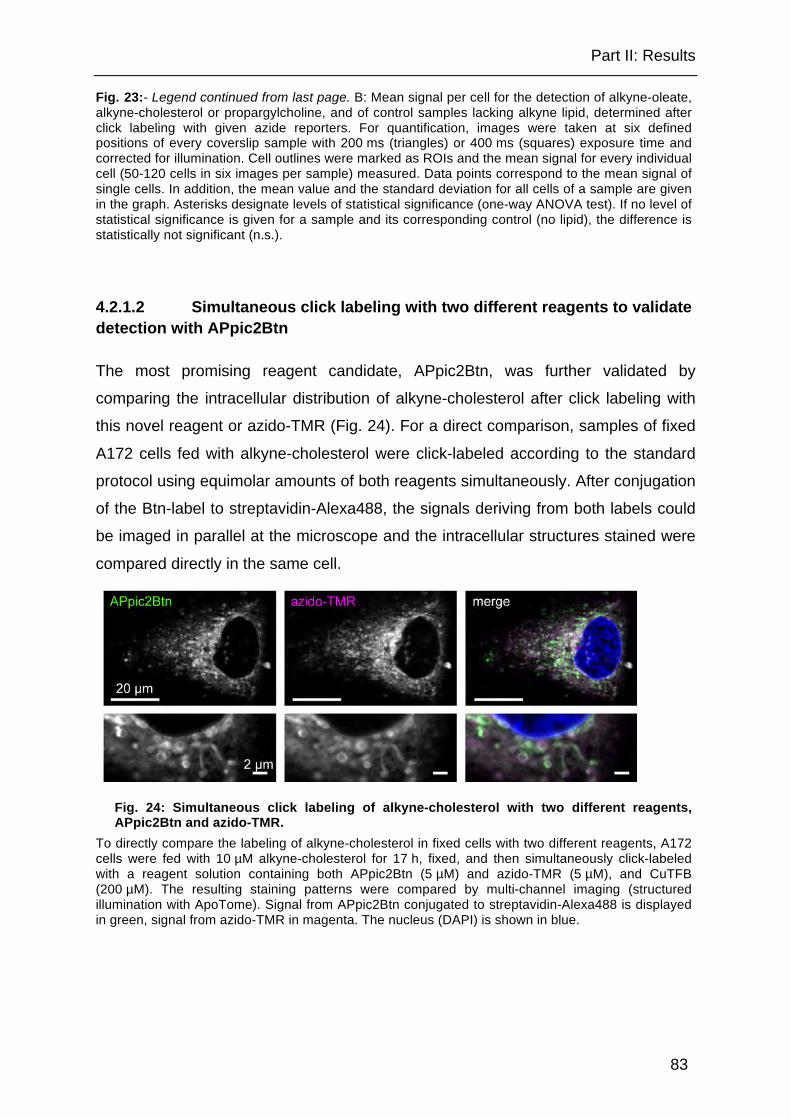
Part II: Results
83
Fig. 23:- Legend continued from last page. B: Mean signal per cell for the detection of alkyne-oleate, alkyne-cholesterol or propargylcholine, and of control samples lacking alkyne lipid, determined after click labeling with given azide reporters. For quantification, images were taken at six defined positions of every coverslip sample with 200 ms (triangles) or 400 ms (squares) exposure time and corrected for illumination. Cell outlines were marked as ROIs and the mean signal for every individual cell (50-120 cells in six images per sample) measured. Data points correspond to the mean signal of single cells. In addition, the mean value and the standard deviation for all cells of a sample are given in the graph. Asterisks designate levels of statistical significance (one-way ANOVA test). If no level of statistical significance is given for a sample and its corresponding control (no lipid), the difference is statistically not significant (n.s.).
4.2.1.2 Simultaneous click labeling with two different reagents to validate detection with APpic2Btn
The most promising reagent candidate, APpic2Btn, was further validated by
comparing the intracellular distribution of alkyne-cholesterol after click labeling with
this novel reagent or azido-TMR (Fig. 24). For a direct comparison, samples of fixed
A172 cells fed with alkyne-cholesterol were click-labeled according to the standard
protocol using equimolar amounts of both reagents simultaneously. After conjugation
of the Btn-label to streptavidin-Alexa488, the signals deriving from both labels could
be imaged in parallel at the microscope and the intracellular structures stained were
compared directly in the same cell.
Fig. 24: Simultaneous click labeling of alkyne-cholesterol with two different reagents, APpic2Btn and azido-TMR.
To directly compare the labeling of alkyne-cholesterol in fixed cells with two different reagents, A172 cells were fed with 10 µM alkyne-cholesterol for 17 h, fixed, and then simultaneously click-labeled with a reagent solution containing both APpic2Btn (5 µM) and azido-TMR (5 µM), and CuTFB (200 µM). The resulting staining patterns were compared by multi-channel imaging (structured illumination with ApoTome). Signal from APpic2Btn conjugated to streptavidin-Alexa488 is displayed in green, signal from azido-TMR in magenta. The nucleus (DAPI) is shown in blue.

Part II: Results
84
Alkyne-cholesterol was observed in the same intracellular compartments with both,
chemically very different reagents. Alkyne-cholesterol rings (presumably partially
around LDs, see chapter 4.2.2) and the nuclear envelope were somewhat more
prominent with the hydrophilic APpic2Btn, whereas diffuse membrane staining in the
perinuclear region (presumably, amongst other organelles, ER) was slightly stronger
with the hydrophobic dye azido-TMR.
4.2.1.3 Influence of the fixation buffer on the click labeling
To test the effect of the fixation protocol on the click labeling of alkyne lipids in
biological membranes, A172 cells were incubated with alkyne-cholesterol, fixed in
HEPES buffer containing different concentrations of calcium ions and subjected to
standard click labeling (Fig. 25).
Fig. 25: Effect of the fixation buffer on the click labeling of alkyne-cholesterol. A172 cells were incubated in medium supplemented with 10 µM alkyne-cholesterol for 17 h, washed and fixed in HEPES buffer (50 mM, pH 7.4) containing 4 % formaldehyde and different concentrations of CaCl2, or fixed in PBS/formaldehyde, followed by standard click labeling with 10 µM APpic2Btn and 200 µM CuTFB. Micrographs were taken in epifluorescence mode.
Whereas in samples lacking calcium ions in the fixation solution, a prominent
labeling of membrane structures inside the cell was visible, the addition of calcium
chloride in increasing concentrations resulted in an increasingly dominant PM

Part II: Results
85
staining. PBS/formaldehyde, the standard fixation reagent in this study, could not be
supplemented with calcium ions, because insoluble calcium phosphate salts would
have formed. Fixation in PBS or HEPES led to similar staining patterns. However,
PBS has a physiological and thus substantially higher ionic strength than 50 mM
HEPES. Hence, the effect of the fixation solution on click labeling was not due to
ionic strength alone but dependent on the presence of specific ions. Similar effects
were detected in HuH7 cells (data not shown) pointing to a general influence of
calcium ions during fixation on the click labeling of alkyne lipids in the PM.
Part II: Results
86
4.2.2 Alkyne-cholesterol localization to lipid droplets and associated endoplasmic reticulum in HuH7 cells
Alkyne-cholesterol localizes to a subpopulation of lipid droplets and associated endomembranes
A prominent localization of alkyne-cholesterol around LDs was observed (Fig. 26A)
after over-night incubation of A172 cells with this lipid and click labeling with the
new sensitive detection protocol (see chapter 4.2.1). Alkyne-cholesterol (or its
metabolite alkyne-cholesterol ester, alkyne-CE, Fig. 26C) was incorporated by the
gliablastoma cell line A172 into ring-like structures that might represent outer parts
of the LDs or membrane structures wrapped around it. These structures were not
an artifact due to the use of the new detection reagent, because they were present
with other detection reagents as well (Fig. 24). The rings appeared to be connected
to alkyne-cholesterol containing tubular structures.
Similar observations were made in other cell types, like in the hepatocarcinoma cell
line HuH7 and in immortalized mouse macrophages (data not shown). This
indicates that a general pathway targets alkyne-cholesterol to LDs. In many cases,
a striking heterogeneity of the alkyne-cholesterol signal inside single cells was
observed (Fig. 26B). Alkyne-cholesterol was not detected around all LDs of a cell,
some LDs had less or no signal. Some LDs were connected to alkyne-cholesterol
containing compartments; others had no apparent connection to these tubular
structures. LDs were sometimes clustered loosely or tightly, or lined up along
membrane bridges like beads on a string.
Alkyne-cholesterol was esterified to alkyne-CE to a considerable proportion (21 %)
by A172 cells (Fig. 26C). In all cell types, the very hydrophobic lipid CE is stored in
LDs, however, no staining of the LD core was observed with our click labeling
protocol. This is probably due to limitations of the click labeling in the very
hydrophobic environment of the LD core. See chapter 4.3.2.1 for a more extensive
discussion of click labeling in biological systems.

Part II: Results
87
Fig. 26: Alkyne-cholesterol localization around lipid droplets in A172 cells. The cell culture medium of A172 cells was supplemented with 10 µM alkyne-cholesterol for 17 h, the cells fixed and click-labeled with APpic2Btn. LDs were stained with LD540 (displayed in magenta) and nuclei with DAPI (blue). Maximum intensity projections of Z-stacks taken under structured illumination are shown. A: Alkyne-cholesterol (green) localized to ring-like structures of or near LDs. Connections between this ring-like staining around the LDs and other membrane compartments positive for alkyne-cholesterol were observed (arrowhead). B: The LD pool of single cells was heterogeneously targeted by alkyne-cholesterol. Not all LDs showed the ring-like staining (right detail). The intensity of the alkyne-cholesterol signal around LDs and associated membranes varied greatly. C: Fluorescent TLC image of click-labeled lipids from A172 cells incubated with alkyne-cholesterol in full medium for 17 h. Alkyne-cholesterol was metabolized to alkyne-CE (21 % of total signal).

Part II: Results
88
Neutral alkyne lipid metabolites accumulate in lipid droplets, but most of the lipid droplet core is not accessible for click labeling
To investigate if the click labeling procedure is able to stain the LD core,
differentiated 3T3-L1 adipocytes were fed with fatty acids of different chain length
and saturation. Fig. 27A shows a maximum intensity projection of an adipocyte
incubated with alkyne-palmitate. Note that the Z-stack spanned less than the full
cell in Z-direction, the Z-fraction most distant to the coverslip was not recorded.
Consequently, the uppermost parts of the largest LDs are missing in this
micrograph. They therefore lack the “caps” of alkyne-palmitate signal (green) that is
surrounding, but not deeply penetrating the LDs (magenta). Also for the other fatty
acids (Fig. 27B, single Z-slice micrographs), no signal was found inside the LDs,
although the bona fide LD-resident lipid alkyne-TAG was generated from all of the
alkyne fatty acids used (Fig. 27C). Thus, like alkyne-CE stored in LDs after alkyne-
cholesterol feeding (Fig. 26), alkyne-TAG cannot be click-labeled (deeply) inside
the highly hydrophobic environment of the LD core. This represents a general
limitation of the current click labeling protocol.
The inability to click-label alkyne lipids deeply inside the LD core does not exclude
the possibility of staining alkyne lipids localized on the LD surface and to a certain
depth inside the core. Comparative imaging of different fatty acids in adipocytes
was performed to shed some light upon the characteristics and limitations of our
click labeling protocol.
In a previous study (Thiele et al., 2012), our lab could show that alkyne fatty acids
are differentially metabolized by adipocytes, depending on the acyl chain length.
Like in the previous study, the alkyne fatty acids used here, with chain lengths
between nine and nineteen carbon atoms, were metabolized to TAG (Fig. 27C).
Incorporation into the membrane constituting phospholipids could be observed for
alkyne-palmitate and alkyne-oleate, which gave rise to considerable amounts of
alkyne-labeled phosphatidylethanolamine (PE) and PC. For the C9 alkyne fatty
acid, however, smaller amounts of these phospholipids were detected, and only
traces for the C11 and C13 alkyne fatty acids. This striking difference was reflected
by the differential intracellular localization pattern of the fatty acid metabolites (Fig.
27B).

Part II: Results
89
Fig. 27: Fatty acid metabolites in 3T3-L1 adipocytes. 3T3-L1 cells were differentiated into adipocytes and incubated with cell culture medium supplemented with 10 µM alkyne fatty acids for 17 h from Day 8 of differentiation. A and B: After fixation and click labeling (shown in green) with 50 µM AP3Btn and 2 mM CuTFB, samples were imaged (structured illumination). LDs were stained with LD540 (magenta), nuclei with DAPI (blue). A: Maximum intensity projection of a Z-stack covering most of the Z-extension of an adipocyte fed with alkyne-palmitate. Click-labeled fatty acid metabolites cover small and large LDs. B: Micrographs of adipocytes (single Z-layer) incubated with various alkyne fatty acids. Display levels of alkyne fatty acids are adjusted to the same scale. C: Fluorescent TLC image of similarly prepared samples. Lipids were extracted from coverslips and click-reacted with azido-coumarin (3-azido-7-hydroxycoumarin). Fatty acid metabolites were identified using co-migrating standards. The differential metabolism of fatty acids detected by TLC corresponds to a dissimilar staining in microscopy. TLC data (panel C) were kindly provided by Mario Lauterbach.
Whereas the phospholipid metabolites of alkyne-palmitate and alkyne-oleate gave
a distinct labeling of the PM, this organelle was much less prominently stained with
the shorter fatty acids C9 and C13. For the C13 fatty acid, which is not incorporated
into phospholipids, the signal intensity was generally much lower, indicating that
the neutral lipids that it was incorporated into were packed into the inaccessible
part of the LDs. The C11 fatty acid however, almost solely converted to neutral
lipids like the C13 fatty acid (see Fig. 27C), gave a ring-like labeling around the LDs

Part II: Results
90
like alkyne-oleate or -palmitate. This demonstrates that the neutral lipids in the
outermost parts of the LD core probably are accessible to our click labeling
protocol.
Besides the insight into the characteristics of our click labeling method, imaging
data from fatty acid metabolites in adipocytes will be a valuable contribution to the
exploration of the striking dependence of fatty acid metabolism and trafficking on
chain length in adipocytes (Thiele et al., 2012).
A label-free detection of alkyne lipids could enable their imaging inside the LD core.
Raman microspectroscopy and other Raman-based microscopy techniques have
been used to identify the intracellular localization of alkyne labeled probes (see
chapter 1.2). In collaboration with the group of Prof. Takeyama at Waseda
University, we tested the feasibility of Raman microspectroscopy with alkyne lipids
for this purpose. In a pilot experiment, the spectral properties of solutions of
different alkyne probes, namely alkyne-cholesterol, two alkyne fatty acids, and
homopropargylglycine, a reagent used to biosynthetically label proteins with alkyne
groups (Beatty et al., 2006), were measured under the Raman microscope to
assess their suitablility for imaging in a complex biological environment.
The tested alkyne probe solutions all showed an intense peak originating from the
alkyne triple bond stretching vibration at about 2120 cm-1, (Fig. 28A), in an
otherwise very silent region of the Raman spectrum of mammalian cells (Fig. 28B).
This is a promising starting point for further experiments in fixed or living cells,
which will focus on the detection of alkyne lipids in the LD core (see
chapter 4.3.2.1).

Part II: Results
91
Fig. 28: Raman spectra of alkyne lipid solutions. A: Raman spectra acquired from solutions of alkyne lipids at the Raman microspectroscope. The intense peak of the alkyne triple bond stretch (~2120 cm-1) is highlighted in yellow. B: Raman spectrum of PC12 cells. The alkyne peak (yellow) lies within a silent region of the Raman spectrum of mammalian cells. C: Raman spectra from solutions containing palmitoleate and alkyne-oleate in different ratios. Sample compositions are given in panel D. D: Plot of the calculated relative amounts of alkyne-oleate in the alkyne-oleate/palmitoleate mixtures (blue triangles), and relative amounts estimated from the Raman peak intensities measured for the alkyne peak at ~ 2120 cm-1 versus the alkene double bond stretch at ~ 1650cm-1 (red circles). Data and figure used with kind permission of Prof. Haruko Takeyama and Rimi Miyaoka, Waseda University, Tokyo, Japan; layout slightly modified.

Part II: Results
92
An additional benefit of spontaneous Raman microspectroscopy is demonstrated in
Fig. 28C and D. Because of the linearity of signal to the amount of molecules that
produce it, relative signal intensities can provide quantitative information about the
relative lipid contents in the focus point of the Raman spectroscope’s laser. Fig. 28C
shows the spectra of six different mixtures of palmitoleate and alkyne-oleate. The
alkene peak intensity, like the relative content of C=C double bonds, did not vary
with different ratios of the two fatty acids, whereas the alkyne peak intensity strongly
correlated with it. The quantification of the peaks against each other (Fig. 28D)
yielded alkyne-oleate contents determined from the relative peak intensities that
were very similar to the actual composition of the mixture.
Colocalization studies with mRFP-tagged marker proteins – Alkyne-cholesterol at the site of its esterification
Click labeling with APpic2Btn allows the sensitive detection of alkyne-cholesterol,
even with a low concentration of the copper catalyst CuTFB (see chapter 4.2.1). This
enabled the preservation of mRFP1 fluorescence during sample preparation and
thus co-imaging of alkyne-cholesterol and mRFP1-tagged proteins to investigate the
nature of the alkyne-cholesterol positive membrane organelle associated with the
rings around the LD (Fig. 29 and 30). Further experiments in our lab showed that the
fluorescence of tdTomato, a member of the mFruit family (Shaner et al., 2004),
which is based on mRFP1, was also satisfyingly preserved during click labeling.
GFP, EGFP and YFP appeared to be more sensitive towards copper ions (Kristina
Hofmann and Lars Kuerschner, unpublished data), pointing to an interaction of
copper with specific amino acids or the structure of the fluorescent proteins that can
lead to disruption of fluorescence.
Fusion proteins of mRFP1 and organelle specific proteins were overexpressed in
HuH7 cells. Alkyne-cholesterol was fed to the transfected cells and click-labeled after
fixation with APpic2Btn (10 µM) and CuTFB (200 µM) for co-imaging of alkyne-
cholesterol and mRFP1-tagged organelle markers for the ER and mitochondria (Fig.
29).
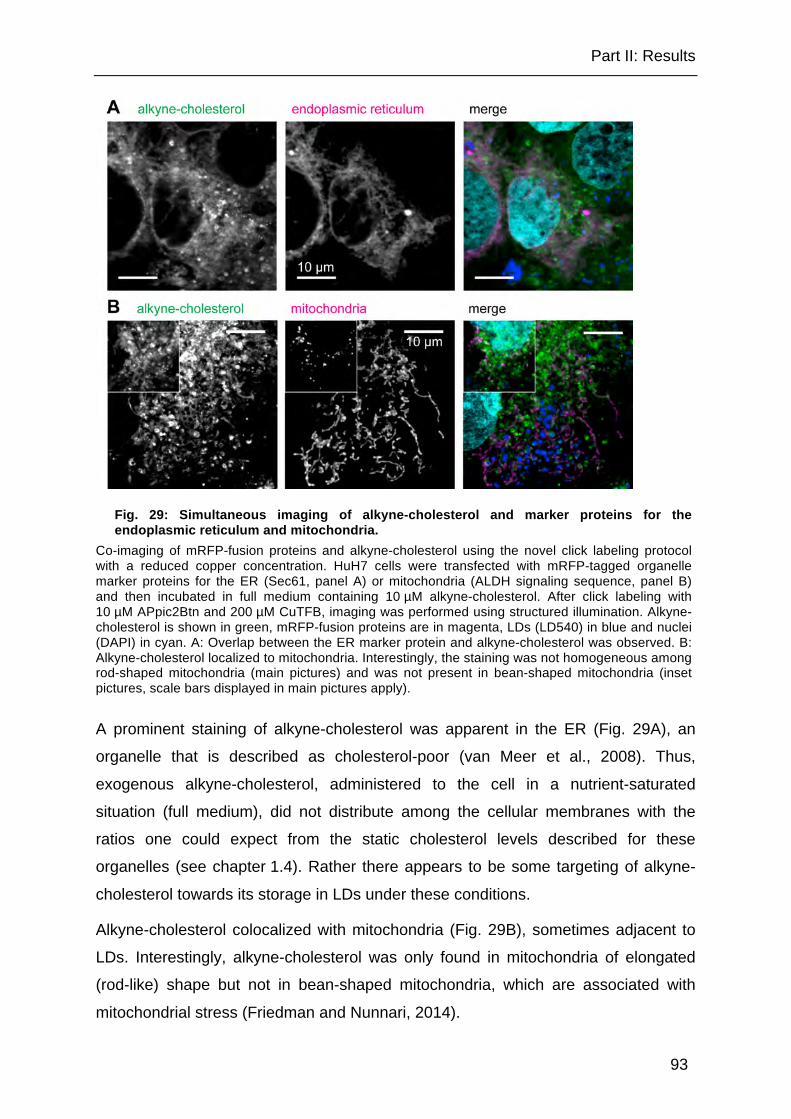
Part II: Results
93
Fig. 29: Simultaneous imaging of alkyne-cholesterol and marker proteins for the endoplasmic reticulum and mitochondria.
Co-imaging of mRFP-fusion proteins and alkyne-cholesterol using the novel click labeling protocol with a reduced copper concentration. HuH7 cells were transfected with mRFP-tagged organelle marker proteins for the ER (Sec61, panel A) or mitochondria (ALDH signaling sequence, panel B) and then incubated in full medium containing 10 µM alkyne-cholesterol. After click labeling with 10 µM APpic2Btn and 200 µM CuTFB, imaging was performed using structured illumination. Alkyne-cholesterol is shown in green, mRFP-fusion proteins are in magenta, LDs (LD540) in blue and nuclei (DAPI) in cyan. A: Overlap between the ER marker protein and alkyne-cholesterol was observed. B: Alkyne-cholesterol localized to mitochondria. Interestingly, the staining was not homogeneous among rod-shaped mitochondria (main pictures) and was not present in bean-shaped mitochondria (inset pictures, scale bars displayed in main pictures apply).
A prominent staining of alkyne-cholesterol was apparent in the ER (Fig. 29A), an
organelle that is described as cholesterol-poor (van Meer et al., 2008). Thus,
exogenous alkyne-cholesterol, administered to the cell in a nutrient-saturated
situation (full medium), did not distribute among the cellular membranes with the
ratios one could expect from the static cholesterol levels described for these
organelles (see chapter 1.4). Rather there appears to be some targeting of alkyne-
cholesterol towards its storage in LDs under these conditions.
Alkyne-cholesterol colocalized with mitochondria (Fig. 29B), sometimes adjacent to
LDs. Interestingly, alkyne-cholesterol was only found in mitochondria of elongated
(rod-like) shape but not in bean-shaped mitochondria, which are associated with
mitochondrial stress (Friedman and Nunnari, 2014).

Part II: Results
94
A colocalization of the ER-marker Sec61 (Fig. 29A) and alkyne-cholesterol in the
vicinity of LDs was rarely observed. Sec61, with its function in the membrane
translocation of proteins (Osborne et al., 2005), may not be the perfect marker for
this specific subdomain of the ER (Lynes and Simmen, 2011). Therefore, ACAT1
was included as a more specific marker for this subcompartment (Fig. 30A), and the
colocalization of alkyne-cholesterol with mRFP-ACAT1 in direct contact to the LDs
implies that the structures stained here could be sites of cholesterol esterification.
With probably nine transmembrane domains (Chang et al., 2009), mRFP-ACAT1
localizes to the ER, but not LDs. This might indicate that the rings around LDs,
positive for alkyne-cholesterol and mRFP-ACAT1, are not part of the droplet
(hemimembrane and outer part of the core), but rather ER wrapped around it.
Nevertheless, it has to be stressed that the overexpression of mRFP-ACAT1 and the
loading with large amounts of unlabeled cholesterol could have led to an
unphysiological response of the cell, depositing a lot of this protein near the LD. With
lower endogeneous levels of ACAT and lower cholesterol levels the vicinity of LDs is
likely to be less crowded with the enzyme. Subsequently, the question arises
whether alkyne-cholesterol in these rings was localized directly on the LDs or in
associated membranes. This question was addressed with super-resolution
microscopy (see below).
Co-imaging of alkyne-cholesterol was performed with overexpressed and mRFP1-
tagged NSDHL (NAD(P) dependent steroid dehydrogenase-like protein, Fig. 30B),
an enzyme in post-squalene cholesterol biosynthesis that is also known as “sterol-4-
α-carboxylate 3-dehydrogenase, decarboxylating” and described to localize to the
ER as well as LDs (Caldas and Herman, 2003; Ohashi et al., 2003). In our studies in
HuH7 cells, mRFP-NSDHL was found in these two organelles as well, and to some
extent a colocalization with alkyne-cholesterol was observed. However the alkyne-
cholesterol signal in the NSDHL-positive LD rings appeared to be less prominent
than for ACAT1-positive rings. This points to a preferential targeting of alkyne-
cholesterol to an ACAT1-adjacent subpopulation of LDs. Furthermore, membrane
connections to NSDHL-positive rings seemed sparser than for ACAT1-positive rings,
which suggests a differential degree of embedding of the two LD populations into the
ER network. Colocalization of alkyne-cholesterol with NSDHL in rings around LDs
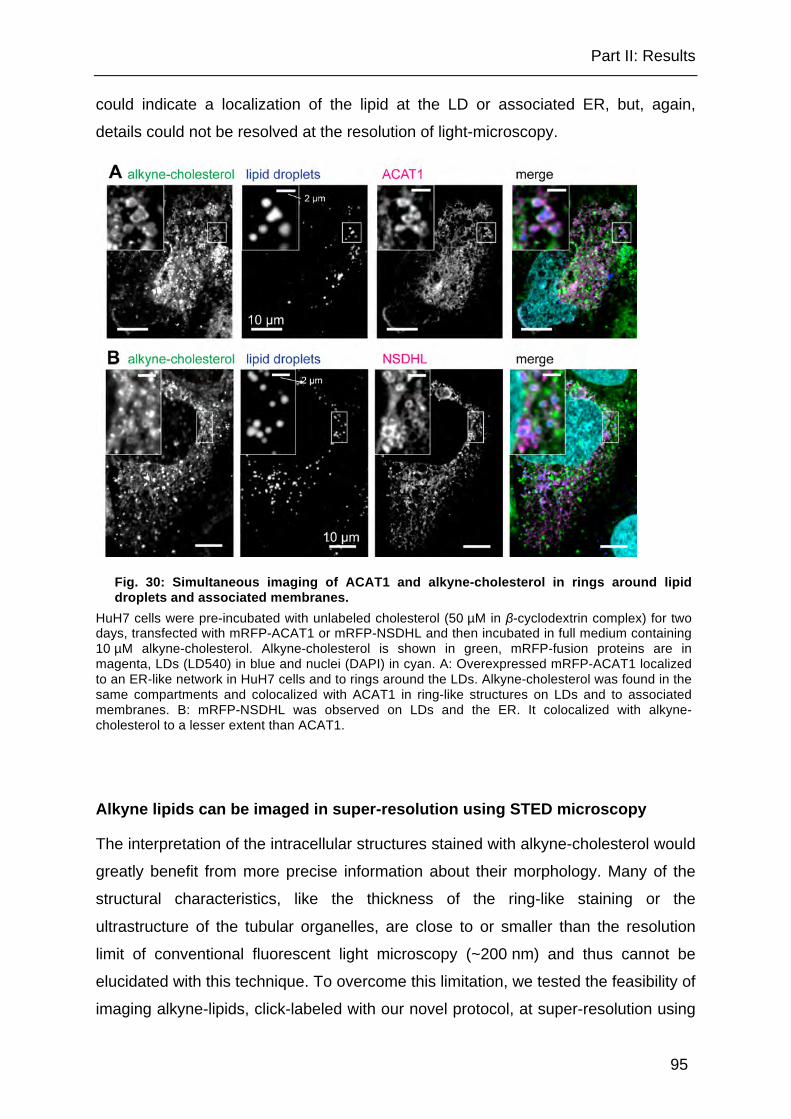
Part II: Results
95
could indicate a localization of the lipid at the LD or associated ER, but, again,
details could not be resolved at the resolution of light-microscopy.
Fig. 30: Simultaneous imaging of ACAT1 and alkyne-cholesterol in rings around lipid droplets and associated membranes.
HuH7 cells were pre-incubated with unlabeled cholesterol (50 µM in β-cyclodextrin complex) for two days, transfected with mRFP-ACAT1 or mRFP-NSDHL and then incubated in full medium containing 10 µM alkyne-cholesterol. Alkyne-cholesterol is shown in green, mRFP-fusion proteins are in magenta, LDs (LD540) in blue and nuclei (DAPI) in cyan. A: Overexpressed mRFP-ACAT1 localized to an ER-like network in HuH7 cells and to rings around the LDs. Alkyne-cholesterol was found in the same compartments and colocalized with ACAT1 in ring-like structures on LDs and to associated membranes. B: mRFP-NSDHL was observed on LDs and the ER. It colocalized with alkyne-cholesterol to a lesser extent than ACAT1.
Alkyne lipids can be imaged in super-resolution using STED microscopy
The interpretation of the intracellular structures stained with alkyne-cholesterol would
greatly benefit from more precise information about their morphology. Many of the
structural characteristics, like the thickness of the ring-like staining or the
ultrastructure of the tubular organelles, are close to or smaller than the resolution
limit of conventional fluorescent light microscopy (~200 nm) and thus cannot be
elucidated with this technique. To overcome this limitation, we tested the feasibility of
imaging alkyne-lipids, click-labeled with our novel protocol, at super-resolution using
Part II: Results
96
STED. STED imaging was performed with Dr. Jan-Gero Schlötel, group of Prof.
Thorsten Lang.
Figure 31 shows that alkyne-cholesterol in fixed A172 cells, click-labeled with
APpic2Btn, could be detected with a good signal-to-noise ratio at the STED
microscope. Detail regions of the cell in panel A were imaged with confocal and
STED settings so that the resolution of the two techniques could be directly
compared. Although the confocal images appeared to have a slightly better signal-to-
noise ratio, the contrast in the STED images was good.
For quantification of resolution, signal intensity profiles were plotted for ROIs in a
micrograph (Fig. 31B and C). The calculation of the FWHM (orange arrows) for a
peak in ROI 1 demonstrated that the thickness of the alkyne-cholesterol signal
around the LD was judged by confocal microscopy to be about 400 nm, whereas
STED revealed that a 200 nm thick ring is observed for this particular droplet. This is
well above the resolution limit of the STED method and thus can be considered a
fairly accurate measure. Hence, some of the click-labeled alkyne-cholesterol rings
are much thicker than a LD monolayer or a single membrane bilayer (see chapter
4.3.2.2 for a broader discussion). Thinner structures were also observed. ROI 2 cut
through a structure identified as a single signal peak in the confocal profile, but
separated into two different features at the higher STED resolution (green arrows). A
thin ring rim of about 100 nm was identified (corresponding to a width of 3 to 4
pixels).

Part II: Results
97
Fig. 31: Super-resolution imaging of alkyne-cholesterol by STED microscopy. Alkyne-cholesterol was imaged with STED at very high resolution after click labeling with 10 µM APpic2Btn and 200 µM CuTFB and conjugation to streptavidin-Alexa488. A: Confocal micrograph of click-labeled alkyne-cholesterol (green) in an A172 cell, detail images (red and yellow boxes, alkyne-cholesterol in gray) were acquired in confocal mode and STED mode. B: Detail region of the cell in panel A displayed using a pseudo-color look-up table (FireLUT). Numbered yellow lines depict ROIs used for signal profiles in panel C. C: Signal intensity profiles of ROIs. Orange arrows indicate the different FWHM values as a measure of the width of the ring-shaped alkyne-cholesterol signal cut by ROI 1. Profile 2 shows a cut through a thinner ring structure (green arrows), which was separated from a second structure with the STED method, but not with confocal microscopy.
Part II: Results
98
STED super-resolution detects alkyne-cholesterol positive membrane contacts between LDs and ER
With STED as a super-resolution technique at hand, detailed insight into the
structure of the alkyne-cholesterol signal could be provided. Alkyne-cholesterol was
detected in tubular organelles near alkyne-cholesterol positive LDs (Fig. 32). These
endomembranes were undulating around LDs in the perinuclear region (Fig. 32B)
and tubules stretched out between the perinuclear and the peripheral regions of the
cell (Fig. 32C).
The tubular structures (green arrowheads in Fig. 32B) in the perinuclear region
appeared as a dense network of stretched out and curved structures and were found
close to LDs bearing a ring-shaped alkyne-cholesterol signal (orange arrowheads).
In many cells, alkyne-cholesterol positive tubular structures were found that connect
the periphery with the perinuclear region. Often, several LDs were found at one end
(Fig. 32 C) or both ends, or along their trajectory (Fig. 33).
An important prerequisite to identify LDs at the STED microscope was the feasibility
of co-imaging with the dye LD540. The LD dye itself could not be imaged at STED
resolution with the laser setup of the microscope used here, but it was possible to
acquire images with good contrast in confocal mode (Fig. 32B and C, LD540
(magenta) overlayed with the alkyne-cholesterol in STED mode (gray)). Because
LD540 was excited by the STED laser, a pre-bleaching step was used between
acquisition in confocal and in STED mode. This way, LD540 did not cause significant
bleed-through signal in the STED acquisition of the alkyne-cholesterol signal.
Fig. 32D to F demonstrates the presence of a lumen inside the stretched out tubule
of Fig. 32C. A pseudo-color image (FireLUT, panel D) displayed low alkyne-
cholesterol signal (blue to red) in the center of the tubule, flanked by high signal
(yellow to white) on both sides. The signal intensity of this image was plotted on the
Z-axis, resulting in a 3D Surface plot (Fig. 32D) in which the lumen was now more
easily visible as “valley” between two ridges of higher signal. Panel F shows a signal
intensity profile of a ROI cutting through the tubular structure (see yellow line in Fig.
32D). From the distance between the two maxima in the ROI profile, the width of the
tubule was estimated to be around 130 nm.

Part II: Results
99
Fig. 32: Structural characteristics of alkyne-cholesterol positive membranes around lipid droplets.
A: HuH7 cell fed with alkyne-cholesterol (green) and labeled as described before with APpic2Btn, confocal image, LDs stained with LD540 (magenta). B and C: Details of the same cell, single Z-layer. Alkyne-cholesterol (gray) was imaged with STED microscopy. Overlay image with confocal signal from LD540 (magenta). Alkyne-cholesterol localized to ring-like structures around LDs (orange arrowheads) and to tubular organelles in their proximity (green arrowheads). D: FireLUT image of the stretched out tubule from the micrograph in panel C. The yellow line marks the ROI used for creating the signal profile in panel F. E: 3D surface plot (displaying the signal intensity on the Z-axis) of the image in panel D. The morphology of the organelle strongly resembled the ER. The lumen of the tubular organelle is visible as a dark “valley” between the two bright ridges of the ER leaflets. F: Signal profile of the ROI designated in panel D. A thickness of the tubule of around 130 nm was measured.

Part II: Results
100
Taken together, the tubular organelles strongly resembled the ER in morphology. ER
undulating near and partially wrapped around LDs could contribute to the
appearance of alkyne-cholesterol rings around LDs. On the other hand, the more
prominent rings around LDs (Fig. 31) were far too thick for a lipid bilayer or even an
ER tubule and showed no sign of an ultrastructure. They are thus likely to consist of
the LD hemimembrane and outer parts of the core.
Direct connections between alkyne-cholesterol in the ER tubules and the alkyne-
cholesterol localized around LDs were visible (Fig. 33). Along bundles of ER tubules
stretched out from the perinuclear region to the periphery, clusters of large and
smaller LDs were observed (Fig. 33A).
When alkyne-cholesterol was imaged in STED resolution (Fig. 33B, green) and the
signal overlayed with LD540 indicating LDs (confocal acquisition, magenta), several
contacts between the two organelles were obvious. In a deconvoluted version of the
image (Fig. 33C), the direct connections became even more apparent. The LD
surface was either directly associated with the ER tubule (orange arrowheads), or
connected to it via membrane bridges (green arrowheads). Occasionally, also
membrane connections between two LDs were observed (blue arrowhead). Care
has to be taken in the interpretation of deconvoluted images because the
deconvolution algorithm could produce artifacts. The structures highlighted in
panel C were therefore double-checked, they were also present in the unprocessed
image (Fig. 33B), but with lower contrast. The LDs in Fig. 33B ranged from larger
LDs with diameters over 1 µm to very small ones (200 to 300 nm) that are about the
same size as early LDs directly after biogenesis (Kassan et al., 2013; Pol et al.,
2014), and appeared to be fully stained by alkyne-cholesterol (see chapter 4.3.2.2
for a broader discussion).
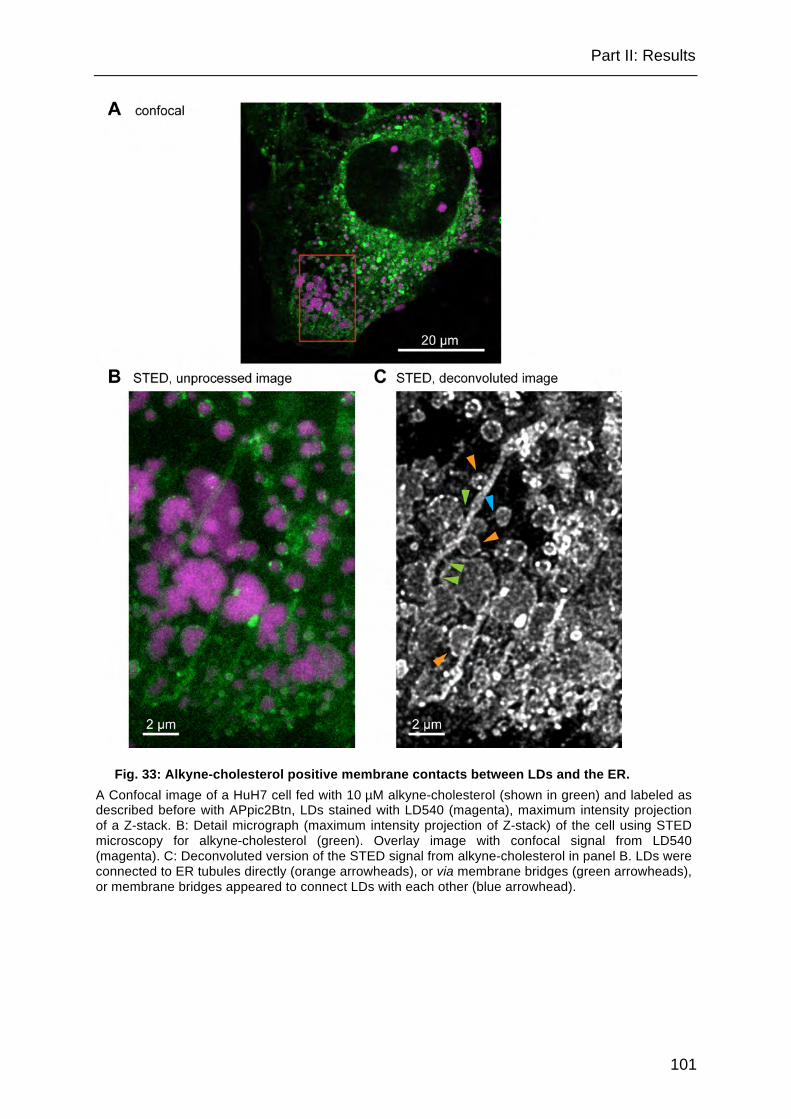
Part II: Results
101
Fig. 33: Alkyne-cholesterol positive membrane contacts between LDs and the ER. A Confocal image of a HuH7 cell fed with 10 µM alkyne-cholesterol (shown in green) and labeled as described before with APpic2Btn, LDs stained with LD540 (magenta), maximum intensity projection of a Z-stack. B: Detail micrograph (maximum intensity projection of Z-stack) of the cell using STED microscopy for alkyne-cholesterol (green). Overlay image with confocal signal from LD540 (magenta). C: Deconvoluted version of the STED signal from alkyne-cholesterol in panel B. LDs were connected to ER tubules directly (orange arrowheads), or via membrane bridges (green arrowheads), or membrane bridges appeared to connect LDs with each other (blue arrowhead).
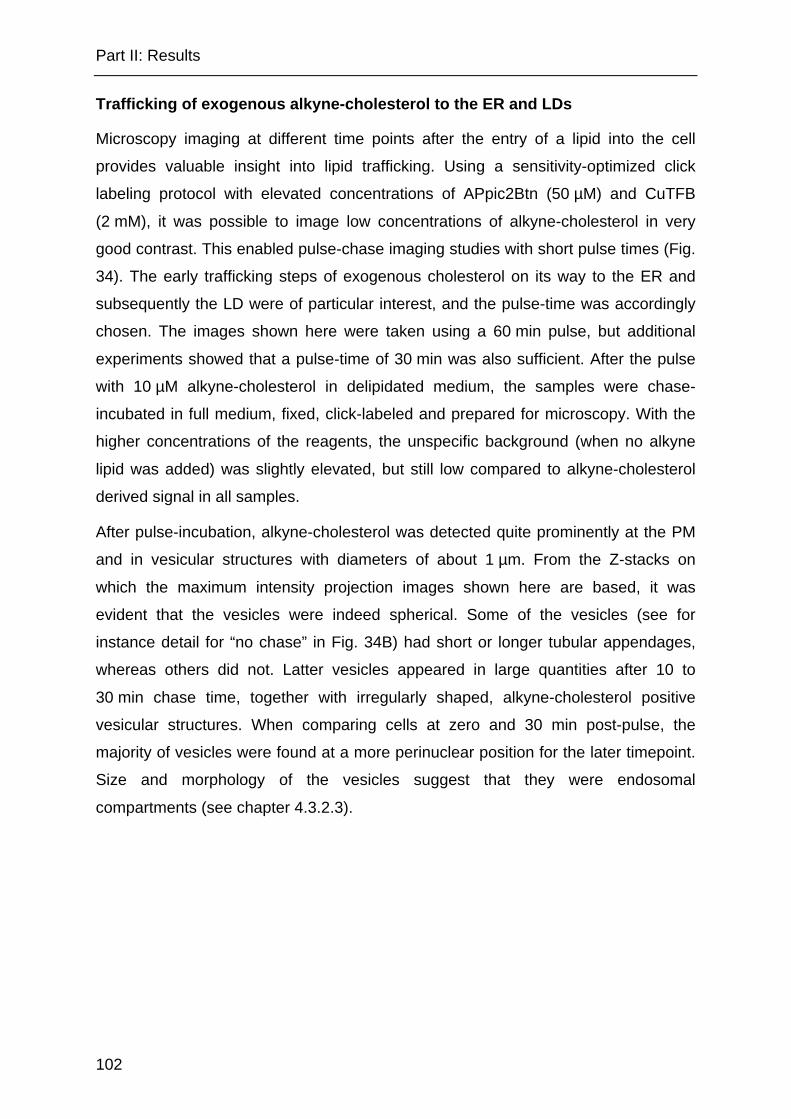
Part II: Results
102
Trafficking of exogenous alkyne-cholesterol to the ER and LDs
Microscopy imaging at different time points after the entry of a lipid into the cell
provides valuable insight into lipid trafficking. Using a sensitivity-optimized click
labeling protocol with elevated concentrations of APpic2Btn (50 µM) and CuTFB
(2 mM), it was possible to image low concentrations of alkyne-cholesterol in very
good contrast. This enabled pulse-chase imaging studies with short pulse times (Fig.
34). The early trafficking steps of exogenous cholesterol on its way to the ER and
subsequently the LD were of particular interest, and the pulse-time was accordingly
chosen. The images shown here were taken using a 60 min pulse, but additional
experiments showed that a pulse-time of 30 min was also sufficient. After the pulse
with 10 µM alkyne-cholesterol in delipidated medium, the samples were chase-
incubated in full medium, fixed, click-labeled and prepared for microscopy. With the
higher concentrations of the reagents, the unspecific background (when no alkyne
lipid was added) was slightly elevated, but still low compared to alkyne-cholesterol
derived signal in all samples.
After pulse-incubation, alkyne-cholesterol was detected quite prominently at the PM
and in vesicular structures with diameters of about 1 µm. From the Z-stacks on
which the maximum intensity projection images shown here are based, it was
evident that the vesicles were indeed spherical. Some of the vesicles (see for
instance detail for “no chase” in Fig. 34B) had short or longer tubular appendages,
whereas others did not. Latter vesicles appeared in large quantities after 10 to
30 min chase time, together with irregularly shaped, alkyne-cholesterol positive
vesicular structures. When comparing cells at zero and 30 min post-pulse, the
majority of vesicles were found at a more perinuclear position for the later timepoint.
Size and morphology of the vesicles suggest that they were endosomal
compartments (see chapter 4.3.2.3).
Part II: Results
103
Fig. 34: Pulse-chase analysis of the intracellular localization of alkyne-cholesterol in HuH7 cells.
A: Micrographs of HuH7 cells pulse-labeled with 10 µM alkyne-cholesterol in serum-free medium supplemented with 1 % lipid-free BSA for 60 min, followed by different chase times in full medium, as indicated. For enhanced detection sensitivity, click labeling was performed with 50 µM APpic2Btn and 2 mM CuTFB. Alkyne-cholesterol is displayed in green, LDs (LD540) in magenta, nuclei (DAPI) in blue. Maximum intensity projections of Z-stacks covering the whole cell, taken at the epifluorescence microscope under structured illumination. Two images with the same magnification are shown next to each other for each timepoint. B: Detail regions from panel A (white frames in A).
While the intensity of the alkyne-cholesterol signal at the PM and in vesicles
decreased with chase time, a concomitant signal increase was detected in a tubular
network, presumably the ER, throughout the cells and in rings around LDs. Alkyne-

Part II: Results
104
cholesterol signal around LDs was occasionally detected directly after the pulse, but
only around small, peripheral LDs and with low intensities. The ring-like signal
around the LDs became much more intense after 30 to 60 min chase. Alkyne-
cholesterol localized to small LDs first, later it was also found around larger LDs.
Whereas without the addition of alkyne-cholesterol and without chase, a
subpopulation of LDs was often found at the cell periphery, after 30 min chase the
LDs in many cells were located at a more perinuclear position.
Taken together, this preliminary pulse-chase study indicates that exogenous alkyne-
cholesterol is taken up by HuH7 cells under nutrient-saturated conditions, at least
partially traffics to endosomal compartments and is loaded onto LDs for storage.
Alkyne-cholesterol localization to lipid droplets is influenced by lipid loading
To test the effect of the metabolic state of hepatocytes, and especially of neutral
lipids stored in their LDs, on alkyne-cholesterol localization, HuH7 cells were loaded
with unlabeled fatty acid or cholesterol to induce the formation of TAG-rich or CE-rich
LDs, respectively. We first validated if with our feeding scheme CE-rich LDs can be
distinguished from LDs containing less CE (Fig. 35).
For that purpose, polarized light microscopy was used (see chapter 1.2), which can
identify the birefringent properties of LDs whose core contains a very high proportion
of CE. These anisotropic LDs, recognizable from formée cross-shaped signals, were
very rarely present under normal growth conditions or oleate feeding, but many of
them formed upon loading of the cells with cholesterol (Fig. 35A). Thus, the lipid
loading protocol was suited to distinguish between two classes of LDs with different
CE content. Different proportions of the LD pool of single cholesterol-loaded cells
were birefringent, ranging from cells with only isotropic LDs over a mixed population
(like shown in Fig. 35A) to cells with predominantly anisotropic LDs. Alkyne-
cholesterol localized to both CE-rich and CE-poor LDs to a certain extent in this first
experiment. This targeting was investigated in detail in further detail (see Figs. 36, 37
and 38).

Part II: Results
105
Fig. 35: Birefringent lipid droplets in HuH7 cells after loading with cholesterol. HuH7 cells were incubated in full medium supplemented with no additional lipid, 50 µM oleate or 200 µM cholesterol (as β-cyclodextrin complex) for two days, followed by 17 h incubation with unlabeled lipid and 10 µM alkyne-cholesterol. After fixation and standard click labeling (10 µM APpic2Btn, 200 µM CuTFB) cells were imaged with structured illumination for fluorescently labeled alkyne-cholesterol (green), LDs (magenta) and nuclei (DAPI). In addition, polarized light microscopy was used to distinguish isotropic and anisotropic LDs. CE-rich anisotropic LDs could be identified by a bright formée cross whereas isotropic LDs were dark. A: Many birefringent LDs were found after loading with cholesterol, but not after incubation in standard growth medium or after oleate feeding. B: Enlarged detail with many birefringent LDs from cholesterol-loaded HuH7 cells as shown in panel A. LD540 (shown in FireLUT as a single channel, 2nd picture from the right, but in magenta in the merge) stained LDs as spherical objects, but unlike in unloaded or fatty acid-loaded cells, the staining was not solid but less intense in the center of the droplets.
Besides the formée cross, anisotropic LDs were characterized by a specific staining
pattern with LD540 (Fig. 35B). Unlike TAG-rich LDs after oleate loading (see Fig.
35A) which always showed a bright LD540 signal throughout the droplet, CE-rich
LDs were not stained uniformly, but rather the staining was less effective in the
center of the core. This is probably due to the higher degree of ordering in CE-rich

Part II: Results
106
LDs. LipidToxGreenTM, a dye of proprietary structure, stains CE-rich LDs much less
efficiently, and also with decreasing efficiency towards the center of the LDs, as
detected by Bautista and colleagues in macrophages (Bautista et al., 2014). The
authors of the study attributed this phenomenon to the distinct physical properties of
CE- and TAG-rich LDs, which they investigated in detail with THG imaging.
After the validation of the setup, we tested if the loading of HuH7 hepatocytes with
fatty acids or cholesterol changed their lipid metabolism. Lipid extracts from lipid-
loaded and alkyne-cholesterol-fed cells were click-labeled with azido-coumarin and
separated by TLC (Fig. 36). The section of the TLC displaying unlabeled TAG and
CE (Fig. 36A) gives a static view of the neutral lipids accumulated within LDs.
Without the addition of unlabeled lipids and without alkyne-cholesterol, small
amounts of both CE and TAG were detected in the extract. Alkyne-cholesterol
feeding shifted that profile to slightly more CE and less TAG. Oleate loading, to a
greater extent than incubation with palmitate, promoted the biosynthesis of TAG.
When cholesterol was fed, the CE content increased and TAG was almost
completely absent, as judged by the semiquantitative method of sulfuric acid
charring (Fig. 36A). The addition of an ACAT inhibitor (avasimibe or CP-113,818)
almost completely abolished CE accumulation and also greatly reduced TAG
formation.
Alkyne-cholesterol and its esters, labeled with azido-coumarin, were detected on a
different section of the TLC plate under UV light (Fig. 36B and C). The uptake of
alkyne-cholesterol, which can be estimated from the overall fluorescent signal, was
similar for all lipid feeding regimes within the limited accuracy available from this
single experiment. A moderate increase in the overall signal might be present after
cholesterol loading. The co-incubation with the inhibitor CP-113,818 or avasimibe led
to decreased levels of unesterified alkyne-cholesterol in cells without lipid loading,
but higher levels of alkyne-cholesterol were detected in cells pre-loaded with
cholesterol. These trends need statistical solidification from repeated experiments.
The degree of esterification of alkyne-cholesterol might depend on the feeding
regime, but no quantitative conclusions can be drawn from the single experiment
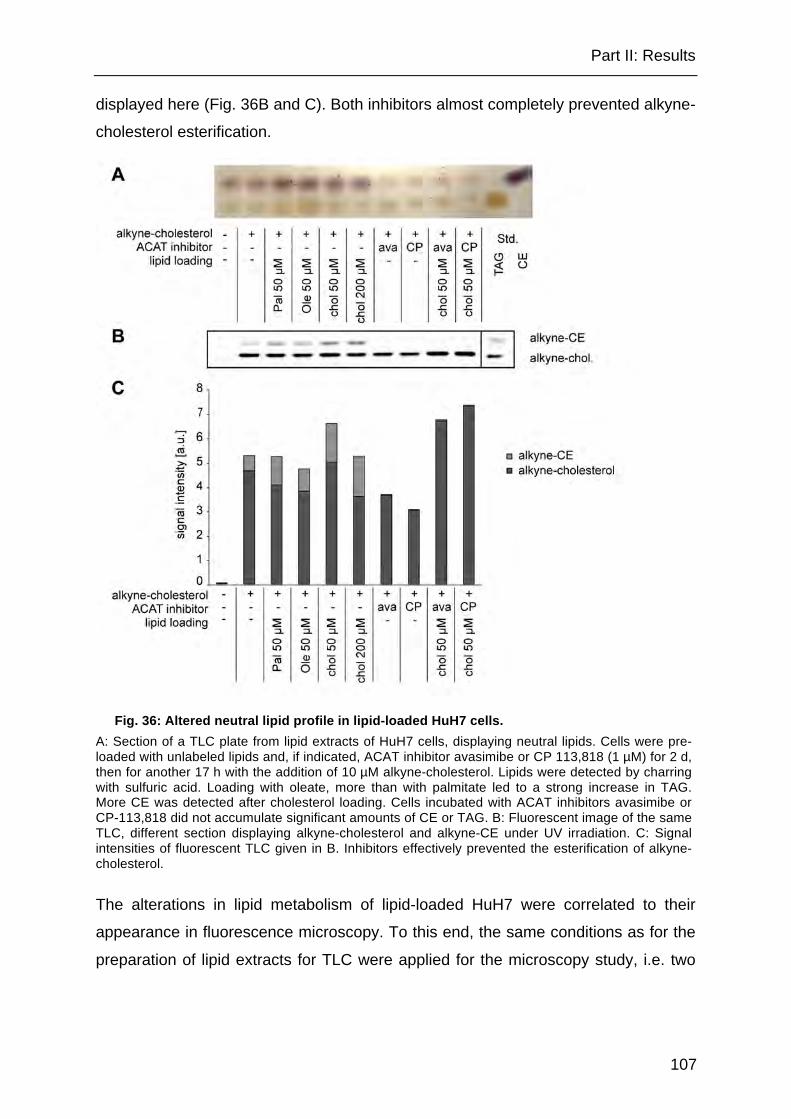
Part II: Results
107
displayed here (Fig. 36B and C). Both inhibitors almost completely prevented alkyne-
cholesterol esterification.
Fig. 36: Altered neutral lipid profile in lipid-loaded HuH7 cells. A: Section of a TLC plate from lipid extracts of HuH7 cells, displaying neutral lipids. Cells were pre-loaded with unlabeled lipids and, if indicated, ACAT inhibitor avasimibe or CP 113,818 (1 µM) for 2 d, then for another 17 h with the addition of 10 µM alkyne-cholesterol. Lipids were detected by charring with sulfuric acid. Loading with oleate, more than with palmitate led to a strong increase in TAG. More CE was detected after cholesterol loading. Cells incubated with ACAT inhibitors avasimibe or CP-113,818 did not accumulate significant amounts of CE or TAG. B: Fluorescent image of the same TLC, different section displaying alkyne-cholesterol and alkyne-CE under UV irradiation. C: Signal intensities of fluorescent TLC given in B. Inhibitors effectively prevented the esterification of alkyne-cholesterol.
The alterations in lipid metabolism of lipid-loaded HuH7 were correlated to their
appearance in fluorescence microscopy. To this end, the same conditions as for the
preparation of lipid extracts for TLC were applied for the microscopy study, i.e. two

Part II: Results
108
days of lipid pre-loading, continued for another 17 h under the addition of alkyne-
cholesterol (Fig. 37).
Palmitate loading of HuH7 resulted in the formation of blistery lipid accumulations
with diameters of about 1-2 µm (Fig. 37A), presumably lysosomes, dilated ER or
autophagosomes (Park et al., 2014). These structures did not accumulate significant
amounts of LD540, but incorporated alkyne-cholesterol. LDs (LD540-positive
structures) were rarely formed in cells with such large lipid accumulations.
The TAG-rich LDs of oleate-loaded HuH7 were larger than LDs of cholesterol-fed
cells, and they appeared to be more clustered, often in large groups that partially
encircle the nucleus. In many cells, alkyne-cholesterol localized to almost all LDs,
with the occasional exception of peripheral, less clustered ones. The staining
patterns on the oleate-induced LDs was ring-like, segmented or confined to a sector
of the droplet surface, frequently to regions were multiple droplets were in contact
with each other, i.e. the center of a cluster.
Cholesterol loading led to the formation of smaller, more uniformly sized and less
clustered LDs than oleate pre-treatment. Alkyne-cholesterol localized to a significant
proportion of LDs, but not all of them, in the majority of cells, and it also localized to
peripheral LDs. The staining was almost exclusively full-ring shaped and quite
heterogeneous in signal intensity.
The incubation of the cells with the ACAT inhibitor CP-113,818 almost completely
abolished the formation of LDs (Fig. 37B), as expected from the minimal content of
neutral lipids and esterified alkyne-cholesterol on the TLC (Fig. 36). The alkyne-
cholesterol signal in the microscopy samples was considerable lower if either
inhibitor was applied, and located at elongated structures that sometimes showed a
faint LD540 signal. They resembled those found at earlier time points of the pulse-
chase study, indicating that the lipid was stored in some vesicular organelle, like for
instance a dilated form of the ERC (Hao et al., 2002), when esterification and thus
deposition on LDs was hampered. After cholesterol loading and concomitant
incubation with an inhibitor large, round alkyne-cholesterol positive vesicles were
observed, similar to those detected after palmitate loading. This may point to the
formation of lysosomes/ autophagosomes, but further experiments are needed to
validate this finding.
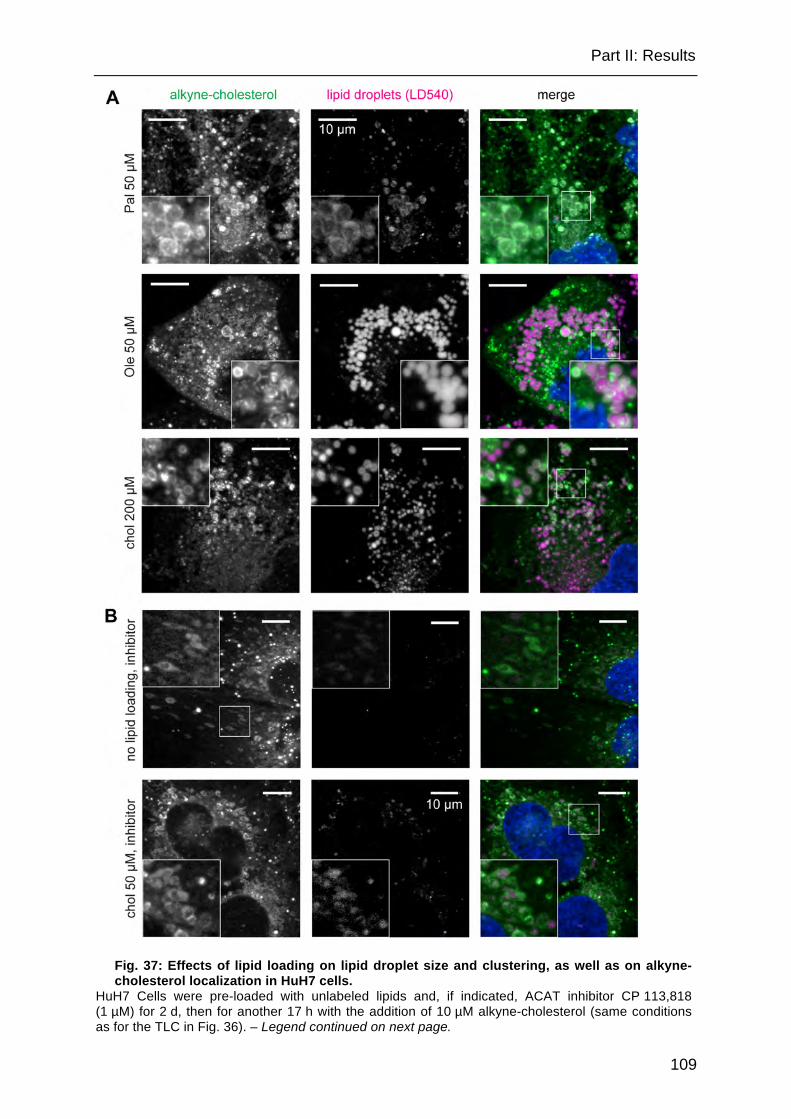
Part II: Results
109
Fig. 37: Effects of lipid loading on lipid droplet size and clustering, as well as on alkyne-cholesterol localization in HuH7 cells.
HuH7 Cells were pre-loaded with unlabeled lipids and, if indicated, ACAT inhibitor CP 113,818 (1 µM) for 2 d, then for another 17 h with the addition of 10 µM alkyne-cholesterol (same conditions as for the TLC in Fig. 36). – Legend continued on next page.
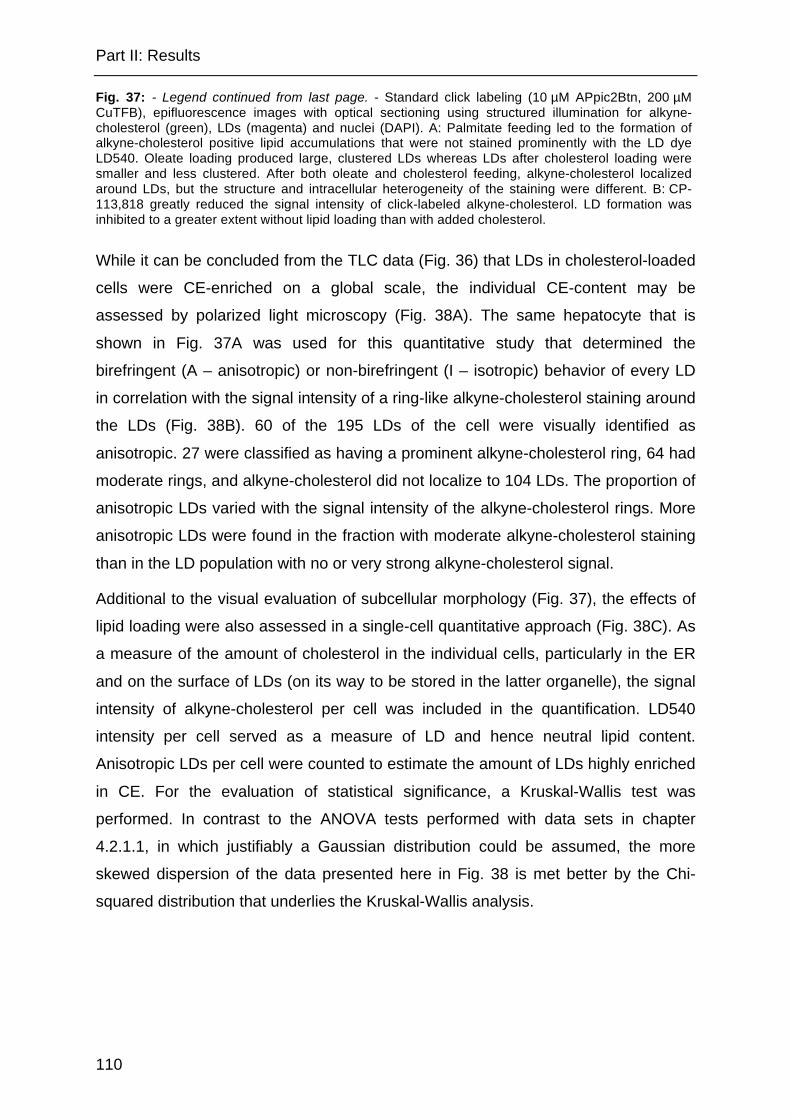
Part II: Results
110
Fig. 37: - Legend continued from last page. - Standard click labeling (10 µM APpic2Btn, 200 µM CuTFB), epifluorescence images with optical sectioning using structured illumination for alkyne-cholesterol (green), LDs (magenta) and nuclei (DAPI). A: Palmitate feeding led to the formation of alkyne-cholesterol positive lipid accumulations that were not stained prominently with the LD dye LD540. Oleate loading produced large, clustered LDs whereas LDs after cholesterol loading were smaller and less clustered. After both oleate and cholesterol feeding, alkyne-cholesterol localized around LDs, but the structure and intracellular heterogeneity of the staining were different. B: CP-113,818 greatly reduced the signal intensity of click-labeled alkyne-cholesterol. LD formation was inhibited to a greater extent without lipid loading than with added cholesterol.
While it can be concluded from the TLC data (Fig. 36) that LDs in cholesterol-loaded
cells were CE-enriched on a global scale, the individual CE-content may be
assessed by polarized light microscopy (Fig. 38A). The same hepatocyte that is
shown in Fig. 37A was used for this quantitative study that determined the
birefringent (A – anisotropic) or non-birefringent (I – isotropic) behavior of every LD
in correlation with the signal intensity of a ring-like alkyne-cholesterol staining around
the LDs (Fig. 38B). 60 of the 195 LDs of the cell were visually identified as
anisotropic. 27 were classified as having a prominent alkyne-cholesterol ring, 64 had
moderate rings, and alkyne-cholesterol did not localize to 104 LDs. The proportion of
anisotropic LDs varied with the signal intensity of the alkyne-cholesterol rings. More
anisotropic LDs were found in the fraction with moderate alkyne-cholesterol staining
than in the LD population with no or very strong alkyne-cholesterol signal.
Additional to the visual evaluation of subcellular morphology (Fig. 37), the effects of
lipid loading were also assessed in a single-cell quantitative approach (Fig. 38C). As
a measure of the amount of cholesterol in the individual cells, particularly in the ER
and on the surface of LDs (on its way to be stored in the latter organelle), the signal
intensity of alkyne-cholesterol per cell was included in the quantification. LD540
intensity per cell served as a measure of LD and hence neutral lipid content.
Anisotropic LDs per cell were counted to estimate the amount of LDs highly enriched
in CE. For the evaluation of statistical significance, a Kruskal-Wallis test was
performed. In contrast to the ANOVA tests performed with data sets in chapter
4.2.1.1, in which justifiably a Gaussian distribution could be assumed, the more
skewed dispersion of the data presented here in Fig. 38 is met better by the Chi-
squared distribution that underlies the Kruskal-Wallis analysis.
Part II: Results
111
Fig. 38: Analysis of the localization of alkyne-cholesterol to birefringent and non-birefringent lipid droplets and quantitative analysis of lipid loading effects.
A: Single Z-layer epifluorescence image of a HuH7 cell, taken under structured illumination. Cells were fed with unlabeled cholesterol (200 µM) and alkyne-cholesterol (10 µM, click-labeled, displayed in green). LDs were stained with LD540 (magenta) and their birefringence was visualized with polarized light. B: Quantification of the localization of alkyne-cholesterol to LDs of the hepatocyte in panel A. All individual LDs were scored visually as isotropic (I) or anisotropic (A), and as bearing no (-), moderate (+) or prominent (++) ring staining. 195 LDs were identified and analyzed in that single cell. The relative amount of anisotropic LDs was higher for LDs with moderate alkyne-cholesterol rings than for those with no alkyne-cholesterol or high alkyne-cholesterol signal. C: Quantification of the effect of lipid pre-loading on the signal intensity of alkyne-cholesterol and LD540, and on the number of birefringent LDs per cell. A total of 130 to 180 cells per sample were analyzed from epifluorescence images at 10 defined positions (same samples as in Fig. 37). Data points represent individual cells. In addition, the mean value and the standard deviation for all cells of a sample are given in the graph. Asterisks designate levels of statistical significance (Kruskal-Wallis test). If indicated, CP-113,818 was used as an ACAT inhibitor.
Part II: Results
112
Whereas upon oleate feeding, the alkyne-cholesterol signal visible in microscopy
was not significantly altered, cholesterol loading of HuH7 hepatocytes led to a
significant increase in alkyne-cholesterol signal per cell, which was efficiently
impeded by the addition of an ACAT inhibitor (CP-113,818, Fig. 38C). The neutral
lipid content inside LDs (LD540, Fig. 38C) on the other hand was not altered
significantly through pre-loading with neither oleate nor cholesterol. A caveat to the
interpretation of the LD540 signal is its non-uniform staining of CE-rich LDs, which
might lead to a slight underrepresentation of neutral lipid content in cholesterol-fed
samples (see Fig. 35B). CP-113,818 diminished the storage of neutral lipids inside
LDs. As expected from the outcome of the pilot experiment (Fig. 35A), only
cholesterol-loaded samples displayed significant amounts of birefringent LDs. The
addition of an ACAT inhibitor greatly, but not completely prevented the formation of
anisotropic LDs.
Taken together, the loading of HuH7 hepatocytes with oleate or cholesterol led to
distinct changes in the lipid profile, in LD morphological parameters like size and
clustering, and affected the localization of alkyne-cholesterol to LDs. Cholesterol
loading induced the formation of birefringent LDs highly enriched in CE, and alkyne-
cholesterol displayed preferential targeting to these LDs to some degree. On a per-
cell scale, cholesterol-loaded hepatocytes had higher amounts of alkyne-cholesterol
present on LDs and in membrane compartments around them than oleate-loaded
cells, but both displayed a similar overall amount of esterified neutral lipids in LDs.
These results indicate a metabolic switch of hepatocytes due to cholesterol loading.

Part II: Discussion
113
4.3 Discussion (Part II)
4.3.1 Highly sensitive imaging of alkyne lipids in biological membranes
Designing azide detection reagents for high click labeling sensitivity
As described above (chapter 1.1.4, Fig. 2), click labeling in biomembranes highly
depends on an azide reporter that is able to penetrate the membrane so that the
azide moiety can approach the alkyne in its central, hydrophobic part, as well as on
the simultaneous delivery of Cu(I) to the center of reaction. This is of particular
importance for the click labeling of rigid molecules like alkyne-cholesterol which
cannot bend out of the membrane like it may be possible for alkyne fatty acids. Thus
the characteristics of the azide detection reagent are likely to have a direct influence
on labeling sensitivity.
AP3Btn, a biotin reporter connected to the azide moiety through a PEG spacer, is
applied routinely in our laboratory for alkyne lipid imaging. With a set of novel azide
detection reagents that have the same fundamental structure, but an altered spacer
length or the additional capability to chelate copper, two questions were addressed
in this study: First, what is the optimal length of the spacer component? Second,
does our click labeling protocol benefit from copper chelation by the azide reporter?
Fig. 39 shows a DPPC bilayer as a model biomembrane, next to the reagents tested,
each click-reacted to alkyne-cholesterol. The conjugates are displayed to scale to
each other and the membrane. The hydroxyl group of cholesterol has been lined up
with the bilayer surface to give a realistic approximation of the possible orientation of
the conjugates inside the bilayer, under the assumption that they are in a stretched
conformation3. In the ASBDP conjugate, the sulfonated BDP dye is situated inside
the membrane, a potentially unfavourable position with regard to membrane
ultrastructure, which might contribute to the occasional occurrence of membrane
blebs with this detection reagent (Fig. 22). These artifacts might derive from a
3 In principal, multiple orientations of the reactions during click labeling are possible, leading to different conformations of the click-conjugates. These are discussed below (Fig. 40). Regardless of the conformation, the azide reporter’s spacer length determines how deep the reporting moiety (the dye or biotin) will be buried inside the membrane after the click reaction.
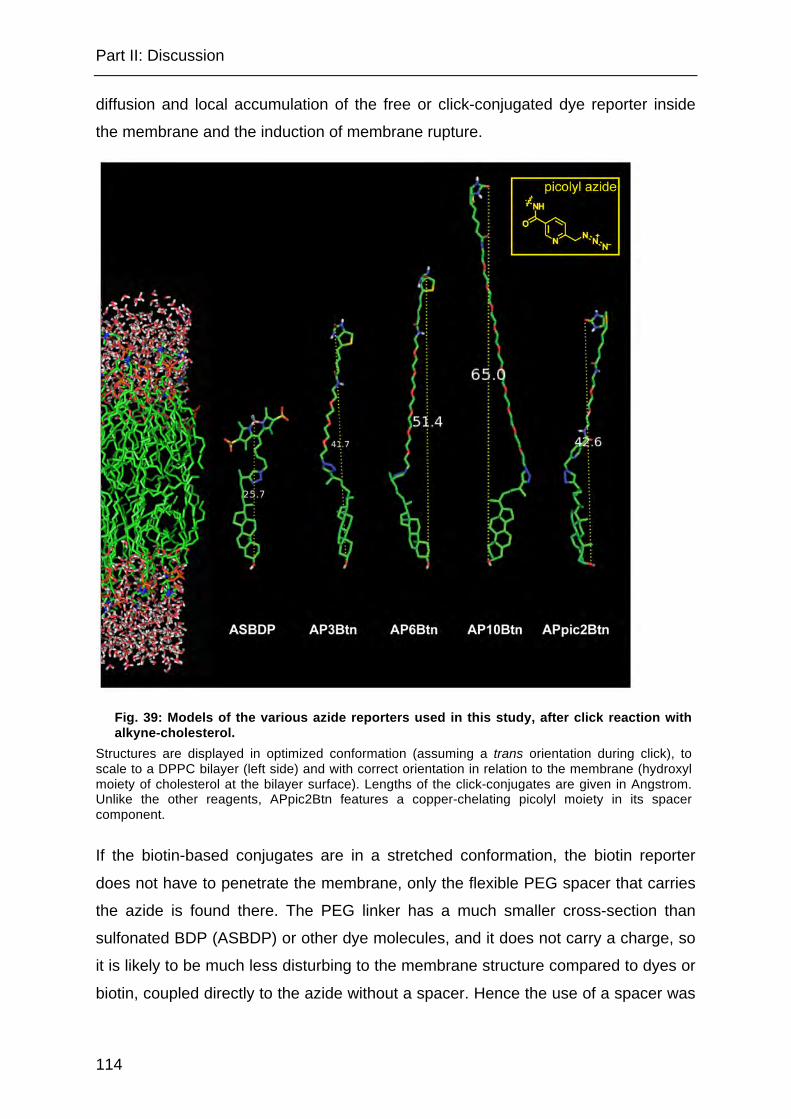
Part II: Discussion
114
diffusion and local accumulation of the free or click-conjugated dye reporter inside
the membrane and the induction of membrane rupture.
Fig. 39: Models of the various azide reporters used in this study, after click reaction with alkyne-cholesterol.
Structures are displayed in optimized conformation (assuming a trans orientation during click), to scale to a DPPC bilayer (left side) and with correct orientation in relation to the membrane (hydroxyl moiety of cholesterol at the bilayer surface). Lengths of the click-conjugates are given in Angstrom. Unlike the other reagents, APpic2Btn features a copper-chelating picolyl moiety in its spacer component.
If the biotin-based conjugates are in a stretched conformation, the biotin reporter
does not have to penetrate the membrane, only the flexible PEG spacer that carries
the azide is found there. The PEG linker has a much smaller cross-section than
sulfonated BDP (ASBDP) or other dye molecules, and it does not carry a charge, so
it is likely to be much less disturbing to the membrane structure compared to dyes or
biotin, coupled directly to the azide without a spacer. Hence the use of a spacer was

Part II: Discussion
115
generally beneficial for membrane morphology. The length of the spacer however is
critical for detection sensitivity.
AP3Btn gave significantly higher signal than AP6Btn and AP10Btn (Fig. 23). The
biotin moiety in the AP3Btn conjugate with alkyne-cholesterol is situated just outside
the membrane (Fig. 39), still within the “hydration sphere” of the DPPC bilayer model
that consists of water molecules that are directly interacting with the phospholipid
headgroups and are of functional importance for biological membranes (Fitter et al.,
1999; Nagle and Tristram-Nagle, 2000). In the AP6Btn conjugate, the biotin is able to
move more freely, because itself and part of the PEG linker is situated outside of the
bilayer. This also holds true for AP10Btn conjugated to alkyne-cholesterol, but here
the spacer outside the membrane is longer. A beneficial influence of a longer portion
of the spacer outside the bilayer on labeling sensitivity was anticipated, because of
less sterical hindrance and more flexibility in streptavidin binding. Upon binding to
streptavidin, biotin is buried quite deeply within an open barrel of the protein, which is
then covered by a surface loop (Hendrickson et al., 1989; Freitag et al., 1997).
Hence, a certain sterical requirement was expected.
However, the results obtained were contradictory to this expectation. They show that
streptavidin binding is equally efficient just above the bilayer surface. Interestingly,
detection with AP10Btn was more sensitive than with AP6Btn (Fig. 23), hence there
seems to be no linear relationship of length and sensitivity. This might be due to
overlaying effects, like the formation of an unfavourable (coiled) conformation of the
detection reagent. If this is the main effect hampering the contact of azide and alkyne
in the membrane, one could postulate that AP3Btn has the most favourable
conformation for the click reaction, AP10Btn a less efficient one, and AP6Btn the
least suitable 3D structure to enter the membrane and position the azide moiety for
the click reaction to take part.
When using streptavidin as a means to detect biotin reporters, the tetrameric nature
of this protein has to be considered as well. Due to its D2 (tetrahedron-like) symmetry
(Freitag et al., 1997), two binding pockets can be simultaneously faced towards the
bilayer. If two biotin moieties are appropriately positioned, one molecule of
streptavidin could bind both of them, possibly complicating quantification. This could
potentially be overcome by the use of monovalent forms of streptavidin (Lim et al.,
2013).

Part II: Discussion
116
Highly sensitive imaging of alkyne-cholesterol with APpic2Btn
Other than the extension of the PEG spacer, which did not have a beneficial effect
on click labeling sensitivity, the introduction of a copper-chelating picolyl moiety led
to a strong increase in sensitivity for all lipids tested (Figs. 20 and 21). The Ting lab,
who first described the use of picolyl as a copper-chelator for CuAAC, reported a 1.8
to 2.7-fold increase in average signal intensity of RNA or proteins labeled with alkyne
precursors (Uttamapinant et al., 2012).
The work presented here demonstrates that the acceleration of CuAAC also
improves click labeling of lipids in biological membranes, with about 1.3 to 2.1-fold
signal increase (Figs. 21 and 23, mean signal per cell, APpic2Btn compared to
AP3Btn). Furthermore, a comparative study with another, simultaneously added
azide reporter shows that subcellular morphologies were preserved and the same
compartments were stained (Fig. 24). Taken together, with the boost in sensitivity
and the expected intracellular staining, click labeling with the novel azide detection
reagent APpic2Btn provided us with a new tool for the imaging of alkyne-cholesterol,
especially for critical applications, where low amounts of the alkyne lipid have to be
detected (see for instance Fig. 34). Recently, other groups have also used picolyl-
containing biotin-azide reporters (Jiang et al., 2014) or other, multidentate chelators
(Bevilacqua et al., 2014) for the highly sensitive labeling of alkyne bearing
biomolecules, and a further development of chelators can be expected. A copper ion
that is bound very tightly to the azide reporter, and shielded by it to prevent the
generation of reactive oxygen species (see (McKay and Finn, 2014)), can be
introduced as a complex into living cells (Bevilacqua et al., 2014), which will
hopefully pave the way for CuAAC application in live cell imaging.
The concentration of APpic2Btn had a differential effect on click labeling sensitivity
for different lipids (Fig. 21). For propargylcholine, whose alkyne label is integrated
into the headgroup of phosphatidylcholine and therefore is presented at the surface
of the bilayer, no significant effect of an increase of the APpic2Btn concentration
from 2 to 10 µM was observed (Fig. 21B). However, the same increase in
concentration greatly improved the imaging of alkyne-oleate (Fig. 21A), and
especially alkyne-cholesterol (Fig. 21B). For the lowest concentration of APpic2Btn
tested (2 µM), this points to a saturated detection of propargylcholine-tagged PC, but
not of alkyne-cholesterol metabolites, presumably due to differences in accessibility

Part II: Discussion
117
of the alkyne moiety for its azide reaction partner, which diffuses more easily in the
buffer than inside the membrane. Additionally, by complexation of Cu(I), APpic2Btn
directly facilitates the access of the catalyst to the membrane. Thus, the delivery of
Cu(I) to the central part of the membrane may also contribute to the increased
imaging sensitivity at higher concentrations of APpic2Btn.
This again highlights that click reactions do not proceed as unhindered inside the
membrane as outside of it. Depending on the label position, the optimal labeling
conditions like reagent concentrations can differ.
Sterical and topological aspects of click labeling in biological membranes
Alkyne lipids can be incorporated into both leaflets of biological membranes. Given
that it has access to the respective cellular compartment, the azide reporter can
approach the membrane from both sides as well (designated with (1) and (2) in Fig.
40). Thus, the reactants for the click reaction can be situated in the same leaflet (cis,
(c) in Fig. 40) or are approaching each other from different sides of the membrane
(trans, (a) or (b)). The resulting conjugate of a trans orientation spans the bilayer in
an altogether stretched conformation. Alkyne lipids incorporated into leaflet (1) are
clicked in trans with azide reagents attacking from side (2) and vice versa. A cis-
attack presumably leads to a looped conformation of the conjugate that occupies
only one leaflet of the bilayer. It is however not clear if the transition of a looped (cis)
conformation to a stretched (trans) conformation, e.g. by flipflop of the cholesterol
component, is possible.
These topological aspects of labeling become relevant in the case of limited
accessibility of the reactants to cellular compartments, so that only one leaflet can be
approached. Furthermore, the sterical characteristics of some conjugate
conformations might lead to processes unfavourable for imaging. Hypothetically, the
space requirement of the cis conjugate may be larger than that of the trans
conjugate, resulting in a more efficient breaking of the interactions inside the
membrane and possibly the extraction of the conjugate from the bilayer, or its
mobilization inside the membrane. This would render an azide reagent that
preferentially reacts in a cis conformation less suitable than another leading to a
trans conjugate.
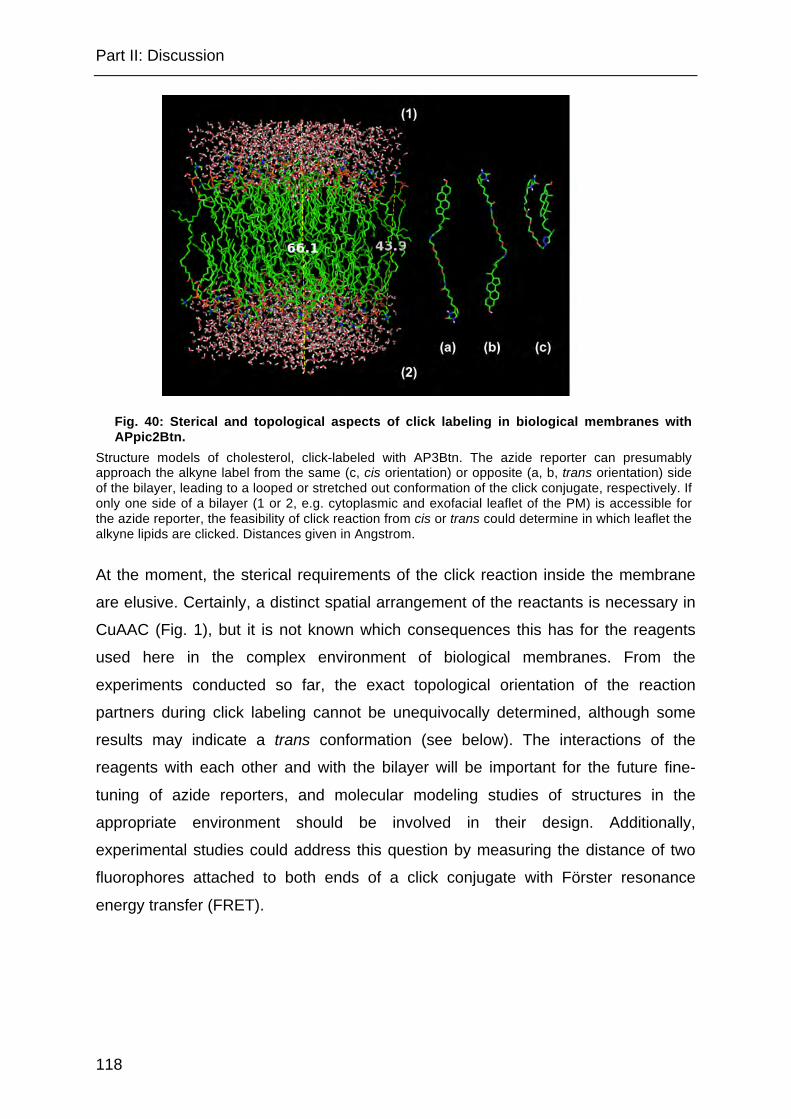
Part II: Discussion
118
Fig. 40: Sterical and topological aspects of click labeling in biological membranes with APpic2Btn.
Structure models of cholesterol, click-labeled with AP3Btn. The azide reporter can presumably approach the alkyne label from the same (c, cis orientation) or opposite (a, b, trans orientation) side of the bilayer, leading to a looped or stretched out conformation of the click conjugate, respectively. If only one side of a bilayer (1 or 2, e.g. cytoplasmic and exofacial leaflet of the PM) is accessible for the azide reporter, the feasibility of click reaction from cis or trans could determine in which leaflet the alkyne lipids are clicked. Distances given in Angstrom.
At the moment, the sterical requirements of the click reaction inside the membrane
are elusive. Certainly, a distinct spatial arrangement of the reactants is necessary in
CuAAC (Fig. 1), but it is not known which consequences this has for the reagents
used here in the complex environment of biological membranes. From the
experiments conducted so far, the exact topological orientation of the reaction
partners during click labeling cannot be unequivocally determined, although some
results may indicate a trans conformation (see below). The interactions of the
reagents with each other and with the bilayer will be important for the future fine-
tuning of azide reporters, and molecular modeling studies of structures in the
appropriate environment should be involved in their design. Additionally,
experimental studies could address this question by measuring the distance of two
fluorophores attached to both ends of a click conjugate with Förster resonance
energy transfer (FRET).

Part II: Discussion
119
Calcium concentration affects accessibility of alkyne-cholesterol for click labeling in the plasma membrane
Several glycoproteins, like integrins (Campbell and Humphries, 2011) and cadherins
(Leckband and Prakasam, 2006) as well as polysaccharides like
glycosaminoglycans (Chevalier et al., 2004) at the cell surface are known to bind
calcium ions, and calcium binding can result in conformational changes (Gabriel and
Carr, 1989). At low micromolar concentrations, calcium ions influence the clustering
of membrane proteins in the PM via electrostatic effects (Zilly et al., 2011). The
addition of calcium ions to the fixation buffer may therefore lead to the fixation of the
PM and its associated biomolecules in an altered conformation that may produce
less (or more) hindrance for the approaching azide reporters than without the use of
calcium ions.
Most of the PM cholesterol has recently been reported to reside in the cytoplasmic
leaflet (Hayashi et al., 2002; Mondal et al., 2009). If these measurements hold true4,
the increased detection of alkyne-cholesterol at the PM after fixation in calcium-
containing buffers (Fig. 25) could be explained by a facilitated attack of the azide
reporter in trans, i.e. from the exofacial leaflet of the PM (see Fig. 40)5. A trans
orientation is further supported by the observation that the longer reagents AP6Btn
and AP10Btn give higher signal in the PM in relation to endomembranes than the
shorter ones, AP3Btn and APpic2Btn (Fig. 22). Because of its glycolipids and
extracellular matrix components, the exofacial side of the PM is probably more
crowded than the cytoplasmic side or many endomembranes. Hence, if lipids in the
4 This statement is based on the microscopy of fluorescent sterols in the PM, quenched with either membrane-permeant or -impermeant substances. Conversely, the raft hypothesis, which is based on the finding that cholesterol has a higher affinity to interact with sphingolipids than with PC, originally postulated that most of the cholesterol should likely be found in the exofacial leaflet, where the majority of the sphingolipids is situated (Simons and Ikonen, 1997; Simons and Vaz, 2004; van Meer, 2011). Early freeze-fracture measurements found more cholesterol in the exofacial leaflet (Fisher, 1976). Reliable determination methods and solid numbers for the distribution of cholesterol between the two leaflets of the PM are still lacking. The quantification may depend strongly on the cell type and sample preparations used. The implications of this distribution pattern on PM organization remain to be elucidated. 5 In living cells, cholesterol is able to flip-flop very fast between leaflets (Steck et al., 2002). Apparently, its transbilayer gradient is nevertheless maintained by strong interactions of cholesterol with neighbouring lipids (Steck et al., 2002) or active transport mechanisms (van Meer, 2011). Since it is not clear if lipid interactions (which would presumably persist after fixation) or active processes (which would stop during fixation) prevail, it is not clear if flip-flop does take place in fixed cells, leveling out the differential transbilayer distribution. Click-labeled and streptavidin-conjugated alkyne-cholesterol is unlikely to flip-flop.
Part II: Discussion
120
(cytoplasmic leaflet of the) PM are to be imaged, an azide reporter with a long
spacer should be used. Since cholesterol in endomembranes was the primary
interest of this study, generally no calcium was used during fixation, and thus alkyne-
cholesterol in the PM was underrepresented in click labeling.
This also leads to the general conclusion that the click labeling and subsequent
imaging of alkyne lipids will always be biased, at least to some extent. Depending on
the structure of the azide reporter that may include hydrophobic or hydrophilic, acidic
or basic, small or bulky moieties, lipids may be preferentially labeled in some
organelles. This biased labeling is acceptable as long as the experimenter is aware
of it. If quantitative statements are to be drawn from the relative amounts in different
organelles, corrections based on the accessibility of the lipid in the respective
organelle may be necessary. Further research will hopefully come up with even
better azide reporters for the highly sensitive labeling of lipids in all biological
membranes. Label-free techniques like Raman microscopy (see chapter 4.3.2.1)
could be applied for the unbiased determination of the distribution of alkyne lipids
between membranes and thereby also aid in evaluation of new azide detection
reagents.
Part II: Discussion
121
4.3.2 Alkyne-cholesterol on its way into the lipid droplet
4.3.2.1 Click labeling of lipids in and on lipid droplets
In different cell lines and with different alkyne lipid probes, prominent rings around
LDs were detected, but alkyne lipids inside the core of LDs could not be click-labeled
with our protocol for fluorescence microscopy (Fig. 26, Fig. 27), except for very small
LDs, which were fully stained (Fig. 33). The neutral lipids TAG and CE occur almost
exclusively in LDs, as their solubility in lipid bilayers is limited (Ohsaki et al., 2009).
Thus, because considerable amounts of alkyne-labeled TAG and CE were detected
by TLC, but the LD core was not stained, a limited accessibility of the core to click
labeling is evident.
LDs can grow to a diameter of several microns, and their cores (see Fig. 5) are the
most hydrophobic compartments inside cells, which makes it very challenging to
label the intact organelle with reasonably hydrophilic reagents. If the click labeling
protocol used in this study was to be optimized for the labeling of alkyne lipids inside
the core, both the azide reporter and the copper catalyst would have to be modified
to become more hydrophobic. In the case of the azide reporter, this could be
achieved by the use of unsulfonated, hydrophobic dyes and of alkyl chains instead of
PEG as spacer components. However, these substitutions would evoke a substantial
increase in non-specific partitioning of the reporter into the LD and other hydrophobic
organelles and therefore probably greatly enhance background staining.
The copper catalyst 6 could be modified to become more hydrophobic as well.
However, it will be tough to maintain the delicate balance between reactivity and
stability of the complex of copper with its ligands, in addition to achieving a balanced
hydrophobicity that allows the dissolution in water, but also the partitioning into LDs.
Pursuing the successful strategy of copper chelation by the azide reagent, the
6 CuTFB, the copper catalyst used in this study, is tetrakis(acetonitrile)copper(I) fluoroborate, in which the Cu(I) ion is coordinated comparatively strongly by four acetonitrile molecules, but only weakly by the tetrafluoroborate anion. The solvatation of copper(I) by acetonitrile is used to prevent disproportionation to Cu(II) and Cu(0) (Kamau and Jordan, 2001). This also abolishes the need for reducing agents like ascorbic acid and additional copper ligands, because in solutions containing some acetonitrile, the acetonitrile-coordinated Cu(I) is moderately stable. In the aqueous solutions (2-3 % acetonitrile) used and under the aerobic conditions present in our click labeling procedure, we observed a slow disproportionation (blue color of Cu(II) visible after click labeling).
Part II: Discussion
122
potential of a tetradentate chelator (Bevilacqua et al., 2014) could be compared to
the bidentate picolylazide in the efficiency to transfer the catalyst to the center of
reaction. Alternatively, additional ligands could be used to complex Cu(I). Such
ligands have already been applied in various labeling conditions to accelerate
CuAAC or to shield excess catalyst from oxidation (reviewed in (McKay and Finn,
2014)). Many of them, like the tris-triazole TBTA are also quite hydrophobic, which
makes them good vehicles inside LDs but hard to dissolve in aqueous solutions. The
use of SPAAC instead of CuAAC (see chapter 1.1.2) would potentially abolish the
need for a copper catalyst. However the general problem of balancing the
hydrophobicity of the azide reporter between LD access and reasonable background
staining would still persist. Hence, probably all modifications that would enable the
click labeling of alkyne lipids inside LDs would render the method less suitable for
general purposes because of unspecific partitioning of the reagents into hydrophobic
compartments. Thus such modifications will likely be desirable for specialized
applications only.
In cooperation with the group of Prof. Takeyama at the Waseda University, it was
demonstrated that the alkyne moiety was sensitively detected by a Raman
microspectroscopy setup in solutions of our alkyne probes, without the need of
additional click labeling. The alkyne peak lies in a silent region of the cellular Raman
spectrum (Fig. 28). In the future we aim at expanding the scope of alkyne lipid
imaging by their label-free detection inside LDs.
Linear (spontaneous) Raman microspectroscopy has been applied to identify LDs
and their individual lipid composition (Schie et al., 2013; Hosokawa et al., 2014;
Majzner et al., 2014). Coherent techniques are used for the same purpose (Rinia et
al., 2008), and also to follow LD motion and fusion, and the interaction with other
organelles (Nan et al., 2006; Jungst et al., 2011; Dou et al., 2012; Jungst et al.,
2013). The feasibility of imaging alkyne probes with Raman and CARS microscopy
has been demonstrated recently (see chapter 1.2). As a next step, experiments
performed by our collaboration partners will evaluate the sensitivity of the detection
of the alkyne label inside LDs of fixed cells using alkyne-cholesterol as a probe. It is
then intended to use spontaneous Raman microspectroscopy to measure the levels
of alkyne-cholesterol and its esters in individual LDs of a heterogenic LD pool (see
Part II: Discussion
123
chapter 4.3.2.4). Further information on the LD lipid content, like the degree of fatty
acid saturation, will presumably enable a high-content analysis of single LDs. Raman
microscopy will also be of great value for the elucidation of the differential
metabolization and trafficking of fatty acids in adipocytes (see Fig. 27).
It has been suggested that the surface or the surrounding of adipocyte LDs contains
considerable amounts of free cholesterol (Prattes et al., 2000). Changes in the
Raman spectrum of deuterated cholesterol inside LDs can indicate its esterification,
as it has been shown in macrophages (Matthäus et al., 2012). A combined
application of the deuterated and the alkyne-labeled probe could correlate the
localization of alkyne-cholesterol inside the LD with the distribution of esterified and
unesterified cholesterol inside this organelle. Nevertheless, a very high resolution of
the Raman microscope would be necessary to answer this question.
Coherent Raman microscopy could potentially be used to follow the entry of alkyne-
cholesterol into the cell and to observe its trafficking into the LD in living cells in a
very non-interfering set-up. Thereby it could contribute to the clarification of
trafficking pathways.
The crystallinity of CEs inside LDs is thought to affect the rate of their hydrolysis
(Adelman et al., 1984). Crystalline substances give sharper peaks in Raman spectra
than amorphous materials. Raman microscopy can identify cholesterol crystals in
atherosclerotic plaques (Adelman et al., 1984; Suhalim et al., 2012), but it also
serves as a measure for crystalline ordering of lipids inside membranes (Percot and
Lafleur, 2001) and has the potential to identify liquid crystals (Lee et al., 2013).
Raman microscopy could thus also provide information about the ordering of lipids
inside LDs and be a valuable tool to investigate the lipid mobilization from LDs of
different degrees of order and chemical composition.
4.3.2.2 A super-resolved view on alkyne-cholesterol at the interface of lipid droplets and the endoplasmic reticulum
If fed to cells under lipid-saturated conditions (in full medium), alkyne-cholesterol was
esterified to a considerable proportion and thus stored in LDs (Fig. 26C). As click
labeling was unable to detect alkyne lipids deeply inside the hydrophobic core (Fig.
27), consequently a ring-like labeling of LDs with alkyne-cholesterol was observed

Part II: Discussion
124
(Fig. 26A). Additionally, alkyne-cholesterol positive membrane structures appeared
to be connected to these rings.
Co-localization studies with mRFP1-tagged marker proteins in HuH7 cells suggested
that these ring-associated membrane tubules, as well as the rings themselves, could
be a subcompartment of the ER (Fig. 29). This subdomain was characterized by the
colocalization of alkyne-cholesterol and overexpressed ACAT1-mRFP1 near or
around LDs (Fig. 30) and therefore probably represents the site of alkyne-cholesterol
esterification. The enhanced concentration of cholesterol in the ER then triggers its
esterification at the putative esterification subcompartment. Cholesterol is an
allosterical activator of ACAT1 and could therefore directly stimulate its conversion
into the storage form CE. Interestingly, ACAT2 seems to be less responsive to
cholesterol-dependent allosteric activation than ACAT1 (Liu et al., 2005). In contrast
to this, ACAT2, but not ACAT1, is transcriptionally upregulated by cholesterol in
HuH7 cells (Pramfalk et al., 2007). These findings support the notion that the
functions of these two enzymes are non-redundant. ACAT2 probably is involved
mainly in pathways that direct cholesterol to its export rather than to its internal
storage in LDs. It is therefore reasonable to assume that the two enzymes are
differentially regulated. In further experiments it would be interesting to compare the
intracellular localization of mRFP1-tagged ACAT1 and ACAT2 in hepatocytes and
the targeting of alkyne-cholesterol to them. The preferential colocolization of the lipid
with one of the isoforms after the application of different stimuli could provide insight
into a possible regulatory switch between these two ways of maintaining hepatocyte,
liver and whole body cholesterol homeostasis. Additional proteins are likely involved
in the inititation, construction and regulation of the putative esterification sites in the
ER, but the underlying mechanisms of these processes are largely unknown.
The relative contributions of other regulatory responses besides esterification to the
cholesterol levels in the ER, like the transcriptional down-regulation of cholesterol
synthesis, or the efflux as lipoproteins, were not investigated in this study so far.
Most probably, several responses are simultaneously triggered in hepatocytes to
cope with the large flux of cholesterol that this specific cell type encounters. This
might however be dependent on the source of cholesterol and thus the pathway of
its entry (Sniderman et al., 2013) and presumably, on the amount of cholesterol to be
detoxified.
Part II: Discussion
125
Due to the diffraction limit, conventional light microscopy cannot separate structures
that are less than about 200 nm apart. The structures observed at the LD-ER
interface fall within this size category and thus using the conventional light
microscope we were not able to elucidate if the rings around the LDs displayed a
thickness that corresponds to that of a LD monolayer (2 nm, Chaban and Khandelia,
2014), an ER tubule (60 – 100 nm, Park and Blackstone, 2010), or another larger
membrane structure.
The higher resolution of STED microscopy allowed a closer look at these sites, as
well as the determination of the ring thickness and the observation of enlightening
substructural detail. We were able to enhance the lateral resolution to about 50 nm,
as judged from the FWHM of the thinnest structures observed (Fig. 32F). Typical ring
thicknesses of alkyne-cholesterol on LDs were in the range between 100 and
200 nm (Fig. 31B and C), which excludes that the rings exclusively consist of
cholesterol in the phospholipid monolayer. Since in the rings themselves, no
ultrastructural details suggested the presence of an ER lumen or the like, it could be
concluded that the click-labeled alkyne-cholesterol rings observed around LDs
represented the LD monolayer and outer shells of the core. Although most of the
cholesterol in the hydrophobic core is in its esterified form, CE, the presence of
shells of unesterified cholesterol on LDs was reported in adipocytes (Prattes et al.,
2000). In yeast LDs, sterol esters were measured to localize to their outermost shells
(Czabany et al., 2008). If the same segregation of lipids should be present in
mammalian LDs, the finite depth of the CE-rich shell of LDs could also contribute to
our finding of the ring-like staining.
Conversely to the solid staining within the rings, ultrastructural detail was visible in
the structures associated with them (Fig. 32). The tubular structures undulated
around LDs, or stretched from the perinuclear region to peripheral regions. They
displayed a lumen of about 130 nm width, which is slightly larger than the average
diameter of a typical smooth ER tubule (Park and Blackstone, 2010).
According to a now widely accepted model, membrane contact sites are present
between the ER and LDs during their formation and are formed again after
recruitment of LDs to the ER. They have been observed in electron microscopy
Part II: Discussion
126
(Jacquier et al., 2011; Wilfling et al., 2013) and may be a way of bulk lipid transport
and the translocation of several proteins between the ER and LDs.
This notion is supported by our studies with alkyne-cholesterol in super-resolution.
We observed small and larger LDs closely attached to an ER tubule, and detected
membrane bridges between the ER and larger LDs (Fig. 33). In future experiments,
colocalization studies of these structures with ACAT, but also other proteins that
were described to be involved in the formation and control of ER-LD membrane
contact sites, like Cideb (Ye et al., 2009), Rab18 (Ozeki et al., 2005), seipin
(Szymanski et al., 2007), or the Arf1/COPI machinery (Wilfling et al., 2014), will be of
great value to understand the prerequisites and mechanisms of the formation of CE-
rich LDs, not only in hepatocytes. Imaging is feasible in super-resolution for both the
lipid probe and the tagged protein with two-color STED techniques (Tonnesen et al.,
2011).
During LD biogenesis, neutral lipids accumulate between the ER leaflets. Globular
structures within the ER form due to phase separation and they curve the ER
membrane (Zanghellini et al., 2010; Kassan et al., 2013). Further growth of the ER-
attached globule is probably achieved by synthesis of lipids at the ER-LD interface
and transport via membrane bridges or a pore and it eventually leads to the
formation of nascent LDs with a diameter of about 250 nm, ready to detach from the
ER (Kassan et al., 2013; Pol et al., 2014). In the case of HuH7 and other hepatic
cells, globular lipid accumulations smaller than ~ 200 nm could thus represent
lipoproteins, particularly VLDL (~50 nm diameter (Otvos et al., 1992)), or primordial
LDs during their biogenesis. With the STED microscope used here, STED imaging of
the LD dye LD540 was not possible due to wavelength requirements not met by the
dye. Therefore, LD540-positive structures smaller than 200 nm were not reliably
detectable with this dye. However, we were able to identify small globular structures
positive for alkyne-cholesterol, which could be indicative of developing LDs or
lipoproteins (Fig. 33B, C). Notably, these, and also the smallest of LD540-positive
LDs up to a size of about 200 to 300 nm were fully stained by click-labeled alkyne-
cholesterol. Apparently, the catalyst and azide reagent were able to fully penetrate
into these small LDs. The maximum size of fully stained LDs nicely correlates with
the maximum thickness of click-labeled alkyne-cholesterol (ester) rings on larger
LDs.
Part II: Discussion
127
Large LDs could stay associated with the ER (Fig. 33) to enable a further deposition
of CE on them or to provide material for the assembly of lipoproteins (Ohsaki et al.,
2009). Efflux studies are needed to clarify if cholesterol is removed from the ER by
storage in cytoplasmic LDs or by export as lipoproteins.
Fluorescent cholesterol probes have recently been used in STED microscopy to
study the spatiotemporal dynamics of PM organization in living cells (Honigmann et
al., 2014). By using live-cell STED, the fluorophore position and orientation of the
attached fluorophore was found to influence the lateral diffusion of BDP-cholesterol
in the PM (Solanko et al., 2013). Also, the concept of bioorthogonal labeling has
found its way into the imaging of molecular probes in STED (Erdmann et al., 2014;
Saka et al., 2014).
To our knowledge, the work presented here is the first study that directly visualizes a
minimal-perturbed analogue of cholesterol, alkyne-cholesterol, in super-resolution
using click labeling and STED microscopy. A direct correlation of LDs with the
alkyne-cholesterol signal was possible by imaging of LD540 in confocal mode
followed by its bleaching and subsequent STED imaging of alkyne-cholesterol.
Thereby we were able to image alkyne-cholesterol on its way into LDs.
STED microscopy highly benefits from a bright fluorescent staining of the sample to
achieve a good signal-to-noise ratio. A plethora of excellent azide coupled
fluorescent dyes is available through facile synthesis or commercial sources, and
they can be click-reacted to the alkyne lipid of interest in a modular fashion. Hence,
the design and implementation of click-based STED imaging of lipids is quite
straightforward nowadays, once access to a STED microscope is available. A
stunning complexity of lipid microdomains in cellular membranes and intracellular
lipid trafficking pathways awaits its revelation. STED and other super-resolution
techniques could become substantial contributors in that quest.
Part II: Discussion
128
4.3.2.3 Trafficking of exogenous alkyne-cholesterol in hepatocytes towards its storage in lipid droplets
In a pulse-chase study (Fig. 34), the trafficking of exogenous alkyne-cholesterol to
LDs was investigated. Vesicles of different shape were observed, especially in the
first 30 min after exchanging the alkyne-cholesterol containing medium to standard
growth medium. Regarding their size and morphological appearance, they
resembled different stages of endosomes, although this preliminary study could not
unequivocally identify them. For this purpose, colocalization studies of the structures
with organelle marker proteins are necessary in future experiments. Nevertheless,
the morphological appearance of the early vesicles (spherical with tubular
appendages) matches the shape of early or sorting endosomes, whereas the
subsequently observed large, spherical vesicles might represent late endosomes or
lysosomes. The size of the vesicles (~ 1 µm) is within the range of typical hepatocyte
lysosomes, but slightly above average (Carpentier et al., 1979). In macrophages, the
fluorescent sterol dehydroergosterol (DHE), when loaded onto the PM, was
transported to recycling endosomes, but not late endosomes and lysosomes,
identified by colocalization with marker proteins (Wustner et al., 2005).
Of course, the observation of vesicles does not exclude the interplay with non-
vesicular pathways. Alkyne-cholesterol could be present in vesicles and still traffic to
the ER and LDs on strictly non-vesicular pathways, or non-vesicular pathways could
be involved in the transfer of alkyne-cholesterol to or from vesicles. This has been
observed in yeast mutant strains, in which sterol trafficking from the PM to the ER
can occur without the key proteins involved in vesicular trafficking (Li and Prinz,
2004). Also in macrophage foam cells, pulse-chase data suggest the prevalence of
non-vesicular pathways for the transport of DHE to LDs (Wustner et al., 2005).
Because of the long pulse time (60 min), early events were not visible in the
preliminary study presented here. The rare occurrence of alkyne-cholesterol in rings
around LDs at early chase timepoints might indicate that a significant proportion of
cholesterol took a slow vesicular route from the PM to the ER. Poorly characterized
non-vesicular transport processes distribute cholesterol among endomembranes
within a few minutes (Hao et al., 2002; Lange et al., 2014). The delayed deposition
on LDs might also be explained by a relatively slow upregulation of the esterification
machinery (Chang et al., 2009).

Part II: Discussion
129
The nature of the early trafficking events involved in the targeting of alkyne-
cholesterol to LDs remains to be elucidated by further studies. Shorter pulse times in
pulse-chase studies of fixed cells, or live-cell tracking of alkyne-cholesterol with
Raman microscopy should be used for this purpose. The results should be
correlated with metabolic pulse-chase studies to determine at which time point CE is
formed.
Compared to other cell types, the possibility of uptake and assembly of lipoproteins
in hepatocytes adds a further level of complexity to cholesterol trafficking (see
chapters 1.4 and 1.5). Exogenous cholesterol in these cells will be taken up by
different receptors, depending on the lipoprotein that it is packed in, and these entry
points also partially determine its further trafficking (Ikonen, 2008; Sniderman et al.,
2013). Studies on the uptake and endocytosis of alkyne-cholesterol loaded LDL and
HDL are planned and will help to investigate how cholesterol from different
exogenous sources is targeted by hepatocytes towards internal storage, metabolism
or re-secretion. Loading of the PM at 4 °C with alkyne-cholesterol (delivered as a β-
cyclodextrin complex or in ethanolic solution) could be used to investigate non-
vesicular trafficking from the PM (Hao et al., 2002).
An interesting observation during the chase was the movement of LDs from the
periphery to perinuclear regions upon their growth, which was observed indirectly in
the pulse-chase study (Fig. 34). This motion has been reported before in adipocytes
(Nagayama et al., 2007), and is thought to be a general phenomenon in LD
biogenesis caused by the movement of LDs between specialized ER subdomains
(Kassan et al., 2013; Pol et al., 2014). The preferential localization of alkyne-
cholesterol rings on perinuclear LDs (Fig. 37) could therefore result from the
translocation of LDs to the ER subcompartment that harbours ACAT to enable the
deposition of CE on LDs. The underlying mechanisms and regulation of this
recruitment are still elusive, but an increased cholesterol concentration at
membranes like the ER or the PM that activates ACAT if it surpasses a certain
threshold (Xu and Tabas, 1991) might also stimulate the recruitment of LDs.

Part II: Discussion
130
4.3.2.4 Esterification of exogenous alkyne-cholesterol and lipid droplet heterogeneity in hepatocytes
Cells need to adjust to a variety of conditions, including the lack or excess of
nutrients, to maintain homeostatic conditions. LDs are important contributors to lipid
homeostasis. To fulfill its diverse functions, the LD pool is split up into several
dynamic populations with different lipid and protein composition, size, intracellular
localization and motion, as well as clustering and connection to organelles (see
chapter 1.3). The presence of LD subpopulations in adipocytes, and the differential
incorporation of nutrients into different LDs of the same adipocyte have been
reported (Kuerschner et al., 2008; Rinia et al., 2008), which demonstrates that LD
subpopulations may react differently to external or internal stimuli. Hepatocytes play
a pivotal role in whole body cholesterol metabolism and circulation. A disturbed
cholesterol homeostasis in these cells is associated with severe diseases of the liver
like NAFLD (Musso et al., 2013) or hepatitis C virus infection (Loizides-Mangold et
al., 2014). Besides the synthesis of cholesterol and many ways of influx into and
efflux from the hepatocyte, the storage of esterified cholesterol in LDs likely
contributes to hepatic cholesterol homeostasis.
This study investigated the cholesterol esterification and storage in LDs in response
to lipid pre-loading of hepatocytes with fatty acids or cholesterol, and the contribution
of individual LDs to that response. To that end, alkyne-cholesterol was applied as a
probe. Administered in the cell culture medium, it was taken up by HuH7 cells and
trafficked to the ER (Fig. 29 and Fig. 34). It thus served in this study as a general
means to raise the cholesterol concentration in that organelle, like it would be the
case after increased influx of cholesterol from lipoproteins, but also after increased
synthesis due to an upregulation of the cholesterol synthetic machinery. Intracellular
esterification of cholesterol, regardless from which source, and regardless if it
ultimately leads to export or internal storage, happens upon the action of ER-residing
ACAT enzymes.
To generate LDs rich in TAG or CE, HuH7 hepatocarcinoma cells were pre-loaded
with unlabeled fatty acids or cholesterol, and this loading was then continued upon
the further addition of alkyne-cholesterol. After the establishment of a feeding setup
that gave distinct neutral lipid profiles (Fig. 35, Fig. 36), microscopy was used to
investigate morphological parameters of LDs and the localization of alkyne-

Part II: Discussion
131
cholesterol to them. Alkyne-cholesterol localized to LDs upon both feeding regimes,
pre-loading with oleate or cholesterol. However, the LDs appeared morphologically
different (Fig. 37) and the quantification of the micrographs (Fig. 38C) suggested
further differences between HuH7 cells with TAG-rich and CE-rich LDs. Although the
amount of neutral lipid stored in LDs was similar for both feeding regimes (Fig. 36A
and Fig. 38C), more alkyne-cholesterol was detected in HuH7 cells fed with
cholesterol than with oleate (Fig. 37 and 38C). As our labeling protocol for
microscopy was able to detect alkyne-cholesterol only in membranes but not inside
the LD core (see chapter 4.3.2.1), the stronger signal inside endomembranes could
be due to a saturated esterification machinery leading to transiently increased levels
of labeled and unlabeled cholesterol at the ER. Cholesterol pre-loading could
presumably lead to upregulation of the responsible isoform of ACAT. However, the
observed effects might be strongly overlayed by lipid efflux. Hence, the
determination of ACAT enzymatic activities (compare chapter 3), ACAT1 and ACAT2
mRNA and/or protein levels, and of lipid efflux are essential in future experiments.
The addition of an ACAT inhibitor effectively prevented alkyne-cholesterol
esterification (Fig. 36B and C). Intracellularly, alkyne-cholesterol was detected with
low signal intensity at vesicular structures (Fig. 37). Presumably, most of it was not
transferred to the ER under these conditions, but remained in the PM, where it was
underrepresented in our microscopic studies (see chapter 4.3.1). If this holds true in
repeated experiments, it would indicate a strong regulation of the alkyne-cholesterol
concentration at the ER depending on the activity of ACAT enzymes and argue
against a solely passive distribution of sterols to endomembranes in response to a
rise of their concentration at the PM. However, the phenotype observed with the
inhibitor might also be derived from secondary effects in stressed or apoptotic HuH7.
In the liver, hepatocytes residing in different zones of the hepatic acini (with different
distances to the blood vessel) have distinct metabolic functions. Additional to that
zonal organization, a cell-to-cell heterogeneity has been suggested by Herms and
colleagues to play a role in the reduction of hepatic lipotoxicity (Herms et al., 2013).
They showed that upon loading with oleate, the LD accumulation in hepatocytes was
heterogenous and the cell population displayed a positive skewed distribution
regarding this parameter. Because the few high-lipid hepatocytes provided lipids to
other cells and accumulated far more reactive oxygen species than the bulk of the

Part II: Discussion
132
population, the authors hypothesized that the reversible establishment of a high-lipid
subpopulation helped to reduce lipotoxicity in the general population and
simultaneously maintain lipid homeostasis. Interestingly, in the work presented here,
the cell-to-cell heterogeneity of the HuH7 population also appeared to be dependent
on the feeding conditions. Preliminary calculations of skewness coefficients and the
robust coefficients of variation (as a measure of the average deviation of an
individual cell from the median of the population, see (Herms et al., 2013)) with the
data in Fig. 38C indicated that these might be worthwile statistic tools to assess the
cell-to-cell heterogeneity of the alkyne-cholesterol signal in our system. The
calculations were not included in this thesis because they have to be repeated with
data from multiple, independent experiments before conclusions can be drawn.
Regardless of its diagnostic value, the high heterogeneity of the HuH7 population
has implications for the microscopy observations of single cells. Although the
micrographs presented here show the typical appearance of the population to the
best knowledge of the experimenter, in future experiments, the observation of
morphological parameters in individual cells should be more randomized, like it has
been done for the quantitative measurements. Future experiments that investigate
mechanisms of hepatocytes against cholesterol cytotoxicity should be performed in
primary hepatocytes instead of the hepatocarcinoma cell line HuH7. Additionally a
more physiological cell culture system should be tested, like the three-dimensional in
vitro co-culturing of hepatocytes with other cell types of the liver, like Kupffer cells,
stellate cells and endothelial cells (Kostadinova et al., 2013).
Inside single cells, the LD-to-LD heterogeneity was assessed. The heterogeneous
localization of alkyne-cholesterol to the LDs of a single HuH7 cell after cholesterol
loading (Fig. 38A and B) suggested the presence of LD subpopulations under these
conditions. It indicated that preferentially the CE-rich LDs acquired further (alkyne-
labeled) CE. Thus, a specialized role of CE-rich LDs in the detoxification of excess
cholesterol is imaginable. However, this interesting finding needs further verification.
The determination of the LD proteome of fatty acid-loaded versus cholesterol-loaded
cells, like it has been performed for steroidogenic cells (Khor et al., 2014), could help
identify proteins localizing specifically to CE-rich or TAG-rich LDs in hepatocytes.
Alternatively to analyzing the bulk metabolism of a cell population altered by lipid
loading, individual LDs can be sorted by flow cytometry, into an isotropic and an
Part II: Discussion
133
anisotropic population, as demonstrated by Kellner-Weibel and colleagues in rat
hepatoma cells (Kellner-Weibel et al., 2001).
Among the highly CE-enriched anisotropic LDs inside a single HuH7 cell, a
significant proportion did not bear an alkyne-cholesterol ring, which could be due to a
low general or an altered metabolic activity, e.g. these LDs could have been
providing lipids for export in lipoproteins. Colocalization studies with ACAT1 and
ACAT2 could give more insight into that. In addition, Raman microscopy could
provide a more precise knowledge about the neutral lipid composition of individual
LDs (Rinia et al., 2008; Hosokawa et al., 2014).
To exclude the possibility of a significant contribution of alkyne-cholesterol, in
addition to unlabeled fatty acid or cholesterol, to the LD core composition, shorter
incubation times with alkyne-cholesterol should be included in the investigations. The
preliminary experiment shown here, which correlates the alkyne-cholesterol signal of
LDs with their anisotropy for a single cell (Fig. 38A and B), should be repeated and
expanded to several cells of a sample. Subsequently, the obtained data should be
subjected to automated image analysis rather than to visual screening. Using such a
refined experimental setup, the differential targeting of alkyne-cholesterol to LDs with
different lipid composition could be assessed. Moreover, further parameters like LD
protein decoration, size and clustering could be determined in order to identify the
characteristics of the putative LD subpopulation responsible for cholesterol
detoxification.
Taken together, the heterogenic accumulation of free cholesterol and CEs in
hepatocytes on a cell-to-cell and an intracellular level, although it cannot be
concluded unequivocally from the preliminary data presented here, is an appealing
hypothesis as a hepatic organizational principle, and a protective measure to
optimally maintain homeostatic conditions and cope with lipotoxicity simultaneously.
Prospective studies will address the many aspects of this hypothesis in further detail.
Conclusion and Outlook
134
5 Conclusion and Outlook
Bioorthogonal labeling is a promising strategy in lipid biology because it allows the
detection of lipid probes with a small and thus comparatively non-interfering label,
subsequent to the metabolic or trafficking events that the probe was subjected to.
Using CuAAC, currently one of the most successful reactions out of the click
chemistry concept, alkyne lipids can be click-labeled with azide-bearing reporters
under physiological conditions to enable their detection. Alternatively, a label-free
detection of alkyne lipids by its strong Raman peak is feasible, and thus able to
complement the click labeling based detection. An important asset of bioorthogonal
labeling is its modularity. Hence, alkyne lipids can be used as versatile probes in a
variety of different applications, given that the azide detection reagent is adjusted to
the needs of the respective application.
The alkyne-labeled lysophospholipids, sphinganine or cholesterol tested in this
thesis demonstrated that the small alkyne group, attached to the ω-end of the
hydrocarbon chain or to the headgroup, did not interfere with the substrate affinity of
various enzymes of lipid metabolism. These results suggest a general suitability of
alkyne lipids as substrates for enzymatic assays. Due to the facile synthesis and
increasing commercial availability of alkyne lipids, a versatile toolbox of alkyne-
labeled substrates is now at hand and provides a fast, convenient and sensitive
alternative to radiolabeled or fluorescent dye-tagged substrates.
Whereas for the in vitro enzymatic assays, a previously established, fluorogenic click
labeling protocol with quantitative labeling yield was utilized, the labeling of alkyne
lipids for microscopy poses different challenges. There, the click reaction has to take
place in intracellular structures like biological membranes or LDs. Whereas in the
highly hydrophobic environment of the LD core click labeling could not be
established so far, this study shows that the sensitivity of the detection of alkyne
lipids in membranes could be significantly increased by the use of a copper-chelating
azide reporter, APpic2Btn.
A better understanding of the sterical and topological arrangement of the reactants
during the click labeling could help to design further improved azide detection
reagents. This could be achieved by molecular modeling of the reaction site, in

Conclusion and Outlook
135
combination with the experimental determination of the conformations of the
resulting click-conjugates, for instance by using FRET between two fluorophores
attached to both ends of the conjugate. Knowledge about the sterical arrangement
during and after click labeling could then be used to elucidate which conformation
favors a fast and efficient click reaction as well as most effectively prevents the
mobilization of the click-labeled lipid, and thus stimulate the design of the appropriate
azide reagents that lead to that favorable conformation. To further enhance the click
labeling sensitivity, and to circumvent copper toxicity and thereby allow click labeling
in living systems, multidentate azide reporters should be tested.
The increased sensitivity with the novel reagent APpic2Btn was particularly
beneficial in the investigation of the intracellular localization of alkyne-cholesterol.
This study demonstrated that exogenously applied alkyne-cholesterol trafficked to
intracellular membranes in HuH7 cells, including mitochondria and the ER. Additional
to that, alkyne-cholesterol was detected at the surface of LDs. Using STED
microscopy, it could be verified that the staining derived from the click labeling of
alkyne-cholesterol in the outer shells of the LD core, additional to the monolayer.
Furthermore alkyne-cholesterol containing ER was found in close proximity, and very
likely in direct contact via membrane bridges, to the LD. The colocalization of alkyne-
cholesterol at the LD-ER interface with overexpressed ACAT1 strongly suggests that
this constitutes the site of cholesterol esterification.
To investigate of the storage of excess cholesterol in hepatocyte LDs as a response
to the cytotoxic accumulation of cholesterol, HuH7 cells were pre-loaded with fatty
acids or cholesterol. In the pilot experiments performed so far, the esterification and
subcellular localization of subsequently administered alkyne-cholesterol was
influenced by lipid loading, suggesting a metabolic switch of hepatocytes towards
cholesterol storage and export as lipoproteins after cholesterol loading. This needs
to be confirmed in the future in repeated experiments and by the determination of
ACAT enzymatic activities. Furthermore, the contribution of the two isoforms, ACAT1
and ACAT2, to storage and export of excess cholesterol and thus to cholesterol
homeostasis in hepatocytes will be addressed. Future studies will also investigate
the role of heterogeneity at the cell-to-cell level and regarding individual LDs inside
single cells for cholesterol detoxification.

References
136
6 References
Adelman, S., J. Glick, M. Phillips, and G. Rothblat (1984). Lipid composition and physical state effects on cellular cholesteryl ester clearance. J. Biol. Chem. 259, 13844-13850. Agarwal, A., S. Sukumaran, V. Cortes, K. Tunison, D. Mizrachi, S. Sankella, R. Gerard, J. Horton, and A. Garg (2011). Human 1-acylglycerol-3-phosphate O-acyltransferase isoforms 1 and 2: Biochemical characterization and inability to rescue hepatic steatosis in Agpat2(-/-) gene lipodystrophic mice. J. Biol. Chem. 286, 37676-37691. Ali, M., K. Cheng, and J. Huang (2007). Assess the nature of cholesterol-lipid interactions through the chemical potential of cholesterol in phosphatidylcholine bilayers. Proc. Natl. Acad. Sci. USA 104, 5372-5377. Arteel, G. (2012). Beyond reasonable doubt: Who is the culprit in lipotoxicity in NAFLD/NASH? Hepatology 55, 2030-2032. Bandhuvula, P., H. Fyrst, and J. Saba (2007). A rapid fluorescence assay for sphingosine-1-phosphate lyase enzyme activity. J. Lipid Res. 48, 2769-2778. Bandhuvula, P., Z. Li, R. Bittman, and J. Saba (2009). Sphingosine 1-phosphate lyase enzyme assay using a BODIPY-labeled substrate. Biochem. Biophys. Res. Commun. 380, 366-370. Bautista, G., S. Pfisterer, M. Huttunen, S. Ranjan, K. Kanerva, E. Ikonen, and M. Kauranen (2014). Polarized THG microscopy identifies compositionally different lipid droplets in mammalian cells. Biophys. J. 107, 2230-2236. Beatty, K., J. Liu, F. Xie, D. Dieterich, E. Schuman, Q. Wang, and D. Tirrell (2006). Fluorescence visualization of newly synthesized proteins in mammalian cells. Angew. Chem. Int. Ed. Engl. 45, 7364-7367. Beller, M., K. Thiel, P. Thul, and H. Jackle (2010). Lipid droplets: A dynamic organelle moves into focus. FEBS Lett. 584, 2176-2182. Best, M. D. (2009). Click chemistry and bioorthogonal reactions: Unprecedented selectivity in the labeling of biological molecules. Biochemistry 48, 6571-6584. Best, M. D. (2013). The development and application of clickable lipid analogs for elucidating and harnessing lipid functions, in: Z. J. Witczak and R. Bielski (eds.). Click chemistry in glycoscience: New developments and strategies. pp. 77-105, John Wiley & Sons, Inc., Hoboken, NJ, USA. Bevilacqua, V., M. King, M. Chaumontet, M. Nothisen, S. Gabillet, D. Buisson, C. Puente, A. Wagner, and F. Taran (2014). Copper-chelating azides for efficient click conjugation reactions in complex media. Angew. Chem. Int. Ed. Engl. 53, 5872-5876. Bickel, P., J. Tansey, and M. Welte (2009). PAT proteins, an ancient family of lipid droplet proteins that regulate cellular lipid stores. Biochim. Biophys. Acta. 1791, 419-440. Boström, P., M. Rutberg, J. Ericsson, P. Holmdahl, L. Andersson, M. Frohman, J. Boren, and S. Olofsson (2005). Cytosolic lipid droplets increase in size by
References
137
microtubule-dependent complex formation. Arterioscler. Thromb. Vasc. Biol. 25, 1945-1951. Boyce, M., and C. Bertozzi (2011). Bringing chemistry to life. Nat. Methods 8, 638-642. Brewer, J. M., K. G. J. Pollock, L. Tetley, and D. G. Russell (2004). Vesicle size influences the trafficking, processing, and presentation of antigens in lipid vesicles. J. Immunol. 173, 6143-6150. Buhman, K., M. Accad, and R. Farese (2000). Mammalian acyl-CoA:cholesterol acyltransferases. Biochim. Biophys. Acta 1529, 142-154. Caldas, H., and G. Herman (2003). NSDHL, an enzyme involved in cholesterol biosynthesis, traffics through the Golgi and accumulates on ER membranes and on the surface of lipid droplets. Hum. Mol. Genet. 12, 2981-2991. Campbell, I., and M. Humphries (2011). Integrin structure, activation, and interactions. Cold Spring Harb. Perspect. Biol. 3, a004994. Campbell, R. E., O. Tour, A. E. Palmer, P. A. Steinbach, G. S. Baird, D. A. Zacharias, and R. Y. Tsien (2002). A monomeric red fluorescent protein. Proc. Natl. Acad. Sci. USA 99, 7877-7882. Carpentier, J., P. Gorden, P. Freychet, A. Le Cam, and L. Orci (1979). Lysosomal association of internalized 125I-insulin in isolated rat hepatocytes. Direct demonstration by quantitative electron microscopic autoradiography. J. Clin. Invest. 63, 1249-1261. Chaban, V., and H. Khandelia (2014). Lipid structure in triolein lipid droplets. J. Phys. Chem. B 118, 10335-10340. Chalasani, N., Z. Younossi, J. E. Lavine, A. M. Diehl, E. M. Brunt, K. Cusi, M. Charlton, and A. J. Sanyal (2012). The diagnosis and management of non�alcoholic fatty liver disease: Practice guideline by the American Association for the Study of Liver Diseases, American College of Gastroenterology, and the American Gastroenterological Association. Hepatology 55, 2005-2023. Chang, C., N. Sakashita, K. Ornvold, O. Lee, E. Chang, R. Dong, S. Lin, C. Lee, S. Strom, R. Kashyap, J. Fung, R. J. Farese, J. Patoiseau, A. Delhon, and T. Chang (2000). Immunological quantitation and localization of ACAT-1 and ACAT-2 in human liver and small intestine. J. Biol. Chem. 275, 28083-28092. Chang, T., B. Li, C. Chang, and Y. Urano (2009). Acyl-coenzyme A:cholesterol acyltransferases. Am. J. Physiol. Endocrinol. Metab. 297, E1-9. Charron, G., J. Wilson, and H. Hang (2009). Chemical tools for understanding protein lipidation in eukaryotes. Curr. Opin. Chem. Biol. 13, 382-391. Chevalier, F., R. Lucas, J. Angulo, M. Martin-Lomas, and P. Nieto (2004). The heparin-Ca2+ Interaction: The influence of the O-sulfation pattern on binding. Carbohydr. Res. 339, 975-983. Chu, Y., M. Masoud, and G. Gebeyehu (2008). Transfection Reagents. U.S. Patent 7,470,817 B2. Coleman, J. (1990). Characterization of Escherichia coli cells deficient in 1-acyl-sn-glycerol-3-phosphate acyltransferase activity. J. Biol. Chem. 265, 17215-17221.

References
138
Coleman, J. (1992). Characterization of the Escherichia coli gene for 1-acyl-sn-glycerol-3-phosphate acyltransferase (plsC). Mol. Gen. Genet. MGG 232, 295-303. Czabany, T., A. Wagner, D. Zweytick, K. Lohner, E. Leitner, E. Ingolic, and G. Daum (2008). Structural and biochemical properties of lipid particles from the yeast Saccharomyces cerevisiae. J. Biol. Chem. 283, 17065-17074. D’Arrigo, P., and S. Servi (2010). Synthesis of lysophospholipids. Molecules 15, 1354-1377. Day, C., and O. James (1998). Steatohepatitis: A tale of two "hits"? Gastroenterology 114, 842-845. Day, J., K. Domke, G. Rago, H. Kano, H. Hamaguchi, E. Vartiainen, and M. Bonn (2011). Quantitative coherent anti-Stokes Raman scattering (CARS) microscopy. J. Phys. Chem. B 115, 7713-7725. Devaux, P. F., P. Fellmann, and P. Hervé (2002). Investigation on lipid asymmetry using lipid probes: Comparison between spin-labeled lipids and fluorescent lipids. Chem. Phys. Lip. 116, 115-134. Dinitto, J., T. Cronin, and D. Lambright (2003). Membrane recognition and targeting by lipid-binding domains. Sci. STKE 2003, re16. Donkor, J., M. Sariahmetoglu, J. Dewald, D. Brindley, and K. Reue (2007). Three mammalian lipins act as phosphatidate phosphatases with distinct tissue Expression patterns. J. Biol. Chem. 282, 3450-3457. Dou, W., D. Zhang, Y. Jung, J. Cheng, and D. Umulis (2012). Label-free imaging of lipid-droplet intracellular motion in early Drosophila embryos using femtosecond-stimulated Raman loss microscopy. Biophys. J. 102, 1666-1675. Engelman, D. M., and G. Hillman (1976). Molecular organization of the cholesteryl ester droplets in the fatty streaks of human aorta. J. Clinical Invest. 58, 997-1007. Erdmann, R., H. Takakura, A. Thompson, F. Rivera-Molina, E. Allgeyer, J. Bewersdorf, D. Toomre, and A. Schepartz (2014). Super-resolution imaging of the Golgi in live cells with a bioorthogonal ceramide probe. Angew. Chem. Int. Ed. Engl. 53, 10242-10246. Fahy, E., S. Subramaniam, H. A. Brown, C. K. Glass, A. H. Merrill, R. C. Murphy, C. R. H. Raetz, D. W. Russell, Y. Seyama, and W. Shaw (2005). A comprehensive classification system for lipids. J. Lipid Res. 46, 839-862. Fahy, E., S. Subramaniam, R. C. Murphy, M. Nishijima, C. R. H. Raetz, T. Shimizu, F. Spener, G. van Meer, M. J. O. Wakelam, and E. A. Dennis (2009). Update of the LIPID MAPS comprehensive classification system for lipids. J. Lipid Res. 50, S9-S14. Favre, A., J. Grugier, A. Brans, B. Joris, and J. Marchand-Brynaert (2012). 6-Aminopenicillanic acid (6-APA) derivatives equipped with anchoring arms. Tetrahedron 68, 10818-10826. Filipe, A., and J. Mclauchlan (2015). Hepatitis C virus and lipid droplets: Finding a niche. Trends. Mol. Med. 21 (1), 34-42. Fisher, K. (1976). Analysis of membrane halves: Cholesterol. Proc. Natl. Acad. Sci. USA 73, 173-177.

References
139
Fitter, J., R. Lechner, and N. Dencher (1999). Interactions of hydration water and biological membranes studied by neutron scattering. J. Phys. Chem. B 103, 8036-8050. Freitag, S., I. Le Trong, L. Klumb, P. Stayton, and R. Stenkamp (1997). Structural studies of the streptavidin binding loop. Protein Sci. 6, 1157-1166. Friedman, J. R., and J. Nunnari (2014). Mitochondrial form and function. Nature 505, 335-343. Gabriel, D., and M. J. Carr (1989). Calcium destabilizes and causes conformational changes in hyaluronic acid. Am. J. Med. Sci. 298, 8-14. Gaebler, A., R. Milan, L. Straub, D. Hoelper, L. Kuerschner, and C. Thiele (2013). Alkyne lipids as substrates for click chemistry-based in vitro enzymatic assays. J. Lipid Res. 54, 2282-2290. Gan, L., D. M. Van Rooyen, M. Koina, R. Mccuskey, N. Teoh, and G. Farrell (2014). Hepatocyte free cholesterol lipotoxicity results from JNK1-mediated mitochondrial injury and is HMGB1 and TLR4-dependent. J. Hepatol. 61, 1376-1384. Gode, D., and D. Volmer (2013). Lipid imaging by mass spectrometry - a review. Analyst 138, 1289-1315. Gong, J., Z. Sun, L. Wu, W. Xu, N. Schieber, D. Xu, G. Shui, H. Yang, R. Parton, and P. Li (2011). Fsp27 promotes lipid droplet growth by lipid exchange and transfer at lipid droplet contact sites. J. Cell. Biol. 195, 953-963. Haberkant, P., R. Raijmakers, M. Wildwater, T. Sachsenheimer, B. Brügger, K. Maeda, M. Houweling, A. Gavin, C. Schultz, and G. van Meer (2013). In vivo profiling and visualization of cellular protein–lipid interactions using bifunctional fatty acids. Angew. Chem. Int. Ed. 52, 4033-4038. Hang, H., J. Wilson, and G. Charron (2011). Bioorthogonal chemical reporters for analyzing protein lipidation and lipid trafficking. Acc. Chem. Res. 44, 699-708. Hao, M., S. Lin, O. Karylowski, D. Wustner, T. Mcgraw, and F. Maxfield (2002). Vesicular and non-vesicular sterol transport in living cells. The endocytic recycling compartment is a major sterol storage organelle. J. Biol. Chem. 277, 609-617. Hares, W., and M. Frentzen (1987). Properties of the microsomal acyl-CoA: sn-1-acyl-glycerol-3-phosphate acyltransferase from spinach (Spinacia oleracea L.) leaves. J. Plant Physiol. 131, 49-59. Harkewicz, R., and E. Dennis (2011). Applications of mass spectrometry to lipids and membranes. Annu. Rev. Biochem. 80, 301-325. Hayashi, H., U. Igbavboa, H. Hamanaka, M. Kobayashi, S. Fujita, W. Wood, and K. Yanagisawa (2002). Cholesterol is increased in the exofacial leaflet of synaptic plasma membranes of human apolipoprotein E4 knock-in mice. Neuroreport 13, 383-386. Hell, S. (2009). Microscopy and its focal switch. Nat. Methods 6, 24-32. Hendrickson, W., A. Pahler, J. Smith, Y. Satow, E. Merritt, and R. Phizackerley (1989). Crystal structure of core streptavidin determined from multiwavelength anomalous diffraction of synchrotron radiation. Proc. Natl. Acad. Sci. USA 86, 2190-2194.
References
140
Herms, A., M. Bosch, N. Ariotti, B. Reddy, A. Fajardo, A. Fernandez-Vidal, A. Alvarez-Guaita, M. A. Fernandez-Rojo, C. Rentero, F. Tebar, C. Enrich, M. Geli, R. Parton, S. Gross, and A. Pol (2013). Cell-to-cell heterogeneity in lipid droplets suggests a mechanism to reduce lipotoxicity. Curr. Biol. 23, 1489-1496. Hiramine, Y., H. Emoto, S. Takasuga, and R. Hiramatsu (2010). Novel acyl-coenzyme A:monoacylglycerol acyltransferase plays an important role in hepatic triacylglycerol secretion. J. Lipid Res. 51, 1424-1431. Ho, J. K., R. I. Duclos, and J. A. Hamilton (2002). Interactions of acyl carnitines with model membranes: a 13C-NMR study. J. Lipid Res. 43, 1429-1439. Hofmann, K., C. Thiele, H. Schott, A. Gaebler, M. Schoene, Y. Kiver, S. Friedrichs, D. Lutjohann, and L. Kuerschner (2014). A novel alkyne cholesterol to trace cellular cholesterol metabolism and localization. J. Lipid Res. 55, 583-591. Hollenback, D., L. Bonham, L. Law, E. Rossnagle, L. Romero, H. Carew, C. Tompkins, D. Leung, J. Singer, and T. White (2006). Substrate specificity of lysophosphatidic acid acyltransferase β - evidence from membrane and whole cell assays. J. Lipid Res. 47, 593-604. Hong, S., T. Chen, Y. Zhu, A. Li, Y. Huang, and X. Chen (2014). Live-cell stimulated Raman scattering imaging of alkyne-tagged biomolecules. Angew. Chem. Int. Ed. Engl. 53, 5827-5831. Honigmann, A., V. Mueller, H. Ta, A. Schoenle, E. Sezgin, S. Hell, and C. Eggeling (2014). Scanning STED-FCS reveals spatiotemporal heterogeneity of lipid interaction in the plasma membrane of living cells. Nat. Commun. 5, 5412. Hosokawa, M., M. Ando, S. Mukai, K. Osada, T. Yoshino, H. Hamaguchi, and T. Tanaka (2014). In vivo live cell imaging for the quantitative monitoring of lipids by using Raman microspectroscopy. Anal. Chem. 86, 8224-8230. Huang, B., H. Babcock, and X. Zhuang (2010). Breaking the diffraction barrier: Super-resolution imaging of cells. Cell 143, 1047-1058. Huang, H., K. Nishi, H. Tsai, and B. Hammock (2007). Development of highly sensitive fluorescent assays for fatty acid amide hydrolase. Anal. Biochem. 363, 12-21. Huang, J., and G. Feigenson (1999). A microscopic interaction model of maximum solubility of cholesterol in lipid bilayers. Biophys. J. 76, 2142-2157. Hubscher, S. (2006). Histological assessment of non-alcoholic fatty liver disease. Histopathology 49, 450-465. Huster, D. (2014). Solid-state NMR spectroscopy to study protein-lipid interactions. Biochim. Biophys. Acta 1841, 1146-1160. Ikonen, E. (2008). Cellular cholesterol trafficking and compartmentalization. Nat. Rev. Mol. Cell Biol. 9, 125-138. Imgrund, S., D. Hartmann, H. Farwanah, M. Eckhardt, R. Sandhoff, J. Degen, V. Gieselmann, K. Sandhoff, and K. Willecke (2009). Adult ceramide synthase 2 (Cers2)-deficient mice exhibit myelin sheath defects, cerebellar degeneration, and hepatocarcinomas. J. Biol. Chem. 284, 33549-33560.
References
141
Ioannou, G. N., W. G. Haigh, D. Thorning, and C. Savard (2013). Hepatic cholesterol crystals and crown-like structures distinguish NASH from simple steatosis. J. Lipid Res. 54, 1326-1334. Jacquier, N., V. Choudhary, M. Mari, A. Toulmay, F. Reggiori, and R. Schneiter (2011). Lipid droplets are functionally connected to the endoplasmic reticulum in Saccharomyces cerevisiae. J. Cell Sci. 124, 2424-2437. Jao, C., M. Roth, R. Welti, and A. Salic (2009). Metabolic labeling and direct imaging of choline phospholipids in vivo. Proc. Natl. Acad. Sci. USA 106, 15332-15337. Jiang, H., T. Zheng, A. Lopez-Aguilar, L. Feng, F. Kopp, F. Marlow, and P. Wu (2014). Monitoring dynamic glycosylation in vivo using supersensitive click chemistry. Bioconjug. Chem. 25, 698-706. Jungst, C., M. Klein, and A. Zumbusch (2013). Long-term live cell microscopy studies of lipid droplet fusion dynamics in adipocytes. J. Lipid Res. 54, 3419-3429. Jungst, C., M. Winterhalder, and A. Zumbusch (2011). Fast and long term lipid droplet tracking with CARS microscopy. J. Biophotonics 4, 435-441. Kamau, P., and R. Jordan (2001). Complex formation constants for the aqueous copper(I)-acetonitrile system by a simple general method. Inorg. Chem. 40, 3879-3883. Kassan, A., A. Herms, A. Fernandez-Vidal, M. Bosch, N. Schieber, B. Reddy, A. Fajardo, M. Gelabert-Baldrich, F. Tebar, C. Enrich, S. Gross, R. Parton, and A. Pol (2013). Acyl-CoA synthetase 3 promotes lipid droplet biogenesis in ER microdomains. J. Cell Biol. 203, 985-1001. Kawaguchi, A., T. Yoshimura, and S. Okuda (1981). A new method for the preparation of acyl-CoA thioesters. J. Biochem. 89, 337-339. Kellner-Weibel, G., B. Mchendry-Rinde, M. P. Haynes, and S. Adelman (2001). Evidence that newly synthesized esterified cholesterol is deposited in existing cytoplasmic lipid inclusions. J. Lipid Res. 42, 768-777. Kemmer, G., and S. Keller (2010). Nonlinear least-squares data fitting in excel spreadsheets. Nat. Protoc. 5, 267-281. Kennedy, D., C. Mckay, M. Legault, D. Danielson, J. Blake, A. Pegoraro, A. Stolow, Z. Mester, and J. Pezacki (2011). Cellular consequences of copper complexes used to catalyze bioorthogonal click reactions. J. Am. Chem. Soc. 133, 17993-18001. Khelef, N., X. Buton, N. Beatini, H. Wang, V. Meiner, T. Chang, R. J. Farese, F. Maxfield, and I. Tabas (1998). Immunolocalization of acyl-coenzyme A:cholesterol O-acyltransferase in macrophages. J. Biol. Chem. 273, 11218-11224. Khor, V., R. Ahrends, Y. Lin, W. Shen, C. Adams, A. Roseman, Y. Cortez, M. Teruel, S. Azhar, and F. Kraemer (2014). The proteome of cholesteryl-ester-enriched versus triacylglycerol-enriched lipid droplets. PLoS One 9, e105047. Kim, H., Q. Qiao, H. Toop, J. Morris, and A. Don (2012). A fluorescent assay for ceramide synthase activity. J. Lipid Res. 53, 1701-1707. Kimmel, A., D. Brasaemle, M. Mcandrews-Hill, C. Sztalryd, and C. Londos (2010). Adoption of perilipin as a unifying nomenclature for the mammalian PAT-family of intracellular lipid storage droplet proteins. J. Lipid Res. 51, 468-471.
References
142
Klar, T., S. Jakobs, M. Dyba, A. Egner, and S. Hell (2000). Fluorescence microscopy with diffraction resolution barrier broken by stimulated emission. Proc. Natl. Acad. Sci. USA 97, 8206-8210. Klauda, J., R. Venable, J. Freites, J. W. O'Connor, D. Tobias, C. Mondragon-Ramirez, I. Vorobyov, A. J. Mackerell, and R. Pastor (2010). Update of the CHARMM all-atom additive force field for lipids: Validation on six lipid types. J. Phys. Chem. B 114, 7830-7843. Klemm, E., E. Spooner, and H. Ploegh (2011). Dual role of ancient ubiquitous protein 1 (AUP1) in lipid droplet accumulation and endoplasmic reticulum (ER) protein quality control. J. Biol. Chem. 286, 37602-37614. Kolb, H., M. Finn, and K. Sharpless (2001). Click chemistry: Diverse chemical function from a few good reactions. Angew. Chem. Int. Ed. Engl. 40, 2004-2021. Konige, M., H. Wang, and C. Sztalryd (2014). Role of adipose specific lipid droplet proteins in maintaining whole body energy homeostasis. Biochim. Biophys. Acta 1842, 393-401. Kornberg, A., and W. Pricer (1953). Enzymatic synthesis of the coenzyme A derivatives oflong chain fatty acids. J. Biol. Chem. 204, 329-343. Kostadinova, R., F. Boess, D. Applegate, L. Suter, T. Weiser, T. Singer, B. Naughton, and A. Roth (2013). A long-term three dimensional liver co-culture system for improved prediction of clinically relevant drug-induced hepatotoxicity. Toxicol. Appl. Pharmacol. 268, 1-16. Kozikowski, A. P., D. Qingjie, and S. Spiegel (1996). Synthesis of erythro-ω-aminosphingosine and preparation of an affinity column for sphingosine kinase purification. Tetrahedron Lett. 37, 3279-3282. Kuerschner, L., C. Ejsing, K. Ekroos, A. Shevchenko, K. Anderson, and C. Thiele (2005). Polyene-lipids: A new tool to image lipids. Nat. Methods 2, 39-45. Kuerschner, L., C. Moessinger, and C. Thiele (2008). Imaging of lipid biosynthesis: How a neutral lipid enters lipid droplets. Traffic 9, 338-352. Kuerschner, L., and C. Thiele (2014). Multiple bonds for the lipid interest. Biochim. Biophys. Acta 1841, 1031-1037. Lada, A. T., M. C. Willingham, and R. W. S. Clair (2002). Triglyceride depletion in THP-1 cells alters cholesteryl ester physical state and cholesterol efflux. J. Lipid Res. 43, 618-628. Lahiri, S., H. Lee, J. Mesicek, Z. Fuks, A. Haimovitz-Friedman, R. Kolesnick, and A. Futerman (2007). Kinetic characterization of mammalian ceramide synthases: Determination of Km values towards sphinganine. FEBS Lett. 581, 5289-5294. Lange, Y., J. Ye, and T. Steck (2014). Essentially all excess fibroblast cholesterol moves from plasma membranes to intracellular compartments. PLoS One 9, e98482. Laviad, E., L. Albee, I. Pankova-Kholmyansky, S. Epstein, H. Park, A. J. Merrill, and A. Futerman (2008). Characterization of ceramide synthase 2: Tissue distribution, substrate specificity, and inhibition by sphingosine 1-phosphate. J. Biol. Chem. 283, 5677-5684. Lechene, C., F. Hillion, G. Mcmahon, D. Benson, A. Kleinfeld, J. Kampf, D. Distel, Y. Luyten, J. Bonventre, D. Hentschel, K. Park, S. Ito, M. Schwartz, G. Benichou, and
References
143
G. Slodzian (2006). High-resolution quantitative imaging of mammalian and bacterial cells using stable isotope mass spectrometry. J. Biol. 5, 20. Leckband, D., and A. Prakasam (2006). Mechanism and dynamics of cadherin adhesion. Annu. Rev. Biomed. Eng. 8, 259-287. Lee, T., H. Mundoor, D. Gann, T. Callahan, and I. Smalyukh (2013). Imaging of director fields in liquid crystals using stimulated Raman scattering microscopy. Opt. Express 21, 12129-12134. Levy, M., and A. Futerman (2010). Mammalian ceramide synthases. IUBMB Life 62, 347-356. Lewin, T., P. Wang, and R. Coleman (1999). Analysis of amino acid motifs diagnostic for the sn-glycerol-3-phosphate acyltransferase reaction. Biochemistry 38, 5764-5771. Li, J., M. Hoene, X. Zhao, S. Chen, H. Wei, H.-U. Häring, X. Lin, Z. Zeng, C. Weigert, and R. Lehmann (2013). Stable isotope-assisted lipidomics combined with nontargeted isotopomer filtering, a tool to unravel the complex dynamics of lipid metabolism. Anal. Chem. 85, 4651-4657. Li, Y., and W. Prinz (2004). ATP-binding cassette (ABC) transporters mediate nonvesicular, raft-Modulated sterol movement from the plasma membrane to the endoplasmic reticulum. J. Biol. Chem. 279, 45226-45234. Li, Z., K. Thiel, P. Thul, M. Beller, R. Kuhnlein, and M. Welte (2012). Lipid droplets control the maternal histone supply of Drosophila embryos. Curr. Biol. 22, 2104-2113. Liang, J., P. Oelkers, C. Guo, P. Chu, J. Dixon, H. Ginsberg, and S. Sturley (2004). Overexpression of human diacylglycerol acyltransferase 1, acyl-CoA:cholesterol acyltransferase 1, or acyl-CoA: cholesterol acyltransferase 2 stimulates secretion of apolipoprotein B-containing lipoproteins in McA-RH7777 cells. J. Biol. Chem. 279, 44938-44944. Lim, K., H. Huang, A. Pralle, and S. Park (2013). Stable, high-affinity streptavidin monomer for protein labeling and monovalent biotin detection. Biotechnol. Bioeng. 110, 57-67. Liu, J., C. Chang, E. Westover, D. Covey, and T. Chang (2005). Investigating the allosterism of acyl-CoA:cholesterol acyltransferase (ACAT) by using various sterols: In vitro and intact cell studies. Biochem. J. 391, 389-397. Lohmann, D., J. Spandl, A. Stevanovic, M. Schoene, J. Philippou-Massier, and C. Thiele (2013). Monoubiquitination of ancient ubiquitous protein 1 promotes lipid droplet clustering. PLoS One 8, e72453. Loizides-Mangold, U., S. Clement, A. Alfonso-Garcia, E. Branche, S. Conzelmann, C. Parisot, E. Potma, H. Riezman, and F. Negro (2014). HCV 3a core protein increases lipid droplet cholesteryl ester content via a mechanism dependent on sphingolipid biosynthesis. PLoS One 9, e115309. Lynes, E., and T. Simmen (2011). Urban planning of the endoplasmic reticulum (ER): How diverse mechanisms segregate the many functions of the ER. Biochim. Biophys. Acta 1813, 1893-1905.
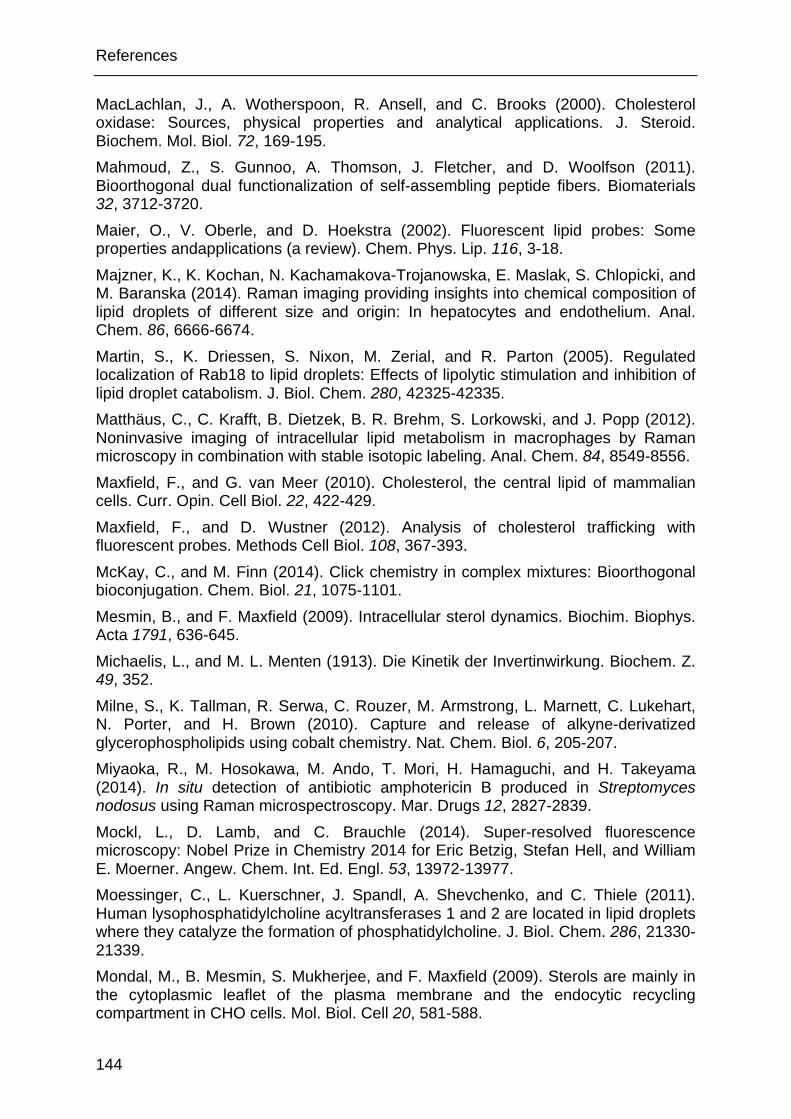
References
144
MacLachlan, J., A. Wotherspoon, R. Ansell, and C. Brooks (2000). Cholesterol oxidase: Sources, physical properties and analytical applications. J. Steroid. Biochem. Mol. Biol. 72, 169-195. Mahmoud, Z., S. Gunnoo, A. Thomson, J. Fletcher, and D. Woolfson (2011). Bioorthogonal dual functionalization of self-assembling peptide fibers. Biomaterials 32, 3712-3720. Maier, O., V. Oberle, and D. Hoekstra (2002). Fluorescent lipid probes: Some properties andapplications (a review). Chem. Phys. Lip. 116, 3-18. Majzner, K., K. Kochan, N. Kachamakova-Trojanowska, E. Maslak, S. Chlopicki, and M. Baranska (2014). Raman imaging providing insights into chemical composition of lipid droplets of different size and origin: In hepatocytes and endothelium. Anal. Chem. 86, 6666-6674. Martin, S., K. Driessen, S. Nixon, M. Zerial, and R. Parton (2005). Regulated localization of Rab18 to lipid droplets: Effects of lipolytic stimulation and inhibition of lipid droplet catabolism. J. Biol. Chem. 280, 42325-42335. Matthäus, C., C. Krafft, B. Dietzek, B. R. Brehm, S. Lorkowski, and J. Popp (2012). Noninvasive imaging of intracellular lipid metabolism in macrophages by Raman microscopy in combination with stable isotopic labeling. Anal. Chem. 84, 8549-8556. Maxfield, F., and G. van Meer (2010). Cholesterol, the central lipid of mammalian cells. Curr. Opin. Cell Biol. 22, 422-429. Maxfield, F., and D. Wustner (2012). Analysis of cholesterol trafficking with fluorescent probes. Methods Cell Biol. 108, 367-393. McKay, C., and M. Finn (2014). Click chemistry in complex mixtures: Bioorthogonal bioconjugation. Chem. Biol. 21, 1075-1101. Mesmin, B., and F. Maxfield (2009). Intracellular sterol dynamics. Biochim. Biophys. Acta 1791, 636-645. Michaelis, L., and M. L. Menten (1913). Die Kinetik der Invertinwirkung. Biochem. Z. 49, 352. Milne, S., K. Tallman, R. Serwa, C. Rouzer, M. Armstrong, L. Marnett, C. Lukehart, N. Porter, and H. Brown (2010). Capture and release of alkyne-derivatized glycerophospholipids using cobalt chemistry. Nat. Chem. Biol. 6, 205-207. Miyaoka, R., M. Hosokawa, M. Ando, T. Mori, H. Hamaguchi, and H. Takeyama (2014). In situ detection of antibiotic amphotericin B produced in Streptomyces nodosus using Raman microspectroscopy. Mar. Drugs 12, 2827-2839. Mockl, L., D. Lamb, and C. Brauchle (2014). Super-resolved fluorescence microscopy: Nobel Prize in Chemistry 2014 for Eric Betzig, Stefan Hell, and William E. Moerner. Angew. Chem. Int. Ed. Engl. 53, 13972-13977. Moessinger, C., L. Kuerschner, J. Spandl, A. Shevchenko, and C. Thiele (2011). Human lysophosphatidylcholine acyltransferases 1 and 2 are located in lipid droplets where they catalyze the formation of phosphatidylcholine. J. Biol. Chem. 286, 21330-21339. Mondal, M., B. Mesmin, S. Mukherjee, and F. Maxfield (2009). Sterols are mainly in the cytoplasmic leaflet of the plasma membrane and the endocytic recycling compartment in CHO cells. Mol. Biol. Cell 20, 581-588.
References
145
Mueller, V., C. Ringemann, A. Honigmann, G. Schwarzmann, R. Medda, M. Leutenegger, S. Polyakova, V. Belov, S. Hell, and C. Eggeling (2011). STED nanoscopy reveals molecular details of cholesterol- and cytoskeleton-modulated lipid interactions in living cells. Biophys. J. 101, 1651-1660. Musso, G., R. Gambino, and M. Cassader (2013). Cholesterol metabolism and the pathogenesis of non-alcoholic steatohepatitis. Prog. Lipid Res. 52, 175-191. Nagayama, M., T. Uchida, and K. Gohara (2007). Temporal and spatial variations of lipid droplets during adipocyte division and differentiation. J. Lipid Res. 48, 9-18. Nagle, J., and S. Tristram-Nagle (2000). Structure of lipid bilayers. Biochim. Biophys. Acta 1469, 159-195. Nakanishi, H., H. Shindou, D. Hishikawa, T. Harayama, R. Ogasawara, A. Suwabe, R. Taguchi, and T. Shimizu (2006). Cloning and characterization of mouse lung-type acyl-CoA:lysophosphatidylcholine acyltransferase 1 (LPCAT1). Expression in alveolar type II cells and possible involvement in surfactant production. J. Biol. Chem. 281, 20140-20147. Nan, X., E. Potma, and X. Xie (2006). Nonperturbative chemical imaging of organelle transport in living cells with coherent anti-Stokes Raman scattering microscopy. Biophys. J. 91, 728-735. Neef, A., and C. Schultz (2009). Selective fluorescence labeling of lipids in living cells. Angew. Chem. Int. Ed. Engl. 48, 1498-1500. Neuschwander-Tetri, B. A. (2010). Hepatic lipotoxicity and the pathogenesis of nonalcoholic steatohepatitis: The central role of nontriglyceride fatty acid metabolites. Hepatology 52, 774-788. Ohashi, M., N. Mizushima, Y. Kabeya, and T. Yoshimori (2003). Localization of mammalian NAD(P)H steroid dehydrogenase-like protein on lipid droplets. J. Biol. Chem. 278, 36819-36829. Ohsaki, Y., J. Cheng, M. Suzuki, Y. Shinohara, A. Fujita, and T. Fujimoto (2009). Biogenesis of cytoplasmic lipid droplets: From the lipid ester globule in the membrane to the visible structure. Biochim. Biophys. Acta 1791, 399-407. Ohsaki, Y., M. Suzuki, and T. Fujimoto (2014). Open questions in lipid droplet biology. Chem. Biol. 21, 86-96. Osborne, A., T. Rapoport, and B. Van Den Berg (2005). Protein translocation by the Sec61/SecY channel. Annu. Rev. Cell Dev. Biol. 21, 529-550. Otvos, J., E. Jeyarajah, D. Bennett, and R. Krauss (1992). Development of a proton nuclear magnetic resonance spectroscopic method for determining plasma lipoprotein concentrations and subspecies distributions from a single, rapid measurement. Clin. Chem. 38, 1632-1638. Owen, D., and K. Gaus (2013). Imaging lipid domains in cell membranes: The advent of super-resolution fluorescence microscopy. Front. Plant Sci. 4, 503. Ozeki, S., J. Cheng, K. Tauchi-Sato, N. Hatano, H. Taniguchi, and T. Fujimoto (2005). Rab18 localizes to lipid droplets and induces their close apposition to the endoplasmic reticulum-derived membrane. J. Cell Sci. 118, 2601-2611. Parini, P., M. Davis, A. Lada, S. Erickson, T. Wright, U. Gustafsson, S. Sahlin, C. Einarsson, M. Eriksson, B. Angelin, H. Tomoda, S. Omura, M. Willingham, and L.
References
146
Rudel (2004). ACAT2 is localized to hepatocytes and is the major cholesterol-esterifying enzyme in human liver. Circulation 110, 2017-2023. Park, E., A. Lee, S. Park, J. Kim, and M. Cho (2014). Multiple pathways are involved in palmitic acid-induced toxicity. Food Chem. Toxicol. 67, 26-34. Park, S., and C. Blackstone (2010). Further assembly required: Construction and dynamics of the endoplasmic reticulum network. EMBO Rep. 11, 515-521. Percot, A., and M. Lafleur (2001). Direct observation of domains in model stratum corneum lipid mixtures by Raman microspectroscopy. Biophys. J. 81, 2144-2153. Petrosino, S., T. Iuvone, and V. Di Marzo (2010). N-palmitoyl-ethanolamine: Biochemistry and new therapeutic opportunities. Biochimie 92, 724-727. Pol, A., S. Gross, and R. Parton (2014). Biogenesis of the multifunctional lipid droplet: Lipids, proteins, and sites. J. Cell Biol. 204, 635-646. Pramfalk, C., B. Angelin, M. Eriksson, and P. Parini (2007). Cholesterol regulates ACAT2 gene expression and enzyme activity in human hepatoma cells. Biochem. Biophys. Res. Commun. 364, 402-409. Prattes, S., G. Horl, A. Hammer, A. Blaschitz, W. Graier, W. Sattler, R. Zechner, and E. Steyrer (2000). Intracellular distribution and mobilization of unesterified cholesterol in adipocytes: Triglyceride droplets are surrounded by cholesterol-rich ER-like surface layer structures. J. Cell Sci. 113, 2977-2989. Prescher, J., and C. Bertozzi (2005). Chemistry in living systems. Nat. Chem. Biol. 1, 13-21. Prinz, W. (2007). Non-vesicular sterol transport in cells. Prog. Lipid Res. 46, 297-314. Rinia, H., K. Burger, M. Bonn, and M. Muller (2008). Quantitative label-free imaging of lipid composition and packing of individual cellular lipid droplets using multiplex CARS microscopy. Biophys. J. 95, 4908-4914. Rostovtsev, V., L. Green, V. Fokin, and K. Sharpless (2002). A Stepwise Huisgen Cycloaddition Process: Copper(I)-catalyzed regioselective "ligation" of azides and terminal alkynes. Angew Chem Int Ed Engl 41, 2596-2599. Saka, S., A. Honigmann, C. Eggeling, S. Hell, T. Lang, and S. Rizzoli (2014). Multi-protein assemblies underlie the mesoscale organization of the plasma membrane. Nat. Commun. 5, 4509. Sakashita, N., A. Miyazaki, M. Takeya, S. Horiuchi, C. Chang, T. Chang, and K. Takahashi (2000). Localization of human acyl-coenzyme A: cholesterol acyltransferase-1 (ACAT-1) in macrophages and in various tissues. Am. J. Pathol. 156, 227-236. Saxon, E., and C. Bertozzi (2000). Cell surface engineering by a modified Staudinger reaction. Science 287, 2007-2010. Schie, I., L. Nolte, T. Pedersen, Z. Smith, J. Wu, I. Yahiatene, J. Newman, and T. Huser (2013). Direct comparison of fatty acid ratios in single cellular lipid droplets as determined by comparative Raman spectroscopy and gas chromatography. Analyst 138, 6662-6670.
References
147
Schindelin, J., I. Arganda-Carreras, E. Frise, V. Kaynig, M. Longair, T. Pietzsch, S. Preibisch, C. Rueden, S. Saalfeld, B. Schmid, J. Tinevez, D. White, V. Hartenstein, K. Eliceiri, P. Tomancak, and A. Cardona (2012). Fiji: An open-source platform for biological-image analysis. Nat. Methods 9, 676-682. Schreiner, M., R. G. Moreira, and H. W. Hulan (2006). Positional distribution of fatty acids in egg yolk lipids. J. Food Lipids 13, 36-56. Sezgin, E., and P. Schwille (2011). Fluorescence techniques to study lipid dynamics. Cold Spring Harb. Perspect. Biol. 3: a009803. Shaner, N., R. Campbell, P. Steinbach, B. Giepmans, A. Palmer, and R. Tsien (2004). Improved monomeric red, orange and yellow fluorescent proteins derived from Discosoma sp. red fluorescent protein. Nat. Biotechnol. 22, 1567-1572. Sharpe, L., E. Cook, N. Zelcer, and A. Brown (2014). The UPS and downs of cholesterol homeostasis. Trends Biochem. Sci. 39, 527-535. Sieber, J., K. Willig, C. Kutzner, C. Gerding-Reimers, B. Harke, G. Donnert, B. Rammner, C. Eggeling, S. Hell, H. Grubmuller, and T. Lang (2007). Anatomy and dynamics of a supramolecular membrane protein cluster. Science 317, 1072-1076. Simons, K., and E. Ikonen (1997). Functional rafts in cell membranes. Nature 387, 569-572. Simons, K., and W. Vaz (2004). Model systems, lipid rafts, and cell membranes. Annu. Rev. Biophys. Biomol. Struct. 33, 269-295. Sivakumar, K., F. Xie, B. M. Cash, S. Long, H. N. Barnhill, and Q. Wang (2004). A fluorogenic 1, 3-dipolar cycloaddition reaction of 3-azidocoumarins and acetylenes. Org. Lett. 6, 4603-4606. Sletten, E., G. De Almeida, and C. Bertozzi (2014). A homologation approach to the synthesis of difluorinated cycloalkynes. Org. Lett. 16, 1634-1637. Smith, M., C. Sudhahar, D. Gong, R. Stahelin, and M. Best (2009). Modular synthesis of biologically active phosphatidic acid probes using click chemistry. Mol. Biosyst. 5, 962-972. Sniderman, A., Y. Qi, C. Ma, R. Wang, M. Naples, C. Baker, J. Zhang, K. Adeli, and R. Kiss (2013). Hepatic cholesterol homeostasis: Is the low-density lipoprotein pathway a regulatory or a shunt pathway? Arterioscler. Thromb. Vasc. Biol. 33, 2481-2490. Solanko, L., A. Honigmann, H. Midtiby, F. Lund, J. Brewer, V. Dekaris, R. Bittman, C. Eggeling, and D. Wustner (2013). Membrane orientation and lateral diffusion of BODIPY-cholesterol as a function of probe structure. Biophys. J. 105, 2082-2092. Soni, K., G. Mardones, R. Sougrat, E. Smirnova, C. Jackson, and J. Bonifacino (2009). Coatomer-dependent protein delivery to lipid droplets. J. Cell Sci. 122, 1834-1841. Soriano Del Amo, D., W. Wang, H. Jiang, C. Besanceney, A. Yan, M. Levy, Y. Liu, F. Marlow, and P. Wu (2010). Biocompatible copper(I) catalysts for in vivo imaging of glycans. J Am Chem Soc 132, 16893-16899. Spandl, J., D. Lohmann, L. Kuerschner, C. Moessinger, and C. Thiele (2011). Ancient ubiquitous protein 1 (AUP1) localizes to lipid droplets and binds the E2
References
148
ubiquitin conjugase G2 (Ube2G2) via its G2 binding region. J. Biol. Chem. 286, 5599-5606. Spandl, J., D. White, J. Peychl, and C. Thiele (2009). Live cell multicolor imaging of lipid droplets with a new dye, LD540. Traffic 10, 1579-1584. Steck, T., and Y. Lange (2010). Cell cholesterol homeostasis: Mediation by active cholesterol. Trends Cell Biol. 20, 680-687. Steck, T., J. Ye, and Y. Lange (2002). Probing red cell membrane cholesterol movement with cyclodextrin. Biophys. J. 83, 2118-2125. Stewart, G. (1961). Mesomorphic forms of lipid in the structure of normal and atheromatous tissues. J. Path. Bact. 81, 385-393. Stowell, J. K., and T. S. Widlanski (1995). A new method for the phosphorylation of alcohols and phenols. Tetrahedron Lett. 36, 1825-1826. Suhalim, J., C. Chung, M. Lilledahl, R. Lim, M. Levi, B. Tromberg, and E. Potma (2012). Characterization of cholesterol crystals in atherosclerotic plaques using stimulated Raman scattering and second-harmonic generation microscopy. Biophys. J. 102, 1988-1995. Szymanski, K., D. Binns, R. Bartz, N. Grishin, W. Li, A. Agarwal, A. Garg, R. Anderson, and J. Goodman (2007). The lipodystrophy protein seipin is found at endoplasmic reticulum lipid droplet junctions and is important for droplet morphology. Proc. Natl. Acad. Sci. USA 104, 20890-20895. Tanaka, K. A. K., K. G. N. Suzuki, Y. M. Shirai, S. T. Shibutani, M. S. H. Miyahara, H. Tsuboi, M. Yahara, A. Yoshimura, S. Mayor, and T. K. Fujiwara (2010). Membrane molecules mobile even after chemical fixation. Nat. Methods 7, 865-866. Tauchi-Sato, K., S. Ozeki, T. Houjou, R. Taguchi, and T. Fujimoto (2002). The surface of lipid droplets is a phospholipid monolayer with a unique fatty acid composition. J. Biol. Chem. 277, 44507-44512. Taylor, D. C., N. Weber, L. R. Hogge, and E. W. Underhill (1990). A simple enzymatic method for the preparation of radiolabeled erucoyl-CoA and other long-chain fatty acyl-CoAs and their characterization by mass spectrometry. Anal. Biochem. 184, 311-316. Temel, R., L. Hou, L. Rudel, and G. Shelness (2007). ACAT2 stimulates cholesteryl ester secretion in ApoB-containing lipoproteins. J. Lipid Res. 48, 1618-1627. Thabuis, C., D. Tissot-Favre, J. Bezelgues, J. Martin, C. Cruz-Hernandez, F. Dionisi, and F. Destaillats (2008). Biological Functions and Metabolism of Oleoylethanolamide. Lipids 43, 887-894. Thiele, C., M. Hannah, F. Fahrenholz, and W. Huttner (2000). Cholesterol binds to synaptophysin and is required for biogenesis of synaptic vesicles. Nat. Cell Biol. 2, 42-49. Thiele, C., C. Papan, D. Hoelper, K. Kusserow, A. Gaebler, M. Schoene, K. Piotrowitz, D. Lohmann, J. Spandl, A. Stevanovic, A. Shevchenko, and L. Kuerschner (2012). Tracing fatty acid metabolism by click chemistry. ACS Chem. Biol. 7, 2004-2011.

References
149
Thirumurugan, P., D. Matosiuk, and K. Jozwiak (2013). Click chemistry for drug development and diverse chemical-biology applications. Chem. Rev. 113, 4905-4979. Tilg, H., and A. Moschen (2010). Evolution of inflammation in nonalcoholic fatty liver disease: The multiple parallel hits hypothesis. Hepatology 52, 1836-1846. Tonnesen, J., F. Nadrigny, K. Willig, R. Wedlich-Soldner, and U. Nagerl (2011). Two-color STED microscopy of living synapses using a single laser-beam pair. Biophys. J. 101, 2545-2552. Tornoe, C., C. Christensen, and M. Meldal (2002). Peptidotriazoles on solid phase: [1,2,3]-Triazoles by regiospecific copper(I)-catalyzed 1,3-dipolar cycloadditions of terminal alkynes to azides. J. Org. Chem. 67, 3057-3064. Tsuboi, K., N. Takezaki, and N. Ueda (2007). The N-acylethanolamine-hydrolyzing acid amidase (NAAA). Chem. Biodivers. 4, 1914-1925. Ueda, N., R. Puffenbarger, S. Yamamoto, and D. Deutsch (2000). The fatty acid amide hydrolase (FAAH). Chem. Phys. Lipids 108, 107-121. Uttamapinant, C., A. Tangpeerachaikul, S. Grecian, S. Clarke, U. Singh, P. Slade, K. R. Gee, and A. Y. Ting (2012). Fast, cell�compatible click chemistry with copper�chelating azides for biomolecular labeling. Angew. Chem. Int. Ed. 124, 5954-5958. van Geel, R., G. Pruijn, F. L. Van Delft, and W. Boelens (2012). Preventing thiol-yne addition improves the specificity of strain-promoted azide-alkyne cycloaddition. Bioconjug. Chem. 23, 392-398. van Meer, G. (2011). Dynamic transbilayer lipid asymmetry. Cold Spring Harb. Perspect. Biol. 3, a004671. van Meer, G., D. R. Voelker, and G. W. Feigenson (2008). Membrane lipids: Where they are and how they behave. Nat. Rev. Mol. Cell Biol. 9, 112-124. Van Rooyen, D. M., C. Larter, W. Haigh, M. Yeh, G. Ioannou, R. Kuver, S. Lee, N. Teoh, and G. Farrell (2011). Hepatic free cholesterol accumulates in obese, diabetic mice and causes nonalcoholic steatohepatitis. Gastroenterology 141, 1393-1403. Vicidomini, G., G. Moneron, K. Han, V. Westphal, H. Ta, M. Reuss, J. Engelhardt, C. Eggeling, and S. Hell (2011). Sharper low-power STED nanoscopy by time gating. Nat. Methods 8, 571-573. Vundyala, N., C. Sun, F. Sidime, W. Shi, W. L’amoreaux, K. Raja, and R. M. Peetz (2008). Biotin-functional oligo (p-phenylene vinylene)s synthesized using click chemistry. Tetrahedron Lett. 49, 6386-6389. Walther, T. C., and R. V. Farese Jr (2012). Lipid droplets and cellular lipid metabolism. Annu. Rev. Biochem. 81, 687. Wei, L., F. Hu, Y. Shen, Z. Chen, Y. Yu, C. Lin, M. Wang, and W. Min (2014). Live-cell imaging of alkyne-tagged small biomolecules by stimulated Raman scattering. Nat. Methods 11, 410-412. Weier, D., W. Lühs, J. Dettendorfer, and M. Frentzen (1998). sn-1-Acylglycerol-3-phosphate acyltransferase of Escherichia coli causes insertion of cis-11 eicosenoic acid into the sn-2 position of transgenic rapeseed oil. Mol. Breed. 4, 39-46.
References
150
Weiss, S., E. Kennedy, and J. Kiyasu (1960). The enzymatic synthesis of triglycerides. J. Biol. Chem. 235, 40-44. Weller, R. (1967). Cytochemistry of lipids in atherosclerosis. J. Path. Bact. 94, 171-182. Welte, M. (2009). Fat on the move: Intracellular motion of lipid droplets. Biochem. Soc. Trans. 37, 991-996. Wilfling, F., A. Thiam, M. Olarte, J. Wang, R. Beck, T. Gould, E. Allgeyer, F. Pincet, J. Bewersdorf, R. J. Farese, and T. Walther (2014). Arf1/COPI machinery acts directly on lipid droplets and enables their connection to the ER for protein targeting. eLife 3, e01607. Wilfling, F., H. Wang, J. Haas, N. Krahmer, T. Gould, A. Uchida, J. Cheng, M. Graham, R. Christiano, F. Frohlich, X. Liu, K. Buhman, R. Coleman, J. Bewersdorf, R. J. Farese, and T. Walther (2013). Triacylglycerol synthesis enzymes mediate lipid droplet growth by relocalizing from the ER to lipid droplets. Dev. Cell 24, 384-399. Windsor, K., T. C. Genaro-Mattos, H. Kim, W. Liu, K. Tallman, S. Miyamoto, Z. Korade, and N. Porter (2013). Probing lipid-protein adduction with alkynyl surrogates: Application to Smith-Lemli-Opitz syndrome. J. Lipid Res. 54, 2842-2850. Worrell, B., J. Malik, and V. Fokin (2013). Direct evidence of a dinuclear copper intermediate in Cu(I)-catalyzed azide-alkyne cycloadditions. Science 340, 457-460. Wouters, K., P. J. Van Gorp, V. Bieghs, M. J. Gijbels, H. Duimel, D. Lütjohann, A. Kerksiek, R. Van Kruchten, N. Maeda, and B. Staels (2008). Dietary cholesterol, rather than liver steatosis, leads to hepatic inflammation in hyperlipidemic mouse models of nonalcoholic steatohepatitis. Hepatology 48, 474-486. Wu, H., J. Volponi, A. Oliver, A. Parikh, B. Simmons, and S. Singh (2011). In vivo lipidomics using single-cell Raman spectroscopy. Proc. Natl. Acad. Sci. USA 108, 3809-3814. Wustner, D., M. Mondal, I. Tabas, and F. Maxfield (2005). Direct observation of rapid internalization and intracellular transport of sterol by macrophage foam cells. Traffic 6, 396-412. Xin, Y., H. Yang, X. Xia, L. Zhang, Y. Zhang, Y. Tong, Y. Chen, and W. Wang (2013). Expression and comparison of recombinant cholesterol oxidases (COD) in Escherichia coli with native cholesterol oxidase expressed in Brevibacterium sp. Afr. J. Biotechnol. 10, 14968-14976. Xu, X., and I. Tabas (1991). Lipoproteins activate acyl-coenzyme A:cholesterol acyltransferase in macrophages only After cellular cholesterol pools are expanded to a critical threshold level. J. Biol. Chem. 266, 17040-17048. Yamakoshi, H., K. Dodo, A. Palonpon, J. Ando, K. Fujita, S. Kawata, and M. Sodeoka (2012). Alkyne-tag Raman imaging for visualization of mobile small molecules in live cells. J. Am. Chem. Soc. 134, 20681-20689. Yamashita, A., H. Nakanishi, H. Suzuki, R. Kamata, K. Tanaka, K. Waku, and T. Sugiura (2007). Topology of acyltransferase motifs and substrate specificity and accessibility in 1-acyl-sn-glycero-3-phosphate acyltransferase 1. Biochim. Biophys. Acta 1771, 1202-1215.
References
151
Yang, L., Y. Ding, Y. Chen, S. Zhang, C. Huo, Y. Wang, J. Yu, P. Zhang, H. Na, H. Zhang, Y. Ma, and P. Liu (2012). The proteomics of lipid droplets: Structure, dynamics, and functions of the organelle conserved from bacteria to humans. J. Lipid Res. 53, 1245-1253. Ye, J., J. Li, Y. Liu, X. Li, T. Yang, X. Ma, Q. Li, Z. Yao, and P. Li (2009). Cideb, an ER- and lipid droplet-associated protein, mediates VLDL lipidation and maturation by interacting with apolipoprotein B. Cell Metab. 9, 177-190. Yu, Y., P. Ramachandran, and M. Wang (2014). Shedding new light on lipid functions with CARS and SRS microscopy. Biochim. Biophys. Acta 1841, 1120-1129. Zanghellini, J., F. Wodlei, and H. H. von Grunberg (2010). Phospholipid demixing and the birth of a lipid droplet. J. Theor. Biol. 264, 952-961. Zhao, Y., Y.-Q. Chen, T. M. Bonacci, D. S. Bredt, S. Li, W. R. Bensch, D. E. Moller, M. Kowala, R. J. Konrad, and G. Cao (2008). Identification and characterization of a major liver lysophosphatidylcholine acyltransferase. J. Biol. Chem. 283, 8258-8265. Zhu, X., J. Liu, and W. Zhang (2015). De novo biosynthesis of terminal alkyne-labeled natural products. Nat. Chem. Biol. 11, 115-120. Zilly, F., N. Halemani, D. Walrafen, L. Spitta, A. Schreiber, R. Jahn, and T. Lang (2011). Ca2+ induces clustering of membrane proteins in the plasma membrane via electrostatic interactions. EMBO J. 30, 1209-1220.
Acknowledgements
152
7 Acknowledgements/ Danksagung
First of all, I want to thank Christoph Thiele, who gave me the opportunity to join his lab and provided this interesting project. Many thanks for the helpful supervision and support. You were open to all questions, from the general outline of a project to specific problems of chemical syntheses. I would like to thank Thorsten Lang for reviewing this thesis and for the fruitful STED microscopy collaboration. Many thanks to Günter Mayer and Ulrich Kubitscheck for agreeing to be part of my thesis committee. I want to thank Jan-Gero Schlötel, whose expertise in STED microscopy enabled a new perspective on the alkyne-cholesterol project. I also want to acknowledge the DZNE for letting us use their STED equipment. I would like to thank our Raman microspectroscopy collaborators Haruko Takeyama and Rimi Miyaoka, for the Raman data and a warm welcome when I visited the lab. Many thanks to the students who contributed to the synthesis of the alkyne lipids (Dominik Hölper and Leon Straub), the establishment of the CerS assay (Robin Milan), cloning of constructs (Jennifer Zablocki) and the analysis of alkyne fatty acids in adipocytes (Mario Lauterbach). I thank Christiane Kremser and Klaus Willecke for providing mice for the CerS assay. Daniel Lohmann and Lars Kuerschner are acknowledged for sharing constructs. I am grateful to the German Federal Ministry of Science and Education for its financial support (Virtual Liver Network). I want to thank all former and present fellow lab members. I enjoyed your company very much. Especially Hanna, Mario, Lars and Christine helped me to get started in the lab. All lab members, but especially Lars and Anke, are acknowledged for the fruitful discussions about my projects. Mario, Kira and Lars diligently proof-read the manuscript. On the 3rd floor and throughout the LIMES, I enjoyed the open and helpful atmosphere, whether I needed advice on a protocol, wanted to borrow instrumentation or just needed someone to talk to in the coffee room. Nicht zuletzt gilt mein Dank allen meinen Freunden und meiner Familie für ihren Rückhalt, ihr Verständnis und die notwendige Ablenkung vom Mikrokosmos Labor und Wissenschaft. Ich danke besonders: Meinen Eltern, die mich immer unterstützt haben und mir stets alle Freiräume gegeben haben. Meiner Schwester Marie, weil manche Dinge nur sie versteht. Ashwani, weil er einfach für mich da ist.