all is not what it seems - why integrate land management and ecological literacy over space and...
TRANSCRIPT
All is not what it seems -
Why integrate land management and ecological literacy over space and time?
Richard Thackway
Fenner School, Australian National University ENVS 2022/6012, Sustainable Systems: Rural (2015)
14 July 2015

Outline
• Why is native vegetation important?• All is not what it seems – spatial & temporal change• How land use modifies and fragments native vegetation • Case studies• Lessons • Conclusions and more information
To understand landscape transformation we to understand why land managers change the
structure, composition and function of native vegetation
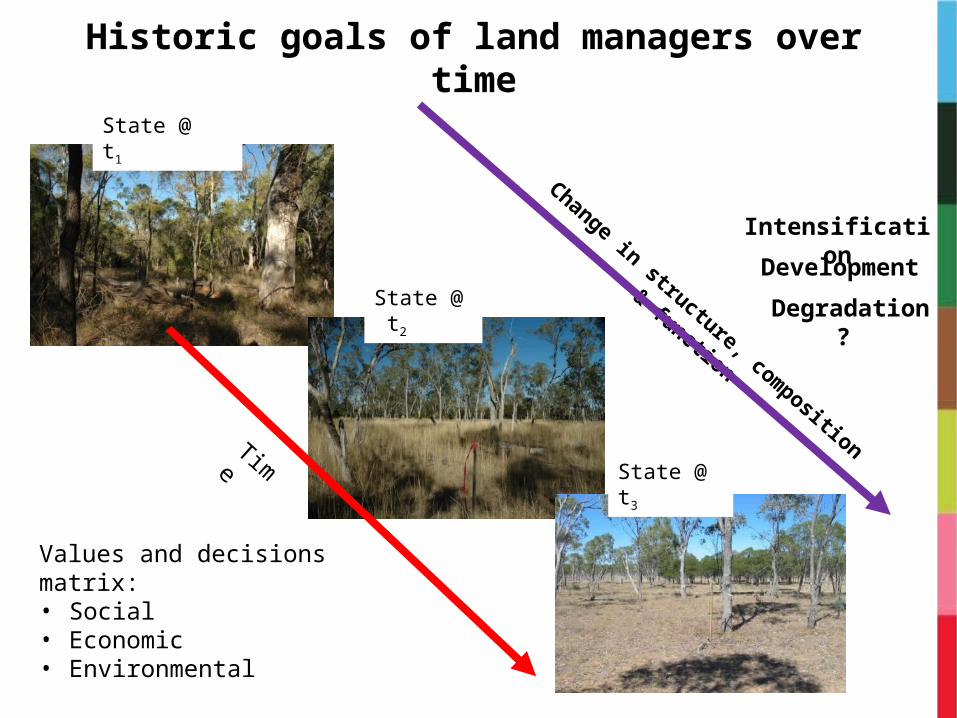
Historic goals of land managers over time
Change in structure, composition & function
Values and decisions matrix:• Social• Economic• Environmental
Intensification
Degradation?
Time
State @ t1
State @ t2
State @ t3
Development
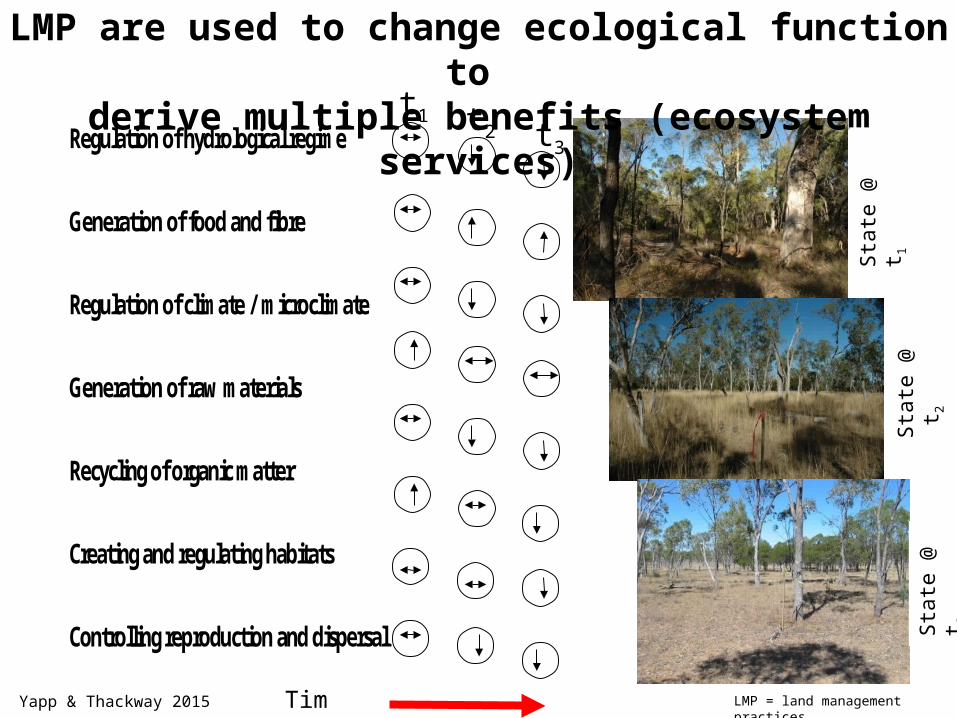
Regulation of hydrological regime Generation of food and fibre Regulation of climate / microclimate Generation of raw materials Recycling of organic matter Creating and regulating habitats Controlling reproduction and dispersal
LMP are used to change ecological function to derive multiple benefits (ecosystem services)
t1 t2 t3
Time
Stat
e @
t1
Stat
e @
t2
Stat
e @
t3
LMP = land management practices Yapp & Thackway 2015
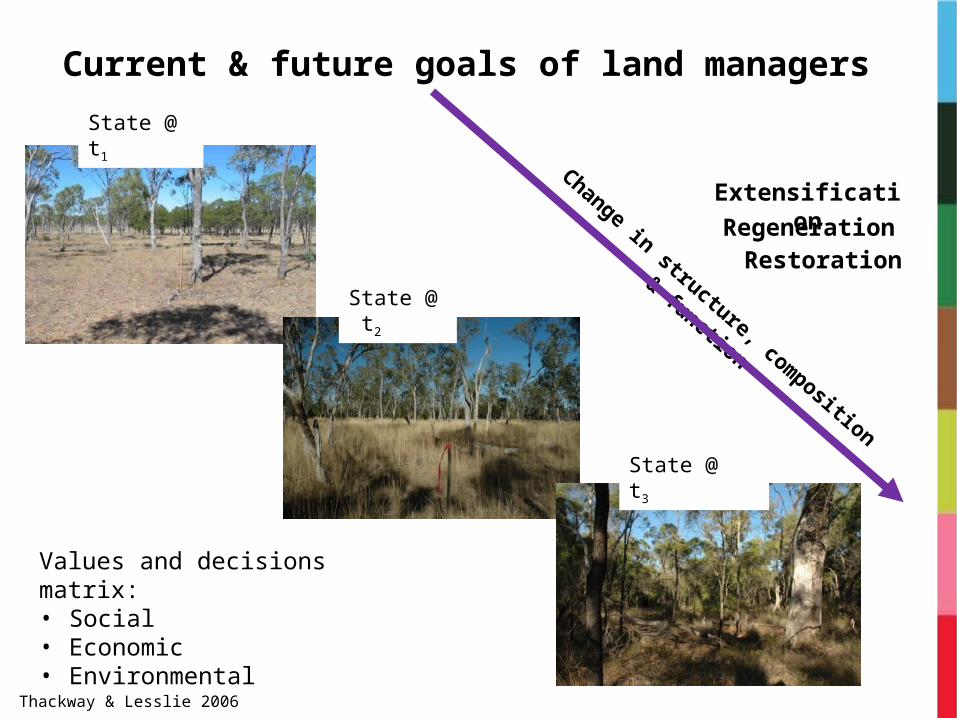
Current & future goals of land managers
Values and decisions matrix:• Social• Economic• Environmental
Extensification
Restoration
State @ t1
Regeneration
State @ t2
State @ t3
Change in structure, composition & function
Thackway & Lesslie 2006
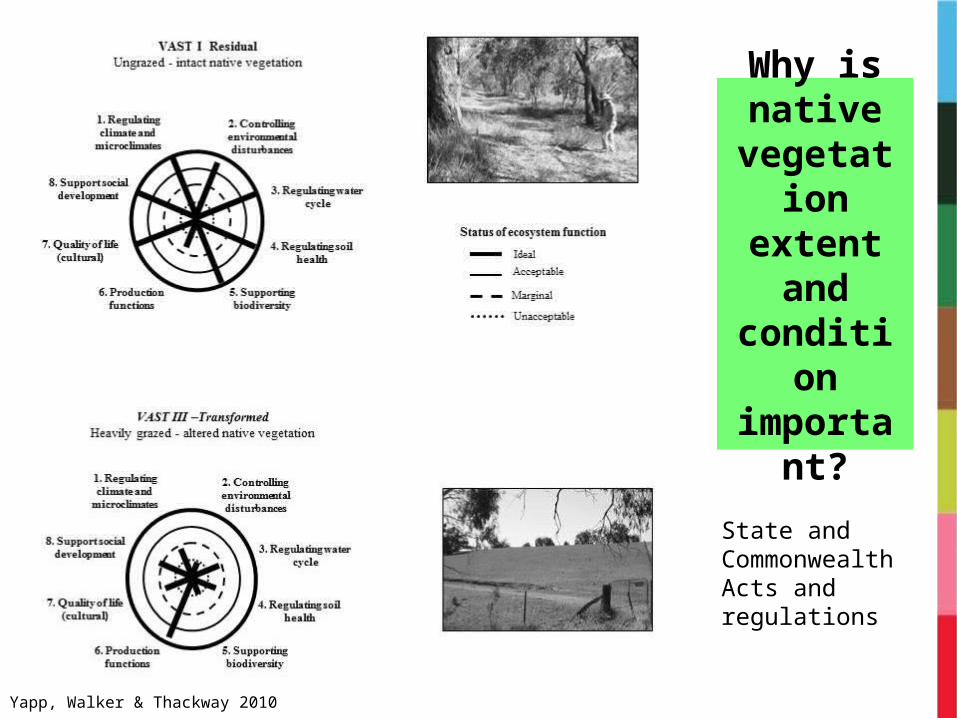
Why is native
vegetation extent and condition
important?
State and Commonwealth Acts and regulations
Yapp, Walker & Thackway 2010

Understanding the sites and landscapes over time
Indigenous land management
First explorers
Grazing
Deg
ree
of
resi
lienc
e/co
nditi
on
Logging
Cropping
Site 1
Site 2
Site 3
Time
Reference state
Long term rainfall
Long term disturbance e.g. wildfire, cyclones
Revegetation
Weeds
Ferals

What are the effects of severe natural events on vegetation condition?
• Wildfire• Dust storm• Cyclone• Others events …
Diagnostic attributes of VAST:• Vegetation structure• Species composition• Regenerative capacity
VAST-2 criteria and indicators Change & Trends

Photos: CSIRO
http://www.canberratimes.com.au/act-news/amazing-bush-recovery-follows-2003-firestorm-20130113-2cnx0.html
Brindabella Ranges, ACT Wildfires
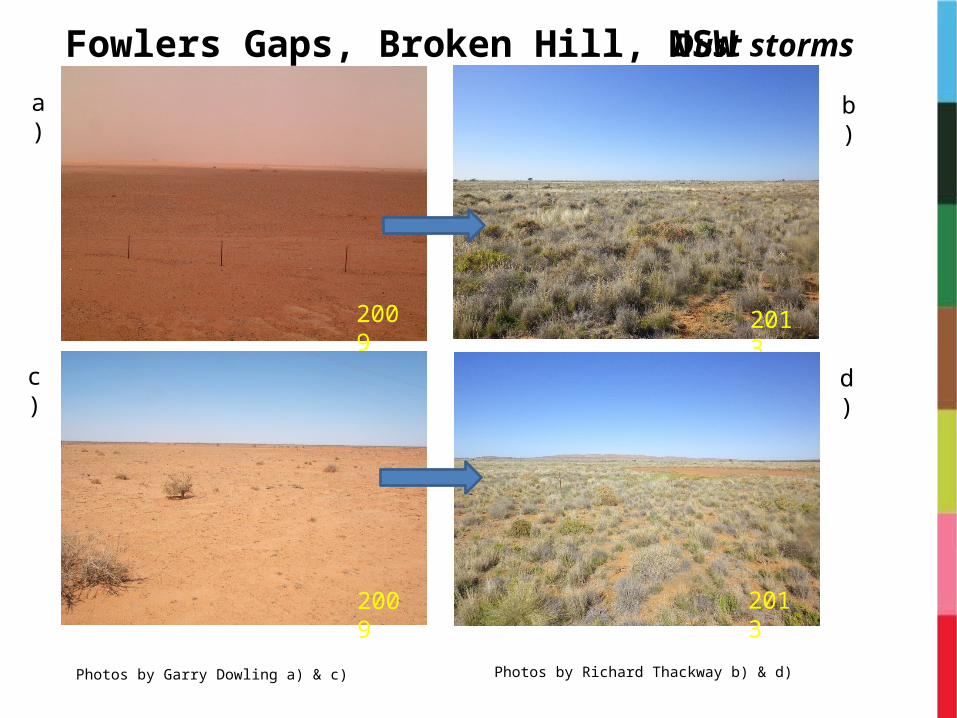
Fowlers Gaps, Broken Hill, NSW
Photos by Garry Dowling a) & c) Photos by Richard Thackway b) & d)
a) b)
c) d)
20132009
20132009
Dust storms
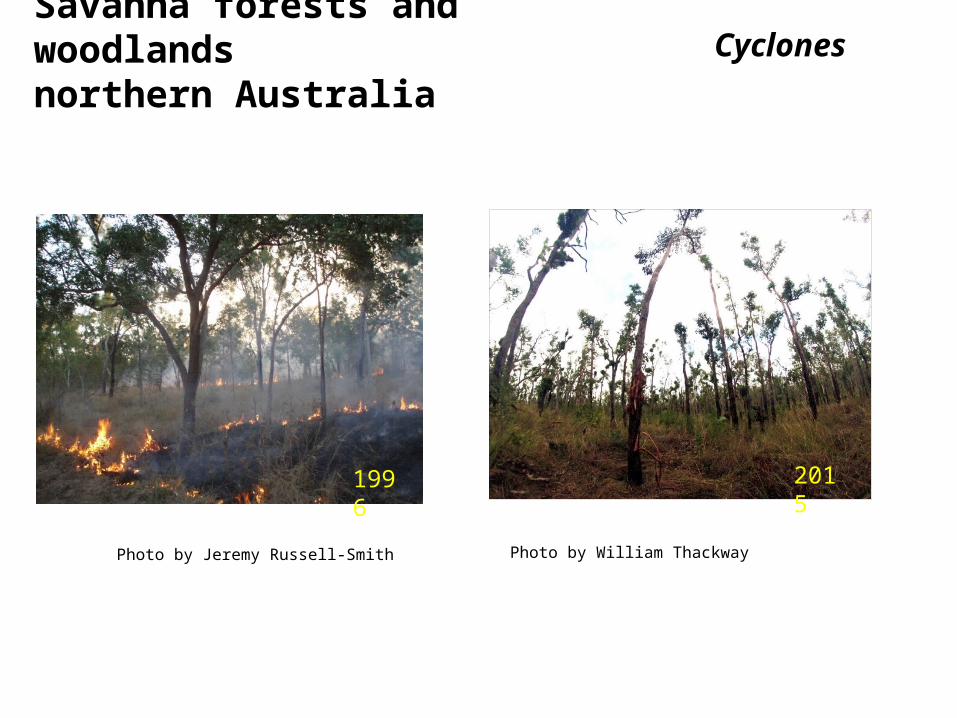
Savanna forests and woodlandsnorthern Australia
1996 2015
Photo by Jeremy Russell-Smith Photo by William Thackway
Cyclones

What is the effect of human interventions on vegetation condition?
• Pest animals• Grazing • Forestry• Infrastructure• Others …
Diagnostic attributes of VAST:• Vegetation structure• Species composition• Regenerative capacity
VAST-2 criteria and indicators Change & Trends
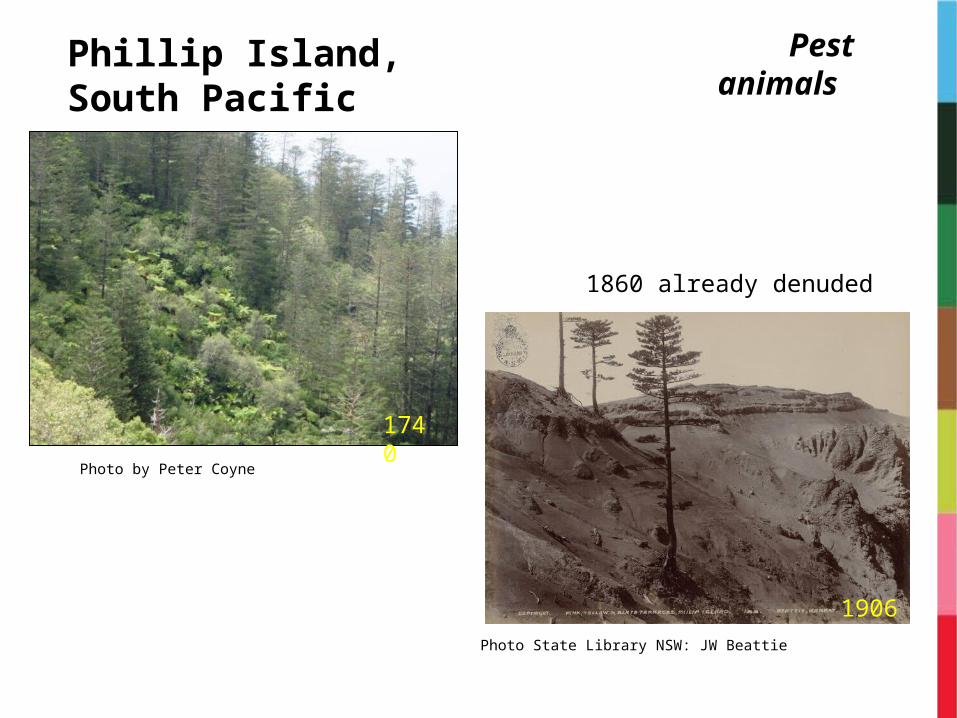
Photo by Peter Coyne
1740
1906
Phillip Island, South Pacific
Photo State Library NSW: JW Beattie
Pest animals
1860 already denuded
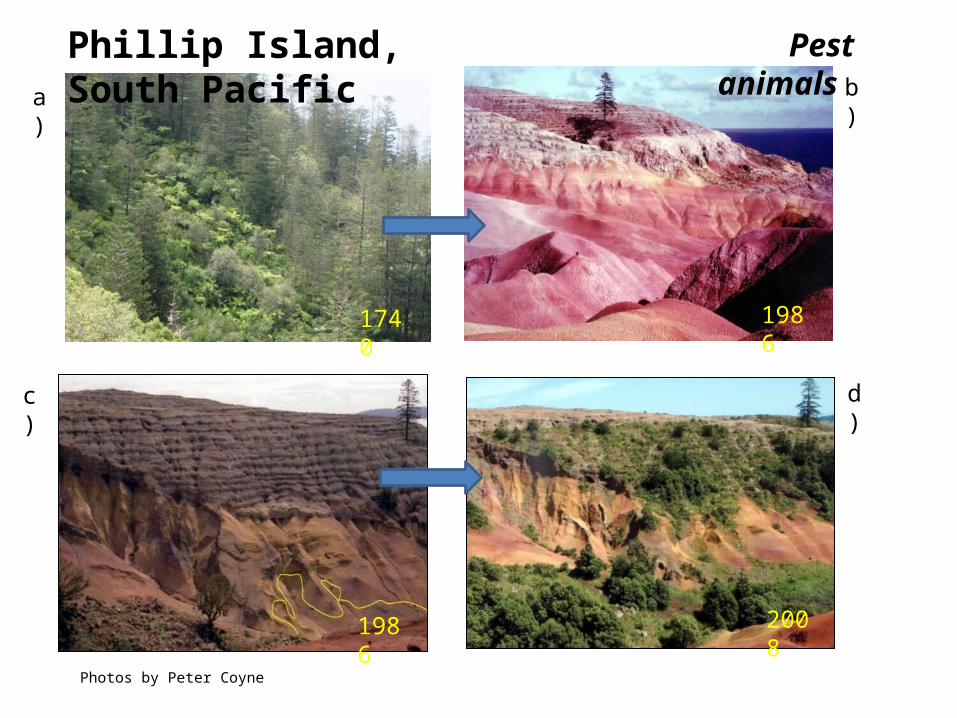
Phillip Island, South Pacific
Photos by Peter Coyne
a) b)
c) d)
1986 2008
1740 1986
Pest animals

Photo Richard Thackway
Kosciuszko National Park Power lines

Photo Richard Thackway
Power lines +++Kosciuszko National Park
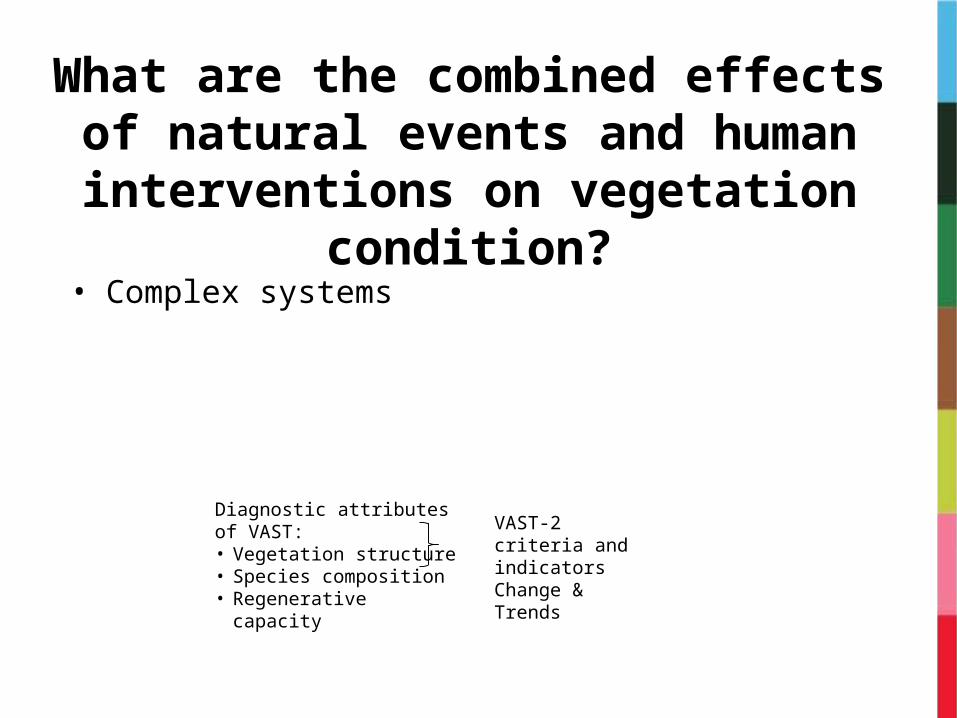
What are the combined effects of natural events and human interventions on
vegetation condition?
• Complex systems
Diagnostic attributes of VAST:• Vegetation structure• Species composition• Regenerative capacity
VAST-2 criteria and indicators Change & Trends

Photos by Richard Thackway
Power lines +++Kosciuszko National Park
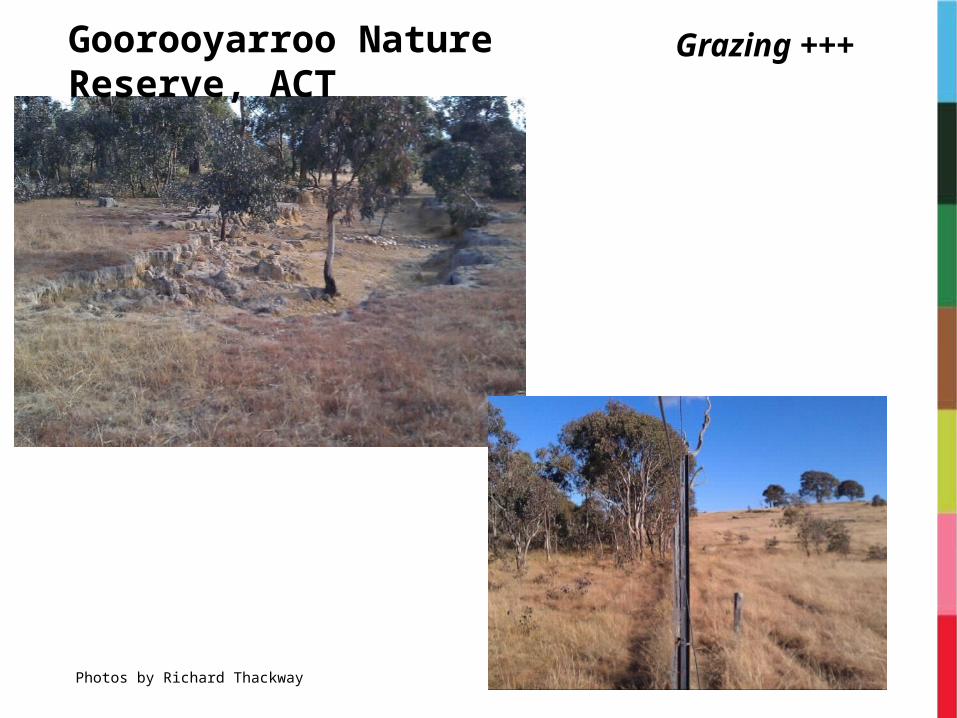
Grazing +++Goorooyarroo Nature Reserve, ACT
Photos by Richard Thackway

Understanding the transformation of sites and landscapes over time
Indigenous land management
First explorers
Grazing
Deg
ree
of
resi
lienc
e/co
nditi
on
Logging
Cropping
Site 1
Site 2
Site 3
Time
Reference state
Long term rainfall
Long term disturbance e.g. wildfire, cyclones
Revegetation
Weeds
Ferals
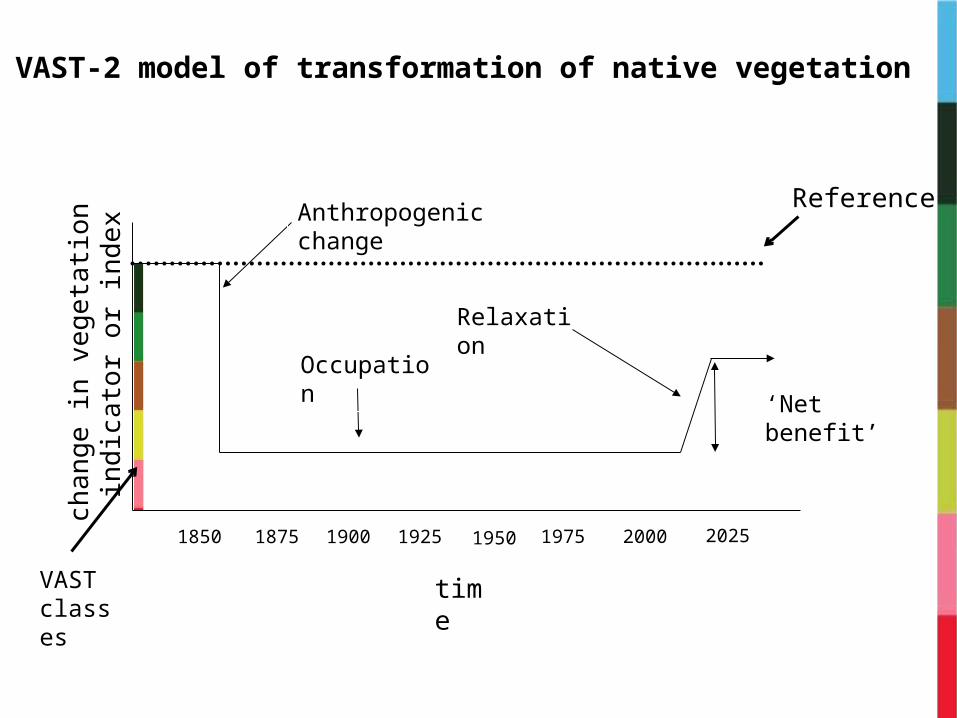
1925
Occupation
Relaxation
Anthropogenic change
‘Net benefit’
time
1900 2025 1950
Reference
chan
ge in
veg
etati
on in
dica
tor o
r ind
ex
1850 1875 1975 2000
VAST-2 model of transformation of native vegetation
VAST classes
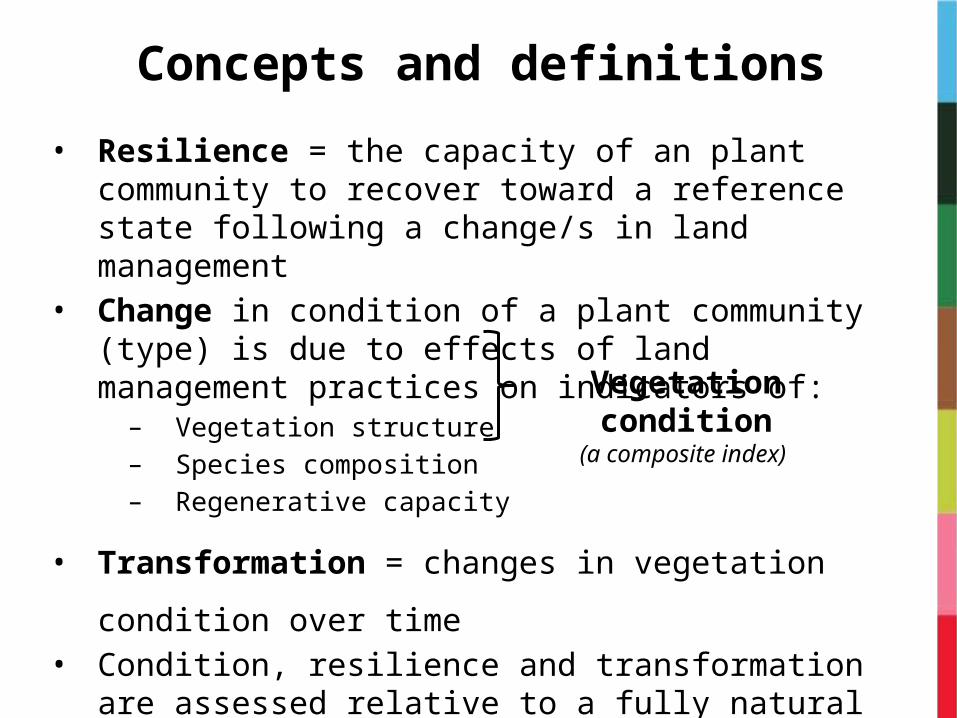
Concepts and definitions
• Resilience = the capacity of an plant community to recover toward a reference state following a change/s in land management
• Change in condition of a plant community (type) is due to effects of land management practices on indicators of:
– Vegetation structure– Species composition – Regenerative capacity
• Transformation = changes in vegetation condition over time• Condition, resilience and transformation are assessed relative
to a fully natural Reference state
Vegetation condition(a composite index)

How do land managers modify structure, composition & function (i.e. resilience) over time?
LMP that focus on soil
LMP that focus on native vegetation
Regenerative capacity/ function
Vegetation structure & Species composition
1. Soil hydrological status2. Soil physical status3. Soil chemical status4. Soil biological status5. Fire regime6. Reproductive potential7. Overstorey structure8. Understorey structure9. Overstorey composition10. Understorey composition
LMP = Land Management Practices
Focussing on 10 key criteria

Common interventions designed to influence structure, composition & function i.e. resilience
Various interventions: Land management practices (LMP) are used to influence ecological building blocks at sites and landscapes by:
• Modifying …• Removing and replacing …• Enhancing …• Restoring …• Maintaining …• Improving …
Various purposes:To achieve the desired mix of ecosystem services (space & time)

VAST-2 is an accounting system for assessing the transformation of native vegetation
Spp compVeg structure
LU = Land Use, LMP = Land Management Practices
VAST Diagnostic attributes
LU & LMPYear
Time
Regen cap
/Function
Every vegetated landscape has been effected by land
management practices since European settlement
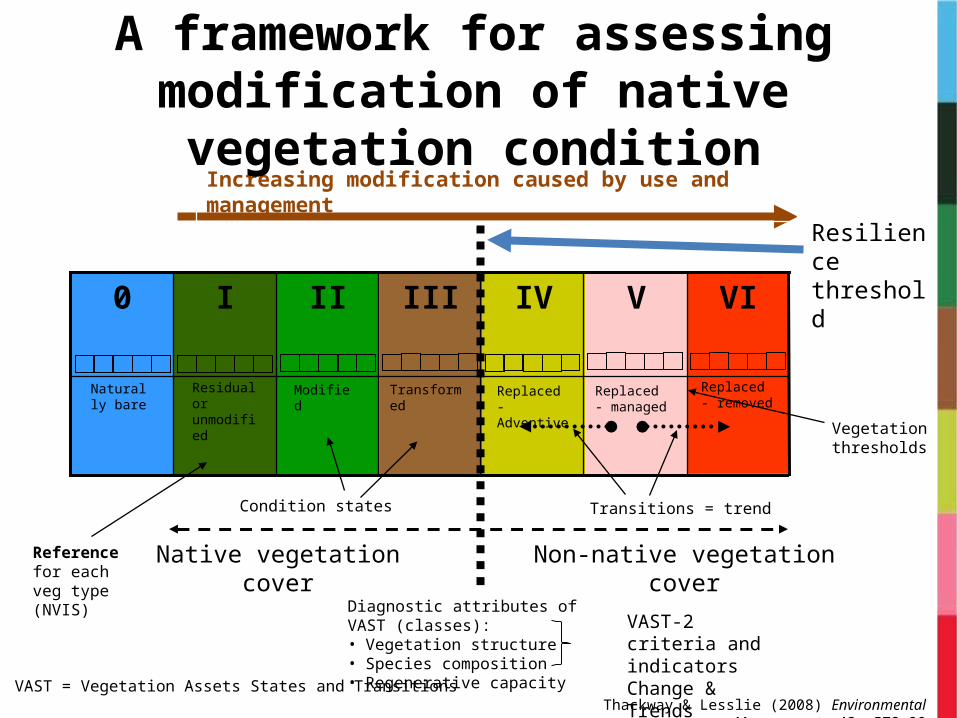
VAST = Vegetation Assets States and Transitions
VIVIVIIIIII0
Native vegetationcover
Non-native vegetationcover
Increasing modification caused by use and management
Transitions = trend
Vegetation thresholds
Reference for each veg type (NVIS)
A framework for assessing modification of native vegetation condition
Condition states
Residual or unmodified
Naturally bare
Modified Transformed Replaced -Adventive
Replaced - managed
Replaced - removed
Thackway & Lesslie (2008) Environmental Management, 42, 572-90
Diagnostic attributes of VAST (classes):• Vegetation structure• Species composition• Regenerative capacity
Resilience threshold
VAST-2 criteria and indicators Change & Trends

Thackway & Lesslie (2008) Environmental Management, 42,
572-90
NB: Input dataset biophysical naturalness reclassified using VAST framework
/ replaced
/ unmodified
VAST 2009
Veg condition derived by classifying &
mapping effects of land management practices
Native
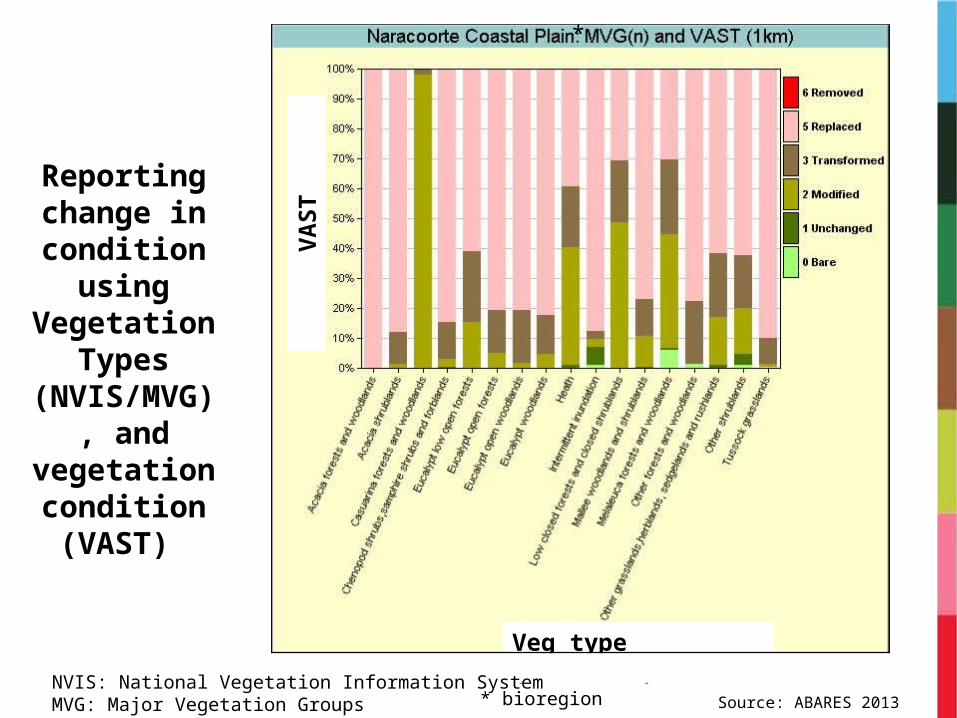
Reporting change in condition
using Vegetation
Types (NVIS/MVG),
and vegetation condition
(VAST)
Source: ABARES 2013
Veg type (NVIS/MVG)
NVIS: National Vegetation Information SystemMVG: Major Vegetation Groups
VAST
*
* bioregion

How does VAST-2 use metrics to assess and report
resilience/condition of native vegetation?
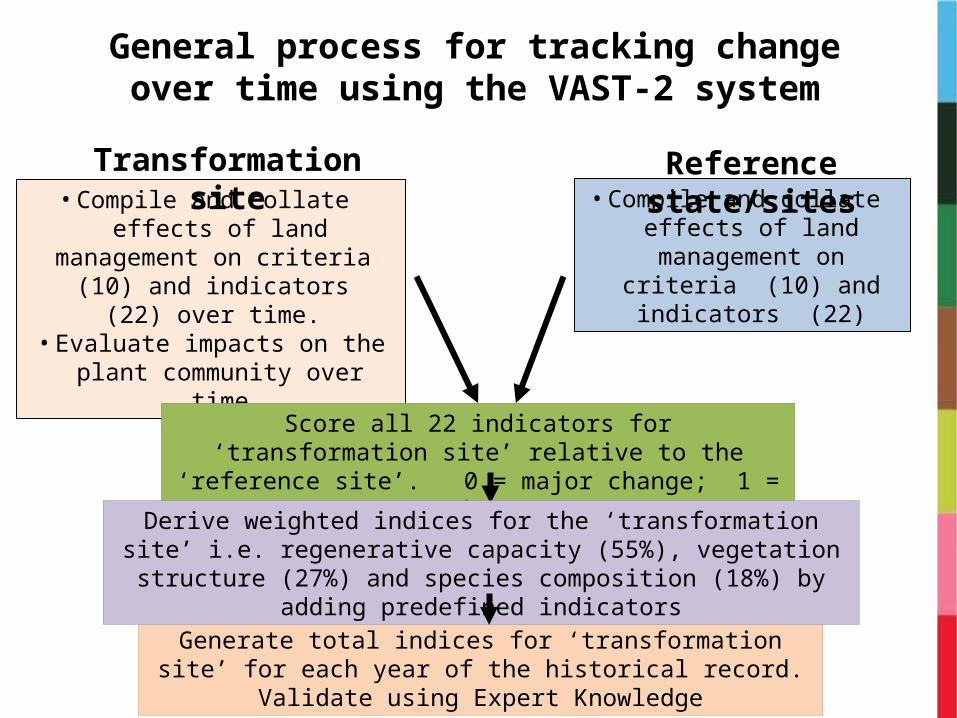
Generate total indices for ‘transformation site’ for each year of the historical record. Validate using Expert Knowledge
• Compile and collate effects of land management on criteria (10) and
indicators (22) over time. • Evaluate impacts on the plant
community over time
Transformation site• Compile and collate effects of
land management on criteria (10) and indicators (22)
Reference state/sites
Score all 22 indicators for ‘transformation site’ relative to the ‘reference site’. 0 = major change; 1 = no change
Derive weighted indices for the ‘transformation site’ i.e. regenerative capacity (55%), vegetation structure (27%) and species composition (18%)
by adding predefined indicators
General process for tracking change over time using the VAST-2 system
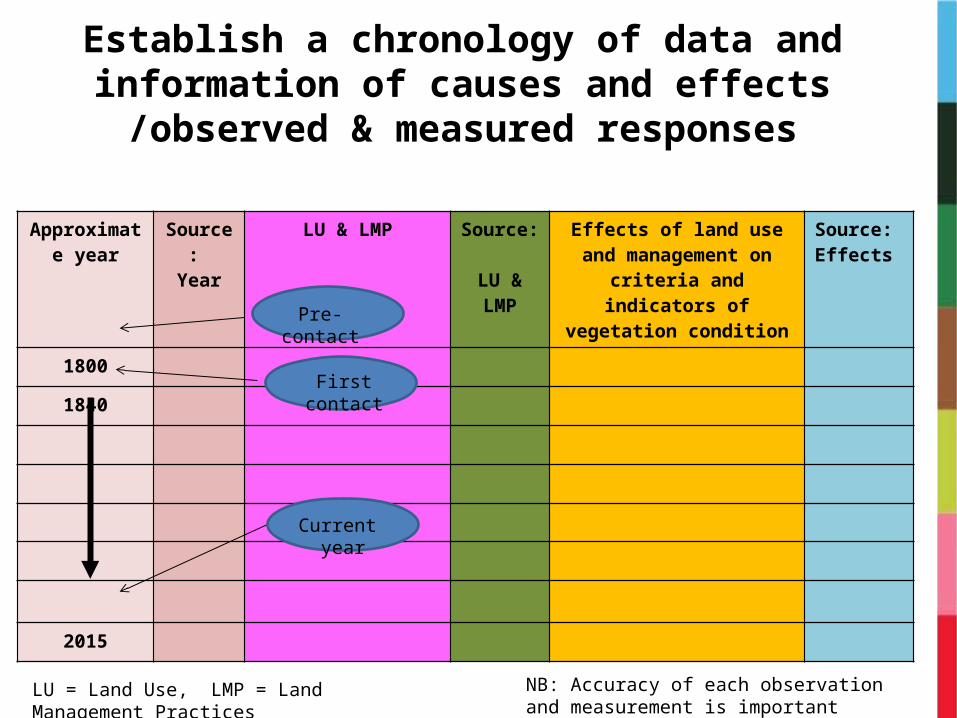
Approximate year
Source: Year
LU & LMP Source: LU & LMP
Effects of land use and management on criteria and
indicators of vegetation condition
Source: Effects
1800
1840
2015
Establish a chronology of data and information of causes and effects /observed & measured responses
Pre-contact
First contact
Current year
LU = Land Use, LMP = Land Management Practices NB: Accuracy of each observation and measurement is important
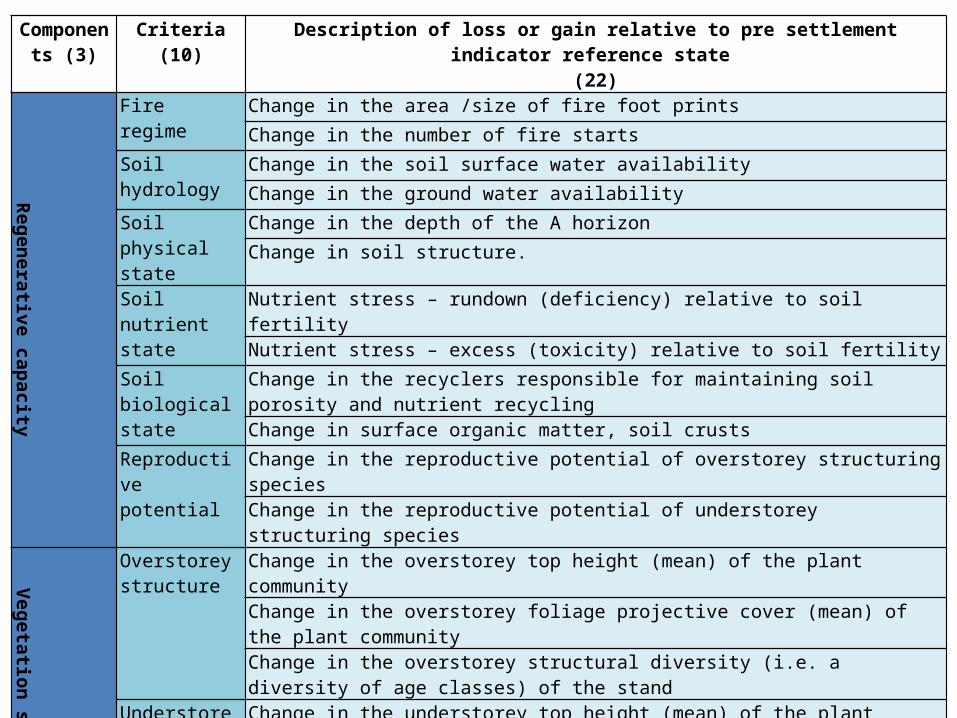
Components (3)
Criteria(10)
Description of loss or gain relative to pre settlement indicator reference state (22)
Regenerative
capacity
Fire regime Change in the area /size of fire foot prints
Change in the number of fire starts
Soil hydrology Change in the soil surface water availability
Change in the ground water availability
Soil physical state
Change in the depth of the A horizon
Change in soil structure.
Soil nutrient state
Nutrient stress – rundown (deficiency) relative to soil fertility
Nutrient stress – excess (toxicity) relative to soil fertility
Soil biological state
Change in the recyclers responsible for maintaining soil porosity and nutrient recycling
Change in surface organic matter, soil crusts
Reproductive potential
Change in the reproductive potential of overstorey structuring species
Change in the reproductive potential of understorey structuring species
Vegetation structure
Overstorey structure
Change in the overstorey top height (mean) of the plant community
Change in the overstorey foliage projective cover (mean) of the plant community
Change in the overstorey structural diversity (i.e. a diversity of age classes) of the stand
Understorey structure
Change in the understorey top height (mean) of the plant community
Change in the understorey ground cover (mean) of the plant community
Change in the understorey structural diversity (i.e. a diversity of age classes) of the plant
Species Compositi
on
Overstorey composition
Change in the densities of overstorey species functional groups
Change in no.s of indigenous overstorey species relative to the number of exotic species
Understorey composition
Change in the densities of understorey species functional groups
Change in no.s of indigenous understorey species relative to the number of exotic species
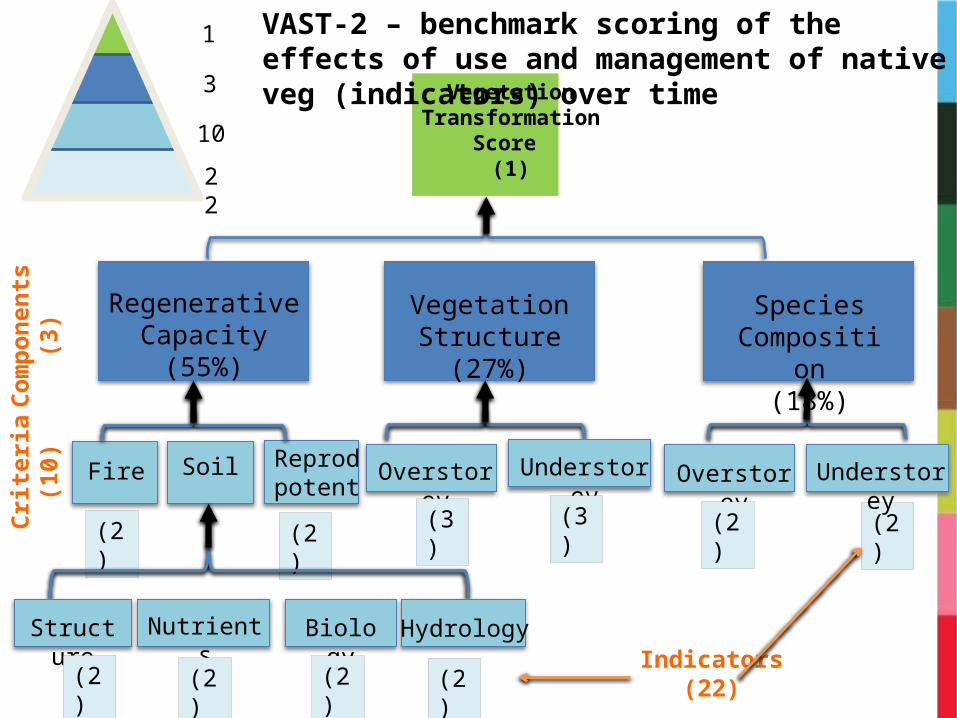
1
3
10
22
Com
pone
nts
(3)
VegetationTransformation
Score (1)
Crite
ria(1
0)
VegetationStructure
(27%)
Overstorey
(3)
Understorey
(3)
SpeciesComposition
(18%)
(2)
UnderstoreyOverstorey
(2)
RegenerativeCapacity
(55%)
Fire
(2)
Reprodpotent
(2)
Soil
Hydrology
(2)
Biology
(2)
Nutrients
(2)
Structure
(2)Indicators
(22)
VAST-2 – benchmark scoring of the effects of use and management of native veg (indicators) over time

Importance of dynamics
Assume rainfall is main driver of natural system dynamics• Period 1900 - 2015• Average seasonal rainfall (summer, autumn, …)• Rainfall anomaly is calculated above and below the mean• Two year running trend line fitted
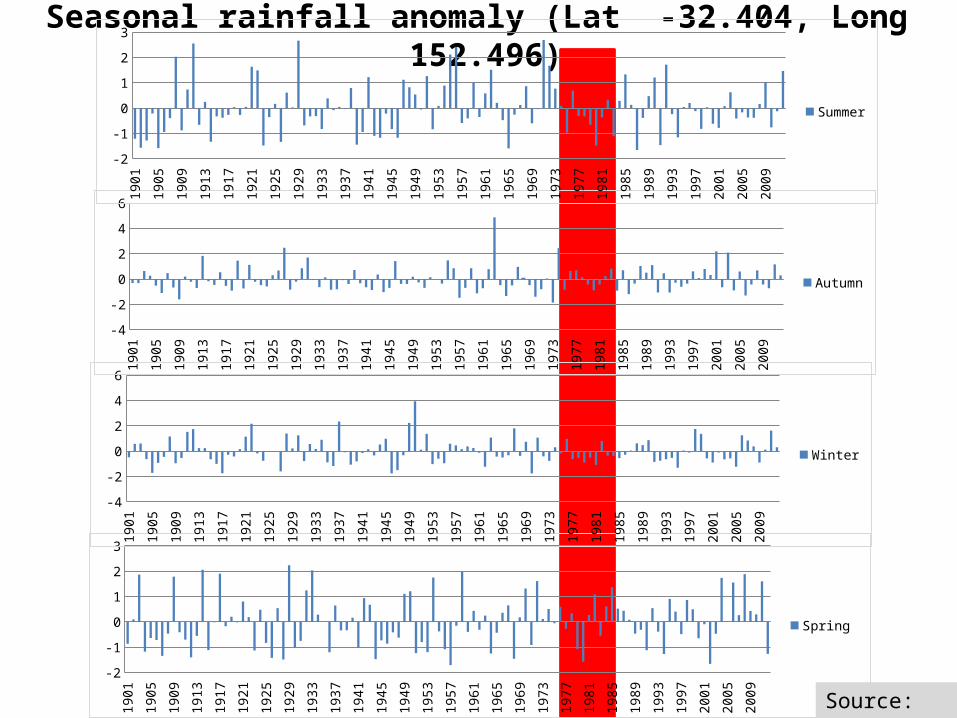
Seasonal rainfall anomaly (Lat -32.404, Long 152.496)
1901
1904
1907
1910
1913
1916
1919
1922
1925
1928
1931
1934
1937
1940
1943
1946
1949
1952
1955
1958
1961
1964
1967
1970
1973
1976
1979
1982
1985
1988
1991
1994
1997
2000
2003
2006
2009
2012
-2-1.5
-1-0.5
00.5
11.5
22.5
Spring
1901
1904
1907
1910
1913
1916
1919
1922
1925
1928
1931
1934
1937
1940
1943
1946
1949
1952
1955
1958
1961
1964
1967
1970
1973
1976
1979
1982
1985
1988
1991
1994
1997
2000
2003
2006
2009
2012
-3-2-1012345
Winter
1901
1904
1907
1910
1913
1916
1919
1922
1925
1928
1931
1934
1937
1940
1943
1946
1949
1952
1955
1958
1961
1964
1967
1970
1973
1976
1979
1982
1985
1988
1991
1994
1997
2000
2003
2006
2009
2012
-3-2-10123456
Autumn
1901
1904
1907
1910
1913
1916
1919
1922
1925
1928
1931
1934
1937
1940
1943
1946
1949
1952
1955
1958
1961
1964
1967
1970
1973
1976
1979
1982
1985
1988
1991
1994
1997
2000
2003
2006
2009
2012
-2-1.5
-1-0.5
00.5
11.5
22.5
3
Summer
Source: BOM

• Network of collaborators• Ecologists, land managers, academics, research scientists,
environmental historians
• Inputs• Reference state • Historical record of land use & Land management practices• Historical record of major natural events e.g. droughts, fires, floods,
cyclones, modelled average rainfall 1900-2015• Observed interactions e.g. rabbits, sheep and drought• Observations and quantitative measures of effects of LMP
• Include written, oral, artistic, photographic, long-term ecological monitoring sites and remote sensing
Resources needed for each site

Assumptions
Changes in LU & LMP – result in measurable and predictable changes in structure, floristics
& regen capacity – can be consistently and reliably differentiated from natural events– have or can be adequately and reliably documented over time
Sequential responses in veg structure, floristics & regen capacity can be discovered, unpacked and scored over time
Ratings and weightings are ecologically meaningful
Data – information – Decision making i.e. fit for purpose
Case studies VAST-2

Coastal Eucalypt Angophora open forest, Myall Lakes, NSW
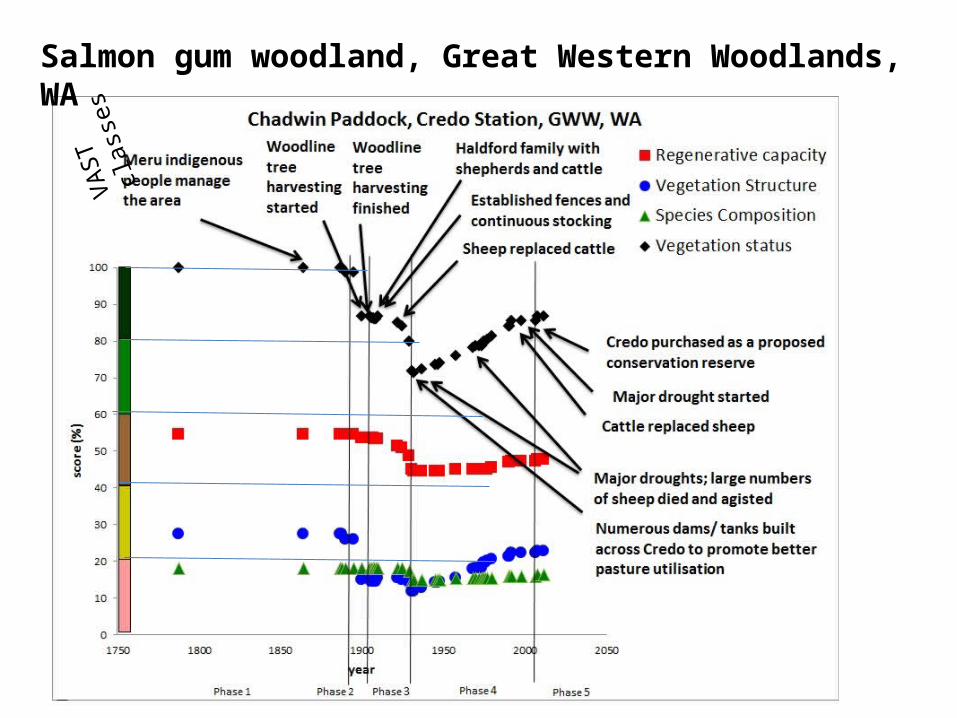
Phase 1 Phase 2
VAST
clas
ses
Salmon gum woodland, Great Western Woodlands, WA

Chenopod shrubland, Koonamore Station, SA
Phase 1 Phase 2 Phase 3

year
scor
e %
Pine – Hardwood Subtropical Rainforest, Phillip Island, Sth Pac
Pigs released
Uninhabited island
Pigs died out
Goats, rabbit and fowl released
Goats died out
Rabbits eradicated
Rabbit control
commenced
Commenced passive & active
restoration. Minimal ecological
monitoring
Phase 1 Phase 2 Phase 3 Phase 4
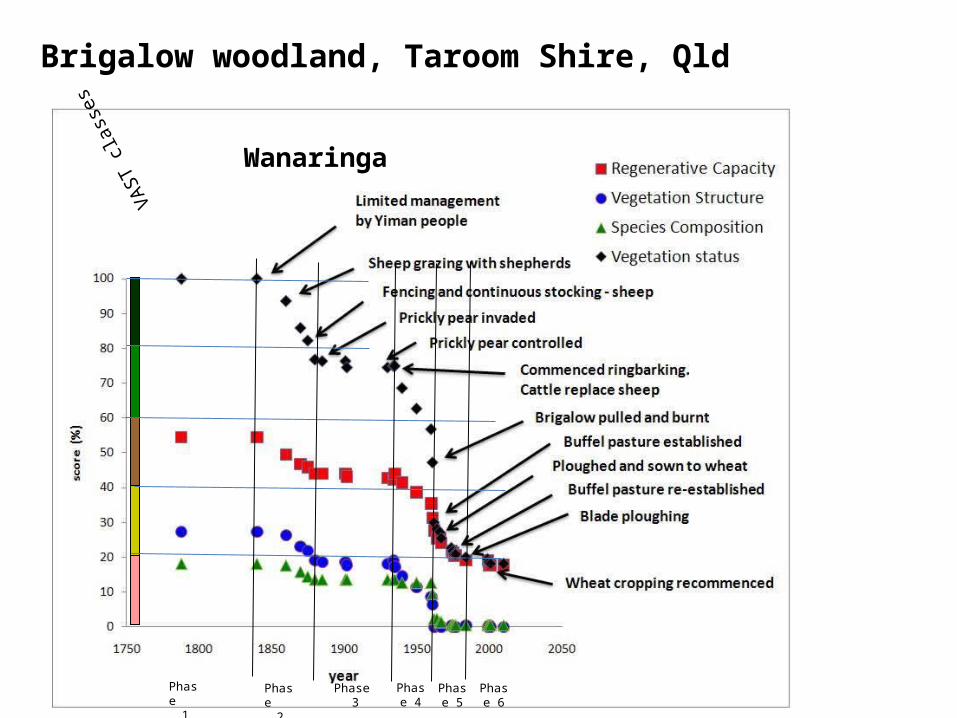
WanaringaVA
ST cl
asse
s
Brigalow woodland, Taroom Shire, Qld
Phase 1
Phase 2
Phase 3
Phase 4
Phase 5
Phase 6

Can the results and the system be used by decision makers
and land managers to influence future landscapes?

Tran
sfo
rmat
ion
sco
re
Years
1800
2012
Reference
Futures landscape - strategic regeneration, revegetation & restoration
Modified
Transformed
Replaced/ managed
Residual
Replaced/adventive
VAST Classes
1850 19501900 2000 2050 2100
Replaced/ removed
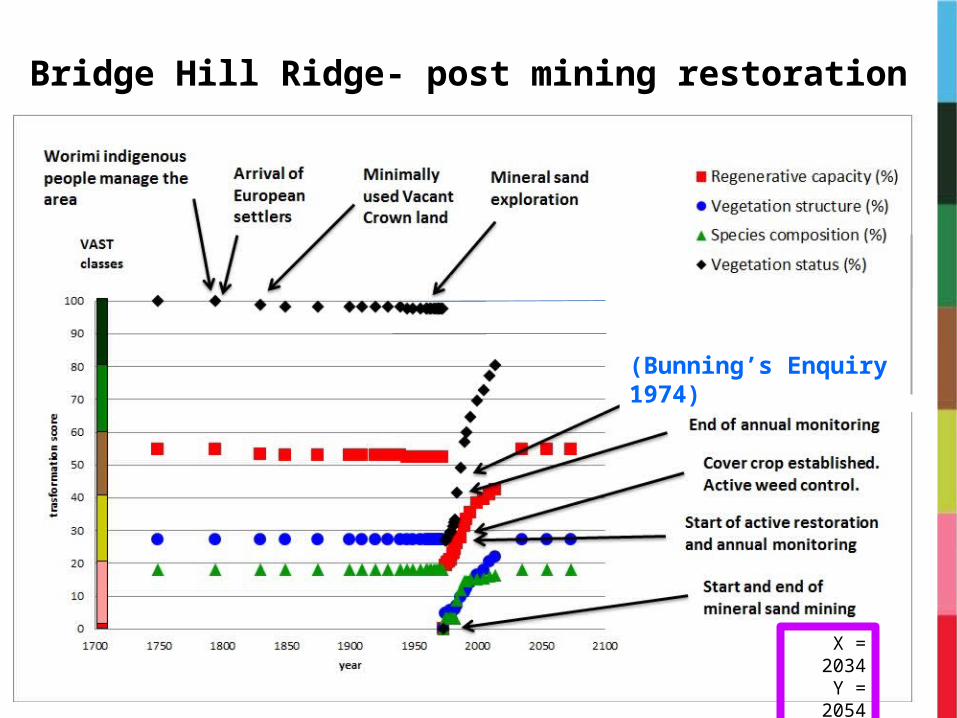
Predictions of mature forest (Bunning’s Enquiry 1974)
Bridge Hill Ridge- post mining restoration
X = 2034Y = 2054Z = 2074
X Y Z
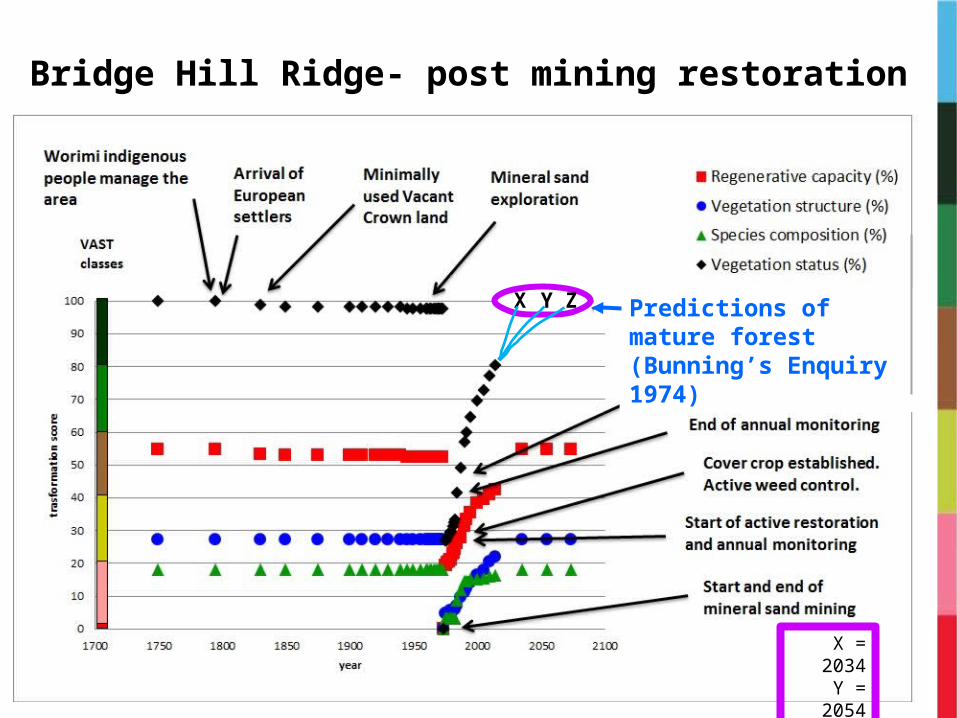
Predictions of mature forest (Bunning’s Enquiry 1974)
Bridge Hill Ridge- post mining restoration
X = 2034Y = 2054Z = 2074
X Y Z

Components (3)
Criteria(10)
Description of loss or gain relative to pre settlement indicator reference state (22)
Regenerative
capacity
Fire regime Change in the area /size of fire foot prints
Change in the number of fire starts
Soil hydrology Change in the soil surface water availability
Change in the ground water availability
Soil physical state
Change in the depth of the A horizon
Change in soil structure.
Soil nutrient state
Nutrient stress – rundown (deficiency) relative to soil fertility
Nutrient stress – excess (toxicity) relative to soil fertility
Soil biological state
Change in the recyclers responsible for maintaining soil porosity and nutrient recycling
Change in surface organic matter, soil crusts
Reproductive potential
Change in the reproductive potential of overstorey structuring species
Change in the reproductive potential of understorey structuring species
Vegetation structure
Overstorey structure
Change in the overstorey top height (mean) of the plant community
Change in the overstorey foliage projective cover (mean) of the plant community
Change in the overstorey structural diversity (i.e. a diversity of age classes) of the stand
Understorey structure
Change in the understorey top height (mean) of the plant community
Change in the understorey ground cover (mean) of the plant community
Change in the understorey structural diversity (i.e. a diversity of age classes) of the plant
Species Compositi
on
Overstorey composition
Change in the densities of overstorey species functional groups
Change in no.s of indigenous overstorey species relative to the number of exotic species
Understorey composition
Change in the densities of understorey species functional groups
Change in no.s of indigenous understorey species relative to the number of exotic species

Lessons site vs. landscape
1. Constrain assessments to soil landscape units because this approximates land manager’s interventions
2. Must account for natural dynamics e.g. flood, fire, cyclone3. Remote sensing is only part of the solution –
a) Some measures of remote sensing e.g. greenness of tree crowns may not be directly related to vegetation condition
4. Tracking outcomes of management interventions using remote sensing a) e.g. environmental plantings and environmental watering requires on-
ground collection of data to calibrate and validate spatial and multi-temporal imagery
b) Only populate criteria and indicators once imagery has been validated
Assessing condition of native vegetation over time
the bottom line• Develop a capacity to record and understand
– Land management practices– Resultant changes & trends in key veg /ecological attributes i.e.
• Structure, composition and function– Ecosystem dynamics – mainly seasonal patterns rainfall & temperature
• In short– Regularly tracking the effects management on key veg /ecological attributes
and their interactions with ecosystem dynamics • Providing a sound basis for demonstrating acceptable ecosystem operating
limits and for sharing learning that is based on adaptive management

Conclusions
• Land managers and ecologists contribute essential environmental data and information
• There are benefits in using a system to compile and synthesize diverse source and types of information (quantitative and qualitative)
• Monitoring site/landscape condition over time, contributes to learning and decision-making by land managers
• Systems thinking enables decision-makers to better understand ecosystem transformations: degradation, restoration and regeneration
• Telling the resilience story is of interest to the wider community
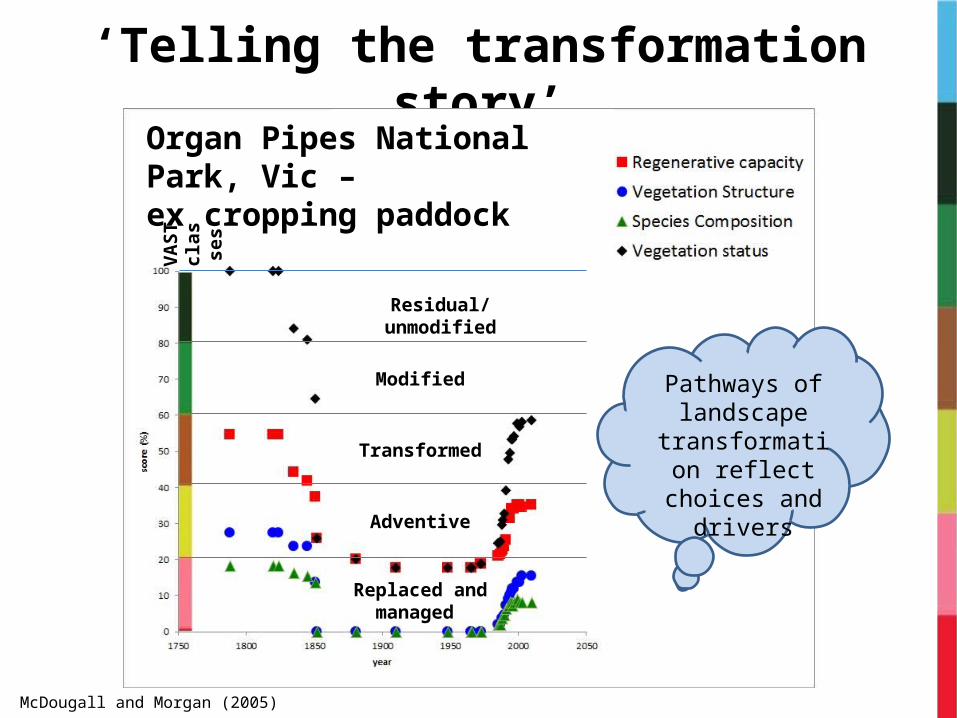
‘Telling the transformation story’
Residual/ unmodified
Modified
Transformed
Adventive
Replaced and managed
Organ Pipes National Park, Vic – ex cropping paddock
Pathways of landscape
transformation reflect choices
and drivers
VAST
cl
asse
s
McDougall and Morgan (2005)


More info & Acknowledgements
More informationhttp://www.vasttransformations.com/http://portal.tern.org.au/searchhttp://aceas-data.science.uq.edu.au/portal/
Acknowledgements• University of Queensland, Department of Geography Planning and
Environmental Management for ongoing research support• Many public and private land managers, land management agencies, consultants
and researchers have assisted in the development of VAST & VAST-2