all renewable power plants in one platform
TRANSCRIPT

ALL RENEWABLES IN ONE PLATFORM

CloudIndustries.eu all renewables in one platform solution
The CloudIndustries.eu platform allows to monitor energy production in real-time and automatically notifies operators and supervisors about unexpected events. It connects directly to renewable power plants controllers, inverters or data gateways and collects all possible data. CloudIndustries.eu enables integration with a wide range of industrial controllers, gateways, meters, sensors and I/O data sources.
Energy data visualization
Easy data aggregation
Profit calculation
Automated reporting
Alarm management
Personalized dashboard
What can be monitored?
The CloudIndustries.eu platform is designed to integrate data from different hardware systems (meters, sensors, controllers, etc.) and software formats, no matter what vendors you choose. Data can be received automatically through protocols from controllers, meters, data loggers, SCADA systems, production systems. The platform can be used as an interface between all system manufacturers, making the integration much more efficient. We already integrated the following devices:
List is constantly updated, so please contact us if you have other vendor’s equipment.
WWW.CLOUDINDUSTRIES.EU

How it works? The architecture of CloudIndustries.eu is designed to work 24/7 by clustering and balancing the server instances where it will run, as well as support for high availability data base deployments.
Integration CloudIndustries.eu monitoring solutions can also be connected to third party or customer-owned software or services in order to develop complex monitoring and automation. Scalable for application of any size. Our system architecture empowers our partners to design, build, deploy and maintain SCADA functionality in WEB-based applications. The data from controllers, meters, sensors and other equipment goes through gateways to our servers, and it is protected by VPN tunnel and firewalls. As we get data into servers, we create a user-friendly, smooth and easy to understand user interface.
WWW.CLOUDINDUSTRIES.EU
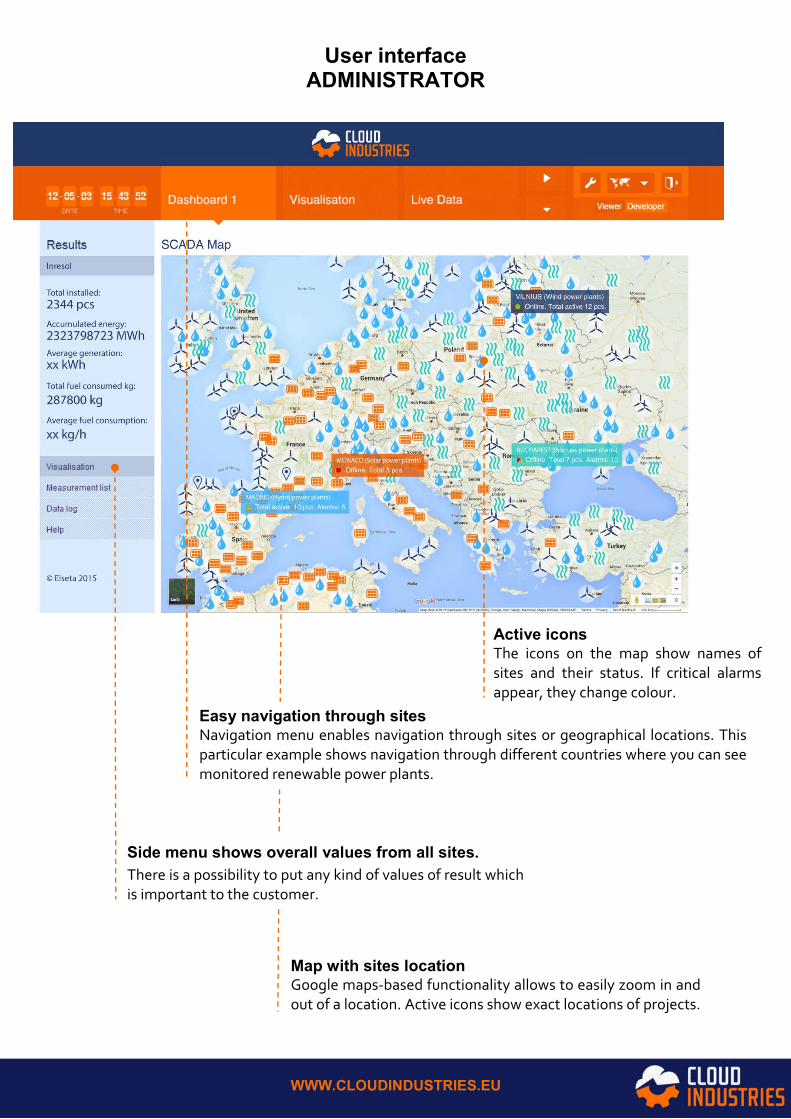
User interface ADMINISTRATOR
Side menu shows overall values from all sites.
There is a possibility to put any kind of values of result which is important to the customer.
Easy navigation through sites Navigation menu enables navigation through sites or geographical locations. This particular example shows navigation through different countries where you can see monitored renewable power plants.
Active icons The icons on the map show names of sites and their status. If critical alarms appear, they change colour.
Map with sites location Google maps-based functionality allows to easily zoom in and out of a location. Active icons show exact locations of projects.
WWW.CLOUDINDUSTRIES.EU

Detailed view of each power plant performance
WWW.CLOUDINDUSTRIES.EU
Administrator is allowed to go into each power plant statistics and see a detailed view of energy production. The dashboard contains such information as outside temperature, wind speed, sun activity, water flow speed, real time power generation, historical perspective of production, minimum and maximum values of temperature, etc. CloudIndustries.eu has a tool for dashboard customization.

Personalized view User interface can be personalized by user needs – grouped by type, size, location. Calculations can be made by year, month, day, production ability, etc.
WWW.CLOUDINDUSTRIES.EU
Overview of power plants Dashboard shows you grouped power plants by type. Each line gives you information about power plant current production and production of the day, month,
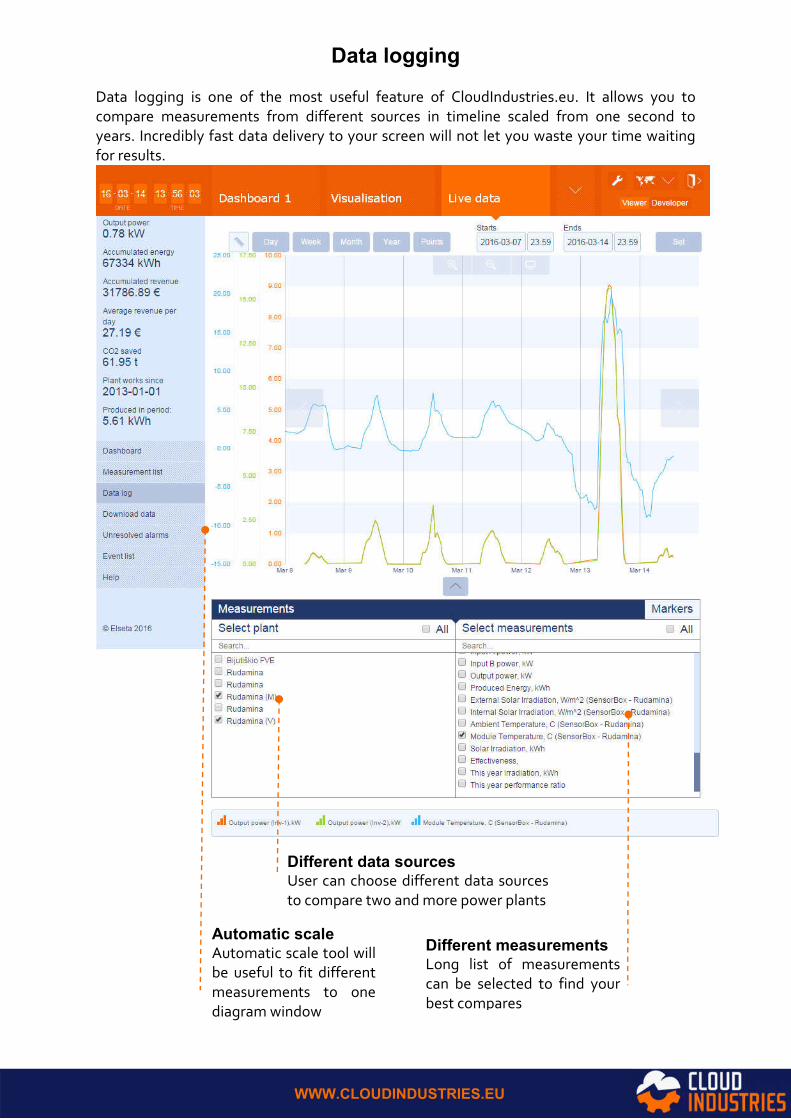
Data logging Data logging is one of the most useful feature of CloudIndustries.eu. It allows you to compare measurements from different sources in timeline scaled from one second to years. Incredibly fast data delivery to your screen will not let you waste your time waiting for results.
Different data sources User can choose different data sources to compare two and more power plants
Different measurements Long list of measurements can be selected to find your best compares
Automatic scale Automatic scale tool will be useful to fit different measurements to one diagram window
WWW.CLOUDINDUSTRIES.EU

Event list In order to maintain your power plant in best condition you must have all alarms in one place, check how frequent they appear, track time spent to solve problems, find out causes and nature of the incidents. CloudIndustries.eu will guarantee that all the alarms will reach you on time.
WWW.CLOUDINDUSTRIES.EU

LET’S CREATE INNOVATIONS TOGETHER!
Justina Bankauskaite +370 672 51 802
Evaldas Paliliunas +370 620 47648