allelomimetic synchronization in merino...
TRANSCRIPT

ANIMAL BEHAVIOUR, 2007, 74, 1443e1454doi:10.1016/j.anbehav.2007.02.020
Allelomimetic synchronization in Merino sheep
JACQUES GAUTRAIS* , PABLO MICHELENA* , ANGELA SIBBALD†, RICHARD BON* & JEAN-LOUIS DENEUBOURG‡
*Centre de Recherche sur la Cognition Animale, Universite Paul Sabatier
yMacaulay Institute, Craigiebuckler, Aberdeen
zEcologie Sociale et Systemes Complexes, Universite Libre de Bruxelles
(Received 19 June 2006; initial acceptance 19 September 2006;
final acceptance 9 February 2007; published online 1 October 2007; MS. number: 9002R)
Changes between the inactive (resting/ruminating) and active (grazing, walking) states in groups ofMerino sheep were studied in the field for different group sizes (two, four, six or eight) of either male orfemale animals over 6-h periods. The amount of synchrony within groups was high (60e80%) and isattributed to the mutual adjustment of behaviour by group members. To quantify this process, changesin the number of active individuals were fitted by a time homogeneous continuous time Markov chainmodel. We found that the probability of an individual becoming active increased with the number ofactive conspecifics in the group and decreased with the number of inactive conspecifics. The reverse effectwas found for the probability of becoming inactive. A model of this individual decision-making process isfitted to the data and predictions of the model are shown to account for the synchrony observed withinthe group. Group synchronization is thus presented as a self-organized dynamic system, where collectiveoscillations between activity and inactivity arise stochastically from the coupling between individualMarkov processes.
� 2007 The Association for the Study of Animal Behaviour. Published by Elsevier Ltd. All rights reserved.
Keywords: activity synchronization; allelomimetism; continuous time Markov chain; decision-making; Merino sheep;positive feedback; sheep; stochastic process; ungulate
Many studies of group-living animals focus on thefunctional benefits of finding food and sexual partners,or escaping predators (Krause & Ruxton 2002). However,there have been fewer experimental studies of howindividual decision making influences group dynamics(Fernandez-Juridic et al. 2006). In gregarious species, acti-vity synchrony between group members is generally con-sidered to be necessary for social cohesion, because themore discrepancy there is between the activities of indi-viduals, the more likely are the groups to split up (Engel& Lamprecht 1997; Conradt & Roper 2005; Focardi & Pec-chiol 2005). In the case of ruminants, individuals typicallyalternate between periods of activity (foraging) and inac-tivity (resting/rumination) and synchrony within groupshas been reported (Rook & Penning 1991a; Cote et al.
Correspondence: J. Gautrais, CRCA, UMR 5169, Universite Paul Sabat-ier, 118 route de Narbonne, F-31062 Toulouse cedex 04, France (email:[email protected]). A. Sibbald is at the Macaulay Institute, Craigiebuck-ler, Aberdeen AB15 8QH, U.K. J.-L. Deneubourg is at the Serviced’Ecologie Sociale, CP 231, ULB, Boulevard du Triomphe, 1050Brussels, Belgium 21.
140003e3472/07/$30.00/0 � 2007 The Association for the S
1997; Michelena et al. 2006), although the degree of syn-chrony can vary with group composition (Conradt 1998;Ruckstuhl & Neuhaus 2002).
How individual decisions to switch between activityand inactivity influence synchrony at the group level isa central issue in understanding group dynamics. Syn-chrony can be achieved by two main mechanisms. First,concurrent behaviours can result from individuals re-sponding to environmental cues (van Oort et al. 2005),for example the foraging synchrony that is commonlyseen at dusk and dawn (Dudzinsky & Arnold 1979; Mayes& Duncan 1986; Rook & Penning 1991a; but see Maier &White 1998). This mechanism can operate whether theanimals are able to see one another, although the synchr-ony is liable to be short lived (Bon et al. 2005), especially ifindividuals have different physiological needs (Conradt1998). Second, synchrony can be produced by social facil-itation (Clayton 1978), when individuals match their be-haviour to that of other animals in the group. Accordingto Clayton (1978), ‘. where environmental stimuli onlyprovide gross synchrony, socially facilitated behaviourwill provide finer-scale synchrony, and, what is function-ally important, greater cohesion of the social group’. In
43tudy of Animal Behaviour. Published by Elsevier Ltd. All rights reserved.
ANIMAL BEHAVIOUR, 74, 51444
some species one or two individuals in a group can act asleaders, for example chicks (Roden & Wechsler 1998),heifers (Dumont et al. 2005) and gorillas (Watts 2000;Conradt & Roper 2005). However, in many vertebrateswhich live in open-membership groups, synchrony ismore likely to result from imitation (Wechsler & Brodman1996; Rajaratnam & Redman 1999) through a processcalled allelomimetism (Scott 1956; Deneubourg & Goss1989), which embodies the case of equally shared, mutualsocial facilitation (Clayton 1978). Quantifying this processrequires detailed information about the behaviour of eachmember of the group over a significant period of time, dur-ing which the environmental conditions remain constant.Unfortunately, such data are still unattainable for wild un-gulates, because of the intense monitoring required, andthe difficulty of controlling environmental factors, suchas the patchiness of food resources or disturbance from bit-ing insects (Maier & White 1998; Palestis & Burger 1998).
In a previous paper (Michelena et al. 2006), we analyseddata from an experiment with male, female and mixed-sexgroups of Merino sheep grazing freely in small, homoge-nous grass plots. We tested a basic assumption of theactivity budget hypothesis (Conradt 1998), that sexual seg-regation can result from a lack of synchrony between thesexes. We showed that pairwise synchrony was indeedhigher between animals of the same sex than the oppositesex. Since synchrony between visually isolated groups wasno greater than would be expected by chance, there was noevidence that environmental cues were involved. We con-cluded, therefore, that the activity synchrony observedwithin the various groups arose from allelomimetism.
The data set used by Michelena et al. (2006) comprisessequences of activity and inactivity bouts, and their dura-tions, for all individuals in each of the groups. In thispaper we have focused on the data for single-sex groupsand quantified group dynamics for each sex and groupsize. Assuming all group members to be the same, we thenderived mean behaviour at the individual level. Finally,we present an individual-based model of the system whichaccounts for the group becoming synchronized.
METHODS
Study Area, Animals and Experimental Set-up
The study took place at the experimental farm ofDomaine du Merle (5.74�E and 48.50�N) in the south ofFrance. Data were collected from November 2003 toFebruary 2004. Thirty four Arles Merino horned malesand 32 adult oestrous-blocked females, randomly selectedfrom a herd of 66 male and 200 female sheep, were used. Allsubjects were familiarized with each other in a 1-ha pasturefor 5 weeks before the beginning of the experiments.
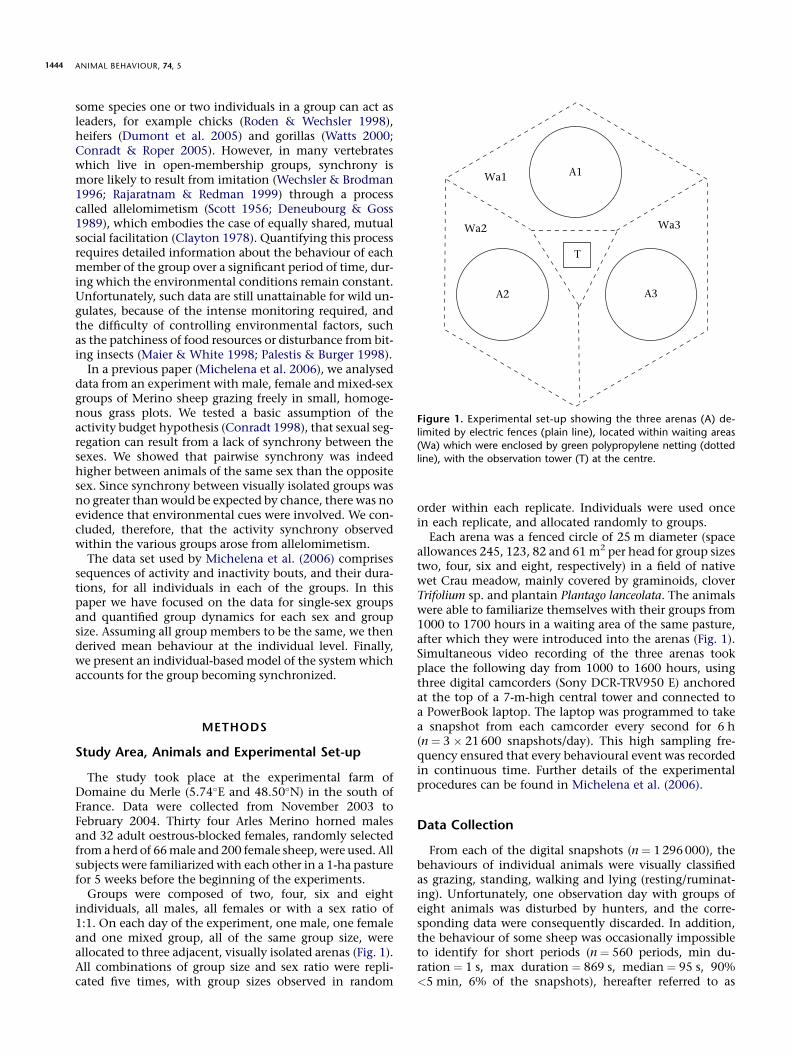
Groups were composed of two, four, six and eightindividuals, all males, all females or with a sex ratio of1:1. On each day of the experiment, one male, one femaleand one mixed group, all of the same group size, wereallocated to three adjacent, visually isolated arenas (Fig. 1).All combinations of group size and sex ratio were repli-cated five times, with group sizes observed in random
order within each replicate. Individuals were used oncein each replicate, and allocated randomly to groups.
Each arena was a fenced circle of 25 m diameter (spaceallowances 245, 123, 82 and 61 m2 per head for group sizestwo, four, six and eight, respectively) in a field of nativewet Crau meadow, mainly covered by graminoids, cloverTrifolium sp. and plantain Plantago lanceolata. The animalswere able to familiarize themselves with their groups from1000 to 1700 hours in a waiting area of the same pasture,after which they were introduced into the arenas (Fig. 1).Simultaneous video recording of the three arenas tookplace the following day from 1000 to 1600 hours, usingthree digital camcorders (Sony DCR-TRV950 E) anchoredat the top of a 7-m-high central tower and connected toa PowerBook laptop. The laptop was programmed to takea snapshot from each camcorder every second for 6 h(n ¼ 3 � 21 600 snapshots/day). This high sampling fre-quency ensured that every behavioural event was recordedin continuous time. Further details of the experimentalprocedures can be found in Michelena et al. (2006).
Data Collection
From each of the digital snapshots (n ¼ 1 296 000), thebehaviours of individual animals were visually classifiedas grazing, standing, walking and lying (resting/ruminat-ing). Unfortunately, one observation day with groups ofeight animals was disturbed by hunters, and the corre-sponding data were consequently discarded. In addition,the behaviour of some sheep was occasionally impossibleto identify for short periods (n ¼ 560 periods, min du-ration ¼ 1 s, max duration ¼ 869 s, median ¼ 95 s, 90%<5 min, 6% of the snapshots), hereafter referred to as
T
Wa2
Wa1
Wa3
A1
A2 A3
Figure 1. Experimental set-up showing the three arenas (A) de-
limited by electric fences (plain line), located within waiting areas
(Wa) which were enclosed by green polypropylene netting (dottedline), with the observation tower (T) at the centre.

GAUTRAIS ET AL.: ALLELOMIMETIC SYNCHRONIZATION 1445
censored time. Only the data for the single-sex groupswere used in the analysis.
Variables of the Dynamics
Focusing on behaviour at the individual level, activitieswere described for each animal using a binary state (activeversus inactive), as in previous studies (Cote et al. 1997;Ruckstuhl 1999; Sibbald et al. 2000). The active state com-prised grazing, standing and walking. The inactive statecomprised only lying (resting/ruminating). At any time,the individual can switch states with a given probability.This probability is expressed as a probability per unittime, that is a switch rate (in /s) that can vary with time.The individual activation rate (the rate at which the indi-vidual switches from the inactive to the active state, de-noted by l) is distinguished from the individualinactivation rate (the rate at which the individual switchesfrom the active to the inactive state, denoted by m). Theevolution of individual state is a stochastic process.
At the group level, the collective state S(t) can be de-scribed at time t by the number A of individuals whichare active at that time (for a given group size N, the num-ber I of inactive individuals is always N � A). Hence, thecollective state S(t) can have N þ 1 values (0 � A � N ).Group members were said to be in concurrent stateswhen all individuals were in the same state (either all ac-tive, A ¼ N, or all inactive, I ¼ N, i.e. A ¼ 0). We havequantified synchrony using a simple concurrence index(CI), equal to the proportion of observed time for whichthe group members were in concurrent states.
Since each observation period started at an arbitrarytime (1000 hours), the initial condition S(0) could havetaken any value of A. S(t) then evolved by �1 unit eachtime an individual switched states, as a result of stochasticindividual processes. S(t) can change at any time witha given probability, expressed as a probability per unittime, that is a collective change rate (in /s). The collectiveactivation rate (the rate at which one member becomes ac-tive, denoted by L) is distinguished from the collective in-activation rate (the rate at which one member becomesinactive, denoted by M ).
Hypothesis on the Dynamics
To investigate the effect of mutual facilitation, wequantified how the collective change rates L and M weremodulated by the current numbers of conspecifics active(A) and inactive (I ). We first checked that these rates de-pended only on A and I, namely that (1) they were nottime dependent as long as A and I remained unchanged(a Markov property) and (2) their dependence on A andI was the same throughout the whole observation time(a time homogeneity property). In such a case, the evolu-tion of S(t) forms a time homogeneous continuous timeMarkov chain (CTMC) and the collective change ratesfully describe the dynamics (see Appendix). Accordingly,they are hereafter denoted by L(A,I ) and M(A,I ).
For a given group size (e.g. N ¼ 4), the process can be de-picted as follows:
ðA; IÞ ¼ ð0;4Þ /Lð0;4Þ
)Mð1;3Þ
ð1;3Þ /Lð1;3Þ
)Mð2;2Þ
ð2;2Þ
/Lð2;2Þ
)Mð3;1Þ
ð3;1Þ /Lð3;1Þ
)Mð4;0Þ
ð4;0Þ
Note that each group size (N ) yields N collective activa-tion rates and N inactivation rates (2N collective changerates).
Quantification of the Dynamics
We quantified the dynamics, at the collective level,separately for each sex. For each group size N, the 2N col-lective change rates L(A,I ) and M(A,I ) were estimatedfrom the observed evolution of S(t) over the full observa-tion time T (6 h). Overall, we thus obtained (2 þ 4 þ6 þ 8) ¼ 20 collective activation rates for each sex, corre-sponding to 20 distinct couples (A,I ), and therefore 20inactivation rates.
Assuming interchangeable individuals, we then derivedthe mean behaviour at the individual level. The 40 meanindividual switch rates l(A,I ) and m(A,I ) were derived fromL(A,I ) and M(A,I ), after correction for the number of indi-viduals available to make the switch. The activation ratel(A,I ) is corrected for the number of inactive individualsI ¼ N � A:
lðA; IÞ ¼LðA; IÞI
:
Correspondingly, the inactivation rate is corrected forthe number of active individuals A:
mðA; IÞ ¼MðA; IÞA
:
Since l(0,N ) is the rate for an individual becomingactive when no other animal is already active, it will betermed the spontaneous activation rate and, similarly,m(N,0) will be termed the spontaneous inactivation rate.
Finally, we fitted for each sex the 40 mean individualswitch rates (combining group sizes) to an analyticalexpression which accounts for spontaneous switch ratesand both the inhibitory and the stimulating effects ofconspecifics, for any group size N:
lðA; IÞ ¼ l0bI�1ð1þ alAÞ
mðA; IÞ ¼ m1bA�1ð1þ amIÞ
The rationale for this expression is developed in theResults section. Since this expression specifies theswitch rates for an individual in a group as a functionof the states of the other members of the group, itembodies an individual-based model of the synchroni-zation process.
Statistical Procedures
Collective change ratesCollective change rates L(A,I ) and M(A,I ) were esti-
mated from S(t), using the package msm (Jackson et al.

ANIMAL BEHAVIOUR, 74, 51446
2003) and the statistical software R (R Development CoreTeam 2005). This package fits any CTMC by maximum-likelihood estimates of the change rates (details in Jackson2005). The procedure handles the presence of censoredtimes, that is when the behaviour of animals was un-known. The five replications were treated as different sub-jects. Note that this estimation procedure requires theMarkov property and the time homogeneity property.
Markov propertyTo check the Markov property, we considered each
collective state (A,I ) separately. For a given collective state(A,I ), a sojourn time is the duration between the time atwhich the group entered the state and the time the groupleft it, whether this change was due to an activation(A þ 1, I � 1) or an inactivation (A � 1, I þ 1). Under theMarkov property, the sample of all the sojourn times in(A,I ) would fit an exponential distribution, indicatinga constant probability per unit time to leave (A,I ). Weused a KolmogoroveSmirnov test (Haccou & Meelis1992) on 24 sets of sojourn times for each sex, since thereare (N þ 1) possible (A,I ) couples per group size N (two,four, six and eight). To test globally for the Markov prop-erty from this multiple test, a Holm correction was used toadjust the 24 P values (Holm 1979). The Holm correctionis the Bonferroni correction modified to be valid under ar-bitrary assumptions. Bonferroni corrections yielded thesame results.
Time homogeneityTo check for time homogeneity, we tested the effect of
time elapsed since the beginning of the observationperiod (max time 6 h) on the sojourn times. We used anF test on the slope of the regression of the log-transformedsojourn times plotted against their starting times (Haccou& Meelis 1992). The Holm correction was applied sepa-rately for males and females, and also with all cases com-bined, to test for global time homogeneity.
Testing group synchronyThe proportion of time for which the group members
were in concurrent states (CI) could have included periodsof chance synchrony. Chance synchrony depends on themean proportion of time that individuals spend active(Pa). Under the null hypothesis of independent behav-iours, the probability density function of S(t) would followa binomial distribution of the parameter Pa, with thenumber of degrees of freedom equal to the group size(N ). Hence, the probability of finding all individuals inconcurrent states would be
CInull ¼ PrfN activegþ Prf0 activeg ¼ PaN þ ð1� PaÞN :
Experimental values of CI were accordingly comparedwith the value of CInull computed for a similar Pa.
Model Validation
We first validated the use of a CTMC model for thequantification of collective change rates. We then validated
the individual-based model by comparing the synchrony itpredicted against the synchrony observed in the field.
The collective change rates describe the instantaneousprobability per unit time that S(t) changes at time t. Theactual evolution of S(t) over the observation period Tcan be summarized as the proportions of time
QTðAÞ,
0 � A � N, that the group spent in each of the possiblecollective states A. Note that CI ¼ Q
Tð0Þ þQ
TðNÞ andis a convenient way to approximate
QTðAÞ, 0 � A � N.
For an infinite observed time T, the collective changerates L(A,I ) and M(A,I ) fully determine
QT ðAÞ, i.e.Q
TðAÞ /T/N
Q*ðAÞ, whereQ*ðAÞ is the stationary distribu-
tion (see Appendix). For a finite observed time T,Q
T ðAÞcan also be predicted from the collective change rates,but taking into account the initial state. To test the rele-vance of using a CTMC model, we thus compared the dis-tributions of time spent in each collective state computedfrom the experimental data
QT ðAÞ with
QTðAÞ and
Q*ðAÞ.QTðAÞ was computed by numerical integration, with the
procedure totlos provided by the package msm, usingthe estimated collective change rates, the observed finitetime T and the initial state (A ¼ 0, N ).
Q*ðAÞ was derivedanalytically (see Appendix).
To compare the amount of synchrony predicted bythe individual-based model with the amount of synchronyobserved experimentally, we built a statistical test to test thehypothesis that the experimental values of the CI could beaccounted for by the model. The mean and 95% confidenceinterval of CI under the model hypothesis were estimatedusing 10 000 Monte-Carlo simulations for each combina-tion of group size and sex, starting with a random numberof active individuals. We concluded to a good agreement ofthe model with the data when the experimental values of CIfell within the 95% confidence interval. Simulations wereperformed in continuous time (not using time steps) usinga dedicated R program.
RESULTS
Activity Synchrony
The mean proportion of time that sheep spent active (Pa)ranged from 60% to 80% over all groups. The animals werein concurrent states most of the time and the time neededby the whole group to shift from concurrent activity toconcurrent inactivity (or back) tended to be short (Fig. 2).CIs were higher than those predicted by the null hypothesisof independent behaviours, although they decreasedslightly as group size increased (Fig. 3). CIs tended to de-crease less with group size in males than in females, whichis consistent with the higher pairwise index of synchronyfor males reported by Michelena et al. (2006).
Time Homogeneity and Markovian Property
The hypothesis of time homogeneity of sojourn timeswas rejected in eight cases out of 48 (four in males andfour in females). After the Holm correction, only onecase appeared to be time sensitive, namely when femalesin groups of eight were all active (adjusted-P ¼ 0.016)(see Fig. 2). The hypothesis that sojourn times had

GAUTRAIS ET AL.: ALLELOMIMETIC SYNCHRONIZATION 1447
(a)
2 M
(g)
6 F
(h)
8 F
(d)
8 M
(f)
4 F
(e)
2 F2
1
0
2
1
00 10 000 20 000
4
3
2
1
0
6
4
2
0
8
4
6
2
0
8
4
6
2
0
0 10 000 20 000
Nu
mbe
r of
act
ive
shee
p
(b)
4 M
(c)
6 M
0
4
3
2
1
0
6
4
2
0
10 000 20 000
0 10 000 20 000 0 10 000 20 000
0 10 000
Time (s)
20 0000 10 000Time (s)
20 000
0 10 000 20 000
Figure 2. Examples of the number of active individuals ( y-axis) in groups of two, four, six or eight male (M; aed) or female (F; eeh) sheep,
plotted at 1-s intervals (x-axis). Dotted lines indicate periods during which behaviour could not be identified.
Markovian properties was rejected in 12 cases in maleand eight in female groups. After the Holm correction,however, only four cases in males (N ¼ 4, A ¼ 1,c2
51 ¼ 0:42; N ¼ 4, A ¼ 3, c243 ¼ 0:32; N ¼ 6, A ¼ 0, c2
27 ¼0:44; N ¼ 6, A ¼ 5, c2
50 ¼ 0:33, adj-P < 0.01 in all cases)and one case in females (N ¼ 6, A ¼ 5, c2
31 ¼ 0:35, adj-P ¼ 0.02) appeared skewed towards shorter sojourn times,as evident from the negative values returned by theBarlow test applied to each (Haccou & Meelis 1992).
Collective Change Rates
The collective change rates L(A,I ) and M(A,I ) wereestimated by CTMC analysis for each combination ofgroup size and sex. To test for the robustness of theseestimates, the distributions
QTðAÞ of the relative time spent
by the groups in each collective state A (0, 1, 2, ., N activesheep) were then compared with the distributions
QT ðAÞ
andQ*ðAÞ predicted by the collective change rates
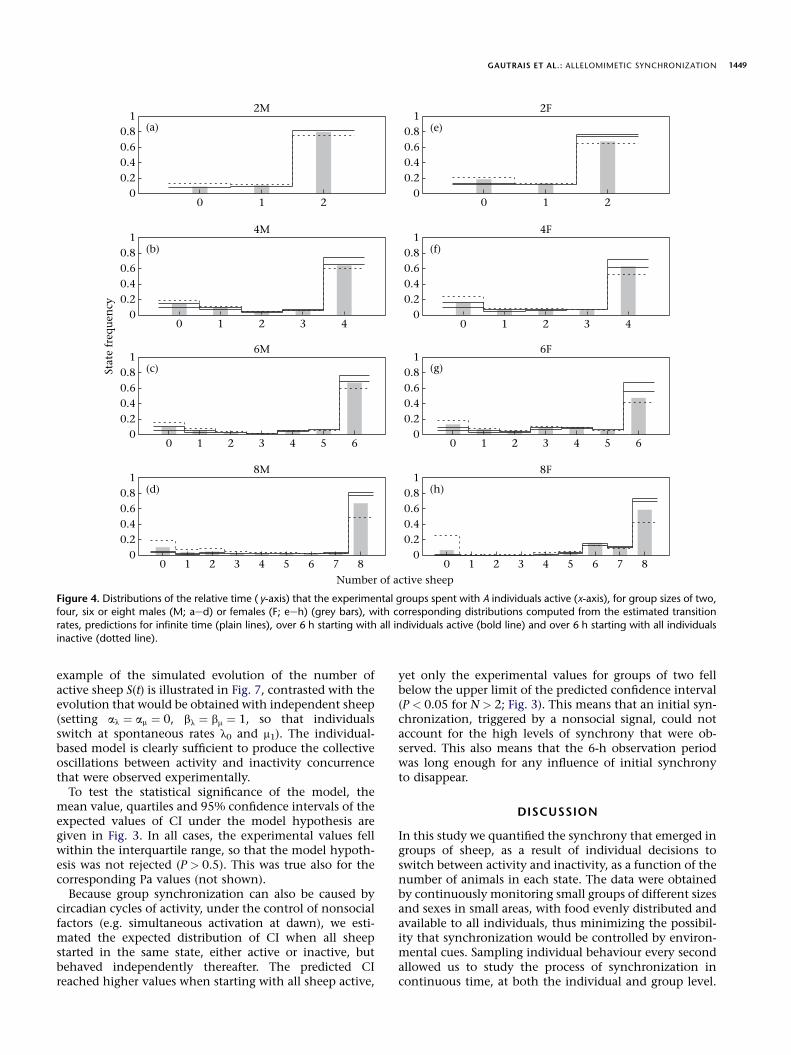
(Fig. 4). A good agreement was found between the experi-mental values and the stationary distribution, especiallyin males. The fitted model tends, however, to predictslightly too much time with the animals all active
(A ¼ N ) and correspondingly too little time with the ani-mals all inactive (A ¼ 0), especially in female and largergroups. Taking into account the finite time of observation,however, the two predicted distributions
QT ðAÞ starting
with all sheep active or inactive can be regarded as thelimits of a confidence interval around the stationary distri-bution
Q*ðAÞ. Figure 4 shows that the observed values forall combinations of group size and sex fall within the con-fidence limits, confirming the good agreement betweenpredicted and experimental data. Consequently, estimatesof mean individual switch rates l(A,I ) and m(A,I ) could beconfidently derived from corresponding estimates ofL(A,I ) and M(A,I ).
Individual Switch Rates
The individual activation rate l(A,I ) increased sharplyas the number of sheep already active increased (Fig. 5),a clear indication of imitation. For example, in groups ofeight males, the activation rate for the last individual be-coming active was about 20 times higher than that ofthe first one. Inactivation rates m(A,I ) increased by thesame order of magnitude in relation to the number of

ANIMAL BEHAVIOUR, 74, 51448
conspecifics already inactive (Fig. 5). These effects ap-peared weaker in females than in males. In addition, wefound that for a given number of individuals to imitate(i.e. already in the opposite state), switch rates decreasedas group size increased. For example, the second individ-ual becoming active has a lower probability of doing soin groups of two than in groups of eight. This was truein particular for spontaneous switch rates l(0,N ) andm(N,0) (Fig. 6), where there were no conspecifics to imi-tate. Overall, this means that activation rates were en-hanced by the number of individuals already active andinhibited by the number of individuals still inactive,with the reverse true for inactivation rates.
Individual-based Model
This experimental quantification yielded for each sexa set of 40 mean individual switch rates l(A,I ) and m(A,I ),each of which depends on the group size and combinesboth the enhancing and inhibiting effects mentionedabove. To disentangle these two effects, we fitted an ana-lytical expression which accounts separately for each ofthem, and is valid whatever the group size. As it involvesonly the number of active and inactive conspecifics whichmodulate a basic spontaneous switch rate, this expressionconstitutes an individual-based rationale for the decision-making process.
First, the inhibitory effect was fitted from the sponta-neous rates (for which the stimulating effect does notoperate). Assuming that spontaneous switches are in-hibited to the same extent by all visible conspecifics in
1
0.8
0.6
0.4
0.2
02
Group size
FemalesMales
6 8 2 44 6 8
Con
curr
ence
in
dex
CI
Figure 3. Experimental CI for groups of two, four, six or eight male
or female sheep (C: mean � SE), expected CI under the hypothesis
of independent behaviours using estimated values for spontaneousswitch rates (,: mean) or with all individuals initially active (-: up-
per limit of the 95% confidence interval), and expected CI over a 6-h
period under the individual-based model hypothesis (black lines:
mean values, blue lines: first and third quartiles, red lines: 95% con-fidence interval).
the same state (N � 1), we considered a simple inhibitoryproportional hazard model:
lð0;NÞ ¼ l0bN�1
mðN;0Þ ¼ m1bN�1 where b < 1:
l0 ¼ l(0,1) and m1 ¼ m(1,0) extrapolate spontaneousswitch rates to the case of an animal in a group but behav-ing independently.
To estimate b, we regressed each of the four data sets oflog-transformed spontaneous rates l(0,N ) and m(N,0), foractivation and inactivation in males and females, againstgroup size N. The slopes were all close to 0.8, with largelyoverlapping confidence intervals (males, activation: 0.75e0.93, inactivation: 0.67e0.89; females, activation: 0.60e0.92, inactivation: 0.78e0.85). The closeness of the fourvalues, obtained independently, shows the relevance ofthis simple model. Consequently, for the sake of simplic-ity, we set b ¼ 0.8 in all cases (fit shown in Fig. 6). The in-tercepts of the four regressions were
Males l0 ¼ 9:43� 10�4=s m1 ¼ 1:77� 10�4=sFemales l0 ¼ 4:88� 10�4=s m1 ¼ 1:23� 10�4=s:
Once the spontaneous switch rates and the inhibitoryeffect of conspecifics in the same state had been estab-lished, the stimulating effect of conspecifics in the otherstate could be fitted, assuming a simple linear function oftheir number:
lðA; IÞ ¼ l0bI�1ð1þ alAÞmðA; IÞ ¼ m1bA�1ð1þ amIÞ where al;am > 0:
The two values al and am were estimated for each sex bylinearly regressing lðA; IÞ=l0bI�1 � 1 against A (and corre-spondingly m(A,I ) against I ), with the intercept forced to0, and heteroscedasticity corrected by weighting by the in-verse of the confidence interval for l(A,I ) (and corre-spondingly m(A,I )). We obtained
Males al ¼ 0:49 am ¼ 3:42Females al ¼ 0:33 am ¼ 1:83
The normality of the residuals was verified by Shapirotests, testing the four data sets (al and am for males and fe-males) both separately and together (all P > 0.4).
Finally, to evaluate the overall error introduced by thistwo-step regression, we compared the rates computedfrom the fitted analytical expression with the experimen-tal ones, combining all group sizes and sexes. The modelfitted the experimental switch rates fairly well (Fig. 5, lin-ear regression of analytical values against observed valueswith zero intercept: slope ¼ 1.02 � 0.01, R2 ¼ 0.99, log-transformed values).
Model Validation
This individual-based model was validated by a quanti-tative comparison between the predicted values of the CIand the experimental values.
The predicted values of CI were computed from Monte-Carlo simulations reproducing the experimental condi-tions (group size, sex, and observed time). A typical
GAUTRAIS ET AL.: ALLELOMIMETIC SYNCHRONIZATION 1449
(a)1
0.80.60.40.2
0
10.80.60.40.2
0
10.80.60.40.2
0
10.80.60.40.2
0
0 1 2 0 1 2
0 1 2 3 4
Number of active sheep
0 1 2 3 4 5 6
2M
(e)
2F
(f)
4F
Stat
e fr
equ
ency
10.80.60.40.2
0
10.80.60.40.2
0
0 1 2 3 4
0 1 2 3 4 5 6
(b)
4M
(c)
6M
10.80.60.40.2
0
10.80.60.40.2
00 1 2 3 4 5 6 7 8 0 1 2 3 4 5 6 7 8
(d)
8M
(h)
8F
(g)
6F
Figure 4. Distributions of the relative time ( y-axis) that the experimental groups spent with A individuals active (x-axis), for group sizes of two,four, six or eight males (M; aed) or females (F; eeh) (grey bars), with corresponding distributions computed from the estimated transition
rates, predictions for infinite time (plain lines), over 6 h starting with all individuals active (bold line) and over 6 h starting with all individuals
inactive (dotted line).
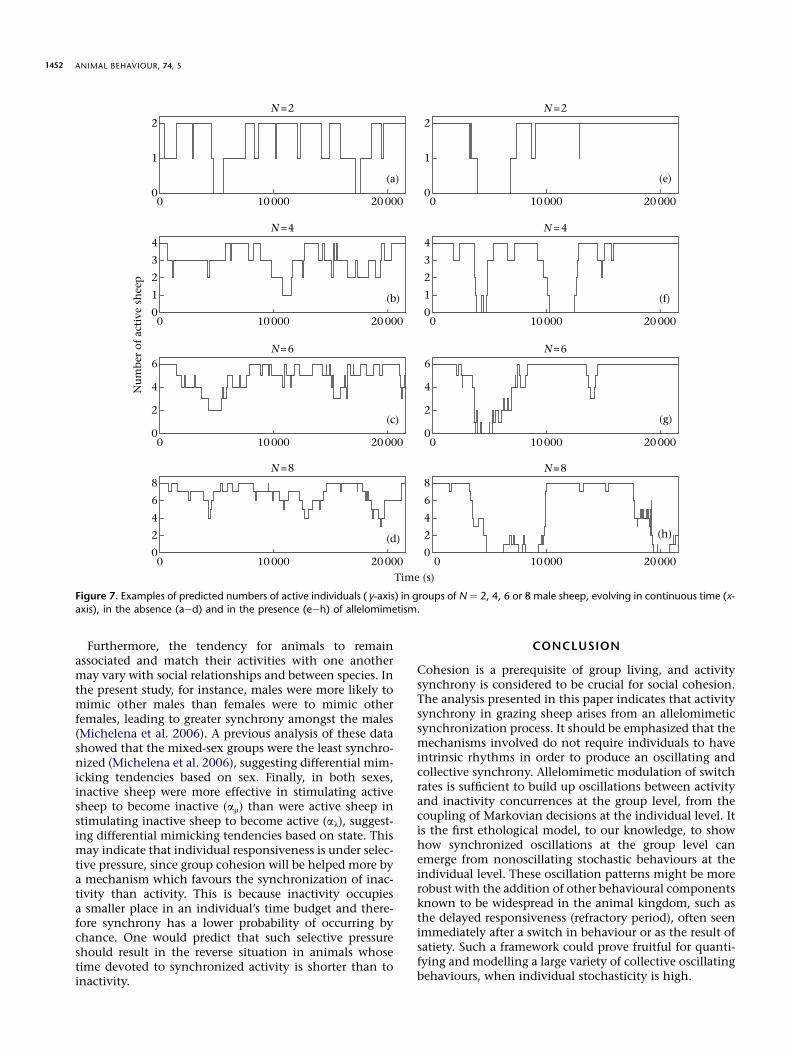
example of the simulated evolution of the number ofactive sheep S(t) is illustrated in Fig. 7, contrasted with theevolution that would be obtained with independent sheep(setting al ¼ am ¼ 0, bl ¼ bm ¼ 1, so that individualsswitch at spontaneous rates l0 and m1). The individual-based model is clearly sufficient to produce the collectiveoscillations between activity and inactivity concurrencethat were observed experimentally.
To test the statistical significance of the model, themean value, quartiles and 95% confidence intervals of theexpected values of CI under the model hypothesis aregiven in Fig. 3. In all cases, the experimental values fellwithin the interquartile range, so that the model hypoth-esis was not rejected (P > 0.5). This was true also for thecorresponding Pa values (not shown).
Because group synchronization can also be caused bycircadian cycles of activity, under the control of nonsocialfactors (e.g. simultaneous activation at dawn), we esti-mated the expected distribution of CI when all sheepstarted in the same state, either active or inactive, butbehaved independently thereafter. The predicted CIreached higher values when starting with all sheep active,
yet only the experimental values for groups of two fellbelow the upper limit of the predicted confidence interval(P < 0.05 for N > 2; Fig. 3). This means that an initial syn-chronization, triggered by a nonsocial signal, could notaccount for the high levels of synchrony that were ob-served. This also means that the 6-h observation periodwas long enough for any influence of initial synchronyto disappear.
DISCUSSION
In this study we quantified the synchrony that emerged ingroups of sheep, as a result of individual decisions toswitch between activity and inactivity, as a function of thenumber of animals in each state. The data were obtainedby continuously monitoring small groups of different sizesand sexes in small areas, with food evenly distributed andavailable to all individuals, thus minimizing the possibil-ity that synchronization would be controlled by environ-mental cues. Sampling individual behaviour every secondallowed us to study the process of synchronization incontinuous time, at both the individual and group level.

ANIMAL BEHAVIOUR, 74, 51450
Number of sheep to mimic
Swit
ch r
ates
(10
–3 s
–1)
A A A A
I I I I I I I I
A A A A
0
2
4
6
8
10(d)(b)
μ(A
,I)
0
2
4
6
8
10(c)(a)
N=4 N=6
N=8
N=2
λ(A
,I)
0
2
4
6
8
10
λ(A
,I)
0
2
4
6
8
10
μ(A
,I)
Figure 5. Mean individual activation rates l(A,I ) in (a) males and (c) females and inactivation rates m(A,I ) in (b) males and (d) females, as a func-
tion of (a, c) the number of conspecifics in the active state (A ¼ 0.N � 1), or (b, d) in the inactive state (I ¼ 0.N � 1), for group sizes N ¼ 2,
4, 6 and 8 (presented side by side, with number of conspecifics increasing from left to right). Red lines denote 95% confidence intervals. Black
lines correspond to the fitted model (see Results: Individual-based model).
The process of switching between activity and inactivityappeared to be intrinsically stochastic. We focused on thesynchrony of behavioural states (active and inactive)rather than events, such as interacting or vigilance head-up, described as phasic activities by Rook & Penning(1991a), since social cohesion relies more on individualsbeing active and inactive at the same time, than on syn-chronizing their phasic activities. This justified usinga CTMC framework for quantifying individual switchrates, whereas synchronization of events would have re-quired other tools, such as a Phase Response Curve, for ex-ample Ramirez-Avila et al. (2003) for the synchronizationof pulse-like flashings among fireflies and Cole (1991a, b)for short-term activity cycles in ants. This also justifiedadopting the CI for quantifying synchrony. The CI isnot corrected for chance synchronization, but this is
appropriate since social cohesion will depend on all theoccasions that synchrony occurs within the group,whether they are due to chance or not.
Synchronization Process
Obviously, individual animals will switch betweenactivity and inactivity in the absence of conspecifics,and, in the absence of external influences, the rate ofswitching must be governed by physiological factors suchas energy requirements and time taken to process foodwithin the gut. The so-called spontaneous switching, seenwhen the first animal in a group became active or inactive,is likely to have been induced by such factors. However,the decrease in the spontaneous switch rate with

GAUTRAIS ET AL.: ALLELOMIMETIC SYNCHRONIZATION 1451
increasing group size suggested that switching is sloweddown by an increasing number of individuals in the samestate. Evidence of a social influence was further confirmedafter the first individual had switched, as the probabilityper unit time of the other group members doing the sameincreased as a function of the number of individuals in thenew state. This social influence was quantified in anindividual-based model of the behavioural decision pro-cess. The proposed model meets the two basic require-ments for self-organization, namely random fluctuations,embodied by spontaneous switches to activity or inactiv-ity, and positive feedback loops, embodied by the allelo-mimetic enhancement of switch rates. Allelomimeticprocesses can produce widely different collective behav-iours, depending on the parameters and the environmen-tal conditions (Deneubourg & Goss 1989; Camazine et al.2001). Allelomimetism has been used to explain collectivedecisions in social insects, such as pheromone-based pathselection in ants, where the choice of only one path drivesall the workers towards the same food source (Detrainet al. 1999), or the choice of a single aggregation site bycockroaches (Jeanson et al. 2005). Allelomimetism hasalso been found to be widespread in vertebrates, for
Spon
tan
eou
s ra
tes
(10–3
s–1
)
(a)
λ(0,N)
μ(N,0)
1.4
1.2
1
0.8
0.6
0.4
0.2
0
1.4
1.2
1
0.8
0.6
0.4
0.2
0
0 2 4 6
(b)
8 10
0 2 4 6Group size
8 10
Figure 6. Estimated spontaneous activation l(0,N ) and inactivation
m(N,0) rates in (a) males and (b) females as a function of group sizes
two, four, six and eight. Lines correspond to the fitted model (see Re-
sults: Individual-based model).
example schooling fishes (Grunbaum et al. 2004). Whenbehaviours are markedly stochastic, allelomimetism isa highly efficient mechanism for coordinating and syn-chronizing activities, since mixtures of states are veryunstable.
Model Features
Analysis of the data did not lead to rejection of theMarkovian hypothesis that switching rates would staythe same if the conditions did not change, in this case thestates of the conspecifics. In their study of behaviouralsynchronization in sheep, in similar experimental condi-tions to ours, Rook & Penning (1991b) also found thata discrete time Markov model generally performed betterthan an age-dependent model to describe the time courseof behaviours. Similarly, Dutilleul et al. (2000, Fig. 4), alsousing sheep, reported an apparently monotonous decay ofthe probability of still being in the current state, consis-tent with an exponential decay, although they wrongly at-tributed their survival curves to an age-dependent process.Such Markovian property is at odds with the structuring ofactivity into well-defined bouts, generally recognized asequivalent to meal and nonmeal periods by intake controltheory. The concepts of hunger and satiety imply that theprobability of an animal initiating a meal is a function ofthe duration of the previous nonmeal interval, that is agedependent (Tolkamp et al. 1998). However, the binaryclassification of behaviour in the present study is likelyto mask any effects of this time dependency, since it com-bines ingestive behaviour with all other activities and allrumination behaviour with resting. Although hungerand satiety effects are likely to be responsible for the oc-currence of so-called spontaneous switching, collectiveswitching thereafter appears to be largely driven by allelo-mimetism in the short term.
As far as the individual decision-making process isconcerned, the model suggests that individuals have tomake a trade-off between maintaining the behaviour ofconspecifics in the same state and adopting the behaviour ofconspecifics in the opposite state. At present, the cognitiveprocesses involved are unclear. The model assumes that allindividuals are aware of the states of all conspecifics at anytime, which is reasonable for the small groups and arenasused in this study. However, the assumption may not holdfor large groups, or groups dispersed over wider areas.Sibbald et al. (2000) found that mean grazing time in smallgroups of sheep (n ¼ 10) increased with increasing spaceallowance, and suggested that the cause could have beena decrease in synchronization at low space allowances, sincelying sheep would not have had to move around in order tostay close to their grazing companions. However, synchro-nization was quantified as the overall proportion of timespent grazing together, and could simply have been aby-product rather than a cause of the differences in grazingtime. An analysis of the switching rates at the beginningand ending of grazing bouts, as described in this paper,would be necessary to determine whether space allowanceaffected switching rates and hence the process ofsynchronization.
ANIMAL BEHAVIOUR, 74, 51452
N=2
(a)
N=2
(e)
N=4
(f)
N=8
(d)
N=8
(h)
N=6
(g)
2
1
0
2
1
0
2
3
4
1
0
2
4
6
8
0
2
4
6
8
0
2
4
6
0
0 10 000 20 000
Nu
mbe
r of
act
ive
shee
p
N=4
N=6
(c)
(b)
2
3
4
1
0
2
4
6
0
0 10 000 20 000
0 10 000 20 000
0 10 000Time (s)
20 000 0 10 000 20 000
0 10 000 20 000
0 10 000 20 000
0 10 000 20 000
Figure 7. Examples of predicted numbers of active individuals ( y-axis) in groups of N ¼ 2, 4, 6 or 8 male sheep, evolving in continuous time (x-
axis), in the absence (aed) and in the presence (eeh) of allelomimetism.
Furthermore, the tendency for animals to remainassociated and match their activities with one anothermay vary with social relationships and between species. Inthe present study, for instance, males were more likely tomimic other males than females were to mimic otherfemales, leading to greater synchrony amongst the males(Michelena et al. 2006). A previous analysis of these datashowed that the mixed-sex groups were the least synchro-nized (Michelena et al. 2006), suggesting differential mim-icking tendencies based on sex. Finally, in both sexes,inactive sheep were more effective in stimulating activesheep to become inactive (am) than were active sheep instimulating inactive sheep to become active (al), suggest-ing differential mimicking tendencies based on state. Thismay indicate that individual responsiveness is under selec-tive pressure, since group cohesion will be helped more bya mechanism which favours the synchronization of inac-tivity than activity. This is because inactivity occupiesa smaller place in an individual’s time budget and there-fore synchrony has a lower probability of occurring bychance. One would predict that such selective pressureshould result in the reverse situation in animals whosetime devoted to synchronized activity is shorter than toinactivity.
CONCLUSION
Cohesion is a prerequisite of group living, and activitysynchrony is considered to be crucial for social cohesion.The analysis presented in this paper indicates that activitysynchrony in grazing sheep arises from an allelomimeticsynchronization process. It should be emphasized that themechanisms involved do not require individuals to haveintrinsic rhythms in order to produce an oscillating andcollective synchrony. Allelomimetic modulation of switchrates is sufficient to build up oscillations between activityand inactivity concurrences at the group level, from thecoupling of Markovian decisions at the individual level. Itis the first ethological model, to our knowledge, to showhow synchronized oscillations at the group level canemerge from nonoscillating stochastic behaviours at theindividual level. These oscillation patterns might be morerobust with the addition of other behavioural componentsknown to be widespread in the animal kingdom, such asthe delayed responsiveness (refractory period), often seenimmediately after a switch in behaviour or as the result ofsatiety. Such a framework could prove fruitful for quanti-fying and modelling a large variety of collective oscillatingbehaviours, when individual stochasticity is high.

GAUTRAIS ET AL.: ALLELOMIMETIC SYNCHRONIZATION 1453
Acknowledgments
We thank the staff of the Domaine du Merle for technicalassistance and access to facilities. We are also indebted toC. Boleat and V. Michelena who participated in the datacollection and S. Noel who further contributed to the videoanalyses. Pablo Michelena and Jacques Gautrais weresupported by the Leurre project sponsored by the Futureand Emerging Technologies programme of the EuropeanCommunity (IST-2001-35506). Animal care and experi-mental manipulations were in accordance with the rules ofthe French committee of animal experimentation ethics.
References
Bon, R., Deneubourg, J.-L., Gerard, J.-F. & Michelena, P. 2005.
Sexual segregation in ungulates: from individual mechanisms to
collective patterns. In: Sexual Segregation in Vertebrates (Ed. byK. Ruckstuhl & P. Neuhaus), pp. 180e199. Cambridge: Cam-
bridge University Press.
Camazine, S., Deneubourg, J.-L., Franks, N. R., Sneyd, J., Therau-laz, G. & Bonabeau, E. 2001. Self-Organization in Biological
Systems. Princeton, New Jersey: Princeton University Press.
Clayton, D. A. 1978. Socially facilitated behavior. Quarterly Review of
Biology, 53, 373e392.
Cole, B. J. 1991a. Short-term activity cycles in ants: generation
of periodicity by worker interaction. American Naturalist, 137,
244e259.
Cole, B. J. 1991b. Short-term activity cycles in ants: a phase-respon-
se curve and phase resetting in worker activity. Journal of InsectBehavior, 4, 129e137.
Conradt, L. 1998. Could asynchrony in activity between the sexes
cause intersexual social segregation in ruminants? Proceedings ofthe Royal Society of London, Series B, 265, 1e5.
Conradt, L. & Roper, T. J. 2005. Consensus decision making inanimals. Trends in Ecology and Evolution, 20, 449e456.
Cote, S. D., Schaefer, J. A. & Messier, F. 1997. Time budgetsand synchrony of activities in muskoxen: the influence of
sex, age and season. Canadian Journal of Zoology, 75, 1628e1635.
Deneubourg, J.-L. & Goss, S. 1989. Collective patterns and decision
making. Ethology, Ecology and Evolution, 1, 295e311.
Detrain, C., Deneubourg, J.-L. & Pasteels, J. 1999. Information
Processing in Social Insects. Basel: Birkhauser-Verlag.
Dudzinsky, M. L. & Arnold, G. W. 1979. Factors influencing the
grazing behaviour of sheep in a Mediterranean climate. Applied
Animal Ethology, 5, 125e144.
Dumont, B., Boissy, A., Achard, C., Sibbald, A. M. & Erhard, H. W.2005. Consistency of animal order in spontaneous group move-
ments allows the measurement of leadership in a group of grazingheifers. Applied Animal Behaviour Science, 95, 55e66.
Dutilleul, P., Deswysen, A. G., Fisher, V. & Maene, D. 2000. Time-dependent transition probabilities and the assessment of seasonal
effects on within-day variations in chewing behaviour of housed
sheep. Applied Animal Behaviour Science, 68, 13e37.
Engel, J. & Lamprecht, J. 1997. Doing what everybody does? A pro-
cedure for investigating behavioural synchronization. Journal of
Theoretical Biology, 185, 255e262.
Fernandez-Juridic, E., Gilak, N., McDonald, J. C., Pithia, P. &Valcarce, A. 2006. A dynamic method to study the transmissionof social foraging information in flocks using robots. Animal Behav-
iour, 71, 901e911. doi:10.1016/j.anbehav.2005.09.008.
Focardi, S. & Pecchiol, E. 2005. Social cohesion and foraging
decrease with group size in fallow deer (Dama dama). Behavioural
Ecology and Sociobiology, 59, 84e91. doi:10.1007/s00265-005-
0012-0.
Grunbaum, D., Viscido, S. & Parrish, J. K. 2004. Extracting interac-
tive control algorithms from group dynamics of schooling fish. In:
Lecture Notes in Control and Information Sciences (Ed. by V. Kumar,N. E. Leonard & A. S. Morse), pp. 103e117. Berlin: Springer-Verlag.
Haccou, P. & Meelis, E. 1992. Statistical Analysis of Behavioural Data.An Approach based on Time-Structured Models. Oxford: Oxford
University Press.
Holm, S. 1979. A simple sequentially rejective Bonferroni test proce-
dure. Scandinavian Journal of Statistics, 6, 65e70.
Jackson, C.H. 2005. msm: Multi-state Markov and hidden Markov
models in continuous time. R package version 0.6. http://cran.
cict.fr/doc/packages/msm.pdf. Read: March 2006.
Jackson, C. H., Sharples, L. D., Thompson, S. G., Duffy, S. W. &Couto, E. 2003. Multistate Markov models for disease progression
with classification error. Journal of the Royal Statistical Society, D,52, 1e17.
Jeanson, R., Rivault, C., Deneubourg, J.-L., Blanco, S., Fournier,R., Jost, C. & Theraulaz, G. 2005. Self-organized aggregation in
cockroaches. Animal Behaviour, 69, 169e180.
Krause, J. & Ruxton, G. D. 2002. Living in Groups. Oxford: Oxford
University Press.
Maier, J. A. K. & White, R. G. 1998. Timing and synchrony of activ-
ity in caribou. Canadian Journal of Zoology, 76, 1999e2009.
Mayes, E. & Duncan, P. 1986. Temporal patterns of feeding behav-iour in free-ranging horses. Behaviour, 96, 105e129.
Michelena, P., Noel, S., Gautrais, J., Gerard, J.-F., Deneubourg,J.-L. & Bon, R. 2006. Sexual dimorphism, activity budget and syn-
chrony in sheep group. Oecologia, 148, 170e180. doi:10.1007/
s00442-005-0347-2.
van Oort, B. E. H., Tyler, N. J. C., Gerkema, M. P., Folkow, L., Blix,A. S. & Stokkan, K.-A. 2005. Circadian organization in reindeer.
Nature, 438, 1095e1096.
Palestis, B. G. & Burger, J. 1998. Evidence for social facilitation of
preening in the common tern. Animal Behaviour, 56, 1107e1111.
R Development Core Team. 2005. R: A Language and Environment
for Statistical Computing. R Foundation for Statistical Computing.Vienna: Austria. ISBN 3-900051-07-0. http://www.R-project.org.
Rajaratnam, S. M. W. & Redman, J. 1999. Social contact synchro-nizes free-running activity rhythms of diurnal palm squirrels. Phys-
iology and Behaviour, 66, 21e26.
Ramirez-Avila, G. M., Guisset, J. L. & Deneubourg, J.-L. 2003.
Synchronization in light-controlled oscillators. Physica, 182,
254e273.
Roden, C. & Wechsler, B. 1998. A comparison of the behaviour of
domestic chicks reared with or without a hen in enriched pens.
Applied Animal Behaviour Science, 55, 317e326.
Rook, A. J. & Penning, P. D. 1991a. Synchronisation of eating,
ruminating and idling activity by grazing sheep. Applied AnimalBehaviour Science, 32, 157e166.
Rook, A. J. & Penning, P. D. 1991b. Stochastic models ofgrazing behaviour in sheep. Applied Animal Behaviour Science, 32,
167e177.
Ross, J. V., Taimre, T. & Pollett, P. K. 2006. On parameter
estimation in population models. Theoretical Population Biology,
70, 498e510.
Ruckstuhl, K. E. 1999. To synchronise or not to synchronise: a
dilemma for young bighorn males? Behaviour, 136, 805e818.
Ruckstuhl, K. E. & Neuhaus, P. 2002. Sexual segregation in ungu-
lates: a comparative test of three hypotheses. Biological Review,
77, 77e96.
Scott, J. P. 1956. The analysis of social organization in animals.
Ecology, 37, 213e221.

ANIMAL BEHAVIOUR, 74, 51454
Sibbald, A. M., Shellard, L. J. F. & Smart, T. S. 2000. Effects of
space allowance on the grazing behaviour and spacing of sheep.
Applied Animal Behaviour Science, 70, 48e62.
Stirzaker, D. 2005. Stochastic Processes and Models. Oxford: Oxford
University Press.
Tolkamp, B. J., Allcroft, D. J., Austin, E. J., Nielsen, B. L. & Kyria-zakis, I. 1998. Satiety splits feeding behaviour into bouts. Journalof Theoretical Biology, 194, 235e250.
Watts, D. P. 2000. Mountain gorilla habitat use strategies and groupmovements. In: On the Move. How and Why Animals Travel in
Groups (Ed. by S. Boinski & P. A. Garber), pp. 351e374. Chicago:
University of Chicago Press.
Wechsler, B. & Brodman, N. 1996. The synchronization of nursing
bouts in group-housed sows. Applied Animal Behaviour Science, 47,
191e199.
Appendix
Group behaviour can be quantified at time t by theinstantaneous probability density function
QðA; tÞ ¼ðPðAÞ ¼ PrfSðtÞ ¼ A ; A ¼ 0.NÞg of the probabilitiesP(A) that the group comprises A active animals attime t.QðA; tÞ is a function of time because it depends on theinitial value S(0). If, for example, the group starts withno active individual:
Qð0; 0Þ ¼ ð1; 0;.;0Þ, that isP(0) ¼ 1 and P(A > 0) ¼ 0. As time goes on, this probabilitydensity function evolves because transitions to highervalues 1.N accumulate, so that the probability P(A > 0)of finding some individuals active increases, and the prob-ability P(0) finding the group still in the initial conditiondeclines. Under the null hypothesis that all individualsswitch states independently and at the same rate,
QðA; tÞwould tend to the binomial distribution as time goes to in-finity. In the short term, however, starting with all the in-dividuals inactive would lead to a higher probability offinding few animals active than when starting with allthe individuals active. Because of this sensitivity to initialconditions, an analytical expression for
QðA; tÞ is impossi-ble to formulate and its value at future time t, startingfrom a given value S(0), is better computed by numericalintegration.
If the process is time homogeneous,QðA; tÞ can be esti-
mated over the observed time T by the relative proportionof time that the group spent with each value of A,0 � A � N (summing the sojourn times in A) and it hasa unique equilibrium value
Q*ðAÞ ¼ limt/NQðA; tÞ, to
which it will converge whatever the initial conditions: atthe limit of infinite time, the impact of the initialconditions vanishes, so that
QðA; tÞ becomes independent
of them.QðA; tÞ approaches
Q* exponentially with respectto time, and the rate of convergence depends on the set oftransition rates. This equilibrium distribution is such thatdQ
*ðA; tÞ=dt ¼ 0, and it can be derived from the masterequation governing the evolution of
QðA; tÞ. The masterequation balances for every value of A, the transitions attime t leading to A (from A � 1 and A þ 1) and the transi-tions departing from A (to A � 1 and A þ 1) conditionallyto the probabilities P(A) of finding the system in the statethe transitions depart from:
dPðAÞdt
¼þTransitions to A�Transitions from A
where
Transitions to A¼ lA�1PðA� 1Þ þ mAþ1PðAþ 1ÞTransitions from A¼ mAPðAÞ þ lAPðAÞ
This master equation is known as the forward Chap-maneKolmogorov equations and reads
dQðtÞdt¼
8><>:
dPð0Þdt¼�ðl0ÞPð0Þþm1Pð1Þ
dPðAÞdt¼lA�1PðA�1Þ�ðlAþmAÞPðAÞþmAþ1PðAþ1Þ
dPðNÞdt¼lN�1PðN�1Þ�ðmNÞPðNÞ
At the equilibrium, dP*ðA; tÞ=dt ¼ 0 cA. SinceQ
is a probability density function, we also have:PNA¼0 PðAÞ ¼ 1. Hence, we can solve recursively and find
Q* ¼
8>>>>>><>>>>>>:
P*ð0Þ ¼ 1
1þPN
A¼1 SðAÞP*ðAÞ ¼ P*ð0Þ SðAÞ
with SðAÞ ¼QA�1
i¼0liQA
i¼1mi
Note that in the case of an isolated individual (N ¼ 1),
Q* ¼P*ð0Þ ¼ m1
l0 þ m1
P*ð1Þ ¼ l0
l0 þ m1
8><>:
with l0 denoting the spontaneous activation rate, m1 denotingthe spontaneous inactivation rate, P*(1) denoting the meanproportion of time spent active Pa. Corresponding theoreticalCI ¼ P*(0)þ P*(1) ¼ 1, as expected.
Further details about stochastic processes can be foundin Stirzaker (2005) and Ross et al. (2006).