allergan/bsm cosmetic surgery benchmarking database benchmarking.pdf · allergan/bsm cosmetic...
TRANSCRIPT

Allergan/BSM Allergan/BSM Cosmetic SurgeryCosmetic Surgery
Benchmarking DatabaseBenchmarking Database
Presented by:
Glenn MorleyAllergan Practice Consultant
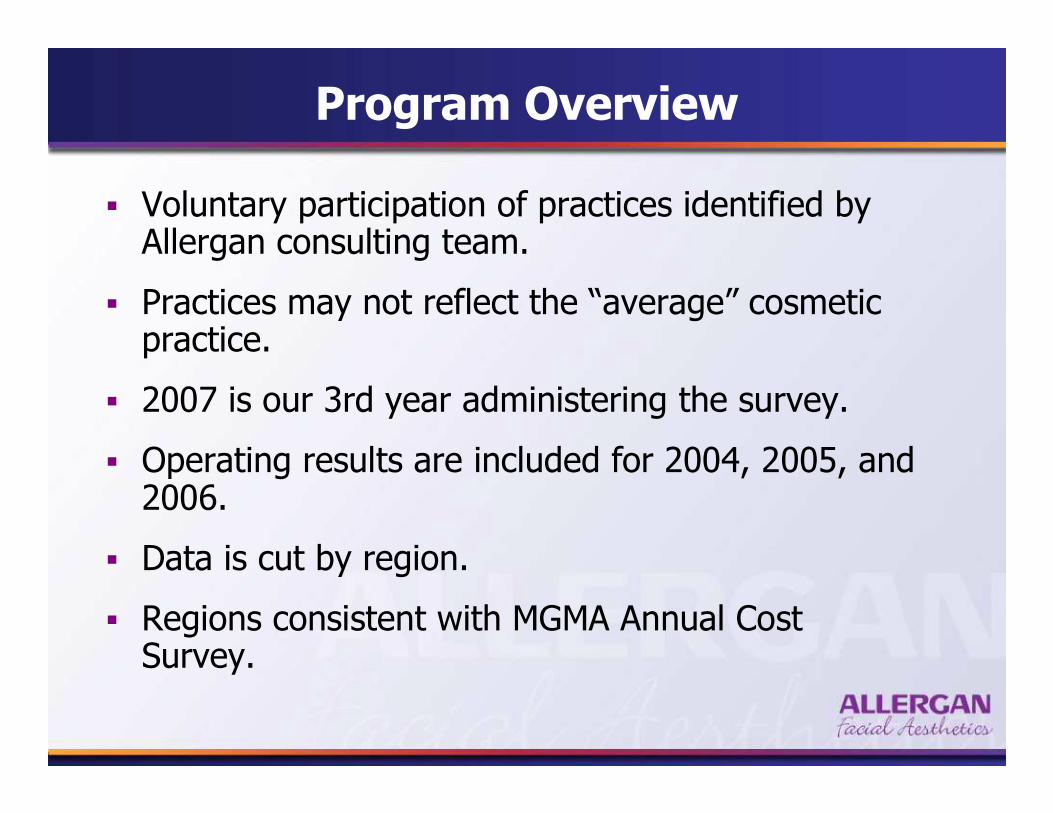
Program Overview
� Voluntary participation of practices identified by Allergan consulting team.
� Practices may not reflect the “average” cosmetic practice.
� 2007 is our 3rd year administering the survey.
� Operating results are included for 2004, 2005, and 2006.
� Data is cut by region.
� Regions consistent with MGMA Annual Cost Survey.
Data Sources
� Practice Financial Statements
� Income Tax Returns
� Productivity Reports
� Employee Census Data
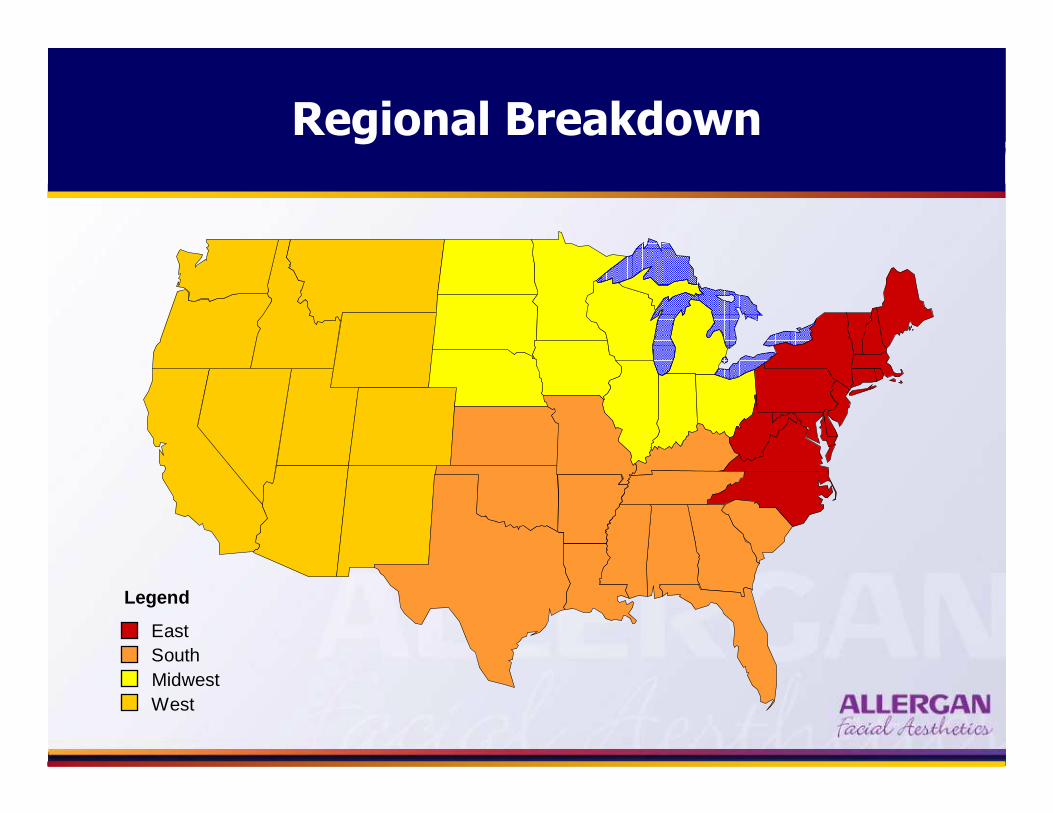
Regional Breakdown
Legend
EastSouthMidwestWest
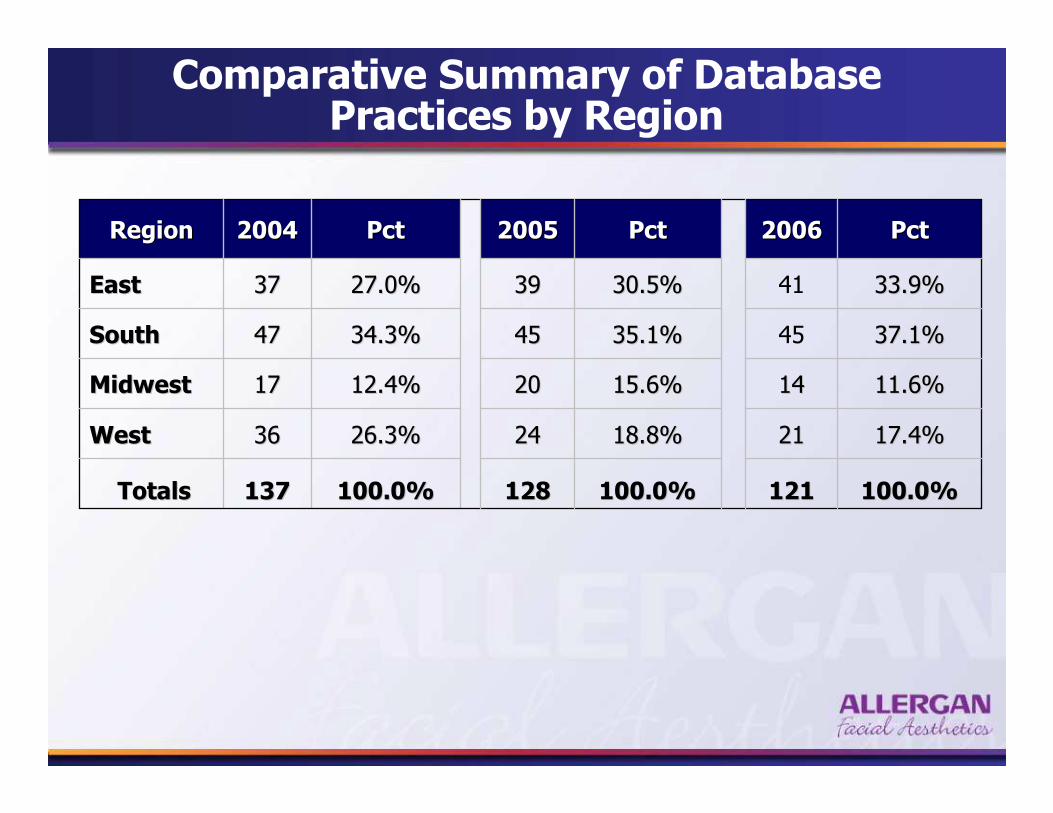
Comparative Summary of DatabasePractices by Region
100.0% 100.0% 121121100.0%100.0%128128100.0%100.0%137137TotalsTotals
17.4% 17.4% 212118.8%18.8%242426.3%26.3%3636WestWest
11.6% 11.6% 141415.6%15.6%202012.4%12.4%1717MidwestMidwest
37.1% 37.1% 4535.1%35.1%454534.3%34.3%4747SouthSouth
33.9% 33.9% 4130.5%30.5%393927.0%27.0%3737East East
Pct Pct 20062006PctPct20052005PctPct20042004RegionRegion
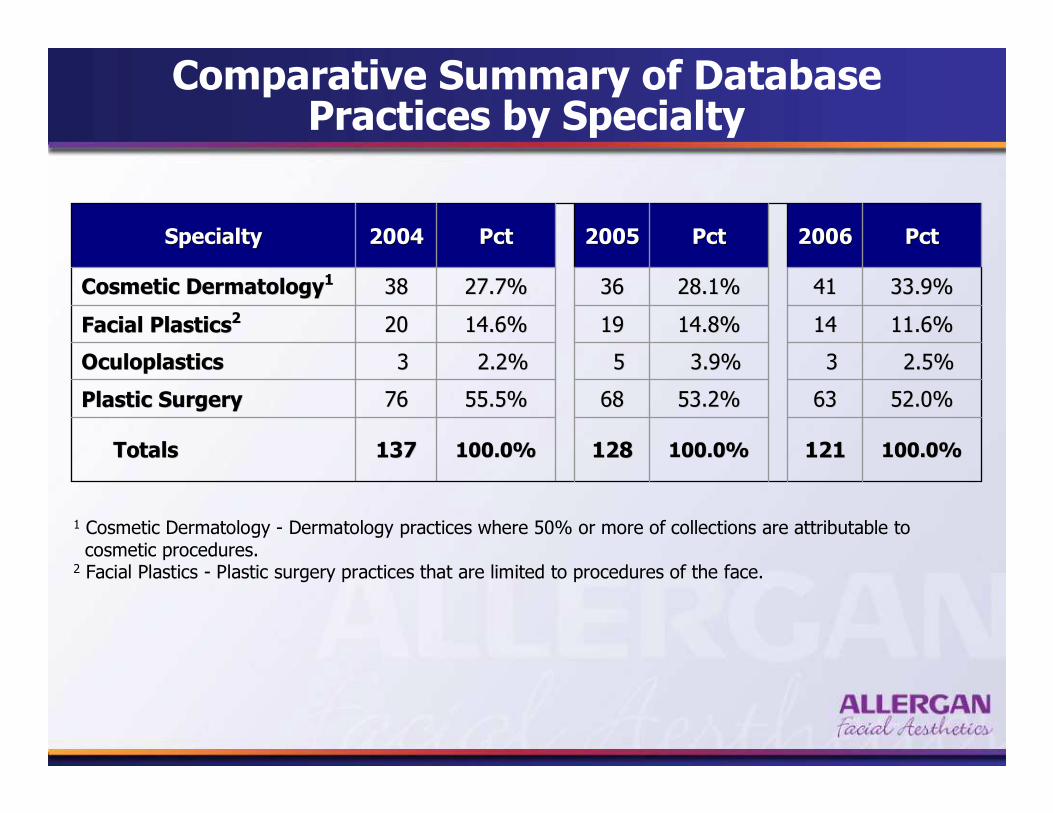
Comparative Summary of DatabasePractices by Specialty
1 Cosmetic Dermatology - Dermatology practices where 50% or more of collections are attributable to cosmetic procedures.
2 Facial Plastics - Plastic surgery practices that are limited to procedures of the face.
100.0%100.0%121121100.0%100.0%128128100.0%100.0%137137TotalsTotals
52.0%52.0%636353.2%53.2%686855.5%55.5%7676Plastic SurgeryPlastic Surgery
2.5%2.5%333.9%3.9%552.2%2.2%33OculoplasticsOculoplastics
11.6%11.6%141414.8%14.8%191914.6%14.6%2020Facial PlasticsFacial Plastics22
33.9%33.9%414128.1%28.1%363627.7%27.7%3838Cosmetic DermatologyCosmetic Dermatology11
PctPct20062006PctPct20052005PctPct20042004SpecialtySpecialty
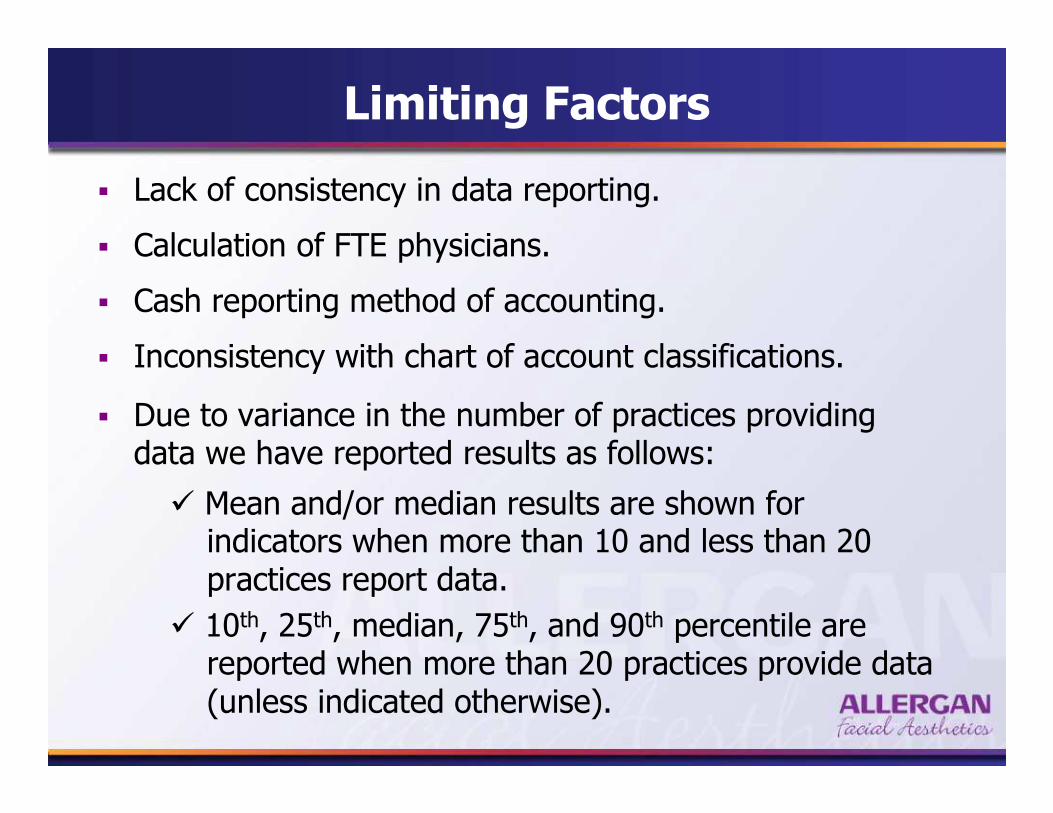
Limiting Factors
� Lack of consistency in data reporting.
� Calculation of FTE physicians.
� Cash reporting method of accounting.
� Inconsistency with chart of account classifications.
� Due to variance in the number of practices providing data we have reported results as follows:
� Mean and/or median results are shown for indicators when more than 10 and less than 20 practices report data.
� 10th, 25th, median, 75th, and 90th percentile are reported when more than 20 practices provide data(unless indicated otherwise).
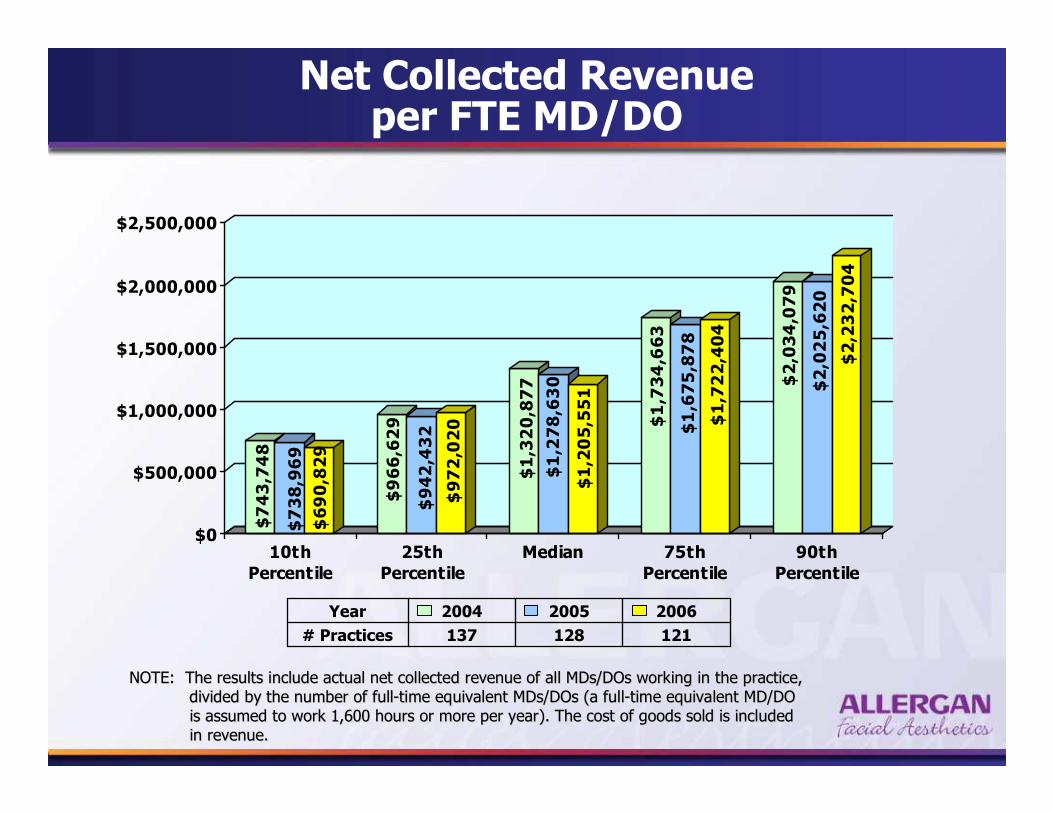
Net Collected Revenue per FTE MD/DO
$743,748
$738,969
$690,829
$966,629
$942,432
$972,020
$1,320,877
$1,278,630
$1,205,551
$1,734,663
$1,675,878
$1,722,404
$2,034,079
$2,025,620
$2,232,704
$0
$500,000
$1,000,000
$1,500,000
$2,000,000
$2,500,000
10th
Percentile
25th
Percentile
Median 75th
Percentile
90th
Percentile
NOTE: The results include actual net collected revenue of all MNOTE: The results include actual net collected revenue of all MDs/DOs working in the practice,Ds/DOs working in the practice,
divided by the number of fulldivided by the number of full--time equivalent MDs/DOs (a fulltime equivalent MDs/DOs (a full--time equivalent MD/DOtime equivalent MD/DO
is assumed to work 1,600 hours or more per year). This assumed to work 1,600 hours or more per year). The cost of goods sold is includede cost of goods sold is included
in revenue.in revenue.
200620052004
121128137# Practices
Year
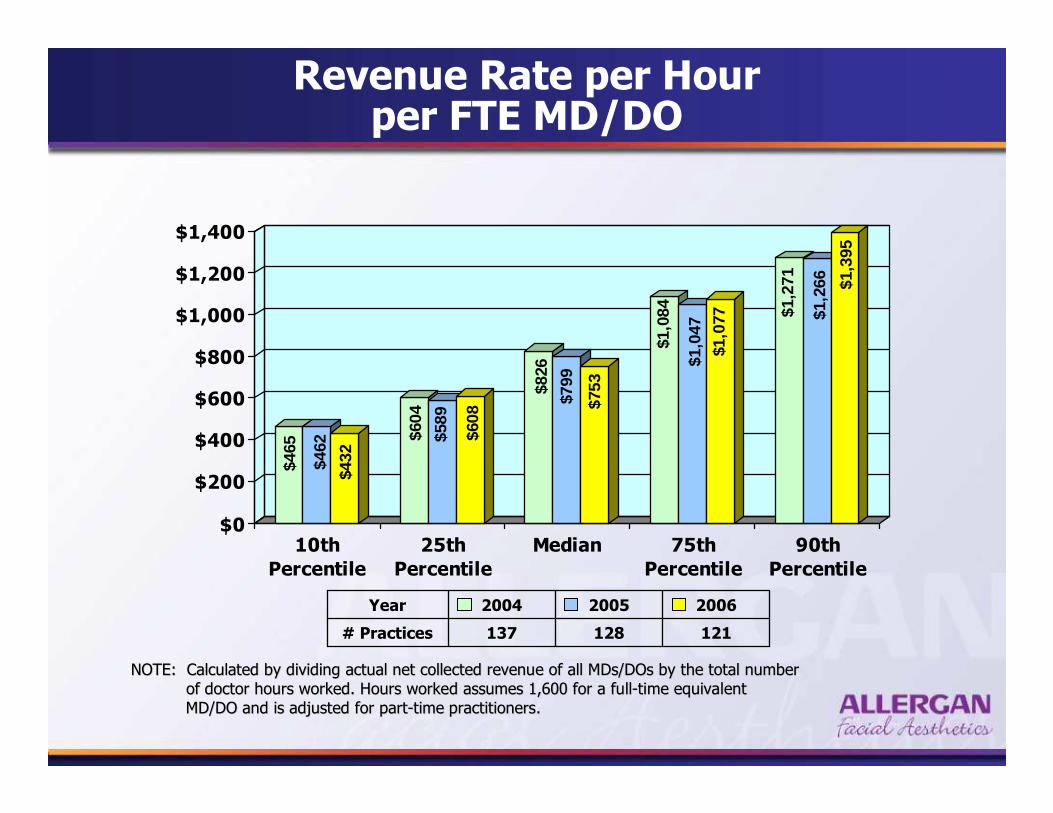
Revenue Rate per Hour per FTE MD/DO
NOTE: Calculated by dividing actual net collected revenue of alNOTE: Calculated by dividing actual net collected revenue of all MDs/DOs by the total numberl MDs/DOs by the total number
of doctor hours worked. Hours worked assumes 1,600 foof doctor hours worked. Hours worked assumes 1,600 for a fullr a full--time equivalenttime equivalent
MD/DO and is adjusted for partMD/DO and is adjusted for part--time practitioners.time practitioners.
$465
$462
$432
$604
$589
$608
$826
$799
$753
$1,0
84
$1,0
47$1
,077 $1
,271
$1,2
66 $1,3
95
$0
$200
$400
$600
$800
$1,000
$1,200
$1,400
10th
Percentile
25th
Percentile
Median 75th
Percentile
90th
Percentile
200620052004
121128137# Practices
Year

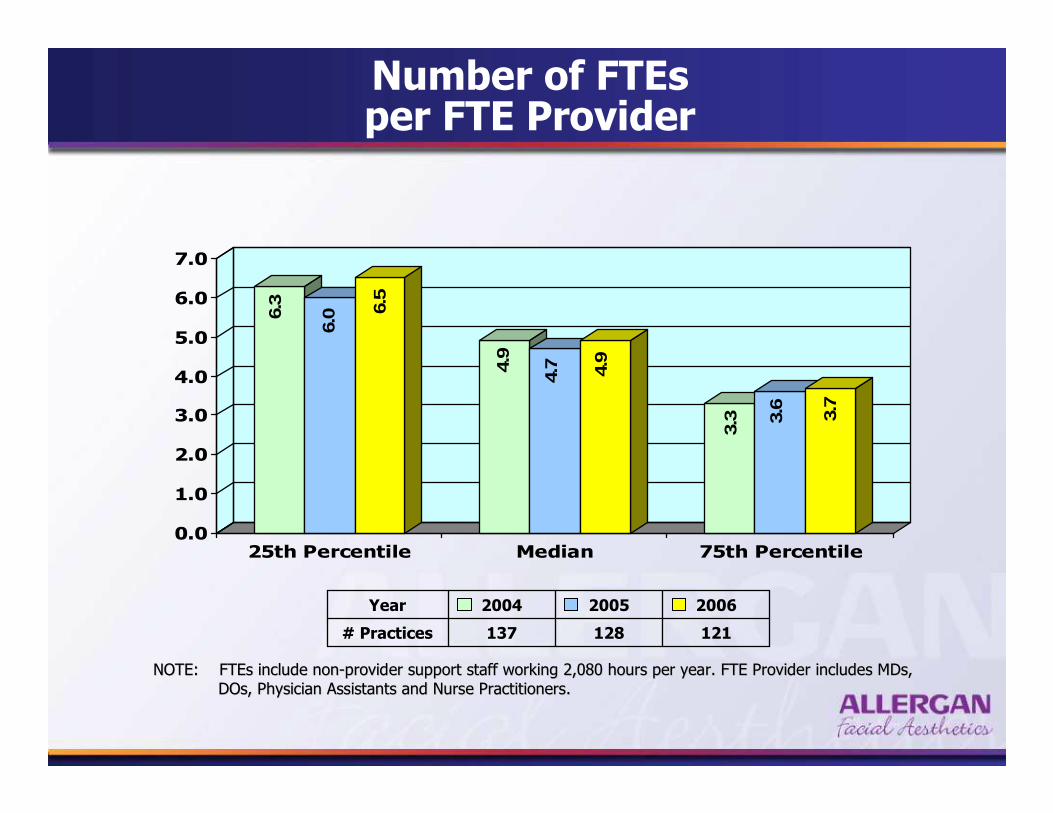
Number of FTEs per FTE Provider
6.3
6.0 6.
5
4.9
4.7 4.9
3.3 3.6
3.7
0.0
1.0
2.0
3.0
4.0
5.0
6.0
7.0
25th Percentile Median 75th Percentile
NOTE: FTEs include nonNOTE: FTEs include non--provider support staff working 2,080 hours per year. FTE Provideprovider support staff working 2,080 hours per year. FTE Provider includes MDs,r includes MDs,
DOs, Physician Assistants and Nurse Practitioners.DOs, Physician Assistants and Nurse Practitioners.
200620052004
121128137# Practices
Year

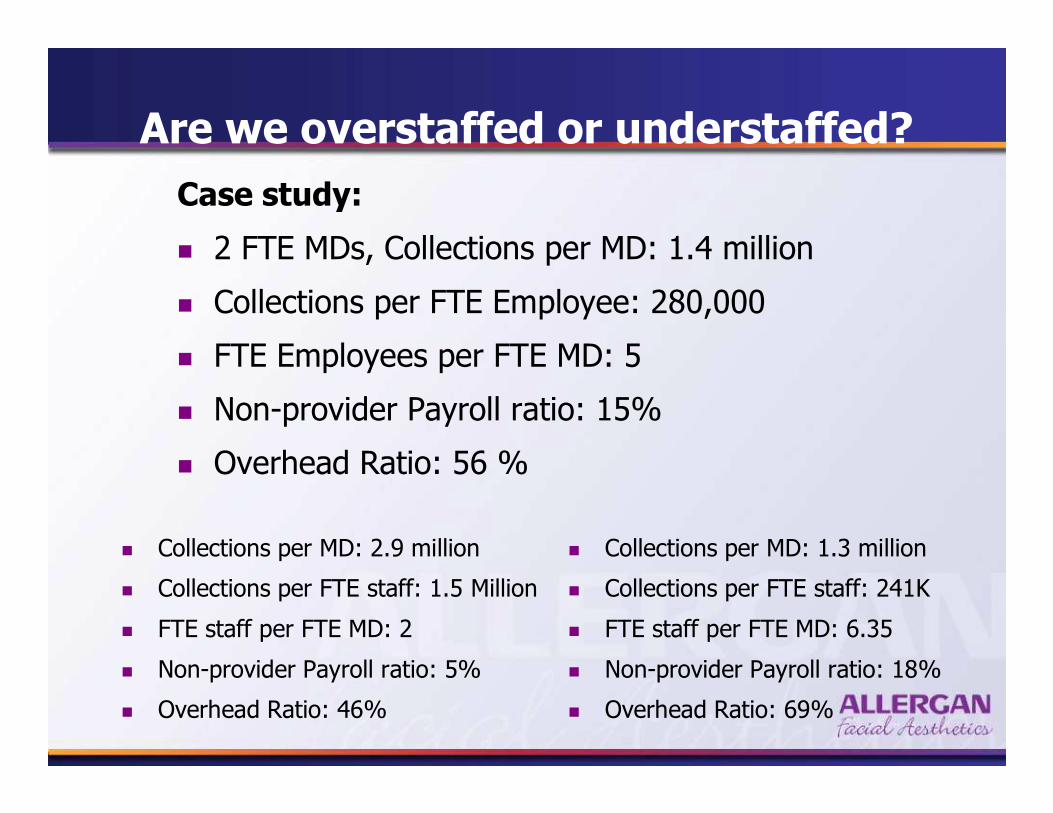
Are we overstaffed or understaffed?
Case study:
� 2 FTE MDs, Collections per MD: 1.4 million
� Collections per FTE Employee: 280,000
� FTE Employees per FTE MD: 5
� Non-provider Payroll ratio: 15%
� Overhead Ratio: 56 %
� Collections per MD: 2.9 million
� Collections per FTE staff: 1.5 Million
� FTE staff per FTE MD: 2
� Non-provider Payroll ratio: 5%
� Overhead Ratio: 46%
� Collections per MD: 1.3 million
� Collections per FTE staff: 241K
� FTE staff per FTE MD: 6.35
� Non-provider Payroll ratio: 18%
� Overhead Ratio: 69%
Number of FTEs per FTE Provider
6.3
6.0 6.
5
4.9
4.7 4.9
3.3 3.6
3.7
0.0
1.0
2.0
3.0
4.0
5.0
6.0
7.0
25th Percentile Median 75th Percentile
NOTE: FTEs include nonNOTE: FTEs include non--provider support staff working 2,080 hours per year. FTE Provideprovider support staff working 2,080 hours per year. FTE Provider includes MDs,r includes MDs,
DOs, Physician Assistants and Nurse Practitioners.DOs, Physician Assistants and Nurse Practitioners.
200620052004
121128137# Practices
Year
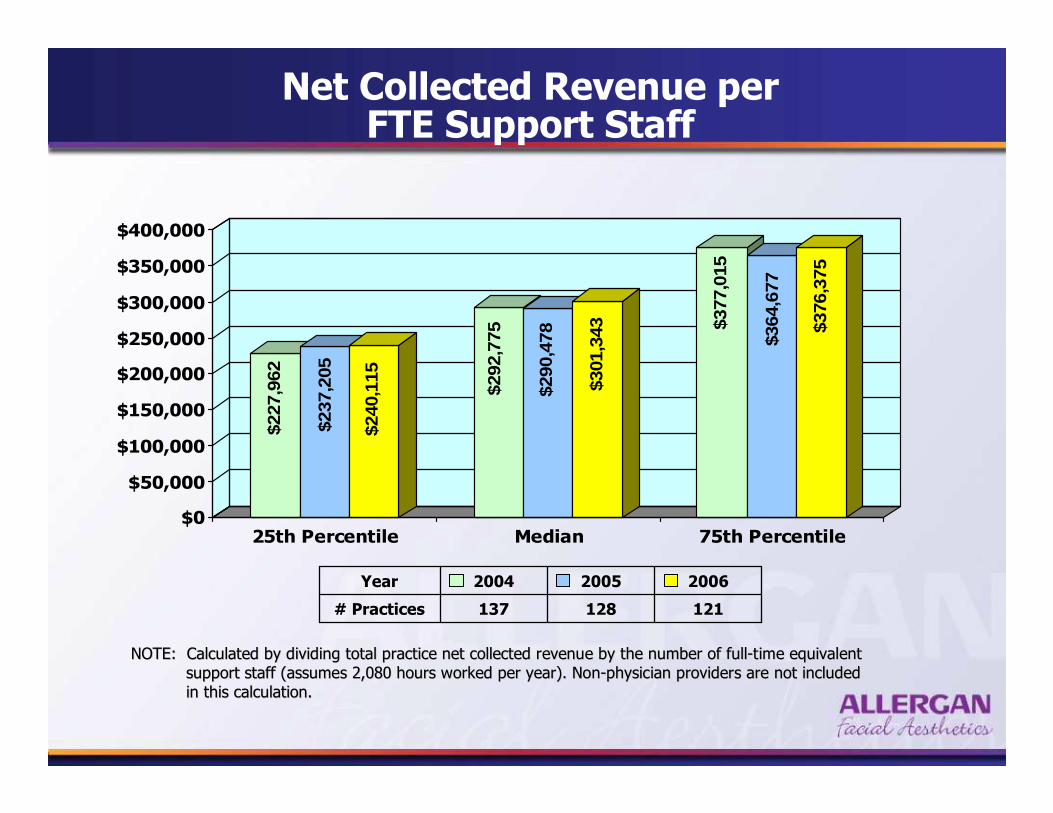
Net Collected Revenue per FTE Support Staff
$227
,962
$237
,205
$240
,115
$292
,775
$290
,478
$301
,343 $3
77,0
15
$364
,677
$376
,375
$0
$50,000
$100,000
$150,000
$200,000
$250,000
$300,000
$350,000
$400,000
25th Percentile Median 75th Percentile
NOTE: Calculated by dividing total practice net collected revenNOTE: Calculated by dividing total practice net collected revenue by the number of fullue by the number of full--time equivalenttime equivalent
support staff (assumes 2,080 hours worked per year). support staff (assumes 2,080 hours worked per year). NonNon--physician providers are not includedphysician providers are not included
in this calculation.in this calculation.
200620052004
121128137# Practices
Year
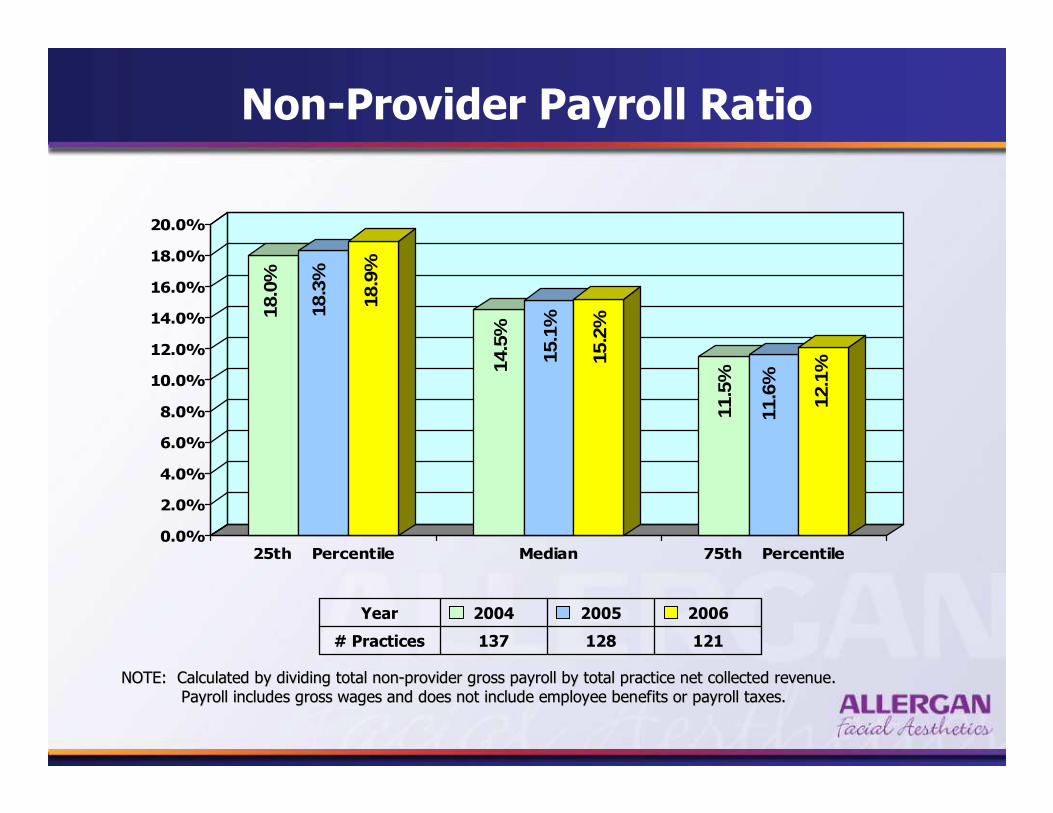
Non-Provider Payroll Ratio
18.0
%
18.3
%
18.9
%
14.5
%
15.1
%
15.2
%
11.5
%
11.6
%
12.1
%
0.0%
2.0%
4.0%
6.0%
8.0%
10.0%
12.0%
14.0%
16.0%
18.0%
20.0%
25th Percentile Median 75th Percentile
NOTE: Calculated by dividing total nonNOTE: Calculated by dividing total non--provider gross payroll by total practice net collected revenue.provider gross payroll by total practice net collected revenue.
Payroll includes gross wages and does not include emPayroll includes gross wages and does not include employee benefits or payroll taxes.ployee benefits or payroll taxes.
200620052004
121128137# Practices
Year
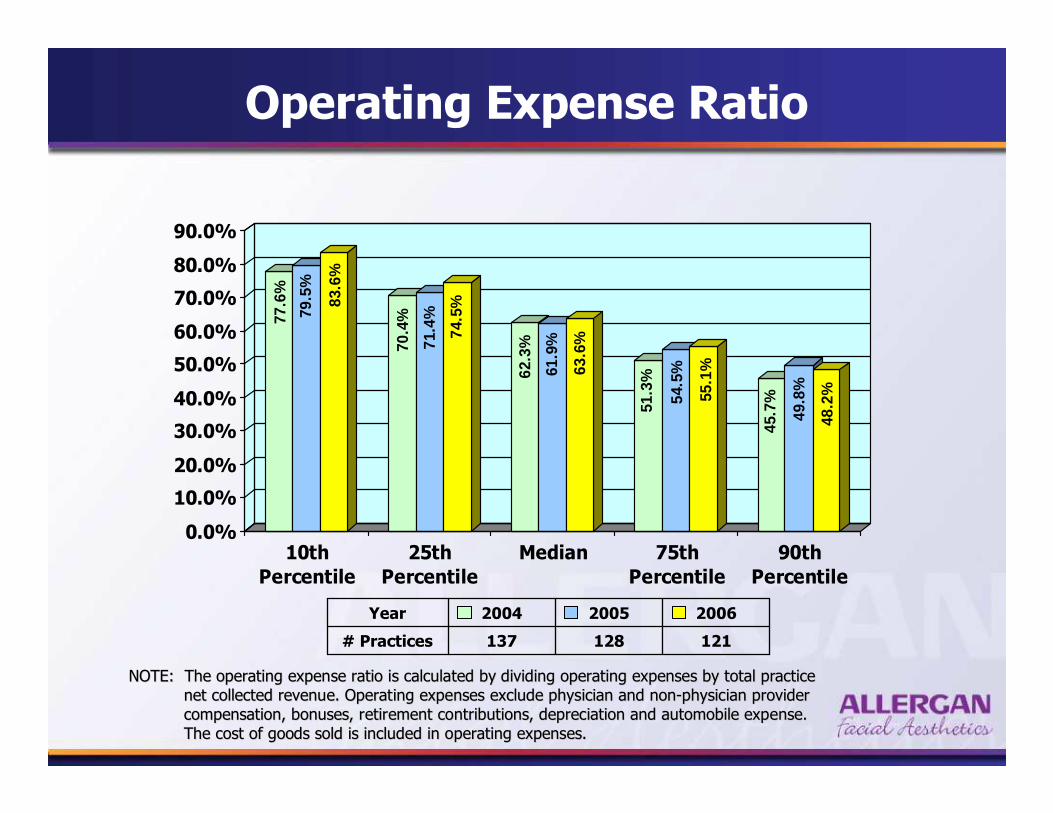
Operating Expense Ratio
77.6
%
79.5
%
83.6
%
70.4
%
71.4
%
74.5
%
62.3
%
61.9
%
63.6
%
51.3
%
54.5
%
55.1
%
45.7
%
49.8
%
48.2
%
0.0%
10.0%
20.0%
30.0%
40.0%
50.0%
60.0%
70.0%
80.0%
90.0%
10th
Percentile
25th
Percentile
Median 75th
Percentile
90th
Percentile
NOTE: The operating expense ratio is calculated by dividing opeNOTE: The operating expense ratio is calculated by dividing operating expenses by total practice rating expenses by total practice
net collected revenue. Operating expenses exclude phynet collected revenue. Operating expenses exclude physician and nonsician and non--physician providerphysician provider
compensation, bonuses, retirement contributions, deprcompensation, bonuses, retirement contributions, depreciation and automobile expense.eciation and automobile expense.
The cost of goods sold is included in operating expenThe cost of goods sold is included in operating expenses.ses.
200620052004
121128137# Practices
Year
Are we overstaffed or understaffed?
Case study:
� 2 FTE MDs, Collections per MD: 1.4 million
� Collections per FTE Employee: 280,000
� FTE Employees per FTE MD: 5
� Non-provider Payroll ratio: 15%
� Overhead Ratio: 56 %
� Collections per MD: 2.9 million
� Collections per FTE staff: 1.5 Million
� FTE staff per FTE MD: 2
� Non-provider Payroll ratio: 5%
� Overhead Ratio: 46%
� Collections per MD: 1.3 million
� Collections per FTE staff: 241K
� FTE staff per FTE MD: 6.35
� Non-provider Payroll ratio: 18%
� Overhead Ratio: 69%
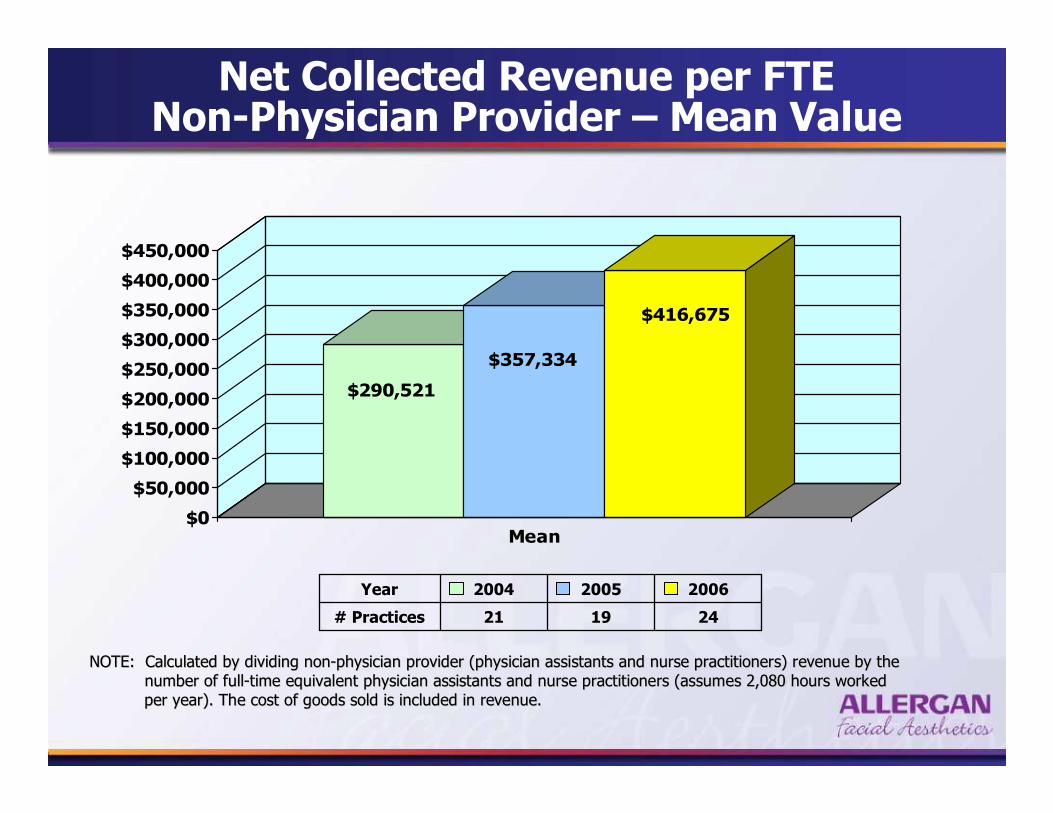
Net Collected Revenue per FTE Non-Physician Provider – Mean Value
$290,521
$357,334
$416,675
$0
$50,000
$100,000
$150,000
$200,000
$250,000
$300,000
$350,000
$400,000
$450,000
Mean
NOTE: Calculated by dividing nonNOTE: Calculated by dividing non--physician provider (physician assistants and nurse practitionersphysician provider (physician assistants and nurse practitioners) revenue by the) revenue by the
number of fullnumber of full--time equivalent physician assistants and nurse practitioners (astime equivalent physician assistants and nurse practitioners (assumes 2,080 hours worked sumes 2,080 hours worked
per year). The cost of goods sold is included in reveper year). The cost of goods sold is included in revenue.nue.
200620052004
241921# Practices
Year
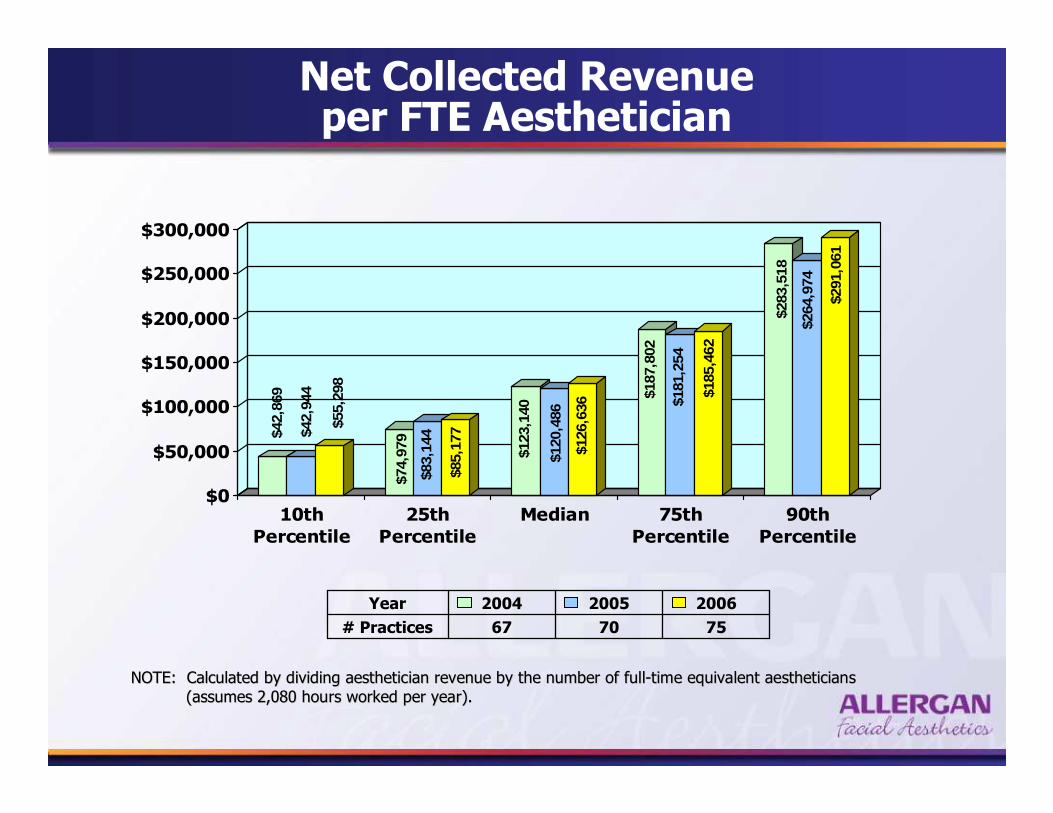
Net Collected Revenue per FTE Aesthetician
$42,
869
$42,
944
$55,
298
$74,
979
$83,
144
$85,
177
$123
,140
$120
,486
$126
,636
$187
,802
$181
,254
$185
,462
$283
,518
$264
,974
$291
,061
$0
$50,000
$100,000
$150,000
$200,000
$250,000
$300,000
10th
Percentile
25th
Percentile
Median 75th
Percentile
90th
Percentile
NOTE: Calculated by dividing aesthetician revenue by the numberNOTE: Calculated by dividing aesthetician revenue by the number of fullof full--time equivalent aestheticianstime equivalent aestheticians
(assumes 2,080 hours worked per year). (assumes 2,080 hours worked per year).
200620052004
757067# Practices
Year
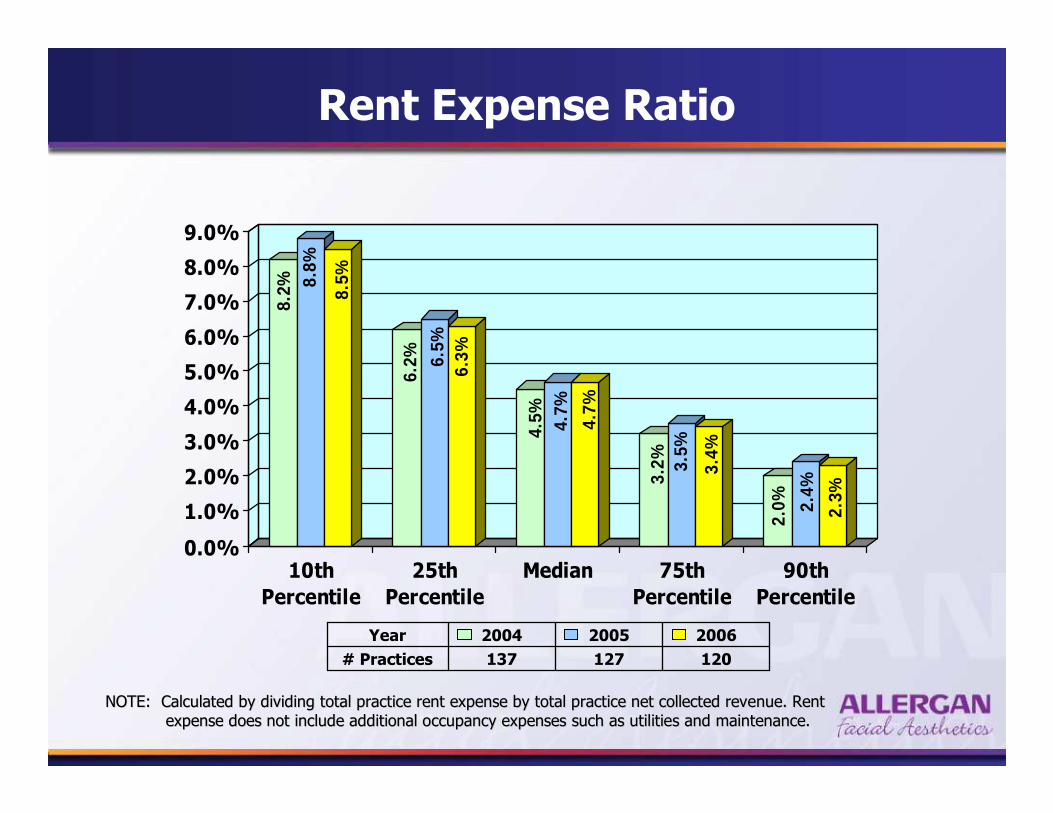
Rent Expense Ratio
8.2% 8.
8%
8.5%
6.2% 6.
5%6.
3%
4.5% 4.7%
4.7%
3.2% 3.
5%
3.4%
2.0% 2.
4%
2.3%
0.0%
1.0%
2.0%
3.0%
4.0%
5.0%
6.0%
7.0%
8.0%
9.0%
10th
Percentile
25th
Percentile
Median 75th
Percentile
90th
Percentile
200620052004
120127137# Practices
Year
NOTE: Calculated by dividing total practice rent expense by totNOTE: Calculated by dividing total practice rent expense by total practice net collected revenue. Rental practice net collected revenue. Rent
expense does not include additional occupancy expensexpense does not include additional occupancy expenses such as utilities and maintenance.es such as utilities and maintenance.
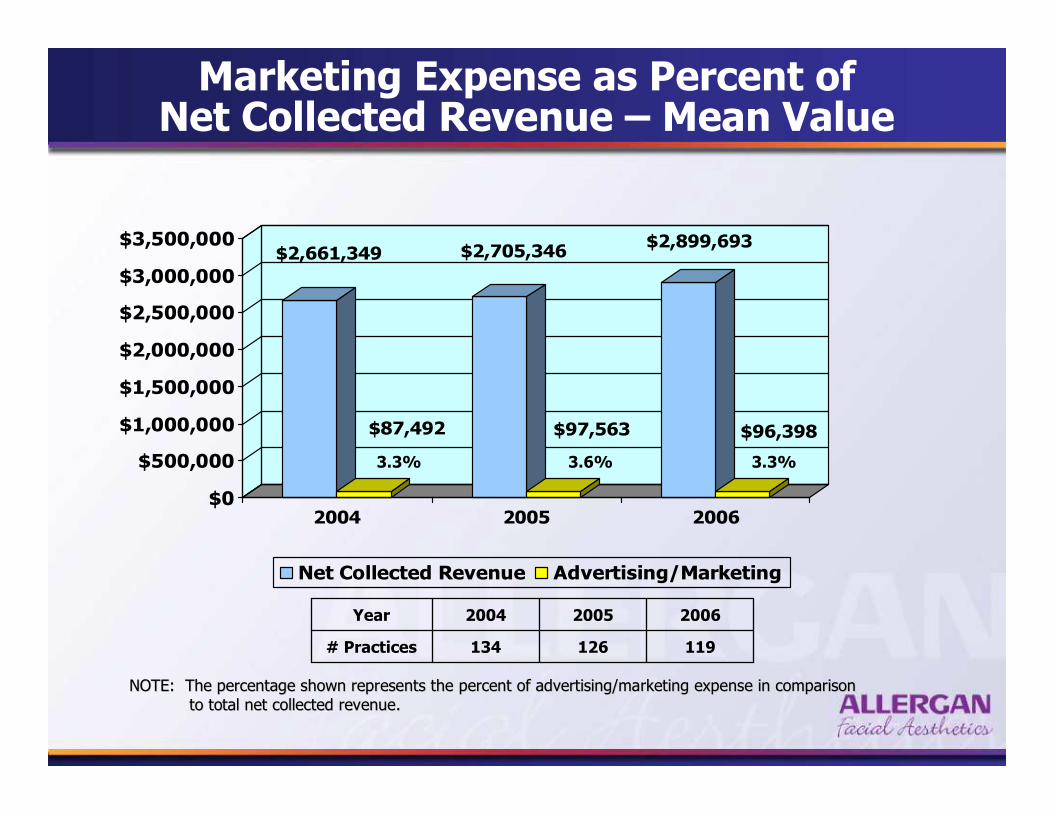
Marketing Expense as Percent of Net Collected Revenue – Mean Value
$2,661,349
$87,492
$2,705,346
$97,563
$2,899,693
$96,398
$0
$500,000
$1,000,000
$1,500,000
$2,000,000
$2,500,000
$3,000,000
$3,500,000
2004 2005 2006
Net Collected Revenue Advertising/Marketing
200620052004
119126134# Practices
Year
3.3% 3.6% 3.3%
NOTE: The percentage shown represents the percent of advertisinNOTE: The percentage shown represents the percent of advertising/marketing expense in comparisong/marketing expense in comparison
to total net collected revenue.to total net collected revenue.
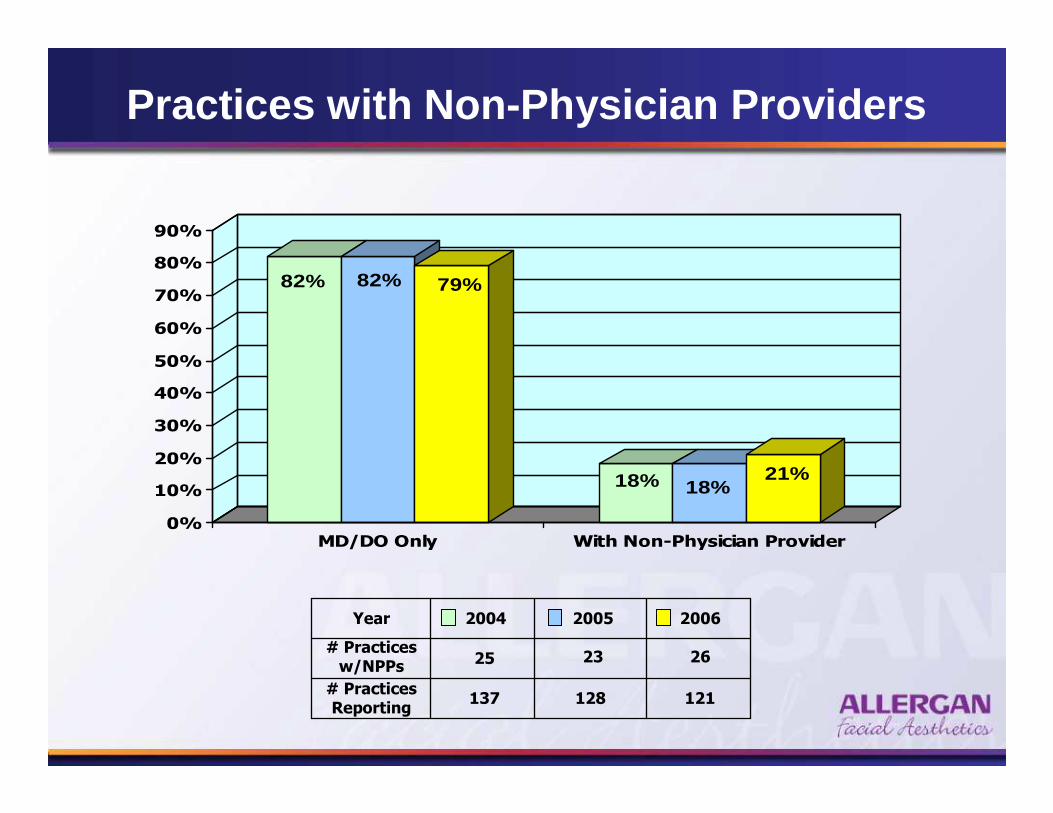
Practices with Non-Physician Providers
82% 82% 79%
18% 18%21%
0%
10%
20%
30%
40%
50%
60%
70%
80%
90%
MD/DO Only With Non-Physician Provider
200620052004
262325# Practices w/NPPs
Year
# Practices Reporting
137 128 121

Achieving Optimal Practice Performance
� Surround yourself with good people and good
information.
� Routinely measure and benchmark practice results.
� Measure patient and employee satisfaction levels.
� Make practice planning a routine.
� Strive to increase your personal productivity.

� More can be better when it comes to your staff.
� Hire “right” and invest in staff training and development.
� Show appreciation to your staff.
� Understand your role as a leader in the practice.
Achieving Optimal Practice Performance

RememberRemember……..
Good business decisions Good business decisions cannot be made cannot be made
without good information!without good information!