allervis - university of british columbia
TRANSCRIPT

AllerVisGeospatial Visualization of National Per Capita Consumption of Primary Food Allergens
José R. Carvajal | Department of Geography | E-mail: [email protected] Iranpour | Department of Computer Science | E-mail: [email protected].
Lucca Siaudzionis | Department of Computer Science | E-mail: [email protected].

● Country v. Country was a tool designed to compare two given countries on a set of pre given indices.
E.g. What are the five major export products of Namibia and Bangladesh?
● Aimed to provide a more holistic representation of countries.
From Country v. Country to AllerVis
2

● Limitations: ○ Binary○ Large scope○ Not user driven
● Solution: ○ Task driven tool○ Limited scope○ Everyday relevancy
From Country v. Country to AllerVis
3

E.g. Expatisan
https://www.expatistan.com/cost-of-living 4

Motivation: Rhys goes to Thailand
1. Eggs2. Peanuts3. Tree Nuts
a. Almonds,b. Walnutsc. Pine nutd. Macadamia nute. Cashewsf. Pistachios
1. Thai Fried Rice: EGGS, SHELLFISH, SOY, FISH2. Tom Kha Gai: FISH3. Green Chicken Curry: SESAME, SOY, FISH.
MAY CONTAIN: PEANUTS4. Pad Thai: PEANUTS, EGGS, SHELLFISH, SOY AND
FISH5. Tom Yum Goong: SHELLFISH AND FISH
SOURCE: https://thaisq.com/5-most-loved-dishes-from-thailand/
RHYS’ ALLERGIES MOST COMMON DISHES IN THAILAND
5

Who is the user?
● I AM● MY SON IS● MY WIFE IS
ALLERGIC TO [X] AND [Y], GIVEN A CHOICE, WHERE SHOULD WE GO?
Responds to:● A significant part of the population that is affected by food allergies.● An increase in international travel for leisure.● Globalized food consumption habits.● 90% of all food allergies are caused by only eight allergens: soy, egg, fish, milk, shellfish, peanuts,
tree nuts and wheat.
6

Similar resources:
● No tool available for this specific task or user.
● Food blogs: ○ ALLERGIC LIVING
○ TORTUGA
○ FOOD ALLERGY CANADA
● Resources with barriers to entry
E.g. allergyinside.com
https://foodallergycanada.ca/living-with-allergies/ongoing-allergy-management/managing-in-different-environments/travel/7

Related Vis Work: Zhihua et al. (2019)Geospatial Visualisation of Food Contaminant Distributions
Spatial distribution of sum PCN congeners for locations around the UK;
Figure 1: Spatial distribution of sum PCN congeners for locations around the UK8
Fig 2: PCN congener occurrence
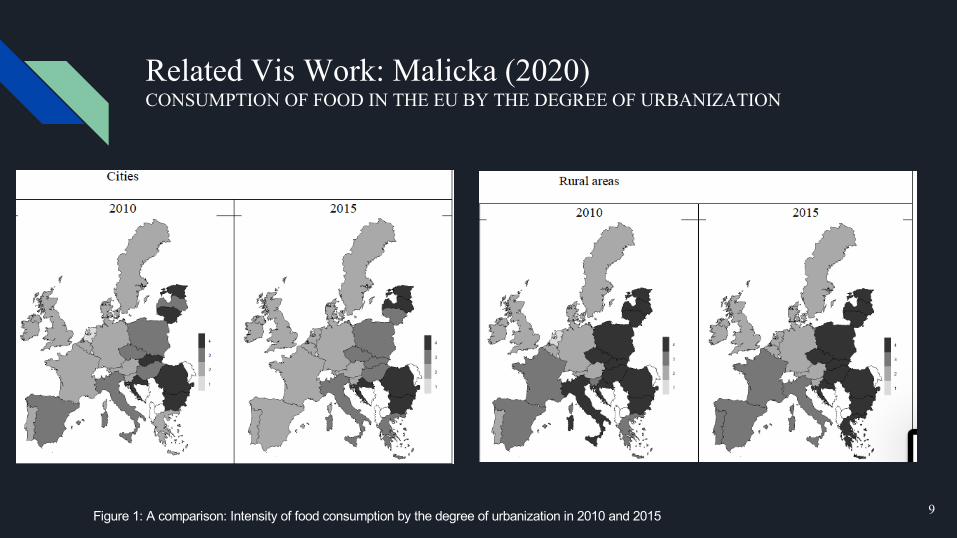
Related Vis Work: Malicka (2020)CONSUMPTION OF FOOD IN THE EU BY THE DEGREE OF URBANIZATION
9Figure 1: A comparison: Intensity of food consumption by the degree of urbanization in 2010 and 2015
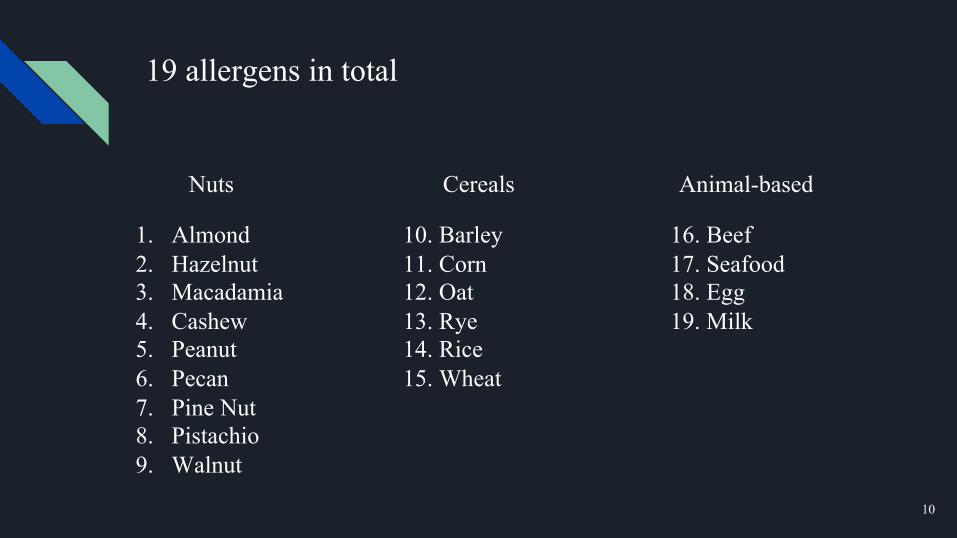
Cereals
10. Barley11. Corn12. Oat13. Rye14. Rice15. Wheat
Nuts
1. Almond2. Hazelnut3. Macadamia4. Cashew5. Peanut6. Pecan7. Pine Nut8. Pistachio9. Walnut
19 allergens in total
Animal-based
16. Beef17. Seafood18. Egg19. Milk
10
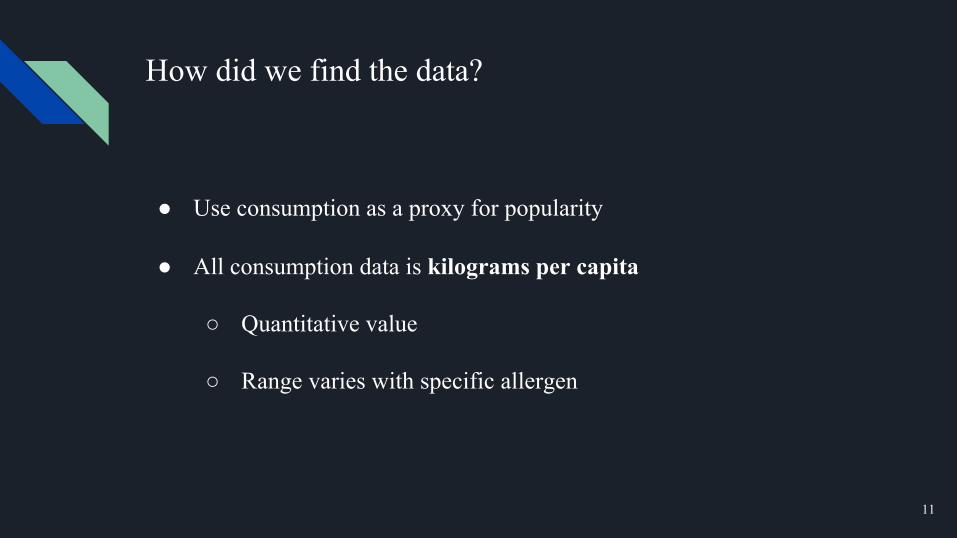
How did we find the data?
● Use consumption as a proxy for popularity
● All consumption data is kilograms per capita
○ Quantitative value
○ Range varies with specific allergen
11

How did we find the data?
● Assembled our own dataset from multiple sources
● Main data source: UN Food and Agriculture Organization (FAO)
○ Usage was “indirect”
● Other data sources: Our World in Data, International Nut & Dried
Fruit
12

Main derived attribute: Prevalence score
● A score from 0 to 1 was given per allergen, per country
○ Function of that country’s consumption relative to the maximum
consumption:
● country_consumption / max_consumption
13

Prevalence score with multiple allergens
● Each allergen’s score is calculated individually
● Scores are aggregated by summation
● Thus, range is [0, N] for N allergens
14
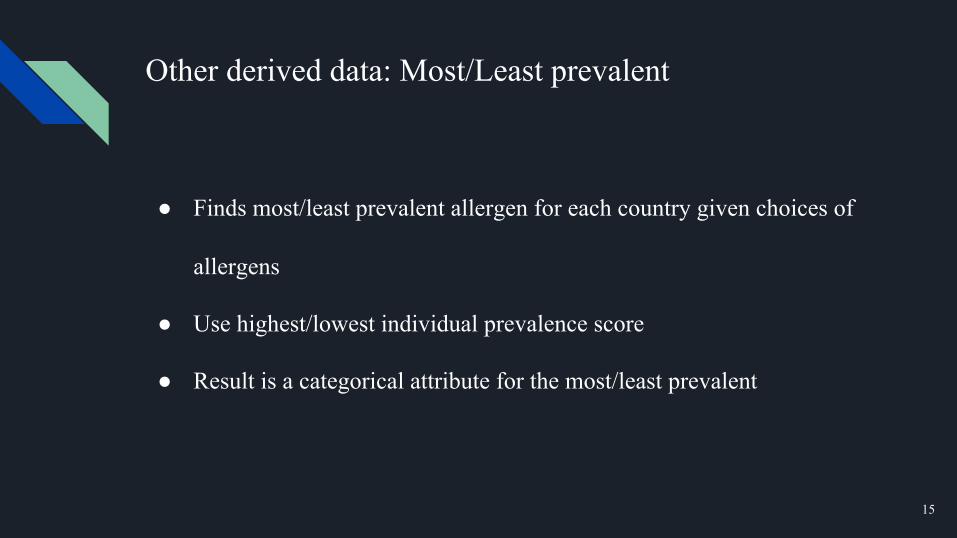
Other derived data: Most/Least prevalent
● Finds most/least prevalent allergen for each country given choices of
allergens
● Use highest/lowest individual prevalence score
● Result is a categorical attribute for the most/least prevalent
15

Solution and Implementation
● Heroku app: Heroku app: allervis.herokupapp.com
● Implementation completely in Python
● Including HTML and CSS
● Pandas and Numpy for data wrangling
● Plotly + Dash for plotting
16

Demo
17

LIMITATIONS AND FURTHER WORK:
● Data:○ Insufficient data for some allergens.○ Missing data for allergens that are not consumed directly.○ Consumption data is not equivalent to allergy prevalence.○ National category erases diversity within nation.
18
LIMITATIONS AND FURTHER WORK:
● Solution:○ Significant lag○ Map and bar chart are not interactive. ○ Too many allergens too many colors.○ Mercator projection advantages northern and larger countries.○ Cartogram not explored.
19

Thank you!
20