almanac & trends 2016 - section 1 - all students
DESCRIPTION
ÂTRANSCRIPT

Section 1 - All Students
The metrics in this section describe the credit and non-credit enrollment of the entire population of students. These metrics include enrollment by demographics such as race/ethnicity, geographic origin, gender, age, and time status.

Section 1 - 12 Section 1 - 13
Definitions:
CREDIT ENROLLMENT refers to the headcount of students on the enrollment census date in the following award levels or categories: Associates, Bachelors, Masters, Doctoral, Diploma (undergraduate, graduate and extension), Credit Certificate, Maintenance of Status, Non-Degree, General Credit, and Visiting students.
Exclusions are: Non-Credit Certificate, Withdraw/Leave students, and Study Abroad and Mobility Out students.
CONTINUING EDUCATION comprises the broad spectrum of alternative learning opportunities - across disciplines, interests, formats and fields - designed for a non-traditional student body. Included are all academic courses and programs, on-site and online, which are accessible to the public at large (children, teens, executives, post-graduates, lifelong learners).
FULL-TIME EQUIVALENT (FTE) is a single calculated value providing a meaningful combination of full-time and part-time students, faculty or staff. In general terms, this is an individual’s “work” divided by a defined amount of “work” performed by a full-time individual.
GENERAL CREDIT STUDENTS are credit-seeking students who are not matriculated in a degree or certificate program at The New School. There is no formal admissions process, and students typically register on a course-by-course basis.
MOBILITY-IN see “VISITING STUDENTS”
MOBILITY-OUT is a student who is matriculated at The New School for a given semester, but is enrolled at an institution outside The New School during that same semester. These students are grouped with degree-seeking students for reporting purposes, but are often not credit-seeking.
NON-CREDIT ENROLLMENT refers to the headcount of students who are enrolled in non-credit certificates or continuing education.
NON-DEGREE STUDENTS are credit-seeking students who are not matriculated in a degree or certificate program at The New School.
Non-Degree students are part of a group which includes Mobility-In and Visiting students.
NON-RESIDENT ALIEN is someone in the U.S. who is neither a U.S. citizen or permanent resident. For the purposes of this year’s Almanac, we are continuing to use this term instead of “international student” because the as-of-census-date reporting of students who are non-U.S. citizens or non-permanent residents is based on visa type.
RACE / ETHNICITY describes groups with which individuals identify themselves as belonging to. The categories do not denote scientific definitions of anthropological origins. They are used to categorize U.S. citizens, resident aliens, and other eligible non-U.S. citizens. Federal reporting requirements have been followed in aggregating and reporting this data.
SITELINE describes a course that has the majority of its delivery online and a minority of its delivery onsite/on campus, making it a hybrid. It is specifically identified this way (rather than “Online, On Campus”) because some external agencies measure these courses in differing ways.
STUDENTS FROM DIFFERENT ETHNIC GROUPS refer to those who identified themselves as Hispanic/Latino, American Indian or Alaska Native, Asian, Black or African American, Native Hawaiian or other Pacific Islander. Also included are those who identified themselves with two or more races.
STUDENT TIME STATUS, denoted as either full-time or part-time, refers to the proportion of time a student is enrolled in a given term, as measured by the number of credits a student is taking. The number of registered credits to be considered full-time or part-time differs for undergraduate and graduate students.
VISITING STUDENTS are matriculated at a different institution, but are enrolled in credit-bearing courses at The New School. Visiting students are part of a group which includes Mobility-In and Non-Degree students. There is an application process for admission.

Section 1 - 14 Section 1 - 15
CREDIT Degree seeking Associate, Bachelors, Masters, Doctoral Diploma & Certificate
Non-degree seeking Continuing Education Non-degree Visiting Student Paris Degree-seeking1
NON-CREDIT Degree seeking Associate, Bachelor, Masters Non-degree seeking Continuing Education Non-Credit & Non-Credit Certificate Associate, Bachelor, Masters
Total Headcount
1 Enrolled in Paris campus and physically attending classes in NYC campus
Table 1. Credit and Non-credit Enrollment
University Summary
2015
10,267
9,993
9,874
119
274
89
82
103
2
2,967
87
2,880
1,554
1,220
106
13,234
2005
9,040
8,556
8,422
134
484
297
93
94
6,567
65
6,502
5,011
1,482
9
15,607
2006
9,128
8,726
8,574
152
402
247
86
69
5,780
85
5,695
4,167
1,516
12
14,908
2007
9,692
9,276
9,138
138
416
253
89
74
5,378
66
5,312
3,933
1,372
7
15,070
2008
10,106
9,700
9,520
180
406
231
97
78
3,986
59
3,927
2,512
1,400
15
14,092
2009
10,471
10,144
10,001
143
327
168
75
84
3,432
52
3,380
2,015
1,358
7
13,903
2010
10,736
10,396
10,251
145
340
157
87
96
3,249
49
3,200
1,812
1,374
14
13,985
2011
10,765
10,452
10,279
173
313
141
77
95
3,037
42
2,995
1,701
1,289
5
13,802
2012
10,406
10,225
10,061
164
181
0
106
75
2,952
54
2,898
1,616
1,280
2
13,358
2013
10,301
10,035
9,895
140
266
91
96
79
2,995
100
2,895
1,503
1,337
55
13,296
2014
10,381
10,084
9,951
133
297
88
68
141
1
2,831
101
2,730
1,366
1,275
89
13,212
Credit and Non-credit Enrollment
Data Interpretation GuideIn accordance with IPEDS (Integrated Postsecondary Education Data System) definitions and standard reporting, certain students may be classified as ‘Degree-seeking and Non-credit’. For example, suppose in Fall 2014 a typical degree-seeking student is enrolled in for-credit course/s at The New School-Paris campus. This student is counted as ‘Degree-seeking and Non-credit’ in the Fall 2014 enrollment report. In addition, due to external reporting guidelines, students enrolled in degree programs at the Paris campus will be counted as non-credit and non-degree, because their degree will be awarded at a branch campus not within the United States. Enrollments were organized in this format to permit direct comparison to publicly available IPEDS data. Members of the campus community may use additional analysis tools and reports available to explore this further.

Section 1 - 16 Section 1 - 17
12,000
10,000
8,000
6,000
4,000
2,000
02005 2006 2007 2008 2009 2010 2011 2012 2013 2014 2015
10,1888,630
4,580
2,603
6,007
2,756
Associate
Bachelor
Masters
Doctoral
Diploma & Certificate
Total
University Summary
Figure 1. Credit and Non-credit: Associate, Bachelors, Masters, Doctoral, Diploma & Certificate
Table 1a. Credit and Non-credit enrollment by Degree Level
Total
Associate
Bachelors
Masters
Doctoral
Diploma & Certificate
Total
Associate, Bachelors, Masters, Doctoral, Diploma & Certificate
Visiting Students
Non-degree
Continuing Education
Non-Credit & Non-Credit Certificate
2015
10,201
811
6,007
2,756
495
132
2015
13,234
10,1881
103
80
1,643
1,220
2005
8,630
736
4,580
2,603
577
134
2005
15,607
8,630
94
93
5,308
1,482
2006
8,823
801
4,747
2,516
607
152
2006
14,908
8,823
69
86
4,414
1,516
2007
9,349
859
5,151
2,603
598
138
2007
15,070
9,349
74
89
4,186
1,372
2008
9,776
960
5,331
2,695
609
181
2008
14,092
9,774
78
97
2,743
1,400
2009
10,203
1,021
5,606
2,883
550
143
2009
13,903
10,203
84
75
2,183
1,358
2010
10,460
999
5,743
2,990
582
146
2010
13,985
10,459
96
87
1,969
1,374
2011
10,499
947
5,816
2,964
599
173
2011
13,802
10,499
95
77
1,842
1,289
2012
10,281
895
5,807
2,847
568
164
2012
13,358
10,281
75
106
1,616
1,280
2013
10,191
866
5,835
2,792
556
142
2013
13,296
10,190
79
96
1,594
1,337
2014
10,275
880
5,866
2,845
551
133
2014
13,212
10,2751
141
67
1,454
1,275
1 Includes Paris degree-seeking

Section 1 - 18 Section 1 - 19
Total Undergraduate
Parsons School of Design Eugene Lang College of Liberal Arts1
Schools of Public EngagementCollege of Performing ArtsContinuing Education
Total Graduate-level
Parsons School of Design The New School for Social ResearchSchools of Public EngagementCollege of Performing ArtsContinuing Education
Total Undergraduate and Graduate-level
Parsons School of Design The New School for Social ResearchEugene Lang College of Liberal ArtsSchools of Public EngagementCollege of Performing ArtsContinuing Education
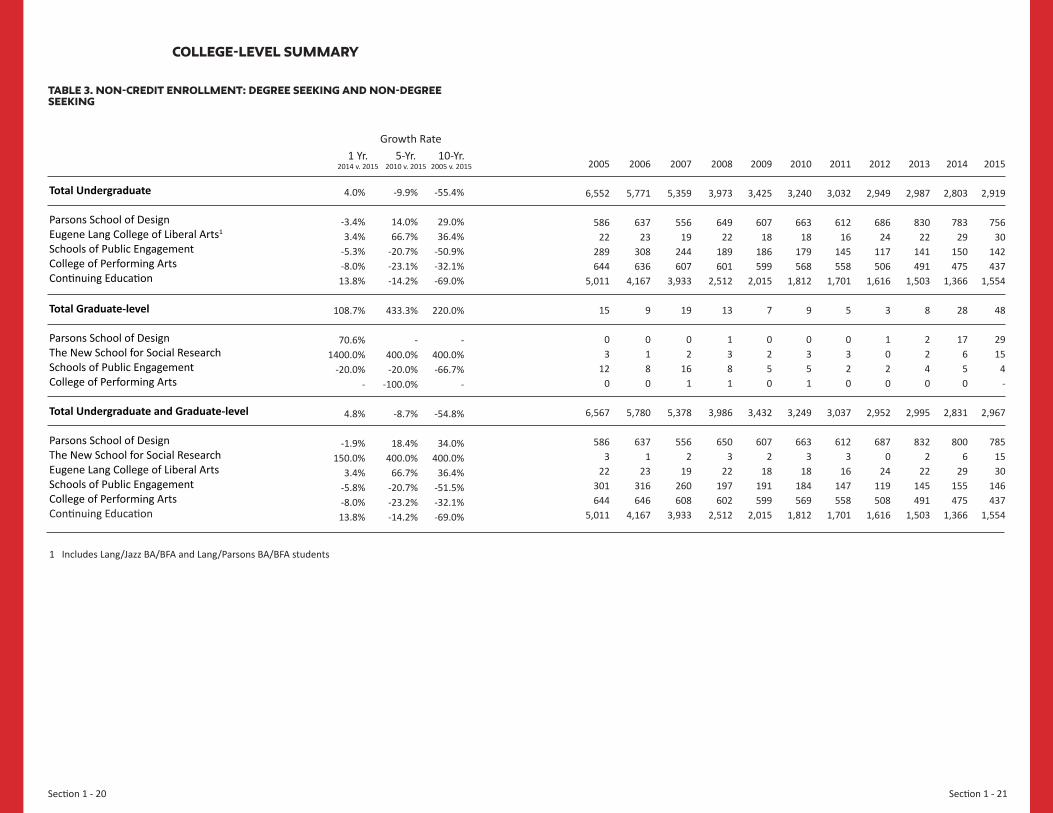
1 Includes Lang/Jazz BA/BFA and Lang/Parsons BA/BFA students
Table 2. Credit Enrollment: Degree seeking and non-degree seeking
Growth Rate
College-level Summary
1%
-1%4%
-4%8%0%
-4%
4%-6%-9%-4%
-
-1%
0%-6%4%
-8%4%1%
-2%
1%0%
-33%24%
-44%
-9%
66%-20%-26%-10%
-
-4%
9%-20%
0%-28%11%
-43%
20%
42%38%
-45%14%
-70%
2%
115%-19%-11%-19%
-
14%
51%-19%38%
-23%1%
-70%
2005
5,720
2,9951,126
829473297
3,320
4301,0901,472
3280
9,040
3,4251,0901,1262,301
801297
2006
5,857
3,1551,188
806461247
3,271
4181,1071,412
3340
9,128
3,5731,1071,1882,218
795247
2007
6,369
3,5431,329
802442253
3,323
4111,1141,468
3300
9,692
3,9541,1141,3292,270
772253
2008
6,645
3,8001,399
738477231
3,461
4251,1211,593
3220
10,106
4,2251,1211,3992,331
799231
2009
6,908
4,0901,487
700463168
3,563
4911,0841,695
3930
10,471
4,5811,0841,4872,395
756168
2010
7,014
4,1991,546
677435157
3,722
5571,0961,776
2930
10,736
4,7561,0961,5462,453
728157
2011
7,043
4,2661,527
656457137
3,722
5851,0881,755
2904
10,765
4,8511,0881,5272,411
747141
2012
6,799
4,2711,471
589468
0
3,607
6591,0181,649
2810
10,406
4,9301,0181,4712,238
7490
2013
6,777
4,2971,468
470451
91
3,524
761945
1,540278
0
10,301
5,058945
1,4682,010
72991
2014
6,844
4,2901,493
472501
88
3,537
885937
1,438277
0
10,381
5,058937
1,4931,910
77888
2015
6,885
4,2531,550
453541
88
3,382
923882
1,311265
1
10,267
5,176882
1,5501,764
80689
1 Yr.2014 v. 2015
5-Yr.2010 v. 2015
10-Yr.2005 v. 2015
Section 1 - 20 Section 1 - 21
Total Undergraduate
Parsons School of Design Eugene Lang College of Liberal Arts1
Schools of Public EngagementCollege of Performing ArtsContinuing Education
Total Graduate-level
Parsons School of Design The New School for Social ResearchSchools of Public EngagementCollege of Performing Arts
Total Undergraduate and Graduate-level
Parsons School of Design The New School for Social ResearchEugene Lang College of Liberal ArtsSchools of Public EngagementCollege of Performing ArtsContinuing Education
1 Includes Lang/Jazz BA/BFA and Lang/Parsons BA/BFA students
Table 3. non-Credit Enrollment: Degree seeking and non-degree seeking
Growth Rate
College-level Summary
2015
2,919
756 30
142 437
1,554
48
29 15
4 -
2,967
785 15 30
146 437
1,554
4.0%
-3.4%3.4%
-5.3%-8.0%13.8%
108.7%
70.6%1400.0%
-20.0%-
4.8%
-1.9%150.0%
3.4%-5.8%-8.0%13.8%
-9.9%
14.0%66.7%
-20.7%-23.1%-14.2%
433.3%
-400.0%-20.0%
-100.0%
-8.7%
18.4%400.0%
66.7%-20.7%-23.2%-14.2%
-55.4%
29.0%36.4%
-50.9%-32.1%-69.0%
220.0%
-400.0%-66.7%
-
-54.8%
34.0%400.0%
36.4%-51.5%-32.1%-69.0%
2005
6,552
58622
289644
5,011
15
03
120
6,567
5863
22301644
5,011
2006
5,771
63723
308636
4,167
9
0180
5,780
6371
23316646
4,167
2007
5,359
55619
244607
3,933
19
02
161
5,378
5562
19260608
3,933
2008
3,973
64922
189601
2,512
13
1381
3,986
6503
22197602
2,512
2009
3,425
60718
186599
2,015
7
0250
3,432
6072
18191599
2,015
2010
3,240
66318
179568
1,812
9
0351
3,249
6633
18184569
1,812
2011
3,032
61216
145558
1,701
5
0320
3,037
6123
16147558
1,701
2012
2,949
68624
117506
1,616
3
1020
2,952
6870
24119508
1,616
2013
2,987
83022
141491
1,503
8
2240
2,995
8322
22145491
1,503
2014
2,803
78329
150475
1,366
28
17650
2,831
8006
29155475
1,366
1 Yr.2014 v. 2015
5-Yr.2010 v. 2015
10-Yr.2005 v. 2015

Section 1 - 22 Section 1 - 23
Definition
FULL-TIME EQUIVALENT (FTE) is a single calculated value providing a meaningful combination of full-time and part-time students, faculty or staff. In general terms, this is an individual’s “work” divided by a defined amount of “work” performed by a full-time individual. While there are many acceptable methods for the calculation of FTE, the method used throughout the Almanac is 1 full-time student equals 1 FTE. 1 part-time student equals 1/3 FTE.
CREDIT AND NON-CREDIT ENROLLMENT BY HEADCOUNT AND FULL-TIME EQUIVALENT (FTE)
University Summary
Table 4. Headcount and Full-time Equivalent (FTE)
Table 5. Undergraduate and graduate-level Headcount and Full-time Equivalent (FTE)
HeadcountFull-time (A)Part-time
FTE of Part-time1 (B)
Total Full-time Equivalent (FTE) (A+B)
1 Part-time headcount multiplied by 1/3
HeadcountUndergraduateGraduate-level
FTEUndergraduateGraduate-level
2015
13,2348,7094,525
1,508
10,217
2005
15,6076,9068,701
2,900
9,806
2006
14,9087,1277,781
2,593
9,720
2007
15,0707,6327,438
2,479
10,111
2008
14,0927,8846,208
2,069
9,953
2009
13,9038,3355,568
1,856
10,191
2010
13,9858,7145,271
1,757
10,471
2011
13,8028,7505,052
1,684
10,434
2012
13,3588,4924,866
1,622
10,114
2013
13,2968,5624,734
1,578
10,140
2014
13,2128,7484,464
1,488
10,236
2014
13,2129,6523,560
10,2367,2792,957
2015
13,2349,8043,430
10,2177,3512,866

Section 1 - 24 Section 1 - 25
College-level Summary
Table 6. Undergraduate Headcount and Full-time-Equivalent (FTE)
The New School Parsons School of Design The New School for Social ResearchSchools of Public EngagementEugene Lang College of Liberal ArtsCollege of Performing ArtsContinuing Education
The New School Parsons School of Design The New School for Social ResearchSchools Public EngagementEugene Lang College of Liberal ArtsCollege of Performing ArtsContinuing Education
FALL 2014
FALL 2015
Headcount Full-time Equivalent (FTE)
3,5591,103
5401
99501
1,450
Part-time(B)
3 3,679 1,111
- 381
86 460
1,641
7,279 4,338
2 355
1,456 642 487
Total FTE(E)=(A)+(D)
7,351 4,268
- 341
1,523 671 548
9,6525,073
5622
1,522976
1,454
Total(C)=(A)+(B)
9,804 5,009
- 595
1,580 978
1,642
6,0933,970
0221
1,423475
4
Full-time(A)
6,125 3,898
- 214
1,494 518
1
1,186 368
2 134
33 167 483
Part-time(D)=(B)*0.33
1,226 370
- 127
29 153 547
Note: Includes credit and non-credit enrollment

Section 1 - 26 Section 1 - 27
college-level Summary
Table 7. Graduate-level Headcount and Full-time Equivalent (FTE)
The New School Parsons School of DesignThe New School for Social ResearchSchools of Public EngagementCollege of Performing Arts
The New School Parsons School of DesignThe New School for Social ResearchSchools of Public EngagementCollege of Performing ArtsContinuing Education
FALL 2014
FALL 2015
Headcount Full-time Equivalent (FTE)
905 55
273 574
3
Part-time(B)
846 69
275 500
1 1
2,957 865 756
1,060 275
Total FTE(E)=(A)+(D)
2,866 906 714 982 264
0
3,560 902 938
1,443 277
Total(C)=(A)+(B)
3,430 952 897
1,315 265
1
2,655 847 665 869 274
Full-time(A)
2,584 883 622 815 264
-
302 18 91
191 1
Part-time(D)=(B)*0.33
282 23 92
167 0 0
Note: Includes credit and non-credit enrollment
Section 1 - 28 Section 1 - 29
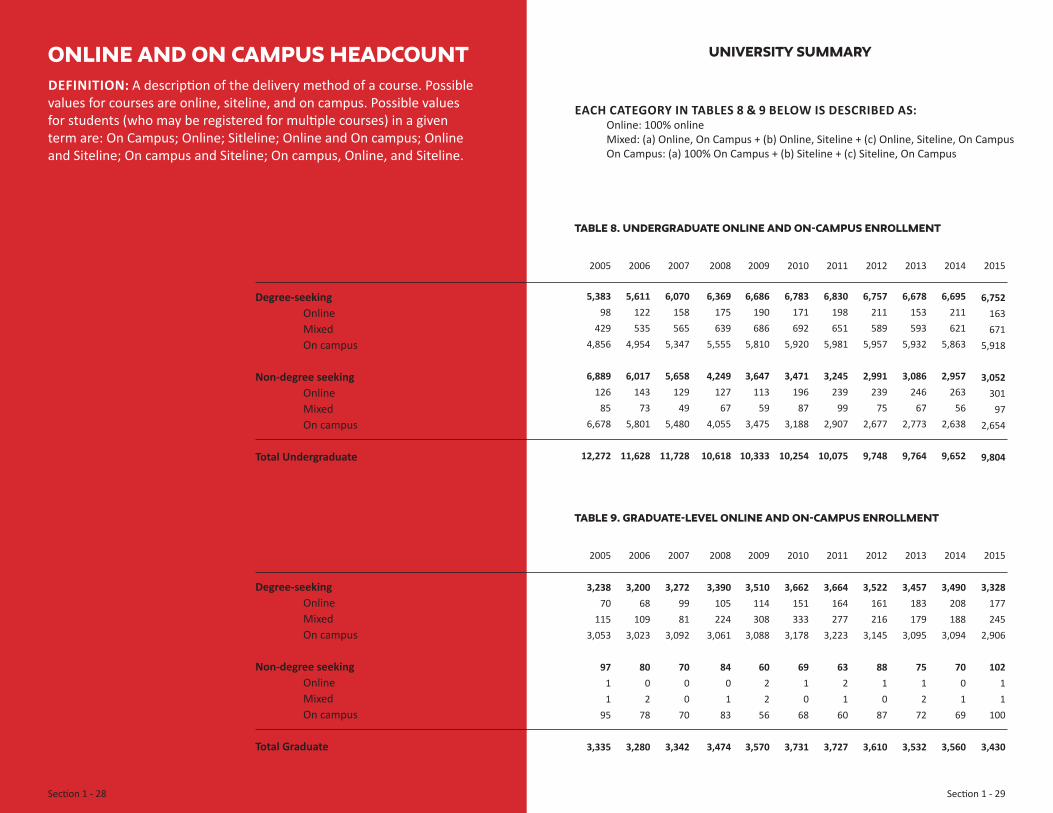
DEFINITION: A description of the delivery method of a course. Possible values for courses are online, siteline, and on campus. Possible values for students (who may be registered for multiple courses) in a given term are: On Campus; Online; Sitleline; Online and On campus; Online and Siteline; On campus and Siteline; On campus, Online, and Siteline.
ONLINE and ON CAMPUS HEADCOUNT University Summary
EACH CATEGORY IN TABLES 8 & 9 BELOW IS DESCRIBED AS: Online: 100% online Mixed: (a) Online, On Campus + (b) Online, Siteline + (c) Online, Siteline, On CampusOn Campus: (a) 100% On Campus + (b) Siteline + (c) Siteline, On Campus
Table 8. Undergraduate Online and On-campus Enrollment
Table 9. Graduate-level Online and On-campus Enrollment
Degree-seeking Online Mixed On campus Non-degree seeking Online Mixed On campus Total Undergraduate
Degree-seeking Online Mixed On campus Non-degree seeking Online Mixed On campus Total Graduate
2015
6,752163671
5,918
3,052301
972,654
9,804
2015
3,328177245
2,906
10211
100
3,430
2005
5,38398
4294,856
6,889126
856,678
12,272
2005
3,23870
1153,053
9711
95
3,335
2006
5,611122535
4,954
6,017143
735,801
11,628
2006
3,20068
1093,023
8002
78
3,280
2007
6,070158565
5,347
5,658129
495,480
11,728
2007
3,2729981
3,092
7000
70
3,342
2008
6,369175639
5,555
4,249127
674,055
10,618
2008
3,390105224
3,061
8401
83
3,474
2009
6,686190686
5,810
3,647113
593,475
10,333
2009
3,510114308
3,088
6022
56
3,570
2010
6,783171692
5,920
3,471196
873,188
10,254
2010
3,662151333
3,178
6910
68
3,731
2011
6,830198651
5,981
3,245239
992,907
10,075
2011
3,664164277
3,223
6321
60
3,727
2012
6,757211589
5,957
2,991239
752,677
9,748
2012
3,522161216
3,145
8810
87
3,610
2013
6,678153593
5,932
3,086246
672,773
9,764
2013
3,457183179
3,095
7512
72
3,532
2014
6,695211621
5,863
2,957263
562,638
9,652
2014
3,490208188
3,094
7001
69
3,560

Section 1 - 30 Section 1 - 31
University Summary
Table 10. Undergraduate Online Enrollment (Headcount)
Table 11. Graduate-level Online Enrollment (Headcount)
Degree-seeking Parsons School of Design Eugene Lang College of Liberal Arts Schools of Public Engagement Non-degree seeking Parsons School of Design Schools of Public Engagement College of Performing Arts Continuing Education Total Undergraduate
Degree-seeking Parsons School of Design Schools of Public Engagement New School for Social Research Non-degree seeking Schools of Public Engagement Continuing Education Total Graduate-level
2005
9842
92
1262319
084
224
2005
700
700
110
71
2006
12252
115
1433123
089
265
2006
670
671
000
67
2007
15813
2143
1292
180
109
287
2007
990
990
000
99
2008
17535
2138
1274
220
101
302
2008
1050
1050
000
105
2009
19061
2127
1134
200
89
303
2009
1140
1140
220
116
2010
17172
495
1961870
0108
367
2010
1510
1510
110
152
2011
19883
3112
23915
1030
121
437
2011
1640
1640
211
166
2012
21191
6114
2396
1271
105
450
2012
16121
1400
110
162
2013
15374
673
24612
1460
88
399
2013
18343
1400
110
184
2014
21187
5119
26314
1620
87
474
2015
16377
482
301161
111
128
464
2014
20860
1480
000
208
2015
17756
1210
110
178

Section 1 - 32 Section 1 - 33
DEFINITION: Students from different ethnic groups refer to those who identified themselves as Hispanic/Latino, American Indian or Alaska Native, Asian, Black or African American, Native Hawaiian or other Pacific Islander. Also included are those who identified themselves with two or more races.
CREDIT AND NON-CREDIT ENROLLMENT BY ETHNICITY AND GEOGRAPHIC ORIGIN
University Summary
Table 12. Credit and Non-credit Enrollment by Ethnicity and Geographic Origin
Figure 2. Credit and Non-credit Enrollment by Ethnicity and Geographic Origin (%)
Non-Resident AliensU.S. Citizens
Ethnic GroupsWhiteNot Reported
Non-Resident AliensU.S. Citizens
Ethnic GroupsWhiteNot Reported
2015
3,647
3,0153,6512,921
13,234
2015
27.6
22.827.622.1
100%
2005
1,995
2,3494,0387,225
15,607
2005
12.8
15.125.946.3
100%
2006
2,095
2,3994,0096,405
14,908
2006
14.1
16.126.943.0
100%
2007
2,210
2,5674,1966,097
15,070
2007
14.7
17.027.840.5
100%
2008
2,333
2,8174,3244,618
14,092
2008
16.6
20.030.732.8
100%
2009
2,392
2,9894,4534,069
13,903
2009
17.2
21.532.029.3
100%
2010
2,609
2,8344,5783,964
13,985
2010
18.7
20.332.728.3
100%
2011
2,823
2,9324,6183,429
13,802
2011
20.5
21.233.524.8
100%
2012
2,970
2,9754,3633,050
13,358
2012
22.2
22.332.722.8
100%
2013
3,243
2,9874,1062,960
13,296
2013
24.4
22.530.922.3
100%
2014
3,502
3,0413,8262,843
13,212
2014
26.5
23.029.021.5
100%
100.0
80.0
60.0
40.0
20.0
0.02005 2006 2007 2008 2009 2010 2011 2012 2013 2014 2015
46.3
22.1
25.9
27.6
15.1
22.8
12.827.6
Non-Resident Aliens Not ReportedEthnic Groups White

Section 1 - 34 Section 1 - 35
University Summary
Table 12a. Credit and Non-credit Enrollment of Different Ethnic Groups
Table 12b. Credit and Non-credit Enrollment of Different Ethnic Groups (%)
Hispanic or LatinoNon-Hispanic
American Indian or Alaska nativeAsianBlack or African AmericanNative Hawaiian or Other Pacific IslanderTwo or More Races
Hispanic or LatinoNon-Hispanic
American Indian or Alaska nativeAsianBlack or African AmericanNative Hawaiian or Other Pacific IslanderTwo or More Races
2015
1,145
9822686
10343
3,015
2015
38.0
0.327.322.8
0.311.4
100%
2005
580
23839591
0316
2,349
2005
24.7
1.035.725.2
0.013.5
100%
2006
590
29863550
0367
2,399
2006
24.6
1.236.022.9
0.015.3
100%
2007
643
28919565
0412
2,567
2007
25.0
1.135.822.0
0.016.0
100%
2008
713
371,000
5640
503
2,817
2008
25.3
1.335.520.0
0.017.9
100%
2009
830
441,008
5970
510
2,989
2009
27.8
1.533.720.0
0.017.1
100%
2010
940
371,029
61619
193
2,834
2010
33.2
1.336.321.7
0.76.8
100%
2011
965
241,035
61722
269
2,932
2011
32.9
0.835.321.0
0.89.2
100%
2012
1,032
18975634
16300
2,975
2012
34.7
0.632.821.3
0.510.1
100%
2013
1,002
10915684
12364
2,987
2013
33.5
0.330.622.9
0.412.2
100%
2014
1,092
12876685
7369
3,041
2014
35.9
0.428.822.5
0.212.1
100%

Section 1 - 36 Section 1 - 37
College-level Summary
Table 13. Credit and Non-credit Enrollment by Ethnicity and Geographic Origin, Fall 2015
Table 13a. Credit and Non-credit Enrollment by Ethnicity and Geographic Origin, Fall 2015 (%)
Continuing Education
Continuing Education
Schools of Public
Engagement
Schools of Public
Engagement
The New School of Social
Research
The New School of Social
Research
Parsons School of
Design
Parsons School of
Design
Eugene Lang College of
Liberal Arts
Eugene Lang College of
Liberal Arts
College of Performing
Arts
College of Performing
Arts
Total
Total
Non-Resident AliensU.S. Citizens
Ethnic GroupsWhiteNot Reported
Non-Resident Aliens U.S. Citizens
Ethnic GroupsWhiteNot Reported
342
636748184
1,910
17.9
33.339.2
9.6
100%
286
142372
97
897
31.9
15.841.510.8
100%
2,484
1,4271,323
727
5,961
41.7
23.922.212.2
100%
129
574743134
1,580
8.2
36.347.0
8.5
100%
21.5
15.027.635.9
100%
267
187343446
1,243
3,647
3,0153,6512,921
13,234
27.6
22.827.622.1
100%
139
49122
1,333
1,643
8.5
3.07.4
81.1
100%
Section 1 - 38 Section 1 - 39
College-level Summary
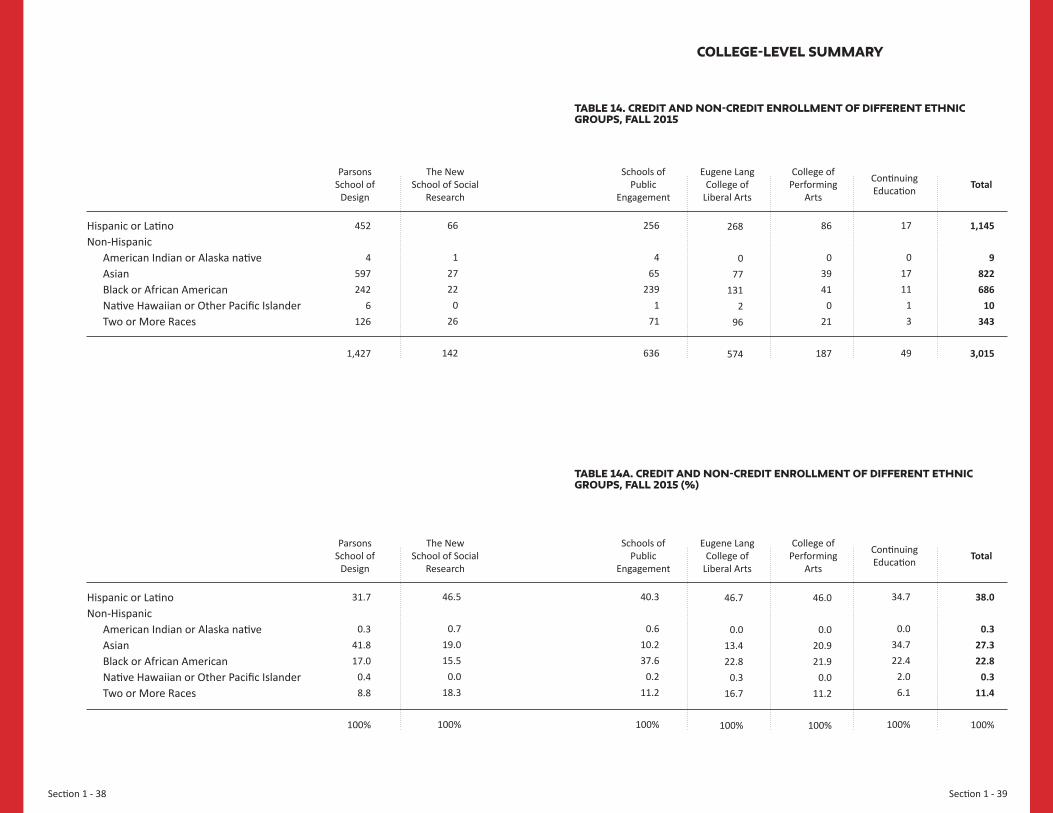
Table 14. Credit and Non-credit Enrollment of Different Ethnic Groups, Fall 2015
Table 14a. Credit and Non-credit Enrollment of Different Ethnic Groups, Fall 2015 (%)
256
465
2391
71
636
40.3
0.610.237.6
0.211.2
100%
66
12722
026
142
46.5
0.719.015.5
0.018.3
100%
452
4597242
6126
1,427
31.7
0.341.817.0
0.48.8
100%
268
077
1312
96
574
46.7
0.013.422.8
0.316.7
100%
46.0
0.020.921.9
0.011.2
100%
86
03941
021
187
1,145
9822686
10343
3,015
38.0
0.327.322.8
0.311.4
100%
17
01711
13
49
34.7
0.034.722.4
2.06.1
100%
Continuing Education
Continuing Education
Schools of Public
Engagement
Schools of Public
Engagement
The New School of Social
Research
The New School of Social
Research
Parsons School of
Design
Parsons School of
Design
Eugene Lang College of
Liberal Arts
Eugene Lang College of
Liberal Arts
College of Performing
Arts
College of Performing
Arts
Total
Total
Hispanic or LatinoNon-Hispanic
American Indian or Alaska nativeAsianBlack or African AmericanNative Hawaiian or Other Pacific IslanderTwo or More Races
Hispanic or LatinoNon-Hispanic
American Indian or Alaska nativeAsianBlack or African AmericanNative Hawaiian or Other Pacific IslanderTwo or More Races

Section 1 - 40 Section 1 - 41
University Summary
Table 15. Credit and non-credit enrollment: Undergraduate by Degree/Award Level, Ethnicity and Geographic Origin, Fall 2015
Table 15a. Credit and non-credit enrollment: graduate-level by Degree/Award Level, Ethnicity and Geographic Origin, Fall 2015
Diploma
DoctoralMasters
Associate
Graduate Certificate
Bachelor
Diploma
Non-credit Certificate, Non-degree
Non-degree
Diploma, Associate, Bachelor
Masters, Doctoral,
Certificate and Diploma
Total
Total
Non-Resident Aliens U.S. Citizens
Hispanic or LatinoNon-Hispanic
American Indian or Alaska NativeAsianBlack or African AmericanNative Hawaiian or Other Pacific IslanderWhiteTwo or More Races
Not Reported
Non-Resident Aliens U.S. Citizens
Hispanic or LatinoNon-Hispanic
American Indian or Alaska NativeAsianBlack or African AmericanNative Hawaiian or Other Pacific IslanderWhiteTwo or More Races
Not Reported
8
2
0110104
17
169
30
1 16 24
- 201
17 37
495
923
273
2 125 234
2 1,000
69 128
2,756
372
53
06245
3226
1337
811
18
2
- 1 6 -
20 - 3
50
1,854
745
6579356
41,996
234233
6,007
30
2
- 6 1 -
11 1 1
52
2,234
800
6642402
72,223
247274
6,835
1,140
307
3 148 265
2 1,232
87 169
3,353
254
35
03119
1183
92,437
2,969
19
3
- 1 - -
13 -
41
77
2,4880
83506
673421
82,406
2562,711
9,804
1,159
310
3 149 265
2 1,245
87 210
3,430
DEGREE/AWARDS LEVEL ENROLLMENT BY ETHNICITY AND GEOGRAPHIC ORIGIN
Section 1 - 42 Section 1 - 43
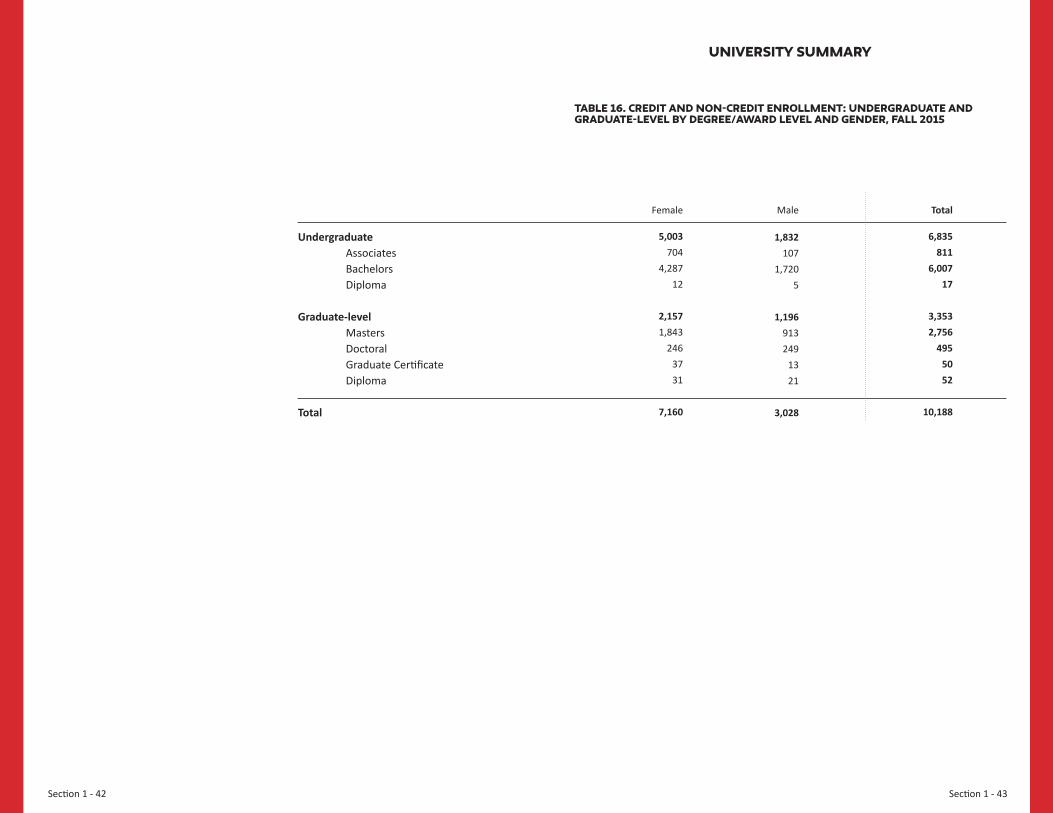
University Summary
Table 16. Credit and non-credit Enrollment: Undergraduate and Graduate-level by Degree/Award Level and Gender, Fall 2015
Female Male Total
Undergraduate Associates Bachelors Diploma
Graduate-level Masters Doctoral Graduate Certificate Diploma
Total
5,003 704
4,287 12
2,157 1,843
246 37 31
7,160
1,832 107
1,720 5
1,196 913 249
13 21
3,028
6,835 811
6,007 17
3,353 2,756
495 50 52
10,188

Section 1 - 44 Section 1 - 45
College-level Summary
Table 17. Credit and non-credit Enrollment: Undergraduate and Graduate-level by Gender and Time Status, Fall 2015
Female Full-timeMale Part-timeTotal
Undergraduate - Diploma, Associate, Bachelor (A)
Parsons School of Design Eugene Lang College of Liberal Arts1
Schools of Public EngagementCollege of Performing Arts Graduate-level - Masters, Doctoral, Diploma, Graduate Certificate (B)
Parsons School of Design The New School for Social ResearchSchools of Public EngagementCollege of Performing Arts
Total Undergraduate and Graduate-level (A+B)
Parsons School of Design The New School for Social ResearchEugene Lang College of Liberal ArtsSchools of Public EngagementCollege of Performing Arts
1 Includes Lang/Jazz BA/BFA and Lang/Parsons BA/BFA
5,003
3,371 1,122
291 219
2,157
679 418 906 154
7,160
4,050 418
1,122 1,197
373
6,028
3,835 1,466
213 514
2,566
878 610 814 264
8,594
4,713 610
1,466 1,027
778
1,832
943 414 162 313
1,196
268 416 401 111
3,028
1,211 416 414 563 424
807
479 70
240 18
787
69 224 493
1
1,594
548 224
70 733
19
6,835
4,314 1,536
453 532
3,353
947 834
1,307 265
10,188
5,261 834
1,536 1,760
797

Section 1 - 46 Section 1 - 47
College-level Summary
Table 17a. Credit and non-credit Enrollment: Undergraduate and Graduate-level by Gender and Time Status, Fall 2015 (%)
Female Full-timeMale Part-timeTotal
Undergraduate - Diploma, Associate, Bachelor (A)
Parsons School of Design Eugene Lang College of Liberal Arts1
Schools of Public EngagementCollege of Performing Arts
Graduate-level - Masters, Doctoral, Diploma and Certificate (B)
Parsons School of Design The New School for Social ResearchSchools of Public EngagementCollege of Performing Arts
Total Undergraduate and Graduate-level (A+B)
Parsons School of Design The New School for Social ResearchEugene Lang College of Liberal ArtsSchools of Public EngagementCollege of Performing Arts
1 Includes Lang-Jazz BA/BFA and Lang-Parsons BA/BFA
73.2
78.173.064.241.2
64.3
71.750.169.358.1
70.3
77.050.173.068.046.8
88.2
88.995.447.096.6
76.5
92.773.162.399.6
84.4
89.673.195.458.497.6
26.8
21.927.035.858.8
35.7
28.349.930.741.9
29.7
23.049.927.032.053.2
11.8
11.14.6
53.03.4
23.5
7.326.937.7
0.4
15.6
10.426.9
4.641.6
2.4
100%
100%
100%

Section 1 - 48 Section 1 - 49
College-level Summary
Table 18. CREDIT and non-credit: Degree and Non-degree by Geographic Origin (Bachelor, Masters, Doctoral, Associate, Diploma and Certificates), Fall 2015
Other U.S. States Not ReportedTotalNon-Resident
Aliens New York
Undergraduate - Diploma, Associate, Bachelor (A)
Parsons School of Design Eugene Lang College of Liberal Arts1
Schools of Public EngagementCollege of Performing Arts
Graduate-level - Masters, Doctoral, Diploma and Certificate (B)
Parsons School of Design The New School for Social ResearchSchools of Public EngagementCollege of Performing Arts
Total Undergraduate and Graduate-level (A+B)
Parsons School of Design The New School for Social ResearchEugene Lang College of Liberal ArtsSchools of Public EngagementCollege of Performing Arts
1 Includes Lang-Jazz BA/BFA and Lang-Parsons BA/BFA
3,146
1,7181,004
141283
1,192
286280515111
4,338
2,004280
1,004656394
87
341043
0
131
137936
3
218
47791079
3
6,835
4,314 1,536
453 532
3,353
947 834
1,307 265
10,188
5,261 834
1,536 1,760
797
2,234
1,906 116 56
156
1,140
503 273 259 105
3,374
2,409 273 116 315 261
1,368
656 406 213
93
890
145 202 497
46
2,258
801 202 406 710 139

Section 1 - 50 Section 1 - 51
College-level Summary
Table 18a. CREDIT and non-credit: Degree and Non-degree by Geographic Origin (Bachelor, Masters, Doctoral, Associate, Diploma and Certificates), Fall 2015 (%)
Undergraduate - Diploma, Associate, Bachelor (A)
Parsons School of Design Schools of Public EngagementEugene Lang College of Liberal Arts1
College of Performing Arts
Graduate-level - Masters, Doctoral, Diploma and Certificate (B)
Parsons School of Design The New School for Social ResearchSchools of Public EngagementCollege of Performing Arts
Total Undergraduate and Graduate-level (A+B)
Parsons School of Design The New School for Social ResearchEugene Lang College of Liberal ArtsSchools of Public EngagementCollege of Performing Arts
1 Includes Lang-Jazz BA/BFA and Lang-Parsons BA/BFA
46%
40%65%31%53%
36%
30%34%39%42%
43%
38%34%65%37%49%
1%
1%1%9%0%
4%
1%9%3%1%
2%
1%9%1%4%0%
100%
100%
100%
33%
44%8%
12%29%
34%
53%33%20%40%
33%
46%33%
8%18%33%
20%
15%26%47%17%
27%
15%24%38%17%
22%
15%24%26%40%17%
Other U.S. States Not ReportedTotalNon-Resident
Aliens New York
Section 1 - 52 Section 1 - 53
University Summary University Summary
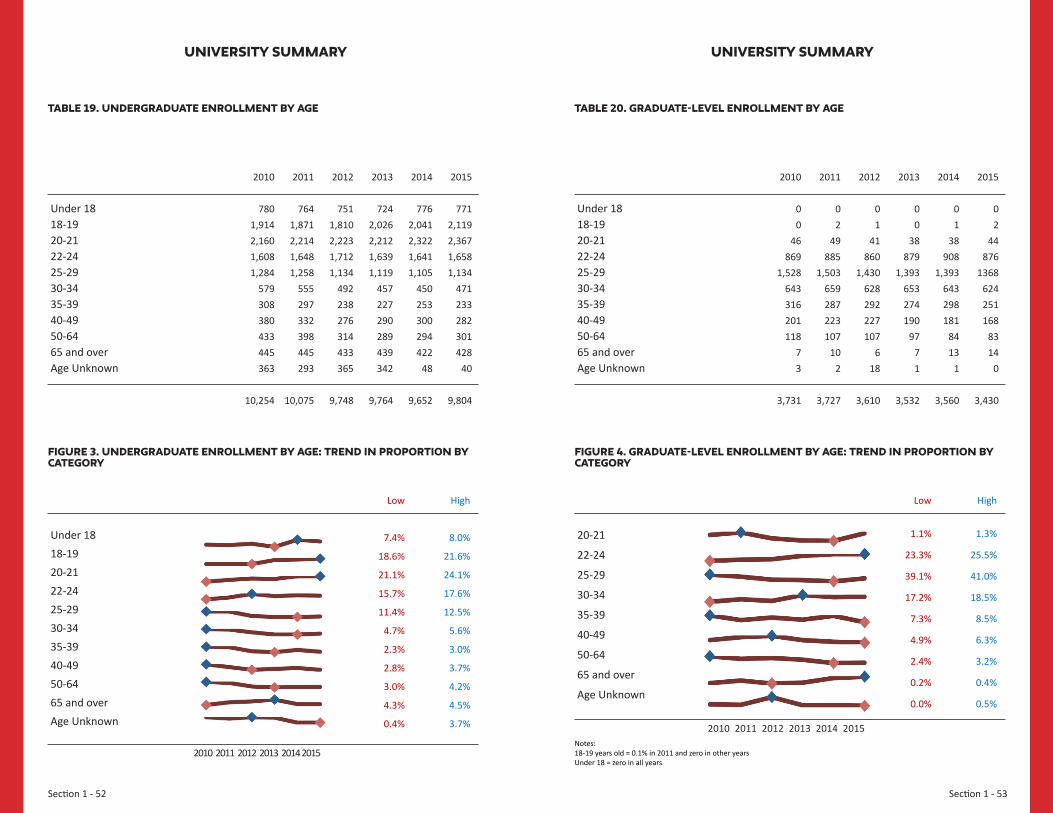
Table 19. Undergraduate Enrollment by Age Table 20. Graduate-level Enrollment by Age
Figure 3. Undergraduate Enrollment by age: Trend in Proportion by category
Figure 4. Graduate-level Enrollment by Age: Trend in proportion by category
Under 18 18-1920-2122-2425-2930-3435-3940-4950-6465 and overAge Unknown
Under 18 18-1920-2122-2425-2930-3435-3940-4950-6465 and overAge Unknown
Under 18 18-1920-2122-2425-2930-3435-3940-4950-6465 and overAge Unknown
20-21
22-24
25-29
30-34
35-39
40-49
50-64
65 and over
Age Unknown
2015
02
44876
1368624251168
8314
0
3,430
2010
7801,9142,1601,6081,284
579308380433445363
10,254
2010
00
46869
1,528643316201118
73
3,731
2011
7641,8712,2141,6481,258
555297332398445293
10,075
2011
02
49885
1,503659287223107
102
3,727
2012
7511,8102,2231,7121,134
492238276314433365
9,748
2012
0 1
41860
1,430628292227107
618
3,610
2013
7242,0262,2121,6391,119
457227290289439342
9,764
2013
00
38879
1,393653274190
9771
3,532
2014
7762,0412,3221,6411,105
450253300294422
48
9,652
2015
771 2,119 2,367 1,658 1,134
471 233 282 301 428
40
9,804
2014
01
38908
1,393643298181
8413
1
3,560
Low
7.4%
18.6%
21.1%
15.7%
11.4%
4.7%
2.3%
2.8%
3.0%
4.3%
0.4%
Low
1.1%
23.3%
39.1%
17.2%
7.3%
4.9%
2.4%
0.2%
0.0%
High
8.0%
21.6%
24.1%
17.6%
12.5%
5.6%
3.0%
3.7%
4.2%
4.5%
3.7%
High
1.3%
25.5%
41.0%
18.5%
8.5%
6.3%
3.2%
0.4%
0.5%
2010 2011 2012 2013 2014 2015
2010 2011 2012 2013 2014 2015Notes:18-19 years old = 0.1% in 2011 and zero in other yearsUnder 18 = zero in all years