almost boring: residential housing in 2015 dr. jim gilkeson, cfa cfa society of orlando april 9,...
TRANSCRIPT
Almost Boring:Residential Housing in 2015
DR. JIM GILKESON, CFA
CFA SOCIETY OF ORLANDO
APRIL 9, 2015

Jim G
ilkeson, PhD
, CFA
2Where We’ve Been
2005: Is the Sky Falling?
2007: What a Difference a Year Makes
2008: Where Do We Go From Here?
2009: Reading the Tea Leaves
2010: The Good, the Bad, and the Ugly
2012: Have We Hit Bottom?
2013: (Very) Cautious Optimism
2014: Will Slow & Steady Win the Race?
2015: Almost Boring
4/9/2015

Jim G
ilkeson, PhD
, CFA
3What We’ll Talk About Today
Price
Volume (Sales)
Delinquency/Foreclosure
Financing
Supply
Demand
Wrap Up
4/9/2015

Jim G
ilkeson, PhD
, CFA
4Prices (constant quality)4/9/2015
1999 2002 2005 2008 2011 2014$ 150,000
$ 175,000
$ 200,000
$ 225,000
$ 250,000
$ 275,000
$ 300,000
$ 325,000
$ 350,000
U.S. South

Jim G
ilkeson, PhD
, CFA
5Median Home Prices
New homes Existing homes
4/9/2015
1999 2002 2005 2008 2011 2014100.0
120.0
140.0
160.0
180.0
200.0
220.0
240.0
260.0
280.0
300.0
U.S.
South
1999 2002 2005 2008 2011 2014100.0
120.0
140.0
160.0
180.0
200.0
220.0
240.0
260.0
280.0
300.0
U.S.
South
Jim G
ilkeson, PhD
, CFA
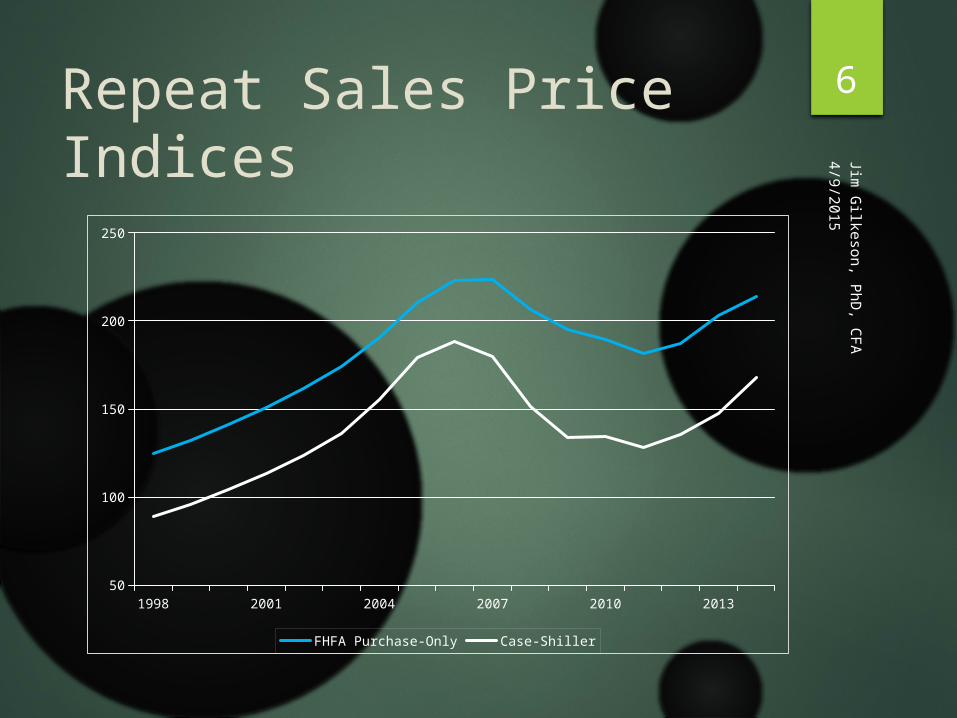
6Repeat Sales Price Indices4/9/2015
1998 2001 2004 2007 2010 201350
100
150
200
250
FHFA Purchase-Only Case-Shiller

Jim G
ilkeson, PhD
, CFA
7FHFA HPI (repeat sales)4/9/2015
2001 2004 2007 2010 2014100
150
200
250
300
350
US FL Orlando

Jim G
ilkeson, PhD
, CFA
8Florida Price Appreciation4/9/2015MSA 1-year 5-year
Miami 11.80% 25.02%
Ft Lauderdale 9.48% 32.29%
Jacksonville 8.71% 3.88%
Ft Myers 8.19% 31.74%
Tampa/St. Pete 7.41% 15.10%
West Palm Beach 7.26% 27.52%
Orlando 5.66% 9.17%
Sarasota 5.10% 19.25%
FLORIDA 7.85% 17.32%

Jim G
ilkeson, PhD
, CFA
9Sales Volume (US)4/9/2015
1998 2001 2004 2007 2010 20130
1000
2000
3000
4000
5000
6000
7000
8000
0
200
400
600
800
1000
1200
1400
existing
new
Jim G
ilkeson, PhD
, CFA
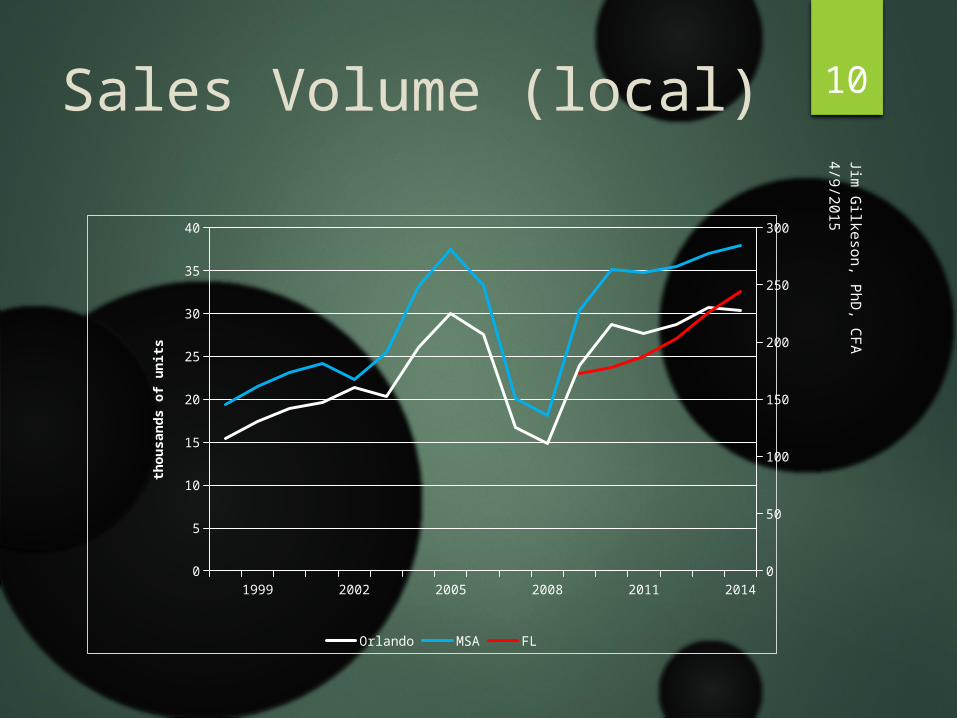
10Sales Volume (local)4/9/2015
1999 2002 2005 2008 2011 20140
5
10
15
20
25
30
35
40
0
50
100
150
200
250
300
Orlando MSA FL
tho
usa
nd
s o
f u
nit
s
Jim G
ilkeson, PhD
, CFA
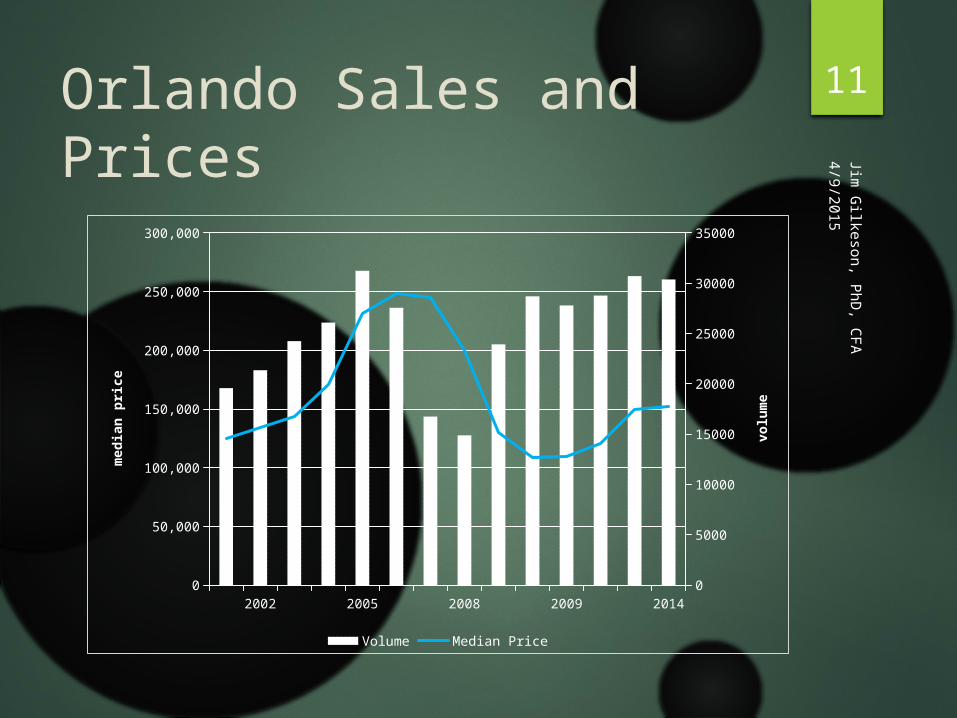
11Orlando Sales and Prices4/9/2015
2002 2005 2008 2009 20140
50,000
100,000
150,000
200,000
250,000
300,000
0
5000
10000
15000
20000
25000
30000
35000
Volume Median Price
med
ian
pri
ce
volu
me

Jim G
ilkeson, PhD
, CFA
12Bank Problem Loans:Federal Reserve Data 4/9/2015
1999 2002 2005 2008 2011 20140
2
4
6
8
10
12
Charge Offs Delinquencies
Rat
e (%
)

Jim G
ilkeson, PhD
, CFA
13Mortgage Delinquencies:U.S. banks (OCC) 4/9/2015
2008 2009 2010 2011 2012 2013 20140
1
2
3
4
5
6
7
8
Seriously Delinquent Foreclosure

Jim G
ilkeson, PhD
, CFA
14Florida Foreclosures4/9/2015
U.S. FloridaFL
rank Orlando
Foreclosure Inventory 1.4% 3.5% 3rd 3.2%
1-year change -0.6% -2.9% -3.3%
Completed foreclosures 552,048 111,321 1st 15,053
Serious Delinquency 4.0% 7.7% 2nd 7.4%
Jim G
ilkeson, PhD
, CFA
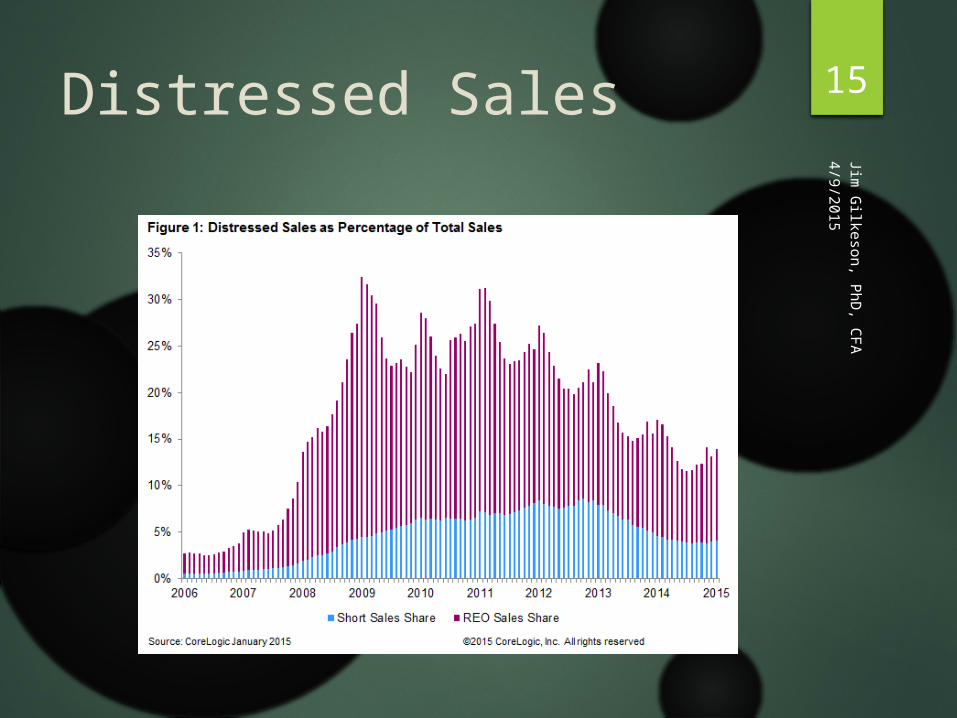
15Distressed Sales4/9/2015

Jim G
ilkeson, PhD
, CFA
16Conventional Mortgage Rate4/9/2015
99 02 05 08 11 140.00%
3.00%
6.00%
9.00%
Jim G
ilkeson, PhD
, CFA
174/9/2015
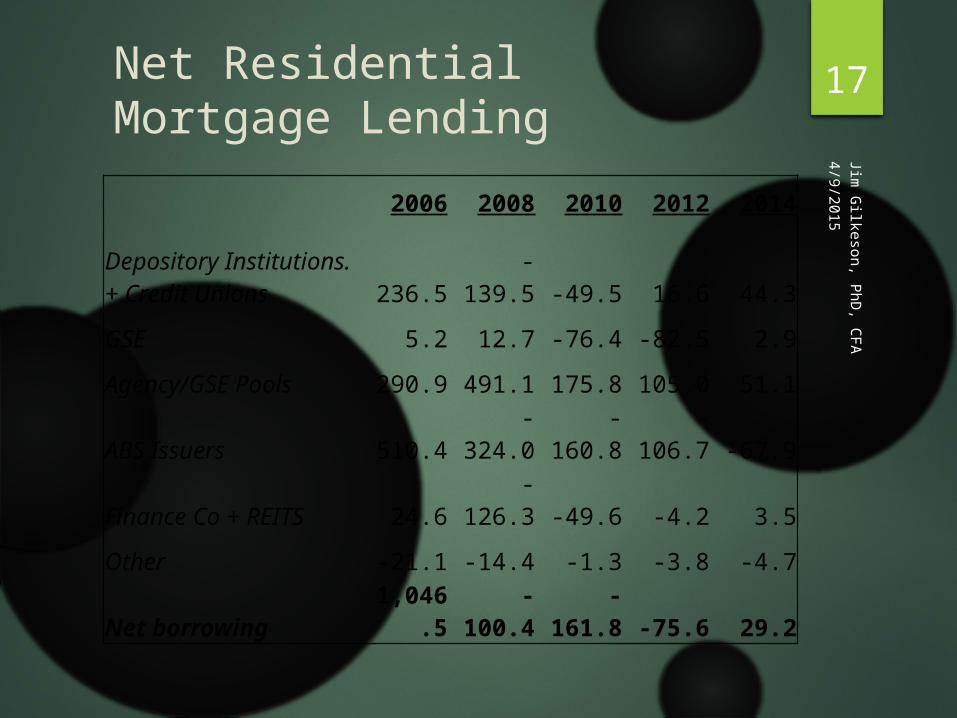
Net Residential Mortgage Lending
2006 2008 2010 2012 2014
Depository Institutions. + Credit Unions 236.5 -139.5 -49.5 16.6 44.3
GSE 5.2 12.7 -76.4 -82.5 2.9
Agency/GSE Pools 290.9 491.1 175.8 105.0 51.1
ABS Issuers 510.4 -324.0 -160.8 -106.7 -67.9
Finance Co + REITS 24.6 -126.3 -49.6 -4.2 3.5
Other -21.1 -14.4 -1.3 -3.8 -4.7
Net borrowing 1,046.5 -100.4 -161.8 -75.6 29.2

Jim G
ilkeson, PhD
, CFA
18FHA Share of Financings4/9/2015
2002 2004 2006 2008 2010 2012 20140.0%
5.0%
10.0%
15.0%
20.0%
25.0%
30.0%
US Orlando

Jim G
ilkeson, PhD
, CFA
19Orlando Financing Sources:Cash is still King 4/9/2015
1998 2001 2004 2007 2010 20130%
20%
40%
60%
80%
100%
All Cash Conventional FHA/VA Other

Jim G
ilkeson, PhD
, CFA
20Single Family Starts4/9/2015
1998 2002 2006 2010 20140
500
1000
1500
2000
2500
0
4500
9000
13500
18000
US (000s) Orlando (units) FL (units)

Jim G
ilkeson, PhD
, CFA
21Housing Market Index4/9/2015
2005 2008 2011 20140
10
20
30
40
50
60
70
80
National South

Jim G
ilkeson, PhD
, CFA
224/9/2015
Household WealthBalance Sheet of Households & Nonprofit Organizations
(in $trillions) 2004 2009 2014 Δ04-14Assets 71.7 73.1 97.1 35.4% Tangible 28.4 23.7 29.1 2.5% Household Real Estate 22.1 16.9 20.6 -6.8% Financial 43.3 49.4 68.0 57.0% Deposits 6.2 8.1 10.2 64.5% Credit Market 3.4 5.6 3.4 0.0% Corporate Equities 8.0 7.5 13.4 67.5% Mutual Fund Shares 3.8 4.1 7.8 105.3% Businesses Owned 8.6 6.3 9.3 8.1% Pension Entitlements 11.4 15.2 20.8 82.5%Liabilities Home Mortgages 8.8 10.4 9.4 6.8% Consumer Credit 2.3 2.6 3.3 43.5%
Net Worth 59.6 59.0 77.3 29.7%

Jim G
ilkeson, PhD
, CFA
23Affordability Index (income/cost)4/9/2015
1999 2002 2005 2008 2011 20140.0
50.0
100.0
150.0
200.0
250.0
300.0
National Orlando

Jim G
ilkeson, PhD
, CFA
24Consumer Confidence4/9/2015
06 08 10 12 1494.00
95.00
96.00
97.00
98.00
99.00
100.00
101.00
102.00
0.0
20.0
40.0
60.0
80.0
100.0
120.0
OECD Indicator Univ Michigan
Jim G
ilkeson, PhD
, CFA
254/9/2015
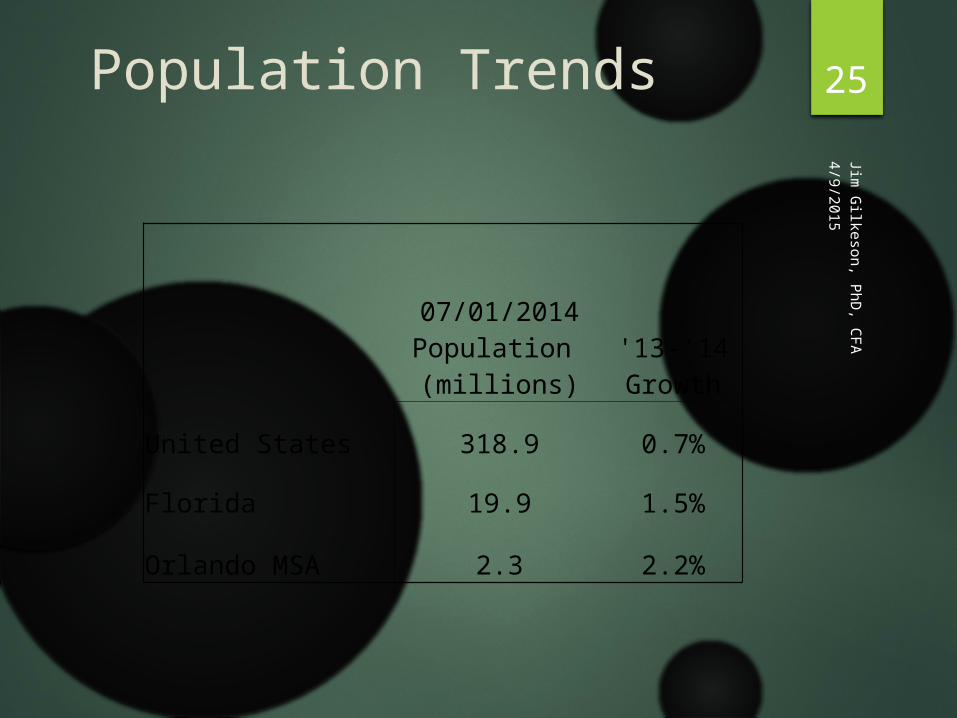
Population Trends
07/01/2014 Population (millions)
'13-'14 Growth
United States 318.9 0.7%
Florida 19.9 1.5%
Orlando MSA 2.3 2.2%
Jim G
ilkeson, PhD
, CFA
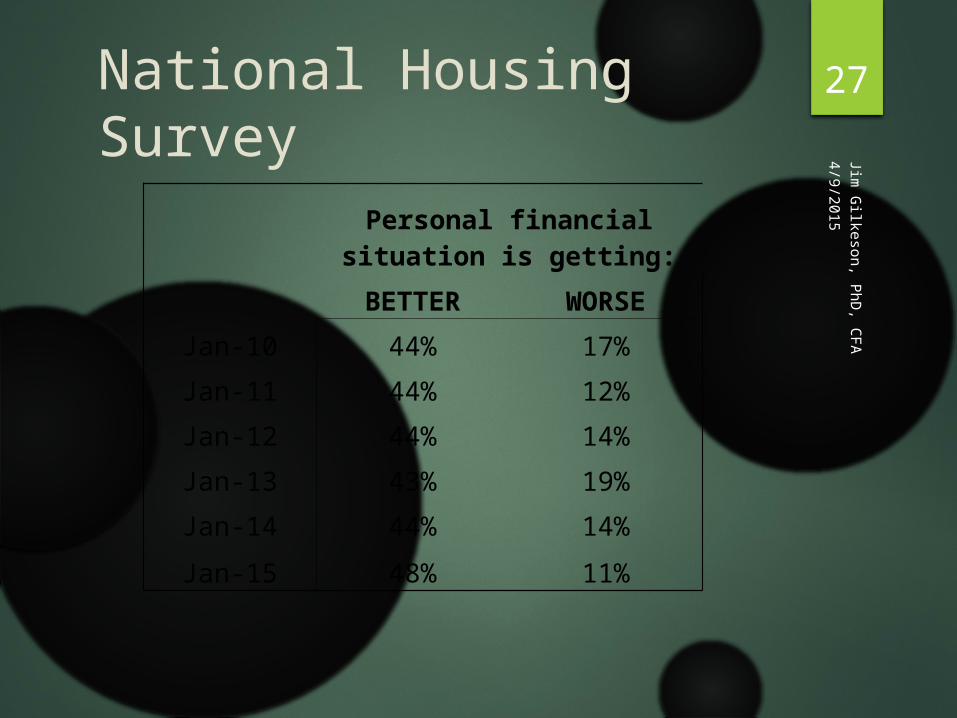
264/9/2015
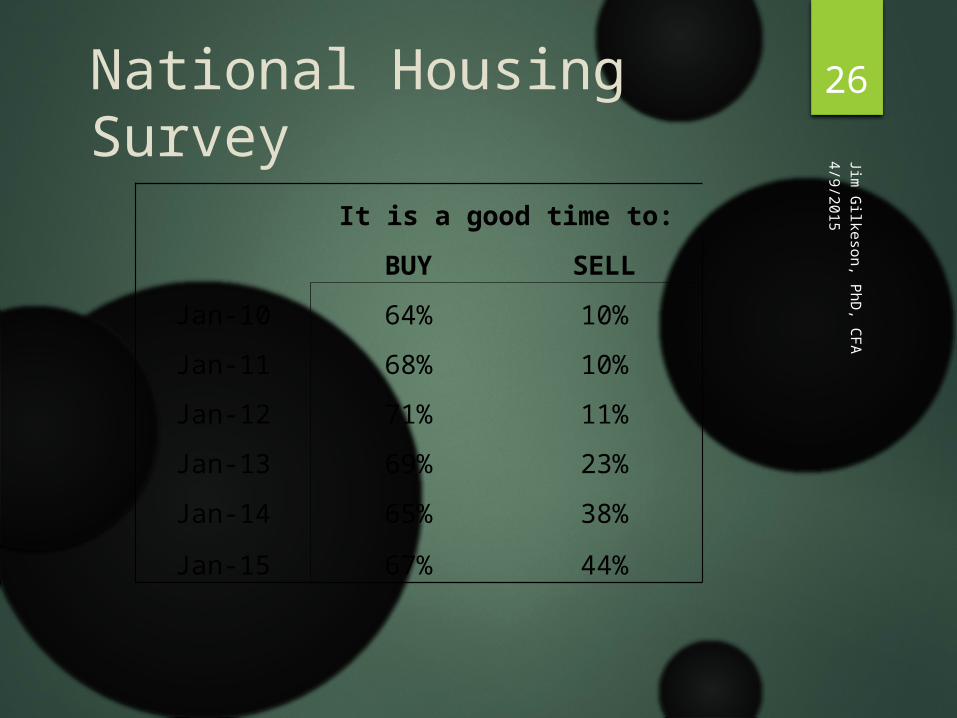
National Housing Survey
It is a good time to:
BUY SELL
Jan-10 64% 10%
Jan-11 68% 10%
Jan-12 71% 11%
Jan-13 69% 23%
Jan-14 65% 38%
Jan-15 67% 44%
Jim G
ilkeson, PhD
, CFA
274/9/2015
National Housing Survey
Personal financial situation is
getting:
BETTER WORSE
Jan-10 44% 17%
Jan-11 44% 12%
Jan-12 44% 14%
Jan-13 43% 19%
Jan-14 44% 14%
Jan-15 48% 11%

Jim G
ilkeson, PhD
, CFA
284/9/2015
National Housing Survey
The economy is on the:
RIGHT track WRONG track
Jan-10 31% 62%
Jan-11 34% 57%
Jan-12 30% 61%
Jan-13 39% 53%
Jan-14 39% 54%
Jan-15 44% 49%
Jim G
ilkeson, PhD
, CFA
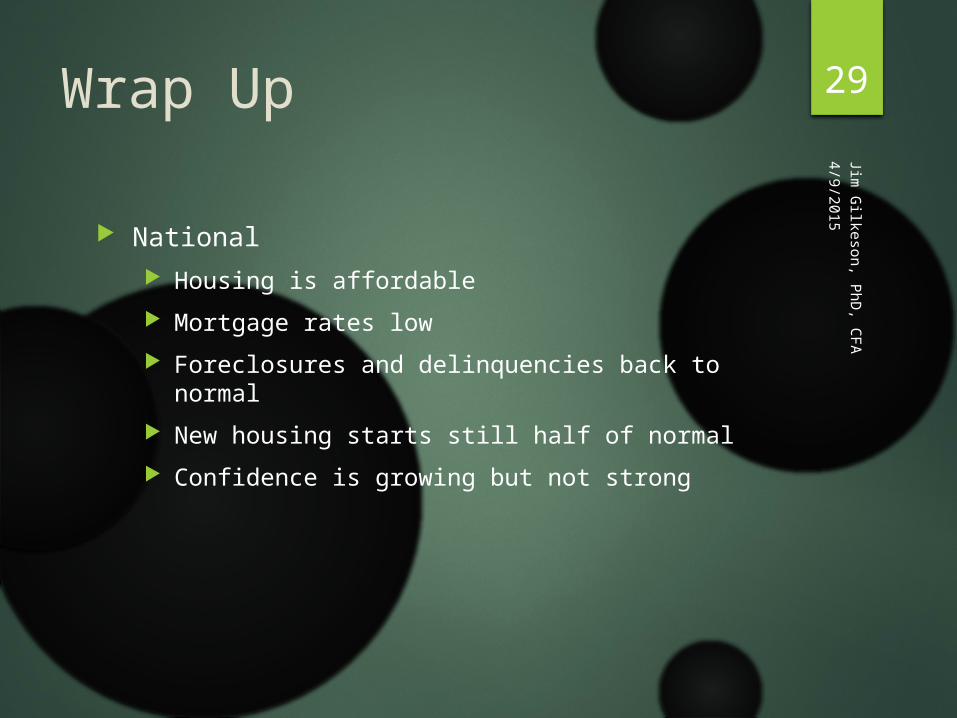
29Wrap Up
National
Housing is affordable
Mortgage rates low
Foreclosures and delinquencies back to normal
New housing starts still half of normal
Confidence is growing but not strong
4/9/2015

Jim G
ilkeson, PhD
, CFA
30Wrap Up
Orlando
Volume stable at peak but prices well below peak
Housing affordable
Population growing again
Starts half of pre-peak normal
Still quite a few problem loans
43% of 2014 sales were cash
4/9/2015