aloraier et al. / international journal of energy ... · aloraier et al. / international journal of...
TRANSCRIPT
Aloraier et al. / International Journal of Energy & Technology 2 (16) (2010) 1-11 1
International Journal of Energy & Technology 2 (16) (2010) 1-11
1Corresponding author: Tel.: +1 514 473 7383. E-mail address: [email protected] (S. Joshi).
1. INTRODUCTION
A weldment is heated intensely during the welding process with a non-uniform temperature distribution that keeps altering continually as the weld torch moves. The intense exposure to heat during welding in a very short time-frame makes inadvertent changes in the microstructure by imposing residual stresses at the grain boundaries that are often left locked-in place [1, 2]. Welding residual stresses are thus formed in structures as a result of differential contractions that occur as the weld metal solidifies and cools to the ambient temperature. It is also worth mentioning that together with the residual stresses, the intense heat input during welding may give rise to welding deformations – shrinking, distortion or warpage - though the probability of significant distortions occurring in large structures is very low as elucidated in [3-5]. The presence of these residual stresses influences the behavior of welded joints in service according to whether they are tensile or compressive. Compressive residual stresses, in many cases, can be even desirable as they tend to improve resistance to cracking, e.g., in stress corrosion cracking (SCC). Despite these presumed benefits of compressive residual stresses, they nevertheless cause an overall decrease in the buckling load. Tensile residual stresses, on the other hand, are undesirable in most instances
because they exacerbate the propensity of the metal to crack and can therefore shorten the fatigue life of industrial structures. Allowing for residual stresses in the assessment of service performance varies according to the failure mechanism the structure is suspected to undergo in its operating life [4-7]. It is generally considered that the overall tensile stress in a member should not exceed 60% of the yield strength (Sy) under operating conditions, and 80% of Sy under extreme loading conditions. Design codes usually do not require taking account of residual stresses in calculations of the static strength for ductile materials. It thus appears to be the case that design procedures for fatigue or buckling of welded structures usually make appropriate allowances for weld-induced residual stresses, and hence it is not necessary to include them explicitly. However, in the context of this research the most important consideration is that tensile residual stresses act to increase the likelihood of fracture and reduce the fatigue life. Comprehensive, 3D heat transfer and fluid flow models have been developed by several researchers [8-11] for validation of experimental data. Many others have utilized the commercial FE code ABAQUS enhanced with user subroutines to model weld simulation with great success [12-16]. The FE code ANSYS was used by several researchers [17-20] while others [3, 21-26] have utilized SYSWELD+ to perform these welding simulations.
MICROSTRUCTURAL AND HARDNESS MODELING: EFFECT OF MULTIPLE
BEAD DEPOSITION IN TEMPER BEAD WELDING TECHNIQUE
Abdulkareem S. Aloraiera, Suraj Joshi
b,1, Mahyar Asadi
c, Rubicel G. Alena
c, John A. Goldak
d
aDepartment of Manufacturing and Welding Technology, College of Technological Studies, PAAET, P.O. Box 42325, Shuwaikh, Kuwait City 70654, Kuwait
bDepartment of Mechanical and Industrial Engineering, Concordia University, Sir Goeorge Williams Campus,1515 St. Catherine Street West, Montréal, Qué., Canada H3G 2W1
cDepartment of Mechanical and Aerospace Engineering, Carleton University, 1125 Colonel By Drive, Ottawa, ON, Canada K1S 5B6
dGoldak Technologies Inc., 3745 Revelstoke Drive, Ottawa, ON, Canada K1V 7C2
ABSTRACT
Flux Cored Arc Welding (FCAW) process is often employed in industry where multiple welding sequences are used to produce stronger fastening between mating parts. Post Weld Heat Treatment (PWHT) is almost always recommended for relieving residual stresses and tempering the microstructural properties in order to prolong the fatigue and fracture life; however, it is often done away with due to the high costs involved, time constraints, infeasibility or sometime deleterious effects of the tempering process. This paper investigates whether the sequence of the initial deposition of the weld material itself can temper the microstructural properties and reduce the size of the Heat Affected Zone (HAZ) in the weld and parent metal. Four weld beads are deposited on a mild steel plate, with each being tempered by an overlapping bead using the Temper Bead Welding (TBW) technique. Numerical simulation is performed using FEA software VrWeld to evaluate the microstructure, hardness and size of the HAZ. It is concluded that there are significant improvements in the microstructure, hardness and size of the HAZ as a result of the deposition of the overlapping, tempering beads.
Keywords: Flux Cored Arc Welding, Heat Affected Zone, Temper Bead Welding, Weld sequence, Microstructure
International Journal of
Energy & Technology
www.journal-enertech.eu
ISSN 2035-911X
Aloraier et al. / International Journal of Energy & Technology 2 (16) (2010) 1–11 2
For assessing the performance of flaws in metallic structures, the British Standard BS 7910 [27] is often used, which recommends to assume the residual stress at the yield stress of the material in the absence of any post weld heat treatment (PWHT). The Australian Standard AS 4100 [28] also uses the same assumption. Since these residual stress fields are in the vicinity of the weldment, total bending stresses due to welding effects are not covered under this assumption. In case the structure undergoes PWHT, a lower residual stress of 30% of Sy may be assumed [22, 23], which is quite a significant reduction. Thus the recommended practice of mitigating the effect of residual stresses is to temper the microstructure by employing PWHT. The Australian Standard AS 4458 [29] recommends PWHT within a temperature range of 580 – 6200C for carbon steels, and less than 7600C for low-alloy steels. As an example, a 2.25% Cr, 1% Mo steel should ideally be heat treated in the range of 680 – 7300C for a minimum of two hours. However, PWHT is not always justified in terms of imparting beneficial properties to welded metals, especially for the toughness of weldments [30]. In some cases, PWHT could even have a negative influence of the fatigue life of a welded structure by removing the beneficial compressive residual stresses and hence decreasing the fatigue resistance. Besides, segregation of phosphorus to grain boundaries in the weld metal and precipitation hardening by some other carbides can increase the brittleness of the metal. Moreover, PWHT is a very expensive and time-consuming process, especially if the structure is large in size (e.g., mining dragline clusters, heavy earth movers, etc.) and already in operation [3, 5]. This is because applying PWHT when the structure is already subjected to huge loads can permanently cause significant distortions.
2. TEMPER BEAD WELDING TECHNIQUE Given the sometimes deleterious effects of PWHT, the temper bead welding (TBW) technique can be employed as an alternative method to treat the underlying beads/ weld layers with the weld heat input of the next layer of deposition. The Heat Affected Zone (HAZ) for the first layer is tempered by controlling the ratio of the heat input for the second layer to that of the first layer. This technique of heat treating by successively overlapping weld layers leaves the very last layer untempered, which can be removed by mechanical grinding. Controlling the size of electrodes, sizes of beads and varying the heat inputs in specific ratios can in effect give the same metallurgical structure that is desired by the PWHT process. Many different TBW techniques have been developed, such as (i) the half-bead technique, wherein the beads of the first layer are ground back before the next weld layer is deposited, (ii) the back-step technique, wherein the weld beads are repeatedly laid opposite to the direction of welding, and (iii) the two-layer technique, wherein the previously laid beads are partially heat treated by successive ones. While the Welding Research Council [31] has discussed the practical applications of the TBW technique, the changes in microstructure by varying welding sequences and inputs have not been hitherto established satisfactorily. The goal of this research paper is to investigate into the characterization of microstructure and hardness changes using TBW specimens created with standard Flux Cored
Arc Welding (FCAW) process. Finite element analysis is employed to simulate fractions of different phases and hardness, and experimental measurements of hardness in sample specimens are reported. Appropriate conclusions are drawn attesting to the importance of weld overlapping in the TBW technique over the costly and often prohibitive PWHT process, in order to realize desirable microstructure properties and hardness.
3. EXPERIMENTAL MEASUREMENTS Four weld bead layers were deposited on a 200 x 100 x 12 mm mild steel plate (AS 3678-250) using FCAW parameters identified by previous work conducted at Monash University, Melbourne [32, 33]. SUPER-COR 5 welding electrodes as specified in AWS A5.20 [34] were employed using Argoshield 52 (77% Ar and 23% CO2) as a
shielding gas. Table 1 shows the exact chemical
composition of the parent metal and Table 2 shows that of
the weld metal. Table 3 shows the mechanical properties of the parent and weld metal. The fixed welding parameters
used in experimental work are shown in Table 4.
Table 1. Exact chemical composition of parent metal
Element Percentage Composition (%)
C 0.22
Si 0.55
Mn 1.70
P 0.04
S 0.03
Cr 0.30
Ni 0.50
Cu 0.40
Mo 0.10
Al 0.10
Ti 0.04
CE 0.44
Table 2. Exact chemical composition of weld metal
Element Percentage Composition (%)
C 0 .10
Mn 1.73
Si 0.68
S 0.017
P 0.019
Ni 0.05
Cr 0.03
Mo 0.04
V 0.04

Aloraier et al. / International Journal of Energy & Technology 2 (16) (2010) 1–11 3
Table 3. Mechanical properties of parent and weld metal
Material Yield Stress [MPa]
Tensile Strength [MPa]
Percentage Elongation
AS 3678-250 285 429 38
SUPER-COR5 445 550 29
Table 4. Fixed parameters used in experimental work
The experimental set-up of the welding apparatus is
shown in Fig.1 (a) and micrographs of cross-section are
shown in Fig. 1 (b). In the welding sequence, the first bead was deposited along the centreline of the substrate plate in the length direction, and the second was deposited by the side of the first bead with a 50% overlap. The third bead was deposited on the opposite side of the second bead along the first bead with a 50% overlap again. This set of three partially overlapping beads formed the first weld layer. The fourth bead was deposited on top of the very first bead, forming the second weld layer with a significant spread over the underlying layer so as to produce an overall tempering effect. Heat inputs were altered by changing the traverse speed of the weld gun, viz. all the three beads in the first layer were deposited with a faster traverse speed of 560 mm/min, while the second layer was deposited with a
slower speed of 290 mm/min as indicated in Table 4. Fig. 2 illustrates a schematic of this deposition sequence.
1 4 25 mm
10 mm
10 mm
10 mm
10 mm
1 2
3 4
b.
Fig.1. (a) Experimental set-up of welding apparatus,
(b) cross-sections after successive bead deposition
3
4
2 1
Fig. 2. Schematic of the bead deposition sequence
4. COMPUTATIONAL MODEL 3D transient temperature is computed by solving the transient heat equation:
0. QTh (1)
where, h = rate of change of specific enthalpy with time,
= thermal conductivity
T = absolute temperature, and Q = power per unit volume (power density distribution). The transient heat equation is solved with Lagrangian FEM [16]. The initial temperature was 300 K. The power density distribution function Q (W/m3)
in the double
ellipsoidal heat source model [10] was used. A convection boundary condition with convection coefficient hc = 20
W/m2-K and ambient temperature of T∞ = 300 K generated
the boundary flux q = hc(T - T∞). The length of the time step
during welding was chosen such that each weld required three time steps to cross the weld pool length. Filler metal was added as the welding arc moved along the weld path, i.e., the FEA domain changed in each time step during welding. After welding was completed, the time step length was increased exponentially by a factor 1.2 per time step for a delay time of 7200 s. By this time the plate had cooled completely to 300 K. The second bead started by a 12 mm offset with the same welding parameters on the side by 50% overlap in order to temper the martensite from the first bead. Having computed the transient temperature, microstructure evolution was determined using algorithms described in [35, 36]. The essential idea was that a pseudo Fe-C phase diagram in which all lines and points are functions of the alloy composition is used to estimate the equilibrium microstructure of the alloy at any time and temperature. Then the kinetics of the transformation of the austenite or gamma phase to ferrite, pearlite and/or bainite phases that tries to drive the microstructure toward an
Parameter First Layer
Overlapping Layer
Electrode diameter (mm) 1.6 1.6
Current range (A) 215-245 215-245
Voltage range (V) 23-25 23-25
Traverse speed (mm/min) 560 290
Wire feed speed (mm/min) 3600 3600
Electrode stick-out dist. (mm) 20 20
Gas flow rate (liter/min) 20 20
FCAW torch moves parallel
to the substrate plate
a.

Aloraier et al. / International Journal of Energy & Technology 2 (16) (2010) 1–11 4
equilibrium state is governed by differential equations such as Eq. 2. The transformation of austenite or gamma phase to martensite is governed by the algebraic Koistinen-Marburger equation [37]. Eq. 2 is an example of the differential equation that describes the kinetics of the austenite-ferrite transformation on cooling. If temperature is cooling and is below A3 in the Fe-C pseudo-binary phase diagram, the rate at which the fraction of ferrite X increases as a function of time while the temperature is above the pearlite start temperature and while austenite fraction is greater than 0.01 is given by the following equation:
COM
XXeTX
XXRT
Fe
G 3/23/12/2300032/1 12
COM = 59.6% Mn + 1.45% Ni + 67.7% Cr + 244% Mo
,3 TATFe 3AT (2)
This equation is integrated as a function of time to determine the fraction of equilibrium ferrite at any time. It is important to note that X is the fraction of equilibrium ferrite, not the fraction of volume that is ferrite. It should also be noted that G is the ASTM grain size index [38]. If N is the number of grains in 0.01 in2, G is computed from the equation N = 2G-1. Typical starting procedures are required to start the integration of this differential equation from X = 0. R is the universal gas constant. FEA software VrWeld was used to simulate this weld bead sequence numerically, wherein two bead layers were deposited on a plate of dimension 200 x 100 x 12 mm in the FE model. The double ellipsoidal heat source model [10] was used with front length = 3 mm, rear length = 6 mm, width = 10 mm, and
depth = 8 mm. Fig. 3 shows the transient temperatures in
the FE simulation and Fig. 4 shows these transient temperatures in the longitudinal sections of the beads.
Fig.3. Transient temperatures (K) in FEA simulation
300 400 500 600 700 800 900 1000 1100 1200 1300 1400 1500 1600 1700
Fig.1. Experimental work: (a) FCAW welding of beads on plate, (b) beads deposition sequence and cross-sections
Fig.4. Transient temperatures (K) in longitudinal section of the beads
a. b.
c. d.
a. b.
c. d.
Aloraier et al. / International Journal of Energy & Technology 2 (16) (2010) 1–11 5
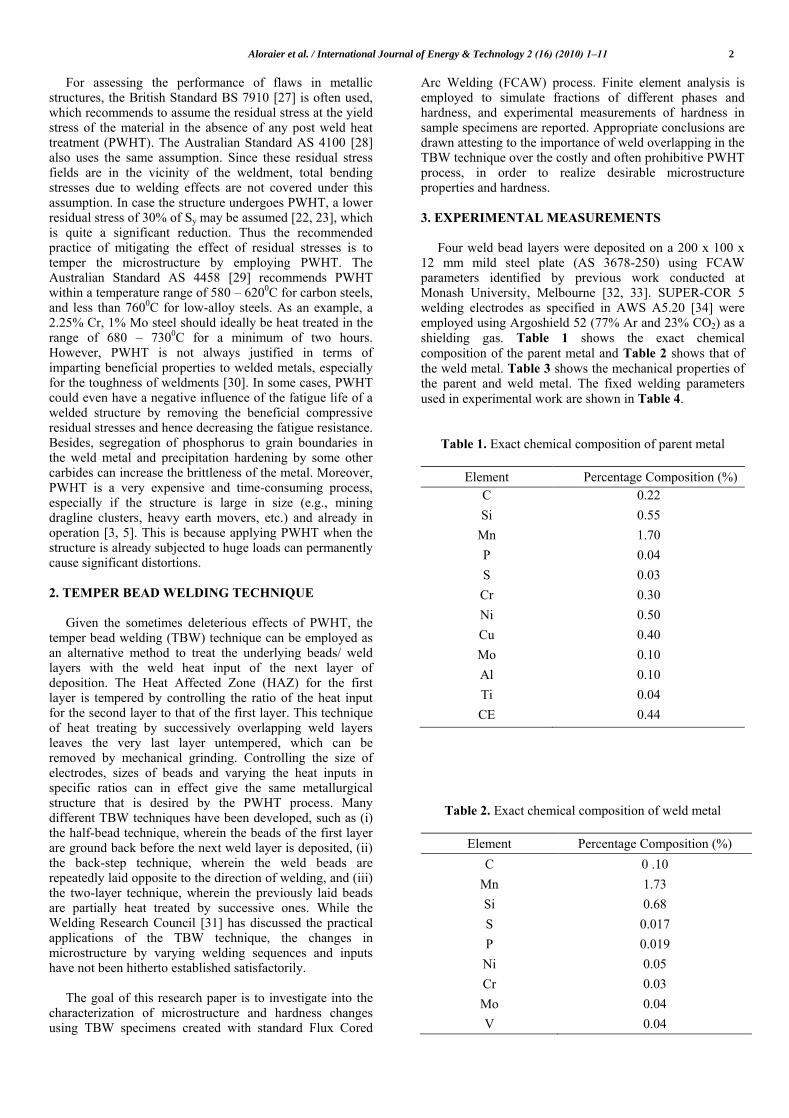
Fig. 5 shows the pass temperature. Fig. 6 shows the microstructure percentages of bainite (a, b) and austenite or
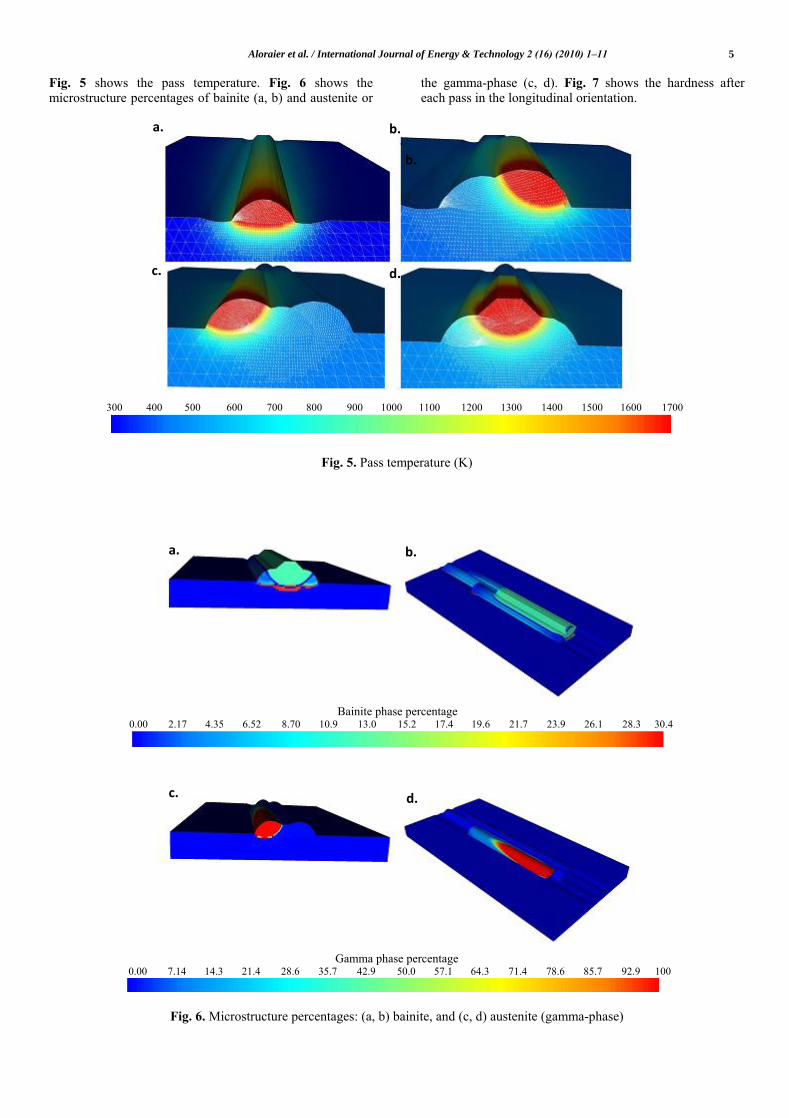
the gamma-phase (c, d). Fig. 7 shows the hardness after each pass in the longitudinal orientation.
Fig. 5. Pass temperature (K)
Bainite phase percentage 0.00 2.17 4.35 6.52 8.70 10.9 13.0 15.2 17.4 19.6 21.7 23.9 26.1 28.3 30.4
Fig. 6. Microstructure percentages: (a, b) bainite, and (c, d) austenite (gamma-phase)
300 400 500 600 700 800 900 1000 1100 1200 1300 1400 1500 1600 1700
Gamma phase percentage 0.00 7.14 14.3 21.4 28.6 35.7 42.9 50.0 57.1 64.3 71.4 78.6 85.7 92.9 100
a. b.
c. d.
a. b.
c.
b.
d.
Aloraier et al. / International Journal of Energy & Technology 2 (16) (2010) 1–11 6
Fig. 7. Hardness after each consecutive pass in longitudinal orientation
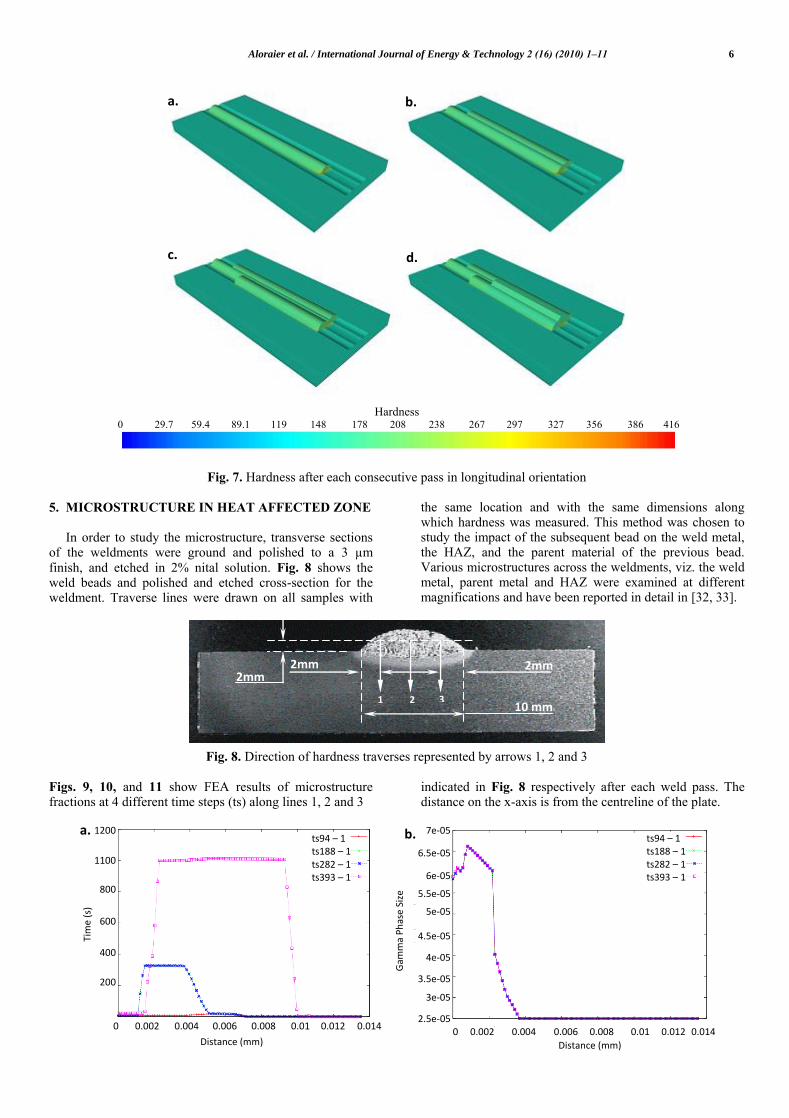
5. MICROSTRUCTURE IN HEAT AFFECTED ZONE
In order to study the microstructure, transverse sections of the weldments were ground and polished to a 3 µm
finish, and etched in 2% nital solution. Fig. 8 shows the weld beads and polished and etched cross-section for the weldment. Traverse lines were drawn on all samples with
the same location and with the same dimensions along which hardness was measured. This method was chosen to study the impact of the subsequent bead on the weld metal, the HAZ, and the parent material of the previous bead. Various microstructures across the weldments, viz. the weld metal, parent metal and HAZ were examined at different magnifications and have been reported in detail in [32, 33].
2 10 mm
2mm
1 3
2mm 2mm
Fig. 8. Direction of hardness traverses represented by arrows 1, 2 and 3
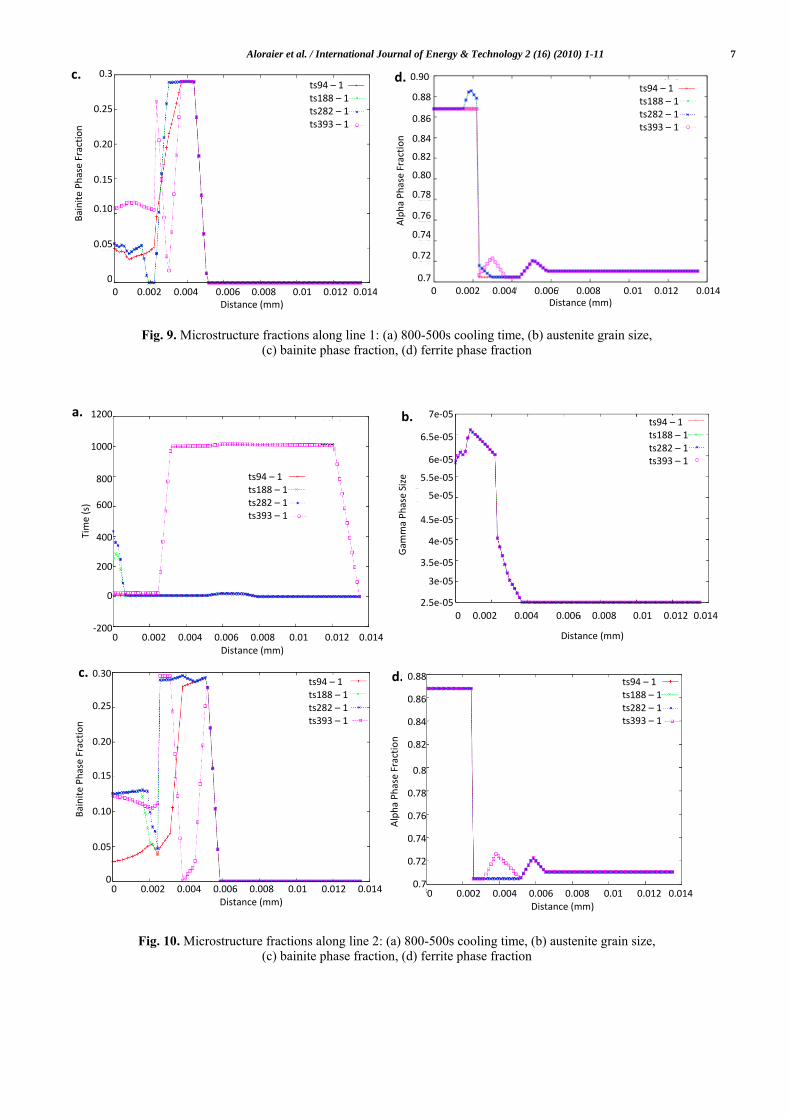
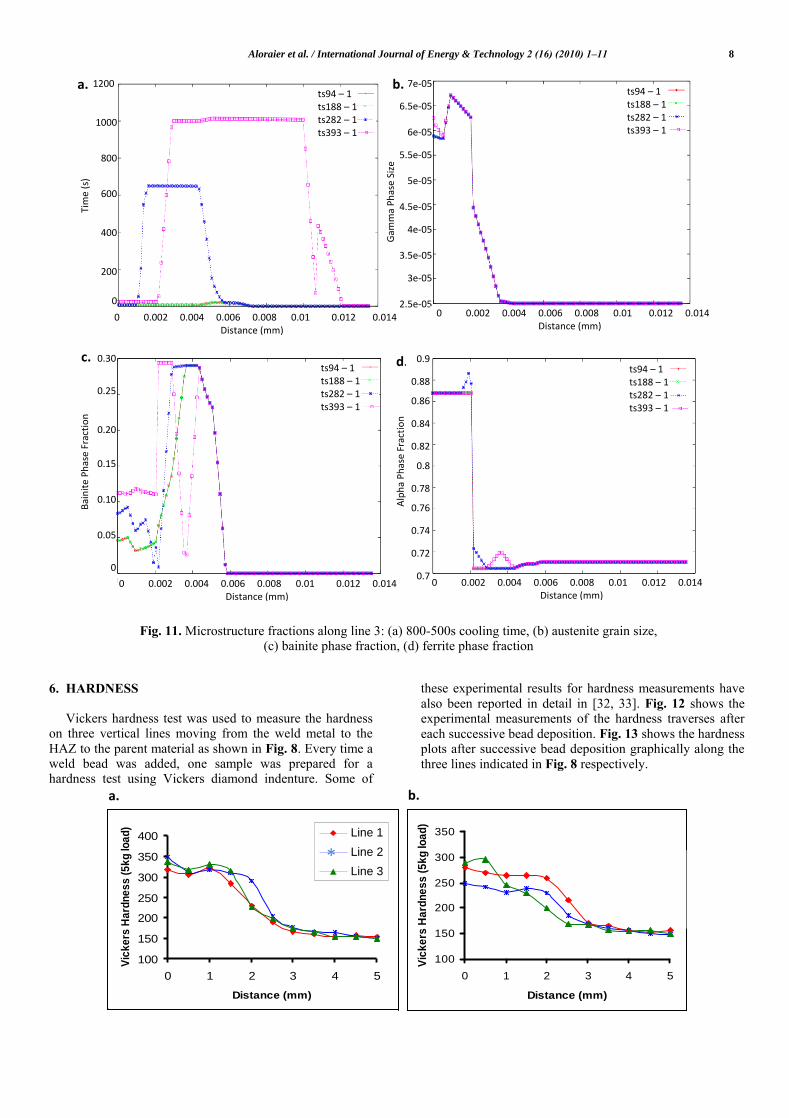
Figs. 9, 10, and 11 show FEA results of microstructure fractions at 4 different time steps (ts) along lines 1, 2 and 3
indicated in Fig. 8 respectively after each weld pass. The distance on the x-axis is from the centreline of the plate.
Hardness 0 29.7 59.4 89.1 119 148 178 208 238 267 297 327 356 386 416
1200
1100
800
600
400
200
0
0.002 0.004 0.006 0.008 0.01 0.012 0.014
Tim
e (s
)
Distance
ts94 – 1 ts188 – 1 ts282 – 1 ts393 – 1
7e-05
6.5e-05
6e-05
5.5e-05
5e-05
4.5e-05
4e-05
3.5e-05
3e-05
2.5e-05
0 0.002 0.004 0.006 0.008 0.01 0.012 0.014
Distance (mm)
Gam
ma
Ph
ase
Size
ts94 – 1 ts188 – 1 ts282 – 1 ts393 – 1
a. b.
Distance (mm)
a. b.
c. d.
Aloraier et al. / International Journal of Energy & Technology 2 (16) (2010) 1-11 7
0.3
0.25
0.20
0.15
0.10
0.05
0 0 0.002 0.004 0.006 0.008 0.01 0.012 0.014
Distance (mm)
Bai
nit
e P
has
e Fr
acti
on
ts94 – 1 ts188 – 1 ts282 – 1 ts393 – 1
0.88
0.86
0.84
0.82
0.80
0.78
0.76
0.74
0.72
0.7 0 0.002 0.004 0.006 0.008 0.01 0.012 0.014
Distance (mm)
Alp
ha
Ph
ase
Frac
tio
n
ts94 – 1 ts188 – 1 ts282 – 1 ts393 – 1
0.900
d. c.
Fig. 9. Microstructure fractions along line 1: (a) 800-500s cooling time, (b) austenite grain size,
(c) bainite phase fraction, (d) ferrite phase fraction
7e-05
6.5e-05
6e-05
5.5e-05
5e-05
4.5e-05
4e-05
3.5e-05
3e-05
2.5e-05
0 0.002 0.004 0.006 0.008 0.01 0.012 0.014
Distance (mm)
Gam
ma
Ph
ase
Size
ts94 – 1 ts188 – 1 ts282 – 1 ts393 – 1
a. b.
c. d.
1200
1000
800
600
400
200
0
-200
Tim
e (s
)
0 0.002 0.004 0.006 0.008 0.01 0.012 0.014 Distance (mm)
ts94 – 1 ts188 – 1 ts282 – 1 ts393 – 1
0.30
0.25
0.20
0.15
0.10
0.05
0
Bai
nit
e P
has
e Fr
acti
on
0 0.002 0.004 0.006 0.008 0.01 0.012 0.014 Distance (mm)
0 0.002 0.004 0.006 0.008 0.01 0.012 0.014 Distance (mm)
0.88
0.86
0.84
0.82
0.8
0.78
0.76
0.74
0.72
0.7
Alp
ha
Ph
ase
Frac
tio
n
ts94 – 1 ts188 – 1 ts282 – 1 ts393 – 1
ts94 – 1 ts188 – 1 ts282 – 1 ts393 – 1
Fig. 10. Microstructure fractions along line 2: (a) 800-500s cooling time, (b) austenite grain size,
(c) bainite phase fraction, (d) ferrite phase fraction
Aloraier et al. / International Journal of Energy & Technology 2 (16) (2010) 1–11 8
7e-05
6.5e-05
6e-05
5.5e-05
5e-05
4.5e-05
4e-05
3.5e-05
3e-05
2.5e-05
a.
c) d.
1200
1000
800
600
400
200
0
Tim
e (s
)
0 0.002 0.004 0.006 0.008 0.01 0.012 0.014 Distance (mm)
0 0.002 0.004 0.006 0.008 0.01 0.012 0.014 Distance (mm)
0 0.002 0.004 0.006 0.008 0.01 0.012 0.014 Distance (mm)
0 0.002 0.004 0.006 0.008 0.01 0.012 0.014 Distance (mm)
Gam
ma
Ph
ase
Size
0.30
0.25
0.20
0.15
0.10
0.05
0
Bai
nit
e P
has
e Fr
acti
on
0.9
0.88
0.86
0.84
0.82
0.8
0.78
0.76
0.74
0.72
0.7
Alp
ha
Ph
ase
Frac
tio
n
ts94 – 1 ts188 – 1 ts282 – 1 ts393 – 1
ts94 – 1 ts188 – 1 ts282 – 1 ts393 – 1
ts94 – 1 ts188 – 1 ts282 – 1 ts393 – 1
ts94 – 1 ts188 – 1 ts282 – 1 ts393 – 1
b.
c.
6. HARDNESS Vickers hardness test was used to measure the hardness on three vertical lines moving from the weld metal to the
HAZ to the parent material as shown in Fig. 8. Every time a weld bead was added, one sample was prepared for a hardness test using Vickers diamond indenture. Some of
these experimental results for hardness measurements have
also been reported in detail in [32, 33]. Fig. 12 shows the experimental measurements of the hardness traverses after
each successive bead deposition. Fig. 13 shows the hardness plots after successive bead deposition graphically along the
three lines indicated in Fig. 8 respectively.
Hardness Traverses Sample 1
100
150
200
250
300
350
400
0 1 2 3 4 5
Distance (mm)
Vic
ke
rs H
ard
ne
ss
(5
kg
loa
d)
Line 1
Line 2
Line 3
Hardness Traverses Sample 2
100
150
200
250
300
350
0 1 2 3 4 5
Distance (mm)
Vic
ke
rs H
ard
ne
ss
(5
kg
loa
d)
Line 1
Line 2
Line 3
a. b.
Line 1
Line 2
Line 3 *
Fig. 11. Microstructure fractions along line 3: (a) 800-500s cooling time, (b) austenite grain size, (c) bainite phase fraction, (d) ferrite phase fraction
Aloraier et al. / International Journal of Energy & Technology 2 (16) (2010) 1–11 9
Hardness Traverses Sample 3
100
150
200
250
300
0 1 2 3 4 5
Distance (mm)
Vic
ke
rs H
ard
ne
ss
(5
kg
loa
d)
Line 1
Line 2
Line 3
d. c. Hardness Traverses Sample 4
100
150
200
250
0 1 2 3 4 5
Distance (mm)
Vic
ke
rs H
ard
ne
ss
(5
kg
loa
d)
Line 1
Line 2
Line 3
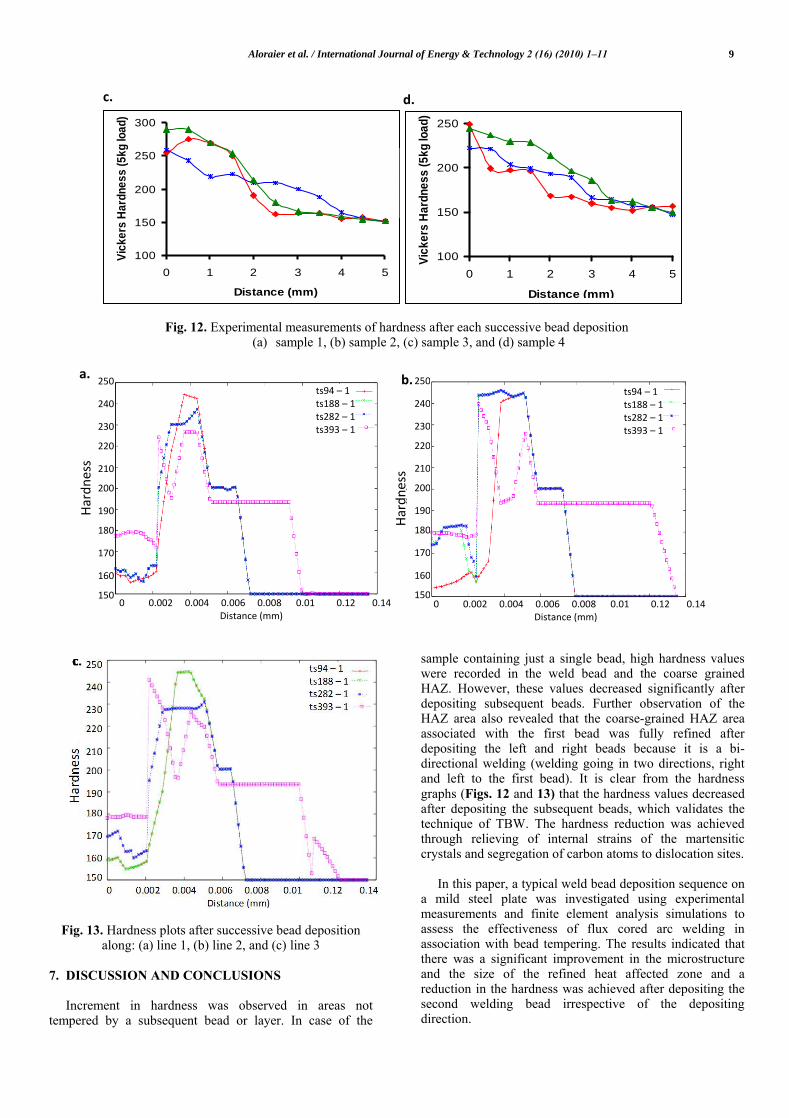
Fig. 12. Experimental measurements of hardness after each successive bead deposition
(a) sample 1, (b) sample 2, (c) sample 3, and (d) sample 4
0 0.002 0.004 0.006 0.008 0.01 0.12 0.14 Distance (mm)
0 0.002 0.004 0.006 0.008 0.01 0.12 0.14 Distance (mm)
250
240
230
220
210
200
190
180
170
160
150
a.
250
240
230
220
210
200
190
180
170
160
150
b.
Har
dn
ess
Har
dn
ess
ts94 – 1 ts188 – 1 ts282 – 1 ts393 – 1
ts94 – 1 ts188 – 1 ts282 – 1 ts393 – 1
Fig. 13. Hardness plots after successive bead deposition along: (a) line 1, (b) line 2, and (c) line 3
7. DISCUSSION AND CONCLUSIONS
Increment in hardness was observed in areas not tempered by a subsequent bead or layer. In case of the
sample containing just a single bead, high hardness values were recorded in the weld bead and the coarse grained HAZ. However, these values decreased significantly after depositing subsequent beads. Further observation of the HAZ area also revealed that the coarse-grained HAZ area associated with the first bead was fully refined after depositing the left and right beads because it is a bi-directional welding (welding going in two directions, right and left to the first bead). It is clear from the hardness
graphs (Figs. 12 and 13) that the hardness values decreased after depositing the subsequent beads, which validates the technique of TBW. The hardness reduction was achieved through relieving of internal strains of the martensitic crystals and segregation of carbon atoms to dislocation sites. In this paper, a typical weld bead deposition sequence on a mild steel plate was investigated using experimental measurements and finite element analysis simulations to assess the effectiveness of flux cored arc welding in association with bead tempering. The results indicated that there was a significant improvement in the microstructure and the size of the refined heat affected zone and a reduction in the hardness was achieved after depositing the second welding bead irrespective of the depositing direction.

Aloraier et al. / International Journal of Energy & Technology 2 (16) (2010) 1–11 10
[1] Radaj, D., 2003, "Welding residual stresses and
distortion: Calculation and measurement," Neusser-Werbedruck GmbH, Remscheid, Dusseldorf.
[2] Dayawansa, P., Chitty, G., Kerezsi, B., Bartosiewicz, H., Price, JWH, 2006, "Fracture Mechanics of Mining Dragline Booms," Engineering Failure Analysis, 13(4) pp. 716-725.
[3] Joshi, S., Semetay, C., Price, JWH, 2010, "Weld-Induced Residual Stresses in a Prototype Dragline Cluster and Comparison with Design Codes," Thin-Walled Structures, 48(2) pp. 89-102.
[4] Joshi, S., and Price, JWH, 2009, "A Comparative Study on Application of Design Codes for Prediction of Fatigue Life of a Mining Dragline Cluster," Engineering Failure Analysis, 16(5) pp. 1562-1569.
[5] Joshi, S., Price, JWH, and Dayawansa, D. P., 2010, "Influence of Variations in Geometric Parameters and an Alternative Design for Improved Fatigue Life of a Mining Dragline Joint," Engineering Structures, 32(5) pp. 1333-1340.
[6] Health and Safety Executive, UK, “Steel - Offshore Technology Report 2001/015”, 2002.
[7] Joshi, S., Mashiri, F. R., Dayawansa, D. P., Zhao, X. -L., and Price, JWH, 2010, "Structural Health Monitoring of a Dragline Cluster using the Hot Spot Stress Method". Article in Press.
[8] Ribic, B., Rai, R., and Debroy, T., 2008, "Numerical Simulation of Heat Transfer and Fluid Flow in GTA/ Laser Hybrid Welding," Science and Technology of Welding and Joining, 13(8) pp. 683-693.
[9] Goldak, J., Gu, M., Paramjeet, K., 1990, "Computer simulation of welding processes," in Proc. of the Int. Conference on International Trends in Welding Science and Technology, ASME Publication, 20, pp. 193-201.
[10] Goldak, J., Chakravarti, A., and Bibby, M., 1984, "A New Finite Element Model for Welding Heat Sources," Metallurgical Transactions B, 15, pp. 299-305.
[11] Murugan, S., Kumar, P. V., Gill, T. P. S., 1999, "Numerical Modeling and Experimental Determination of Temperature Distribution during Manual Metal Arc Welding," Science and Technology of Welding and Joining, 4(6) pp. 357-364.
[12] Webster, P. J., Ananthaviravakumar, N., Hughes, D. J., 2002, "Measurement and Modelling of Residual Stresses in a TIG Weld," Applied Physics A: Materials Science and Processing, 74 (SUPPL II) pp. 1421-1423.
[13] Dong, P., Hong, J., Bynum, J., 1997, "Analysis of residual stresses in Al–Li alloy repair welds. Approximate methods in the design and analysis of pressure vessels and piping components," ASME Pressure Vessel and Piping Division Publication, 347 pp. 61-75.
[14] Hong, J. K., Tsai, C. -L., and Dong, P., 1998, "Assessment of Numerical Procedures for Residual Stress Analysis of Multipass Welds." Welding Journal, Welding Research Supplement, pp. 372-382.
[15] Brown, S. B., and Song, H., 1992, "Finite Element Simulation of Welding of Large Structures," ASME Journal of Engineering for Industry, 114 pp. 441-451.
[16] Dong, P., Ghadiali, P. N., and Brust, F. W., 1998, "Residual Stress Analysis of a Multi-pass Girth Weld,"
ASME Pressure Vessel and Piping Division - Fracture, Fatigue and Weld Residual Stress, 373 pp. 421-431.
[17] Yuan-xiang, Z., Xue-rong, Z., Xiao-fei, Z., 2004, "Numerical Simulation of Multi-Repaired Weld Residual Stress," Journal of Wuhan University of Technology -Materials Science Edition, 19(4) pp. 99-102.
[18] Jin, X. -J., Huo, L. -X., Zhang, Y. -F., 2004, "Three Dimensional Finite Element Numerical Simulation of Residual Stresses of all-Position Welding in Duplex Stainless Steel Pipe," Hanjie Xuebao/ Transactions of the China Welding Institution, 25(2) pp. 52-56.
[19] Lee, C. K., Candy, J., and Tan, C. P. H., 2004, "Measurement and Finite Element Analysis of Temperature Distribution in Arc Welding Process," International Journal of Computer Applications in Technology, 21(4) pp. 171-177.
[20] Katsareas, D. E., Ohms, C., and Youtsos, A. G., 2004, "On the Performance of a Commercial Finite Element Code in Multipass Welding Simulation," in Proceedings of the ASME/JSME Pressure Vessels and Piping Conference, PVP - 477 pp. 29-37, San Diego, USA.
[21] Bate, S. K., Charles, R., and Warren, A., 2009, "Finite Element Analysis of a Single Bead-on-Plate Specimen using SYSWELD," International Journal of Pressure Vessels and Piping, 86(1) pp. 73-78.
[22] Price, JWH, Ziara-Paradowska, A., Joshi, S., 2008, "Comparison of Experimental and Theoretical Residual Stresses in Welds: The Issue of Gauge Volume," International Journal of Mechanical Sciences, 50(3) pp. 513-521.
[23] Price, JWH, Paradowska, A., Joshi, S., 2006, "Residual Stresses Measurement by Neutron Diffraction and Theoretical Estimation in a Single Weld Bead," International Journal of Pressure Vessels and Piping, 83(5) pp. 381-387.
[24] Vincent, Y., 1999, "On the Validation of the Models Related to the Prevision of the HAZ Behaviour," ASME Pressure Vessel and Piping Division - Fracture, Fatigue and Weld Residual Stress, 393 pp. 193-200.
[25] Dubois, D., Devaux, J., and Leblond, J. B., 1984, "Numerical Simulation of a Welding Operation: Calculation of Residual Stresses and Hydrogen Diffusion," ASME Fifth International Conference on Pressure Vessel Technology, Materials and Manufacturing II, 1210-1238, San Francisco, USA.
[26] Roelens, J., 1996, "Numerical Simulation of some Multipass Submerged Arc Welding - Determination of the Residual Stresses and Comparison with Experimental Measurements," Welding Research Abroad, 42(8-9) pp. 17-24.
[27] British Standards Institute, 2000, "BS 7910: 2000 Guide on Methods for Assessing the Acceptability of Flaws in Metallic Structures".
[28] Standards Australia, 1998, "AS 4100: Steel Structures". [29] Standards Australia, 1999, "AS 4458-1997/ Amdt. No. 1-
1999: Pressure equipment-Manufacture". [30] Paradowska, A., Price, JWH, and Dayawansa, P., 2006,
"Study of Influence of Post Weld Heat Treatment on Residual Stress Distribution in Tubular Joints," Welding Research Abroad, 52(2) pp. 10-19.
[31] Bulletin No. 412, "Overview of results from PVRC (Pressure Vessel Research Council) programs on half-bead/ temper bead/ controlled deposition techniques for
8. REFERENCES

Aloraier et al. / International Journal of Energy & Technology 2 (16) (2010) 1–11 11
improvement of fabrication and service performance of Cr–Mo steels," Welding Research Council, pp. 16-26.
[32] Aloraier, A. S., Ibrahim, R. N., and Thomson, P., 2006, "FCAW Process to Avoid the use of Post Weld Heat Treatment," International Journal of Pressure Vessels and Piping, 83(5) pp. 394-398.
[33] Aloraier, A. S., Ibrahim, R. N., and Ghojel, J., 2004, "Eliminating Post-Weld Heat Treatment in Repair Welding by Temper Bead Technique: Role Bead Sequence in Metallurgical Changes," Journal of Materials Processing Technology, 153-154 pp. 392-400.
[34] American Welding Society, 2005, "AWS A5.20/ A5.20M - Carbon Steel Electrodes for Flux Cored Arc Welding".
[35] Watt, D. F., Coon, L., Bibby, M., 1988, "An Algorithm for Modelling Microstructural Development in Weld Heat-Affected Zones (Part A) Reaction Kinetics," Acta Metallurgica, 36(11) pp. 3029-3035.
[36] Henwood, C., Bibby, M., Goldak, J., 1988, "Coupled Transient Heat Transfer - Microstructure Weld Computations (Part B)," Acta Metallurgica, 36(11) pp. 3037-3046.
[37] Gur, C. H., and Pan, J., 2008, "Handbook of Thermal Process Modelling of Steel," CRC Press, UK.
[38] ASTM E112 - 96(2004)e2, "Standard Test Methods for Determining Average Grain Size".
THE MATERIAL WITHIN THIS PAPER, AT THE AUTHORS’ RESPONSIBILITY, HAS NOT BEEN PUBLISHED
ELSEWHERE IN THIS SUBSTANTIAL FORM NOR SUBMITTED ELSEWHERE FOR PUBLICATION. NO
COPYRIGHTED MATERIAL OR ANY MATERIAL DAMAGING THIRD PARTIES’ INTERESTS HAS BEEN USED IN
THIS PAPER, AT THE AUTHORS’ RESPONSIBILITY, WITHOUT HAVING OBTAINED A WRITTEN PERMISSION.