also good teachers? the relationship between research ... · also good teachers? the relationship...
TRANSCRIPT
Are good researchers also good teachers?The relationship between research quality andteaching qualityAli PalaliRoel van ElkJonneke BolhaarIryna Rud
CPB Discussion Paper | 347

Are good researchers also good teachers?
The relationship between research quality and
teaching quality
Ali Palali∗1, Roel van Elk1, Jonneke Bolhaar1, and Iryna Rud2
1CPB Netherlands Bureau for Economic Policy Analysis2The Top Institute for Evidence Based Education Research, TIER, Maastricht University
March 15, 2017
Abstract
We investigate the relationship between research quality and teaching quality using data
from Maastricht University, the Netherlands, where students are randomly allocated to dif-
ferent teachers within the same course. We measure research quality by the publication
records of the teachers and teaching quality by both student evaluations of the teachers and
final student grades. We find that being taught by teachers with high quality publications
leads to higher grades for master students. This is not fully reflected in the student evalu-
ations of teachers. Master students do not give higher scores to teachers with high quality
of publications, bachelor students give lower scores.
Keywords: research and teaching, student grades, teacher evaluations
JEL codes: I23, I28
∗Corresponding author. Email: [email protected]
1 Introduction
There is a continuous discussion, both academic and public, on how research and educa-
tion in universities are related (Hattie and Marsh (1996); uz Zaman (2004); Jenkins et al.
(2007); Elken and Wollscheid (2016)). It is often questioned whether a ‘good researcher’
implies also a ‘good teacher’, whether teachers who conduct research are more effective
than those teachers who do not do research, and, in general, whether research and teach-
ing activities can complement each other. Even though answers to these questions are
important for university stakeholders to find the most efficient way in distributing human
resources between research and teaching activities, the current empirical evidence is lim-
ited and mixed. Furthermore, evidence on the relationship between research and teaching
is important for providing a better insight into the effective production of research output
and student learning outcomes.
This study aims to analyse the relationship between research quality and teaching
quality. We use individual-level data from the School of Business and Economics at
Maastricht University in the Netherlands, where students are randomly allocated to dif-
ferent teachers within the same course. At the end of the course, students take the same
exam. This enables us to exploit the exogenous variation in research quality of teachers
on student outcomes such as grades and student evaluation scores. We measure research
quality by the publication records of the teachers. Our results show that master students
who are taught by teachers with high quality publications score higher grades. We do not
find any effect for having any publications or total number of publications. Therefore,
quality seems to matter rather than the quantity. The results on student grades are not
fully reflected in how students evaluate their teachers. Master students do not give higher
scores to teachers with higher number of publications or higher quality of publications.
Bachelor students give lower scores.
Empirical evidence on the relationship between research quality and teaching quality
obtained from using data on randomized experiments is scarce. Our study contributes
to the existing literature by using rich individual-level data on students who are ran-
domly assigned to different teachers within the same course. The second contribution of
2
this study lies in exploring and comparing two different measures of teaching outcomes:
student evaluations of the teachers and final student grades.
This paper is organized as follows: In section 2, we discuss possible mechanisms under-
lying the relationship between research and education. In section 3, we discuss previous
literature on the relationship between research quality and teaching quality. In section
4 we provide an overview of the higher education system in the Netherlands and of the
Maastricht University, in particular. Section 5 describes data and presents descriptive
statistics. In section 6, we describe our empirical strategy. In section 7, we discuss our
estimation results. Finally, section 8 concludes.
2 Mechanisms linking research quality and teaching
quality
The link between research quality and teaching quality is complex and multidimensional.
Based on the previous literature, we distinguish several main mechanisms that can underlie
this relationship. Depending on which of the mechanisms dominates, this relationship can
vary from positive to null, and even to a negative one.
The first type of mechanisms suggests a positive relationship between research and
teaching via complementarity between skills (uz Zaman (2004)). Conducting research
can both enhance teacher’s proficiency in the subject and keep the teacher up-to-date
with regards to the newest developments in the discipline. As a result, research activities
would have a positive impact on teaching quality. Such skills transfer can operate not only
at the level of teacher but also at the teacher-student level. For example, through involve-
ment in teaching activities and interactions with students during classroom discussions,
researchers can transfer their critical thinking and research skills to students.
The second set of mechanisms suggests a negative relationship between research and
teaching. Both research and teaching activities require investment of time and effort.
Being involved in one activity, for instance, the process of conducting research, usually
does not allow for simultaneously spending time and effort on another activity (the pro-
cess of teaching), unless one activity benefits both research and teaching (e.g. reading
3
a scientific paper can simultaneously contribute to research ideas and to teaching prepa-
ration). Time and effort allocated to teaching and research are also influenced by the
system of incentives in academia. Research can be rewarded by universities through pro-
motion more generously than teaching. Therefore, there can be a selective inflow into the
profession, or people in academia might choose to prioritize research over teaching, and
they might be more likely to build career in academia by doing research, while teaching
is often regarded as “punishment” (Walstad and Allgood (2005); Cretchley et al. (2014);
De Philippis (2015)). Furthermore, contrary to the first mechanism teaching and research
might require different set of skills. If research requires more specific skills (e.g. synthesis,
deduction) than teaching (e.g. communication, mentoring), this can lead to disparities
between skill transfers. Hence, the relationship between research output and teaching ef-
fectiveness might be neutral or even negative. Which one of these mechanisms dominates
the others is an empirical question.
3 Previous literature
The literature on the relationship between research quality and teaching quality is rather
large. However, most of these studies focus on the correlation between the two without
making causal claims. Below we give an extensive review of the literature by first focusing
on the research and teaching quality measures and then focusing on the findings between
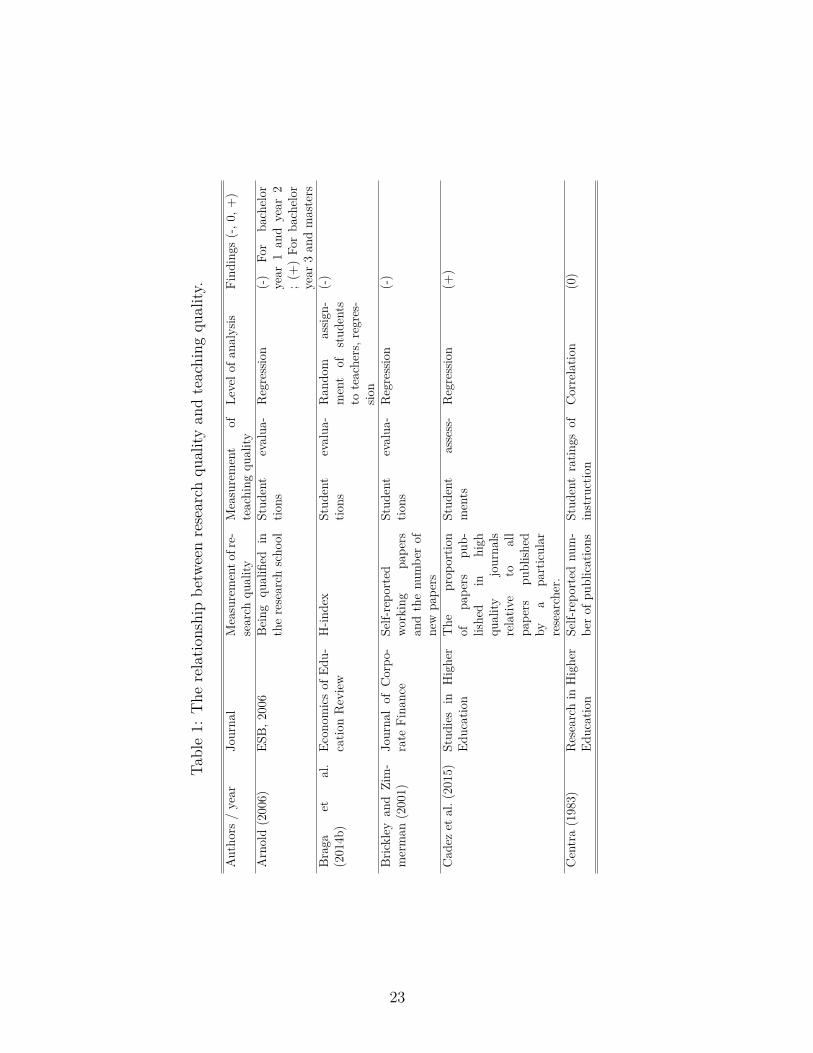
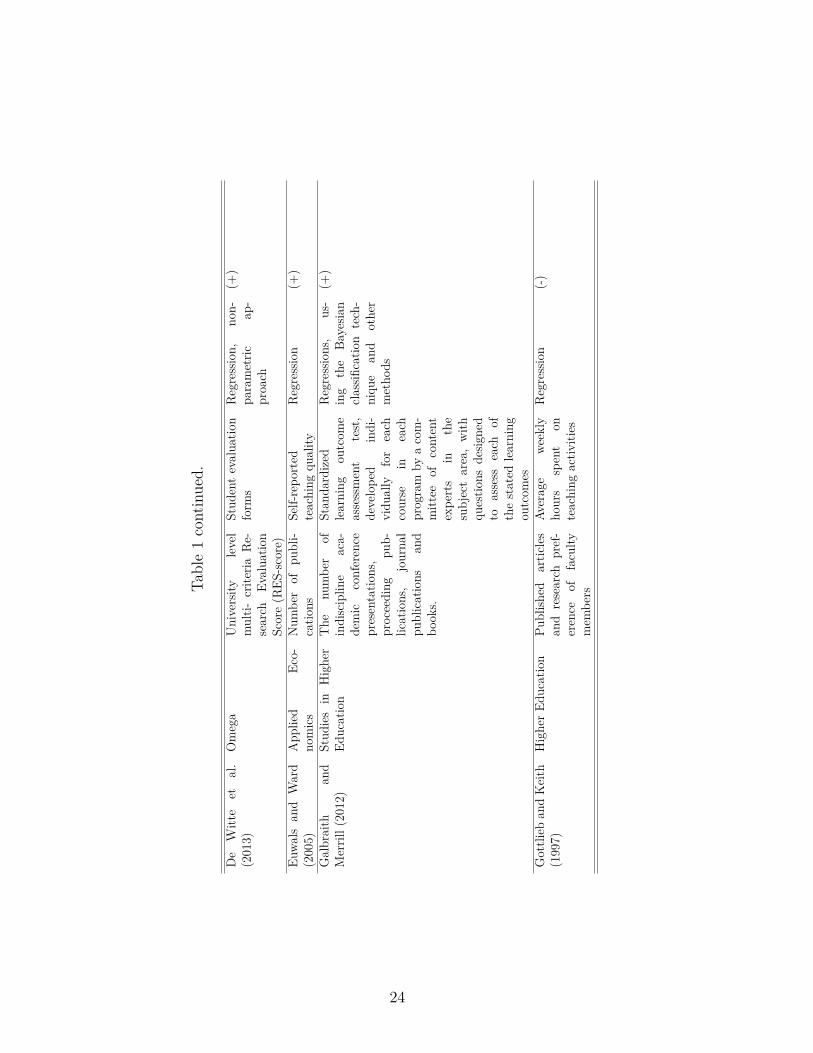
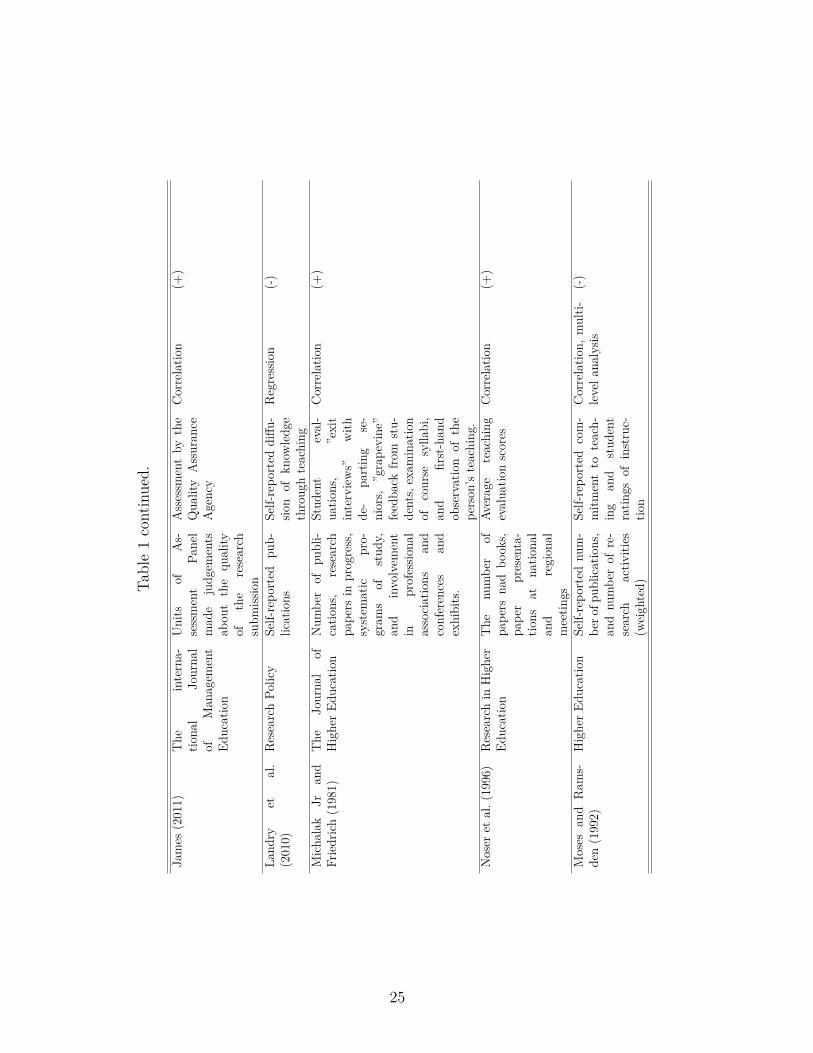
these two measurements. Since the liteture is extensive, we present some of the relevant
papers in Table 1.1
3.1 Measures of research output and teaching quality from the
existing literature
It is generally not straightforward how to measure research quality and teaching qual-
ity. Even if the research quality can be to some extent observed and summarized based1Studies are not included to this table if they are (a) published earlier than 1980; (b) descriptive (non-
empirical); (c) analyze exclusively the link from teaching to research output; (d) based on the analyzes ofteachers(students) believes(views) on the research-teaching relationship; (e) the number of observationsin the analyzes is lower than 20.
4
on (produced) research outcomes, teaching quality cannot be directly observed. In our
study we measure the research quality by publication records of the teachers. We have
information on not only how many publications that a teacher had in a certain year,
but also if these publications appeared in A, B or C level journals. Therefore, we can
differentiate between quantity of publications and quality of publications. For teaching
quality we use two different measures: student evaluation of the teachers and student
grades. Whereas student evaluations capture how students perceive teaching quality of
their teachers, student grades capture the final learning experience.
We are aware of the fact that there are several different measures prosposed in the
literature. Research quality has been traditionally measured by the number of published
and refereed articles (see e.g. Gottlieb and Keith (1997)), by citation scores (see e.g.
Rothman and Preshaw (1975)), by impact factor (Saha et al. (2003)) and by the combined
measures of quantity and quality of publications (Lanjouw and Schankerman (2004);
Hirsch (2005); Bornmann et al. (2008) develop an h-index2 to characterize the scientific
output of researchers, based on both the number of published articles and the impact of
these publications). However all of these measures have been criticized and there is no
consensus in the literature on which measure of research quality should be considered as
universal, but rather the choice of the measure depends on the particular research goals
of the study. In our study, we will use publication records to construct different research
quality measures that vary in emphasis on quantity and quality of publications.
Teaching quality is related to both teacher’s performance and student learning out-
comes. Student evaluations of teachers are the most frequently used measure to estimate
teaching quality in higher education (Becker and Watts (1999); Becker et al. (2012)).
This popularity is mainly explained by the availability of the data on student evalua-
tions. This measure, however, has been increasingly challenged in the literature since it
is based on the perceptions of respondents and it might not necessarily reflect true teach-2Even though it is much more complex than the other measures, h-index also has been criticized in
later studies for non-completeness. Several researchers, for example, argued that this index does notaccount for aging of citation Sidiropoulos et al. (2007); Glanzel (2006); Burrell (2007). At the same time,alternatives to the h-index, such as a g-index (Egghe (2006)), an a-index (Jin (2006)) and an ar-index(Jin (2007)), hardly overcome all drawbacks of the h-index (Bornmann and Daniel (2007); Bornmannet al. (2008)).
5
ing effectiveness. In particular, students often evaluate the teachers on the basis of how
they enjoyed the course and on the basis of teachers’ personal characteristics, and not
necessarily characteristics related to teaching quality (Braga et al. (2014b); McPherson
et al. (2009)). Evidence shows that student evaluations are less biased in the populations
where high-skill students are over-represented (Braga et al. (2014a)). Another concern
is that students are usually not obliged by the institution to provide evaluations, and
they are not randomly selected, which leads to a biased assessment of teacher quality. In
other words, students who eventually fill in evaluation forms represent a selected sample
of all students. Salomons and Goos (2014) quantify the direction and size of selection
on both observable and unobservable characteristics of students, teachers and courses.
They find that the true evaluation score is lower than the average reported, and thus the
selection bias is positive. Moreover, they also conclude that taking student evaluation is
not advisable when response rates are low or vary considerably across courses. Hoffmann
and Oreopoulos (2009) suggest using the mean of the averages for teacher evaluations
across classes, as this ensures that teacher quality measures differ only when instructors
differ. Finally, Emery et al. (2003) and Becker and Watts (1999) advise not to use student
evaluations as the only measure of teaching quality.
The alternative to student evaluation of teachers is actual student grades which are
directly informative about student learning. However, using student grades in empirical
analyses is not without problems either. Some studies point at the fact that teachers can
inflate grades for the purpose of elevating student evaluations (see e.g. Krautmann and
Sander (1999); Johnson (2003); Carrell and West (2010)). This tendency is related to
characteristics of departments and teacher-specific characteristics (Jewell et al. (2013)),
whereas teacher-specific characteristics explain relatively much more variation in grade
inflation. Jewell et al. (2013) explain this by the universal tendency of the universities to
use student evaluation scores as inputs into tenure and promotion decisions, and therefore
teachers are likely to inflate grades rationally. This causes many universities to collect
student evaluations before final exams. Another criticism about using student grades is
that student performance can be influenced by different characteristics of students, not
related to teaching effectiveness (Berk (1988, 2014)). Keeping these criticisms in mind,
6

we use both student evaluations and student grades as teaching quality measures. By
doing so, we also shed more light on the differences between the two measures.
3.2 Existing evidence on the relationship between research qual-
ity and teaching quality
The existing literature on the relationship between research and teaching is primarily lim-
ited to correlational studies. From an extensive review of empirical literature, uz Zaman
(2004) concludes that the correlation between research and teaching varies from -.4 to +.8.
This broad range of findings can be explained by different measures of research quality
and teaching quality, by differences in applied empirical strategies and by a variety of
exogenous and endogenous factors influencing this relationship, such as discipline or the
ability level of students. More recent studies extend the previous correlation literature
by controlling for different educational settings (e.g. discipline, institution type, student
group size, level of studies), characteristics of teachers (e.g. age, academic rank), and
characteristics of students (e.g. gender, ability of students) (see e.g. Zamorski (2002);
Bettinger and Long (2005); Arnold (2006); Cherastidtham et al. (2013)). Nevertheless,
evidence obtained from these studies is mixed.
The relationship between research quality and teaching quality can differ across coun-
tries and educational systems. Whereas the vast majority of previous research on the
relationship between research quality and teaching quality has been conducted for the
United States, there is recently a growing empirical evidence on this relationship from
other countries, such as Korea, Italy, the Netherlands, and Australia (Cherastidtham
et al. (2013); Braga et al. (2014a); Arnold (2006); Bak et al. (2015)). For the Nether-
lands, Arnold (2006) examines the relationship between research quality and teaching
quality at the Faculty of Economics, at Erasmus University of Rotterdam. He creates
a measure of research quality based on the information whether academic staff meets
the criteria for a research fellowship of the graduate school and research institute. He
measures teaching quality by student evaluations of teachers. The study finds a negative
correlation between research quality and teaching quality for the first and second year
7
bachelor courses, while this relationship is positive for the third year bachelor courses and
for the master courses.
Despite controlling for different observable factors influencing research and teaching
and accounting for potential non-linearity of the relationship, most of studies on the
relationship between research and teaching suffer from endogeneity problems, in particular
due to selection issues (i.e. self-selection of teachers to research and teaching activities
and self-selection of students to different teachers). In the recent years, more data on
random assignment of students to different teachers in higher education have become
available and enabled researchers to analyze different aspects in higher education (see
Carrell and West (2010); Braga et al. (2014b,a); Feld and Zulitz (2016)). However, causal
research on the relationship between research quality and teaching quality is still scarce.
The only exception is a study by Braga et al. (2014a) who use data on students who
are randomly assigned to different professors at Bocconi University, Italy to investigate
the relationship between research and teaching. They find that professors who are more
productive in research are likely to be less effective as teachers, when output is measured
by the h-index. The effect is reversed using yearly citations, however it is insignificant.
4 Higher education in the Netherlands and Random-
ization of students
4.1 Higher education in the Netherlands
The system of higher education in the Netherlands is characterized by self-governance,
autonomy of the universities and the unity of research and teaching. In Dutch universities,
the share of time spent on research and teaching is usually fixed by the contract.3
The data we use in this study come from the School of Business and Economics (SBE)
of Maastricht University (UM), one of the biggest higher education institutions in the3Based on self-reported information from academic personnel at Dutch universities (n=4243), it follows
that the share of working time spent on conducting research for PhD candidates is above 70 percent, forpostdoctoral researchers is above 50 percent, for assistant professors and associate professors is between20 and 25 percent, and for professors is below 20 percent. The rest of the contract time is usually spenton teaching and organizational tasks (de Goede and Hessels (2014)).
8
country with over 15 000 students. There are around 4200 students enrolled in one of
the programs at SBE with a high percentage of international students (around 40%).
The vast majority of the bachelor programs last 3 years in contrast to bachelor programs
at, for example, the U.S. Universities which last 4 years. Most of the students continue
their studies with a master program which lasts only one year. The teaching strategy
at the UM provides a unique opportunity to investigate the effect of research quality
on teaching. Students follow weekly or every two weeks lectures in both bachelor and
master programs as in most educational institutions, generally taught by the senior staff
at the departments, which are called course coordinators. Later in that week students
participate in tutorials supervised by other teachers. All tutorials make use of Problem-
Based Learning approach, which is an important component of the teaching philosophy
of the UM (Bastiaens and Nijhuis (2012)). This approach emphasizes on personal skill
development, including problem solving, group work and self-directed learning. Each
tutorial can have at most 16 students, which means that each course at SBE can have
several tutorials taught by different teachers.
At the end of the course, the students who are taking the same course, also take the
same exam even though they participate in tutorials taught by different teachers. The
exam is generally prepared by the course coordinator, and it is for almost all courses in
the form of a written exam. In order to ensure objectivity, the grading is done collectively
by the tutorial teachers. General practice is that each teacher grades a part of the exams
from all students instead of grading only the exams of the students in their tutorials.
Before taking the final exam students fill in online evaluation surveys to indicate their
opinions about course and tutorial teachers as well as the completed course. The teachers
receive the evaluation scores after the final grades are published online. The final grades
are given in a scale of 1-10. The passing grade is 5.5.
4.2 Randomization of students and teachers
Allocation of students into tutorial groups is done by the Scheduling Department at
SBE via a computer program. Before the start of the academic year students register
for the courses that they want to follow. In bachelor programs most of the courses are
9

mandatory for students, whereas in masters programs students can choose among a large
variety of courses. Once the online registration closes, all students taking the same course
are randomly assigned to tutorial groups by a computer program. Afterwards, tutorial
teachers are randomly assigned to tutorial groups within a course.4 Finally, the list
of students in each tutorial group and the corresponding teachers is published by the
Scheduling Department. Even though they are assigned to different tutors, all students
taking the same course take exactly the same exam at the end of the course. Feld and
Zulitz (2016) present more detailed information about the procedure used by SBE and
perform several estimations to check the random assignment of students into tutorial
groups. The authors show that randomization of students works successfully.
5 Data
We received a data set for more than 9000 students in BA and MA programs at UM in the
years 2011, 2012 and 2013. This data set includes information on student grades, courses,
programs at which the students were participating and several background characteristics
such as age and nationality. In total, this data set has 80 000 student-course-grade
observations.
For students who filled in course evaluation forms we also received information on
tutorial groups and teachers. However, not every student fills in the evaluation forms, and
for those who do not fill in evaluation forms there is no tutorial and teacher information.
This means we can only use information about students who fill in evaluation forms,
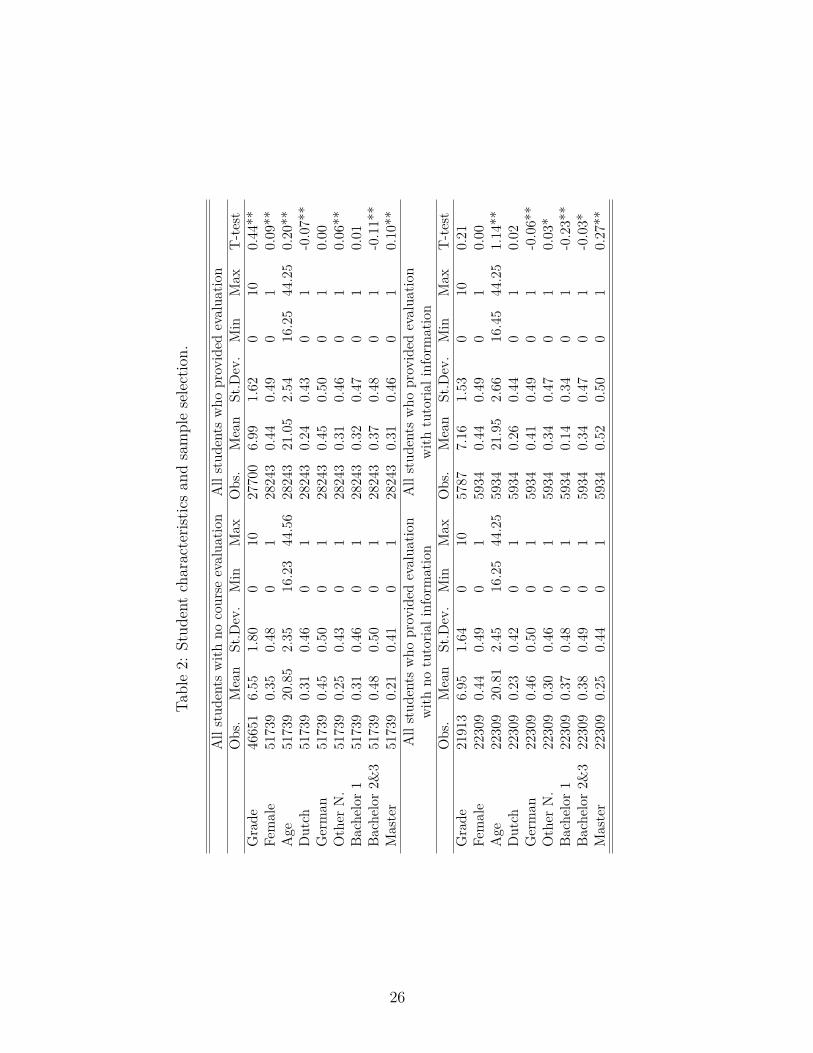
which decreases the number of observations from 80 000 to 28 000. The first panel in
Table 2 shows the descriptive statistics for student characteristics for the whole sample
and for those who filled in evaluation surveys. The last column presents the p-values
for mean differences between the two groups. It shows that the difference between the
two samples is significant for many characteristics. Overall students with higher grades,
female students and older students are more likely to fill in the evaluation surveys. The4It is expected that certain teachers are assigned to certain courses based on their expertise. How-
ever, they are randomly assigned to tutorial groups within one course which does not invalidate ourrandomization.
10
difference between average grade for students who fill in the evaluation forms and those
who do not is 0.4. Even though better students are more likely to fill the evaluation forms,
the difference is not very large considering the grades are given in a scale from 1 to 10.5
The publication records are also obtained from SBE. For teachers who have worked
at UM the entire observed period (2008-2011), we obtain information on publication
record. These records show how many publications that a teacher had in A, B or C
level journals in a certain year.6 Since our measure of research quality entirely depends
on such publication records we make certain choices with regards to the measurement.
First, instead of using the publication records at each year separately we calculate the
total number of publications in the last 4 years for each year so that our measurements
would suffer less from possible outliers. This means, for example, for a teacher who was
teaching in 2011 we use information on the publication records from 2008 to 2011. SBE
does not keep track of the publication records of teachers who did not work at UM for
the entire period or that of PhD students. Therefore, we can use only a subset of the
initial student data set. This subset consists of 5934 student-course-grade observations.
In total there are 176 different courses, which gives 408 course-year combinations. 69 of
these course-year combinations have multiple tutorial groups taught by different teachers.
There are 1127 tutorial groups taught by 83 different teachers. The second panel in Table
2 shows the descriptive statistics for students who filled in evaluation surveys but excluded
due to limited information on publications and for students who are included in the final
analytical sample of 5934 observations. Although several characteristics are significantly
different, student grades do not differ significantly between both groups. Later in Section
7, we discuss these selections more in detail.7
Table 3 shows the distribution of teachers according to the number of publications.5That being sad our results still need to be interpreted with caution as we obtain results for slightly
better and maybe more motivated students in general.6The list of all journals and corresponding classifications used by SBE are given in Table 16 in Appendix
9. SBE’s main strategy in deciding on journal classification is to use 5-year impact factor of the (S)SCIlisted journals.
7Note that we do not explicitly deal with students who drop out. We can not directly observe if astudent drops the course once s/he learns in which tutorial group s/he sits. In order to have an ideaabout such cases we assume that a student can be classified as a drop out if that student registers to acourse but do not make the exam at the end. In the initial sample of 80000 observations, only 7% of thestudents register to a course but do not make the exam. This number is less than 1% for the analyticalsample of 5934 observations.
11
There are 83 teachers in total. 35 of them had at least one A publication, 59 had at least
one B and 60 had at least one C publications in the last 4 years. 15 teachers had one A
publications, 8 teachers had two A publications, and so on. Table 4 shows the interactions
between different publications. No teacher had only A publications, 4 teacher had only B
publications and 6 teachers had only C publications. Finally, 30 teachers had A, B and
C publications in the last 4 years.
In our empirical analyses we make a distinction between bachelor and master students
as the research quality of teachers might have heterogeneous effects on students due to the
differences in course types (mandatory vs. selective courses; general topics vs. specialized
topics), student motivation, etc. Tables 5 and 6 present the descriptive statistics of student
and teacher variables used in the empirical analysis by differentiating first year bachelor
students, second and third year bachelor students and master students.8 Descriptions of
these variables are given in Table 7. Student grades are on average 6.6 for the first year
bachelors, 7.2 for the second and third year bachelors and 7.3 for master students. There
is almost no professor teaching in the first year bachelor courses.9
5.1 Tests for sample selection and randomization of students to
teachers
As noted earlier we have a significant selection in our data because of selection of stu-
dents and restrictions due to teacher information. In order to investigate the selection of
students we perform two descriptive analysis. In the first analysis we regress the proba-
bility of filling in evaluation surveys on student characteristics for all of the students and
then separately for bachelor and master students. Table 8 presents the results. In all
columns the results show that students characteristics are significant in probability to fill
in evaluation surveys. In the second analysis we regress the probability of being in the8Relatively high number of observation for master program is due to the fact that we use information
on teachers (non-PhD students) who worked at UM for the entire period of 2008-20139Note that there are two different Professor positions. The difference between the two is that the first
group has more management responsibilities, has better publication records and rewarded with a bettersalary.
12

analytical sample for those who filled in evaluation forms.10 The results are presented
in Table 9. None of the student characteristics are found to be statistically significant.
Therefore, the observations that we lose due to the restrictions on teacher information
are not systematically different than those included in our analytical sample.
Since randomization of students into teacher groups is the underlying identifying mech-
anism, we perform a randomization check. In order to see if the randomization of students
to different teachers successfully works, we regress teacher specific publication variables
on student characteristics. Table 10 presents the results. In the first column we regress
the probability of having any publication in the last 4 years on student characteristics.
In the following three columns we regress the probability of having any publications in
A, B or C level journals on student characteristics. None of the student characteristics is
significant. Therefore we conclude that, in terms of publication performance of teachers,
randomization works successfully.
6 Model
We investigate the effect of research quality of teachers on teaching quality measured
by student evaluations of the teacher and student grades. For student grades we have
individual data, and we use the following regression:
Gictg = β0 + β1Ptg + β2Ttg + β3Sit + β4Cct + uictg (1)
where Gictg is the grade of student i, in course c and year t and at the tutorial taught
by teacher g. Ptg is the publication record of teacher g, in year t. Similarly, Ttg is the
set of other teacher characteristics. Sit is the student characteristics in year t, which
also includes a program fixed effect for the program that students are enrolled in. Cct
is the course fixed effect for course c in year t.11 uictg is the error term. Since students10Note that only a part of the observations is used in the analytical sample due to unavailability of
data for certain teachers.11Since the courses are taught by senior members of the department, course coordinators, and tutorials
are taught by different teachers, course fixed effects also capture course coordinator effects. This isimportant because course coordinators can be different when it comes to how rigorous they are aboutexam questions, course structure or tutorial guidelines. By controlling for such course fixed effects, we
13
are randomly assigned to different teachers after they make a course choice and take the
same exam at the end of the course, we can interpret the coefficients of Ptg and Ttg as
causal, conditional on Cct. In all estimations we use robust standard errors clustered on
the course-year level because of a possible correlation between the outcomes of students
choosing the same course.
For student evaluations of the teachers, we have data only on the teacher level unlike
the data on student grades. In other words we know the average evaluation score that a
teacher receives after the course ends. Therefore, we cannot perform the same individual
level analysis as in the student grades analysis. In order to investigate the evaluation
scores we use averages of the all variables on tutorial (teacher) level. The regression
equation is
Ectg = β0 + β1Ptg + β2Ttg + β3Stg + β4Cct + vctg (2)
where Ectg is the average teacher evaluation score in course c, year t and at the tutorial
taught by teacher g. Ptg is the publication record of teacher g, Ttg is the set of other teacher
characteristics in year t. St is the average of student characteristics in tutorial g in year
t. Cct is again the set of fixed effects for course c in year t. vctg is the error term.
The course structure in the bachelor and master programs are different. Courses in
bachelor programs tend to be general introduction courses on various topics. Courses
in master programs, on the other hand, are mostly specialized courses. When a teacher
gives a course on the specific topic that s/he specializes in, we expect the expertise and
motivation to be different. Therefore, in our estimations we run the above-mentioned
model first for all students, and then for bachelor and master students separately.
7 Results
First, we present the results of individual level student grade estimations. The results
are displayed in Table 11. The first column displays the results for all students, the rest
achieve identification through within variation- variation due to the different teachers in different tutorialsfor the same course.
14
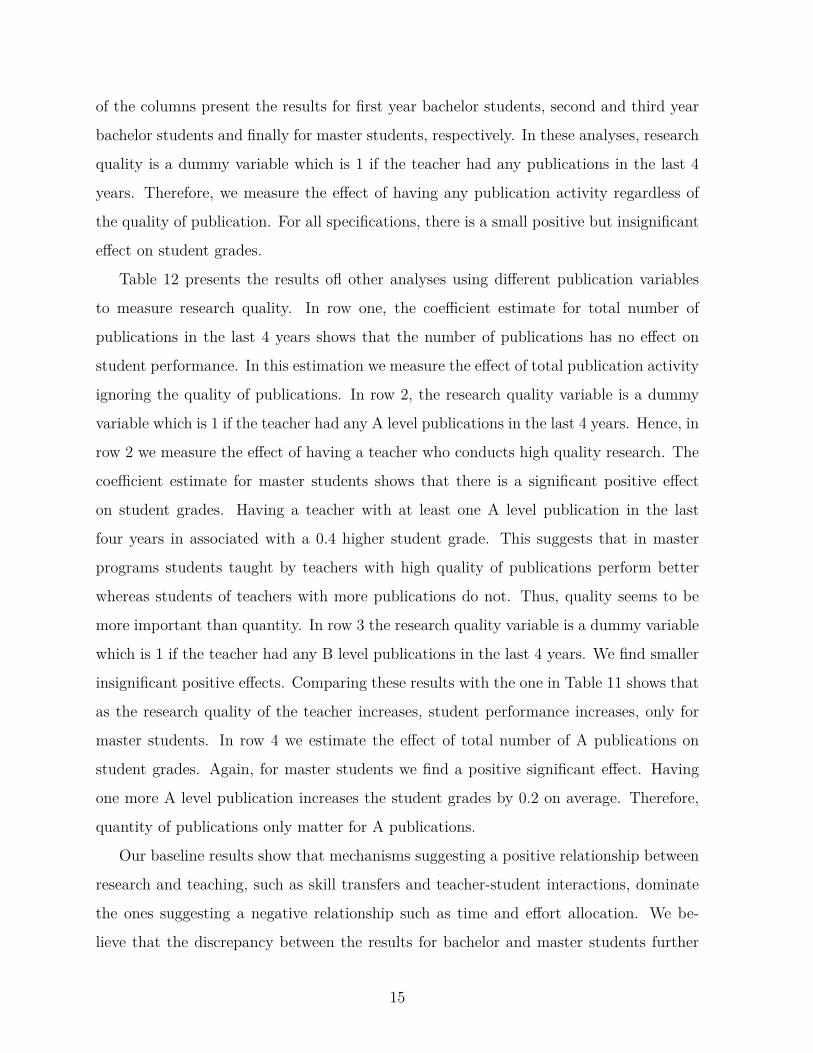
of the columns present the results for first year bachelor students, second and third year
bachelor students and finally for master students, respectively. In these analyses, research
quality is a dummy variable which is 1 if the teacher had any publications in the last 4
years. Therefore, we measure the effect of having any publication activity regardless of
the quality of publication. For all specifications, there is a small positive but insignificant
effect on student grades.
Table 12 presents the results ofl other analyses using different publication variables
to measure research quality. In row one, the coefficient estimate for total number of
publications in the last 4 years shows that the number of publications has no effect on
student performance. In this estimation we measure the effect of total publication activity
ignoring the quality of publications. In row 2, the research quality variable is a dummy
variable which is 1 if the teacher had any A level publications in the last 4 years. Hence, in
row 2 we measure the effect of having a teacher who conducts high quality research. The
coefficient estimate for master students shows that there is a significant positive effect
on student grades. Having a teacher with at least one A level publication in the last
four years in associated with a 0.4 higher student grade. This suggests that in master
programs students taught by teachers with high quality of publications perform better
whereas students of teachers with more publications do not. Thus, quality seems to be
more important than quantity. In row 3 the research quality variable is a dummy variable
which is 1 if the teacher had any B level publications in the last 4 years. We find smaller
insignificant positive effects. Comparing these results with the one in Table 11 shows that
as the research quality of the teacher increases, student performance increases, only for
master students. In row 4 we estimate the effect of total number of A publications on
student grades. Again, for master students we find a positive significant effect. Having
one more A level publication increases the student grades by 0.2 on average. Therefore,
quantity of publications only matter for A publications.
Our baseline results show that mechanisms suggesting a positive relationship between
research and teaching, such as skill transfers and teacher-student interactions, dominate
the ones suggesting a negative relationship such as time and effort allocation. We be-
lieve that the discrepancy between the results for bachelor and master students further
15

strengthens this interpretation. Finding a stronger effect for master students is not partic-
ular to our analysis (see Arnold (2006)) and can be explained by the course characteristics
in the bachelor and master programs. Most of the courses in the bachelor programs are
mandatory courses on introductory level. However, master courses can be elective ones,
more specialized on certain topics and followed by students who are more interested and
motivated. It is also generally the case that teachers give special topic courses which
primarily focus on their field of interest. This can increase the effects of skill transfers
and the effects of interactions between teachers and students.
In Table 13 we present the results of some sensitivity analyses where we introduce more
covariates using student level and tutor level information. For these sensitivity analysis
we use the specification in the second row of Table 12.12 In panel 1, we introduce tutor-
student gender combinations. The coefficient estimates show that male students taught
by female teachers perform worse in comparison to male students who are taught by male
teachers in the master program. In panel 2, we add peer variables by calculating the
average age and percentage of females in the classroom for peers of students. We perform
this analysis because peer effects can be important in the classroom. The coefficient
estimate of the publication variable remains the same. Finally, in panel 3 we add variables
to capture the academic position of the teachers. The reference group is lecturers. The
correlation between publications and positions is very high. This is of course expected as
the decision to promote an assistant professor to associate professor position, for example,
mainly depends on the publication records of the academic. Once we control for the
position variable, the variation in the publication variable becomes very small. This is
reflected in the higher standard error for the publication variable.1314
In Table 14 we present the results of teacher evaluations. The coefficient estimate
for having any publication shows that teachers with publications receive lower evaluation12Although we perform the sensitivity analysis for all of the other specifications, we present only the
results of the third specification due to high significant effect of research quality measure. All otherresults remain the same once we introduce more variables, and they are available upon request.
13We choose to include the variables on academic position only in a sensitivity analysis because ofcorrelation between publication records and academic positions. This correlation is not surprising asdecisions on promotions/tenure largely depend on publishing performance.
14When it comes to the question of whether we can control for experience of the tutor, we can do thatpartly by including the age of the tutor. In all our estimations we control for the age. Therefore, webelieve that we partly control for the work experience.
16
scores on average although the coefficients are estimated imprecisely.15 Table 15 presents
the results for other publication measures. The results for master students show that
coefficient estimates are positive but small, indicating that teachers with high quality
publications do not receive higher evaluation scores. The teachers with publications on
the other hand receive lower scores in the second and third year of the bachelor programs.
The difference between the results concerning students grades and student evaluations
is important. As mentioned earlier when students evaluate the teachers, they do not nec-
essarily evaluate the teaching effectiveness. Evaluation scores might reflect the personality
of the teacher or in general personal experience in the classroom. A rigorous demanding
teacher for example might end up with a lower score compared to a fun but not much
better teacher. This can explain the smaller or even the negative results for evaluation
scores estimations. This is in line with some of the previous findings in the literature
(see Emery et al. (2003)). Student grades, on the other hand, might reflect true learning
experience and can be more informative in measuring teaching effectiveness.
8 Conclusion
There is a continuous debate about the relationship between research quality of academi-
cians and their teaching performance. Are good researchers also good teachers? Answer-
ing this question is important not only for scientific merit but also for policy-making,
especially for higher education stakeholders as the answer can help them in distributing
human resources more efficiently between research and teaching.
In this paper we investigate the relationship between research quality and teaching
quality. We use data from Maastricht University, the Netherlands, where students are
randomly allocated to different teachers even though they all take the same exam. The
research quality is measured by the publication records of the teachers. The teaching
quality is measured by both student grades and student evaluations of the teachers. Ex-
ploiting the random allocation of students to different teachers, and the fact that students
with different teachers make the same exam, we find that master students who are taught15The high positive coefficient estimate for the first year bachelor students is most probably due to the
low number of observations.
17
by teachers with high quality publications score higher grades. However, we do not find
any effect for having any publications or total number of publications. This shows that
quality matters when it comes to student performances, and the quantity matters only
if the quality is good because only for A publications the number of publications has
a significant positive effect on student grades. Moreover, we believe that the stronger
results for master students strengthen our interpretation of the findings. The vast major-
ity of the courses in the bachelor programs are mandatory courses on introductory level.
However, master courses can be elective ones, they are much more specialized on certain
topics, generally in the interest areas of teachers, and followed by students who are more
interested and motivated. This can increase the effects of aforementioned skill transfers
and the interactions between teachers and students in the classrooms.
The results based on course evaluations show that the findings from student grades
estimations are not fully reflected in how students evaluate their teachers. Master stu-
dents do not give higher scores to teachers with higher number of publications or higher
quality of publications. Moreover, bachelor students give lower scores to teachers with
publications. The difference between the results of student grades and student evaluation
scores estimations indicates that the two measures capture different things. Evaluation
scores might reflect the personality of the teacher or in general personal experience in the
classroom rather than learning. Hence, we conclude that it is useful to use both measures
in analyzing teaching quality.
When it comes to the policy implications of our findings, one should interpret the
results with caution. Our findings cannot be interpreted as evidence supporting or dis-
missing the argument that research and teaching at the universities should be separated.
Our results also do not answer how much time the teachers should spend on teaching
or research. We conclude that excellent research performance contributes to a higher
teaching quality in the master programs if the quality of teaching is measured by student
grades. This might suggest that if good researchers have indeed time for teaching, then
they better should be allocated to courses in the master programs.
18
ReferencesArnold, I. (2006). Het beste onderwijs komt uit de ivoren toren. Economisch Statistische
Berichten, 334–335.
Bak, H.-J. et al. (2015). Too much emphasis on research? an empirical examination of therelationship between research and teaching in multitasking environments. Research in HigherEducation 56 (8), 843–860.
Bastiaens, E. and J. Nijhuis (2012). From problem-based learning to undergraduate research:The experience of maastricht university in the netherlands. Council on Undergraduate Re-search Quarterly 32, 43.
Becker, W. E., W. Bosshardt, and M. Watts (2012). Revisiting how departments of economicsevaluate teaching. Citeseer.
Becker, W. E. and M. Watts (1999). How departments of economics evaluate teaching. AmericanEconomic Review, 344–349.
Berk, R. A. (1988). Fifty reasons why student achievement gain does not mean teacher effec-tiveness. Journal of Personnel Evaluation in Education 1 (4), 345–363.
Berk, R. A. (2014). Should student outcomes be used to evaluate teaching? The Journal ofFaculty Development 28 (2), 87.
Bettinger, E. and B. T. Long (2005). Help or hinder? adjunct professors and student outcomes.Technical report, What’s happening to public higher education.
Bornmann, L. and H.-D. Daniel (2007). What do we know about the h index? Journal of theAmerican Society for Information Science and technology 58 (9), 1381–1385.
Bornmann, L., R. Mutz, and H.-D. Daniel (2008). Are there better indices for evaluation pur-poses than the h index? a comparison of nine different variants of the h index using data frombiomedicine. Journal of the American Society for Information Science and Technology 59 (5),830–837.
Braga, M., M. Paccagnella, and M. Pellizzari (2014a). The academic and labor market returnsof university professors. IZA Discussion Paper 7902, Institute for Labour Market PolicyEvaluation.
Braga, M., M. Paccagnella, and M. Pellizzari (2014b). Evaluating students’ evaluations ofprofessors. Economics of Education Review 41, 71–88.
Brickley, J. and J. Zimmerman (2001). Changing incentives in a multitask environment: evidencefrom a top-tier business school. Journal of Corporate Finance 7, 367–396.
Burrell, Q. (2007). Hirsch index or hirsch rate? some thoughts arising from liang’s data.Scientometrics 73 (1), 19–28.
Cadez, S., V. Dimovski, and M. Zaman Groff (2015). Research, teaching and performanceevaluation in academia: the salience of quality. Studies in Higher Education, 1–19.
19
Carrell, S. E. and J. E. West (2010). Does professor quality matter? evidence from randomassignment of students to professors. Journal of Political Economy 118 (3), 409–432.
Centra, J. A. (1983). Research productivity and teaching effectiveness. Research in Highereducation 18 (4), 379–389.
Cherastidtham, I., J. Sonnemann, and A. Norton (2013). The teaching-research nexus in highereducation. (2013- 12).
Cretchley, P., S. Edwards, P. O’Shea, J. Sheard, J. Hurst, and W. Brookes (2014). Researchand/or learning and teaching: a study of australian professors’ priorities, beliefs and be-haviours. Higher Education Research and Development 33 (4), 649–669.
de Goede, M. and L. Hessels (2014). Drijfveren van onderzoekers. Technical report, RathenauInstitute.
De Philippis, M. (2015). Multitask Agents and Incentives: The Case of Teaching and Researchfor University Professors. CEP working paper 1386.
De Witte, K., N. Rogge, L. Cherchye, and T. Van Puyenbroeck (2013). Economies of scope inresearch and teaching: A non-parametric investigation. Omega 41, 305–314.
Egghe, L. (2006). How to improve the h-index. The Scientist (3), 14.
Elken, M. and S. Wollscheid (2016). The relationship between research and education: typologiesand indicators. A literature review. , Nordic Institute for Studies in Innovation, Researchand Education.
Emery, C. R., T. R. Kramer, and R. G. Tian (2003). Return to academic standards: A critiqueof student evaluations of teaching effectiveness. Quality Assurance in Education 11 (1), 37–46.
Euwals, R. and M. E. Ward (2005). What matters most: teaching or research? empiricalevidence on the remuneration of british academics. Applied Economics 37 (14), 1655–1672.
Feld, J. and U. Zulitz (2016). Understanding peer effects: On the nature, estimation andchannels of peer effects. Journal of Labor Economics Forthcoming.
Galbraith, C. S. and G. B. Merrill (2012). Faculty research productivity and standardizedstudent learning outcomes in a university teaching environment: A bayesian analysis of rela-tionships. Studies in Higher Education 37 (4), 469–480.
Glanzel, W. (2006). On the opportunities and limitations of the h-index. Science focus.
Gottlieb, E. E. and B. Keith (1997). The academic research-teaching nexus in eight advanced-industrialized countries. Higher Education 34 (3), 397–419.
Hattie, J. and H. W. Marsh (1996). The relationship between research and teaching: A meta-analysis. Review of educational research 66 (4), 507–542.
Hattie, J. and H. W. Marsh (2004). One journey to unravel the relationship between researchand teaching. In Research and teaching: Closing the divide? An International Colloquium,pp. 18–19.
20

Hirsch, J. E. (2005). An index to quantify an individual’s scientific research output. Proceedingsof the National academy of Sciences of the United States of America 102 (46), 16569–16572.
Hoffmann, F. and P. Oreopoulos (2009). Professor qualities and student achievement. TheReview of Economics and Statistics 91 (1), 83–92.
James, S. (2011). Does business school research have to be” excellent” to benefit business schoolteaching? The international journal of management education 9 (2), 37–47.
Jenkins, A., M. Healey, and R. Zetter (2007). Linking teaching and research in disciplines anddepartments. Technical report, The Higher Education Academy.
Jewell, R. T., M. A. McPherson, and M. A. Tieslau (2013). Whose fault is it? assigning blamefor grade inflation in higher education. Applied economics 45 (9), 1185–1200.
Jin, B. (2006). H-index: an evaluation indicator proposed by scientist. Science Focus 1 (1), 8–9.
Jin, B. (2007). The ar-index: complementing the h-index. ISSI newsletter 3 (1), 6.
Johnson, V. E. (2003). Grade inflation: A crisis in college education. Springer Science &Business Media.
Krautmann, A. C. and W. Sander (1999). Grades and student evaluations of teachers. Economicsof Education Review 18 (1), 59–63.
Landry, R., M. Saıhi, N. Amara, and M. Ouimet (2010). Evidence on how academics managetheir portfolio of knowledge transfer activities. Research Policy 39 (10), 1387–1403.
Lanjouw, J. O. and M. Schankerman (2004). Patent quality and research productivity: Measur-ing innovation with multiple indicators*. The Economic Journal 114 (495), 441–465.
McPherson, M. A., R. T. Jewell, and M. Kim (2009). What determines student evaluationscores? a random effects analysis of undergraduate economics classes. Eastern EconomicJournal 35 (1), 37–51.
Michalak Jr, S. J. and R. J. Friedrich (1981). Research productivity and teaching effectivenessat a small liberal arts college. The Journal of Higher Education, 578–597.
Moses, I. and P. Ramsden (1992). Academic values and academic practice in the new universities.Higher Education Research and Development 11 (2), 101–118.
Noser, T. C., H. Manakyan, and J. R. Tanner (1996). Research productivity and perceivedteaching effectiveness: A survey of economics faculty. Research in Higher Education 37 (3),199–221.
Rothman, A. and R. Preshaw (1975). Is scientific achievement a correlate of effective teachingperformance? Research in Higher Education 3 (1), 29–34.
Saha, S., S. Saint, and D. A. Christakis (2003). Impact factor: a valid measure of journalquality? Journal of the Medical Library Association 91 (1), 42.
Salomons, A. and M. Goos (2014). Measuring teaching quality in higher education. Tjalling C.Koopmans Research Institute Discussion Paper Series (DP 14-16).
21
Sidiropoulos, A., D. Katsaros, and Y. Manolopoulos (2007). Generalized hirsch h-index fordisclosing latent facts in citation networks. Scientometrics 72 (2), 253–280.
Stack, S. (2003). Research productivity and student evaluation of teaching in social scienceclasses: A research note. Research in Higher Education 44 (5), 539–556.
uz Zaman, M. Q. (2004). Review of the academic evidence on the relationship between teachingand research in Higher Education. Department for Education and Skills London.
Walstad, W. B. and S. Allgood (2005). Views of teaching and research in economics and otherdisciplines. American Economic Review, 177–183.
Zamorski, B. (2002). Research-led teaching and learning in higher education. Teaching in HigherEducation 7 (4), 411–427.
22
Tabl
e1:
The
rela
tions
hip
betw
een
rese
arch
qual
ityan
dte
achi
ngqu
ality
.
Aut
hors
/ye
arJo
urna
lM
easu
rem
ento
fre-
sear
chqu
ality
Mea
sure
men
tof
teac
hing
qual
ityLe
velo
fana
lysis
Find
ings
(-,0
,+)
Arn
old
(200
6)ES
B,20
06Be
ing
qual
ified
inth
ere
sear
chsc
hool
Stud
ent
eval
ua-
tions
Reg
ress
ion
(-)
For
bach
elor
year
1an
dye
ar2
;(+
)Fo
rba
chel
orye
ar3
and
mas
ters
Brag
aet
al.
(201
4b)
Econ
omic
sof
Edu-
catio
nR
evie
wH
-inde
xSt
uden
tev
alua
-tio
nsR
ando
mas
sign-
men
tof
stud
ents
tote
ache
rs,r
egre
s-sio
n
(-)
Brick
ley
and
Zim
-m
erm
an(2
001)
Jour
nal
ofC
orpo
-ra
teFi
nanc
eSe
lf-re
port
edwo
rkin
gpa
pers
and
the
num
ber
ofne
wpa
pers
Stud
ent
eval
ua-
tions
Reg
ress
ion
(-)
Cad
ezet
al.(
2015
)St
udie
sin
Hig
her
Educ
atio
nT
hepr
opor
tion
ofpa
pers
pub-
lishe
din
high
qual
ityjo
urna
lsre
lativ
eto
all
pape
rspu
blish
edby
apa
rtic
ular
rese
arch
er.
Stud
ent
asse
ss-
men
tsR
egre
ssio
n(+
)
Cen
tra
(198
3)R
esea
rch
inH
ighe
rEd
ucat
ion
Self-
repo
rted
num
-be
rof
publ
icat
ions
Stud
ent
ratin
gsof
inst
ruct
ion
Cor
rela
tion
(0)
23
Tabl
e1
cont
inue
d.
De
Witt
eet
al.
(201
3)O
meg
aU
nive
rsity
leve
lm
ulti-
crite
riaR
e-se
arch
Eval
uatio
nSc
ore
(RES
-sco
re)
Stud
ent
eval
uatio
nfo
rms
Reg
ress
ion,
non-
para
met
ricap
-pr
oach
(+)
Euwa
lsan
dW
ard
(200
5)A
pplie
dEc
o-no
mic
sN
umbe
rof
publ
i-ca
tions
Self-
repo
rted
teac
hing
qual
ityR
egre
ssio
n(+
)
Gal
brai
than
dM
erril
l(20
12)
Stud
ies
inH
ighe
rEd
ucat
ion
The
num
ber
ofin
disc
iplin
eac
a-de
mic
conf
eren
cepr
esen
tatio
ns,
proc
eedi
ngpu
b-lic
atio
ns,
jour
nal
publ
icat
ions
and
book
s.
Stan
dard
ized
lear
ning
outc
ome
asse
ssm
ent
test
,de
velo
ped
indi
-vi
dual
lyfo
rea
chco
urse
inea
chpr
ogra
mby
aco
m-
mitt
eeof
cont
ent
expe
rts
inth
esu
bjec
tar
ea,
with
ques
tions
desig
ned
toas
sess
each
ofth
est
ated
lear
ning
outc
omes
Reg
ress
ions
,us
-in
gth
eBa
yesia
ncl
assifi
catio
nte
ch-
niqu
ean
dot
her
met
hods
(+)
Got
tlieb
and
Kei
th(1
997)
Hig
her
Educ
atio
nPu
blish
edar
ticle
san
dre
sear
chpr
ef-
eren
ceof
facu
ltym
embe
rs
Aver
age
week
lyho
urs
spen
ton
teac
hing
activ
ities
Reg
ress
ion
(-)
24
Tabl
e1
cont
inue
d.
Jam
es(2
011)
The
inte
rna-
tiona
lJo
urna
lof
Man
agem
ent
Educ
atio
n
Uni
tsof
As-
sess
men
tPa
nel
mad
eju
dgem
ents
abou
tth
equ
ality
ofth
ere
sear
chsu
bmiss
ion
Ass
essm
ent
byth
eQ
ualit
yA
ssur
ance
Age
ncy
Cor
rela
tion
(+)
Land
ryet
al.
(201
0)R
esea
rch
Polic
ySe
lf-re
port
edpu
b-lic
atio
nsSe
lf-re
port
eddi
ffu-
sion
ofkn
owle
dge
thro
ugh
teac
hing
Reg
ress
ion
(-)
Mich
alak
Jran
dFr
iedr
ich(1
981)
The
Jour
nal
ofH
ighe
rEd
ucat
ion
Num
ber
ofpu
bli-
catio
ns,
rese
arch
pape
rsin
prog
ress
,sy
stem
atic
pro-
gram
sof
stud
y,an
din
volv
emen
tin
prof
essio
nal
asso
ciat
ions
and
conf
eren
ces
and
exhi
bits
.
Stud
ent
eval
-ua
tions
,”e
xit
inte
rvie
ws”
with
de-
part
ing
se-
nior
s,”g
rape
vine
”fe
edba
ckfro
mst
u-de
nts,
exam
inat
ion
ofco
urse
sylla
bi,
and
first
-han
dob
serv
atio
nof
the
pers
on’s
teac
hing
.
Cor
rela
tion
(+)
Nos
eret
al.(
1996
)R
esea
rch
inH
ighe
rEd
ucat
ion
The
num
ber
ofpa
pers
nad
book
s,pa
per
pres
enta
-tio
nsat
natio
nal
and
regi
onal
mee
tings
Aver
age
teac
hing
eval
uatio
nsc
ores
Cor
rela
tion
(+)
Mos
esan
dR
ams-
den
(199
2)H
ighe
rEd
ucat
ion
Self-
repo
rted
num
-be
rofp
ublic
atio
ns,
and
num
ber
ofre
-se
arch
activ
ities
(wei
ghte
d)
Self-
repo
rted
com
-m
itmen
tto
teac
h-in
gan
dst
uden
tra
tings
ofin
stru
c-tio
n
Cor
rela
tion,
mul
ti-le
vela
naly
sis(-
)
25
Tabl
e2:
Stud
ent
char
acte
ristic
san
dsa
mpl
ese
lect
ion.
All
stud
ents
with
noco
urse
eval
uatio
nA
llst
uden
tsw
hopr
ovid
edev
alua
tion
Obs
.M
ean
St.D
ev.
Min
Max
Obs
.M
ean
St.D
ev.
Min
Max
T-t
est
Gra
de46
651
6.55
1.80
010
2770
06.
991.
620
100.
44**
Fem
ale
5173
90.
350.
480
128
243
0.44
0.49
01
0.09
**A
ge51
739
20.8
52.
3516
.23
44.5
628
243
21.0
52.
5416
.25
44.2
50.
20**
Dut
ch51
739
0.31
0.46
01
2824
30.
240.
430
1-0
.07*
*G
erm
an51
739
0.45
0.50
01
2824
30.
450.
500
10.
00O
ther
N.
5173
90.
250.
430
128
243
0.31
0.46
01
0.06
**Ba
chel
or1
5173
90.
310.
460
128
243
0.32
0.47
01
0.01
Bach
elor
2&3
5173
90.
480.
500
128
243
0.37
0.48
01
-0.1
1**
Mas
ter
5173
90.
210.
410
128
243
0.31
0.46
01
0.10
**A
llst
uden
tsw
hopr
ovid
edev
alua
tion
All
stud
ents
who
prov
ided
eval
uatio
nw
ithno
tuto
riali
nfor
mat
ion
with
tuto
riali
nfor
mat
ion
Obs
.M
ean
St.D
ev.
Min
Max
Obs
.M
ean
St.D
ev.
Min
Max
T-t
est
Gra
de21
913
6.95
1.64
010
5787
7.16
1.53
010
0.21
Fem
ale
2230
90.
440.
490
159
340.
440.
490
10.
00A
ge22
309
20.8
12.
4516
.25
44.2
559
3421
.95
2.66
16.4
544
.25
1.14
**D
utch
2230
90.
230.
420
159
340.
260.
440
10.
02G
erm
an22
309
0.46
0.50
01
5934
0.41
0.49
01
-0.0
6**
Oth
erN
.22
309
0.30
0.46
01
5934
0.34
0.47
01
0.03
*Ba
chel
or1
2230
90.
370.
480
159
340.
140.
340
1-0
.23*
*Ba
chel
or2&
322
309
0.38
0.49
01
5934
0.34
0.47
01
-0.0
3*M
aste
r22
309
0.25
0.44
01
5934
0.52
0.50
01
0.27
**
26
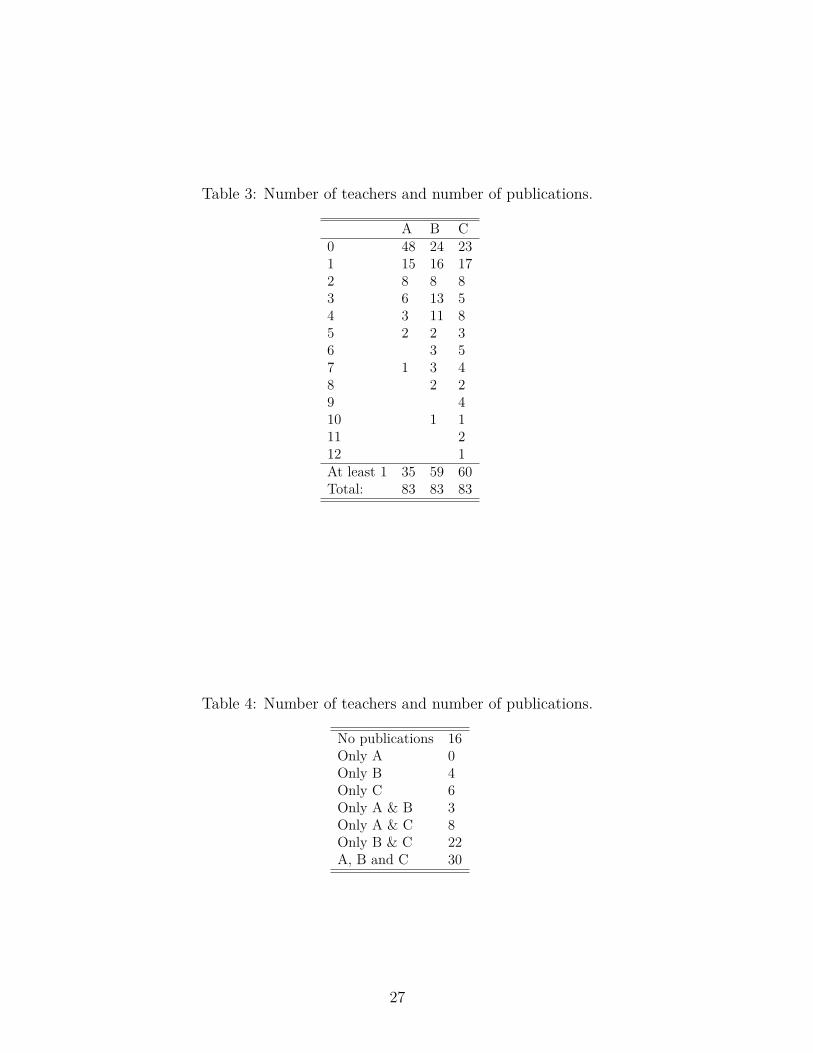
Table 3: Number of teachers and number of publications.
A B C0 48 24 231 15 16 172 8 8 83 6 13 54 3 11 85 2 2 36 3 57 1 3 48 2 29 410 1 111 212 1At least 1 35 59 60Total: 83 83 83
Table 4: Number of teachers and number of publications.
No publications 16Only A 0Only B 4Only C 6Only A & B 3Only A & C 8Only B & C 22A, B and C 30
27

Table 5: Student characteristics in the analytical sample.
Bachelor 1 Bachelor 2&3 MasterObs. Mean St.Dev. Obs. Mean St.Dev. Obs. Mean St.Dev.
Grade 784 6.61 1.86 1970 7.19 1.56 3033 7.29 1.37Female 810 0.42 0.49 2028 0.41 0.49 3096 0.48 0.49Age 810 19.04 1.56 2028 20.83 1.77 3096 23.45 2.37Dutch 810 0.26 0.44 2028 0.22 0.41 3096 0.28 0.45German 810 0.47 0.50 2028 0.45 0.50 3096 0.36 0.48Other N. 810 0.27 0.44 2028 0.33 0.47 3096 0.36 0.48
Table 6: Teacher characteristics in the analytical sample.
Bachelor 1 Bachelor 2&3 MasterObs. Mean St.Dev. Obs. Mean St.Dev. Obs. Mean St.Dev.
Evaluation score 810 8.01 1.26 2028 7.91 1.29 3094 7.93 1.14Female 810 0.11 0.31 2028 0.08 0.28 3094 0.17 0.37Dutch 810 0.48 0.5 2028 0.57 0.49 3094 0.59 0.49Age 810 45.62 7.15 2028 46.44 8.62 3094 43.65 9.8Professor 1 810 – – 2028 0.05 0.21 3094 0.16 0.44Professor 2 810 0.01 0.07 2028 0.09 0.29 3094 0.06 0.24Assistant Prof. 810 0.11 0.31 2028 0.19 0.39 3094 0.35 0.49Associate Prof. 810 0.13 0.34 2028 0.2 0.43 3094 0.22 0.47Lecturer 810 0.76 0.43 2028 0.53 0.59 3094 0.27 0.44
28

Table 7: Descriptions of student and teacher specific variables.
Grade Final exam grade of the student, from 1 to 10.Evaluation score Evaluation score of the teacher in a tutor group, from 1 to 10.
“Evaluate the overall functioning of your tutor with a grade from 1 to 10. ”Female 1 if the student/tutor is femaleAge Age of the student/tutor in the academic yearDutch 1 if the student/tutor is DutchGerman 1 if the student is GermanOther N. 1 if the student/tutor is from another countryProfessor 1/2 1 if the teacher is appointed as a professorAssistant Prof. 1 if the teacher is appointed as an assistant professorAssociate Prof. 1 if the teacher is appointed as an associate professorLecturer 1 if the teacher is appointed as a lecturer
29
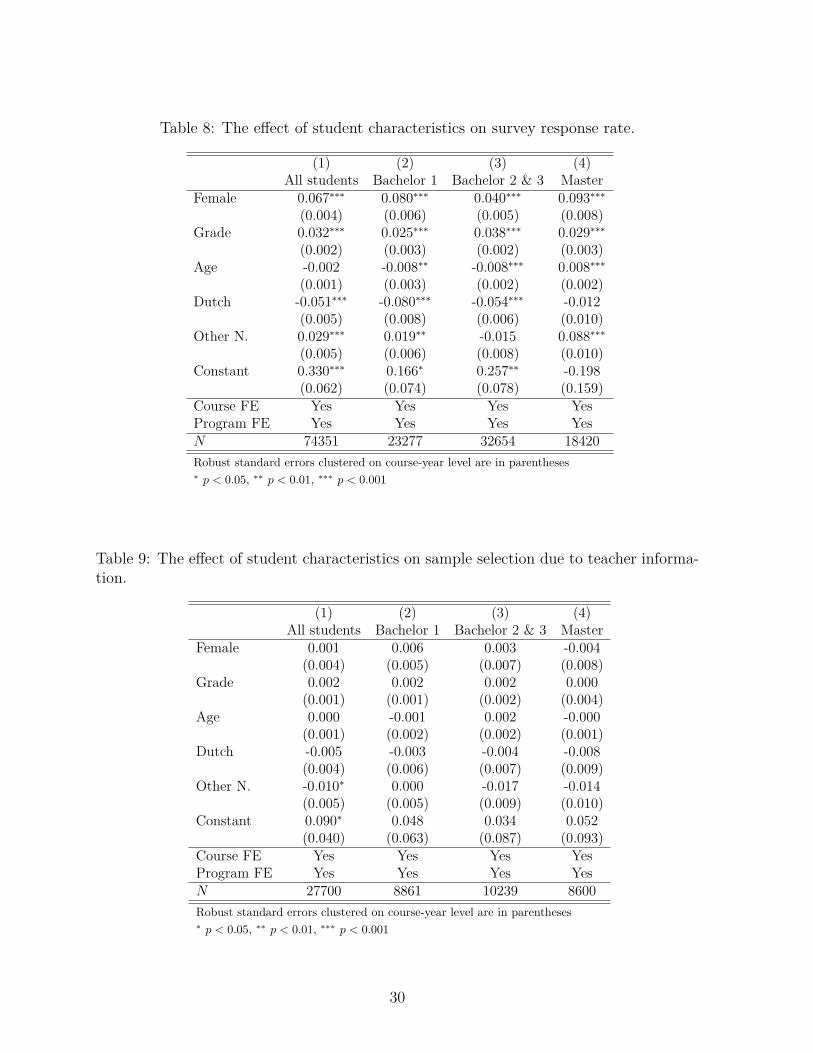
Table 8: The effect of student characteristics on survey response rate.
(1) (2) (3) (4)All students Bachelor 1 Bachelor 2 & 3 Master
Female 0.067∗∗∗ 0.080∗∗∗ 0.040∗∗∗ 0.093∗∗∗
(0.004) (0.006) (0.005) (0.008)Grade 0.032∗∗∗ 0.025∗∗∗ 0.038∗∗∗ 0.029∗∗∗
(0.002) (0.003) (0.002) (0.003)Age -0.002 -0.008∗∗ -0.008∗∗∗ 0.008∗∗∗
(0.001) (0.003) (0.002) (0.002)Dutch -0.051∗∗∗ -0.080∗∗∗ -0.054∗∗∗ -0.012
(0.005) (0.008) (0.006) (0.010)Other N. 0.029∗∗∗ 0.019∗∗ -0.015 0.088∗∗∗
(0.005) (0.006) (0.008) (0.010)Constant 0.330∗∗∗ 0.166∗ 0.257∗∗ -0.198
(0.062) (0.074) (0.078) (0.159)Course FE Yes Yes Yes YesProgram FE Yes Yes Yes YesN 74351 23277 32654 18420Robust standard errors clustered on course-year level are in parentheses∗ p < 0.05, ∗∗ p < 0.01, ∗∗∗ p < 0.001
Table 9: The effect of student characteristics on sample selection due to teacher informa-tion.
(1) (2) (3) (4)All students Bachelor 1 Bachelor 2 & 3 Master
Female 0.001 0.006 0.003 -0.004(0.004) (0.005) (0.007) (0.008)
Grade 0.002 0.002 0.002 0.000(0.001) (0.001) (0.002) (0.004)
Age 0.000 -0.001 0.002 -0.000(0.001) (0.002) (0.002) (0.001)
Dutch -0.005 -0.003 -0.004 -0.008(0.004) (0.006) (0.007) (0.009)
Other N. -0.010∗ 0.000 -0.017 -0.014(0.005) (0.005) (0.009) (0.010)
Constant 0.090∗ 0.048 0.034 0.052(0.040) (0.063) (0.087) (0.093)
Course FE Yes Yes Yes YesProgram FE Yes Yes Yes YesN 27700 8861 10239 8600Robust standard errors clustered on course-year level are in parentheses∗ p < 0.05, ∗∗ p < 0.01, ∗∗∗ p < 0.001
30

Table 10: Regression of publication variables on student characteristics.
(1) (2) (3) (4)Any publications Any A publications Any B publication Any C publication
Female 0.004 0.004 0.023 0.024(0.006) (0.011) (0.014) (0.017)
Dutch 0.001 -0.008 -0.001 0.005(0.008) (0.009) (0.023) (0.014)
Other N. -0.005 0.005 -0.014 -0.030(0.009) (0.014) (0.021) (0.022)
Age -0.001 -0.000 0.005 0.002(0.002) (0.002) (0.003) (0.003)
Constant 1.021∗∗∗ -0.001 -0.058 6.998∗∗∗
(0.028) (0.029) (0.058) (0.065)N 5934 5934 5934 5934Robust standard errors clustered on course-year level are in parentheses∗ p < 0.05, ∗∗ p < 0.01, ∗∗∗ p < 0.001
31

Table 11: Student grades estimations.
(1) (2) (3) (4)All students Bachelor 1 Bachelor 2 & 3 Master
Student: female 0.070 -0.067 0.042 0.121∗
(0.042) (0.136) (0.072) (0.057)Student: Dutch -0.425∗∗∗ -0.070 -0.519∗∗∗ -0.496∗∗∗
(0.059) (0.182) (0.118) (0.068)Student: other nationality -0.699∗∗∗ -0.843∗∗∗ -0.721∗∗∗ -0.662∗∗∗
(0.063) (0.200) (0.135) (0.071)Student: age -0.082∗∗∗ -0.106∗ -0.140∗∗∗ -0.062∗∗∗
(0.012) (0.049) (0.028) (0.012)Tutor: female 0.111 0.246 0.178 -0.102
(0.108) (0.199) (0.250) (0.099)Tutor: Dutch -0.053 -0.134 0.242 -0.183
(0.103) (0.258) (0.148) (0.152)Tutor: age -0.012 0.001 -0.032 -0.002
(0.007) (0.020) (0.018) (0.010)Any publications 0.072 0.164 0.110 0.105
(0.103) (0.546) (0.232) (0.115)Constant 9.628∗∗∗ 9.766∗∗∗ 10.868∗∗∗ 8.656∗∗∗
(0.480) (1.585) (1.024) (1.081)Course/year fixed effects Yes Yes Yes YesProgram fixed effects Yes Yes Yes YesN 5787 784 1970 3033Robust standard errors clustered on course-year level are in parentheses∗ p < 0.05, ∗∗ p < 0.01, ∗∗∗ p < 0.001
32
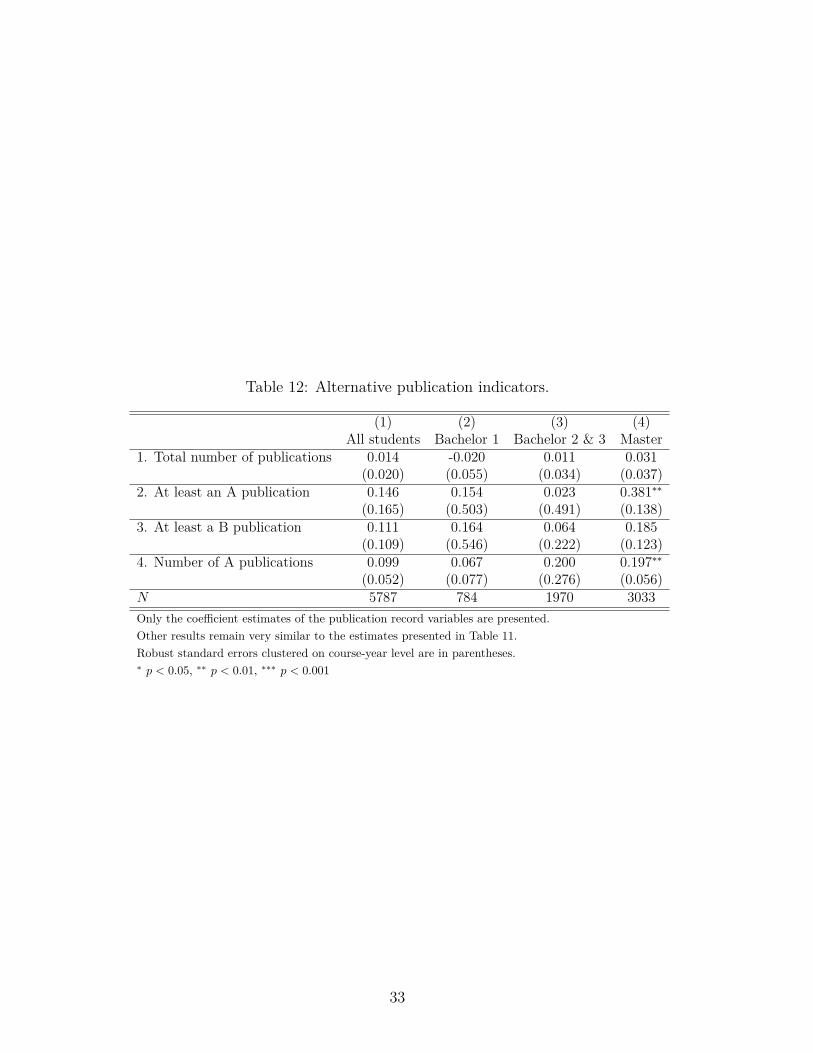
Table 12: Alternative publication indicators.
(1) (2) (3) (4)All students Bachelor 1 Bachelor 2 & 3 Master
1. Total number of publications 0.014 -0.020 0.011 0.031(0.020) (0.055) (0.034) (0.037)
2. At least an A publication 0.146 0.154 0.023 0.381∗∗
(0.165) (0.503) (0.491) (0.138)3. At least a B publication 0.111 0.164 0.064 0.185
(0.109) (0.546) (0.222) (0.123)4. Number of A publications 0.099 0.067 0.200 0.197∗∗
(0.052) (0.077) (0.276) (0.056)N 5787 784 1970 3033Only the coefficient estimates of the publication record variables are presented.Other results remain very similar to the estimates presented in Table 11.Robust standard errors clustered on course-year level are in parentheses.∗ p < 0.05, ∗∗ p < 0.01, ∗∗∗ p < 0.001
33

Table 13: Sensitivities: student grade estimations.
(1) (2) (3) (4)All students Bachelor 1 Bachelor 2 & 3 Master
1.At least an A publication 0.155 0.147 0.023 0.407∗∗
(0.164) (0.503) (0.491) (0.141)Tutor Female - Student Male -0.077 -0.032 0.096 -0.335∗
(0.141) (0.301) (0.280) (0.142)Tutor Male - Student Female 0.019 -0.128 0.034 0.049
(0.045) (0.136) (0.082) (0.057)Tutor Female - Student Female 0.326∗∗ 0.356 0.219 0.165
(0.118) (0.249) (0.248) (0.116)2.At least an A publication 0.168 0.468 0.029 0.374∗∗
(0.165) (0.512) (0.536) (0.141)Peer age 0.012 -0.058 0.026 0.002
(0.026) (0.089) (0.047) (0.031)Peer female 0.144 0.556 0.237 -0.133
(0.123) (0.328) (0.197) (0.188)3.At least an A publication -0.068 -0.041 -0.036 0.255
(0.228) (0.409) (0.547) (0.262)Professor 1 0.250 – 0.842 0.080
(0.162) – (0.431) (0.189)Professor 2 0.009 -1.313∗∗∗ -0.083 0.163
(0.219) (0.361) (0.393) (0.195)Associate Prof. -0.019 -0.098 0.073 -0.081
(0.128) (0.143) (0.296) (0.126)Assistant Prof. 0.210 0.988∗ 0.308 -0.098
(0.190) (0.415) (0.312) (0.166)N 5787 784 1970 3033Only the coefficient estimates of the publication record variables are presented.Other results remain very similar to the estimates presented in Table 11.Robust standard errors clustered on course-year level are in parentheses.∗ p < 0.05, ∗∗ p < 0.01, ∗∗∗ p < 0.001
34
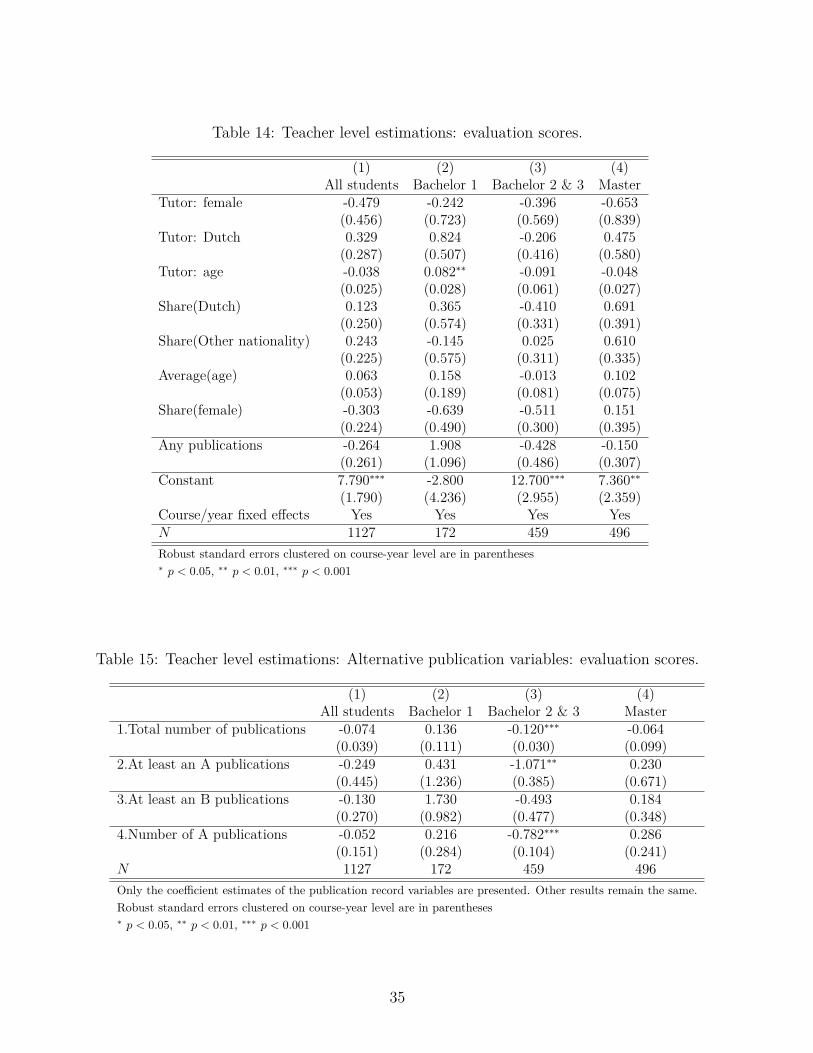
Table 14: Teacher level estimations: evaluation scores.
(1) (2) (3) (4)All students Bachelor 1 Bachelor 2 & 3 Master
Tutor: female -0.479 -0.242 -0.396 -0.653(0.456) (0.723) (0.569) (0.839)
Tutor: Dutch 0.329 0.824 -0.206 0.475(0.287) (0.507) (0.416) (0.580)
Tutor: age -0.038 0.082∗∗ -0.091 -0.048(0.025) (0.028) (0.061) (0.027)
Share(Dutch) 0.123 0.365 -0.410 0.691(0.250) (0.574) (0.331) (0.391)
Share(Other nationality) 0.243 -0.145 0.025 0.610(0.225) (0.575) (0.311) (0.335)
Average(age) 0.063 0.158 -0.013 0.102(0.053) (0.189) (0.081) (0.075)
Share(female) -0.303 -0.639 -0.511 0.151(0.224) (0.490) (0.300) (0.395)
Any publications -0.264 1.908 -0.428 -0.150(0.261) (1.096) (0.486) (0.307)
Constant 7.790∗∗∗ -2.800 12.700∗∗∗ 7.360∗∗
(1.790) (4.236) (2.955) (2.359)Course/year fixed effects Yes Yes Yes YesN 1127 172 459 496Robust standard errors clustered on course-year level are in parentheses∗ p < 0.05, ∗∗ p < 0.01, ∗∗∗ p < 0.001
Table 15: Teacher level estimations: Alternative publication variables: evaluation scores.
(1) (2) (3) (4)All students Bachelor 1 Bachelor 2 & 3 Master
1.Total number of publications -0.074 0.136 -0.120∗∗∗ -0.064(0.039) (0.111) (0.030) (0.099)
2.At least an A publications -0.249 0.431 -1.071∗∗ 0.230(0.445) (1.236) (0.385) (0.671)
3.At least an B publications -0.130 1.730 -0.493 0.184(0.270) (0.982) (0.477) (0.348)
4.Number of A publications -0.052 0.216 -0.782∗∗∗ 0.286(0.151) (0.284) (0.104) (0.241)
N 1127 172 459 496Only the coefficient estimates of the publication record variables are presented. Other results remain the same.Robust standard errors clustered on course-year level are in parentheses∗ p < 0.05, ∗∗ p < 0.01, ∗∗∗ p < 0.001
35

9 Appendix
36

Tabl
e16
:Li
stof
jour
nals
and
clas
sifica
tions
used
bySB
E.
Jour
nals
Jour
nals
1A
cade
my
ofM
anag
emen
tEx
ecut
ive
B36
Con
tem
pora
ryA
ccou
ntin
gR
esea
rch
B2
Aca
dem
yof
Man
agem
ent
Jour
nal
A37
Con
tem
pora
ryEc
onom
icPo
licy
C3
Aca
dem
yof
Man
agem
ent
Rev
iew
A38
Cor
pora
teG
over
nanc
eB
4A
ccid
ent
Ana
lysis
and
Prev
entio
nB
39D
ecisi
onSc
ienc
esB
5A
ccou
ntin
gan
dBu
sines
sR
esea
rch
B40
Dec
ision
Supp
ort
Syst
ems
B6
Acc
ount
ing
Rev
iew
A41
Def
ence
and
Peac
eEc
onom
ics
C7
Acc
ount
ing,
Org
anisa
tions
and
Soci
ety
A42
Dev
elop
ing
Econ
omie
sC
8A
CM
Tran
sIn
form
atio
nSy
stem
sA
43Ea
ster
nEu
rope
anEc
onom
ics
C9
Adm
inist
rativ
eSc
ienc
eQ
uart
erly
A44
Ecol
ogic
alEc
onom
ics
B10
Adv
ance
sin
Stra
tegi
cM
anag
emen
tC
45Ec
onom
etric
Rev
iew
sC
11A
frica
nD
evel
opm
ent
Rev
iew
C46
Econ
omet
ricT
heor
yA
12A
gric
ultu
ralE
cono
mic
sB
47Ec
onom
etric
aA
13A
mer
ican
Econ
omic
Rev
iew
A48
Econ
omic
and
Indu
stria
lDem
ocra
cyC
14A
mer
ican
Jour
nalo
fAgr
icul
tura
lEco
nom
ics
B49
Econ
omic
Dev
elop
men
t&
Cul
tura
lCha
nge
B15
Am
eric
anJo
urna
lofE
cono
mic
san
dSo
ciol
ogy
C50
Econ
omic
Dev
elop
men
tQ
uart
erly
C16
Ann
als
ofO
pera
tions
Res
earc
hB
51Ec
onom
icG
eogr
aphy
B17
App
lied
Econ
omic
sB
52Ec
onom
icH
istor
yR
evie
wB
18A
pplie
dEc
onom
ics
Lett
ers
C53
Econ
omic
Inqu
iryB
19A
pplie
dM
athe
mat
ical
Mod
ellin
gC
54Ec
onom
icJo
urna
lA
20A
pplie
dSt
ocha
stic
Mod
els
inBu
sines
san
dIn
dust
ryC
55Ec
onom
icM
odel
ling
C21
Asia
-Pac
ific
Jour
nalo
fOpe
ratio
nalR
esea
rch
C56
Econ
omic
Polic
yC
22A
uditi
ng:
Jour
nalo
fPra
ctic
ean
dT
heor
yB
57Ec
onom
icR
ecor
dC
23A
ustr
alia
nJo
urna
lofA
gric
ultu
ral&
Res
ourc
eEc
onom
ics
C58
Econ
omic
The
ory
B24
Betr
iebs
wirt
scha
ftlich
eFo
rsch
ung
und
Prax
isC
59Ec
onom
ica
B25
Briti
shJo
urna
lofI
ndus
tria
lRel
atio
nsB
60Ec
onom
ics
and
Philo
soph
yC
26Br
itish
Jour
nalo
fMan
agem
ent
B61
Econ
omic
sLe
tter
sB
27Br
ooki
ngs
Pape
rsO
nEc
onom
icA
ctiv
ityB
62Ec
onom
ics
ofEd
ucat
ion
Rev
iew
B28
Busin
ess
Hist
ory
C63
Econ
omic
sof
Tran
sitio
nC
29Bu
sines
sH
istor
yR
evie
wC
64Ec
onom
istC
30C
alifo
rnia
Man
agem
ent
Rev
iew
B65
Econ
omy
and
Soci
ety
B31
Cam
brid
geJo
urna
lofE
cono
mic
sC
66Em
piric
alEc
onom
ics
C32
Can
adia
nJo
urna
lofE
cono
mic
sB
67En
ergy
Econ
omic
sB
33C
hina
Econ
omic
Rev
iew
C68
Ener
gyJo
urna
lC
34C
ompu
tatio
nalO
ptim
izat
ion
and
App
licat
ions
C69
Engi
neer
ing
Opt
imiz
atio
nC
35C
ompu
ters
&O
pera
tions
Res
earc
h(U
k)B
70En
trep
rene
ursh
ipan
dR
egio
nalD
evel
opm
ent
B
37

Tabl
e16
cont
inue
d.
Jour
nals
Jour
nals
71En
viro
nmen
t&
Plan
ning
AB
106
Indu
stria
lRel
atio
nsB
72En
viro
nmen
t&
Plan
ning
BB
107
Info
rC
73En
viro
nmen
t&
Plan
ning
CC
108
Info
rmat
ion
and
Man
agem
ent
B74
Envi
ronm
ent
&Pl
anni
ngD
B10
9In
form
atio
nEc
onom
ics
and
Polic
yC
75En
viro
nmen
tal&
Res
ourc
eEc
onom
ics
B11
0In
form
atio
nPr
oces
sing
&M
anag
emen
tB
76Eu
rope
anA
ccou
ntin
gR
evie
wC
111
Info
rmat
ion
Proc
essin
gLe
tter
sC
77Eu
rope
anEc
onom
icR
evie
wA
112
Info
rmat
ion
Res
earc
hC
78Eu
rope
anFi
nanc
ialM
anag
emen
tC
113
Info
rmat
ion
Scie
nces
C79
Euro
pean
Jour
nalo
fInd
ustr
ialR
elat
ions
C11
4In
form
atio
nSo
ciet
yC
80Eu
rope
anJo
urna
lofI
nfor
mat
ion
Syst
ems
C11
5In
form
atio
nSy
stem
sB
81Eu
rope
anJo
urna
lofO
pera
tiona
lRes
earc
hB
116
Info
rmat
ion
Syst
ems
Fron
tiers
C82
Euro
pean
Jour
nalo
fWor
k&
Org
aniz
atio
nalP
sych
olog
yC
117
Info
rmat
ion
Syst
ems
Jour
nal
C83
Euro
pean
Rev
iew
ofA
gric
ultu
ralE
cono
mic
sC
118
Info
rmat
ion
Syst
ems
Man
agem
ent
C84
Euro
pe-A
siaSt
udie
sC
119
Info
rmat
ion
Syst
ems
Res
earc
hA
85Ex
pert
Syst
ems
With
App
licat
ions
B12
0In
form
sJo
urna
lOn
Com
putin
gB
86Ex
plor
atio
nsin
Econ
omic
Hist
ory
C12
1In
sura
nce,
Mat
hem
atic
s&
Econ
omic
sB
87Fe
min
istEc
onom
ics
C12
2In
terfa
ces
C88
Fina
ncia
lAna
lyst
sJo
urna
lC
123
Inte
rnat
iona
lEco
nom
icR
evie
wA
89Fi
nanc
ialM
anag
emen
tB
124
Inte
rnat
iona
lJou
rnal
ofC
ompu
ter
Inte
grat
edM
anuf
actu
ring
C90
Futu
res
C12
5In
tern
atio
nalJ
ourn
alof
Coo
pera
tive
Info
rmat
ion
Syst
ems
C91
Gam
esan
dEc
onom
icBe
havi
orA
126
Inte
rnat
iona
lJou
rnal
ofEl
ectr
onic
Com
mer
ceB
92G
enev
aPa
pers
On
Risk
&In
sura
nce:
Issu
esan
dPr
actic
eC
127
Inte
rnat
iona
lJou
rnal
ofFi
nanc
ean
dEc
onom
ics
C93
Gro
upan
dO
rgan
izat
ion
Man
agem
ent
C12
8In
tern
atio
nalJ
ourn
alof
Flex
ible
Man
ufac
turin
gSy
stem
sC
94G
roup
Dec
ision
and
Neg
otia
tion
C12
9In
tern
atio
nalJ
ourn
alof
Fore
cast
ing
B95
Har
vard
Busin
ess
Rev
iew
B13
0In
tern
atio
nalJ
ourn
alof
Gam
eT
heor
yB
96H
ealth
Econ
omic
sB
131
Inte
rnat
iona
lJou
rnal
ofIn
dust
rialO
rgan
isatio
nB
97H
itots
ubas
hiJo
urna
lofE
cono
mic
sC
132
Inte
rnat
iona
lJou
rnal
ofIn
form
atio
nM
anag
emen
tC
98H
uman
Com
pute
rIn
tera
ctio
nB
133
Inte
rnat
iona
lJou
rnal
ofM
anag
emen
tR
evie
ws
B99
Hum
anR
elat
ions
B13
4In
tern
atio
nalJ
ourn
alof
Man
powe
rC
100
Hum
anR
esou
rce
Man
agem
ent
A13
5In
tern
atio
nalJ
ourn
alof
Mar
ket
Res
earc
hC
101
IIE
Tran
sact
ions
B13
6In
tern
atio
nalJ
ourn
alof
Ope
ratio
ns&
Prod
uctio
nM
anag
emen
tC
102
IMF
Staff
Pape
rsB
137
Inte
rnat
iona
lJou
rnal
ofPh
ysD
istr
and
Log
Man
agem
ent
B10
3In
dust
riala
ndC
orpo
rate
Cha
nge
B13
8In
tern
atio
nalJ
ourn
alof
Prod
uctio
nEc
onom
ics
C10
4In
dust
riala
ndLa
bor
Rel
atio
nsR
evie
wB
139
Inte
rnat
iona
lJou
rnal
ofPr
oduc
tion
Res
earc
hB
105
Indu
stria
lMar
ketin
gM
anag
emen
tB
140
Inte
rnat
iona
lJou
rnal
ofR
esea
rch
inM
arke
ting
B
38

Tabl
e16
cont
inue
d.
Jour
nals
Jour
nals
141
Inte
rnat
iona
lJou
rnal
ofSe
lect
ion
and
Ass
essm
ent
C17
6Jo
urna
lofC
onsu
mer
Psyc
holo
gyC
142
Inte
rnat
iona
lJou
rnal
ofSe
rvic
eIn
dust
ryM
anag
emen
tC
177
Jour
nalo
fCon
sum
erR
esea
rch
A14
3In
tern
atio
nalJ
ourn
alof
Tech
nolo
gyM
anag
emen
tC
178
Jour
nalo
fCor
pora
teFi
nanc
eB
144
Inte
rnat
iona
lJou
rnal
ofU
rban
&R
egio
nalR
esea
rch
B17
9Jo
urna
lofD
eriv
ativ
esB
145
Inte
rnat
iona
lLab
our
Rev
iew
C18
0Jo
urna
lofD
evel
opm
ent
Econ
omic
sB
146
Inte
rnat
iona
lMar
ketin
gR
evie
wC
181
Jour
nalo
fDev
elop
men
tSt
udie
sB
147
Inte
rnat
iona
lReg
iona
lSci
ence
Rev
iew
C18
2Jo
urna
lofE
cono
met
rics
A14
8In
tern
atio
nalR
evie
wof
Law
&Ec
onom
ics
C18
3Jo
urna
lofE
cono
mic
Beha
viou
r&
Org
aniz
atio
nB
149
Inte
rnat
iona
lSm
allB
usin
ess
Jour
nal
C18
4Jo
urna
lofE
cono
mic
Dyn
amic
s&
Con
trol
B15
0In
tern
atio
nalT
axan
dPu
blic
Fina
nce
C18
5Jo
urna
lofE
cono
mic
Educ
atio
nC
151
Inte
rnet
Res
earc
h-El
ectr
onic
Net
work
ing
App
land
Polic
yC
186
Jour
nalo
fEco
nom
icG
eogr
aphy
C15
2Ja
pan
and
the
Wor
ldEc
onom
yC
187
Jour
nalo
fEco
nom
icG
row
thB
153
Jour
nalo
fAcc
ount
ing
&Ec
onom
ics
A18
8Jo
urna
lofE
cono
mic
Hist
ory
B15
4Jo
urna
lofA
ccou
ntin
gR
esea
rch
A18
9Jo
urna
lofE
cono
mic
Issu
esC
155
Jour
nalo
fAcc
ount
ing,
Aud
iting
and
Fina
nce
B19
0Jo
urna
lofE
cono
mic
Lite
ratu
reA
156
Jour
nalo
fAdv
ance
dTr
ansp
orta
tion
C19
1Jo
urna
lofE
cono
mic
Pers
pect
ives
A15
7Jo
urna
lofA
dver
tisin
gC
192
Jour
nalo
fEco
nom
icPs
ycho
logy
B15
8Jo
urna
lofA
dver
tisin
gR
esea
rch
C19
3Jo
urna
lofE
cono
mic
The
ory
A15
9Jo
urna
lofA
frica
nEc
onom
ies
C19
4Jo
urna
lofE
cono
mic
sC
160
Jour
nalo
fAgr
icul
tura
land
Res
ourc
eEc
onom
ics
C19
5Jo
urna
lofE
cono
mic
s&
Man
agem
ent
Stra
tegy
C16
1Jo
urna
lofA
gric
ultu
ralE
cono
mic
sC
196
Jour
nalo
fEm
piric
alFi
nanc
eB
162
Jour
nalo
fAir
Tran
spor
tM
anag
emen
tC
197
Jour
nalo
fEnv
ironm
enta
lEco
nom
ics
&M
anag
emen
tB
163
Jour
nalo
fApp
lied
Econ
omet
rics
A19
8Jo
urna
lofE
volu
tiona
ryEc
onom
ics
C16
4Jo
urna
lofB
anki
ng&
Fina
nce
B19
9Jo
urna
lofF
inan
ceA
165
Jour
nalo
fBus
ines
s&
Econ
omic
Stat
istic
sA
200
Jour
nalo
fFin
anci
alan
dQ
uant
itativ
eA
naly
sisA
166
Jour
nalo
fBus
ines
san
dPs
ycho
logy
C20
1Jo
urna
lofF
inan
cial
Econ
omic
sA
167
Jour
nalo
fBus
ines
sEt
hics
C20
2Jo
urna
lofF
inan
cial
Inte
rmed
iatio
nB
168
Jour
nalo
fBus
ines
sFi
nanc
e&
Acc
ount
ing
B20
3Jo
urna
lofF
orec
astin
gB
169
Jour
nalo
fBus
ines
sLo
gist
ics
B20
4Jo
urna
lofF
utur
esM
arke
tsC
170
Jour
nalo
fBus
ines
sR
esea
rch
C20
5Jo
urna
lofG
loba
lOpt
imiz
atio
nC
171
Jour
nalo
fBus
ines
sVe
ntur
ing
B20
6Jo
urna
lofH
ealth
Econ
omic
sA
172
Jour
nalo
fCom
mon
Mar
ket
Stud
ies
C20
7Jo
urna
lofH
ousin
gEc
onom
ics
C17
3Jo
urna
lofC
ompa
rativ
eEc
onom
ics
B20
8Jo
urna
lofH
uman
Res
ourc
esA
174
Jour
nalo
fCom
pute
rIn
form
atio
nSy
stem
sC
209
Jour
nalo
fInd
ustr
ialE
cono
mic
sB
175
Jour
nalo
fCon
sum
erA
ffairs
C21
0Jo
urna
lofI
nfor
mat
ion
Scie
nce
C
39
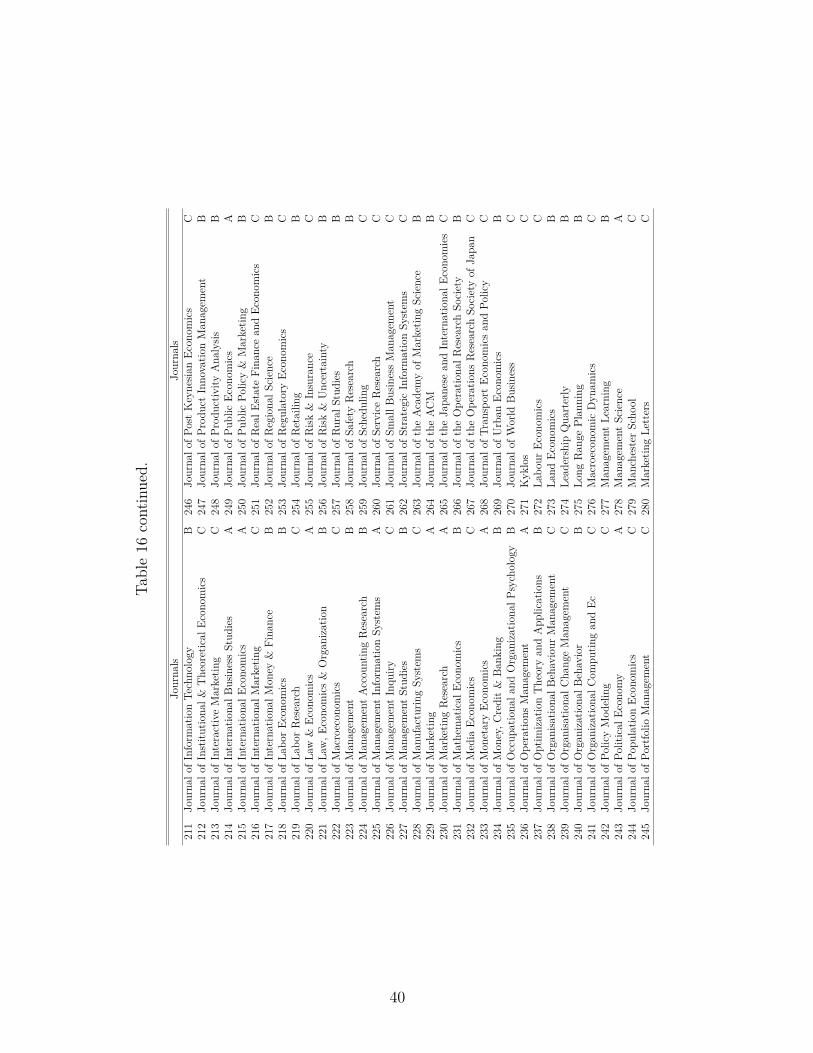
Tabl
e16
cont
inue
d.
Jour
nals
Jour
nals
211
Jour
nalo
fInf
orm
atio
nTe
chno
logy
B24
6Jo
urna
lofP
ost
Key
nesia
nEc
onom
ics
C21
2Jo
urna
lofI
nstit
utio
nal&
The
oret
ical
Econ
omic
sC
247
Jour
nalo
fPro
duct
Inno
vatio
nM
anag
emen
tB
213
Jour
nalo
fInt
erac
tive
Mar
ketin
gC
248
Jour
nalo
fPro
duct
ivity
Ana
lysis
B21
4Jo
urna
lofI
nter
natio
nalB
usin
ess
Stud
ies
A24
9Jo
urna
lofP
ublic
Econ
omic
sA
215
Jour
nalo
fInt
erna
tiona
lEco
nom
ics
A25
0Jo
urna
lofP
ublic
Polic
y&
Mar
ketin
gB
216
Jour
nalo
fInt
erna
tiona
lMar
ketin
gC
251
Jour
nalo
fRea
lEst
ate
Fina
nce
and
Econ
omic
sC
217
Jour
nalo
fInt
erna
tiona
lMon
ey&
Fina
nce
B25
2Jo
urna
lofR
egio
nalS
cien
ceB
218
Jour
nalo
fLab
orEc
onom
ics
B25
3Jo
urna
lofR
egul
ator
yEc
onom
ics
C21
9Jo
urna
lofL
abor
Res
earc
hC
254
Jour
nalo
fRet
ailin
gB
220
Jour
nalo
fLaw
&Ec
onom
ics
A25
5Jo
urna
lofR
isk&
Insu
ranc
eC
221
Jour
nalo
fLaw
,Eco
nom
ics
&O
rgan
izat
ion
B25
6Jo
urna
lofR
isk&
Unc
erta
inty
B22
2Jo
urna
lofM
acro
econ
omic
sC
257
Jour
nalo
fRur
alSt
udie
sB
223
Jour
nalo
fMan
agem
ent
B25
8Jo
urna
lofS
afet
yR
esea
rch
B22
4Jo
urna
lofM
anag
emen
tA
ccou
ntin
gR
esea
rch
B25
9Jo
urna
lofS
ched
ulin
gC
225
Jour
nalo
fMan
agem
ent
Info
rmat
ion
Syst
ems
A26
0Jo
urna
lofS
ervi
ceR
esea
rch
C22
6Jo
urna
lofM
anag
emen
tIn
quiry
C26
1Jo
urna
lofS
mal
lBus
ines
sM
anag
emen
tC
227
Jour
nalo
fMan
agem
ent
Stud
ies
B26
2Jo
urna
lofS
trat
egic
Info
rmat
ion
Syst
ems
C22
8Jo
urna
lofM
anuf
actu
ring
Syst
ems
C26
3Jo
urna
loft
heA
cade
my
ofM
arke
ting
Scie
nce
B22
9Jo
urna
lofM
arke
ting
A26
4Jo
urna
loft
heA
CM
B23
0Jo
urna
lofM
arke
ting
Res
earc
hA
265
Jour
nalo
fthe
Japa
nese
and
Inte
rnat
iona
lEco
nom
ies
C23
1Jo
urna
lofM
athe
mat
ical
Econ
omic
sB
266
Jour
nalo
fthe
Ope
ratio
nalR
esea
rch
Soci
ety
B23
2Jo
urna
lofM
edia
Econ
omic
sC
267
Jour
nalo
fthe
Ope
ratio
nsR
esea
rch
Soci
ety
ofJa
pan
C23
3Jo
urna
lofM
onet
ary
Econ
omic
sA
268
Jour
nalo
fTra
nspo
rtEc
onom
ics
and
Polic
yC
234
Jour
nalo
fMon
ey,C
redi
t&
Bank
ing
B26
9Jo
urna
lofU
rban
Econ
omic
sB
235
Jour
nalo
fOcc
upat
iona
land
Org
aniz
atio
nalP
sych
olog
yB
270
Jour
nalo
fWor
ldBu
sines
sC
236
Jour
nalo
fOpe
ratio
nsM
anag
emen
tA
271
Kyk
los
C23
7Jo
urna
lofO
ptim
izat
ion
The
ory
and
App
licat
ions
B27
2La
bour
Econ
omic
sC
238
Jour
nalo
fOrg
anisa
tiona
lBeh
avio
urM
anag
emen
tC
273
Land
Econ
omic
sB
239
Jour
nalo
fOrg
anisa
tiona
lCha
nge
Man
agem
ent
C27
4Le
ader
ship
Qua
rter
lyB
240
Jour
nalo
fOrg
aniz
atio
nalB
ehav
ior
B27
5Lo
ngR
ange
Plan
ning
B24
1Jo
urna
lofO
rgan
izat
iona
lCom
putin
gan
dEc
C27
6M
acro
econ
omic
Dyn
amic
sC
242
Jour
nalo
fPol
icy
Mod
elin
gC
277
Man
agem
ent
Lear
ning
B24
3Jo
urna
lofP
oliti
calE
cono
my
A27
8M
anag
emen
tSc
ienc
eA
244
Jour
nalo
fPop
ulat
ion
Econ
omic
sC
279
Man
ches
ter
Scho
olC
245
Jour
nalo
fPor
tfolio
Man
agem
ent
C28
0M
arke
ting
Lett
ers
C
40
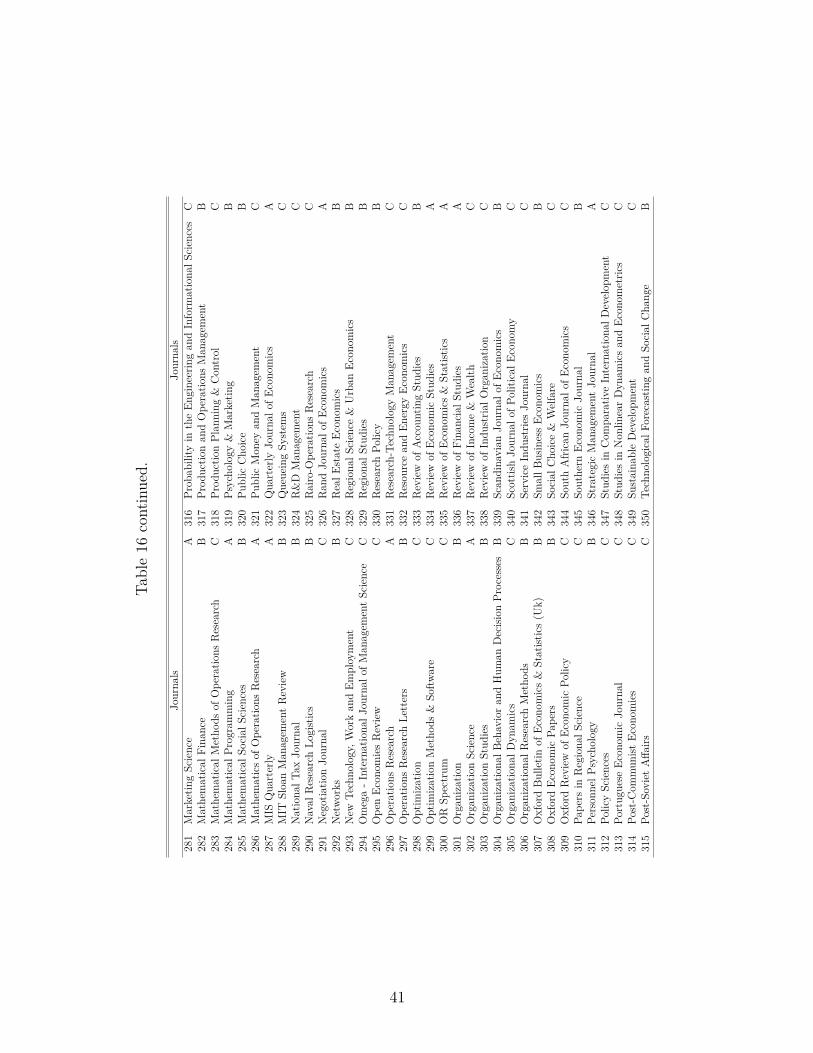
Tabl
e16
cont
inue
d.
Jour
nals
Jour
nals
281
Mar
ketin
gSc
ienc
eA
316
Prob
abili
tyin
the
Engi
neer
ing
and
Info
rmat
iona
lSci
ence
sC
282
Mat
hem
atic
alFi
nanc
eB
317
Prod
uctio
nan
dO
pera
tions
Man
agem
ent
B28
3M
athe
mat
ical
Met
hods
ofO
pera
tions
Res
earc
hC
318
Prod
uctio
nPl
anni
ng&
Con
trol
C28
4M
athe
mat
ical
Prog
ram
min
gA
319
Psyc
holo
gy&
Mar
ketin
gB
285
Mat
hem
atic
alSo
cial
Scie
nces
B32
0Pu
blic
Cho
ice
B28
6M
athe
mat
ics
ofO
pera
tions
Res
earc
hA
321
Publ
icM
oney
and
Man
agem
ent
C28
7M
ISQ
uart
erly
A32
2Q
uart
erly
Jour
nalo
fEco
nom
ics
A28
8M
ITSl
oan
Man
agem
ent
Rev
iew
B32
3Q
ueue
ing
Syst
ems
C28
9N
atio
nalT
axJo
urna
lB
324
R&
DM
anag
emen
tC
290
Nav
alR
esea
rch
Logi
stic
sB
325
Rai
ro-O
pera
tions
Res
earc
hC
291
Neg
otia
tion
Jour
nal
C32
6R
and
Jour
nalo
fEco
nom
ics
A29
2N
etwo
rks
B32
7R
ealE
stat
eEc
onom
ics
B29
3N
ewTe
chno
logy
,Wor
kan
dEm
ploy
men
tC
328
Reg
iona
lSci
ence
&U
rban
Econ
omic
sB
294
Om
ega
-Int
erna
tiona
lJou
rnal
ofM
anag
emen
tSc
ienc
eC
329
Reg
iona
lStu
dies
B29
5O
pen
Econ
omie
sR
evie
wC
330
Res
earc
hPo
licy
B29
6O
pera
tions
Res
earc
hA
331
Res
earc
h-Te
chno
logy
Man
agem
ent
C29
7O
pera
tions
Res
earc
hLe
tter
sB
332
Res
ourc
ean
dEn
ergy
Econ
omic
sC
298
Opt
imiz
atio
nC
333
Rev
iew
ofA
ccou
ntin
gSt
udie
sB
299
Opt
imiz
atio
nM
etho
ds&
Softw
are
C33
4R
evie
wof
Econ
omic
Stud
ies
A30
0O
RSp
ectr
umC
335
Rev
iew
ofEc
onom
ics
&St
atist
ics
A30
1O
rgan
izat
ion
B33
6R
evie
wof
Fina
ncia
lStu
dies
A30
2O
rgan
izat
ion
Scie
nce
A33
7R
evie
wof
Inco
me
&W
ealth
C30
3O
rgan
izat
ion
Stud
ies
B33
8R
evie
wof
Indu
stria
lOrg
aniz
atio
nC
304
Org
aniz
atio
nalB
ehav
ior
and
Hum
anD
ecisi
onPr
oces
ses
B33
9Sc
andi
navi
anJo
urna
lofE
cono
mic
sB
305
Org
aniz
atio
nalD
ynam
ics
C34
0Sc
ottis
hJo
urna
lofP
oliti
calE
cono
my
C30
6O
rgan
izat
iona
lRes
earc
hM
etho
dsB
341
Serv
ice
Indu
strie
sJo
urna
lC
307
Oxf
ord
Bulle
tinof
Econ
omic
s&
Stat
istic
s(U
k)B
342
Smal
lBus
ines
sEc
onom
ics
B30
8O
xfor
dEc
onom
icPa
pers
B34
3So
cial
Cho
ice
&W
elfa
reC
309
Oxf
ord
Rev
iew
ofEc
onom
icPo
licy
C34
4So
uth
Afri
can
Jour
nalo
fEco
nom
ics
C31
0Pa
pers
inR
egio
nalS
cien
ceC
345
Sout
hern
Econ
omic
Jour
nal
B31
1Pe
rson
nelP
sych
olog
yB
346
Stra
tegi
cM
anag
emen
tJo
urna
lA
312
Polic
ySc
ienc
esC
347
Stud
ies
inC
ompa
rativ
eIn
tern
atio
nalD
evel
opm
ent
C31
3Po
rtug
uese
Econ
omic
Jour
nal
C34
8St
udie
sin
Non
linea
rD
ynam
ics
and
Econ
omet
rics
C31
4Po
st-C
omm
unist
Econ
omie
sC
349
Sust
aina
ble
Dev
elop
men
tC
315
Post
-Sov
iet
Affa
irsC
350
Tech
nolo
gica
lFor
ecas
ting
and
Soci
alC
hang
eB
41

Tabl
e16
cont
inue
d.
Jour
nals
351
Tech
nolo
gyA
naly
sisan
dSt
rate
gic
Man
agem
ent
C35
2Te
chno
vatio
nC
353
Tele
com
mun
icat
ions
Polic
yC
354
The
ory
and
Dec
ision
C35
5To
talQ
ualit
yM
anag
emen
tan
dbu
sines
sEx
celle
nce
C35
6To
urism
Man
agem
ent
C35
7Tr
ansp
ort
Rev
iew
sC
358
Tran
spor
tatio
nB
359
Tran
spor
tatio
nJo
urna
lB
360
Tran
spor
tatio
nQ
uart
erly
C36
1Tr
ansp
orta
tion
Res
earc
hPa
rtA
-Pol
icy
and
Prac
tice
B36
2Tr
ansp
orta
tion
Res
earc
hPa
rtB-
Met
hodo
logi
cal
A36
3Tr
ansp
orta
tion
Res
earc
hPa
rtD
-Tra
nspo
rtan
dEn
viro
nmen
tB
364
Tran
spor
tatio
nR
esea
rch
Part
E-Lo
gist
ics
and
Tran
spor
tatio
nR
evie
wC
365
Tran
spor
tatio
nR
esea
rch
Rec
ord
C36
6Tr
ansp
orta
tion
Scie
nce
A36
7Tr
imes
tre
Econ
omic
oC
368
Urb
anSt
udie
sB
369
Wel
twirt
scha
ftlich
esA
rchi
v-R
evie
wof
Wor
ldEc
onom
ics
C37
0W
irtsc
hafts
info
rmat
ikC
371
Wor
ldBa
nkEc
onom
icR
evie
wB
372
Wor
ldBa
nkR
esea
rch
Obs
erve
rC
373
Wor
ldD
evel
opm
ent
B37
4W
orld
Econ
omy
C
42

Publisher:
CPB Netherlands Bureau for Economic Policy Analysis P.O. Box 80510 | 2508 GM The HagueT (088) 984 60 00
March 2017 | ISBN 978-90-5833-769-6