alternative measures of well–being maxime ladaique -...
TRANSCRIPT
ALTERNATIVE MEASURES OF WELL–BEING
Maxime LADAIQUE OECD, France
Executive Summary
1. All discussions about the desirability of policy reforms rest on judgements about their effects
of individuals and societal well–being. Yet, suitable measures for assessing how well–being is
changing over time or compares across countries are lacking. This problem is, of course, not
new and standard economic theory has provided, over the years, a range of insights about the
criteria and domains that are most critical for the measurement of well–being, and on the
relation between well–being and measures of economic resources. This paper does not revisit
this theoretical discussion, nor does it provide a comprehensive review of different
approaches to the measurement of well–being. It rather assesses whether GDP per capita is an
adequate proxy as a measure of well–being or whether other indicators – used either as
substitutes or as complements to GDP per capita – are more suitable for that purpose.
Attention is limited to only some of the factors that influence well–being, and excludes some
critical elements such as the environment, home production and other non–market factors.
2. The main findings of the paper are the following:
• Within the national accounts framework, other – and possibly better – measures of
economic resources than GDP per capita exist (e.g. net national product, net income)
but data availability and reliability restrict the scope for cross–country and inter–
temporal comparisons. The different economy–wide measures that are available are
closely correlated with each other, and paint a similar picture of the ranking of countries
and developments over time, while there are larger differences when comparing income
measures for the economy as a whole and for households.
• Illustrative calculations to “extend” measures of economic resources to include leisure
time, the sharing of income within households and distributional concerns suggest that
cross–country ranking based on the augmented indicators and on GDP per capita are
generally similar, although they have evolved differently over time.
• Several indicators exist to measure specific social conditions that are related to well–
being. Across OECD countries, levels of most of these social indicators are significantly
correlated to GDP per capita while changes over time are not. A composite index based
on these indicators points to significant difference in performance relative to GDP per
capita in around half of countries, whatever the weights used.
• Survey–based data on happiness and life–satisfaction across OECD countries are only
weakly related to levels of GDP per capita. Research on these subjective measures
suggests that there are several distinct domains – such as joblessness, family and
community ties – that contribute to overall life–satisfaction and that their influence
cannot be reduced to a single dimension of economic resources.
3. In summary, measures of economic growth remain critical for any assessment of well–being
but they need to be complemented with measures of other dimensions of well–being. How
best to integrate these different measures is an open question. One approach is to take
measures of economic resources as a starting point and then introduce a series of corrections
to incorporate other arguments, but internationally–agreed standards on how to value these
various non–market factors have yet to be developed. A different approach is to use various
non–monetary indicators alongside conventional measures of economic resources: while still
lacking a coherent conceptual and statistical framework, these indicators provide information
that is relevant for the assessment of well–being.
ISBN 92-64-02818-8
Society at a Glance
OECD Social Indicators
© OECD 2007
PART I
Chapter 2
Measuring Well-being: What Role for Social Indicators?
19
I.2. MEASURING WELL-BEING: WHAT ROLE FOR SOCIAL INDICATORS?
1. IntroductionSocial indicators aim to provide information on well-being beyond that conveyed by
conventional economic measures.1 While the level and change in gross domestic product(GDP) per capita have long been used as the main yardstick for measuring and comparing
living standards across countries, policy makers and citizens are concerned with muchmore than just GDP per capita. In particular, they seek to ensure the overall well-being of
society, both today and in the future.
But what precisely is “well-being”? Answers differ. Social indicators focus on observable
outcomes in a variety of fields (health, literacy, poverty) based on the premise that most peoplewould agree about the value of what is being described and that these social characteristics
can be measured reliably and independently of people’s subjective perceptions. On the otherhand, the economic literature assumes that individuals derive well-being from the satisfaction
of their wants according to their preferences, chiefly as exercised in the marketplace.Satisfaction of wants is a function of what individuals consume, but since their consumption
is ultimately determined by their income, this can be used as a proxy for well-being andreliably measured using national accounts income measures.
Up until the recent period, using a monetary measure like GDP per capita as a proxyfor the population’s well-being made much sense. GDP per capita provides an accurate
measure of a country’s capacity to deal with the material needs of its residents. And so longas the basic necessities of life remain scarce, additions to GDP per capita can be expected
to equate closely with improvements in meeting the population’s basic needs, and hencein greater well-being. The consensus on the use of GDP per capita as a good proxy measure
of well-being is, however, becoming less obvious as the more developed societies movefrom a situation of scarcity to a situation of plenty. The intuitive notion that, once a certain
level of material needs has been met, further increments in economic growth will notnecessarily yield the same improvements in the well-being of the citizens is backed up by
numerous studies that indicate that this divergence between added income and addedwell-being holds true both within and across societies.
So there is a need for indicators that better reflect non-monetary factors – but is therea single indicator that can be measured reliably across countries and used as yardstick for
well-being? Unfortunately, the answer is No. This may be seen as providing one argumentfor sticking with GDP per capita: after all, it can be calculated with a certain degree of
reliability to yield a figure that can be readily compared across countries. This should notbe viewed historically, however: the current development of comparable economic
measures represents a relatively recent achievement. In the post-World War II era greatefforts have been made to develop harmonized tools to measure economic growth. These
tools have become increasingly sophisticated as economies have shifted from theproduction of goods like wheat and steel, which are more easily quantified, into the
production of services, for which measurement is more elusive. But considerable progresshas also been made in developing a comparable set of social indicators, particularly since
SOCIETY AT A GLANCE: OECD SOCIAL INDICATORS – 2006 EDITION – ISBN 92-64-02818-8 – © OECD 200720
I.2. MEASURING WELL-BEING: WHAT ROLE FOR SOCIAL INDICATORS?
the 1980s, when the OECD first presented its social indicators (OECD, 1986). This progress
needs to be sustained, inter alia through greater co-operation between the statistical officesof member countries and international organisations such as the OECD – whose role in this
field can be similar to what it has achieved in respect to conventional economic statistics.
This chapter considers four approaches to measuring well-being.2 First, it presents
evidence on the importance for well-being of the social indicators presented in differentissues of Society at a Glance and on the extent to which they are correlated with GDP per
capita. Second, it reviews monetary measures of economic resources derived from nationalaccounts. Third, it looks at ways in which these monetary measures can be adjusted to take
into account other factors that influence well-being, in particular leisure time, householdsize and aversion to inequality. Finally, it considers subjective measures of happiness and
life satisfaction, before concluding.
2. Social indicatorsSocial indicators provide a complementary approach to GDP-derived proxies for well-
being. In this chapter, four indicators have been chosen for each of the four domains (self-sufficiency, equity, health status and social cohesion) described in Chapter 1.3 The
selection of these indicators, while subjective, is based on both their importance to socialwell-being and their availability, so as to allow meaningful cross-country comparisons.
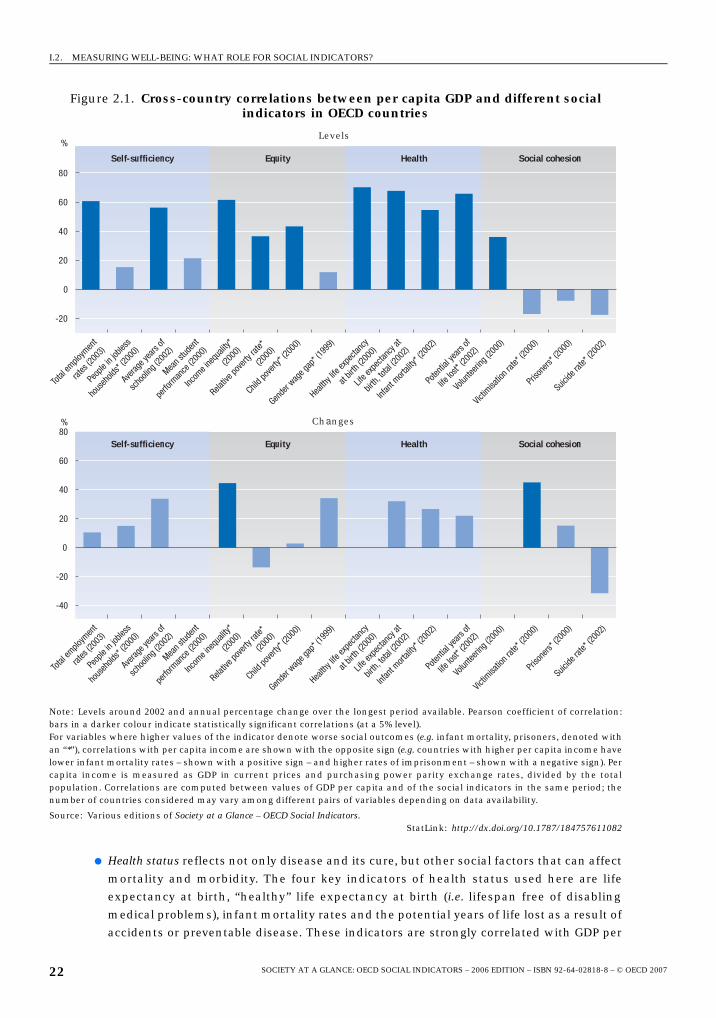
Do these indicators provide additional information relative to that conveyed by GDPper capita? To answer this question, the top panel of Figure 2.1 presents the simple
correlation between the levels of these 16 social indicators and GDP per capita. The bottompanel of the figure presents the correlation between average annual changes in the two
sets of variables. The panel shows varying degrees of correlation between the 16 socialindicators and GDP per capita, with the highest degrees of correlation with health
indicators and the lowest with social cohesion indicators.
● Self-sufficiency reflects the extent of participation in the economy and society and how
well individuals are able to get through daily life on their own. It is measured in terms ofthe overall employment rate, the proportion of the population in households where
nobody has a job, the average number of years of schooling, and the average schoolperformance of children at age 15. All these factors affect or will affect the ability of
individuals to earn a decent living. GDP per capita correlates significantly withemployment rates but not with measures of how employment opportunities (and thus
joblessness) are shared within the population. Likewise, in richer countries the averageadult has completed more years of education, but the average 15-year-old student does
not necessarily perform better. There is only a weak correlation between changes inthese self-sufficiency measures and GDP per capita.
● Equity reflects the distribution of household incomes and the extent of equality ofopportunity and autonomy of individuals. It may be measured in terms of income
inequality, relative poverty rates, child poverty and the gender wage gap. Higher levels ofGDP per capita correlate to some extent with lower inequity in income distribution.
OECD countries with lower GDP per capita also tend to record higher relative poverty andpoverty among children, but not necessarily lower earnings inequalities by gender.
Increases in GDP per capita go hand-in-hand with reductions in income inequality andgender wage gaps, but this is only very weakly, if at all, related to changes in child
poverty and relative poverty.
SOCIETY AT A GLANCE: OECD SOCIAL INDICATORS – 2006 EDITION – ISBN 92-64-02818-8 – © OECD 2007 21
I.2. MEASURING WELL-BEING: WHAT ROLE FOR SOCIAL INDICATORS?
● Health status reflects not only disease and its cure, but other social factors that can affect
mortality and morbidity. The four key indicators of health status used here are lifeexpectancy at birth, “healthy” life expectancy at birth (i.e. lifespan free of disabling
medical problems), infant mortality rates and the potential years of life lost as a result ofaccidents or preventable disease. These indicators are strongly correlated with GDP per
Figure 2.1. Cross-country correlations between per capita GDP and different social indicators in OECD countries
Note: Levels around 2002 and annual percentage change over the longest period available. Pearson coefficient of correlation:bars in a darker colour indicate statistically significant correlations (at a 5% level).For variables where higher values of the indicator denote worse social outcomes (e.g. infant mortality, prisoners, denoted withan “*”), correlations with per capita income are shown with the opposite sign (e.g. countries with higher per capita income havelower infant mortality rates – shown with a positive sign – and higher rates of imprisonment – shown with a negative sign). Percapita income is measured as GDP in current prices and purchasing power parity exchange rates, divided by the totalpopulation. Correlations are computed between values of GDP per capita and of the social indicators in the same period; thenumber of countries considered may vary among different pairs of variables depending on data availability.
Source: Various editions of Society at a Glance – OECD Social Indicators.StatLink: http://dx.doi.org/10.1787/184757611082
0
20
40
60
80
%
-20
%
-40
-20
0
20
40
60
80
Social cohesionHealthEquitySelf-sufficiency
Tota
l em
ploym
ent
rate
s (20
03)
Peop
le in
jobles
s
hou
seho
lds* (
2000
)
Aver
age y
ears
of
scho
oling
(200
2)
Mea
n stu
dent
per
form
ance
(200
0)
Incom
e ine
quali
ty*
(200
0)
Relativ
e pov
erty
rate
*
(200
0)
Child
pove
rty* (
2000
)
Gende
r wag
e gap
* (19
99)
Health
y life
expe
ctan
cy
at b
irth
(200
0)
Life e
xpec
tanc
y at
birt
h, to
tal (
2002
)
Infan
t mor
tality
* (20
02)
Pote
ntial
year
s of
life l
ost*
(200
2)
Volun
teer
ing (2
000)
Victim
isatio
n ra
te* (
2000
)
Priso
ners
* (20
00)
Suici
de ra
te* (
2002
)
Levels
Social cohesionHealthEquitySelf-sufficiency
Changes
SOCIETY AT A GLANCE: OECD SOCIAL INDICATORS – 2006 EDITION – ISBN 92-64-02818-8 – © OECD 200722
I.2. MEASURING WELL-BEING: WHAT ROLE FOR SOCIAL INDICATORS?
capita, meaning that on average OECD countries with higher incomes enjoy better
health. Nevertheless, differences in country performance can still be significant – forexample, infant mortality rates differ by a factor of around two between countries with
similar GDP per capita. While changes in GDP per capita are positively related to changesin health status, the correlations are weak and not statistically significant.
● A feeling of belonging to a wider community and the satisfaction that derives fromparticipation in the broader society are important to well-being. But social cohesion is
measured not only through positive indicators, like the share of people who volunteer incommunity groups, but also through negative manifestations, such as levels of crime,
victimisation and suicide. While people do more volunteering in countries with higherGDP per capita, there is no significant correlation with the negative indicators, although
an increase in GDP per capita does seem to go hand-in-hand with a decline in thenumber of people who have been victims of crime.
Overall, social indicators provide information about a number of dimensions of well-being that seem to go beyond what is conveyed by GDP.4 The main weakness of social
indicators is, however, that they do not allow a parsimonious representation of well-being,because of the lack of agreement on how to aggregate these indicators. A simple synthetic
measure can be constructed by normalizing and then aggregating the 16 indicatorsdescribed above into a composite index that can be compared across countries.5 This index
then needs to be tested to see how robust it is when different weights are used to aggregatethe various elementary indicators. The techniques used to perform this operation are
described in Boarini et al. (2006).
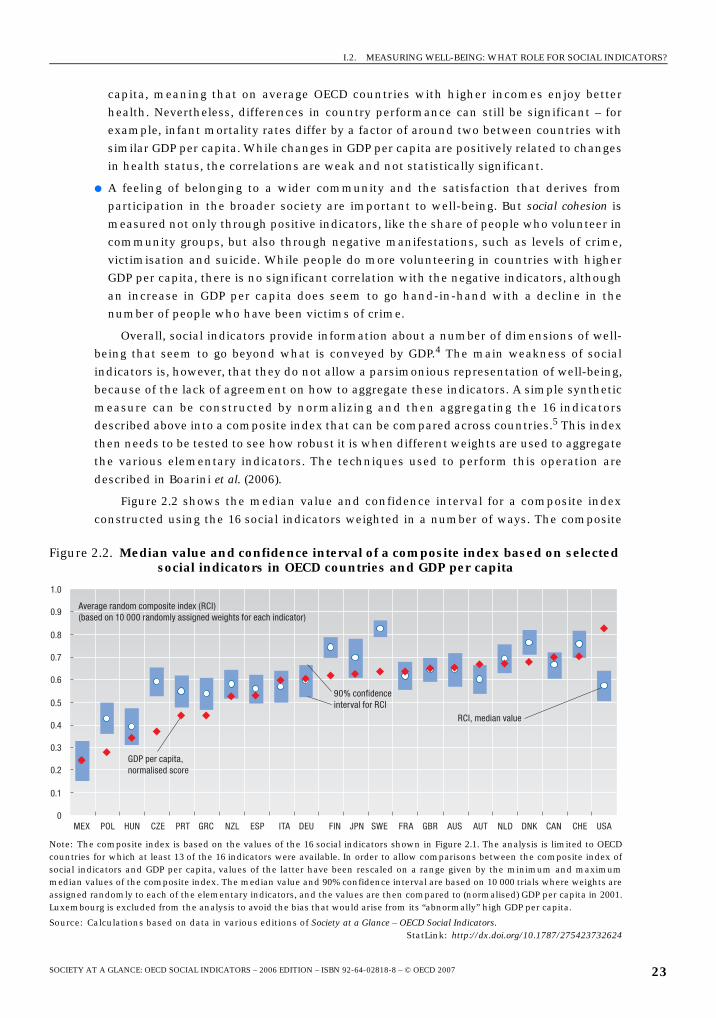
Figure 2.2 shows the median value and confidence interval for a composite index
constructed using the 16 social indicators weighted in a number of ways. The composite
Figure 2.2. Median value and confidence interval of a composite index based on selected social indicators in OECD countries and GDP per capita
Note: The composite index is based on the values of the 16 social indicators shown in Figure 2.1. The analysis is limited to OECDcountries for which at least 13 of the 16 indicators were available. In order to allow comparisons between the composite index ofsocial indicators and GDP per capita, values of the latter have been rescaled on a range given by the minimum and maximummedian values of the composite index. The median value and 90% confidence interval are based on 10 000 trials where weights areassigned randomly to each of the elementary indicators, and the values are then compared to (normalised) GDP per capita in 2001.Luxembourg is excluded from the analysis to avoid the bias that would arise from its “abnormally” high GDP per capita.
Source: Calculations based on data in various editions of Society at a Glance – OECD Social Indicators.StatLink: http://dx.doi.org/10.1787/275423732624
0
0.1
0.2
0.3
0.4
0.5
0.6
0.7
0.8
0.9
1.0
MEX POL HUN CZE PRT GRC NZL ESP ITA DEU FIN JPN SWE FRA GBR AUS AUT NLD DNK CAN CHE USA
90% confidence
interval for RCI
Average random composite index (RCI)
(based on 10 000 randomly assigned weights for each indicator)
RCI, median value
GDP per capita,
normalised score
SOCIETY AT A GLANCE: OECD SOCIAL INDICATORS – 2006 EDITION – ISBN 92-64-02818-8 – © OECD 2007 23
I.2. MEASURING WELL-BEING: WHAT ROLE FOR SOCIAL INDICATORS?
index of the social indicators yielded by this operation differs significantly from the relative
performance indicated by GDP per capita in slightly more than half the countries.6 Usingdifferent methodologies to construct the composite indices yields similar results. In
general, several composite indices developed in individual OECD countries highlight acommon pattern of much smaller increases in well-being than in GDP per capita since the
early 1970s, and in recent years they even indicate declines (Sharpe, 1999).
3. Monetary measures of economic resourcesThe second approach to the measurement of well-being is to use one or another way of
calculating real income from the System of National Accounts. While more established,problems remain in ensuring cross-country comparability. Furthermore, the impact of non-
monetary factors on well-being is excluded.
As mentioned above, the monetary measure most commonly used to assess the total
value of the economic resources that affect well-being is GDP per capita. GDP measures thevalue of the goods and services produced within a country during a given period of time. In
practice, this means the production of those activities that fall within the boundary of theSystem of National Accounts. The production of these goods and services is generally valued
at market prices, based on the assumption that these prices accurately reflect the value (toindividuals and society) of the resources used for their production, since they have
alternative uses. Some activities that are included in GDP are, however, particularly difficultto measure. Government services, for example, are often provided free or at a subsidised
price to direct users, and their output cannot be valued in terms of market prices. In the pastthe value of inputs has been used to make estimates, which amounts to equating
government output to the cost of its production. Recently some OECD countries, such as theUnited Kingdom, have modified their approach and begun to measure changes in government
production based on direct measures of output. While these adjustments remaincontroversial, their implications are significant: Atkinson (2005) reckons that methodological
differences in accounting for government output explain nearly half of the difference betweenthe GDP growth rates for the United Kingdom and the United States between 1995 and 2003.
Valuing quantities through market prices assumes that the prices are representativeof the marginal contributions of the different goods consumed to the utility of individuals.
In this approach, however, GDP per capita is only a proxy of well-being, meaning that thereare several areas in which it fails to take into account factors that are of importance as well:
● GDP excludes a range of non-market activities that influence well-being, due frequentlyto practical concerns with measuring them, because their value is not easily defined in
market terms. These include not only illegal activities and home activities likehousework and do-it-yourself work, but also leisure, which is clearly of value to society
and important to well-being.
● Conventional measurements of GDP exclude changes in asset values, although these
clearly influence what an individual can consume in the current period withoutbecoming worse off. Therefore, GDP more accurately reflects what a society produces
than what it can consume.
● GDP does not take account of externalities, such as pollution or environmental
deterioration, nor of depletion of non-renewable resources. This distorts how muchmarket prices actually reflect the marginal contribution of certain items to well-being,
including those of future generations.
SOCIETY AT A GLANCE: OECD SOCIAL INDICATORS – 2006 EDITION – ISBN 92-64-02818-8 – © OECD 200724
I.2. MEASURING WELL-BEING: WHAT ROLE FOR SOCIAL INDICATORS?
● GDP does not distinguish inter-country differences in the distribution of income. To most
people, a huge increase in national income that goes exclusively to a tiny handful of verywealthy families will not increase general well-being as much as if it were more
equitably distributed.
For these and other reasons, various adjustments have been made to SNA-based
measures to develop alternative monetary measures of well-being.
3.1. Gross national income: adjusting for net transfers from abroad
GDP takes into account only the production process that occurs within the borders ofa country, and ignores that some of the income generated by these activities is paid to non-
residents, while residents receive income from production in other countries. Thepurchasing power of residents may also increase or decrease with respect to foreign goods
due to changes in the terms of trade, that is, the price of imported relative to exportedgoods. Factoring in the “net income from abroad” gives a figure for gross national income
(GNI) that is more relevant to the well-being of the country’s residents.
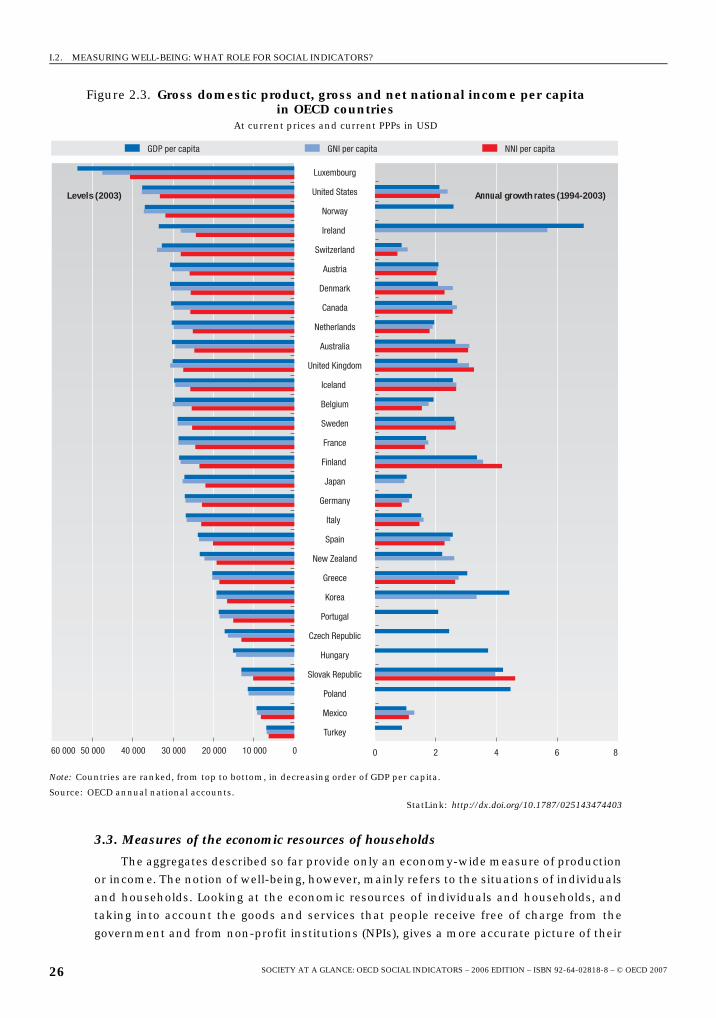
To compare these figures between countries, the production data, which are collected
in the local currency, need to be converted to a common currency, using purchasing-power-parity exchange rates (PPPs). In most OECD countries, the difference between GDP and GNI
per capita is small, since gross income inflows from abroad tend to be offset by grossoutflows, although there are some notable exceptions (e.g. Ireland and Switzerland,
Figure 2.3). Changes in GDP and GDI per capita over the past decade are broadly similar,with the exceptions of Ireland and South Korea, countries that are large producers of ICT
products and suffered, as a result, relatively large declines in their terms of trade.
3.2. Net national income: adjusting for capital consumption
GDP does not reflect the consumption of capital during the production process, and thus
overestimates the value of output that actually contributes to well-being without loweringfuture production. To correct for this, consumption of capital is estimated and then subtracted
from GDP to yield the net domestic product (NDP). This is the maximum amount of output thatcan be spent on consumption while maintaining a country’s productive capacity unchanged.
While all countries provide estimates of capital consumption, these are not calculated in thesame way, which reduces the international comparability of NDP measures.
Nevertheless, the difference between GDP and NDP per capita does not vary much
from one year to another, and neither do country rankings based on the two criteria. NDPper capita in OECD countries is on average 85% of the level of GDP per capita. NDP per
capita has, however, grown slightly more slowly than GDP per capita over the past decade,which reflects that capital consumption has grown faster than GDP due to the growing
investment in new technologies with a shorter service life.
As with GDP, it is possible to adjust NDP to take into account the affect of “net income
from abroad” to obtain net national income (NNI). Keeping in mind the problem withcalculating capital consumption, this figure gives, in principle, a more accurate picture of
the actual economic resources available to the country as a whole to secure well-being, andshows that GDP per capita does tend to overstate them. Nevertheless, the ranking of
countries based on NNI per capita is generally similar to that based on GDP per capita,although the difference is significant for a few countries (Figure 2.3). The growth rates are
also broadly similar for the two measures.
SOCIETY AT A GLANCE: OECD SOCIAL INDICATORS – 2006 EDITION – ISBN 92-64-02818-8 – © OECD 2007 25
I.2. MEASURING WELL-BEING: WHAT ROLE FOR SOCIAL INDICATORS?
3.3. Measures of the economic resources of households
The aggregates described so far provide only an economy-wide measure of productionor income. The notion of well-being, however, mainly refers to the situations of individuals
and households. Looking at the economic resources of individuals and households, andtaking into account the goods and services that people receive free of charge from the
government and from non-profit institutions (NPIs), gives a more accurate picture of their
Figure 2.3. Gross domestic product, gross and net national income per capita in OECD countries
At current prices and current PPPs in USD
Note: Countries are ranked, from top to bottom, in decreasing order of GDP per capita.
Source: OECD annual national accounts.StatLink: http://dx.doi.org/10.1787/025143474403
010 00020 00030 00040 00050 00060 000 0 2 4 6 8
GDP per capita GNI per capita NNI per capita
Luxembourg
United States
Norway
Ireland
Switzerland
Austria
Denmark
Canada
Netherlands
Australia
United Kingdom
Iceland
Belgium
Sweden
France
Finland
Japan
Germany
Italy
Spain
New Zealand
Greece
Korea
Portugal
Czech Republic
Hungary
Slovak Republic
Poland
Mexico
Turkey
Levels (2003) Annual growth rates (1994-2003)
SOCIETY AT A GLANCE: OECD SOCIAL INDICATORS – 2006 EDITION – ISBN 92-64-02818-8 – © OECD 200726

I.2. MEASURING WELL-BEING: WHAT ROLE FOR SOCIAL INDICATORS?
economic well-being. There are three ways to use the national accounts to calculate this:
household disposable income per capita; household final consumption per capita; and“actual” household consumption per capita, which includes an estimate of the services
provided by government and NPIs.7
Not surprisingly, all three of these measures are significantly lower than GDP per
capita, especially for final consumption. Nevertheless, all the measures correlate stronglywith GDP per capita, even though the gap between disposable income and GDP per capita
ranges from 20% in Turkey to 57% in Denmark. Household income and actual consumptionhave, however, risen less rapidly than GDP per capita in most countries over the past
decade (Figure 2.4) – with a gap of as much as one percentage point for a number ofcountries – reflecting shifts in the allocation of income between households, firms and the
public sector.
3.4. Summing-up on monetary indicators
Overall, when we remain confined within the borders of the System of National
Accounts, there is a fair degree of convergence in the levels and, to a lower extent, thegrowth rates of the different measures of country-wide economic resources, whatever the
different adjustments made. But the more realistic the picture of the economic resourcesthat households actually have at their disposal to secure their well-being, the less
convergence there is with economy-wide measures of resources.
The indicators of economic resources discussed above measure a key factor for
securing the well-being of individuals and society. But however important economicresources are, they don’t tell the whole story – as the old adage tells us, “money doesn’t buy
happiness”. This would seem to be particularly true as societies move beyond the pointwhere they are capable of meeting the basic needs of the population for food, shelter and
Figure 2.4. Real household disposable income, real final consumption expenditure and real GDP per capita, average annual growth rate, 1994-2003
Percentage
Source: OECD annual national accounts and OECD (2005), OECD Economic Outlook, No. 76, Paris.StatLink: http://dx.doi.org/10.1787/602121645683
0 1 2 3 4 5 6 70
1
2
3
4
5
6
7
0 1 2 3 4 5 6 70
1
2
3
4
5
6
7
Household disposable income per capita
GDP per capita
USAGBR
TUR
CHE
SWE
SVK
PRT
POL
NOR
NZLNLD
MEX
KOR
JPN
ITA
HUN
GRCDEU
FRAFIN
DNK
CZE
CANBEL
AUT
AUS
GDP and household disposable income per capita
Private consumption per capita
GDP per capita
GDP and final consumption expenditure per capita
USA
GBR
TUR
CHE
SWE
ESP
SVK
PRT
POL
NOR
NZLNLD
MEX
LUX
KOR
JPN
ITA
IRL
ISL
HUN
GRC
DEU
FRA
FIN
DNK
CZE
CAN
BEL
AUT
AUS
SOCIETY AT A GLANCE: OECD SOCIAL INDICATORS – 2006 EDITION – ISBN 92-64-02818-8 – © OECD 2007 27
I.2. MEASURING WELL-BEING: WHAT ROLE FOR SOCIAL INDICATORS?
clothing. Economists have recognised this limit themselves and have endeavoured to
develop various other mechanisms for taking into account non-market factors.8
4. Additional adjustments to national accounts measuresThe measures of the economic resources that are derived from the national accounts
can be adjusted by attaching a monetary value to various non-monetary factors in order toobtain a better proxy of the well-being of individuals and societies. The main difficulty is
how to price different non-market activities, such as leisure, and unrecorded economicactivities, such as work in the home. Different estimates generally value the inputs into
these activities based on either replacement costs or opportunity costs. Some resultssuggestive of the impact of some of these non-market factors are presented below.
4.1. Well-being and leisure
Using GDP-derived measures as proxies for well-being takes no account of leisuretime. Yet leisure time is obviously of great importance to almost everyone’s well-being. In
this sense, it is a “good” that has a certain marginal utility. But how can we measure itsquantity? And how should it be valued? We are certainly far from having satisfactory
responses to these questions. Still, the large cross-country differences in the annualamount of paid work performed by workers suggest that there are big differences in the
amount of leisure time that they enjoy in different countries. Part of the gap in GDP percapita between the United States and most other OECD countries reflects the greater
number of hours American workers work each year. How much is this due to differences inculture and/or preferences, and how much to the impact of policies and institutions? While
it is impossible to answer these questions precisely, any realistic evaluation of well-beingneeds to ascribe some monetary value to the leisure time of workers.9
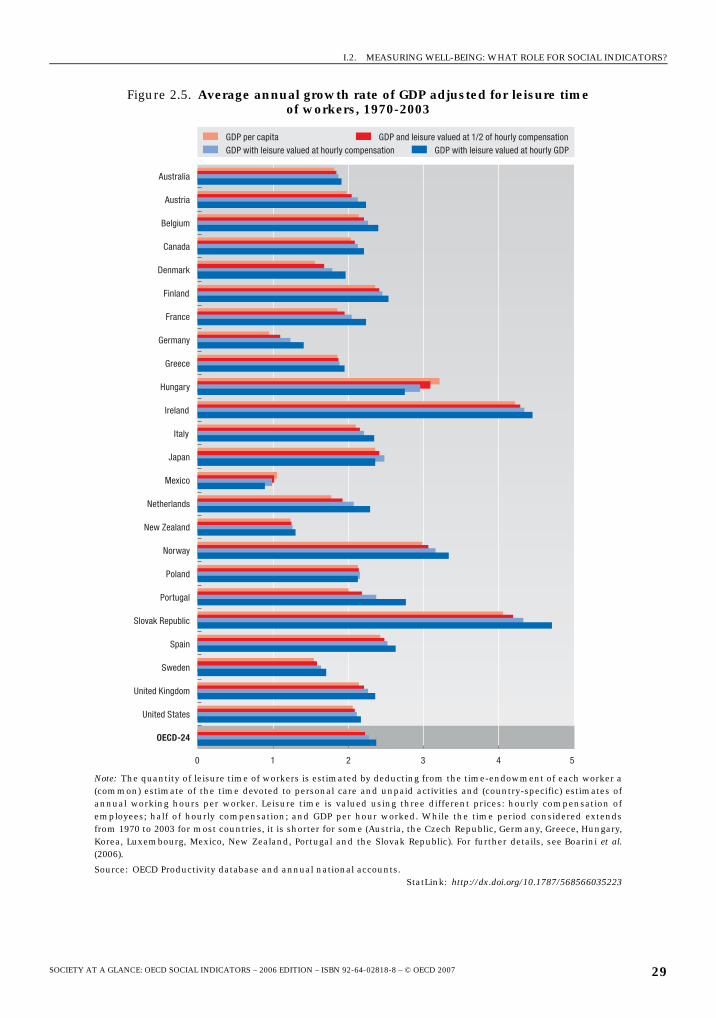
This valuation is performed here by adding to GDP per capita an estimate of thequantity of leisure time annually enjoyed by each worker valued in three different ways: at
GDP per hour worked, at the hourly compensation of each worker and at half of hourlycompensation (to allow for the possibility that lower working hours in some countries
reflect the impact of taxes and other policies). Plotting the gaps relative to the UnitedStates in “leisure-adjusted” GDP per capita using these three approaches shows that any
positive valuation to leisure narrows the gaps relative to those based on GDP per capita (thehigher the valuation placed on leisure, the narrower the gap). The average annual growth
in “leisure-adjusted” GDP per capita tends to exceed that of GDP, with the difference beingespecially large in some European countries (Figure 2.5).
4.2. Well-being and household size
Estimates of per capita household income in the national accounts are obtained by
summing up income across all households and dividing the total among the residentpopulation. This approach does not take into account any variation in household size. In
fact, households of different sizes have different abilities to pool resources and do not needthe same income to assure the same level of well-being for their members. For instance, a
household consisting of a couple with two children does not necessarily need twice theincome of a childless couple to achieve the same level of well-being. One way this factor
can be taken into account is by applying a common “equivalence scale” to survey data onhousehold income to calculate what is called the “equivalised household disposable
income” of each person.
SOCIETY AT A GLANCE: OECD SOCIAL INDICATORS – 2006 EDITION – ISBN 92-64-02818-8 – © OECD 200728
I.2. MEASURING WELL-BEING: WHAT ROLE FOR SOCIAL INDICATORS?
Figure 2.5. Average annual growth rate of GDP adjusted for leisure time of workers, 1970-2003
Note: The quantity of leisure time of workers is estimated by deducting from the time-endowment of each worker a(common) estimate of the time devoted to personal care and unpaid activities and (country-specific) estimates ofannual working hours per worker. Leisure time is valued using three different prices: hourly compensation ofemployees; half of hourly compensation; and GDP per hour worked. While the time period considered extendsfrom 1970 to 2003 for most countries, it is shorter for some (Austria, the Czech Republic, Germany, Greece, Hungary,Korea, Luxembourg, Mexico, New Zealand, Portugal and the Slovak Republic). For further details, see Boarini et al.(2006).
Source: OECD Productivity database and annual national accounts.StatLink: http://dx.doi.org/10.1787/568566035223
0 1 2 3 4 5
GDP and leisure valued at 1/2 of hourly compensationGDP per capita
GDP with leisure valued at hourly GDPGDP with leisure valued at hourly compensation
Australia
Austria
Belgium
Canada
Denmark
Finland
France
Germany
Greece
Hungary
Ireland
Italy
Japan
Mexico
Netherlands
New Zealand
Norway
Poland
Portugal
Slovak Republic
Spain
Sweden
United Kingdom
United States
OECD-24
SOCIETY AT A GLANCE: OECD SOCIAL INDICATORS – 2006 EDITION – ISBN 92-64-02818-8 – © OECD 2007 29
I.2. MEASURING WELL-BEING: WHAT ROLE FOR SOCIAL INDICATORS?
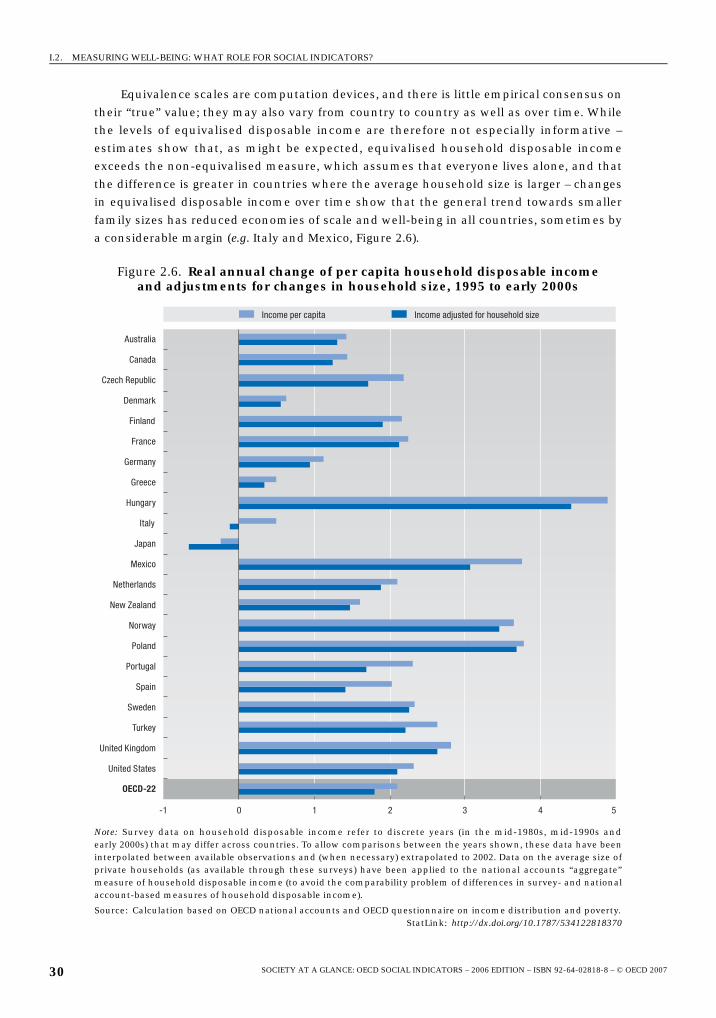
Equivalence scales are computation devices, and there is little empirical consensus on
their “true” value; they may also vary from country to country as well as over time. Whilethe levels of equivalised disposable income are therefore not especially informative –
estimates show that, as might be expected, equivalised household disposable incomeexceeds the non-equivalised measure, which assumes that everyone lives alone, and that
the difference is greater in countries where the average household size is larger – changesin equivalised disposable income over time show that the general trend towards smaller
family sizes has reduced economies of scale and well-being in all countries, sometimes bya considerable margin (e.g. Italy and Mexico, Figure 2.6).
Figure 2.6. Real annual change of per capita household disposable income and adjustments for changes in household size, 1995 to early 2000s
Note: Survey data on household disposable income refer to discrete years (in the mid-1980s, mid-1990s andearly 2000s) that may differ across countries. To allow comparisons between the years shown, these data have beeninterpolated between available observations and (when necessary) extrapolated to 2002. Data on the average size ofprivate households (as available through these surveys) have been applied to the national accounts “aggregate”measure of household disposable income (to avoid the comparability problem of differences in survey- and nationalaccount-based measures of household disposable income).
Source: Calculation based on OECD national accounts and OECD questionnaire on income distribution and poverty.StatLink: http://dx.doi.org/10.1787/534122818370
-1 0 1 2 3 4 5
Australia
Canada
Czech Republic
Denmark
Finland
France
Germany
Greece
Hungary
Italy
Japan
Mexico
Netherlands
New Zealand
Norway
Poland
Portugal
Spain
Sweden
Turkey
United Kingdom
United States
OECD-22
Income per capita Income adjusted for household size
SOCIETY AT A GLANCE: OECD SOCIAL INDICATORS – 2006 EDITION – ISBN 92-64-02818-8 – © OECD 200730

I.2. MEASURING WELL-BEING: WHAT ROLE FOR SOCIAL INDICATORS?
4.3. Inequality in the distribution of economic resources
Income is not distributed equally in any OECD country, and OECD-wide trends sincethe mid-1980s indicate that the degree of inequality has increased, particularly in a few
countries (Förster and Mira d’Ercole, 2005). Conventional measures of GDP per capita attachthe same weight to each unit of income, regardless of how equally it is distributed. Yet
many theories of social justice would argue for giving an added weight to income that goesto the poorest strata, especially in more unequal societies. For example, in a situation
where the income of the richest decile of a population rises by amounts equal to thedeclines in income of the poorest decile, per capita income remains constant, whereas
most observers would agree that the general well-being of the society has declined.
To take the issue of unequal distribution into account, it is possible to adjust GDP and
household income by weighting the average income of each decile of the distribution by acoefficient that represents the degree of social aversion to inequality (Kolm, 1969).
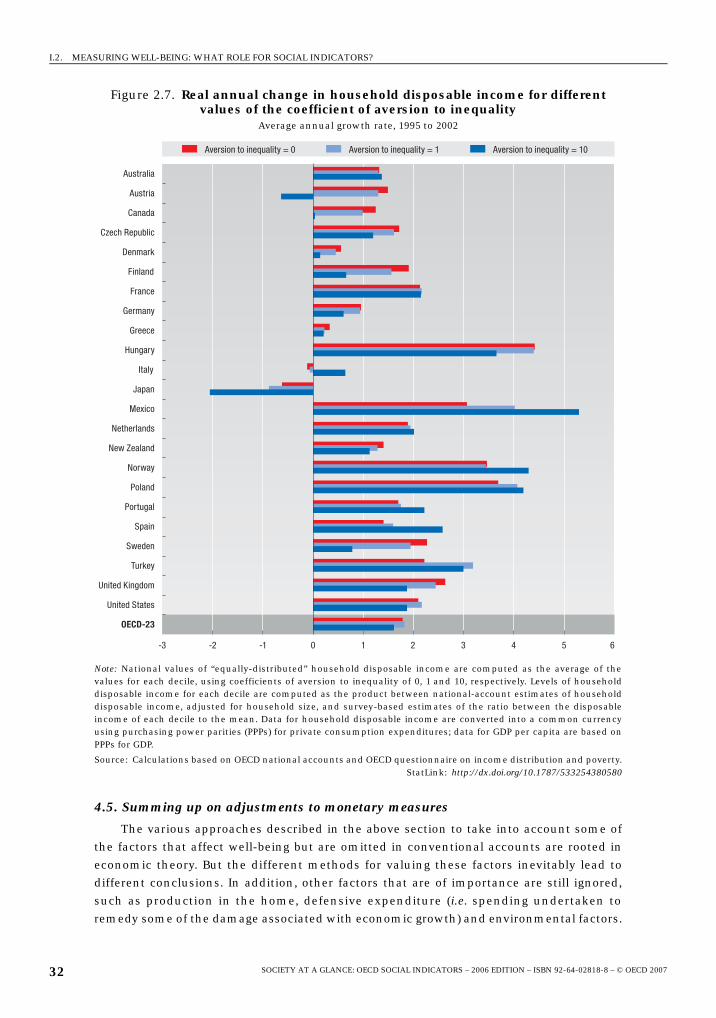
Figure 2.7 shows the results of calculations performed using three different weightings to
adjust household disposable income to reflect the society’s aversion to inequality. A highervalue for this coefficient implies a higher degree of aversion to inequality, and therefore
that less weight is given to higher incomes. So in countries where income growth has beenskewed towards the better-off, applying the higher value of the coefficient will reduce the
annual change in household income (the United Kingdom, the Czech Republic, the UnitedStates) while in those where the poorer deciles have benefited more it will tend to increase
the annual change (Mexico, Spain, Norway).While a low or even intermediate degree ofaversion to inequality does not change the country rankings much, a higher degree of
aversion to inequality leads to significant changes. Using a coefficient to reflect the highestdegree of aversion also lowers the adjusted growth rate for disposable income for the
period 1985-2002 to 0.6%, as compared with 1.4% for conventional income, with greaterdeclines in some countries (Figure 2.7). In conclusion, while the degree of inequality in
income distribution can have a significant impact on the assessment of well-being, ascompared with measures using conventional income, the extent of the impact depends
crucially on the assumption of the degree of aversion to inequality in the given society.
4.4. Well-being and the environment
Well-being does not depend only on social and economic factors but also on
environmental ones. Indeed, historically, much of the research on expanded measures ofwell-being has been driven by concerns about environmental degradation. Concern about
sustainable development emphasises the need to take into account resources and capitalstocks that are not included in the production boundary of conventional economic
accounts. Although a sustainable development approach has direct implications for themeasurement of income – in particular in terms of resources and environmental values
that are affected by production but not calculated in market exchanges – there are not yetestablished mechanisms for integrating these concerns into measurements of economic
resources.10 Further, as in the social area, the relation between environmental quality andeconomic development is complex. Higher GDP levels generally tend to stress the
environment more, but also increase the capacities and resources for dealing withenvironmental problems.
SOCIETY AT A GLANCE: OECD SOCIAL INDICATORS – 2006 EDITION – ISBN 92-64-02818-8 – © OECD 2007 31
I.2. MEASURING WELL-BEING: WHAT ROLE FOR SOCIAL INDICATORS?
4.5. Summing up on adjustments to monetary measures
The various approaches described in the above section to take into account some ofthe factors that affect well-being but are omitted in conventional accounts are rooted in
economic theory. But the different methods for valuing these factors inevitably lead todifferent conclusions. In addition, other factors that are of importance are still ignored,
such as production in the home, defensive expenditure (i.e. spending undertaken toremedy some of the damage associated with economic growth) and environmental factors.
Figure 2.7. Real annual change in household disposable income for different values of the coefficient of aversion to inequality
Average annual growth rate, 1995 to 2002
Note: National values of “equally-distributed” household disposable income are computed as the average of thevalues for each decile, using coefficients of aversion to inequality of 0, 1 and 10, respectively. Levels of householddisposable income for each decile are computed as the product between national-account estimates of householddisposable income, adjusted for household size, and survey-based estimates of the ratio between the disposableincome of each decile to the mean. Data for household disposable income are converted into a common currencyusing purchasing power parities (PPPs) for private consumption expenditures; data for GDP per capita are based onPPPs for GDP.
Source: Calculations based on OECD national accounts and OECD questionnaire on income distribution and poverty.StatLink: http://dx.doi.org/10.1787/533254380580
-3 -2 -1 0 1 2 3 4 5 6
Aversion to inequality = 1Aversion to inequality = 0 Aversion to inequality = 10
Australia
Austria
Canada
Czech Republic
Denmark
Finland
France
Germany
Greece
Hungary
Italy
Japan
Mexico
Netherlands
New Zealand
Norway
Poland
Portugal
Spain
Sweden
Turkey
United Kingdom
United States
OECD-23
SOCIETY AT A GLANCE: OECD SOCIAL INDICATORS – 2006 EDITION – ISBN 92-64-02818-8 – © OECD 200732
I.2. MEASURING WELL-BEING: WHAT ROLE FOR SOCIAL INDICATORS?
While these are difficult to measure, ignoring them may lead to misleading conclusions in
so far as they vary over time and between countries.11 This is particularly the case whenthese factors are directly affected by economic activities.
5. Well-being and happinessInstead of using objective measures as proxies for well-being, a third approach is
simply to ask the individuals themselves how satisfied they are with their lives. Subjective
measures of well-being are of course fraught with methodological difficulties. They couldreflect different underlying concepts, be influenced by transient factors, or be affected by
linguistic or cultural differences. Nevertheless, studies have shown that individuals whoreport higher levels of satisfaction with their lives are also rated as happier by their
relatives and friends, tend to smile more during social interactions, have higher pre-frontalbrain activity (the part of the brain associated with positive states), are more likely to recall
positive life events, and have a higher resilience to stress (Layard, 2005). Several globalsurveys exist, such as the World Values Surveys, that utilise comparable criteria and ask a
representative sample of people such questions as how satisfied they are with their lives.
Comparisons of subjective measures of life satisfaction with average income at the
national level reveal two findings:
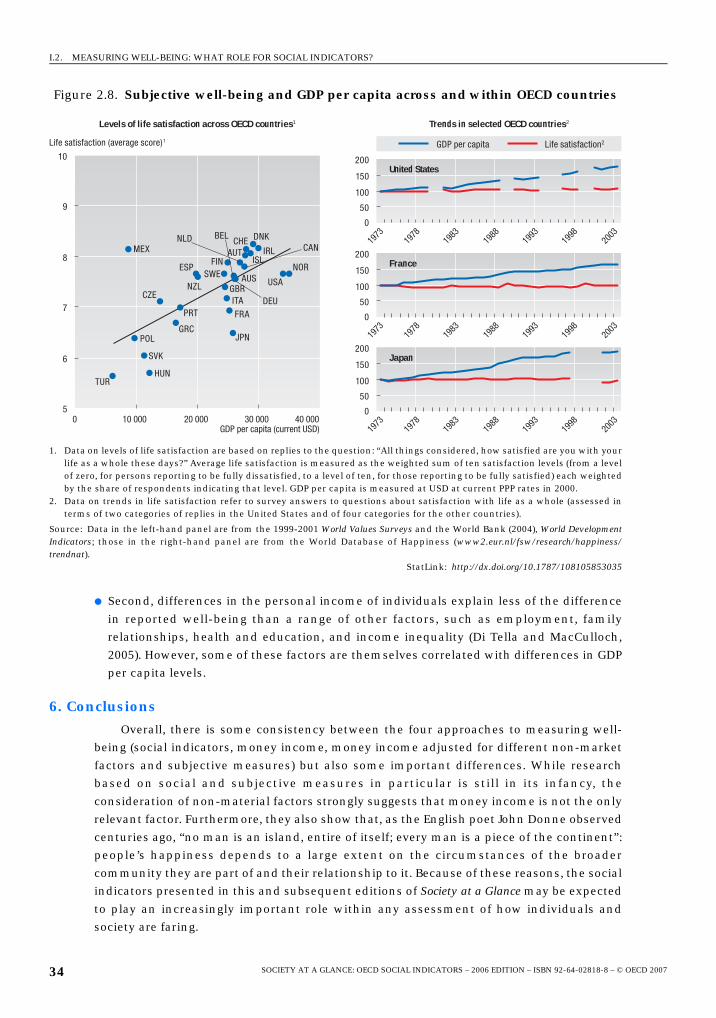
● Across countries, people living in countries with a higher GDP per capita tend to report
being happier at a given point in time, but the size of the gain in subjective well-beingtends to decline once GDP per capita exceeds USD 10 000 (Frey and Stutzer, 2002). This
tapering-off is however less clear when referring only to OECD countries (Figure 2.8, left-hand panel), and varies with the measure of national income used (i.e. GDP or NNI per
capita).
● Across time, the coexistence of a rapid rise in GDP per capita with stable levels of
subjective well-being has been interpreted as evidence that greater material prosperitydoes not necessarily make people happier (see the right-hand panel of Figure 2.8 for an
illustration based on data for selected OECD countries). The stability of the indicator forsubjective well-being may however reflect to some extent that it is measured using a
bounded variable (i.e. respondents are asked to rank their life satisfaction on a scale – e.g. by1 to 10 – that is unchanged over time) whereas income is measured with an unbounded
variable (GDP per capita).
While the conclusions concerning the link between income and subjective life
satisfaction based on aggregate cross-country data remain controversial, there is firmerevidence about the determinants of happiness and life satisfaction at the level of
individuals.
● First, while individual data do highlight a relation between income and well-being, they
also show that the differences in reported well-being between individuals are notproportional to the differences in their income. Furthermore, changes in individual
income do not bring comparable changes in subjective well-being, and depend stronglyon the direction of changes in income – a loss has a much bigger effect than a
comparable gain. This probably arises because individuals adapt to a certain level ofincome (“satisfaction treadmill”), and higher income levels lead to expectations that are
more difficult to fulfil. Another factor at work here is the desire to “keep up with theJoneses”, although social comparison may sometimes work to increase subjective well-
being too.
SOCIETY AT A GLANCE: OECD SOCIAL INDICATORS – 2006 EDITION – ISBN 92-64-02818-8 – © OECD 2007 33
I.2. MEASURING WELL-BEING: WHAT ROLE FOR SOCIAL INDICATORS?
● Second, differences in the personal income of individuals explain less of the difference
in reported well-being than a range of other factors, such as employment, familyrelationships, health and education, and income inequality (Di Tella and MacCulloch,
2005). However, some of these factors are themselves correlated with differences in GDPper capita levels.
6. ConclusionsOverall, there is some consistency between the four approaches to measuring well-
being (social indicators, money income, money income adjusted for different non-market
factors and subjective measures) but also some important differences. While researchbased on social and subjective measures in particular is still in its infancy, the
consideration of non-material factors strongly suggests that money income is not the onlyrelevant factor. Furthermore, they also show that, as the English poet John Donne observed
centuries ago, “no man is an island, entire of itself; every man is a piece of the continent”:people’s happiness depends to a large extent on the circumstances of the broader
community they are part of and their relationship to it. Because of these reasons, the socialindicators presented in this and subsequent editions of Society at a Glance may be expected
to play an increasingly important role within any assessment of how individuals andsociety are faring.
Figure 2.8. Subjective well-being and GDP per capita across and within OECD countries
1. Data on levels of life satisfaction are based on replies to the question: “All things considered, how satisfied are you with yourlife as a whole these days?” Average life satisfaction is measured as the weighted sum of ten satisfaction levels (from a levelof zero, for persons reporting to be fully dissatisfied, to a level of ten, for those reporting to be fully satisfied) each weightedby the share of respondents indicating that level. GDP per capita is measured at USD at current PPP rates in 2000.
2. Data on trends in life satisfaction refer to survey answers to questions about satisfaction with life as a whole (assessed interms of two categories of replies in the United States and of four categories for the other countries).
Source: Data in the left-hand panel are from the 1999-2001 World Values Surveys and the World Bank (2004), World DevelopmentIndicators; those in the right-hand panel are from the World Database of Happiness (www2.eur.nl/fsw/research/happiness/trendnat).
StatLink: http://dx.doi.org/10.1787/108105853035
5
6
7
8
9
10
0 10 000 20 000 30 000 40 000
50
0
100
150
200
1973
1978
1983
1988
1993
1998
2003
1973
1978
1983
1988
1993
1998
2003
1973
1978
1983
1988
1993
1998
2003
50
0
100
150
200
50
0
100
150
200
Life satisfaction (average score)1
GDP per capita (current USD)
IRL CHE
MEX ISL
AUT
NLD
FIN
CAN
NZL
NOR
USA SWE
BEL
AUSGBR
ITA CZE
PRT FRA
GRCJPNPOL
SVK
HUN TUR
GDP per capita Life satisfaction2
United States
France
Japan
DNK
ESP
DEU
Trends in selected OECD countries2Levels of life satisfaction across OECD countries1
SOCIETY AT A GLANCE: OECD SOCIAL INDICATORS – 2006 EDITION – ISBN 92-64-02818-8 – © OECD 200734

I.2. MEASURING WELL-BEING: WHAT ROLE FOR SOCIAL INDICATORS?
Notes
1. This is, of course, only one of the goals of OECD social indicators. In addition to measuring the“social status” of OECD countries, the two other goals are describe the “social context” and“societal responses” to various problems (see Chapter 1).
2. This chapter draws on analysis provided in Boarini et al. (2006).
3. A full list of indicators published in all issues of Society at a Glance is provided in Table 1.1.
4. This conclusion is further reinforced when the analysis is limited to OECD countries with GDP percapita above a level of USD 25 000; in this case, none of the correlations between levels of socialindicators and GDP per capita is statistically significant.
5. Practical guidance on the construction of composite indicators is provided by Hoffman et al. (2005).
6. The correlation coefficient between (normalised) GDP per capita and the median value of thecomposite index is 0.76.
7. The same adjustment for the services provided by governments and NPIs can also be applied tohousehold disposable income.
8. A comprehensive approach to the construction of non-market accounts in the fields of homeproduction, human capital, the environment, health and education, government and the non-profit sector is described in Abraham and Mackie (2005), which summarises the conclusions of apanel of the National Research Council for the United States.
9. Accounting for the leisure time of non-employed persons would have required controversialassumptions on whether unemployment is voluntary or involuntary, and to distinguish betweenthe home production and the leisure time of housewives. An earlier assessment of the impact ofleisure time (and income inequality) on well-being was provided by Beckerman (1978).
10. Practical steps to better integrate physical measures of environmental stress within nationalaccounts are described in the 2003 Handbook of Integrated Environmental and Economic Accounts (aco-publication by United Nations, European Commission, IMF, OECD and the World Bank). However,such satellite accounts are not widely used in OECD countries.
11. Nordhaus and Tobin (1973) in their seminal contribution on measures of economic welfare adjustnational accounts aggregates for leisure time, defence and other intermediate expenditures,household production and some of the dysfunctions arising from urbanisation. They conclude thattheir preferred measure of economic welfare per capita increased in the United States at an annualrate of 1% from 1929 to 1965, as compared with 1.7% in personal consumption per capita and 1.6%in net national product per capita.
References
Abraham, K.G. and C. Mackie (2005), Beyond the Market – Designing Nonmarket Accounts for the UnitedStates, National Research Council of the National Academies, Washington D.C.
Atkinson, A.B. (2005), Measurement of Government Output and Productivity for the National Accounts,Atkinson Review: Final Report, Palgrave-MacMillan, United Kingdom.
Beckerman, W. (1978), Measures of Leisure, Equality and Welfare, OECD, Paris.
Boarini, R., A. Johansson and M. Mira d’Ercole (2006), “Alternative Measures of Well-being”, OECDEconomics Department Working Paper, No. 476 and OECD Social, Employment and MigrationWorking Paper, No. 33, OECD, Paris.
Di Tella, R. and R. MacCulloch (2005), “Gross National Happiness as an Answer to the EasterlinParadox?”, Economic Working Paper Archive at WUSTLE, April.
Förster, M. and M. Mira d’Ercole (2005), “Income Distribution and Poverty in OECD Countries in the SecondHalf of the 1990s”, OECD Social, Employment and Migration Working Paper, No. 22, OECD, Paris.
Frey, B.S. and A. Stutzer (2002), Happiness and Economics, Princeton University Press, Princeton and Oxford.
Hoffman, A.E. Giovannini, M. Nardo, M. Saisana, A. Saltelli and S. Tarantola (2005), “Handbook onConstructing Composite Indicators: Methodology and User Guide”, OECD Statistics Working Paper,Paris.
Kolm, S.C. (1969), “The Optimal Production of Social Justice”, in J. Margolis and H. Guitton (eds), PublicEconomics, MacMillan, London.
SOCIETY AT A GLANCE: OECD SOCIAL INDICATORS – 2006 EDITION – ISBN 92-64-02818-8 – © OECD 2007 35
I.2. MEASURING WELL-BEING: WHAT ROLE FOR SOCIAL INDICATORS?
Layard, R. (2005), Happiness – Lessons from a New Science, Penguin Press, New York.
Nordhaus, W.D. and J. Tobin (1973), “Is Growth Obsolete?”, in M. Moss (ed.), The Measurement of Economicand Social Performance, Studies in Income and Wealth, Vol. 38, National Bureau of EconomicResearch, Cambridge.
OECD (1986), Living Conditions in OECD Countries – A Compendium of Social Indicators, OECD, Paris.
Sharpe, A. (1999), “A Survey of Indicators of Economic and Social Well-being”, paper prepared for theCanadian Policy Research Networks, July.
SOCIETY AT A GLANCE: OECD SOCIAL INDICATORS – 2006 EDITION – ISBN 92-64-02818-8 – © OECD 200736