alternative technology for sour water stripping
TRANSCRIPT

University of Pennsylvania University of Pennsylvania
ScholarlyCommons ScholarlyCommons
Senior Design Reports (CBE) Department of Chemical & Biomolecular Engineering
4-20-2018
Alternative Technology for Sour Water Stripping Alternative Technology for Sour Water Stripping
Andrew E. Frederick University of Pennsylvania, [email protected]
Connor T. Leach University of Pennsylvania, [email protected]
Christelle U. Nayandi University of Pennsylvania, [email protected]
Follow this and additional works at: https://repository.upenn.edu/cbe_sdr
Part of the Biochemical and Biomolecular Engineering Commons
Frederick, Andrew E.; Leach, Connor T.; and Nayandi, Christelle U., "Alternative Technology for Sour Water Stripping" (2018). Senior Design Reports (CBE). 106. https://repository.upenn.edu/cbe_sdr/106
Sour water is a waste product of various crude oil refining processes at refineries. Ammonia and hydrogen sulfide, the main contaminants of sour water, must be removed from the sour water before it can be discharged or used elsewhere in the refinery. Through a process known as stripping, the contaminants are transferred from the sour water to the gaseous stripping agent in a large stripping column containing trays or packing. The designs outlined in this report analyze the economic and environmental validity of using two alternative stripping agents, air and natural gas, compared to the industry incumbent, steam. The Net Present Value for a natural gas-fed stripper is -$15 MM over 19 years compared to -$16 MM for that of an air-fed stripper. One novel feature included in both designs is the option of recycling the extract stream to reduce NOx emissions in natural gas-fed burners. Careful analysis of the economic, environmental, and safety considerations of each of the two stripping agents reveals that the natural gas stripping process is economically and efficaciously superior, while the air stripping process is environmentally superior with less safety concerns. Therefore, it is recommended that management pursues both options as potentially viable replacements for traditional sour water stripping processes. The analysis was performed assuming an average sour water flow rate of 37.5 gallons per minute and an average ammonia concentration of 1650 ppm in the sour water feed. The recommendation of pursuing natural gas and air equivalently as stripping agents is dependent on the assumed location of the refinery. Because environmental regulations for water and atmospheric discharge vary by region, a separate analysis of the validity of each alternative should be performed for stripping operations in different areas.
This paper is posted at ScholarlyCommons. https://repository.upenn.edu/cbe_sdr/106 For more information, please contact [email protected].

Alternative Technology for Sour Water Stripping Alternative Technology for Sour Water Stripping
Disciplines Disciplines Biochemical and Biomolecular Engineering | Chemical Engineering | Engineering
Comments Comments Sour water is a waste product of various crude oil refining processes at refineries. Ammonia and hydrogen sulfide, the main contaminants of sour water, must be removed from the sour water before it can be discharged or used elsewhere in the refinery. Through a process known as stripping, the contaminants are transferred from the sour water to the gaseous stripping agent in a large stripping column containing trays or packing. The designs outlined in this report analyze the economic and environmental validity of using two alternative stripping agents, air and natural gas, compared to the industry incumbent, steam. The Net Present Value for a natural gas-fed stripper is -$15 MM over 19 years compared to -$16 MM for that of an air-fed stripper. One novel feature included in both designs is the option of recycling the extract stream to reduce NOx emissions in natural gas-fed burners. Careful analysis of the economic, environmental, and safety considerations of each of the two stripping agents reveals that the natural gas stripping process is economically and efficaciously superior, while the air stripping process is environmentally superior with less safety concerns. Therefore, it is recommended that management pursues both options as potentially viable replacements for traditional sour water stripping processes.
The analysis was performed assuming an average sour water flow rate of 37.5 gallons per minute and an average ammonia concentration of 1650 ppm in the sour water feed. The recommendation of pursuing natural gas and air equivalently as stripping agents is dependent on the assumed location of the refinery. Because environmental regulations for water and atmospheric discharge vary by region, a separate analysis of the validity of each alternative should be performed for stripping operations in different areas.
This working paper is available at ScholarlyCommons: https://repository.upenn.edu/cbe_sdr/106

i | P a g e
University of Pennsylvania
Department of Chemical and Biomolecular Engineering
220 South 33rd Street
Philadelphia, PA 19014
April 18, 2018
Dear Dr. Sue Ann Bidstrup-Allen and Professor Bruce Vrana,
Enclosed is an analysis of two alternative designs to traditional sour water stripping and a recommendation for the superior alternative design. The alternative designs explore the use of
different stripping agents, air and natural gas, from the traditional method of using steam. The two alternative designs were compared based on their economic, environmental, and health and safety
impact. Ultimately, given the slightly higher efficacy and economic advantages of natural gas as the stripping agent, and the slight safety and environmental advantages of air as the stripping agent, we recommend pursuing both approaches as equivalent alternative sour water stripping methods.
The proposed design will be able to strip the incoming sour water feed with flows ranging
between 30 and 50 GPM, initial ammonia concentrations ranging between 300 and 3,000 ppm, hydrogen sulfide concentrations of 5 ppm, and trace amounts of propane, down to ammonia concentrations of 20 ppm and hydrogen sulfide concentrations of 0.1 ppm. The effluent raffinate
will be discharged to the Delaware River and the effluent extract stream will be returned to the refinery feed to be used as fuel, or air, for different refinery processes, such as fired heaters. The
novel approach of recycling the extract stream containing ammonia and water to the refinery’s natural gas burning fired heaters will reduce harmful NOx emissions, reducing the environmenta l impact of the proposed process.
The refinery will be located in Philadelphia along the Delaware River and will operate for
24 hours, 333 days a year. We conducted a thorough economic analysis of the design to optimize the efficiency of the process while minimizing capital and operating expenditures. The proposed design using natural gas requires an initial investment of $1.64 MM and has a NPV of -$15 MM
over 19 years, while the design for using air requires $1.80 MM and has a NPV of -$16 MM over 19 years.
Sincerely,
Andrew Frederick Connor Leach Christelle Nayandi

ii | P a g e
Alternative Technology for Sour
Water Stripping
Andrew Frederick University of Pennsylvania
Connor Leach University of Pennsylvania
Christelle Nayandi University of Pennsylvania
Advised by:
Professor Bruce Vrana Dr. Sue Ann Bidstrup-Allen
Project Proposed by:
Dr. P. C. Gopalratnam

Section 3: Table of Contents
Frederick | Leach | Nayandi
iii | P a g e
Table of Contents Section 1: Letter of Transmittal .........................................................................................................i
Section 2: Title Page..........................................................................................................................ii
Section 3: Table of Contents ............................................................................................................iii
Section 4: Abstract............................................................................................................................1
Section 5: Introduction and Objective-time Chart ............................................................................3
Section 5.1: Introduction.................................................................................................................. 4
Section 5.2: Objective-time Chart..................................................................................................... 7
Section 6: Innovation Map ................................................................................................................8
Section 7: Market and Competitive Analyses ....................................................................................9
Section 8: Customer Requirements .................................................................................................10
Section 9: Critical-to-quality (CTQ) Variables ...............................................................................12
Section 10: Product Concepts .........................................................................................................13
Section 11: Superior Product Concepts...........................................................................................14
Section 12: Competitive (patent) Analysis .......................................................................................15
Section 13: Preliminary Process Synthesis ......................................................................................16
Section 13.1: ASPEN Traditional Sour Water Stripping Approach ................................................... 17
Section 13.2: Preliminary Sour Water Stripping with Air ................................................................. 18
Section 13.3: Preliminary Design with Two Sour Water Strippers .................................................... 19
Section 13.4: One Column Stripper Design ..................................................................................... 20
Section 13.5: Process Design with Preliminary Equipment Integration.............................................. 21
Section 13.6: Nearly Finalized Process Design ................................................................................ 23
Section 14: Assembly of Database ...................................................................................................24
Section 14.1: Process Simulation Setup .......................................................................................... 25
Section 14.2: Table of Acronyms ................................................................................................... 27
Section 15: Process Flow Diagram and Material Balances ..............................................................28
Section 16: Process Description.......................................................................................................36
Section 16.1: Sour Water Feed ....................................................................................................... 37
Section 16.2 Mixing, Heating, and Pressurizing Sour Water and Acid .............................................. 39
Section 16.3 Air as Stripping Agent................................................................................................ 40
Section 16.4 Natural Gas as Stripping Agent ................................................................................... 41
Section 16.5: Heating the Stripping Agent ...................................................................................... 42
Section 16.6: Feed and Effluent to Stripping Column ...................................................................... 43
Section 17: Energy Balance and Utility Requirements ....................................................................47

Section 3: Table of Contents
Frederick | Leach | Nayandi
iv | P a g e
Section 17.1: Heat Integration ........................................................................................................ 48
Section 17.2: Stripping Efficiency ................................................................................................. 48
Section 17.3: Utility Requirements ................................................................................................. 49
Section 18: Equipment List and Unit Descriptions ..........................................................................50
Section 18.1: Sour Water Specific Equipment ................................................................................. 51
Section 18.1.1: Sour Water Surge Tank: T-100 ........................................................................... 51
Section 18.1.2: Acid Storage Tank: T-101 .................................................................................. 52
Section 18.1.3: Acid Mixing Tank: T-102 ................................................................................... 52
Section 18.1.4: Sour Water Pump: P-100 .................................................................................... 53
Section 18.1.5: Sour Water Heater: F-100 ................................................................................... 53
Section 18.2: Air Specific Equipment ............................................................................................. 54
Section 18.2.1: Blower: B-100 ................................................................................................... 54
Section 18.2.2: Air Heater: F-101 ............................................................................................... 55
Section 18.2.3: Stripping Column: C-100.................................................................................... 56
Section 18.2.4: Blower Control System Computer: BC|CP with Equation ..................................... 59
Section 18.3: Natural Gas Specific Equipment ................................................................................ 60
Section 18.3.1: Control Valve: V-101 ......................................................................................... 60
Section 18.3.2: Natural Gas Heater: F-101 .................................................................................. 61
Section 18.3.3: Stripping Column: C-100.................................................................................... 61
Section 18.3.4: Valve Control System Computer: VC|CP with Equation ....................................... 63
Section 18.4: Minor Equipment...................................................................................................... 64
Section 19: Specification Sheets ......................................................................................................65
Section 19.1: Specification Sheets for Air Stripping Process ........................................................... 66
Section 19.2: Specification Sheets for Natural Gas Stripping Process................................................ 74
Section 20: Equipment Cost Summary............................................................................................81
Section 20.1: Unit Costing Considerations ..................................................................................... 85
Section 20.1.1: Air and Natural Gas Stripping Column ................................................................ 85
Section 20.1.2: Sour Water and Air/Natural Gas Heaters.............................................................. 86
Section 20.1.3: Air Blower ........................................................................................................ 86
Section 20.1.4: Sour Water Pump ............................................................................................... 86
Section 20.1.5: Acid Storage Tank, Acid Mixing Tank, and Surge Tank ....................................... 87
Section 21: Fixed-capital Investment Summary ..............................................................................88
Section 22: Operating Cost – Cost of Manufacture .........................................................................92
Section 22.1: Variable Costs ......................................................................................................... 93

Section 3: Table of Contents
Frederick | Leach | Nayandi
v | P a g e
Section 22.1.1: Raw Materials.................................................................................................... 94
Section 22.1.2: Utilities ............................................................................................................. 95
Section 22.2: Fixed Costs .............................................................................................................. 96
Section 23: Other Important Considerations ..................................................................................98
Section 23.1: Environmental Review ............................................................................................. 99
Section 23.2: Process Control Systems ........................................................................................ 108
Section 23.2.1: Level Control System ....................................................................................... 109
Section 23.2.2: Recycle Control System ................................................................................... 109
Section 23.2.3 Blower Control System ..................................................................................... 110
Section 23.2.4 Valve Control System........................................................................................ 112
Section 23.2.5 Humidity Control System .................................................................................. 115
Section 23.2.6 Temperature Control System.............................................................................. 115
Section 23.3: Safety and Health Concerns .................................................................................... 115
Section 23.4: Boiler Feed Water (BFW) Considerations ................................................................ 117
Section 24: Profitability Analysis – Business Case.........................................................................119
Section 25: Conclusions and Recommendations ............................................................................127
Section 26: Acknowledgments .......................................................................................................130
Section 27: Bibliography ...............................................................................................................133
Section 28: Appendix ....................................................................................................................136
Appendix 0: Project Description .................................................................................................. 137
Appendix 0.1. Project Description ........................................................................................... 137
Appendix 0.2. Additional Details ............................................................................................. 140
Appendix 0.3. Project Author Amendment to Standard Incoming Flow Rates ............................ 142
Appendix 1: Calculations ............................................................................................................ 143
Appendix 1.1. Calculation of Amount of Natural Gas Used by Stripping Process vs Amount
Consumed by Average East Coast Refinery ............................................................................. 143
Appendix 1.2. Calculation for Intermediate Temperature of Air and Natural Gas before Adding
Steam .................................................................................................................................... 143
Appendix 1.3. Average Yearly Flow Rate ................................................................................ 144
Appendix 1.4. Amount of Ammonia Removed from Sour Water Annually ................................ 144
Appendix 1.5. Sensitivity Analysis for Sulfuric Acid Addition (Air and Natural Gas) .................. 145
Appendix 2: Figures ................................................................................................................... 146
Appendix 2.1. Effect of Various Parameters on Stripping Efficacy ............................................ 146
Appendix 2.1.1. Effect of Number of Stages on Stripping Efficacy ....................................... 146
Appendix 2.1.2. Effect of Air Flow Rate and Water Temperature on Stripping Efficacy ......... 147

Section 3: Table of Contents
Frederick | Leach | Nayandi
vi | P a g e
Appendix 2.2. Column Tray Profiles ....................................................................................... 148
Appendix 2.2.1. Column Integral Hydrogen Sulfide and Ammonia Concentration Profiles ..... 148
Appendix 2.2.2. Column Integral pH Profiles ...................................................................... 149
Appendix 2.3. Control Equation Formulation ........................................................................... 150
Appendix 2.4. Pennsylvania PM2.5 Nonattainment Areas ........................................................... 151
Appendix 3: Permits ................................................................................................................... 152
Appendix 3.1. Warren Refinery Permit (excerpt) ...................................................................... 152
Appendix 3.2. Marcus Hook Refinery Permit (excerpt) ............................................................. 153
Appendix 4: Quotations and Equipment Specifications ................................................................. 155
Appendix 4.1. pH Meter Quotation (pH Converter) (excerpt) .................................................... 155
Appendix 4.2. Acid Storage Tank ............................................................................................ 157
Appendix 4.3. Acid Mixing Tank ............................................................................................ 158
Appendix 4.4. Polyethylene Chemical Resistance Chart (excerpt) ............................................. 159
Appendix 4.5. Heuristic 34 (Seider et al. 2017) ........................................................................ 161
Appendix 5: ASPEN Input and Output Files ................................................................................ 162
Appendix 5.1. Valve P and T Change Test ............................................................................... 162
Appendix 5.1.1. Input File .................................................................................................. 162
Appendix 5.1.2. Stream Report ........................................................................................... 163
Appendix 5.2. Air Stripping Column Simulation without Acid .................................................. 164
Appendix 5.2.1. Input File .................................................................................................. 164
Appendix 5.2.2. Output File ............................................................................................... 168
Appendix 5.3. Natural Gas Stripping Column Simulation without Acid ..................................... 190
Appendix 5.3.1. Input File .................................................................................................. 190
Appendix 5.3.2. Output File ............................................................................................... 194
Appendix 6: Material Safety Data Sheets ..................................................................................... 210
Appendix 6.1. Hydrogen Sulfide ............................................................................................. 210
Appendix 6.2. Ammonia.......................................................................................................... 217
Appendix 6.3. Sulfuric Acid .................................................................................................... 222
Appendix 6.4. Methane ........................................................................................................... 227
Appendix 6.5. Propane ............................................................................................................ 232
Appendix 6.6. Sulfur Dioxide .................................................................................................. 237
Appendix 6.7. Nitrogen Dioxide............................................................................................... 242

Section 3: Table of Contents
Frederick | Leach | Nayandi
vii | P a g e
Tables Table 14.1: Equilibrium Dissociation Reactions .................................................................................. 25
Table 14.2: Comprehensive Table of Acronyms.................................................................................. 27
Table 15.1: Stream Table for Air Stripping Process............................................................................. 30
Table 15.2: Equipment (block) Table for Air Stripping Process ........................................................... 31
Table 15.3: Stream Table for Natural Gas Stripping Process ................................................................ 33
Table 15.4: Equipment (block) Table for Natural Gas Stripping Process............................................... 34
Table 16.1: Correlation Between pH and Ammonia Concentration ...................................................... 39
Table 17.1: Utility and Electricity Requirements for Air Stripping Process ........................................... 49
Table 17.2: Utility and Electricity Requirements for Natural Gas Stripping Process .............................. 49
Table 18.1: Preliminary Analysis of Stripping Parameters ................................................................... 56
Table 20.1: Equipment Cost Summary for Air Stripping Process ......................................................... 82
Table 20.2: Equipment Cost Summary for Natural Gas Stripping Process............................................. 82
Table 20.3: Breakdown of Total Equipment Costs for the Air Stripping Process ................................... 83
Table 20.4: Breakdown of Total Equipment Costs for the Natural Gas Stripping Process....................... 84
Table 21.1: Different Costs Needed to Calculate the Total Capital Investment ..................................... 89
Table 21.2: Total Capital Investment Calculations for Sour Water Stripping with Air from Equipment
Bare module Costs............................................................................................................................ 90
Table 21.3: Total Capital Investment Calculations for Sour Water Stripping with Natural Gas from
Equipment Bare Module Costs .......................................................................................................... 91
Table 22.1: Raw Materials Cost and Yearly Requirements for Sour Water Stripping Using Air ............. 94
Table 22.2: Raw Materials Cost and Yearly Requirements for Sour Water Stripping Using
Natural Gas ...................................................................................................................................... 94
Table 22.3: Utility Cost and Yearly Requirements for Sour Water Stripping Using Air ......................... 95
Table 22.4: Utility Cost and Yearly Requirements for Sour Water Stripping Using Natural Gas............. 95
Table 22.5: Labor-related Operation Expenses for Sour Water Stripping with Air and Natural Gas ........ 96
Table 22.6: Maintenance Expenses for Sour Water Stripping with Air and Natural Gas ......................... 96
Table 22.7: General Expenses for Sour Water Stripping with Air and Natural Gas ................................ 97
Table 23.1: Literature Standards for Sour Water Stripping Effluent.................................................... 102
Table 24.1: Working Capital Requirements for the Air Stripping Process ........................................... 120
Table 24.2: Working Capital Requirements for the Natural Gas Stripping Process .............................. 121
Table 24.3: Profitability Measures for the Air Stripping Process ........................................................ 122
Table 24.4: Profitability Measures for the Natural Gas Stripping Process ........................................... 122
Table 24.5: Cash Flow Summary for the Air Stripping Process .......................................................... 125
Table 24.6: Cash Flow Summary for the Natural Gas Stripping Process ............................................. 126

Section 3: Table of Contents
Frederick | Leach | Nayandi
viii | P a g e
Figures
Figure 13.1: ASPEN Sour Water Tutorial Using Steam as Stripping Agent .......................................... 17
Figure 13.2: Preliminary Sour Water Stripper with Condenser and Reboiler ......................................... 18
Figure 13.3: Preliminary Design with Two Sour Water Stripping Columns........................................... 19
Figure 13.4: One Column Stripper Design: Block Flow Diagrams........................................................ 20
Figure 13.5: Process Design with Preliminary Equipment Integration................................................... 21
Figure 13.6: Nearly Finalized Process Design with Equipment ............................................................ 23
Figure 15.1: Process Flow Diagram for Air Stripping Process.............................................................. 29
Figure 15.2: Process Flow Diagram for Natural Gas Stripping ............................................................. 32
Figure 15.3: 3D Model of Air Stripping Process ................................................................................. 35
Figure 23.1: 3D Representation of the Equation 18.1 Surface for Air Stripping ................................... 111
Figure 23.2: 2D Representation of the Equation 18.1 Surface for Air Stripping ................................... 112
Figure 23.3: 3D Representation of the Equation 18.2 Surface for Natural Gas Stripping ...................... 114
Figure 23.4: 2D Representation of the Equation 18.2 Surface for Natural Gas Stripping ...................... 114
Figure 24.1: Cumulative Discounted Free Cash Flow ($MM) for the Air Stripping Process Over a
Nineteen-year Lifespan ................................................................................................................... 123
Figure 24.2: Cumulative Discounted Free Cash Flow ($MM) for the Natural Stripping Process Over a
Nineteen-year Lifespan ................................................................................................................... 124

Section 4: Abstract
Frederick | Leach | Nayandi
1 | P a g e
Section 4
Abstract

Section 4: Abstract
Frederick | Leach | Nayandi
2 | P a g e
Sour water is a waste product of various crude oil refining processes at refineries. Ammonia
and hydrogen sulfide, the main contaminants of sour water, must be removed from the sour water
before it can be discharged or used elsewhere in the refinery. Through a process known as
stripping, the contaminants are transferred from the sour water to the gaseous stripping agent in a
large stripping column containing trays or packing. The designs outlined in this report analyze the
economic and environmental validity of using two alternative stripping agents, air and natural gas,
compared to the industry incumbent, steam. The Net Present Value for a natural gas-fed stripper
is -$15 MM over 19 years compared to -$16 MM for that of an air-fed stripper. One novel feature
included in both designs is the option of recycling the extract stream to reduce NOx emissions in
natural gas-fed burners. Careful analysis of the economic, environmental, and safety
considerations of each of the two stripping agents reveals that the natural gas stripping process is
economically and efficaciously superior, while the air stripping process is environmenta l ly
superior with less safety concerns. Therefore, it is recommended that management pursues both
options as potentially viable replacements for traditional sour water stripping processes.
The analysis was performed assuming an average sour water flow rate of 37.5 gallons per
minute and an average ammonia concentration of 1650 ppm in the sour water feed. The
recommendation of pursuing natural gas and air equivalently as stripping agents is dependent on
the assumed location of the refinery. Because environmental regulations for water and
atmospheric discharge vary by region, a separate analysis of the validity of each alternative should
be performed for stripping operations in different areas.

Section 5: Introduction and Objective-time Chart
Frederick | Leach | Nayandi
3 | P a g e
Section 5
Introduction and Objective-time Chart

Section 5: Introduction and Objective-time Chart
Frederick | Leach | Nayandi
4 | P a g e
Section 5.1: Introduction
Sour water is a ubiquitous wastewater product of crude oil refineries, where it flows as an
effluent from atmospheric and vacuum distillation towers.1 Sour water typically contains high
amounts of ammonia (100-8,000 ppm) and hydrogen sulfide (300-12,000 ppm), as well as lower
amounts of light hydrocarbons, which must be removed before the water can be discharged
downstream or reused in the refinery.2 Depending on the composition of the stripped water, it can
either be reused as wash water for the hydrodesulfurization process and makeup water for the crude
desaltification process, or it can be discharged to a downstream purification plant or even released
directly to the sewer or river.3
A stripping operation must take into account phase equilibria, in this case Henry’s Law
(and its temperature dependence), for each component being stripped. The relationship between
liquid fraction and vapor fraction is the driving force behind this type of separation. Another
important factor to consider is the chemical equilibria of the water-dissolved gases, which
dissociate into ions that cannot be stripped. Using pH manipulation and Le Chatelier's Principle,
it is possible and advantageous to control the relative amounts of dissolved gases and ions in order
to optimize the desired separation in a given column.
The components are traditionally removed in a multi-step process, depending on the
contaminants that need to be removed. This process often includes a degasification step, which
removes hydrogen and light alkanes.4 While degasification is only necessary if light hydrocarbons
1 “Sour Water Stripper Process.” Yokogawa America, Yokogawa Electric Corporation, 2 Aug. 2016,
www.yokogawa.com/us/library/resources/application-notes/sour-water-stripper-process/. 2 Stevens, D. K., and A. Mosher. "Fundamentals of Sour Water Stripping." Brimstone Sulfur Symposia, Vail,
Colorado. 2008. 3 Weiland, R.H., et al. “Stripping Phenolic Water.” Protreat.com, 2013,
www.protreat.com/files/publications/85/S_344_sour_water_prf4.pdf. 4 “Sour Water Stripper Process.” Yokogawa America, Yokogawa Electric Corporation, 2 Aug. 2016,
www.yokogawa.com/us/library/resources/application-notes/sour-water-stripper-process/.

Section 5: Introduction and Objective-time Chart
Frederick | Leach | Nayandi
5 | P a g e
are present, the process always includes a series of steam-strippers, using either live steam or a
reboiler, to remove the basic ammonia and the acidic hydrogen sulfide and/or carbon
dioxide.5 This is generally accomplished with a two-column setup, with one low-pH (5-6) column
to remove the acidic compounds followed by a high-pH column (10-12) to remove the basic
ammonia.6 Occasionally a one-column approach with a pH around 8 may be used if the stripping
goals are to a lesser extent than normal.7
Our design prompt details our incoming sour water feed as having 300-3,000 ppm
ammonia, 5 ppm hydrogen sulfide, and trace amount of propane. Because of the relative
contaminant concentrations, we interpret this stream as having already been subjected to
degasification, which left 1 ppm propane in the sour water stream, and hydrogen sulfide stripping,
which removed all but 5 ppm of the initial hydrogen sulfide concentration.
The focus of this publication is to examine the use of alternative stripping agents, natural
gas and air, to remove the remaining ammonia and hydrogen sulfide in the sour water feed. These
alternative stripping agents have potential benefits compared to the industry incumbent, steam,
worth exploring. However, the effectiveness of natural gas and air as stripping agents and their
impact on the environment remain to be fully understood. This paper will serve to evaluate the
two alternative stripping agents with respect to economics, safety, and environmental impact.
For this investigation, the following assumptions were made regarding the process. The
sour water stripping operation is performed by the wastewater treatment division of a petroleum
5 Addington, Luke, et al. "Sour water: Where it comes from and how to handle it." Bryan Research and
Engineering Inc.[online]. Disponible en: https://www. bre. com/PDF/Sour-Water-Where-It-Comes-from-and-
How-to-Handle-It. pdf (2011). 6 Stevens, D. K., and A. Mosher. "Fundamentals of Sour Water Stripping." Brimstone Sulfur Symposia, Vail,
Colorado. 2008. 7 “Sour Water Stripper Process.” Yokogawa America, Yokogawa Electric Corporation, 2 Aug. 2016,
www.yokogawa.com/us/library/resources/application-notes/sour-water-stripper-process/.

Section 5: Introduction and Objective-time Chart
Frederick | Leach | Nayandi
6 | P a g e
refinery just north of Philadelphia, PA, along the Delaware River. The stripping process takes
place on-site at the refinery, and has access to refinery utilities like steam, electricity, and natural
gas. Natural gas is assumed to be 100% methane. The refinery is of average size for the east coast
region. The refinery is assumed to operate for 8000 hours per year, the standard number given for
a continuous industrial process in the second edition of Chemical Engineering Design by Towler
and Sinnott, 2013.8
8 Towler, Gavin, and Ray K. Sinnott. Chemical engineering design: principles, practice and economics of
plant and process design. Elsevier, 2012.

Section 5: Introduction and Objective-time Chart
Frederick | Leach | Nayandi
7 | P a g e
Section 5.2: Objective-time Chart
Specific Goals: o Develop a stripping operation than can treat 75,000 tons of sour water per year,
with a standard flow rate between 30 and 50 GPM, and an NH3 concentration ranging from 300-3000 ppm. The process must reduce the NH3 to under 20 ppm
and the H2S to under 0.1 ppm. o Compare air to natural gas as a stripping agent, and using economics, and
environmental and safety concerns, determine the superior stripping agent.
Project Scope:
In Scope o Reduce the ammonia in the sour water stream from 300-3000 ppm to 20 ppm o Reduce the hydrogen sulfide in the sour water stream from 5 ppm to 0.1 ppm
o Compare air and natural gas as stripping agents from an environmental, safety, and economic perspective
o Determine the effect of adjusting the pH on the stripping process o Determine the equipment needed and its appropriate design and size o Determine the bare module capital cost of each process unit and its associated
operating cost o Conduct a thorough environmental analysis of liquid phase and gas phase
effluents Out of Scope
o An accurate ASPEN Plus V10 simulation combining pH adjustments and
Murphree tray efficiencies o Refinery plant capacity and specifics
o Existing permits for the refinery o Henry’s Law constants
Deliverables: o Present block results and operating conditions for each unit
o Develop a detailed equipment design for the stripping units o Create a process flow sheet with mass and energy balances o Provide financial and environmental analyses.
Process Development Timeline: o Complete mid-semester presentation by February 27, 2018 o Complete 6 deliverables over the course of the semester, with the final report
completed by April 17th, 2018.

Section 6: Innovation Map
Frederick | Leach | Nayandi
8 | P a g e
Section 6
Innovation Map
N/A

Section 7: Market and Competitive Analysis
Frederick | Leach | Nayandi
9 | P a g e
Section 7
Market and Competitive Analyses
N/A

Section 8: Customer Requirements
Frederick | Leach | Nayandi
10 | P a g e
Section 8
Customer Requirements

Section 8: Customer Requirements
Frederick | Leach | Nayandi
11 | P a g e
For our process, there is no traditional customer. We are not selling a product to a customer
for revenue. However, we are offering a service that can severely impact both the immediate and
distant communities. For that reason, the health and safety of the various communities and
surrounding ecosystems must be considered. To ensure the safety of the communities, federal
agencies such as the Environmental Protection Agency (EPA) and state agencies such as the
Department of Environmental Protection (DEP) impose effluent concentration requirements on
the raffinate and extract streams. For the sweet water raffinate, the ammonia (and ammonium)
must be stripped down to a sum of 20 ppm. Additionally, the hydrogen sulfide and its dissociated
species must be stripped beyond detectable limits, which is equivalent to less than 0.10 ppm.
Because these species are less harmful in air than in water,9 the emission limits for releasing
ammonia and hydrogen sulfide into the air are more lax than those of water. It is for this reason
that the sour water stripper is an effective technology. For an in-depth discussion of the
environmental considerations, see Section 23.1.
In addition to the surrounding communities, the refinery also acts as a customer. The sour
water stripper must be designed with the capacity to strip 75,000 tons of sour water, a byproduct
of the refinery, per year with flows ranging between 20-50 GPM. The standard flow of the sour
water will be 30-50 GPM, and will drop to 20 GPM around annual plant shutdown. The refinery
will also be a customer from the economic standpoint. Because the sour water stripper generates
no revenue, it is not a profitable unit. Therefore, the only economic goal in the construction and
operation of the unit will be to minimize its cost.
9 Lee, D., et al. "Dynamic simulation of the sour water stripping process and modified structure for effective
pressure control." Chemical Engineering Research and Design 80.2 (2002): 167-177.

Section 9: CTQ Variables
Frederick | Leach | Nayandi
12 | P a g e
Section 9
Critical-to-quality (CTQ) Variables
N/A

Section 10: Product Concepts
Frederick | Leach | Nayandi
13 | P a g e
Section 10
Product Concepts
N/A

Section 11: Superior Product Concepts
Frederick | Leach | Nayandi
14 | P a g e
Section 11
Superior Product Concepts
N/A

Section 12: Competitive (patent) Analysis
Frederick | Leach | Nayandi
15 | P a g e
Section 12
Competitive (patent) Analysis
N/A

Section 13: Preliminary Process Synthesis
Frederick | Leach | Nayandi
16 | P a g e
Section 13
Preliminary Process Synthesis

Section 13: Preliminary Process Synthesis
Frederick | Leach | Nayandi
17 | P a g e
Across the refinery industry, stripping systems for sour water can vary depending on the
relative amounts of different contaminants, differing standards for sweet water purity, and
available stripping media. Most industrial sour water strippers use steam as the stripping medium,
either from the refinery’s utilities, or by boiling a portion of the sour water itself.
Section 13.1: ASPEN Traditional Sour Water Stripping Approach
While our process does not use steam as the stripping agent, we initiated our design
optimization process by simulating a steam stripping operation is ASPEN Plus V10, namely
ASPEN’s sour water stripping tutorial, which models a two-column stripping approach (Figure
13.1). The first column was operated at a lower, more acidic pH, and removed the hydrogen
sulfide from the sour water. The second column was operated at a higher more basic pH, removing
the ammonia. Although this system is not in line with our project specifications, it successfully
removed our contaminants and was a good way familiarize ourselves with using ASPEN for
stripping.
Figure 13.1: ASPEN Sour Water Tutorial Using Steam as Stripping Agent

Section 13: Preliminary Process Synthesis
Frederick | Leach | Nayandi
18 | P a g e
Section 13.2: Preliminary Sour Water Stripper with Air
Implementing the useful features of the steam stripping tutorial, namely the electrolyte
package, RADFRAC column setup, and design specification format, we designed a similar process
using air as the incoming stripping agent. The column had a condenser and reboiler, which
circulated steam and water within the system (Figure 13.2). This approach achieved the necessary
the requirements for ammonia and hydrogen sulfide, but this system had an inherent flaw. The
reboiler and condenser circulate water and steam within the column, and the steam made by the
reboiler flows upward through the column, stripping the sour water as it does. The condenser then
removed the water vapor from the extract, leaving only air and the contaminants to leave the
system. While this approached appeared to be successful as an air-stripping operation from a
material balance perspective, the goal of the project is to use air itself as the stripping agent, not
just as a carrier for the contaminants stripped by steam. We left this model behind and moved
forward with column designs that did not have a reboiler or condenser.
Figure 13.2: Preliminary Sour Water Stripper with Condenser and Reboiler

Section 13: Preliminary Process Synthesis
Frederick | Leach | Nayandi
19 | P a g e
Section 13.3: Preliminary Design with Two Sour Water Strippers
Our next stripping process simulation incorporated 2 columns, both without condensers or
reboilers (Figure 13.3). We were still simulating with preliminary conditions: reboiler and
condenser, absorber set to off, low incoming air temperature, dissociation reactions not activated,
and using ideal stages. Because of the simulation conditions, ASPEN would return errors if we
had too high or low of a stripping media flow rate. Some of these errors we interpreted as
legitimately process-related, such as stages drying up if our air flow rate was too high; but others
did not make intuitive sense or appeared to be simulation-related. Because of these restraints, we
were not able to strip the sour water to the required levels of contaminants with only one column,
so we directed the raffinate of the first column into a second column which allowed us to
sufficiently remove the contaminants. While this fulfilled our project specifications, we needed to
incorporate all the necessary simulation features, such as tray efficiency and electrolytics, for
fullest accuracy. Once these were enabled, we were able to remove all contaminants with a single
column, so we abandoned the two-column approach for good.
Figure 13.3: Preliminary Design with Two Sour Water Stripping Columns

Section 13: Preliminary Process Synthesis
Frederick | Leach | Nayandi
20 | P a g e
Section 13.4: One Column Stripper Design
The decision to move forward with the one-column approach finalized, we activated the
final input and column parameters, making the simulation as accurate to reality as possible. Inside
the column, with differential contaminant concentrations, pH, and temperature all varying among
the trays, the type of tray and correct tray efficiency were implemented. Figure 13.4 shows the
simplistic one-column design, essentially a block flow diagram (BFD) for our system since the
stripper is the only process unit where an important reaction or separation takes place. While this
simple diagram serves as a BFD, it is not comprehensive of the other process equipment needed,
such as heaters, pumps, storage tanks, or control systems.
Figure 13.4: One Column Stripper Design: Block Flow Diagram

Section 13: Preliminary Process Synthesis
Frederick | Leach | Nayandi
21 | P a g e
Section 13.5: Process Design with Preliminary Equipment Integration
The next step in our process design was incorporating the other equipment necessary to run
a sour water stripping operation. Figure 13.5 shows the stripping process with early-stage
associated equipment.
Figure 13.5: Process Design with Preliminary Equipment Integration
The flow diagram includes heaters and pressure changers for both the sour water and gas
streams. For the sour water stream, there is a surge/recycle tank and one tank which was
envisioned as a delay mechanism so the control system would have time to adjust the stripping
agent flow rate to meet the needs of the sour water. The major breakthrough that was introduced
during this iteration of our process is the addition of water vapor to the stripping agent stream.
While optimizing the stripping column, we found that the temperature inside the column (affected
by the temperatures of the incoming sour water and stripping agent streams) had a positive effect
on the extent of the stripping. We realized that a substantial amount of sour water was vaporizing
and cooling the column, so we added water vapor to our stripping agent gas to reduce the amount
of water that could vaporize in the column. This had the effect of increasing the operating
temperature of the stripping column, and yielded, for the first time, a fully successful ASPEN

Section 13: Preliminary Process Synthesis
Frederick | Leach | Nayandi
22 | P a g e
simulation with every process variable engaged (i.e. electrolytics, absorber, tray efficiency,
etc.). For the gas stream, there is a blower and then saturation vessel for adding humidity to the
gas stream. This diagram also includes several measurement devices, including a flow meter, pH
meter, and humidity meter. There is a pump in line with the recycle stream to propel the diverted
raffinate stream to the surge tank.

Section 13: Preliminary Process Synthesis
Frederick | Leach | Nayandi
23 | P a g e
Section 13.6: Nearly Finalized Process Design
The next iteration of our process design corrected for the inadequacies of the previous
flowsheet. The design of an efficient process design (Figure 15.3) and the pressure of the raffinate
(Tables 15.1 and 15.3) eliminate the need for a recycle pump. We found that steam injection is a
far more cost-effective method to add humidity to a stream compared to vaporizing large amounts
of water. The flow diagram in Figure 13.6 now features both the pH and flow meters downstream
of the surge tank, to better monitor the composition and flow rate of the sour water entering the
stripping column. There is now a mixer to add a small amount of acid to our sour water, which
we optimized to create column interior conditions to best strip both ammonia and hydrogen sulfide.
There is a pH meter after the acid adder to keep track of the pH of the sour water entering the
column. The gas feed stream is now accurately represented by a blower to pressurize the air, then
a heater, then steam injectors to add humidity to the stream. A thermocouple and humidity meter
are downstream of the steam injection point to control the heat duty of the heater, and amount of
steam which is injected.
Figure 13.6: Nearly Finalized Process Design with Equipment
The final iteration of our process design are the finalized flowsheets (Figures 15.1 and
15.2) that can be found in Section 15: Process Flow Diagram and Material Balances.

Section 14: Assembly of Database
Frederick | Leach | Nayandi
24 | P a g e
Section 14
Assembly of Database

Section 14: Assembly of Database
Frederick | Leach | Nayandi
25 | P a g e
Section 14.1: Process Simulation Setup
The simulations modeling the sour water process were designed using ASPEN Plus V10.
To accurately depict the dissociation of ammonia and hydrogen sulfide in water, the electrolyte
package in ASPEN was turned on. Said package enables the partial dissociation equilibria of
molecular species. In this instance the major dissociation reactions are listed in Table 14.1. The
sour water stripping tutorial on ASPEN was followed to set up our simulation. However, the
tutorial was quickly abandoned because it used steam as the stripping agent, which required
equipment like a reboiler and condenser that deviated from our process.
Table 14.1: Equilibrium Dissociation Reactions
Turning on the electrolytic package is especially important in this simulation because the
pH plays an important role in determining how much of a species can be stripped. For example, a
dissociated ion cannot be stripped from water because its charge interacts with the polar water
molecules. Altering the pH of the solution will determine how much of a given molecule is
dissociated. In basic conditions for example, equilibria will favor the formation of ammonia over
ammonium and the dissociated sulfide ions over hydrogen sulfide.

Section 14: Assembly of Database
Frederick | Leach | Nayandi
26 | P a g e
The Electrolyte Wizard on ASPEN automatically generates all possible ionic species and
reactions for the H2O-NH3-H2S system. For the purpose of this simulation, all precipitates are
considered to be negligible. The apparent component approach for the Electrolyte Wizard was
selected. This approach describes solution chemistry as part of the physical property calculat ions
and reports the component flow rates of the apparent components as if no dissociation occurred .
Once the pH of the solution was further analyzed, the apparent species approach was changed to
the true species approach to distinguish between dissociated and undissociated species.
The Electrolyte Wizard also automatically updates the Henry’s constants as a function of
temperature and the dissociation reaction equilibrium constants as a function of
temperature. These values are dependent on the thermodynamic simulation method assigned in
ASPEN. The ENTRL-RK method was chosen because it is optimized for electrolyte reactions,
Henry’s Law, and ionic components. The method also influences the interactions of the species
which is accounted for through the “Binary Interactions” section. All in all, the electrolyt ic
package accurately accounts for the dissociation and interaction of the species, which is vital for
the proper modeling of a sour water stripper.
Additional ASPEN simulation modifications include setting the convergence method to
the Broyden Method, a variant of Newton’s Method that converges more quickly in fewer loops.
The absorber option for the column was set to on. The absorber option is necessary for a
RADFRAC column if there is no condenser or reboiler, because it controls the inside- loop
convergence for the standard algorithm.

Section 14: Assembly of Database
Frederick | Leach | Nayandi
27 | P a g e
Section 14.2: Table of Acronyms
Table 14.2: Comprehensive Table of Acronyms

Section 15: PFD and Material Balances
Frederick | Leach | Nayandi
28 | P a g e
Section 15
Process Flow Diagram and Material
Balances

Section 15: PFD and Material Balances
Frederick | Leach | Nayandi
29 | P a g e
Fig
ure 1
5.1
: P
rocess F
low
Dia
gra
m fo
r A
ir S
trip
pin
g P
rocess

Section 15: PFD and Material Balances
Frederick | Leach | Nayandi
30 | P a g e
Table
1
5.1
: S
tream
Tab
le f
or
Air
Str
ipp
ing
Pro
cess

Section 15: PFD and Material Balances
Frederick | Leach | Nayandi
31 | P a g e
T
able
1
5.2
: E
qu
ipm
en
t (b
lock)
Tab
le f
or
Air
Str
ipp
ing
Pro
cess

Section 15: PFD and Material Balances
Frederick | Leach | Nayandi
32 | P a g e
Fig
ure 1
5.2
: P
rocess F
low
Dia
gra
m fo
r N
atu
ral
Gas S
trip
pin
g P
rocess

Section 15: PFD and Material Balances
Frederick | Leach | Nayandi
33 | P a g e
Table
1
5.3
: S
tream
Tab
le f
or
Natu
ral
Gas S
trip
pin
g P
rocess

Section 15: PFD and Material Balances
Frederick | Leach | Nayandi
34 | P a g e
Table
1
5.4
: E
qu
ipm
en
t (b
lock)
Tab
le f
or
Natu
ral
Gas S
trip
pin
g
Pro
cess

Section 15: PFD and Material Balances
Frederick | Leach | Nayandi
35 | P a g e
Figure 15.3: 3D Model of Air Stripping Process. (Paint 3D). The orange air stream enters from the lower right, passes
through the blower, heater, meets the grey steam stream at the injector, enters the bottom of the column, and exits the
top of the column. The blue water stream enters from the left, passes through the surge tank, then, driven by gravity,
meets a thin blue acid stream coming from the acid storage tank. The mixture flows downhill to th e pump, then
through the heater, then up to enter the top of the column. The water exits the bottom rear of the column and is split
into a recycle stream back to the surge tank, and the product sweet water which flows to the right out of the diagram.

Section 16: Process Description
Frederick | Leach | Nayandi
36 | P a g e
Section 16
Process Description

Section 16: Process Description
Frederick | Leach | Nayandi
37 | P a g e
The Process Flow Diagrams (PFDs) for each stripping agent case in the previous section
(Figures 15.1 and 15.2) are nearly identical with respect to the sour water’s path to the
column. There are six measurement devices in the PFD, and each represent a set of duplicate
measurement devices. They are duplicate to ensure against complications that arise if a device
experiences drift or any type of malfunction, and to allow the system to continue to operate while
the faulty device is replaced. With the exception of the pipe for Stream 6 which climbs 60 feet
from ground-level to the top of the column, pressure drop through pipes is assumed to be negligib le
because the efficient layout of the operation minimizes pipe lengths and maximize gravity-dr iven
flow (Figure 15.3). The following subsections refer to equipment and streams diagrammed in
Figures 15.1 and 15.2, quantified in Tables 15.1 and 15.3, and described in Tables 15.2 and 15.4.
Section 16.1: Sour Water Feed (S1 and S2)
The sour water feed enters the system from the refinery in Stream 1, where the average
flow rate is 37.5 GPM (Appendix: A.1.3), average ammonia concentration is 1650 ppm, hydrogen
sulfide concentration is 5 ppm, the temperature is 80°F, and the pressure is just above atmospheric
at 15 psia. The sour water enters a surge tank, T-100 (see 18.1.1), which serves to dampen any
spikes in flow rate or ammonia concentration. The surge tank has a capacity of 2500 gallons, large
enough for one hour of holdup at average flow. The surge tank is also where the raffinate recycle
stream is returned when it is activated. The surge tank has a level meter, M-100, with a level
controller, LC (see 23.2.1), that controls the control valve, V-100, which alters the flow rate of the
exit stream of the surge tank, Stream 2.
Stream 2 passes through the control valve, V-100, then through the flow meter,
M-101. The measurement is transmitted to the recycle controller, RC (see 23.2.2), which diverts

Section 16: Process Description
Frederick | Leach | Nayandi
38 | P a g e
a portion of the raffinate back to the surge tank if the sour water flow rate falls below 30
GPM. This flow meter measurement is also transmitted to the blower control computer (see
18.2.4, 23.2.3) for air stripping (and the valve control computer (see 18.3.4, 23.2.4) for natural gas
stripping), which determines of amount of stripping agent needed for a given flow rate and
composition of sour water.
A small portion of Stream 2 is diverted to flow through pH meter 1, M-102, before being
returned to the main portion of the stream. Like the flow meter, the pH meter 1 transmits its
measurement to the blower control computer (or valve control computer). This pH meter is the
functional equivalent of a concentration meter. Since the only compositional variable in the sour
water feed is ammonia, a basic component, the concentration of ammonia in the sour water can be
directly correlated to the pH of the sour water (Table 16.1). A pH meter was chosen rather than a
concentration meter based on the dead time associated with each type of unit. A concentration
meter, usually a chromatograph, has a dead time on the order of minutes to tens of minutes, while
the Yokogawa pH Meter apparatus in our process has a delay time of approximately 4 seconds
(Appendix: A.4.1).10 This negligent dead time greatly enhances the efficacy of the main control
system of the blower control computer (or valve control computer).
10 Leach, Connor T, and Michael Dowdy. “PH Meter Delay Time for Step Input.” 13 Mar. 2018. Michael is a
sales representative for Cemtech Energy Controls, Inc., the Philadelphia sales representative company for
Yokogawa Corporation of America.

Section 16: Process Description
Frederick | Leach | Nayandi
39 | P a g e
Table 16.1: Correlation Between pH and Ammonia Concentration
Section 16.2: Mixing, Heating, and Pressurizing Sour Water and Acid (S3 S4)
Stream 2 is then mixed together with Stream 3 in the 400-gallon mixing tank, T-102 (see
18.1.3). Stream 3 is 33% by weight sulfuric acid in water, and has a low fixed flow rate of 1.8
lb/hr for air stripping (1.65 lb/hr for natural gas stripping) (Appendix: A.1.5). Stream 3 comes
from the 200-gallon acid storage tank, T-101 (see 18.1.2), which is large enough to hold a 5-week
supply of acid solution, and is restocked monthly. The mixing tank is sized for a 10-minute holdup
at average flows, and is agitated to ensure the small amount of acid is well-mixed in the sour water
before the homogenous stream moves on to the column as Stream 4.
Stream 4 leaves the mixing tank and a small diversion passes through pH meter 2, M-103,
before being returned to the rest of the stream. This pH meter records the pH of the stream that
will enter the column without undergoing any additional chemical changes. Stream 4 then enters
the sour water pump, P-100 (see 18.1.4). The pump has an outlet pressure of 55 psia to provide
enough pressure for the sour water to climb 60 feet to the top of the column, overcome the friction
of the long vertical pipe, and to enter the column at 25 psia.

Section 16: Process Description
Frederick | Leach | Nayandi
40 | P a g e
The sour water pump outlet, Stream 5, enters the natural gas burning fired heater. This
sour water heater, F-100 (see 18.1.5), heats the sour water to the column inlet specification of
190°F. Stream 5 enters above the top tray, tray 1, of the stripping column, the details of which are
discussed in Section 16.6
Section 16.3: Air as Stripping Agent (S7 S8)
Stream 7 is the feed stream of the stripping agent: air in Figure 15.1 and natural gas in
Figure 15.2. Since Stream 7 and the equipment unit that controls its flow rate (B-100 for air and
V-101 for natural gas) are the most different between air and natural gas stripping, each will be
described separately.
Stream 7 represents atmospheric air in Philadelphia, PA. Atmospheric air in this region
annually fluctuates between 0°F and 100°F, and between 0 and 4 percent water vapor by
mass. Philadelphia’s mean annual temperature is 56°F. 11 The air is pulled into the system by a
screened blower, B-100 (see 18.2.12), which is housed inside the temperature-controlled facility
of the stripping operation. The indoor temperature of the facility is 70°F, so the air in the blower
is assumed to be 70°F as well, since this is only 14°F higher than the annual average. A blower
was chosen instead of a fan because a fan cannot generate the needed outlet pressure, and a
compressor would be more expensive than a blower for the same pressure increase (Appendix:
A.4.5).12 In the ASPEN simulations, air is modeled as 79% nitrogen and 21% oxygen by mole,
rather than “Air,” so ASPEN could accurately calculate phase and dissolution chemistry. The
11 “Historic Average, Philadelphia, Pennsylvania.” Intellicast - Philadelphia Historic Weather Averages in
Pennsylvania (19113), TWC Product and Technology, LLC, 2018,
www.intellicast.com/Local/History.aspx?location=USPA1276. 12 Seider, Warren D., et al. Product and Process Design Principles: Synthesis, Analysis, and Evaluation. 4th
ed., John Wiley & Sons Inc., 2017.

Section 16: Process Description
Frederick | Leach | Nayandi
41 | P a g e
blower pulls in enough air to effectively strip the sour water leaving the surge tank; the amount of
which is explicitly calculated as a direct function of sour water flow rate and ammonia
concentration by the blower control computer (see 18.2.4). The blower pressurizes the air to 35
psia, the column inlet specification, and feeds it into the fired air heater, F-101. The blower must
come before the heater in the air feed stream because the air must have a pressure gradient to flow
through the heater.
Section 16.4: Natural Gas as Stripping Agent (S7 S8)
Stream 7 represents utility natural gas at the indoor temperature of 70°F, and an assumed
pressure of 500 psig.13 This pressure is too high to feed into our system, and since we need a valve
to control the amount of natural gas fed to our system, a pressure drop from 514.7 psia to 35 psia
was specified across the valve. This decrease in pressure leads to a higher volumetric flow rate,
and decreases the temperature from 70°F to 42°F (Appendix: A.5.1). The utility natural gas is
assumed to be 100% methane, with a negligibly small concentration of t-butyl mercaptan added
by the utility company as a safety measure, so the gas can be smelled if there is a leak. The natural
gas control valve, V-101 (see 18.3.1), allows enough natural gas to effectively strip the sour water
leaving the surge tank; the amount of which is explicitly calculated as a direct function of sour
water flow rate and ammonia concentration by the valve control computer (see 18.3.4). The natural
gas leaves the natural gas control valve as Stream 8. The natural gas is depressurized before being
heated to mitigate safety concerns, i.e. minimizing the length of piping that has to handle 500 psig
natural gas and avoid feeding high pressure natural gas to a heater.
13“Natural Gas – From Wellhead to Burner Tip.” NaturalGasorg, NaturalGas.Org, 20 Sept. 2013,
naturalgas.org/naturalgas/.

Section 16: Process Description
Frederick | Leach | Nayandi
42 | P a g e
Section 16.5: Heating the Stripping Agent (S9 S10 S11)
Stream 8 is the pressurized air being fed to the air heater, F-101 (see 18.2.2), for air
stripping (and is the de-pressurized natural gas being fed to the natural gas heater, F-101 (see
18.3.2)). The air heater heats the stream to 158°F for air stripping (and 180°F for natural gas
stripping), which is lower than column inlet specification temperature. This is because the addition
of 50 psig, 300°F utility steam helps to heat the mixture to the specified 190°F (Appendix:
A.1.2). Stream 9, the heated gas, is injected with 30 psig steam from Stream 10 by the steam
injector, I-100. The steam retains most of the heat energy through the injection, but its higher
initial pressure does not significantly contribute to the gas stream. The stripping agent streams are
heated before the steam is added so the gas is hot enough to be above the saturation temperature of
10% water vapor.14 The reason water vapor must be added to the stripping agent is because the
high temperatures in the column, as well as the large amount of gas in contact with the sour water,
led to the vaporization of a large amount of sour water. This had the effect of both concentrating
the contaminants in the raffinate, since there was less water to dissolve them in, and, more
importantly, significantly cooling the column by the heat of vaporization of all the water that had
undergone a phase change. To minimize the effect of sour water vaporizing, we applied Le
Chatelier’s Principle and added water vapor to our stripping agent before it entered the column,
which lessened the amount of sour water that could be vaporized. This allowed the column to be
operated at a higher temperature, and to effectively strip the contaminants to the required
specifications.
14 Engineering ToolBox, “Water Vapor and Saturation Pressure in Humid Air.” Water Vapor and Saturation
Pressure in Humid Air, 2004, www.engineeringtoolbox.com/water-vapor-saturation-pressure-air-d_689.html.

Section 16: Process Description
Frederick | Leach | Nayandi
43 | P a g e
The humid stripping agent, Stream 11, passes by a humidity meter, M-104, which transmits
the measurement to the humidity controller, HC (see 23.2.5). The humidity controller controls
how much steam is injected into Stream 9 to maintain the humidity of Stream 11 at 10% by mass.
Stream 11 also passes through a thermocouple, M-105, which transmits its measurement to the
temperature controller, TC (see 23.2.6). The temperature controller controls the fired heater F-
101 to maintain the temperature of Stream 11 at 190°F. The stripping agent leaves the
thermocouple and enters the stripping column as Stream 12.
The potential atmospheric humidity of the incoming air will not be an issue for the steam
injection humidification process. The saturation temperature for 10% water vapor in air is 115°F,15
which is 9°F higher than Philadelphia’s record high temperature of 106°F, set in 1918. This means
that the atmospheric water vapor concentration will always be lower than the amount specified to
enter the column, and the feedback humidity control system (23.2.5) will add enough steam to the
fed air stream to reach the desired 10% specification no matter the humidity of the incoming air.
Section 16.6: Feed and Effluent to Stripping Column (S6 S12 S13 S14)
The stripping column, C-100 (see 18.2.3 and 18.3.3), is the primary unit operation of the
sour water stripping operation. The column has 20 Trays for air stripping, (and 17 trays for natural
gas stripping), and was sized independently for each case. For both cases, a turndown capability
of 60% is assumed, as well as a Murphree Tray Efficiency of 25%.16 17 The column was sized to
be able to handle the maximum flow rate of 50 GPM, and a turndown capability of 60% allows
15 Engineering ToolBox, “Water Vapor and Saturation Pressure in Humid Air.” Water Vapor and Saturation
Pressure in Humid Air, 2004, www.engineeringtoolbox.com/water-vapor-saturation-pressure-air-d_689.html. 16 Frederick, Andrew E, and Leonard Fabiano. “Column Design in ASPEN.” 8 Mar. 2018.Leonard is an
adjunct Professor at the University of Pennsylvania 17 Hatcher, Nathan, and Ralph Weiland. "Reliable design of sour water strippers." Petroleum Technology
Quarterly 17.4 (2012): 83.

Section 16: Process Description
Frederick | Leach | Nayandi
44 | P a g e
the column to operate without tray weeping at 30 GPM, the lowest flow rate the system is expected
to receive under normal operation. The sour water in Stream 6 is introduced to the column above
the top tray, and the stripping agent in Stream 12 is added on the bottom tray. The column effluents
are the contaminated stripping agent, and the sweeter water, purified to the specifications of less
than 20 ppm ammonia and 0.1 ppm hydrogen sulfide.
The gaseous stripping agent leaves the top of the Stripping Column as Stream 13, the
extract. The extract is comprised of the initial stripping agent and water vapor, as well as
additional water vapor from evaporated sour water, and the stripped contaminants including most
of the ammonia and hydrogen sulfide, and all of the propane.
In the case of natural gas stripping, the contaminated natural gas extract, Stream 13, would
be sold back to the main utility feed of natural gas to the refinery. The average annual natural gas
consumption of a refinery on the east coast (EIA PADD 1) was 5,813,400,000 SCFY in 2016
(Appendix: A.1.1).18 The natural gas stripping process for sour water uses 1,161,000,000 SCFY
(Appendix: A.1.1). One fifth of the natural gas utility purchased by the refinery would need to be
diverted to strip the sour water. The stripping process loses 0.0019% (21,800 SCFY) of natural
gas to the raffinate sweet water, but the remaining 99.9981% is recoverable (Table 15.3). The
extract from the natural gas stripping process is comprised of primarily natural gas, 82.7% by
mass, and also contains 17.7% water, 0.167% ammonia (1670 ppm) and 0.000495% hydrogen
sulfide (5 ppm) (Table 15.3). This gas is at a significantly lower pressure (2.3 psig) than the
refinery feed of natural gas (500 psig). Assuming eductors or injectors can be used to return this
extract stream to the feed natural gas, against the pressure gradient, and that the price at which the
18 U.S. Energy Information Administration. “Fuel Consumed at Refineries.” East Coast (PADD 1) Fuel
Consumed at Refineries, U.S. Department of Energy, 21 June 2017,
www.eia.gov/dnav/pet/pet_pnp_capfuel_dcu_r10_a.htm.

Section 16: Process Description
Frederick | Leach | Nayandi
45 | P a g e
refinery will buy back the natural gas does not depend on pressure, returning the extract natural
gas to the refinery feed is an effective way to make the natural gas useful and redistributable to the
refinery, and to dilute the contaminants to a lower level to be burned in fired heaters. If the column
extract is returned to the natural gas feed, the water concentration would be diluted to 3.42%, the
ammonia would be diluted to 334 ppm, and the hydrogen sulfide would be diluted to 0.99 ppm.
This concentration of water vapor in the natural gas is appropriate for combustion. The
combustion of methane in air is stable up to a 15% water vapor content in the air, which is
introduced in a 19:1 ratio to natural gas.19 This corresponds to a 14.25% water vapor presence in
the mixture, whereas our natural gas extract (before dilution) would lead to a mixture water vapor
content of 1.25%. Therefore, the humidity of the extract natural gas stream is not an obstacle to
recycling it for use as fuel.
In the case of air stripping, rather than being released to the atmosphere, the extract can
also be returned to the refinery as preheated air to be consumed in natural gas burning fired heaters,
which requires a natural gas-to-air ratio of 19:1.20 21
The stripped sweeter water exiting the bottom of the stripping column, Stream 14, and a
concentration meter, M-106. This concentration meter measures the concentrations of every
component present in the sour water, especially the ammonia and hydrogen sulfide and their
dissociative counterparts. This meter is not part of the control system for the column, because to
maintain the specified purities 100% of the time, a feedback control system with a large dead time
chromatograph would not be adequate. The concentration meter serves to ensure the specificat ions
19 Nakhamkin, M., et al. Combustion Studies of Natural Gas and Syn-Gas with Humid air. Technical report,
EPRI, Palo Alto CA, USA, 1994. 20 Frederick, Andrew E, and Tyler McDevitt. “Sour Water Process Engineer Consultation.” 12 Apr.
2018. Tyler is a process engineer at Phillips 66 refinery. 21 Methane MDSD.

Section 16: Process Description
Frederick | Leach | Nayandi
46 | P a g e
are being met, and the results will be monitored by the control room operator, and a computer
alarm system, which will take action to fix any problems that arise if the specifications cease being
met.
The sweet water of Stream 14 passes through a splitter valve, S-100, which is usually not
in use. The project specifications indicate that the expected incoming sour water flow rate will
range from 30 to 50 GPM, with two-day periods of 20 GPM low-flow prior to, and following,
annual refinery shutdown. During the periods of low-flow, and any time the flow rate
unexpectedly drops below 30 GPM, the recycle controller will have the splitter recycle enough of
the raffinate to the surge tank, Stream 15, to maintain a minimum column water flow rate of 30
GPM.
Stream 16 is the relatively sweet water effluent from the process. The stripped water has
low enough concentrations of all contaminants to be discharged into the Delaware River, since the
Philadelphia refinery is located along it. Other options for the sweet water include sewer
discharge, or recycling for other refinery uses, i.e. boiler feed water (BFW) or desalting operations.

Section 17: Energy Balance and Utility Requirements
Frederick | Leach | Nayandi
47 | P a g e
Section 17
Energy Balance and Utility
Requirements

Section 17: Energy Balance and Utility Requirements
Frederick | Leach | Nayandi
48 | P a g e
Section 17.1: Heat Integration
Heat integration was not necessary for this project. The reason for this is because, for the
natural gas case, the effluent gas stream (Stream 13) is going to be sent back to the refinery’s
natural gas feed to the furnace to be burnt. If this stream was to be used to help heat the influent
gas stream from 80°F (Stream 5) to 190°F (Stream 6) required for stripping, its temperature would
decrease and require even more heat to reach the required temperature for combustion in the
furnace. Because no heat exchanger is 100% efficient, reheating Stream 13 would require more
energy and increase utility and operating costs. Additionally, heat integration would require the
capital cost of a heat exchanger, an unnecessary cost for an inferior design. For that reason, we
did not think it was a good idea to do a heat integration on this part. This same reasoning applies
for the effluent air stream in the air stripping process since it is also being recycled to the furnaces.
Section 17.2: Stripping Efficiency
As mentioned in Section 13, in order to increase the effectiveness of stripping, the sour
water feed stream (Stream 6) and air/ natural gas stream (Stream 9) were evaluated. It was found
that at extreme conditions, specifically low flow rate of sour water coupled with high concentration
of ammonia, air alone or natural gas alone could not effectively strip ammonia and hydrogen
sulfide from sour water. In addition to this, there was a lot of heat lost in the column due to the
heat of vaporization of water in sour water evaporating to the air/ natural gas stream. For that
reason, we decided to add 10 mole% water to the incoming air stream and natural gas stream to
prevent much of the evaporation, making the column much warmer throughout (137°F for the air
stripping process and 140°F for the natural gas stripping process in Stream 14). The addition of
10 mole% water also made the stripping process much more efficient because it reduced the

Section 17: Energy Balance and Utility Requirements
Frederick | Leach | Nayandi
49 | P a g e
required amount of air for stripping by 71.3% and the required amount of natural gas for stripping
by 62.2%.
Section 17.3: Utility Requirements
Table 17.1 and Table 17.2 show details of utility requirements and electricity for air
stripping process and natural gas stripping process respectively.
Table 17.1: Utility and Electricity Requirements for Air Stripping Process
Table 17.2: Utility and Electricity Requirements for Natural Gas Stripping Process
Utility Equipment Quantity (per hr) Quantity (per yr)
Steam @50 psi I-100 1665 13.32 MM
Total (lb) 1665 13.32 MM
Natural Gas F-100 354.59 2.84 MM
F-101 73.32 0.59 MM
Total (lb) 427.91 3.48 MM
Electricity B-100 23.32 0.187 MM
P-100 1.61 0.01288 MM
Total (Kwh) 24.9 0.019988 MM
Utility Equipment Quantity (lb/hr) Quantity (lb/yr)
Steam @50 psi I-100 1665 13.32 MM
Total (lb) 1665 13.32 MM
Natural Gas F-100 359.54 2.84 MM
F-101 87.9 0.70 MM
Total (lb) 442.49 3.54 MM
Electricity P-100 1.61 0.01288 MM
Total (Kwh) 1.61 0.01288 MM

Section 18: Equipment List and Unit Descriptions
Frederick | Leach | Nayandi
50 | P a g e
Section 18
Equipment List and Unit Descriptions

Section 18: Equipment List and Unit Descriptions
Frederick | Leach | Nayandi
51 | P a g e
The process unit descriptions will be detailed in four sections: sour water specific, air
specific, natural gas specific, and minor equipment. The sour water specific section contains the
equipment that will be designed identically for the sour water process regardless of the stripping
agent that is used. The air specific section contains the equipment necessary if air is the stripping
agent. The natural gas specific section is laid out the same way. Finally, the minor equipment
section contains a list of miscellaneous valves, devices, and other control system related
equipment.
Section 18.1: Sour Water Specific Equipment (Figures 15.1 and 15-2)
Section 18.1.1: Sour Water Surge Tank: T-100
Type: Open storage tank
Material: Fiberglass
Bare Module Cost: $55,876.00
Specification Sheet: Section 19.1 and 19.2
The sour water surge tank was designed to reduce any fluctuation and variability in the
inlet sour water feed flow rate and composition. Additionally, it was designed to enable the
recycling of the raffinate during plant shut down. To ensure that all spikes in the inlet feed will be
dampened, the tank was designed to hold 2500 gallons, or one hour’s average worth of flow. The
2500 gallon capacity of the tank will ensure that the flow out of the tank, Stream 2, will be
consistent in flow rate and composition, maximizing the effectiveness of the control system.

Section 18: Equipment List and Unit Descriptions
Frederick | Leach | Nayandi
52 | P a g e
Section 18.1.2: Acid Storage Tank: T-101
Type: Closed Storage Tank
Material: 316 Stainless Steel
Bare Module Cost: $1,977.00
Specification Sheet: Section 19.1 and 19.2
The acid storage tank is designed to hold the 33.3% sulfuric acid solution that will be added
at 1.8 lb/hr when air is used as the stripping agent and 1.65 lb/hr when natural gas is used as the
stripping agent. These acid flow rates prime the streams to be stripped to the required raffinate
conditions regardless of sour water flow rate. The steady acid flow rates also prevent the need for
an acid control system. The tank is big enough to hold an entire bulk order of sulfuric acid so that
it does not have to be stored on the facility floor.
Section 18.1.3: Acid Mixing Tank: T-102
Type: Closed Tank
Accessories: Agitator
Material: 316 Stainless Steel
Bare Module Cost: $29,597.00
Specification Sheet: Section 19.1 and 19.2
The acid mixing tank is designed to ensure homogenous mixing of the sulfuric acid solution
and sour water feed prior to entering the column. Doing so will reduce the pH of the sour water,
which readjusts the composition of the sour water stream to be primed for stripping. Given that
the average flow is 37.5 GPM, a capacity of 400 gallons will provide an average mixing time of
around ten minutes, which will ensure a consistent outlet concentration in Stream 4. The 316
stainless steel is to prevent corrosion from the acid.

Section 18: Equipment List and Unit Descriptions
Frederick | Leach | Nayandi
53 | P a g e
Section 18.1.4: Sour Water Pump: P-100
Type: Centrifugal Pump
Material: Stainless Steel
Bare Module Cost: $30,679.00
Specification Sheet: Section 19.1 and 19.2
The sour water pump is designed to handle the maximum sour water flow rate of 50
GPM. The pump type is the industry standard centrifugal pump. The inlet pressure is 15 psia, and
the outlet pressure is 55 psia, to provide enough pressure to pump the water through the heater, up
60 feet to the top of the column, and enter the column at 25 psia. The head necessary for this
pressure increase is 92.6 ft. The construction material is stainless steel to avoid any corrosion from
sour water contaminants. The calculated bare module cost of the sour water pump is $30,679.00.
Section 18.1.5: Sour Water Heater: F-100
Type: Fired Heater
Operating P: 55 psia
Material: Stainless Steel
Bare Module Cost: $378,824.00
Specification Sheet: Section 19.1 and 19.2
The sour water heater is designed to handle a maximum of 25,036 lb/hr of sour
water. Raising the temperature of this stream from 80°F to 190°F takes a maximum heat duty of
2,753,960 Btu/hr. The type of heater is a fired heater. The operating pressure is 55 psia, the
pressure of the sour water stream. The construction material is stainless steel, to avoid any
corrosion from the sour water contaminants. The heater will be shop fabricated. The bare module
cost of the sour water heater is $378,824.00.

Section 18: Equipment List and Unit Descriptions
Frederick | Leach | Nayandi
54 | P a g e
Section 18.2: Air Specific Equipment (Figure 15.1)
The process equipment designs for the stripping agent feed streams, as well as the stripping
column itself, depend intimately on the stripping agent used. For the air stripping process, the size
of the blower, heater, and stripping column were optimized together to minimize the combined
bare module cost, e.g. a column with more trays would be more expensive, but require less air
leading to a less expensive blower and air heater. This optimization was based on the maximum
sour water flow rate and ammonia concentration, and accordingly at the maximum air flow rate,
because this is the highest output the equipment will need to be designed to handle.
Section 18.2.1: Blower: B-100
Type: Centrifugal (turbo) Blower
psia in: 15
psia out: 35
Material: Aluminum
Bare Module Cost: $162,083.00
Specification Sheet: Section 19.1
The blower for the air stripping system is designed to accommodate a maximum flow rate
output capacity of 4036 cu.ft. per minute. The inlet pressure is 15 psia, and the outlet pressure is
35 psia. The material of construction is aluminum because this is the least expensive option, and
is sufficient for the purpose of pulling atmospheric air into the system. The type of blower is the
industry standard centrifugal blower. A screen on the inlet side of the blower will prevent large
contaminants, such as birds, from entering the process air feed. The calculated bare module cost
of the blower is $162,083.00.

Section 18: Equipment List and Unit Descriptions
Frederick | Leach | Nayandi
55 | P a g e
Section 18.2.2: Air Heater: F-101
Type: Fired Heater
Operating P: 35 psia
Material: Cr-Mo Alloy Steel
Bare Module Cost: $87,199.00
Specification Sheet: Section 19.1
The heater for the air stripping system is designed to accommodate a maximum flow rate
of 33,793 lb/hr. This amount of air entering at 70°F and being heated to 158°F requires a
maximum heat duty of 542,901 Btu/hr. The heater type is a fired heater, as this was the least
expensive option to choose from in Seider et al.22 The operating pressure of the heater is 35 psia.
The Cr-Mo Alloy Steel was chosen to be the material over stainless steel because the heater does
not have be resistant to corrosion and the allow steel is less expensive. The fabrication method of
the heater is at the shop. The calculated bare module cost of the air heater is $87,199.00.
22 Seider, Warren D., et al. Product and Process Design Principles: Synthesis, Analysis, and Evaluation. 4th
ed., John Wiley & Sons Inc., 2017.

Section 18: Equipment List and Unit Descriptions
Frederick | Leach | Nayandi
56 | P a g e
Section 18.2.3: Stripping Column: C-100
Trays: Column:
Number: 20 Height/Diameter Ratio: 10.64
Efficiency: 25% Height: 50 ft
Type: Sieve Diameter: 4.701 ft
Spacing: 2 ft Turndown capability: 60%
Pressure drop: 0.1 psi Pressure drop: 1.9 psi
Bare Module Cost: $738,056.00
Material: 316 Stainless Steel
Specification Sheet: Section 19.1
The column was optimized to strip 20-50 GPM of sour water at initial compositions
between 300-3000 ppm down to an outlet concentration 20 ppm. Although traditional sour water
strippers use steam and have a reboiler and condenser, air is already in the gaseous phase and is
not compressible at reasonable temperatures. To optimize the column, a variety of parameters
were tested and their impact was observed on the extent of the stripping process. The parameters
and their effects are listed in Table 18.1 below.
Table 18.1: Preliminary Analysis of Stripping Parameters. The parameters were qualitatively tested through ASPEN
and their costs to adjust were roughly determined. The parameters with good stripping value (high impact on stripping
and a low cost to adjust) were highlighted in green and those with medium value were highlighted in yellow.
Parameter Impact on Stripping
Effectiveness Cost to Adjust
Air/Methane
Flow Rate High Medium
Temperature Medium Medium
Pressure Low Low
Water Temperature High Medium
Pressure Low Low
Stripping Column Number of Stages High High
pH High Low

Section 18: Equipment List and Unit Descriptions
Frederick | Leach | Nayandi
57 | P a g e
By adjusting one variable at a time and keeping the remainders constant, the most impactful
variables on the stripping process were determined and labeled as “High” in Table 18.1. The
influence of these variables on the process through the amount of ammonia stripped can be seen
in the figures in the Appendix (A.2.1). To optimize the column, it was essential to minimize
parameters with a high cost to adjust and prioritize parameters with a large impact on stripping
effectiveness and a low cost to adjust (Appendix: A.2.1). For example, increasing the number of
stages greatly increased the effectiveness of the column but also had the greatest cost associated
with doing so by far. Therefore, the number of stages was minimized while cheaper parameters
like the stripping agent flow rate and water temperature were increased.
All of the above parameters greatly affected the amount of ammonia that could be stripped
from the process but had little impact on the amount of hydrogen sulfide that could be stripped .
As it stood, the sweeter water still had a concentration of 2.5 ppm which was well above the 0.1
ppm limit. This is because the large majority of the hydrogen sulfide in the sweet water was in its
dissociated conjugate base in the form of HS-. Ions in water cannot be stripped because they have
too strong of interactions with polar water molecules. Therefore it was realized that stripping more
hydrogen sulfide from the sour water required a lower pH. While a lower pH increases the amount
of hydrogen sulfide that can be stripped, it converts ammonia to its conjugate acid, ammonium,
and reduces the amount of ammonia that could be stripped. Determining the optimal pH of the
sour water required a careful balance to ensure that both species could be stripped in their
undissociated form and reach the outlet concentration requirements.

Section 18: Equipment List and Unit Descriptions
Frederick | Leach | Nayandi
58 | P a g e
From the literature and the industrial consultants, it was determined that the Murphree Tray
Efficiency for a stripping column is 25%.23 The efficiency is less than 100% because the liquid
and vapor phases on each tray are not in contact long enough to reach thermodynamic equilibr ium.
Trays were selected over column packing because ASPEN cannot accurately predict the size of a
column for packing. Sieve trays were selected as opposed to bubble cap trays and valve trays for
a couple of reasons. First, sieve trays are less expensive than both bubble cap trays and valve
trays. Additionally, sieve trays are the easiest to clean. The spacing between trays was chosen to
be the commercial standard of 2 feet. The height of the column, number of trays multiplied by the
tray spacing, was 40 feet. However, 5 feet above tray one and 5 feet below tray two were added
to the column to accommodate the addition and removal of the streams. The diameter of the
column was given as 4.7 feet and the 60% turndown capacity of 50 GPM means the minimum
standard flow is 30 GPM. The thickness was chosen to be 0.3125 inches because an extra 0.125
inches was added to the walls to account for corrosion, and the next largest thickness of the column
commercially available was 0.3125 inches
The top of the column was set to 17 psia and the pressure drop per stage was suggested to
be 0.1 psi. The incoming water feed at the top of the column was set to 25 ppm, and the incoming
stripping agent at the bottom of the column was set to 35 ppm. The difference between the two
incoming streams is well above the 1.9 psi pressure drop that the column will experience. The
calculated bare module cost is $738,056.00 and the column is made from 316 Stainless Steel.
An example of an ASPEN simulation used to optimize the air stripping column can be
found in the Appendix (A.5.2).
23 Frederick, Andrew E, and Leonard Fabiano. “Column Design in ASPEN.” 8 Mar. 2018.Leonard is an
adjunct Professor at the University of Pennsylvania

Section 18: Equipment List and Unit Descriptions
Frederick | Leach | Nayandi
59 | P a g e
Section 18.2.4: Blower Control System Computer: BC | CP with Equation
The blower control computer is the key to stripping the sour water to the required
specifications. The blower control computer determines how much air is needed to strip sour water
of a given flow rate and ammonia concentration. A more detailed description of the control system
is given in Section 23.2.3. Equation 18.1 was formulated to calculate the required amount of air
to strip the sour water. To ensure that enough air is used, the equation has a small overshoot buffer,
and because the specifications in ASPEN were for 19 instead of 20 ppm ammonia (plus
ammonium). Below is Equation 18.1:
𝑽 = ((√𝑪 ∗𝑭𝑭
24+(15000−𝑭𝑭)
12.5−330 ∗ (
𝑪
300)1.5
+555 + (𝑭𝑭− 20000) ∗ 0.026) ∗ (300
𝑪)0.2
+ (𝑪
300)
1
3+
(29
𝑭𝑭∗𝑪
4)19.15
+ ((15000
𝑭𝑭)0.1
∗𝑪
3)+
16000−𝑭𝑭
1.25+ (
300
𝑪)3
∗ 58 ∗𝐹𝐹−14000
115+𝑎𝑏𝑠 |
𝑭𝑭−19100
4.3|)∗ 0.8802,
where V is the air flow required in lb/hr, C is the concentration of ammonia in ppm, and FF is the
feed sour water flow rate in lb/hr (or 498.65*GPM at flowmeter conditions). This feed-forward
control equation will be utilized by the blower control computer to set the blower to the appropriate
specification based on the sour water flow rate.

Section 18: Equipment List and Unit Descriptions
Frederick | Leach | Nayandi
60 | P a g e
Section 18.3: Natural Gas Specific (Figure 15-2)
As was the case for air, the optimization of the natural gas stripping process was performed
on the heater and stripping column to minimize the combined bare module cost. This optimiza t ion
was based on the maximum sour water flow rate and ammonia concentration and the maximum
natural gas flow rate, as the equipment needs to be designed to handle the maximum process
output.
The natural gas heater is significantly more expensive than the air heater, $195,927.00 vs
$87,199.00, but the natural gas control valve has no bare module cost compared to the $162,083.00
for the air blower. The natural gas stripping column is less expensive than the air stripping column,
$680,792.00 vs $738,056.00. The total bare module cost of the natural gas specific units is
$876,719 and the total bare module cost of the air specific units $987,388. This difference shows
that the natural gas stripping process has a lower capital cost that the air stripping process, but the
true economic comparisons are the NPV calculations in Section 24, which incorporate capital
costs, operating costs, utility costs, depreciation costs, and more.
Section 18.3.1: Control Valve: V-101
While the natural gas stripping process does not include a blower, it does include a large
control valve which allows the necessary amount of natural gas into the system, and reduces the
pressure from 500 psig to 35 psia. The cost of the control valve is accounted for in the pricing
factors of the rest of the equipment.

Section 18: Equipment List and Unit Descriptions
Frederick | Leach | Nayandi
61 | P a g e
Section 18.3.2: Natural Gas Heater: F-101
Type: Fired Heater
Operating P: 35 psia
Material: Cr-Mo Alloy Steel
Bare Module Cost: $195,927.00
Specification Sheet: Section 19.2
The heater required for the natural gas stripping system is designed to handle a maximum
flow rate of 23,054 lb/hr. This amount of natural gas entering at 42°F and being heated to 180°F
requires a maximum heat duty of 1,522,641 Btu/hr. The heater type is a fired heater, the least
expensive option recommended in Seider et al.24 The operating pressure of the heater is 35
psia. The material of construction is Cr-Mo Alloy Steel, the less expensive option. The fabrication
method is shop fabrication. The calculated bare module cost of the natural gas heater is
$195,927.00.
Section 18.3.3: Stripping Column: C-100
Trays: Column:
Number: 17 Height/Diameter Ratio: 9.75
Efficiency: 25% Height: 44 ft
Type: Sieve Diameter: 4.513 ft
Spacing: 2 ft Turndown capability: 60%
Pressure drop: 0.1 psi Pressure drop: 1.6 psi
Bare Module Cost: $680,792.00
Material: 316 Stainless Steel
Specification Sheet: Section 19.2
24 Seider, Warren D., et al. Product and Process Design Principles: Synthesis, Analysis, and Evaluation. 4th
ed., John Wiley & Sons Inc., 2017.

Section 18: Equipment List and Unit Descriptions
Frederick | Leach | Nayandi
62 | P a g e
The optimization analysis of the column with natural gas as the stripping agent was
performed in the same manner as that of the column with air as the stripping agent. The parameters
in Table 18.1 had the same effect on the stripping process and the same costs associated with them.
In this case, because natural gas is a better stripping agent than air, the number of trays was lowered
even further to 17.
As was the case with the air stripper, it was determined that the Murphree Tray Efficiency
for a stripping column is 25%. The efficiency is less than 100% because the liquid and vapor
phases on each tray are not in contact long enough to reach thermodynamic equilibrium. Trays
were selected over column packing because ASPEN cannot accurately predict the size of a column
for packing. Sieve trays were selected as opposed to bubble cap trays and valve trays for a couple
of reasons. First, sieve trays are less expensive than both bubble cap trays and valve trays.
Additionally, sieve trays are the easiest to clean. The spacing between trays was chosen to be the
commercial standard of 2 feet. The height of the column, number of trays multiplied by the tray
spacing, was 34 feet. However, 5 feet above tray one and 5 feet below tray two were added to the
column to accommodate the addition and removal of the streams. The diameter of the column was
given as 4.51 feet and the 60% turndown capacity of 50 GPM means the minimum standard flow
is 30 GPM.
The top of the column was set to 17 psia and the pressure drop per stage was suggested to
be 0.1 psi. The incoming water feed at the top of the column was set to 25 ppm, and the incoming
stripping agent at the bottom of the column was set to 35 ppm. The difference between the two
incoming streams is well above the 1.9 psi pressure drop that the column will experience. The
calculated bare module cost is $680,792.00 and the column is made from 316 Stainless Steel.

Section 18: Equipment List and Unit Descriptions
Frederick | Leach | Nayandi
63 | P a g e
An example of an ASPEN simulation used to optimize the natural gas stripping column
can be found in the Appendix (A.5.3).
Section 18.3.4: Valve Control System Computer: VC | CP with Equation
The valve control computer is the key to stripping the sour water to the required
specifications. The valve control computer determines how much natural gas is needed to strip
sour water of a given flow rate and ammonia concentration.
A more detailed description of the control system is given in Section 23.2.4. Equation 18.2
was formulated to calculate the required amount of natural gas to strip the sour water. To ensure
that enough natural gas is used, the equation has a small overshoot buffer, and because the
specifications in ASPEN were for 19 instead of 20 ppm ammonia (plus ammonium). Below is
Equation 18.2:
𝑽 = (((𝑪∗𝑭𝑭
1500+15000−𝑭𝑭
12.5− 330 ∗ (
𝑪
300)1.5
+330+ (1000− 𝑪) ∗ 6 ∗ (𝑭𝑭−17200
10000)) + 6065) ∗ 0.96−
(15000
𝑭𝑭)1.5
∗ 𝑪 ∗ 5 +(900−𝑪)∗𝑭𝑭
20000−𝑎𝑏𝑠|1600− 𝑪| ∗ (
𝑭𝑭
27000)3
+ (15000
𝑭𝑭)4
∗ 3300 +𝑪
3∗25000
𝑭𝑭) ∗
(14+300
𝑪)
14.3,
where V is the natural gas flow required in lb/hr, C is the concentration of ammonia in ppm, and
FF is the feed sour water flow rate in lb/hr (or 498.65*GPM at flowmeter conditions). This feed-
forward control equation will be utilized by the valve control computer to set the blower to the
appropriate specification based on the sour water flow rate.

Section 18: Equipment List and Unit Descriptions
Frederick | Leach | Nayandi
64 | P a g e
Section 18.4: Minor Equipment
Minor equipment that was incorporated but not fully designed include
Level meter, controller, control valve Flowmeter and ph meter for main control system
pH meter for post-acid Steam injectors
Humidity meter and controller Thermocouple and controller Raffinate composition meter
Splitter valve.

Section 19: Specification Sheets
Frederick | Leach | Nayandi
65 | P a g e
Section 19
Specification Sheets

Section 19: Specification Sheets
Frederick | Leach | Nayandi
66 | P a g e
Section 19.1: Specification Sheets for Air Stripping Process

Section 19: Specification Sheets
Frederick | Leach | Nayandi
67 | P a g e

Section 19: Specification Sheets
Frederick | Leach | Nayandi
68 | P a g e

Section 19: Specification Sheets
Frederick | Leach | Nayandi
69 | P a g e

Section 19: Specification Sheets
Frederick | Leach | Nayandi
70 | P a g e

Section 19: Specification Sheets
Frederick | Leach | Nayandi
71 | P a g e

Section 19: Specification Sheets
Frederick | Leach | Nayandi
72 | P a g e

Section 19: Specification Sheets
Frederick | Leach | Nayandi
73 | P a g e

Section 19: Specification Sheets
Frederick | Leach | Nayandi
74 | P a g e
Section 19.2: Specification Sheets for Natural Gas Stripping Process

Section 19: Specification Sheets
Frederick | Leach | Nayandi
75 | P a g e

Section 19: Specification Sheets
Frederick | Leach | Nayandi
76 | P a g e

Section 19: Specification Sheets
Frederick | Leach | Nayandi
77 | P a g e

Section 19: Specification Sheets
Frederick | Leach | Nayandi
78 | P a g e

Section 19: Specification Sheets
Frederick | Leach | Nayandi
79 | P a g e

Section 19: Specification Sheets
Frederick | Leach | Nayandi
80 | P a g e

Section 20: Equipment Cost Summary
Frederick | Leach | Nayandi
81 | P a g e
Section 20
Equipment Cost Summary

Section 20: Equipment Cost Summary
Frederick | Leach | Nayandi
82 | P a g e
Table 20.1. Equipment Cost Summary for Air Stripping Process
Process
Equipment ID Type
Purchase
Cost($)
Bare Module
Factor Bare Module Cost ($)
Surge Tank T-100 Fabricated
Equipment $17,407.00 3.21 $55,876.47
Acid Storage
Tank T-101
Fabricated
Equipment $616.00 3.21 $1,977.36
Acid Mixing
Tank T-102
Fabricated
Equipment $9,220.25 3.21 $29,597.00
Sour Water
Pump P-100
Process
Machinery $9,296.67 3.3 $30,679.00
Sour Water
Heater F-100
Process
Machinery $172,979.00 2.19 $378,824.00
Air Blower B-100 Process
Machinery $75,387.44 2.15 $162,083.00
Air Heater F-101 Process
Machinery $39,816.89 2.19 $87,199.00
Stripping
Column C-100
Fabricated
Equipment $177,417.31 4.16 $738,056.00
Total $502,140.56 $1,484,291.83
Table 20.2. Equipment Cost Summary for Natural Gas Stripping Process
Process
Equipment ID Type
Purchase
Cost($)
Bare Module
Factor Bare Module Cost ($)
Surge Tank T-100 Fabricated
Equipment $17,407.00 3.21 $55,876.47
Acid Storage
Tank T-101
Fabricated
Equipment $616.00 3.21 $1,977.36
Acid Mixing
Tank T-102
Fabricated
Equipment $9,220.25 3.21 $29,597.00
Sour Water
Pump P-100
Process
Machinery $9,296.67 3.3 $30,679.00
Sour Water
Heater F-100
Process
Machinery $172,979.00 2.19 $378,824.00
CH4 heater F-101 Process
Machinery $89,464.38 2.19 $195,927.00
Stripping
Column C-100
Fabricated
Equipment $163,651.92 4.16 $680,792.00
Total $462,635.22 $1,373,672.83

Section 20: Equipment Cost Summary
Frederick | Leach | Nayandi
83 | P a g e
For all of the purchase and bare module cost calculations, a Chemical Engineering (CE)
Index of 600 was used. This was done by assuming a 4% per year escalation from the December
2017 CE Index of 572.8 to project start-up in mid-2019.
In order to implement this project, a total permanent investment of $1.78 MM is needed
for the air stripping process. $0.55 MM of the total permanent investment is spent on start-up of
the project, contingencies and contractor fees, site preparations, and service facilities. The
remaining $1.23 MM is spent on buying the process equipment and installation fees as is shown
in Table 20.1 above. On the other hand, a total permanent investment of $1.64 MM is needed for
the natural gas stripping process. $0.53 MM of this total permanent investment is also spent on
start-up of the project, contingencies and contractor fees, site preparations, and service facilit ies.
The remaining $1.11 MM is spent on buying the process equipment and installation fees as seen
in Table 20.2 above.
Table 20.3. Breakdown of Total Equipment Costs for the Air Stripping Process. The stripping column is the most
expensive equipment followed by the sour water heater. The sour water pump and tanks are the least expensive ones.
Equipment Percentage of Total Purchase Cost
Surge Tank 3.76%
Acid Storage Tank 0.13%
Acid Mixing Tank 1.99%
Sour Water Pump 2.07%
Sour Water Heater 25.52%
Air Heater 10.92%
Blower 5.87%
Stripping Column 49.72%

Section 20: Equipment Cost Summary
Frederick | Leach | Nayandi
84 | P a g e
Of the $1.48 MM required for all pieces of equipment for the air stripping process, the
stripping column is the most expensive equipment, comprising of 49.72% of the total cost followed
by the sour water heater and air heater at $0.38 MM (25.52%) and $0.16 MM (10.92%),
respectively. The acid storage tank and acid mixing tank are the least expensive due to their small
sizes.
Table 20.4. Breakdown of Total Equipment Costs for the Natural Gas Stripping Process. The sour water pump is the
most expensive equipment followed by the stripping column. The sour water pump and tanks are the least expensive
ones.
Equipment Percentage of Total Purchase Cost
Surge Tank 4.07%
Acid Storage Tank 0.14%
Acid Mixing Tank 2.15%
Sour Water Pump 2.23%
Sour Water Heater 27.58%
CH4 heater 14.26%
Stripping Column 49.56%
Of the $1.37 MM required for all pieces of equipment for the air stripping process, the
stripping column is the most expensive equipment, comprising of 49.56% of the total cost followed
by the sour water heater and natural gas heater at $0.38MM (27.58%) and $0.20 MM (14.26%),
respectively. The acid storage tank and acid mixing tank are the least expensive due to their small
sizes.
All in all, the total equipment cost for the air stripping process is higher than that for the
natural gas stripping process; the air stripping process requires an air blower unlike the natural gas
stripping process, and comprises of 10.92% of the total equipment cost.

Section 20: Equipment Cost Summary
Frederick | Leach | Nayandi
85 | P a g e
Section 20.1: Unit Costing Considerations
For the air stripping process, optimizations of the stripping column, air heater, and air
blower were done simultaneously. This is so because the variation of the number of stages affects
the amount of air required for stripping. For instance, reducing the number of stages to get a
column of reasonable height and price for successful stripping would require more air for stripping.
The increase in the amount of air required for stripping increased the price for the air blower and
air heater as they are highly dependent on the amount of air.
For the natural gas stripping, only the stripping column and natural gas heater were done
simultaneously because the process had a depressurizing valve instead of a blower.
Section 20.1.1: Air and Natural Gas Stripping Column
The air and natural gas stripping column were costed based on their diameters, tray types,
height, and material of construction. This was in accordance with equations provided in Chapter
16 of Product and Process Design Principles25 for a vertical pressure vessel with trays, and the
costing spreadsheet provided with the required equations. Stainless steel was chosen as the
material of construction in order to avoid corrosion in the stripping column as said in Section 18.
The inputs used in these equations were retrieved from the ASPEN process simulation results. The
input values used can be found in the specification spreadsheets in Section 19.
25 Seider, Warren D., et al. Product and Process Design Principles: Synthesis, Analysis, and Evaluation. 4th
ed., John Wiley & Sons Inc., 2017.

Section 20: Equipment Cost Summary
Frederick | Leach | Nayandi
86 | P a g e
Section 20.1.2: Sour Water and Air/ Natural Gas Heaters
Sour water and air/natural gas heaters were costed based on the material of construction,
flowrate of the sour water, air, and natural gas and the amount of heat required to achieve the
heating. The equations used in these calculations can be found in Chapter 16 of Product and
Process Design Principles.26 The inputs for these calculations are from the ASPEN process
simulation stream results presented in Section 15.
Section 20.1.3: Air Blower
The centrifugal air blower was costed based on its volumetric flow rate it delivers and the
inlet and outlet pressures as seen in Section 18. Its purchase and bare module costs were
determined using equations 16.30 and 16.32 in Chapter 16 of Product and Process Design
Principles27.
Section 20.1.4: Sour Water Pump
The centrifugal pump’s costing equations in Chapter 16 of Product and Process Design
Principles28 were used in order to design and determine the purchase and bare module cost. The
pump head and the flowrate through the pump were crucial in these calculations and they are
presented in Section 18. The other factors taken into consideration, like the rate of rotation and
material of construction, can be found in the specification sheets in Section 19.
26 Seider, Warren D., et al. Product and Process Design Principles: Synthesis, Analysis, and Evaluation. 4th
ed., John Wiley & Sons Inc., 2017. 27 Seider, Warren D., et al. Product and Process Design Principles: Synthesis, Analysis, and Evaluation. 4th
ed., John Wiley & Sons Inc., 2017. 28 Seider, Warren D., et al. Product and Process Design Principles: Synthesis, Analysis, and Evaluation. 4th
ed., John Wiley & Sons Inc., 2017.

Section 20: Equipment Cost Summary
Frederick | Leach | Nayandi
87 | P a g e
Section 20.1.5: Acid Storage Tank, Acid Mixing Tank, and Surge Tank.
The acid storage tank, T-101 and acid mixing tank, T-102, were each costed based on
purchase prices from INDCO, whose quotes can be found in the Appendix (A.4.2 and A.4.3), and
on the assumed volume of storage and mixing as described in Section 18.1.2 and Section 18.1.3.
The surge tank, T-100, was costed based on the surge tank pricing equation from Chapter 16 of
Product and Process Design Principles, 29 and on the assumed volume required as described in
Section 18.1.1.
29 Seider, Warren D., et al. Product and Process Design Principles: Synthesis, Analysis, and Evaluation. 4th
ed., John Wiley & Sons Inc., 2017.

Section 21: Fixed-Capital Investment Summary
Frederick | Leach | Nayandi
88 | P a g e
Section 21
Fixed-Capital Investment Summary

Section 21: Fixed-Capital Investment Summary
Frederick | Leach | Nayandi
89 | P a g e
In order to calculate the purchase cost of each major equipment, the Equipment Cost
Spreadsheet30 was used to calculate the bare module cost. The purchase cost was then calculated
based on the obtained bare module cost and the bare module factor. These costs can be seen in
Table 20.1 and Table 20.2 for the air stripping process and the natural gas stripping process. To
calculate the total capital investment, its components presented in Table 16.9 of Chapter 16 of
Product and Process Design Principles31 were first calculated. These components are shown in
Figure 21.1 below.
Table 21.1. Different Costs needed to calculate the Total Capital Investment32
30 Downey, B. K., Profitability Analysis Spreadsheet, University of Pennsylvania, Philadelphia (2008). 31 Seider, Warren D., et al. Product and Process Design Principles: Synthesis, Analysis, and Evaluation. 4th
ed., John Wiley & Sons Inc., 2017. 32 Seider, Warren D., et al. Product and Process Design Principles: Synthesis, Analysis, and Evaluation. 4th
ed., John Wiley & Sons Inc., 2017.

Section 21: Fixed-Capital Investment Summary
Frederick | Leach | Nayandi
90 | P a g e
The corresponding calculations for each of the costs mentioned in Table 21.1 are shown in
Table 21.2 and Table 21.3 for sour water stripping using air and sour water stripping using natural
gas, respectively.
Table 21.2 Total capital investment calculations for sour water stripping with air from equipment bare module costs33
33 Downey, B. K., Profitability Analysis Spreadsheet, University of Pennsylvania, Philadelphia (2008).

Section 21: Fixed-Capital Investment Summary
Frederick | Leach | Nayandi
91 | P a g e
Table 21.3 Total capital investment calculations for sour water stripping with natural gas from equipment bare module
costs34
From Table 21.2 and Table 21.3 above, it can be seen that stripping with natural gas
requires a total permanent investment of $131,914 less than stripping with air.
34 Downey, B. K., Profitability Analysis Spreadsheet, University of Pennsylvania, Philadelphia (2008).

Section 22: Operating Cost – Cost of Manufacture
Frederick | Leach | Nayandi
92 | P a g e
Section 22
Operating Cost – Cost of Manufacture

Section 22: Operating Cost – Cost of Manufacture
Frederick | Leach | Nayandi
93 | P a g e
Section 22.1: Variables Costs
Since the goal of our project is to strip ammonia and hydrogen sulfide and trace amount of
propane from sour water, we are not producing any product to be sold. We had contemplated
separating the ammonia from the extract gas phase and selling it, but the economics were not
favorable. For example, we would produce 120 tons of ammonia/year sold at $500/ton, which
corresponds to only $60,000/year (Appendix: A.1.4). This yearly revenue was determined to not
be enough per year to sell as the equipment required to remove it from the air stream would cost
more to buy, install, and operate than we would make selling it for the foreseeable future. Since
we are not selling any product, all variable operating costs were calculated based on the average
amount of sweet water produced in each case: stripping with air or stripping with natural gas. For
stripping with air, the basis for our raw materials and utilities calculations was 16,944.2 lb/hr of
sweet water. For stripping with natural gas, the basis was 16,883.1 lb/hr of sweet water.
In order to start operations, the project would have to pay a total of $7,475 for wastewater
and air quality permits as well as permit applications and operating fees as mentioned in Section
23.1.

Section 22: Operating Cost – Cost of Manufacture
Frederick | Leach | Nayandi
94 | P a g e
Section 22.1.1: Raw Materials
Table 22.1. Raw Materials Cost and Yearly Requirements for Sour Water Stripping Using Air
Table 22.2. Raw Materials Cost and Yearly Requirements for Sour Water Stripping Using Natural Gas (CH4)
For both air and natural gas stripping, sour water used in the process comes directly from
within the refinery at no cost. For air stripping, air used in the stripping process is free. For natural
gas stripping however, the natural gas is bought and sold to and from the refinery for $5.00/1,000
SCF35. Due to Henry’s law, 0.0019%, or 2,225 of the 117.1 MM pounds, of methane ends up in
the raffinate water. As a result, we will only sell back 99.9981% of the methane used to strip to
the refinery. Additionally, the process needs 1.8 lb/hr of sulfuric acid solution for air strip ping
compared to 1.65 lb/hr for natural gas stripping, which is bought at $0.1375/lb.
35 Seider, Warren D., et al. Product and Process Design Principles: Synthesis, Analysis, and Evaluation. 4th
ed., John Wiley & Sons Inc., 2017.

Section 22: Operating Cost – Cost of Manufacture
Frederick | Leach | Nayandi
95 | P a g e
Section 22.1.2: Utilities
Table 22.3 Utility Cost and Yearly Requirements for Sour Water Stripping Using Air
Table 22.4 Utility Cost and Yearly Requirements for Sour Water Stripping Using Natural Gas (CH4)
Natural gas used in fired heaters to heat sour water, air, and natural gas in different
scenarios before entering the stripper is purchased from the refinery at $5.00/1,000 SCF36. 427.9
lb/hr of natural gas is needed for fired heaters in sour water stripping with air whereas 251 lb/hr of
natural gas is needed for fired heaters in sour water stripping with natural gas.
The sum of variable costs from Table 22.1-22.4 is $0.301 MM for the air stripping process.
The total of $7.231 MM for the natural gas stripping process doesn’t include the natural gas sent
back to the refinery. This natural gas sent back totals $7.12 MM per year and this reduces the
annual variable costs for the natural gas stripping process to $0.201 MM per year. The $0.09 MM
difference in these annual variable costs is mainly due to a difference in the utility costs of these
two processes. This is mainly because for the air stripping process, more electricity is needed for
the blower in the air stripping, which is not present in the natural gas stripping process. The
36 Seider, Warren D., et al. Product and Process Design Principles: Synthesis, Analysis, and Evaluation. 4th
ed., John Wiley & Sons Inc., 2017.

Section 22: Operating Cost – Cost of Manufacture
Frederick | Leach | Nayandi
96 | P a g e
function of this air blower can be seen in Section 18.2.1 and the electricity requirement calculat ion
was based on equations in Chapter 16 of Product and Process Design Principles37.
Section 22.2: Fixed Costs
Table 22.5. Labor-related Operation Expenses for Sour Water Stripping with Air and Natural Gas (CH4)
For this process, we assumed there will be three eight-hour shifts and that we will have 2
operators and 2 engineers per shift. One operator will be in the control room another in the field
to make sure everything is going well and to assist the control room operator just in case something
needs to be adjusted. The field operator will also be in charge of loading raw materials. All the
remaining data used were taken from Chapter 17 of Product and Process Design Principles 38.
Table 22.6. Maintenance Expenses for Sour Water Stripping with Air and Natural Gas (CH4)
37 Seider, Warren D., et al. Product and Process Design Principles: Synthesis, Analysis, and Evaluation. 4th
ed., John Wiley & Sons Inc., 2017. 38 Seider, Warren D., et al. Product and Process Design Principles: Synthesis, Analysis, and Evaluation. 4th
ed., John Wiley & Sons Inc., 2017.

Section 22: Operating Cost – Cost of Manufacture
Frederick | Leach | Nayandi
97 | P a g e
Table 22.7. General Expenses for Sour Water Stripping with Air and Natural Gas (CH4)
The sum of fixed expenses in Tables 22.5-22.7 gives $3.19 MM in annual fixed costs for
the air stripping process and $3.17 MM for natural gas. They are almost similar because the
general expenses, maintenance, and labor-related operations will be similar.

Section 23: Other Important Considerations
Frederick | Leach | Nayandi
98 | P a g e
Section 23
Other Important Considerations

Section 23: Other Important Considerations
Frederick | Leach | Nayandi
99 | P a g e
Section 23.1: Environmental Review
Environmental considerations for this project are of paramount importance. The
harmfulness of the contaminants in water to humans, marine life, and the atmosphere is the reason
for the sour water stripping technology. In fact, the design of the process and stripper are driven
by the environmental regulations. Federal agencies such as the Environmental Protection Agency
(EPA) and state agencies like the Department of Environmental Protection (DEP) issue regulat ions
to plants and refineries that limit the amount harmful, toxic, or cancerous pollutants that can be
released into the environment. The EPA identifies harmful pollutants but lacks the budget and
bandwidth to monitor the emissions of all facilities.39 Therefore, the EPA requires state agencies
to enforce the national emission limits through a State Implementation Plan (SIP) submitted to the
EPA for approval.40 The state agencies also have the authority to create additional emission
restrictions so long as they meet minimum restrictions imposed by the EPA. These regulations are
made clear in an operating permit issued by the state regulatory agency.41 The penalties associated
with noncompliance and permit violations can be severe, and include fines, imprisonment, and
even plant termination.42 43 There are two major environmental criteria to satisfy in order to
consider the project successful: achieving acceptable emissions in the water and atmosphere.
39 Frederick, Andrew E, and Edward Wiener. “Emission Limits of Ammonia in Philadelphia.” 16 Apr.
2018. Edward is an Environmental Engineer for Philadelphia Air Management Services. 40 South, Mia. “Approved Air Quality Implementation Plans.” EPA, Environmental Protection Agency, 29
Sept. 2017, www.epa.gov/air-quality-implementation-plans/approved-air-quality-implementation-plans. 41 Frederick, Andrew E, and Robert Schlosser. “Emission Limit for Ammonia.” 12 Apr. 2018.Robert is a
Principal Project Manager at IES Engineers 42 “CWA Section 404 Enforcement Overview.” EPA, Environmental Protection Agency, 17 Nov. 2017,
www.epa.gov/cwa-404/cwa-section-404-enforcement-overview. 43 “Penalties Associated with Violating U.S. Environmental Laws.” EnviroGuide, Mar. 2013,
enviroguides.us/content/%E2%80%93penalties-associated-violating-us-environmental-laws.

Section 23: Other Important Considerations
Frederick | Leach | Nayandi
100 | P a g e
To begin the environmental analysis, the toxicity of the pollutants dissolved in water will
be investigated first. The two pollutants that could harm the environment and require in-depth
analysis in this project are ammonia and hydrogen sulfide.
The primary objective behind the project is to convert the large amounts of ammonia (300-
3,000 ppm) dissolved in water to the gaseous phase. When dissolved in water, ammonia mostly
becomes its ionized form of ammonium. Ammonium is acutely and chronically toxic to fish and
other marine organisms. Furthermore, it can easily be oxidized to nitrite which is also dangerous
to marine life. It has been shown that the lethal concentration of ammonia in water ranges from
0.2 to 2.0 ppm44 for various fish species. Ammonium is dangerous to humans as well but only for
long term consumption at moderate levels. Although the EPA has not established a maximum
contaminant level of ammonia in drinking water, the National Science of Academy recommends
a standard in drinking water of 0.5 ppm because long term ingestion of water at 1 ppm can cause
adverse health effects.45 Hydrogen sulfide is also harmful to the environment as a gas dissolved in
water. It is extremely toxic to life, even in small concentrations.46 Additionally, it is highly
corrosive and can damage steel on boats or docks in the water.47
Because of the damaging effects of ammonia and hydrogen sulfide in water, state and
federal agencies have issued specific emission limits for pollutants in water. The Clean Water Act
(CWA), administered by the EPA, is the primary federal law in the United States governing water
pollution. It was first enacted in 1948 and completely rewritten in 1972. The CWA provides
guidelines for state agencies to create permits to regulate industrial and municipal emissions. One
44 Oram, Brian. “Ammonia in Groundwater, Runoff, and Streams.” Water Research Center, June 2014,
www.water-research.net/index.php/ammonia-in-groundwater-runoff-and-streams. 45 Health Effects Information: Ammonia. Public Health Office, 2000, Health Effects Information: Ammonia. 46 QMax Solutions. “Overview of H2S.” Tech Bulletin #13. 47 Vaquer-Sunyer, Raquel. “Ecosystem Impacts of Hypoxia: Thresholds of Hypoxia and Pathways to
Recovery.” Research Gate, 2011.

Section 23: Other Important Considerations
Frederick | Leach | Nayandi
101 | P a g e
important divergence within the CWA that will determine a refinery’s guidelines is the
distinguishment between a point and a non-point source.48 According to the CWA, a point source
is defined to be “any discernible, confined, and discrete conveyance from which pollutants are or
may be discharged”.49 Oil refineries and other industrial facilities are thus classified as point
sources. Point sources must adhere to and obtain a permit from the National Pollutant Discharge
Elimination System (NPDES) before discharging pollutants to surface waters. The NPDES permit
mandates that states investigate two areas to control emissions: technology based limitations and
water quality based limitations. Technology based limitations refer to the technological and
economic ability of dischargers in the same category to control the discharge of pollutants and
water quality based limitations refer to the current state of pollution of the body of water receiving
the discharge. 50
Because different bodies of water contain various pollutants with a wide range of
concentrations, states are authorized to create their own limits to which industrial facilities must
adhere. For the purposes of this project, we will assume that the plant will be near Philadelphia
and have access to the Delaware River. Because the Delaware River was bustling with factories
and refineries after the Industrial Revolution, it was subject to a lot of polluted abuse. In fact,
according to a newspaper article from 1940, the “rotten egg” smell of the water due to hydrogen
sulfide was so strong that it threatened the usefulness of Philadelphia as a port.51 For this reason,
the Delaware River Basin Commission (DRBC) was founded in 1961 as an interstate compact
48 “Key Federal Laws: Clean Water Act.” Chem Alliance, 2016,
www.chemalliance.org/tools/?subsec=25&id=6922. 49 “Clean Water Act, Section 502 General Definitions.” EPA, Environmental Protection Agency, 15 Sept.
2016, www.epa.gov/cwa-404/clean-water-act-section-502-general-definitions. 50 “Key Federal Laws: Clean Water Act.” Chem Alliance, 2016,
www.chemalliance.org/tools/?subsec=25&id=6922. 51 “Usefulness of City as a Port Threatened by River Fumes.” The Philadelphia Record, 14 Aug. 1944.

Section 23: Other Important Considerations
Frederick | Leach | Nayandi
102 | P a g e
between New York, New Jersey, Pennsylvania, and Delaware to ensure fair treatment of the river
by all parties. Based on the technology available to limit emissions into the water and the current
state of the river, the DRBC has set the limit for the emission of ammonia dissolved in water at an
average of 20 ppm over a 30 day period.52 The DRBC has not set a limit on the amount of
hydrogen sulfide that can be released into the Delaware River, but we will assume that it is
negligible beyond the detectable limit, or < 0.1 ppm.53 These numbers are in line with the literature
from a 1984 breakthrough report from Patricia Mackenzie listed in Table 24.154, which also shows
the effluent limits if the water stream were to be recycled and used elsewhere in the plant.
Table 23.1: Literature standards for Sour Water Stripping Effluent. King, et al., 1981.
For the purpose of this project we will solely be analyzing the option of releasing the water
into the river rather than recycling it to the cooling tower as we do not have enough information
regarding quantity of water needed for the cooling tower and composition
52 “18 CFR Part 410.” Delaware River Basin Commission, 4 Dec. 2013, p. 111. 53 Wanek, Rick. “Monitoring H2S to Meet New Exposure Standards.” Occupational Health & Safety, 1 Sept.
2011, ohsonline.com/articles/2011/09/01/monitoring-h2s-to-meet-new-exposure-standards.aspx. 54 Mackenzie, Patricia Denise, and C. J. King. "Simultaneous stripping and solvent extraction for the recovery
of ammonia and acid gases from wastewaters." (1984).

Section 23: Other Important Considerations
Frederick | Leach | Nayandi
103 | P a g e
requirements. Additionally, recycling sweeter water to the cooling tower is traditionally done in
arid climates with low-volume waterways and expensive water utilities. Having analyzed the tight
emission limits for ammonia and hydrogen sulfide in water, we will now look at the emission
Gaseous ammonia’s most popular application is in the agriculture industry. In fact, over 90%55 of
all ammonia in the atmosphere comes from ammonium nitrate, which is used as a fertilizer and
ammonia is produced in large amounts from cow excrement. By itself, ammonia is not very
dangerous. There are few, if any, reports of death via exposure to high amounts of ammonia 56.
However, people are susceptible to irritation at concentrations as low as 30 ppm. The
Occupational Safety and Health Administration (OSHA) has set an 8 hour exposure limit to
ammonia at 25 ppm and a 15 minute exposure limit to ammonia at 35 ppm (Appendix: A.6.1).
These limits are for workers dealing with the chemical in close quarters and confined spaces. In
the expansive atmosphere, ammonia is much less dangerous to humans and the environment.
Hydrogen sulfide on the other hand is extremely hazardous. It is a flammable gas that can
irritate the lungs, eyes, and nose and cause nausea and confusion at low levels of 10 ppm
(Appendix: A.6.1). Being exposed to hydrogen sulfide at high levels will result in unconsciousness
and sometimes death. Hydrogen sulfide has a very strong “rotten-egg” scent at 0.1 ppm so it can
be detected, but at higher concentrations the smell is undetectable and the gas can lead to instant
death. OSHA has set the exposure limit to hydrogen sulfide at 1 ppm averaged over an 8 hour
work shift.
55 Phillips, Jennifer. Control and pollution prevention options for ammonia emissions. No. PB-95-241790/XAB.
VIGYAN, Inc., Vienna, VA (United States), 1995. 56 “Ammonia Acute Exposure Guideline Levels.” Acute Exposure Guideline Levels for Selected Airborne
Chemicals: Volume 6., U.S. National Library of Medicine, 1 Jan. 1970,
www.ncbi.nlm.nih.gov/books/NBK207883

Section 23: Other Important Considerations
Frederick | Leach | Nayandi
104 | P a g e
With respect to ammonia emission limits, the EPA has not imposed national regulations as
to how much ammonia a refinery or plant can release.57 While a lot of environmentalists called
for the EPA to regulate ammonia under the Clean Air Act, the EPA resisted to include it because
of the uncontrollable amount that is released from livestock.58 Environmentalists urging for the
regulation of ammonia is supported by the amount of ammonia refineries release into the
atmosphere. In a report on all refineries across the U.S., ammonia was the highest emitted pollutant
in units of pounds for every year from 2008-2012.59 Roughly 5.5 million pounds of ammonia was
released into the atmosphere by refineries between 2008 and 2012, more than any other pollutant.
Although ammonia is currently unregulated by federal agencies, there has been growing
concern over its harmful potential to the environment. Studies have been conducted showing
ammonia’s role in forming particulate matter of 2.5 microns or less.60 61 In 2007, the EPA deemed
that states have the option to regulate precursors to particulate matter in non-attainment areas, or
areas where the air quality is worse than the National Ambient Air Quality Standards (NAAQS).62
As a result, state agencies have been stringent on imposing limits on the amount of ammonia
refineries can release. An example of the state regulating refineries can be seen with the Marcus
Hook refinery. Marcus Hook was a Sunoco operated refinery that produced 178,000 barrels of oil
per day located 20 minutes outside of Philadelphia. From the excess amounts of ammonia that the
refinery was producing, the Pennsylvania DEP implemented ammonia emission limits on the
57 Shaver, Sally. “The Regulation of Ammonia Emissions in the United States.” U.S . EPA, 18 July 2008. 58 Baise, Gary. “More EPA Regulation of Ammonia?” Farm Futures, 6 Oct. 2016,
www.farmfutures.com/blogs-more-epa-regulation-ammonia-9456. 59 McAngus, Jess. Refinery Air Emission Metrics. Spirit Environmental, LLC, 2013,Refinery Air Emission
Metrics. 60 “2014 National Emissions Inventory (NEI) Data.” EPA, Environmental Protection Agency, 2 Mar. 2018,
www.epa.gov/air-emissions-inventories/2014-national-emissions-inventory-nei-data. 61 “Agricultural Air Pollution Fact Sheet.” Texas A&M Center for Agricultural Air Quality Engineering &
Science. 62 Mathias, Scott. “Managing Air Quality: State Implementation Plans.” U.S. EPA, 3 Oct. 2007.

Section 23: Other Important Considerations
Frederick | Leach | Nayandi
105 | P a g e
refinery. These limits were strict. The refinery could not release more than 8.5 pounds per hour
of ammonia averaged monthly and could not release more than 37.3 tons over any 12 month period.
These numbers are significantly less than the 122 tons/year and 29.6 lb/hr of ammonia that the
design with air as a stripping agent is estimated to release. This permit was issued in 2008 but the
refinery was shut down in 2011 for deteriorating market conditions (Appendix: A.3.2). While the
DEP was quick to regulate ammonia emissions in some refineries, it did not do so in others. For
the United Refining plant in Warren, PA, the DEP made no effort to regulate ammonia emissions .
The permit was issued in 2012 and contains no ammonia regulations (Appendix: A.3.1). The
reason for ammonia regulations for some refineries can most likely be attributed to their location.
The Marcus Hook refinery is located in Delaware County, which is one of 5 non-attainment areas
for particulate matter in Pennsylvania. The Warren refinery is in Warren County and is an
attainment area, or an area where the surrounding air is better than the NAAQS standards
(Appendix: A.3.1). Philadelphia is an attainment area, so the DEP does not have the authority to
regulate ammonia emissions. However, it is located adjacent to Delaware County, so a
deterioration in air quality over time can be expected.
Because of the increasing concern over ammonia as a precursor for particulate matter and
Philadelphia’s location near a non-attainment area, it is important to consider a control system that
can reduce emissions for gaseous ammonia. According to the EPA, the packed tower scrubber has
an efficiency of 99% in removing ammonia.63 With the scrubber however, ammonia would be
transferred back to the liquid phase. This ammonia-concentrated water would then have to be sent
to a biopond for further treatment before being released into the river. Pursuing a scrubber
63 Phillips, Jennifer. Control and pollution prevention options for ammonia emissions. No. PB-95-
241790/XAB. VIGYAN, Inc., Vienna, VA (United States), 1995.

Section 23: Other Important Considerations
Frederick | Leach | Nayandi
106 | P a g e
equipment would incur an additional $50,000 in capital cost64 for the scrubber and operating costs
for water treatment. Ammonia control via the formation of ammonium phosphates was
investigated but ultimately rejected due to the costs of separating, condensing, and reacting the
ammonia, which would certainly be more than the $60,000 worth of ammonia the process could
produce annually (Appendix: A.1.4).
Another option is to simply recycle the contaminated air and use it as oxygen for the
combustion of the natural gas. This option has several benefits over releasing it to the atmosphere.
First, it avoids the costs mentioned above in case ammonia regulations become stricter. Secondly,
it has environmental benefits. The addition of water and ammonia to the combustion of natural
gas reduces the production of NOx gases, 65 one of the 6 Criteria Pollutants in the Clean Air Act.66
The extract air stream being recycled to the combustion of natural gas would have both of these
components (Table 15.1). Since natural gas requires 19 times as much air as methane, the
hydrogen sulfide would be diluted by the excess air, and the ammonia would be introduced to
reduce NOx formation. And if our refinery is burning 5.8 billion SCF methane per year, our annual
air feed to the furnaces will be in excess of 100 billion SCF, far more air than is being used in our
stripping process. The recycled air would be rich with ammonia and reduce the refinery’s need to
purchase outside ammonia.
Unlike using air as a stripping agent, there is only one destination option for the natural gas
extract stream. If natural gas were used as the stripping agent, the extract stream would be directed
back into the incoming natural gas stream to eventually be burned for heat in the refinery heaters.
64 Frederick, Andrew E, and Sarah. “Ammonia Scrubber Price.” 5 Apr. 2018. Sarah is an ammonia scrubber
saleswoman at Heil Process Equipment 65 Nakhamkin, M., et al. Combustion Studies of Natural Gas and Syn-Gas with Humid air. Technical report,
EPRI, Palo Alto CA, USA, 1994. 66 “Criteria Air Pollutants.” EPA, Environmental Protection Agency, 8 Mar. 2018, www.epa.gov/criteria-air-
pollutants.

Section 23: Other Important Considerations
Frederick | Leach | Nayandi
107 | P a g e
In 2016, refineries on the east coast used an average of 5,813,400,000 SCFY natural gas in their
processes (Appendix: A.1.1).67 The amount of natural gas required to strip the sour water in our
design is 1,161,000,000 SCFY, which constitutes 20% of the total used by the refinery (Appendix:
A.1.1).68 Although the ammonia in the extract phase would be an average of 1670 ppm, it would
be diluted to a concentration of 334 ppm of ammonia and 0.99 ppm of hydrogen sulfide once
reintroduced to the refinery feed. The presence of ammonia and water vapor in the natural gas to
be combusted work to reduce the amount of NOx produced in the fired heaters. While the presence
of hydrogen sulfide in the natural gas to be burnt will react to form SOx, industrial fired heaters
have systems in place to reduce the amount of SOx in the flue gas. Utility natural gas is considered
sweet because it contains less than 8 ppm hydrogen sulfide, above which it is considered sour.69
The average amount of hydrogen sulfide in the extract gas is under 5 ppm, and under 1 ppm after
reintroduction to the feed natural gas. The amount of hydrogen sulfide introduced to the natural
gas from the stripping process is less than the amount that the fired heater flue gas cleaning systems
are designed to handle. Therefore, the natural gas stripping process would not contribute a
significant amount of pollutants to the environment, and in fact would work to reduce NOx
pollutants.
In recent years, east coast refineries have significantly increased their consumption of
natural gas to higher levels than ever before.70 The increase can be partially attributed to the
67 U.S. Energy Information Administration. “Fuel Consumed at Refineries.” East Coast (PADD 1) Fuel
Consumed at Refineries, U.S. Department of Energy, 21 June 2017,
www.eia.gov/dnav/pet/pet_pnp_capfuel_dcu_r10_a.htm. 68 U.S. Energy Information Administration. “Fuel Consumed at Refineries.” East Coast (PADD 1) Fuel
Consumed at Refineries, U.S. Department of Energy, 21 June 2017,
www.eia.gov/dnav/pet/pet_pnp_capfuel_dcu_r10_a.htm. 69 NaturalGas.org website page Processing Natural Gas. 70 U.S. Energy Information Administration. “Fuel Consumed at Refineries.” East Coast (PADD 1) Fuel
Consumed at Refineries, U.S. Department of Energy, 21 June 2017,
www.eia.gov/dnav/pet/pet_pnp_capfuel_dcu_r10_a.htm.

Section 23: Other Important Considerations
Frederick | Leach | Nayandi
108 | P a g e
increase in natural gas production in the northeast from the Marcellus Shale, making natural gas
more economical to purchase than other fuel sources for fueling steam boilers and other process
units. The continued production of natural gas from shale in the northeast ensures that natural gas
will continue to be used by refineries as a fuel, providing the natural gas stripping process with
enough stripping agent to continue to be viable for the foreseeable future.
While the extract streams of the natural gas-fed and air-fed stripping columns have
identical environmental consequences, the raffinate stream for a natural-gas fed stripping column
has a slightly worse environmental impact. From Henry’s Law, the sour water absorbs an average
of 16 ppm when natural gas is used as the stripping agent. Concentrations of methane at this level
are not harmful to the surrounding aquatic ecosystems.
In order to obtain a wastewater and air quality permit, fees must be paid to the state agency.
For an air quality permit, the fees are $5,300 for a permit application, $375 for permit processing,
and $375/yr for operating fees.71 For a wastewater permit, the fees are $1,500 for a permit
application and $100 for every disturbed acre of land. Combined, the fees are $7,475 in year 0
(assuming the sour water stripper technology will disturb 3 acres of land) and $375 per year for
operating costs.72
Section 23.2: Process Control Systems
There are several control systems implemented in the sour water stripping process. They
can all be seen in Section 15, in the Process Flow Diagrams (Figures 15.1 and 15.2). The level of
detail given to the control system formulation is related to how specialized and integral it is in the
71 “Subchapter I. Plan Approval And Operating Permit Fees.” Pennsylvania Code,
www.pacode.com/secure/data/025/chapter127/subchapItoc.html. 72 “The Pennsylvania Code.” Permit Applications and Fees.,
www.pacode.com/secure/data/025/chapter102/s102.6.html.

Section 23: Other Important Considerations
Frederick | Leach | Nayandi
109 | P a g e
process. The blower and valve control computers and formulae are the most complex in the
process, and very accurately calculate the amount of stripping agent required as a function of the
feed sour water. The other four control systems, surge tank level, recycle, humidity, and
temperature do not require as detailed or complex of a control system because they are less unique
to the process, and they each depend on only one variable.
Section 23.2.1: Level Control System (T-100, M-100, LC, V-100)
The Sour Water Surge Tank is fitted with a level meter, level controller, and control valve
to maintain the height of liquid in the vessel. The height of liquid in the tank will be mainta ined
at 80% capacity with a proportional controller. This amount of liquid equates to nearly an hour
(0:53:20) of holdup, and is low enough that it would take 10 minutes of maximum flow, and no
control system action, to overflow the tank.
Section 23.2.2: Recycle Control System (M-100, RC, S-100, T-100)
The recycle control system is engaged when the sour water flow rate at the flow meter
drops below the set point value of 30 GPM, the minimum flow rate in the column before tray
weeping occurs. This will activate the splitter valve on the raffinate to return enough water back
to the surge tank to bring the sour water flow back up to 30 GPM. While this control system is
engaged, the Blower Control Computer (or Valve Control Computer) will ignore pH Meter 1, and
will calculate the amount of stripping agent required based on the sour water flow rate, and
assuming an ammonia concentration of 3000 ppm. This is because the pH Meter will give readings
influenced by more dissolved components than just ammonia, so the ammonia concentration
calculation will be incorrect.

Section 23: Other Important Considerations
Frederick | Leach | Nayandi
110 | P a g e
Section 23.2.3: Blower Control System (M-101, M-102, BC | CP, B-100)
The feed forward blower control system calculates and specifies the amount of air required
to strip the sour water given the flow rate and ammonia concentration. From 9 combinations of
ASPEN inputs and outputs, calculated at minimum, average, and maximum values for both input
variables (Appendix: A.2.3), an equation (Equation 18.1) was fit to the data to yield an air flow
rate at least as high as the minimum simulation flow rate. Calculations were made using the
qualities (density, temperature, etc.) of sour water at the measurement conditions Stream 2 (Figure
15.1), and estimates the amount of air needed with an overshoot between 0.04% and 3.24%. The
equation has a small overshoot buffer so that the water will never be stripped to less-than-required
specifications, although a calculated value marginally below the required air would not be an issue
because the specifications in ASPEN are to 19 ppm instead of 20, giving a small buffer zone if the
amount of air fed to the column is slightly too low. Below is Equation 18.1:
𝑽 = ((√𝑪 ∗𝑭𝑭
24+(15000−𝑭𝑭)
12.5−330 ∗ (
𝑪
300)1.5
+555 + (𝑭𝑭− 20000) ∗ 0.026) ∗ (300
𝑪)0.2
+ (𝑪
300)
1
3+
(29
𝑭𝑭∗𝑪
4)19.15
+ ((15000
𝑭𝑭)0.1
∗𝑪
3)+
16000−𝑭𝑭
1.25+ (
300
𝑪)3
∗ 58 ∗𝐹𝐹−14000
115+𝑎𝑏𝑠 |
𝑭𝑭−19100
4.3|)∗ 0.8802,
where V is the air flow required in lb/hr, C is the concentration of ammonia in ppm, and FF is the
feed sour water flow rate in lb/hr (or 498.65*GPM at flowmeter conditions). This feed-forward
control equation will be utilized by the blower control computer to set the blower to the appropriate
specification based on the sour water flow rate.
Figures 23.1 and 23.2 below represent the surface created by graphing the blower control
equation (Equation 18.1). The axes on the horizontal plane represent the variability of the sour
water flow rate (right horizontal axis) and the variability of sour water ammonia concentration (left
horizontal axis). The vertical axis represents the amount of stripping agent (air) required to

Section 23: Other Important Considerations
Frederick | Leach | Nayandi
111 | P a g e
satisfactorily purify the sour water at a given point on the horizontal plane. The color bars
represent the amount of stripping agent required in lb/hr. In figure 23.1, the turned-up corners
indicate that the control equation is not ideally optimized, but the buffer systems in place
(overestimation of control equation, and specification for 19 ppm ammonia) work to ensure that
enough air is being provided to the stripping process. This 3D representation of the equation
surface shows the complexity of the control equation, and how complicated the relationship of the
sour water variables are to the amount of stripping agent required.
Figure 23.1: 3D Representation of the Equation 18.1 Surface for Air Stripping. Color bar in units of lb/hr.
Figure 23.2 shows a top-down view of the control equation surface. While less complex,
this figure more clearly shows the trends of the relationships. The color bar shows the amount of
stripping agent required in units of lb/hr.

Section 23: Other Important Considerations
Frederick | Leach | Nayandi
112 | P a g e
Figure 23.2: 2D Representation of Equation 18.1 Surface for Air Stripping. Color bar in units of lb/hr.
Section 23.2.4: Valve Control System (M-101, M-102, VC | CP, V-101)
The feed forward valve control system calculates and specifies the amount of natural gas
required to strip the sour water given the flow rate and ammonia concentration. From 9
combinations of ASPEN inputs and outputs, calculated at minimum, average, and maximum
values for both input variables (Appendix: A.2.3) an equation (Equation 18.2) was fit to the data
to yield a natural gas flow rate at least as high as the minimum simulation flow rate. Calculat ions
were made using the qualities (density, temperature, etc.) of sour water at the measurement
conditions Stream 2 (Figure 15.2), and estimates the amount of natural gas needed with an
overshoot between 0.01% and 3.17%. The equation has a small overshoot buffer so that the water
will never be stripped to less-than-required specifications, although a calculated value margina l ly
below the required natural gas would not be an issue because the specifications in ASPEN are to

Section 23: Other Important Considerations
Frederick | Leach | Nayandi
113 | P a g e
19 ppm instead of 20, giving a small buffer zone if the amount of air fed to the column is slightly
too low. Below is Equation 18.2:
𝑽 = (((𝑪∗𝑭𝑭
1500+15000−𝑭𝑭
12.5− 330 ∗ (
𝑪
300)1.5
+330+ (1000− 𝑪) ∗ 6 ∗ (𝑭𝑭−17200
10000)) + 6065) ∗ 0.96−
(15000
𝑭𝑭)1.5
∗ 𝑪 ∗ 5 +(900−𝑪)∗𝑭𝑭
20000−𝑎𝑏𝑠|1600− 𝑪| ∗ (
𝑭𝑭
27000)3
+ (15000
𝑭𝑭)4
∗ 3300 +𝑪
3∗25000
𝑭𝑭) ∗
(14+300
𝑪)
14.3,
where V is the natural gas flow required in lb/hr, C is the concentration of ammonia in ppm, and
FF is the feed sour water flow rate in lb/hr (or 498.65*GPM at flowmeter conditions). This feed-
forward control equation will be utilized by the valve control computer to set the blower to the
appropriate specification based on the sour water flow rate.
Figures 23.3 and 23.4 below represent the surface created by graphing the valve control
equation (Equation 18.2). The axes on the horizontal plane represent the variability of the sour
water flow rate (right horizontal axis) and the variability of sour water ammonia concentration (left
horizontal axis). The vertical axis represents the amount of stripping agent (natural gas) required
to satisfactorily purify the sour water at a given point on the horizontal plane. The color bars
represent the amount of stripping agent required in lb/hr. In figure 23.3, the smooth contours of
the surface indicate that the control system is well-optimized for the entire range of inputs. This
3D representation of the equation surface shows the complexity of the control equation, and how
complicated the relationship of the sour water variables are to the amount of stripping agent
required.

Section 23: Other Important Considerations
Frederick | Leach | Nayandi
114 | P a g e
Figure 23.3: 3D Representation of the Equation 18.2 Surface for Natural Gas Stripping. Color bar in units of lb/hr.
Figure 23.4 shows a top-down view of the control equation surface. While less complex,
this figure more clearly shows the trends of the relationships. The color bar shows the amount of
stripping agent required in units of lb/hr.
Figure 23.4: 2D Representation of Equation 18.2 Surface for Natural Gas Stripping. Color bar in units of lb/hr.

Section 23: Other Important Considerations
Frederick | Leach | Nayandi
115 | P a g e
Section 23.2.5: Humidity Control System (M-104, HC, I-100)
The feedback humidity control system regulates how much steam is injected into the
stripping agent gas stream to maintain a water vapor concentration of 10% by mass in the stripping
agent fed to the column.
Section 23.2.6: Temperature Control System (M-105, TC, F-101)
The feedback temperature control system regulates the heat duty of the fired heater to
maintain a temperature of 190°F in the stripping agent fed to the column
Section 23.3: Safety and Health Concerns
Ammonia and hydrogen sulfide are dangerous to humans in the gaseous phase. As
mentioned above, the OSHA 8 hour limit exposure limit to ammonia and hydrogen sulfide is 25
ppm and 1 ppm respectively. Exposure to 300 ppm of ammonia 100 ppm of hydrogen sulfide is
immediately dangerous to life and health according to the National Institute for Occupational
Safety and Health (NIOSH). Because such workplace limits are set, continuously monitor ing
devices must be installed to alert the operators of unsafe conditions.
Operators must be equipped with personal protective equipment (PPE) to prevent harmful
encounters with the chemicals. This PPE includes wearing gloves and clothing that cannot be
permeated or degraded by hydrogen sulfide, wearing non-vented, impact resistant goggles, and a
full facepiece powered-air purifying respirator if levels of hydrogen sulfide reach greater than 1
ppm or if levels of ammonia reach greater than 25 ppm. Because the gases are irritants to eyes
and skin, eyewashes and showers must be available on the floor in case of emergencies. In the
case of spills or leaks, the immediate area will be ventilated to disperse the gases. Additiona lly,

Section 23: Other Important Considerations
Frederick | Leach | Nayandi
116 | P a g e
carbon dioxide fire extinguishers must be handy to put out potential fire caused by hydrogen
sulfide.
Accidental large scale releases of ammonia due to equipment malfunction or failure have
caused major problems in the past. In August of 2010, a refrigeration warehouse released 32,000
pounds of ammonia from a cracked pipe. The ammonia travelled over a shipyard that caused 152
people to be treated at hospitals. These large scale releases can also be costly. The EPA required
third party audits to conduct pipe testing and test for compliance at Tyson Foods following mult ip le
violations and a large scale leak at the plant, costing Tyson Foods $3.95 million.73 To mitiga te
these accidental release, the EPA requires plants to implement a Risk Management Program.
Emitting more than 10,000 pounds74 of ammonia through a leak violates 40 CFR part 68, the
chemical accident prevention provision. To avoid these catastrophic failures, the refinery is
responsible for assessing the potential release impacts, steps to prevent releases, and a plan for
emergency response to releases.
If natural gas were used as the stripping agent instead of air, additional safety precautions
would have to be taken. While methane can cause irritation when inhaled, its direct threat to
human safety is that it decreases the amount of oxygen in the air when present in large amounts .
For this reason, careful monitoring must be done to ensure that there is a minimum of 19.5%
oxygen concentration by volume. An additional danger of using methane over air is that it is
highly flammable. For this reason, it is important to avoid accumulation of gas above the lower
explosive limit (LEL) which is 5%. Additionally, since the natural gas feed pressure is 500 psig,
the area between the utility source and the natural gas control valve must be demarcated as a high
73 “40 CFR Part 68.” Environmental Protection Agency: Accidental Release Prevention Program, vol. 81, no.
49, 14 Mar. 2016. 74 “40 CFR Part 68.” Environmental Protection Agency: Accidental Release Prevention Program, vol. 81, no.
49, 14 Mar. 2016. Appendix A

Section 23: Other Important Considerations
Frederick | Leach | Nayandi
117 | P a g e
pressure zone. To mitigate the risk associated with using natural gas as the stripping agent, some
safety precautions should be installed. These include continuously monitoring leak devices to
check for any methane leaks, gas sampling to ensure quality of natural gas and indicate corrosion
of pipe, and the removal of any possible ignition sources near the natural gas source.
Another general safety concern involves water above scalding temperature. To control the
threat of this hot water, the sour pump heater will be isolated and caged to prevent operators from
coming too close. Administrative “warning” signs will also be placed nearby to indicate the danger
of hot surfaces.75
One preventative measure to ensure proper the functioning of measuring devices is the
installation of duplicate pH meters and thermocouples. These devices are susceptible to corrosion
and declining performance over time. Having two of each device will alert the operators of any
malfunctions and ensure proper readings.
Section 23.4: Boiler Feed Water (BFW) Considerations
The use of the raffinate, or sweet water, as Boiler Feed Water was considered and
ultimately rejected. Boiler Feed Water is typically bought from the utilities at $5/1000 gallons and
used as steam generation from the boilers. Boilers require ammonia and hydrogen sulfide
concentrations below detectable limits, or less than 0.1 ppm.76 Stripping the ammonia
concentrations to below 0.1 ppm would require a bigger column, the price of which would be far
from covered by the $5 savings per 1000 gallons. Rather than stripping the ammonia to 0.1 ppm,
it was proposed that the effluent raffinate stream could be sent to a biopond for further purificat ion.
75 “Critical Risk: Hot Water and Steam.” MINTRAC and AMPC, June 2014. 76 Frederick, Andrew E, and Tyler McDevitt. “Sour Water Process Engineer Consultation.” 12 Apr.
2018. Tyler is a process engineer at Phillips 66 refinery.

Section 23: Other Important Considerations
Frederick | Leach | Nayandi
118 | P a g e
The transportation alone to and from the pond would exceed $5/1000 gallons, not to mention the
cost of the treatment itself. In the end, it is not economically viable to reuse the raffinate as boiler
feed water.

Section 24: Profitability Analysis – Business Case
Frederick | Leach | Nayandi
119 | P a g e
Section 24
Profitability Analysis – Business Case

Section 24: Profitability Analysis – Business Case
Frederick | Leach | Nayandi
120 | P a g e
For the air stripping process, of $2.00 MM total capital investment, $0.23 MM is the
present value of the working capital at 15% nominal interest rate. This working capital is
composed of cash reserves and accounts payable for purchasing raw materials. On the other hand,
of the $1.4 MM total capital investment of the natural gas stripping process, $0.25 MM is the
present value of the working capital at 15% nominal interest rate and has the same composition as
in the air stripping process.
Our team estimated the value of this project over a nineteen-year lifespan. The first year
is allocated to process design and the second year to construction. For the lifespan of this project,
the stripping process will be carried out at 100% of design capacity and it will be started at 100%
of production capacity. This is because, as the main objective of this project is to strip ammonia
and hydrogen sulfide from sour water to the acceptable concentrations, the process can’t be carried
out at a percentage of design capacity less than 100% because then the acceptable concentrations
would not be reached.
Table 24.1. Working Capital Requirements for the Air Stripping Process 77
77 Downey, B. K., Profitability Analysis Spreadsheet, University of Pennsylvania, Philadelphia (2008).

Section 24: Profitability Analysis – Business Case
Frederick | Leach | Nayandi
121 | P a g e
Table 24.2. Working Capital Requirements for the Natural Gas Stripping Process78
Table 24.3 and Table 24.4 show the profitability metrics of the stripping process using air
and natural gas respectively in the third year, even though the first year the plant will already be
operating at full capacity. The net present value (NPV) for the 19 years of the air stripping process
is -$16 MM with an ROI of -135.81% compared to -$15 MM with a ROI of -197.17% for the
natural gas stripping process. The NPV and ROI are both negative because this project is not
generating any revenue as mentioned in Section 22.1. The air stripping process’s NPV is $1 MM
more than that of the natural gas stripping process because the operating costs of the air stripping
process are more than those of the natural gas stripping process as seen in Section 22.
78 Downey, B. K., Profitability Analysis Spreadsheet, University of Pennsylvania, Philadelphia (2008).

Section 24: Profitability Analysis – Business Case
Frederick | Leach | Nayandi
122 | P a g e
Table 24.3. Profitability measures for the Air Stripping Process 79
Table 24.4. Profitability Measures for the Natural Gas Stripping Process 80
79 Downey, B. K., Profitability Analysis Spreadsheet, University of Pennsylvania, Philadelphia (2008). 80 Downey, B. K., Profitability Analysis Spreadsheet, University of Pennsylvania, Philadelphia (2008).

Section 24: Profitability Analysis – Business Case
Frederick | Leach | Nayandi
123 | P a g e
The following graphics show the value of the air and natural gas stripping processes in
millions of 2018 U.S. dollars over time. Over the first 2 years, the cash flow is a more negative
number because both stripping processes are at 0% design capacity and these costs can be
attributed to design and construction of each process. In 2020, both processes are at 100% design
capacity and the variable and fixed costs related to the stripping processes start to be incurred.
This explains why the cash flows become a greater negative number beginning 2020 and increases
constantly until the end of the useful life of the project. The cumulative cash flow for the air
stripping process is more negative than that for the air stripping process because, as mentioned
earlier, there is a difference in the operating costs. This becomes more pronounced since these are
cumulative cash flows.
Figure 24.1. Cumulative discounted free cash flow ($MM) for the air stripping process over nineteen -year lifespan.
The process assume no product is being sold and production starts in 2020 after 2 years of design and constructio n.
-16
-14
-12
-10
-8
-6
-4
-2
0
2
20
18
20
19
20
20
20
21
20
22
20
23
20
24
20
25
20
26
20
27
20
28
20
29
20
30
20
31
20
32
20
33
20
34
20
35
20
36
Net
Pre
sen
t V
alu
e o
f C
um
ula
tiv
e F
ree C
ash
Flo
w
($M
M)

Section 24: Profitability Analysis – Business Case
Frederick | Leach | Nayandi
124 | P a g e
Figure 24.2. Cumulative discounted free cash flow ($MM) for the natural gas stripping process over nineteen -year
lifespan. The process assume no product is being sold and production starts in 2020 after 2 years of design and
construction.
The following cash flow summary sheets assume a 20-year MACRS depreciation schedule
for the air and natural gas stripping processes. Additionally, annual tax assets were added for each
year net operating loss was incurred.
-16
-14
-12
-10
-8
-6
-4
-2
0
2
20
18
20
19
20
20
20
21
20
22
20
23
20
24
20
25
20
26
20
27
20
28
20
29
20
30
20
31
20
32
20
33
20
34
20
35
20
36
Net P
rese
nt V
alu
e o
f C
um
ula
tive F
ree
Cash
Flo
w (
$M
M)

Section 24: Profitability Analysis – Business Case
Frederick | Leach | Nayandi
125 | P a g e
Table
2
4.5
: C
ash
Flo
w S
um
mary
fo
r th
e A
ir S
trip
pin
g P
rocess

Section 24: Profitability Analysis – Business Case
Frederick | Leach | Nayandi
126 | P a g e
Table
2
4.6
: C
ash
Flo
w S
um
mary
fo
r th
e N
atu
ral
Gas S
trip
pin
g P
rocess

Section 25: Conclusions and Recommendations
Frederick | Leach | Nayandi
127 | P a g e
Section 25
Conclusions and Recommendations

Section 25: Conclusions and Recommendations
Frederick | Leach | Nayandi
128 | P a g e
Based on thorough analyses of the economic, environmental, and health and safety viability
of the designs using air and natural gas as stripping agents, it is recommended that the refinery
pursues both designs as potential alternatives to the traditional steam stripping processes. Both
designs were compared on the basis of stripping ammonia and hydrogen sulfide to raffinate
concentrations of 20 ppm and 0.1 ppm respectively. Compared to the air design, the natural gas
design is superior with respect to economics and stripping efficiency, equivalent with respect to
extract gas environmental impact, and slightly worse with respect to health and safety concerns
and wastewater environmental impact.
Both designs were optimized to lower the capital cost of the equipment; and the total
capital investment of the natural gas stripping process was $1.6 MM compared to $1.8 MM for
air. Additionally, the NPV of the design with natural gas as the stripping agent is -$15 MM
compared to the NPV of air as the stripping agent which is -$16 MM. These numbers are based
on a large number of assumptions and calculations listed in Section 22 and Section 24 which should
be revisited to confirm their accuracy.
Rather than releasing the extract gas into the atmosphere, it is recommended that the extract
gases for both stripping processes are recycled to the furnaces: as fuel in the case of natural gas,
and as oxygen-containing air required for combustion in the case of air. Doing so has two benefits.
First, it avoids the capital expenditure needed for ammonia control equipment in the likely case
that ammonia regulations become stricter. Second, the ammonia and water in the extract stream
reduce the amount of NOx produced in the combustion of natural gas. Recycling the extract stream
to the refinery burners results in nearly identical environmental consequences for both air and
natural gas as stripping agents.

Section 25: Conclusions and Recommendations
Frederick | Leach | Nayandi
129 | P a g e
Another difference between natural gas and air stripping to consider is the contamina tion
of the raffinate water. Compared to air as a stripping agent, which does not further contaminate
the sour water, the use of natural gas as a stripping agent leads to the addition of 17 ppm methane
in the produced sweeter water (Table 15.3).
The final consideration for the endorsement of one design over the other is the safety of
each design. Using natural gas as the stripping agent requires additional safety precautions
compared to using air. Such safety precautions include carefully monitoring the oxygen
concentration of the ambient inside air to protect against reduction by methane, having leak
monitoring devices since methane is highly flammable and odorless, and demarcating the piping
from the natural gas feed to the depressurizing control valve as a high pressure zone.
Given that the use of air and natural gas have equivalent trade-offs, namely the slightly
lower environmental impact of air, the manageable health and safety concerns of natural gas, and
the minor economic advantages of natural gas, both processes are recommended for further
investigation. This further investigation should include a rigorous comparison to the industry
standard, steam stripping, to determine if the novel processes have any economic, environmenta l,
or health and safety benefits versus steam stripping.

Section 26: Acknowledgements
Frederick | Leach | Nayandi
130 | P a g e
Section 26
Acknowledgements

Section 26: Acknowledgements
Frederick | Leach | Nayandi
131 | P a g e
Our team would like to thank Dr. Allen and Professor Vrana for their constant support. We
are extremely grateful that Dr. Allen provided guidance in our weekly meetings to make sure we
moved in the right direction. We would like to thank Professor Vrana for helping us with our
process development and economics. He provided help on column internals in order to accurately
model the air and natural gas stripping processes. He also provided tremendous help in deciding
what our economic analysis should be based on since we are not producing any product that is
going to be sold. Their advice was very helpful and helped us stay on track.
We would like to thank the industrial consultants who attended our weekly design meetings
for their advice: Dr. Gopalratnam, Professor Fabiano, Mr. Stephen M. Tieri of DuPont, Ms.
Mariella Juhasz of DuPont, Mr. Gary Sawyer of CDI Corporation, Dr. Michael Grady of Axalta
Coating Systems, and the renowned Dr. Arthur William Etchells III. Special thanks to Dr. Gopal,
our project author, for constantly providing guidance in environmental and wastewater treatment
considerations for our project and his weekly feedback on our meetings with other consultants.
We would also like to extend our gratitude to Dr. Grady and Dr. Etchells for their help with the
mixing and design aspects of our controls system. Special thanks to Mr. Sawyer for helping us
with the process simulation, especially for reminding us to turn on the absorber. We also thank
Dr. Warren Seider for his generous consultations of our control system design.
Our group would especially like to thank Professor Fabiano for his tremendous help with
the ASPEN process simulations of our project throughout the semester. He helped us with
troubleshooting a lot of errors we were experiencing and gave us a great deal of advice on major
decisions we had to make for stripping columns ranging from what electrolytic packages to use to
the tray type suitable for the process. We would not have made the progress we made without his
help.

Section 26: Acknowledgements
Frederick | Leach | Nayandi
132 | P a g e
We would also like to thank Robert Tannenbaum and Justin Wanyeki who gave us
guidance about different parts of our report.
Finally, we would like to extend our gratitude towards process engineer Tyler McDevitt at
Phillips 66 Refinery, environmental engineer Edward Wiener at Philadelphia Air Management
Service, sales representative Michael Dowdy of Cemtech Energy Controls, Inc., environmenta l
managers Charles Zadakis and Sean Wenrich at the DEP, project manager Robert Schlosser at IES
Engineers, director of environmental and compliance Cheryl Coffee at Clean Earth, and the
countless other professionals who assisted in our understanding of the various regulations.

Section 27: Bibliography
Frederick | Leach | Nayandi
133 | P a g e
Section 27
Bibliography

Section 27: Bibliography
Frederick | Leach | Nayandi
134 | P a g e
1. “18 CFR Part 410.” Delaware River Basin Commission, 4 Dec. 2013, p. 111.
2. “2014 National Emissions Inventory (NEI) Data.” EPA, Environmental Protection Agency, 2 Mar.
2018, www.epa.gov/air-emissions-inventories/2014-national-emissions-inventory-nei-data.
3. “40 CFR Part 68.” Environmental Protection Agency: Accidental Release Prevention Program, vol.
81, no. 49, 14 Mar. 2016.
4. “40 CFR Part 68.” Environmental Protection Agency: Accidental Release Prevention Program, vol.
81, no. 49, 14 Mar. 2016. Appendix A
5. Addington, Luke, et al. "Sour water: Where it comes from and how to handle it." Bryan Research and
Engineering Inc.[online]. Disponible en: https://www. bre. com/PDF/Sour-Water-Where-It-Comes-
from-and-How-to-Handle-It. pdf (2011).
6. “Agricultural Air Pollution Fact Sheet.” Texas A&M Center for Agricultural Air Quality Engineering
& Science.
7. “Ammonia Acute Exposure Guideline Levels.” Acute Exposure Guideline Levels for Selected
Airborne Chemicals: Volume 6., U.S. National Library of Medicine, 1 Jan. 1970,
www.ncbi.nlm.nih.gov/books/NBK207883
8. Baise, Gary. “More EPA Regulation of Ammonia?” Farm Futures, 6 Oct. 2016,
www.farmfutures.com/blogs-more-epa-regulation-ammonia-9456.
9. “Clean Water Act, Section 502 General Definitions.” EPA, Environmental Protection Agency, 15
Sept. 2016, www.epa.gov/cwa-404/clean-water-act-section-502-general-definitions.
10. “Criteria Air Pollutants.” EPA, Environmental Protection Agency, 8 Mar. 2018,
www.epa.gov/criteria-air-pollutants. 11. “Critical Risk: Hot Water and Steam.” MINTRAC and AMPC, June 2014.
12. “CWA Section 404 Enforcement Overview.” EPA, Environmental Protection Agency, 17 Nov. 2017,
www.epa.gov/cwa-404/cwa-section-404-enforcement-overview.
13. Downey, B. K., Profitability Analysis Spreadsheet, University of Pennsylvania, Philadelphia (2008).
14. Engineering ToolBox, “Water Vapor and Saturation Pressure in Humid Air.” Water Vapor and
Saturation Pressure in Humid Air, 2004, www.engineeringtoolbox.com/water-vapor-saturation
pressure-air-d_689.html.-
15. Frederick, Andrew E, and Edward Wiener. “Emission Limits of Ammonia in Philadelphia.” 16 Apr.
2018. Edward is an Environmental Engineer for Philadelphia Air Management Services.
16. Frederick, Andrew E, and Leonard Fabiano. “Column Design in ASPEN.” 8 Mar. 2018.Leonard is an
adjunct Professor at the University of Pennsylvania
17. Frederick, Andrew E, and Robert Schlosser. “Emission Limit for Ammonia.” 12 Apr. 2018.Robert is a
Principal Project Manager at IES Engineers
18. Frederick, Andrew E, and Sarah. “Ammonia Scrubber Price.” 5 Apr. 2018. Sarah is an ammonia
scrubber saleswoman at Heil Process Equipment
19. Frederick, Andrew E, and Tyler McDevitt. “Sour Water Process Engineer Consultation.” 12 Apr.
2018. Tyler is a process engineer at Phillips 66 refinery.
20. Harvey, Fiona. “Ammonia Emissions Rise in UK, .” The Guardian, Guardian News and Media, 16
Feb. 2018, www.theguardian.com/environment/2018/feb/15/ammonia-emissions-rise-air-pollutants-
fall-new-government-statistics.
21. Hatcher, Nathan, and Ralph Weiland. "Reliable design of sour water strippers." Petroleum Technology
Quarterly 17.4 (2012): 83.
22. Health Effects Information: Ammonia. Public Health Office, 2000, Health Effects Information:
Ammonia.
23. “Historic Average, Philadelphia, Pennsylvania.” Intellicast - Philadelphia Historic Weather Averages
in Pennsylvania (19113), TWC Product and Technology, LLC, 2018,
24. “Key Federal Laws: Clean Water Act.” Chem Alliance, 2016,
www.chemalliance.org/tools/?subsec=25&id=6922
25. Leach, Connor T, and Michael Dowdy. “PH Meter Delay Time for Step Input.” 13 Mar. 2018.
Michael is a sales representative for Cemtech Energy Controls, Inc., the Philadelphia sales
representative company for Yokogawa Corporation of America.

Section 27: Bibliography
Frederick | Leach | Nayandi
135 | P a g e
26. Lee, D., et al. "Dynamic simulation of the sour water stripping process and modified structure for
effective pressure control." Chemical Engineering Research and Design 80.2 (2002): 167-177.
27. Mackenzie, Patricia Denise, and C. J. King. "Simultaneous stripping and solvent extraction for the
recovery of ammonia and acid gases from wastewaters." (1984).
28. Mathias, Scott. “Managing Air Quality: State Implementation Plans.” U.S. EPA, 3 Oct. 2007.
29. McAngus, Jess. Refinery Air Emission Metrics. Spirit Environmental, LLC, 2013,Refinery Air
Emission Metrics.
30. Nakhamkin, M., et al. Combustion Studies of Natural Gas and Syn-Gas with Humid air. Technical
report, EPRI, Palo Alto CA, USA, 1994.
31. “Natural Gas – From Wellhead to Burner Tip.” NaturalGasorg, NaturalGas.Org, 20 Sept. 2013,
naturalgas.org/naturalgas/.
32. NaturalGas.org website page Processing Natural Gas.
33. Oram, Brian. “Ammonia in Groundwater, Runoff, and Streams.” Water Research Center, June 2014,
www.water-research.net/index.php/ammonia-in-groundwater-runoff-and-streams.
34. “Penalties Associated with Violating U.S. Environmental Laws.” EnviroGuide, Mar. 2013,
enviroguides.us/content/%E2%80%93penalties-associated-violating-us-environmental-laws.
35. Phillips, Jennifer. Control and pollution prevention options for ammonia emissions. No. PB-95-
241790/XAB. VIGYAN, Inc., Vienna, VA (United States), 1995.
36. QMax Solutions. “Overview of H2S.” Tech Bulletin #13.
37. Seider, Warren D., et al. Product and Process Design Principles: Synthesis, Analysis, and Evaluation.
4th ed., John Wiley & Sons Inc., 2017
38. Shaver, Sally. “The Regulation of Ammonia Emissions in the United States.” U.S. EPA, 18 July 2008.
39. “Sour Water Stripper Process.” Yokogawa America, Yokogawa Electric Corporation, 2 Aug. 2016,
www.yokogawa.com/us/library/resources/application-notes/sour-water-stripper-process/.
40. South, Mia. “Approved Air Quality Implementation Plans.” EPA, Environmental Protection Agency,
29 Sept. 2017, www.epa.gov/air-quality-implementation-plans/approved-air-quality-implementation-
plans.
41. Stevens, D. K., and A. Mosher. "Fundamentals of Sour Water Stripping." Brimstone Sulfur Symposia,
Vail, Colorado. 2008.
42. “Subchapter I. Plan Approval And Operating Permit Fees.” Pennsylvania Code,
www.pacode.com/secure/data/025/chapter127/subchapItoc.html.
43. “The Pennsylvania Code.” Permit Applications and Fees.,
www.pacode.com/secure/data/025/chapter102/s102.6.html.
44. Towler, Gavin, and Ray K. Sinnott. Chemical engineering design: principles, practice and economics
of plant and process design. Elsevier, 2012.
45. “Usefulness of City as a Port Threatened by River Fumes.” The Philadelphia Record, 14 Aug. 1944.
46. Vaquer-Sunyer, Raquel. “Ecosystem Impacts of Hypoxia: Thresholds of Hypoxia and Pathways to
Recovery.” Research Gate, 2011.
47. Wanek, Rick. “Monitoring H2S to Meet New Exposure Standards.” Occupational Health & Safety, 1
Sept. 2011, ohsonline.com/articles/2011/09/01/monitoring-h2s-to-meet-new-exposure-standards.aspx.
48. Weiland, R.H., et al. “Stripping Phenolic Water.” Protreat.com, 2013,
www.protreat.com/files/publications/85/S_344_sour_water_prf4.pdf.
49. “Who Has to Obtain a Title V Permit?” EPA, Environmental Protection Agency, 15 Mar. 2017,
www.epa.gov/title-v-operating-permits/who-has-obtain-title-v-permit.
50. U.S. Energy Information Administration. “Fuel Consumed at Refineries.” East Coast (PADD 1) Fuel
Consumed at Refineries, U.S. Department of Energy, 21 June 2017,
www.eia.gov/dnav/pet/pet_pnp_capfuel_dcu_r10_a.htm.

Section 28: Appendix
Frederick | Leach | Nayandi
136 | P a g e
Section 28
Appendix

Section 28: Appendix
Frederick | Leach | Nayandi
137 | P a g e
A.0: Project Description
A.0.1: Project Description

Section 28: Appendix
Frederick | Leach | Nayandi
138 | P a g e

Section 28: Appendix
Frederick | Leach | Nayandi
139 | P a g e

Section 28: Appendix
Frederick | Leach | Nayandi
140 | P a g e
A.0.2: Additional Details

Section 28: Appendix
Frederick | Leach | Nayandi
141 | P a g e

Section 28: Appendix
Frederick | Leach | Nayandi
142 | P a g e
A.0.3: Project Author Amendment to Standard Incoming Flow Rates
Team 5 & others,
The range of sour water feed for this project is suggested for extreme operating conditions and it is suggested one would see this range over a typical year. Let us assume that the
actual variation during regular operation to be between 30 gpm and 50 rpm only. The lower end of the range at 20 gpm would correspond to a couple of days of transience before and after the annual shutdown of the plant.
As Prof. Fabiano suggested, design the column for a routine operation of 30 to 50 gpm
range with a turndown of 60%. Then consider placing the column on total recycle (usually called the stand-by mode) during transitions (2 days each) around the annual shutdown.
I hope this helps.
Gopal.

Section 28: Appendix
Frederick | Leach | Nayandi
143 | P a g e
A.1: Calculations
A.1.1: Calculation of amount of natural gas used by stripping process vs amount consumed
by average east coast refinery
Amount of Natural Gas Used in the Natural Gas Stripping Process
((178,623 𝐶𝐹
ℎ𝑟) ∗ (8000
ℎ𝑟
𝑦𝑟∗𝑟𝑒𝑓𝑖𝑛𝑒𝑟𝑦) = 1,428,984,000
𝐶𝐹𝑌
𝑟𝑒𝑓𝑖𝑛𝑒𝑟𝑦 (@ 180°F;640°R))
(𝑇1𝑉1=𝑇2𝑉2)
(1,428,984,000𝐶𝐹𝑌
𝑟𝑒𝑓𝑖𝑛𝑒𝑟𝑦 (@ 180°F;640°R) = 1,161,049,500
𝑆𝐶𝐹𝑌
𝑟𝑒𝑓𝑖𝑛𝑒𝑟𝑦 (@ 60°F;520°R))
Average Amount of Natural Gas Consumed by an East Coast Refinery
((52,323𝑀𝑆𝐶𝐹𝑌3
𝐸. 𝐶. 𝑟𝑒𝑓𝑖𝑛𝑒𝑟𝑦) ∗ (
1 𝑟𝑒𝑓.
9 𝑟𝑒𝑓.) ∗ 1,000,000
1
𝑀= 5,813,366,667
𝑆𝐶𝐹𝑌
𝑟𝑒𝑓𝑖𝑛𝑒𝑟𝑦 (@ 60°F;520°R))
A.1.2: Calculations for intermediate temperature of air and natural gas before adding steam
Average flow rates, 10 mole% water vapor, column inlet temperature of 190
Air Formula
𝑇𝑚 = (𝑇𝑎𝑖𝑟 ,𝑖 + (𝐹𝑙𝑜𝑤𝑎𝑖𝑟 ∗ 𝐶𝑝,𝑎𝑖𝑟 ∗ (𝑇𝑐𝑜𝑙𝑢𝑚𝑛 − 𝑇𝑎𝑖𝑟 ,𝑖) − 𝑀𝑎𝑠𝑠𝐹𝑟𝑎𝑐𝐻2𝑂 ∗ 𝐹𝑙𝑜𝑤𝑎𝑖𝑟 ∗ 𝐶𝑝,𝐻2𝑂 ∗ (𝑇𝐻2𝑂 − 𝑇𝑐𝑜𝑙𝑢𝑚𝑛 ))
𝐶𝑝,𝑎𝑖𝑟 ∗ 𝐹𝑙𝑜𝑤𝑎𝑖𝑟)
Air Average Flow Rate Example
171 = (70+ (23,992 ∗ 0.17 ∗ (190− 70) − 0.065 ∗ 23,992 ∗ 0.45 ∗ (300 − 190))
0.17 ∗ 23,992)

Section 28: Appendix
Frederick | Leach | Nayandi
144 | P a g e
Natural Gas Formula
𝑇𝑚 = (𝑇𝑔𝑎𝑠 ,𝑖 + (𝐹𝑙𝑜𝑤𝑔𝑎𝑠 ∗ 𝐶𝑝,𝑔𝑎𝑠 ∗ (𝑇𝑐𝑜𝑙𝑢𝑚𝑛 − 𝑇𝑔𝑎𝑠 ,𝑖) − 𝑀𝑎𝑠𝑠𝐹𝑟𝑎𝑐𝐻2𝑂 ∗ 𝐹𝑙𝑜𝑤𝑔𝑎𝑠 ∗ 𝐶𝑝,𝐻2𝑂 ∗ (𝑇𝐻2𝑂 − 𝑇𝑐𝑜𝑙𝑢𝑚𝑛 ))
𝐶𝑝,𝑔𝑎𝑠 ∗ 𝐹𝑙𝑜𝑤𝑔𝑎𝑠)
Natural Gas Average Flow Rate Example
180 =
(
42+ (14,664 ∗ 0.533 ∗ (190 − 42) −
19 ∗ 14,644 ∗ 0.45 ∗
(300− 190))
0.533 ∗ 14,644
)
A.1.3: Average Yearly Flow Rate
(37.5 𝐺𝑃𝑀 = 37.5𝑔𝑎𝑙
𝑚𝑖𝑛=
(75,000𝑡𝑜𝑛𝑦𝑟) ∗ (2000 𝑙𝑏
𝑡𝑜𝑛)
(8000ℎ𝑟𝑦𝑟)∗ (60𝑚𝑖𝑛
ℎ𝑟) ∗ (8.309 𝑙𝑏
𝑔𝑎𝑙))
A.1.4: Amount of Ammonia Removed from Sour Water Annually
((29.8𝑙𝑏
ℎ𝑟) ∗ (8000
ℎ𝑟
𝑦𝑟) ∗ (
1 𝑡𝑜𝑛
2000 𝑙𝑏)∗ (
$500
𝑡𝑜𝑛) = $59,600)

Section 28: Appendix
Frederick | Leach | Nayandi
145 | P a g e
A.1.5: Sensitivity Analysis for Sulfuric Acid Addition (Air and Natural Gas)
Sulfuric Acid Sensitivity Analysis for Air Stripping. The bolded blue numbers represent the flow rate of air required to strip the sour water feed to 20 ppm of ammonia and 0.1 ppm of hydrogen sulfide with 0.6 lb/hr of sulfuric acid. The ASPEN simulations were run using 5 ideal trays, which is why the numbers do not match the control equation.
Sulfuric Acid Sensitivity Analysis for Natural Gas Stripping. The bolded blue numbers represent the flow rate of natural gas required to strip the sour water feed to 20 ppm of ammonia and 0.1 ppm of hydrogen sulfide with 0.55 lb/hr of sulfuric acid. The ASPEN simulations were run using 5 ideal trays, which is why the numbers do not match the control equation.

Section 28: Appendix
Frederick | Leach | Nayandi
146 | P a g e
A.2: Figures
A.2.1: Effect of Various Parameters on Stripping Efficacy
A.2.1.1: Effect of Number of Stages on Stripping Efficacy
An early test of an integral variable of the process, number of trays, and how the extent of stripping is affected by changing it. Increasing the number of trays increases the amount
of ammonia that is stripped by a constant air flow rate.

Section 28: Appendix
Frederick | Leach | Nayandi
147 | P a g e
A.2.1.2: Effect of Air Flow Rate and Water Temperature on Stripping Efficacy
This graph shows the results of an early test to determine how water temperature and stripping agent air flow rate affects the extent of stripping. Increasing both the sour water temperature and air flow rate has a positive effect on the amount of ammonia that can be stripped.

Section 28: Appendix
Frederick | Leach | Nayandi
148 | P a g e
A.2.2: Column Tray Profiles
A.2.2.1: Column Internal Hydrogen Sulfide and Ammonia Concentration Profiles
This is an example of an ASPEN simulation where the concentrations of the contaminants were measured on each tray. This concentration is only for the dissolved gas, not includ ing
its dissociated constituents.

Section 28: Appendix
Frederick | Leach | Nayandi
149 | P a g e
A.2.2.2: Column Internal pH Profiles
This is an example of an ASPEN simulation where the pH of the sour water was measured on each tray.

Section 28: Appendix
Frederick | Leach | Nayandi
150 | P a g e
A.2.3: Control Equation Formulation
This excerpt from spreadsheet calculation spreadsheet shows the control equations from Section 23.2 being optimized for different sour
water conditions. The equation was formulated to calculate more than
enough stripping agent to strip the sour water when at the minimum and maximum ammonia concentrations
and the minimum and maximum flow rates.

Section 28: Appendix
Frederick | Leach | Nayandi
151 | P a g e
A.2.4: Pennsylvania PM2.5 Nonattainment Areas
The map below represents the nonattainment areas in Pennsylvania for particulate matter of size less than 2.5 microns. Nonattainment areas are areas where the ambient air in that
area is of worse quality than the NAAQS standards.

Section 28: Appendix
Frederick | Leach | Nayandi
152 | P a g e
A.3: Permits
A.3.1: Warren Refinery Permit (excerpt)

Section 28: Appendix
Frederick | Leach | Nayandi
153 | P a g e
A.3.2: Marcus Hook Refinery Permit (excerpts)

Section 28: Appendix
Frederick | Leach | Nayandi
154 | P a g e

Section 28: Appendix
Frederick | Leach | Nayandi
155 | P a g e
A.4: Quotations and Equipment Specifications
A.4.1: pH Meter Quotation (pH Converter) (excerpt)

Section 28: Appendix
Frederick | Leach | Nayandi
156 | P a g e

Section 28: Appendix
Frederick | Leach | Nayandi
157 | P a g e
A.4.2: Acid Storage Tank
Section 28: Appendix
Frederick | Leach | Nayandi
158 | P a g e
A.4.3: Acid Mixing Tank

Section 28: Appendix
Frederick | Leach | Nayandi
159 | P a g e
A.4.4: Polyethylene Chemical Resistance Chart (excerpt)

Section 28: Appendix
Frederick | Leach | Nayandi
160 | P a g e

Section 28: Appendix
Frederick | Leach | Nayandi
161 | P a g e
A.4.5: Heuristic 34 (Seider et al. 2017)
“Heuristic 34: Use a fan to raise the gas pressure from atmospheric pressure
to as high as 40 inches water gauge (10.1 kPa gauge or 1.47 psig). Use a
blower or compressor to raise the gas pressure to as high as 206 kPa gauge or
30 psig. Use a compressor or a staged compressor system to attain pressures
greater than 206 kPa gauge or 30 psig.”

Section 28: Appendix
Frederick | Leach | Nayandi
162 | P a g e
A.5: ASPEN Input and Output Files
A.5.1: Valve P and T Change Test
A.5.1.1: Input File
; ;Input Summary created by Aspen Plus Rel. 36.0 at 01:10:44 Tue Apr 17, 2018 ;Directory \\nestor\leconnor\CBE459\Valve CH4 P drop Filename C:\Users\leconnor\AppData\Local\Temp\~ape89d.txt ; DYNAMICS DYNAMICS RESULTS=ON IN-UNITS ENG SHORT-LENGTH=in DEF-STREAMS CONVEN ALL DATABANKS 'APV100 PURE36' / 'APV100 AQUEOUS' / 'APV100 SOLIDS' & / 'APV100 INORGANIC' / 'APESV100 AP-EOS' / & 'NISTV100 NIST-TRC' / NOASPENPCD PROP-SOURCES 'APV100 PURE36' / 'APV100 AQUEOUS' / & 'APV100 SOLIDS' / 'APV100 INORGANIC' / 'APESV100 AP-EOS' & / 'NISTV100 NIST-TRC' COMPONENTS CH4 CH4 SOLVE RUN-MODE MODE=SIM FLOWSHEET BLOCK VALVE IN=1 OUT=2 PROPERTIES ENRTL-RK STREAM 1 SUBSTREAM MIXED TEMP=70. PRES=514.6959488 MASS-FLOW=21015. MOLE-FRAC CH4 1. BLOCK VALVE VALVE PARAM P-OUT=24.69594878 NPHASE=1 PHASE=V BLOCK-OPTION FREE-WATER=NO EO-CONV-OPTI STREAM-REPOR MOLEFLOW ; ; ; ;

Section 28: Appendix
Frederick | Leach | Nayandi
163 | P a g e
A.5.1.2: Stream Report
1 2 --- STREAM ID 1 2 FROM : ---- VALVE TO : VALVE ---- SUBSTREAM: MIXED PHASE: VAPOR VAPOR COMPONENTS: LBMOL/HR CH4 1309.9367 1309.9367 TOTAL FLOW: LBMOL/HR 1309.9367 1309.9367 LB/HR 2.1015+04 2.1015+04 CUFT/HR 1.3522+04 2.8421+05 STATE VARIABLES: TEMP F 70.0000 41.5954 PRES PSIA 514.6959 24.6959 VFRAC 1.0000 1.0000 LFRAC 0.0 0.0 SFRAC 0.0 0.0 ENTHALPY: BTU/LBMOL -3.2350+04 -3.2350+04 BTU/LB -2016.4667 -2016.4667 BTU/HR -4.2376+07 -4.2376+07 ENTROPY: BTU/LBMOL-R -26.7674 -20.8752 BTU/LB-R -1.6685 -1.3012 DENSITY: LBMOL/CUFT 9.6872-02 4.6091-03 LB/CUFT 1.5541 7.3942-02 AVG MW 16.0428 16.0428

Section 28: Appendix
Frederick | Leach | Nayandi
164 | P a g e
A.5.2: Air Stripping Column Simulation without Acid
A.5.2.1: Input File
This is an example of an ASPEN simulation that helped us optimize the stripping column. Since there is no one perfect simulation, the inputs and results from this simulation may
not match the specifications, required outputs, or column sizing data; and this is expected. This specific run is for the 20-tray column with 25% Murphree Efficiency, Design Specified to reduce ammonia to 16 ppm (so that ammonia plus ammonium are together
less than 20 ppm), for the maximum sour water flow rate and ammonia concentration.
; ;Input Summary created by Aspen Plus Rel. 36.0 at 03:52:55 Tue Apr 17, 2018 ;Directory \\nestor\leconnor\CBE459 Filename C:\Users\leconnor\AppData\Local\Temp\~ap654e.txt ; DYNAMICS DYNAMICS RESULTS=ON IN-UNITS ENG SHORT-LENGTH=in DEF-STREAMS CONVEN ALL MODEL-OPTION DESCRIPTION " Electrolytes Simulation with English Units : F, psi, lb/hr, lbmol/hr, Btu/hr, cuft/hr. Property Method: ELECNRTL Flow basis for input: Mass Stream report composition: Mass flow " DATABANKS 'APV100 ASPENPCD' / 'APV100 AQUEOUS' / 'APV100 SOLIDS' & / 'APV100 INORGANIC' / 'APV100 PURE36' PROP-SOURCES 'APV100 ASPENPCD' / 'APV100 AQUEOUS' / & 'APV100 SOLIDS' / 'APV100 INORGANIC' / 'APV100 PURE36' COMPONENTS H2O H2O / H2S H2S / NH3 H3N / N2 N2 / O2 O2 / H3O+ H3O+ / NH4+ NH4+ / HS- HS- / OH- OH- / S-- S-2 HENRY-COMPS GLOBAL H2S NH3 O2 N2 SOLVE

Section 28: Appendix
Frederick | Leach | Nayandi
165 | P a g e
RUN-MODE MODE=SIM CHEMISTRY GLOBAL PARAM GAMMA-BASIS=UNSYMMETRIC STOIC 1 NH3 -1 / H2O -1 / OH- 1 / NH4+ 1 STOIC 2 H2O -1 / HS- -1 / H3O+ 1 / S-- 1 STOIC 3 H2O -1 / H2S -1 / H3O+ 1 / HS- 1 STOIC 4 H2O -2 / OH- 1 / H3O+ 1 K-STOIC 1 A=-1.256563 B=-3335.699951 C=1.4971 D=-0.037057 K-STOIC 2 A=-9.741963 B=-8585.469727 C=0 D=0 K-STOIC 3 A=214.582443 B=-12995.400391 C=-33.5471 D=0 K-STOIC 4 A=132.89888 B=-13445.900391 C=-22.477301 D=0 FLOWSHEET BLOCK STRIPPER IN=SOURWATR AIRFEED OUT=EXTRACT RAFINATE & S1 S2 S3 S4 S5 S6 S7 S8 S9 S10 S11 S12 S13 S14 & S15 S16 PROPERTIES ENRTL-RK HENRY-COMPS=GLOBAL CHEMISTRY=GLOBAL & TRUE-COMPS=NO PROPERTIES ELECNRTL PROP-DATA HENRY-1 IN-UNITS ENG PRESSURE=psi PDROP=psi SHORT-LENGTH=in PROP-LIST HENRY BPVAL H2S H2O 381.6601370 -23826.24000 -55.05510000 & .0330916666 31.73000000 301.7300000 0.0 BPVAL NH3 H2O -158.8183807 -283.5936000 28.10010000 & -.0273483333 31.73000000 436.7300000 0.0 BPVAL N2 H2O 180.3399883 -15178.98600 -21.55800000 & -4.6868000E-3 31.73000000 163.1300000 0.0 BPVAL O2 H2O 157.8962298 -13995.10800 -18.39740000 & -5.2464111E-3 33.53000000 166.7300000 0.0 BPVAL N2 NH3 10.80598441 0.0 0.0 0.0 67.73000000 & 67.73000000 0.0 BPVAL O2 NH3 11.20948341 0.0 0.0 0.0 67.73000000 & 67.73000000 0.0 PROP-DATA NRTL-1 IN-UNITS ENG SHORT-LENGTH=in PROP-LIST NRTL BPVAL H2O H2S -3.674000000 2080.620000 .2000000000 0.0 0.0 & 0.0 32.00000000 302.0000000 BPVAL H2S H2O -3.674000000 2080.620000 .2000000000 0.0 0.0 & 0.0 32.00000000 302.0000000 BPVAL H2O NH3 -.5440720000 3021.244200 .2000000000 0.0 0.0 & 0.0 32.00000000 392.0000000 BPVAL NH3 H2O -.1642422000 -1849.545000 .2000000000 0.0 & 0.0 0.0 32.00000000 392.0000000 PROP-DATA GMELCC-1 IN-UNITS ENG SHORT-LENGTH=in PROP-LIST GMELCC PPVAL H2O ( H3O+ HS- ) 8.045000000 PPVAL ( H3O+ HS- ) H2O -4.072000000 PPVAL H2O ( H3O+ OH- ) 8.045000000 PPVAL ( H3O+ OH- ) H2O -4.072000000 PPVAL H2O ( H3O+ S-- ) 8.045000000 PPVAL ( H3O+ S-- ) H2O -4.072000000 PPVAL H2O ( NH4+ HS- ) 8.060565000 PPVAL ( NH4+ HS- ) H2O -4.326618000 PPVAL H2O ( NH4+ OH- ) 8.045000000 PPVAL ( NH4+ OH- ) H2O -4.072000000 PPVAL H2O ( NH4+ S-- ) 8.045000000

Section 28: Appendix
Frederick | Leach | Nayandi
166 | P a g e
PPVAL ( NH4+ S-- ) H2O -4.072000000 PPVAL H2S ( H3O+ HS- ) 15.00000000 PPVAL ( H3O+ HS- ) H2S -8.000000000 PPVAL H2S ( H3O+ OH- ) 15.00000000 PPVAL ( H3O+ OH- ) H2S -8.000000000 PPVAL H2S ( H3O+ S-- ) 15.00000000 PPVAL ( H3O+ S-- ) H2S -8.000000000 PPVAL H2S ( NH4+ HS- ) 10.00000000 PPVAL ( NH4+ HS- ) H2S -4.000000000 PPVAL NH3 ( NH4+ HS- ) 50.00000000 PPVAL ( NH4+ HS- ) NH3 -2.850924000 PROP-DATA GMELCD-1 IN-UNITS ENG SHORT-LENGTH=in PROP-LIST GMELCD PPVAL H2O ( NH4+ HS- ) -85.25541600 PPVAL ( NH4+ HS- ) H2O 158.0140800 PPVAL H2S ( H3O+ HS- ) 0.0 PPVAL ( H3O+ HS- ) H2S 0.0 PPVAL H2S ( H3O+ OH- ) 0.0 PPVAL ( H3O+ OH- ) H2S 0.0 PPVAL H2S ( H3O+ S-- ) 0.0 PPVAL ( H3O+ S-- ) H2S 0.0 PROP-DATA GMELCE-1 IN-UNITS ENG SHORT-LENGTH=in PROP-LIST GMELCE PPVAL H2S ( H3O+ HS- ) 0.0 PPVAL ( H3O+ HS- ) H2S 0.0 PPVAL H2S ( H3O+ OH- ) 0.0 PPVAL ( H3O+ OH- ) H2S 0.0 PPVAL H2S ( H3O+ S-- ) 0.0 PPVAL ( H3O+ S-- ) H2S 0.0 PROP-DATA GMELCN-1 IN-UNITS ENG SHORT-LENGTH=in PROP-LIST GMELCN PPVAL H2S ( H3O+ HS- ) .1000000000 PPVAL H2S ( H3O+ OH- ) .1000000000 PPVAL H2S ( H3O+ S-- ) .1000000000 PROP-DATA GMENCC-1 IN-UNITS ENG SHORT-LENGTH=in PROP-LIST GMENCC PPVAL H2O ( H3O+ HS- ) 8.045000000 PPVAL ( H3O+ HS- ) H2O -4.072000000 PPVAL H2O ( H3O+ OH- ) 8.045000000 PPVAL ( H3O+ OH- ) H2O -4.072000000 PPVAL H2O ( H3O+ S-- ) 8.045000000 PPVAL ( H3O+ S-- ) H2O -4.072000000 PPVAL H2O ( NH4+ HS- ) 8.060565000 PPVAL ( NH4+ HS- ) H2O -4.326618000 PPVAL H2O ( NH4+ OH- ) 8.045000000 PPVAL ( NH4+ OH- ) H2O -4.072000000 PPVAL H2O ( NH4+ S-- ) 8.045000000 PPVAL ( NH4+ S-- ) H2O -4.072000000 PROP-DATA GMENCD-1 IN-UNITS ENG SHORT-LENGTH=in PROP-LIST GMENCD PPVAL H2O ( NH4+ HS- ) -85.25541600 PPVAL ( NH4+ HS- ) H2O 158.0140800 STREAM AIRFEED

Section 28: Appendix
Frederick | Leach | Nayandi
167 | P a g e
SUBSTREAM MIXED TEMP=190. PRES=35. MASS-FLOW=33792.71516 MOLE-FRAC H2O 0.1 / N2 0.711 / O2 0.189 STREAM SOURWATR SUBSTREAM MIXED TEMP=190. PRES=25. MASS-FLOW=25000. MASS-FRAC H2O 0.996995 / H2S 5E-006 / NH3 0.003 BLOCK STRIPPER RADFRAC SUBOBJECTS INTERNALS = CS-1 PARAM NSTAGE=20 ALGORITHM=STANDARD EFF=MURPHREE ABSORBER=YES & HYDRAULIC=NO MAXOL=200 DAMPING=NONE PARAM2 STATIC-DP=YES COL-CONFIG CONDENSER=NONE REBOILER=NONE CA-CONFIG=INT-1 FEEDS SOURWATR 1 / AIRFEED 20 ON-STAGE PRODUCTS RAFINATE 20 L / EXTRACT 1 V PSEUDO-STREA S1 1 MOLE-FLOW=1E-005 / S2 2 & MOLE-FLOW=1E-005 / S3 3 MOLE-FLOW=1E-005 / S4 4 & MOLE-FLOW=1E-005 / S5 5 MOLE-FLOW=1E-005 / S6 6 & MOLE-FLOW=1E-005 / S7 7 MOLE-FLOW=1E-005 / S8 8 & MOLE-FLOW=1E-005 / S9 9 MOLE-FLOW=1E-005 / S10 10 & MOLE-FLOW=1E-005 / S11 11 MOLE-FLOW=1E-005 / S12 12 & MOLE-FLOW=1E-005 / S13 13 MOLE-FLOW=1E-005 / S14 14 & MOLE-FLOW=1E-005 / S15 15 MOLE-FLOW=1E-005 / S16 16 & MOLE-FLOW=1E-005 P-SPEC 1 17. COL-SPECS DP-STAGE=0.1 DP-COND=0. PROPERTIES ENRTL-RK HENRY-COMPS=GLOBAL CHEMISTRY=GLOBAL & FREE-WATER=STEAM-TA SOLU-WATER=3 TRUE-COMPS=YES REPORT NOHYDRAULIC STEFF-SEC SECNO=1 1 20 0.25 INTERNALS CS-1 STAGE1=1 STAGE2=20 P-UPDATE=NO TRAY-SIZE 1 1 20 SIEVE DESIGN-SPEC DS-1 DEFINE NH3 MASS-FRAC STREAM=RAFINATE SUBSTREAM=MIXED & COMPONENT=NH3 SPEC "NH3" TO "16e-06" TOL-SPEC ".1e-07" VARY STREAM-VAR STREAM=AIRFEED SUBSTREAM=MIXED & VARIABLE=MASS-FLOW UOM="lb/hr" LIMITS "8000" "45000" EO-CONV-OPTI CONV-OPTIONS PARAM TEAR-METHOD=BROYDEN SPEC-METHOD=BROYDEN STREAM-REPOR MOLEFLOW MASSFLOW ; ; ; ; ;

Section 28: Appendix
Frederick | Leach | Nayandi
168 | P a g e
A.5.2.2: Output File
+ + + + + + + + + + + + + + + + + + + + + + + + + + + + + + + + + + + + + + + + + + + + + + + + + + + + + + + + + + + + + + + + + + + + + + + + + + + + + + + + + + + + + + ASPEN PLUS CALCULATION REPORT + + + + + + + + + + + + + + + + + + + + + + + + + + + + + + + + + + + + + + + + + + + + + + + + + + + + + + + + + + + + + + + + + + + + + + + + + + + + + + + + + + + + + + ASPEN PLUS IS A TRADEMARK OF HOTLINE: ASPEN TECHNOLOGY, INC. U.S.A. 888/996-7100 781/221-6400 EUROPE (44) 1189-226555 PLATFORM: WINDOWS APRIL 17, 2018 VERSION: 36.0 Build 249 TUESDAY INSTALLATION: 9:52:22 A.M. ASPEN PLUS PLAT: WINDOWS VER: 36.0 04/17/2018 PAGE I ASPEN PLUS (R) IS A PROPRIETARY PRODUCT OF ASPEN TECHNOLOGY, INC. (ASPENTECH), AND MAY BE USED ONLY UNDER AGREEMENT WITH ASPENTECH. RESTRICTED RIGHTS LEGEND: USE, REPRODUCTION, OR DISCLOSURE BY THE U.S. GOVERNMENT IS SUBJECT TO RESTRICTIONS SET FORTH IN (i) FAR 52.227-14, Alt. III, (ii) FAR 52.227-19, (iii) DFARS 252.227-7013(c)(1)(ii), or (iv) THE ACCOMPANYING LICENSE AGREEMENT, AS APPLICABLE. FOR PURPOSES OF THE FAR, THIS SOFTWARE SHALL BE DEEMED TO BE "UNPUBLISHED" AND LICENSED WITH DISCLOSURE PROHIBITIONS. CONTRACTOR/SUBCONTRACTOR: ASPEN TECHNOLOGY, INC. 20 CROSBY DRIVE, BEDFORD, MA 01730. TABLE OF CONTENTS RUN CONTROL SECTION.................................... 1 RUN CONTROL INFORMATION........................... 1 DESCRIPTION....................................... 1 FLOWSHEET SECTION...................................... 2 FLOWSHEET CONNECTIVITY BY STREAMS................. 2 FLOWSHEET CONNECTIVITY BY BLOCKS.................. 2 CONVERGENCE STATUS SUMMARY........................ 2 DESIGN-SPEC: DS-1................................ 2 CONVERGENCE BLOCK: $OLVER01...................... 3 COMPUTATIONAL SEQUENCE............................ 3 OVERALL FLOWSHEET BALANCE......................... 3 PHYSICAL PROPERTIES SECTION............................ 5 COMPONENTS........................................ 5 U-O-S BLOCK SECTION.................................... 6

Section 28: Appendix
Frederick | Leach | Nayandi
169 | P a g e
BLOCK: STRIPPER MODEL: RADFRAC................... 6 STREAM SECTION......................................... 17 AIRFEED EXTRACT RAFINATE S1 S10................... 17 S11 S12 S13 S14 S15............................... 18 S16 S2 S3 S4 S5................................... 19 S6 S7 S8 S9 SOURWATR.............................. 20 PROBLEM STATUS SECTION................................. 21 BLOCK STATUS...................................... 21 ASPEN PLUS PLAT: WINDOWS VER: 36.0 04/17/2018 PAGE 1 RUN CONTROL SECTION RUN CONTROL INFORMATION ----------------------- THIS COPY OF ASPEN PLUS LICENSED TO UNIVERSITY OF PENNSYLVAN TYPE OF RUN: NEW INPUT FILE NAME: _4940mjg.inm OUTPUT PROBLEM DATA FILE NAME: _4940mjg LOCATED IN: PDF SIZE USED FOR INPUT TRANSLATION: NUMBER OF FILE RECORDS (PSIZE) = 0 NUMBER OF IN-CORE RECORDS = 256 PSIZE NEEDED FOR SIMULATION = 256 CALLING PROGRAM NAME: apmain LOCATED IN: C:\Program Files (x86)\AspenTech\Aspen Plus V10.0\Engine\\xeq SIMULATION REQUESTED FOR ENTIRE FLOWSHEET DESCRIPTION ----------- Electrolytes Simulation with English Units : F, psi, lb/hr, lbmol/hr, Btu/hr, cuft/hr. Property Method: ELECNRTL Flow basis for input: Mass Stream report composition: Mass flow ASPEN PLUS PLAT: WINDOWS VER: 36.0 04/17/2018 PAGE 2 FLOWSHEET SECTION FLOWSHEET CONNECTIVITY BY STREAMS --------------------------------- STREAM SOURCE DEST STREAM SOURCE DEST AIRFEED ---- STRIPPER SOURWATR ---- STRIPPER EXTRACT STRIPPER ---- RAFINATE STRIPPER ---- S1 STRIPPER ---- S2 STRIPPER ---- S3 STRIPPER ---- S4 STRIPPER ---- S5 STRIPPER ---- S6 STRIPPER ---- S7 STRIPPER ---- S8 STRIPPER ---- S9 STRIPPER ---- S10 STRIPPER ---- S11 STRIPPER ---- S12 STRIPPER ---- S13 STRIPPER ---- S14 STRIPPER ----

Section 28: Appendix
Frederick | Leach | Nayandi
170 | P a g e
S15 STRIPPER ---- S16 STRIPPER ---- FLOWSHEET CONNECTIVITY BY BLOCKS -------------------------------- BLOCK INLETS OUTLETS STRIPPER SOURWATR AIRFEED EXTRACT RAFINATE S1 S2 S3 S4 S5 S6 S7 S8 S9 S10 S11 S12 S13 S14 S15 S16 CONVERGENCE STATUS SUMMARY -------------------------- DESIGN-SPEC SUMMARY =================== DESIGN CONV SPEC ERROR TOLERANCE ERR/TOL VARIABLE STAT BLOCK ------ ----- --------- ------- -------- ---- ----- DS-1 -0.87165E-08 0.10000E-07 -0.87165 28984. # $OLVER01 # = CONVERGED * = NOT CONVERGED LB = AT LOWER BOUNDS UB = AT UPPER BOUNDS DESIGN-SPEC: DS-1 ------------------ SAMPLED VARIABLES: NH3 : NH3 MASSFRAC IN STREAM RAFINATE SUBSTREAM MIXED SPECIFICATION: MAKE NH3 APPROACH 0.160000-04 WITHIN 0.100000-07 MANIPULATED VARIABLES: VARY : TOTAL MASSFLOW IN STREAM AIRFEED SUBSTREAM MIXED LOWER LIMIT = 8,000.00 LB/HR UPPER LIMIT = 45,000.0 LB/HR FINAL VALUE = 28,983.7 LB/HR ASPEN PLUS PLAT: WINDOWS VER: 36.0 04/17/201 PAGE 3 FLOWSHEET SECTION DESIGN-SPEC: DS-1 (CONTINUED) VALUES OF ACCESSED FORTRAN VARIABLES: VARIABLE VALUE AT START FINAL VALUE UNITS OF LOOP -------- -------------- ----------- ----- NH3 0.652506E-05 0.159913E-04 CONVERGENCE BLOCK: $OLVER01 ---------------------------- SPECS: DS-1 MAXIT = 30 PERTURBATION SIZE (% OF RANGE): DS-1 1.0000 MAXIMUM STEP SIZE (% OF RANGE): DS-1 100.00 METHOD: BROYDEN STATUS: CONVERGED

Section 28: Appendix
Frederick | Leach | Nayandi
171 | P a g e
TOTAL NUMBER OF ITERATIONS: 7 *** FINAL VALUES *** VAR# MANIPUL/TEAR-VAR VARIABLE DESCRIPTION UNIT VALUE PREV VALUE ERR/TOL ---- ---------------- ------------------------- ----------- ------------ ------------ ------------ 1 TOTAL MASSFLOW AIRFEED.MIXED.TOTAL.MASSFLOW LB/HR 2.8984+04 2.8915+04 -0.8716 *** ITERATION HISTORY *** DESIGN-SPEC ID: DS-1 ITERATED: TOTAL MASSFLOW IN STREAM AIRFEED SUBSTREAM MIXED ITERATION VARIABLE ERROR ERR/TOL --------- -------- ----- ------- 1 0.3379E+05 -0.9475E-05 -947.5 2 0.3416E+05 -0.9921E-05 -992.1 3 0.2593E+05 0.1284E-04 1284. 4 0.3045E+05 -0.3800E-05 -380.0 5 0.2942E+05 -0.1247E-05 -124.7 6 0.2891E+05 0.1970E-06 19.70 7 0.2898E+05 -0.8716E-08 -0.8716 COMPUTATIONAL SEQUENCE ---------------------- SEQUENCE USED WAS: $OLVER01 STRIPPER (RETURN $OLVER01) OVERALL FLOWSHEET BALANCE ------------------------- ASPEN PLUS PLAT: WINDOWS VER: 36.0 04/17/2018 PAGE 4 FLOWSHEET SECTION OVERALL FLOWSHEET BALANCE (CONTINUED) *** MASS AND ENERGY BALANCE *** IN OUT GENERATION RELATIVE DIFF. CONVENTIONAL COMPONENTS (LBMOL/HR) H2O 1487.88 1487.92 0.429045E-01 -0.287289E-13 H2S 0.223004E-05 0.170229E-02 0.170006E-02 0.727349E-13 NH3 4.35497 4.39957 0.446078E-01 -0.934697E-13 N2 742.157 742.157 0.00000 0.480999E-13 O2 197.282 197.282 0.00000 0.350081E-13 H3O+ 0.607576E-08 0.206218E-07 0.145461E-07 0.238120E-11 NH4+ 0.488827E-01 0.427494E-02 -0.446078E-01 0.230669E-15

Section 28: Appendix
Frederick | Leach | Nayandi
172 | P a g e
HS- 0.366215E-02 0.196531E-02 -0.169684E-02 0.118422E-15 OH- 0.452141E-01 0.230957E-02 -0.429045E-01 0.335710E-15 S-- 0.325827E-05 0.421339E-07 -0.321614E-05 0.211221E-15 TOTAL BALANCE MOLE(LBMOL/HR) 2431.77 2431.77 -0.105165E-12 -0.187003E-15 MASS(LB/HR ) 53983.7 53983.7 0.862597E-14 ENTHALPY(BTU/HR ) -0.177480E+09 -0.177480E+09 0.271437E-07 *** CO2 EQUIVALENT SUMMARY *** FEED STREAMS CO2E 0.00000 LB/HR PRODUCT STREAMS CO2E 0.00000 LB/HR NET STREAMS CO2E PRODUCTION 0.00000 LB/HR UTILITIES CO2E PRODUCTION 0.00000 LB/HR TOTAL CO2E PRODUCTION 0.00000 LB/HR ASPEN PLUS PLAT: WINDOWS VER: 36.0 04/17/2018 PAGE 5 PHYSICAL PROPERTIES SECTION COMPONENTS ---------- ID TYPE ALIAS NAME H2O C H2O WATER H2S C H2S HYDROGEN-SULFIDE NH3 C H3N AMMONIA N2 C N2 NITROGEN O2 C O2 OXYGEN H3O+ C H3O+ H3O+ NH4+ C NH4+ NH4+ HS- C HS- HS- OH- C OH- OH- S-- C S-2 S-- LISTID SUPERCRITICAL COMPONENT LIST GLOBAL H2S NH3 O2 N2 ASPEN PLUS PLAT: WINDOWS VER: 36.0 04/17/2018 PAGE 6 U-O-S BLOCK SECTION BLOCK: STRIPPER MODEL: RADFRAC ------------------------------- INLETS - SOURWATR STAGE 1 AIRFEED STAGE 20 OUTLETS - EXTRACT STAGE 1 RAFINATE STAGE 20 S1 STAGE 1 S2 STAGE 2 S3 STAGE 3 S4 STAGE 4 S5 STAGE 5 S6 STAGE 6 S7 STAGE 7 S8 STAGE 8 S9 STAGE 9

Section 28: Appendix
Frederick | Leach | Nayandi
173 | P a g e
S10 STAGE 10 S11 STAGE 11 S12 STAGE 12 S13 STAGE 13 S14 STAGE 14 S15 STAGE 15 S16 STAGE 16 PROPERTY OPTION SET: ENRTL-RK ELECTROLYTE NRTL / REDLICH-KWONG HENRY-COMPS ID: GLOBAL CHEMISTRY ID: GLOBAL - TRUE SPECIES *** MASS AND ENERGY BALANCE *** IN OUT GENERATION RELATIVE DIFF. TOTAL BALANCE MOLE(LBMOL/HR) 2431.77 2431.77 -0.105165E-12 -0.374005E-15 MASS(LB/HR ) 53983.7 53983.7 0.835640E-14 ENTHALPY(BTU/HR ) -0.177480E+09 -0.177480E+09 0.271437E-07 *** CO2 EQUIVALENT SUMMARY *** FEED STREAMS CO2E 0.00000 LB/HR PRODUCT STREAMS CO2E 0.00000 LB/HR NET STREAMS CO2E PRODUCTION 0.00000 LB/HR UTILITIES CO2E PRODUCTION 0.00000 LB/HR TOTAL CO2E PRODUCTION 0.00000 LB/HR ASPEN PLUS PLAT: WINDOWS VER: 36.0 04/17/2018 PAGE 7 U-O-S BLOCK SECTION BLOCK: STRIPPER MODEL: RADFRAC (CONTINUED) ********************** **** INPUT DATA **** ********************** **** INPUT PARAMETERS **** NUMBER OF STAGES 20 ALGORITHM OPTION STANDARD INITIALIZATION OPTION STANDARD HYDRAULIC PARAMETER CALCULATIONS NO INSIDE LOOP CONVERGENCE METHOD NEWTON DESIGN SPECIFICATION METHOD NESTED MAXIMUM NO. OF OUTSIDE LOOP ITERATIONS 200 MAXIMUM NO. OF INSIDE LOOP ITERATIONS 10 MAXIMUM NUMBER OF FLASH ITERATIONS 30 FLASH TOLERANCE 0.000100000 OUTSIDE LOOP CONVERGENCE TOLERANCE 0.000100000 **** COL-SPECS **** MOLAR VAPOR DIST / TOTAL DIST 1.00000 CONDENSER DUTY (W/O SUBCOOL) BTU/HR 0.0 REBOILER DUTY BTU/HR 0.0 **** REAC-STAGES SPECIFICATIONS ****

Section 28: Appendix
Frederick | Leach | Nayandi
174 | P a g e
STAGE TO STAGE REACTIONS/CHEMISTRY ID 1 20 GLOBAL ***** CHEMISTRY PARAGRAPH GLOBAL ***** **** REACTION PARAMETERS **** RXN NO. TYPE PHASE CONC. TEMP APP TO EQUIL CONVERSION BASIS F 1 EQUILIBRIUM LIQUID MOLE-GAMMA 0.0000 2 EQUILIBRIUM LIQUID MOLE-GAMMA 0.0000 3 EQUILIBRIUM LIQUID MOLE-GAMMA 0.0000 4 EQUILIBRIUM LIQUID MOLE-GAMMA 0.0000 ASPEN PLUS PLAT: WINDOWS VER: 36.0 04/17/2018 PAGE 8 U-O-S BLOCK SECTION BLOCK: STRIPPER MODEL: RADFRAC (CONTINUED) ** STOICHIOMETRIC COEFFICIENTS ** RXN NO. H2O H2S NH3 N2 O2 1 -1.000 0.000 -1.000 0.000 0.000 2 -1.000 0.000 0.000 0.000 0.000 3 -1.000 -1.000 0.000 0.000 0.000 4 -2.000 0.000 0.000 0.000 0.000 RXN NO. H3O+ NH4+ HS- OH- S-- 1 0.000 1.000 0.000 1.000 0.000 2 1.000 0.000 -1.000 0.000 1.000 3 1.000 0.000 1.000 0.000 0.000 4 1.000 0.000 0.000 1.000 0.000 ** COEFFICIENTS OF EQUILIBRIUM CONSTANT EXPRESSION ** RXN NO. A B C D E 1 -1.2566 -3335.7 1.4971 -0.37057E-01 0.0000 2 -9.7420 -8585.5 0.0000 0.0000 0.0000 3 214.58 -12995. -33.547 0.0000 0.0000 4 132.90 -13446. -22.477 0.0000 0.0000 **** PROFILES **** P-SPEC STAGE 1 PRES, PSIA 17.0000 **** TRAY MURPHREE EFFICIENCY **** SEGMENT 1 20 EFFICIENCY 0.25000 ******************* **** RESULTS **** *******************

Section 28: Appendix
Frederick | Leach | Nayandi
175 | P a g e
*** COMPONENT SPLIT FRACTIONS *** OUTLET STREAMS -------------- EXTRACT RAFINATE COMPONENT: H2O .12606 .87394 H2S .99563 .43664E-02 NH3 .99500 .49999E-02 N2 .99999 .13549E-04 O2 .99998 .24540E-04 H3O+ 0.0000 1.0000 NH4+ 0.0000 1.0000 HS- 0.0000 1.0000 OH- 0.0000 1.0000 S-- 0.0000 1.0000 ASPEN PLUS PLAT: WINDOWS VER: 36.0 04/17/2018 PAGE 9 U-O-S BLOCK SECTION BLOCK: STRIPPER MODEL: RADFRAC (CONTINUED) *** SUMMARY OF KEY RESULTS *** TOP STAGE TEMPERATURE F 155.993 BOTTOM STAGE TEMPERATURE F 136.007 TOP STAGE LIQUID FLOW LBMOL/HR 1,347.02 BOTTOM STAGE LIQUID FLOW LBMOL/HR 1,300.40 TOP STAGE VAPOR FLOW LBMOL/HR 1,131.37 BOILUP VAPOR FLOW LBMOL/HR 1,055.55 CONDENSER DUTY (W/O SUBCOOL) BTU/HR 0.0 REBOILER DUTY BTU/HR 0.0 **** MAXIMUM FINAL RELATIVE ERRORS **** BUBBLE POINT 0.14748E-06 STAGE= 7 COMPONENT MASS BALANCE 0.43421E-12 STAGE= 1 COMP=H2S ENERGY BALANCE 0.25465E-09 STAGE= 1 **** PROFILES **** **NOTE** REPORTED VALUES FOR STAGE LIQUID AND VAPOR RATES ARE THE FLOWS FROM THE STAGE INCLUDING ANY SIDE PRODUCT. ENTHALPY STAGE TEMPERATURE PRESSURE BTU/LBMOL HEAT DUTY F PSIA LIQUID VAPOR BTU/HR 1 155.99 17.000 -0.12137E+06 -16763. 2 140.87 17.000 -0.12170E+06 -13763. 9 124.61 17.700 -0.12208E+06 -11086. 10 124.71 17.800 -0.12208E+06 -11083. 11 124.88 17.900 -0.12208E+06 -11090. 19 128.26 18.700 -0.12204E+06 -11207. 20 136.01 18.800 -0.12190E+06 -11029. STAGE FLOW RATE FEED RATE PRODUCT RATE LBMOL/HR LBMOL/HR LBMOL/HR LIQUID VAPOR LIQUID VAPOR MIXED LIQUID VAPOR

Section 28: Appendix
Frederick | Leach | Nayandi
176 | P a g e
1 1347. 1131. 1387.9483 1131.3678 2 1330. 1090. 9 1312. 1056. 10 1312. 1056. 11 1312. 1056. 19 1312. 1057. 20 1300. 1056. 1043.8212 1300.4017 ASPEN PLUS PLAT: WINDOWS VER: 36.0 04/17/2018 PAGE 10 U-O-S BLOCK SECTION BLOCK: STRIPPER MODEL: RADFRAC (CONTINUED) **** MASS FLOW PROFILES **** STAGE FLOW RATE FEED RATE PRODUCT RATE LB/HR LB/HR LB/HR LIQUID VAPOR LIQUID VAPOR MIXED LIQUID VAPOR 1 0.2426E+05 0.3056E+05 .25000+05 .30556+05 2 0.2396E+05 0.2982E+05 9 0.2364E+05 0.2920E+05 10 0.2364E+05 0.2919E+05 11 0.2364E+05 0.2920E+05 19 0.2364E+05 0.2922E+05 20 0.2343E+05 0.2919E+05 .28984+05 .23427+05 **** MOLE-X-PROFILE **** STAGE H2O H2S NH3 N2 O2 1 0.99809 0.11251E-08 0.18498E-02 0.59181E-05 0.27690E-05 2 0.99866 0.10797E-08 0.12793E-02 0.66658E-05 0.31874E-05 9 0.99971 0.38670E-08 0.25581E-03 0.77533E-05 0.37928E-05 10 0.99976 0.47792E-08 0.20823E-03 0.77964E-05 0.38134E-05 11 0.99980 0.58110E-08 0.16925E-03 0.78359E-05 0.38318E-05 19 0.99995 0.68166E-08 0.25225E-04 0.80558E-05 0.39209E-05 20 0.99997 0.57159E-08 0.16916E-04 0.77325E-05 0.37229E-05 **** MOLE-X-PROFILE **** STAGE H3O+ NH4+ HS- OH- S-- 1 0.22679E-11 0.27981E-04 0.27795E-05 0.25199E-04 0.11790E-08 2 0.17480E-11 0.23584E-04 0.29741E-05 0.20608E-04 0.83477E-09 9 0.27966E-11 0.12662E-04 0.53462E-05 0.73152E-05 0.41991E-09 10 0.32538E-11 0.11953E-04 0.56671E-05 0.62852E-05 0.38220E-09 11 0.38016E-11 0.11286E-04 0.58921E-05 0.53932E-05 0.34114E-09 19 0.11098E-10 0.43974E-05 0.23933E-05 0.20040E-05 0.52596E-10

Section 28: Appendix
Frederick | Leach | Nayandi
177 | P a g e
20 0.15858E-10 0.32874E-05 0.15113E-05 0.17760E-05 0.32401E-10 **** MOLE-Y-PROFILE **** STAGE H2O H2S NH3 N2 O2 1 0.16579 0.14981E-05 0.38693E-02 0.65597 0.17437 2 0.13618 0.16272E-05 0.22956E-02 0.68060 0.18092 9 0.10969 0.43145E-05 0.38234E-03 0.70304 0.18688 10 0.10968 0.47821E-05 0.30884E-03 0.70311 0.18690 11 0.10977 0.51821E-05 0.24881E-03 0.70308 0.18690 19 0.11116 0.20911E-05 0.24162E-04 0.70216 0.18665 20 0.10999 0.11146E-05 0.11933E-04 0.70310 0.18690 **** MOLE-Y-PROFILE **** STAGE H3O+ NH4+ HS- OH- S-- 1 0.0000 0.0000 0.0000 0.0000 0.0000 2 0.0000 0.0000 0.0000 0.0000 0.0000 9 0.0000 0.0000 0.0000 0.0000 0.0000 10 0.0000 0.0000 0.0000 0.0000 0.0000 11 0.0000 0.0000 0.0000 0.0000 0.0000 19 0.0000 0.0000 0.0000 0.0000 0.0000 20 0.0000 0.0000 0.0000 0.0000 0.0000 ASPEN PLUS PLAT: WINDOWS VER: 36.0 04/17/2018 PAGE 11 U-O-S BLOCK SECTION BLOCK: STRIPPER MODEL: RADFRAC (CONTINUED) **** K-VALUES **** STAGE H2O H2S NH3 N2 O2 1 0.25509 987.19 4.6439 98356. 55878. 2 0.17531 889.31 3.4495 97242. 54059. 9 0.10975 752.93 2.3565 90651. 49260. 10 0.10942 749.55 2.3481 90194. 49018. 11 0.10933 746.68 2.3437 89757. 48793. 19 0.11468 736.54 2.4121 86814. 47414. 20 0.13995 780.01 2.8218 87864. 48511. **** K-VALUES **** STAGE H3O+ NH4+ HS- OH- S-- 1 0.0000 0.0000 0.0000 0.0000 0.0000 2 0.0000 0.0000 0.0000 0.0000 0.0000 9 0.0000 0.0000 0.0000 0.0000 0.0000 10 0.0000 0.0000 0.0000 0.0000 0.0000 11 0.0000 0.0000 0.0000 0.0000 0.0000 19 0.0000 0.0000 0.0000 0.0000 0.0000 20 0.0000 0.0000 0.0000 0.0000 0.0000 **** RATES OF GENERATION **** LBMOL/HR STAGE H2O H2S NH3 N2 O2 H3O+ 1 0.1127E-01 -.8020E-04 0.1119E-01 0.000 0.000 -.3020E-08 2 0.6535E-02 -.2110E-03 0.6324E-02 0.000 0.000 -.7302E-09 9 0.1538E-02 -.4922E-03 0.1046E-02 0.000 0.000 0.4899E-09 10 0.1351E-02 -.4212E-03 0.9301E-03 0.000 0.000 0.5999E-09

Section 28: Appendix
Frederick | Leach | Nayandi
178 | P a g e
11 0.1170E-02 -.2960E-03 0.8739E-03 0.000 0.000 0.7193E-09 19 0.2822E-03 0.1032E-02 0.1314E-02 0.000 0.000 0.1895E-08 20 0.3200E-03 0.1175E-02 0.1495E-02 0.000 0.000 0.6060E-08 **** RATES OF GENERATION **** LBMOL/HR STAGE NH4+ HS- OH- S-- 1 -.1119E-01 0.8187E-04 -.1127E-01 -.1670E-05 2 -.6324E-02 0.2115E-03 -.6535E-02 -.4779E-06 9 -.1046E-02 0.4922E-03 -.1538E-02 -.4488E-07 10 -.9301E-03 0.4212E-03 -.1351E-02 -.4946E-07 11 -.8739E-03 0.2960E-03 -.1170E-02 -.5384E-07 19 -.1314E-02 -.1032E-02 -.2823E-03 -.3103E-07 20 -.1495E-02 -.1175E-02 -.3200E-03 -.2688E-07 **** MASS-X-PROFILE **** STAGE H2O H2S NH3 N2 O2 1 0.99818 0.21287E-08 0.17489E-02 0.92035E-05 0.49187E-05 2 0.99873 0.20427E-08 0.12094E-02 0.10366E-04 0.56617E-05 9 0.99971 0.73158E-08 0.24183E-03 0.12056E-04 0.67368E-05 10 0.99976 0.90414E-08 0.19685E-03 0.12123E-04 0.67733E-05 11 0.99979 0.10993E-07 0.16000E-03 0.12185E-04 0.68059E-05 19 0.99995 0.12896E-07 0.23846E-04 0.12527E-04 0.69642E-05 20 0.99996 0.10813E-07 0.15991E-04 0.12024E-04 0.66125E-05 ASPEN PLUS PLAT: WINDOWS VER: 36.0 04/17/2018 PAGE 12 U-O-S BLOCK SECTION BLOCK: STRIPPER MODEL: RADFRAC (CONTINUED) **** MASS-X-PROFILE **** STAGE H3O+ NH4+ HS- OH- S-- 1 0.23950E-11 0.28019E-04 0.51034E-05 0.23792E-04 0.20988E-08 2 0.18458E-11 0.23615E-04 0.54606E-05 0.19457E-04 0.14860E-08 9 0.29530E-11 0.12678E-04 0.98152E-05 0.69062E-05 0.74744E-09 10 0.34357E-11 0.11968E-04 0.10404E-04 0.59338E-05 0.68031E-09 11 0.40142E-11 0.11300E-04 0.10817E-04 0.50916E-05 0.60722E-09 19 0.11718E-10 0.44029E-05 0.43938E-05 0.18920E-05 0.93620E-10 20 0.16745E-10 0.32915E-05 0.27746E-05 0.16767E-05 0.57673E-10 **** MASS-Y-PROFILE **** STAGE H2O H2S NH3 N2 O2 1 0.11058 0.18904E-05 0.24398E-02 0.68039 0.20659 2 0.89708E-01 0.20279E-05 0.14295E-02 0.69717 0.21169 9 0.71447E-01 0.53167E-05 0.23543E-03 0.71209 0.21622

Section 28: Appendix
Frederick | Leach | Nayandi
179 | P a g e
10 0.71437E-01 0.58927E-05 0.19017E-03 0.71213 0.21623 11 0.71499E-01 0.63857E-05 0.15321E-03 0.71212 0.21623 19 0.72436E-01 0.25780E-05 0.14884E-04 0.71151 0.21604 20 0.71639E-01 0.13735E-05 0.73479E-05 0.71212 0.21623 **** MASS-Y-PROFILE **** STAGE H3O+ NH4+ HS- OH- S-- 1 0.0000 0.0000 0.0000 0.0000 0.0000 2 0.0000 0.0000 0.0000 0.0000 0.0000 9 0.0000 0.0000 0.0000 0.0000 0.0000 10 0.0000 0.0000 0.0000 0.0000 0.0000 11 0.0000 0.0000 0.0000 0.0000 0.0000 19 0.0000 0.0000 0.0000 0.0000 0.0000 20 0.0000 0.0000 0.0000 0.0000 0.0000 **** MURPHREE EFF **** STAGE H2O H2S NH3 N2 O2 1 0.25000 0.25000 0.25000 0.25000 0.25000 2 0.25000 0.25000 0.25000 0.25000 0.25000 9 0.25000 0.25000 0.25000 0.25000 0.25000 10 0.25000 0.25000 0.25000 0.25000 0.25000 11 0.25000 0.25000 0.25000 0.25000 0.25000 19 0.25000 0.25000 0.25000 0.25000 0.25000 20 0.25000 0.25000 0.25000 0.25000 0.25000 **** MURPHREE EFF **** STAGE H3O+ NH4+ HS- OH- S-- 1 0.25000 0.25000 0.25000 0.25000 0.25000 2 0.25000 0.25000 0.25000 0.25000 0.25000 9 0.25000 0.25000 0.25000 0.25000 0.25000 10 0.25000 0.25000 0.25000 0.25000 0.25000 11 0.25000 0.25000 0.25000 0.25000 0.25000 19 0.25000 0.25000 0.25000 0.25000 0.25000 20 0.25000 0.25000 0.25000 0.25000 0.25000 ASPEN PLUS PLAT: WINDOWS VER: 36.0 04/17/2018 PAGE 13 U-O-S BLOCK SECTION BLOCK: STRIPPER MODEL: RADFRAC (CONTINUED) ******************************** ***** HYDRAULIC PARAMETERS ***** ******************************** *** DEFINITIONS *** MARANGONI INDEX = SIGMA - SIGMATO FLOW PARAM = (ML/MV)*SQRT(RHOV/RHOL) QR = QV*SQRT(RHOV/(RHOL-RHOV)) F FACTOR = QV*SQRT(RHOV) WHERE: SIGMA IS THE SURFACE TENSION OF LIQUID FROM THE STAGE SIGMATO IS THE SURFACE TENSION OF LIQUID TO THE STAGE ML IS THE MASS FLOW OF LIQUID FROM THE STAGE MV IS THE MASS FLOW OF VAPOR TO THE STAGE RHOL IS THE MASS DENSITY OF LIQUID FROM THE STAGE RHOV IS THE MASS DENSITY OF VAPOR TO THE STAGE QV IS THE VOLUMETRIC FLOW RATE OF VAPOR TO THE STAGE

Section 28: Appendix
Frederick | Leach | Nayandi
180 | P a g e
TEMPERATURE F STAGE LIQUID FROM VAPOR TO 1 155.99 140.87 2 140.87 133.19 9 124.61 124.71 10 124.71 124.88 11 124.88 125.10 19 128.26 136.01 20 136.01 189.49 MASS FLOW VOLUME FLOW MOLECULAR WEIGHT LB/HR CUFT/HR STAGE LIQUID FROM VAPOR TO LIQUID FROM VAPOR TO LIQUID FROM VAPOR TO 1 24265. 29821. 397.88 0.41293E+06 18.014 27.348 2 23959. 29515. 390.83 0.39895E+06 18.014 27.497 9 23638. 29194. 383.56 0.37148E+06 18.015 27.658 10 23639. 29195. 383.57 0.36953E+06 18.015 27.658 11 23641. 29198. 383.61 0.36766E+06 18.015 27.657 19 23639. 29195. 383.90 0.35854E+06 18.015 27.659 20 23427. 28984. 381.27 0.38654E+06 18.015 27.767 DENSITY VISCOSITY SURFACE TENSION LB/CUFT CP DYNE/CM STAGE LIQUID FROM VAPOR TO LIQUID FROM VAPOR TO LIQUID FROM 1 60.985 0.72218E-01 0.41347 0.19458E-01 64.150 2 61.302 0.73982E-01 0.46981 0.19323E-01 65.785 9 61.629 0.78589E-01 0.54560 0.19170E-01 67.566 10 61.629 0.79006E-01 0.54514 0.19174E-01 67.558 11 61.628 0.79415E-01 0.54427 0.19180E-01 67.542 ASPEN PLUS PLAT: WINDOWS VER: 36.0 04/17/2018 PAGE 14 U-O-S BLOCK SECTION BLOCK: STRIPPER MODEL: RADFRAC (CONTINUED) DENSITY VISCOSITY SURFACE TENSION LB/CUFT CP DYNE/CM STAGE LIQUID FROM VAPOR TO LIQUID FROM VAPOR TO LIQUID FROM 19 61.575 0.81427E-01 0.52735 0.19462E-01 67.188 20 61.445 0.74981E-01 0.49130 0.20855E-01 66.363 MARANGONI INDEX FLOW PARAM QR REDUCED F-FACTOR STAGE DYNE/CM CUFT/HR (LB-CUFT)**.5/HR 1 0.28000E-01 14218. 0.11097E+06 2 1.6351 0.28200E-01 13868. 0.10851E+06 9 0.66983E-02 0.28913E-01 13274. 0.10414E+06 10 -.78367E-02 0.28990E-01 13239. 0.10387E+06 11 -.16623E-01 0.29066E-01 13206. 0.10361E+06 19 -.14595 0.29444E-01 13047. 0.10231E+06 20 -.82438 0.28236E-01 13511. 0.10585E+06 ************************************ ***** TRAY SIZING CALCULATIONS *****

Section 28: Appendix
Frederick | Leach | Nayandi
181 | P a g e
************************************ ******************* *** SECTION 1 *** ******************* STARTING STAGE NUMBER 1 ENDING STAGE NUMBER 20 FLOODING CALCULATION METHOD GLITSCH6 DESIGN PARAMETERS ----------------- PEAK CAPACITY FACTOR 1.00000 SYSTEM FOAMING FACTOR 1.00000 FLOODING FACTOR 0.80000 MINIMUM COLUMN DIAMETER FT 1.00000 MINIMUM DC AREA/COLUMN AREA 0.100000 HOLE AREA/ACTIVE AREA 0.100000 TRAY SPECIFICATIONS ------------------- TRAY TYPE SIEVE NUMBER OF PASSES 1 TRAY SPACING FT 2.00000 ASPEN PLUS PLAT: WINDOWS VER: 36.0 04/17/2018 PAGE 15 U-O-S BLOCK SECTION BLOCK: STRIPPER MODEL: RADFRAC (CONTINUED) ***** SIZING RESULTS @ STAGE WITH MAXIMUM DIAMETER ***** STAGE WITH MAXIMUM DIAMETER 1 COLUMN DIAMETER FT 4.37737 DC AREA/COLUMN AREA 0.100000 DOWNCOMER VELOCITY FT/SEC 0.073440 FLOW PATH LENGTH FT 3.00747 SIDE DOWNCOMER WIDTH FT 0.68495 SIDE WEIR LENGTH FT 3.18065 CENTER DOWNCOMER WIDTH FT 0.0 CENTER WEIR LENGTH FT MISSING OFF-CENTER DOWNCOMER WIDTH FT 0.0 OFF-CENTER SHORT WEIR LENGTH FT MISSING OFF-CENTER LONG WEIR LENGTH FT MISSING TRAY CENTER TO OCDC CENTER FT 0.0 **** SIZING PROFILES **** STAGE DIAMETER TOTAL AREA ACTIVE AREA SIDE DC AREA FT SQFT SQFT SQFT 1 4.3774 15.049 12.039 1.5049 2 4.3774 15.049 12.039 1.5049 3 4.3774 15.049 12.039 1.5049 4 4.3774 15.049 12.039 1.5049 5 4.3774 15.049 12.039 1.5049 6 4.3774 15.049 12.039 1.5049 7 4.3774 15.049 12.039 1.5049 8 4.3774 15.049 12.039 1.5049 9 4.3774 15.049 12.039 1.5049

Section 28: Appendix
Frederick | Leach | Nayandi
182 | P a g e
10 4.3774 15.049 12.039 1.5049 11 4.3774 15.049 12.039 1.5049 12 4.3774 15.049 12.039 1.5049 13 4.3774 15.049 12.039 1.5049 14 4.3774 15.049 12.039 1.5049 15 4.3774 15.049 12.039 1.5049 16 4.3774 15.049 12.039 1.5049 17 4.3774 15.049 12.039 1.5049 18 4.3774 15.049 12.039 1.5049 19 4.3774 15.049 12.039 1.5049 20 4.3774 15.049 12.039 1.5049 **** ADDITIONAL SIZING PROFILES **** FLOODING DC BACKUP/ STAGE FACTOR PRES. DROP DC BACKUP (TSPC+WHT) PSI FT 1 80.00 0.1715 0.7852 36.24 2 77.73 0.1608 0.7189 33.18 3 76.46 0.1581 0.7080 32.68 4 75.64 0.1563 0.7013 32.37 5 75.08 0.1552 0.6968 32.16 6 74.64 0.1543 0.6935 32.01 7 74.29 0.1535 0.6909 31.89 8 73.99 0.1529 0.6887 31.78 9 73.72 0.1523 0.6867 31.69 10 73.47 0.1518 0.6849 31.61 11 73.23 0.1513 0.6832 31.53 ASPEN PLUS PLAT: WINDOWS VER: 36.0 04/17/2018 PAGE 16 U-O-S BLOCK SECTION BLOCK: STRIPPER MODEL: RADFRAC (CONTINUED) FLOODING DC BACKUP/ STAGE FACTOR PRES. DROP DC BACKUP (TSPC+WHT) PSI FT 12 73.00 0.1508 0.6816 31.46 13 72.78 0.1503 0.6801 31.39 14 72.56 0.1499 0.6785 31.32 15 72.34 0.1494 0.6770 31.25 16 72.12 0.1490 0.6756 31.18 17 71.92 0.1486 0.6742 31.12 18 71.79 0.1482 0.6733 31.07 19 72.08 0.1488 0.6751 31.16 20 75.57 0.1554 0.6984 32.23 HEIGHT DC REL TR LIQ REL FRA APPR TO STAGE OVER WEIR FROTH DENS FROTH DENS SYS LIMIT FT 1 0.1694 0.6083 0.1696 40.48 2 0.1663 0.6083 0.1708 39.29 3 0.1647 0.6083 0.1716 38.65 4 0.1637 0.6083 0.1720 38.25 5 0.1632 0.6083 0.1724 37.99 6 0.1628 0.6083 0.1727 37.80 7 0.1626 0.6083 0.1729 37.66 8 0.1624 0.6083 0.1731 37.54 9 0.1622 0.6083 0.1733 37.43 10 0.1621 0.6083 0.1734 37.34 11 0.1620 0.6083 0.1736 37.25

Section 28: Appendix
Frederick | Leach | Nayandi
183 | P a g e
12 0.1620 0.6083 0.1737 37.16 13 0.1619 0.6083 0.1739 37.08 14 0.1618 0.6083 0.1740 37.00 15 0.1617 0.6083 0.1742 36.92 16 0.1616 0.6083 0.1743 36.85 17 0.1616 0.6083 0.1745 36.77 18 0.1615 0.6083 0.1746 36.73 19 0.1616 0.6083 0.1744 36.85 20 0.1622 0.6083 0.1723 38.22 ASPEN PLUS PLAT: WINDOWS VER: 36.0 04/17/2018 PAGE 17 STREAM SECTION AIRFEED EXTRACT RAFINATE S1 S10 ------------------------------- STREAM ID AIRFEED EXTRACT RAFINATE S1 S10 FROM : ---- STRIPPER STRIPPER STRIPPER STRIPPER TO : STRIPPER ---- ---- ---- ---- SUBSTREAM: MIXED PHASE: VAPOR VAPOR LIQUID LIQUID LIQUID COMPONENTS: LBMOL/HR H2O 104.3821 187.5644 1300.3562 9.9809-06 9.9976-06 H2S 0.0 1.6949-03 7.4329-06 1.1251-14 4.7792-14 NH3 0.0 4.3776 2.1998-02 1.8498-08 2.0823-09 N2 742.1569 742.1469 1.0055-02 5.9181-11 7.7964-11 O2 197.2822 197.2774 4.8412-03 2.7690-11 3.8134-11 H3O+ 0.0 0.0 2.0622-08 2.2679-17 3.2538-17 NH4+ 0.0 0.0 4.2749-03 2.7981-10 1.1953-10 HS- 0.0 0.0 1.9653-03 2.7795-11 5.6671-11 OH- 0.0 0.0 2.3096-03 2.5199-10 6.2852-11 S-- 0.0 0.0 4.2134-08 1.1790-14 3.8220-15 COMPONENTS: LB/HR H2O 1880.4732 3379.0248 2.3426+04 1.7981-04 1.8011-04 H2S 0.0 5.7764-02 2.5333-04 3.8345-13 1.6288-12 NH3 0.0 74.5526 0.3746 3.1504-07 3.5463-08 N2 2.0790+04 2.0790+04 0.2817 1.6579-09 2.1841-09 O2 6312.7943 6312.6394 0.1549 8.8603-10 1.2202-09 H3O+ 0.0 0.0 3.9228-07 4.3142-16 6.1895-16 NH4+ 0.0 0.0 7.7111-02 5.0472-09 2.1561-09 HS- 0.0 0.0 6.5001-02 9.1930-10 1.8744-09

Section 28: Appendix
Frederick | Leach | Nayandi
184 | P a g e
OH- 0.0 0.0 3.9281-02 4.2858-09 1.0690-09 S-- 0.0 0.0 1.3511-06 3.7806-13 1.2256-13 TOTAL FLOW: LBMOL/HR 1043.8213 1131.3679 1300.4017 1.0000-05 1.0000-05 LB/HR 2.8984+04 3.0556+04 2.3427+04 1.8014-04 1.8015-04 CUFT/HR 2.0768+05 4.3917+05 381.2737 2.9538-06 2.9232-06 STATE VARIABLES: TEMP F 190.0000 155.9929 136.0066 155.9929 124.7051 PRES PSIA 35.0000 17.0000 18.8000 17.0000 17.8000 VFRAC 1.0000 1.0000 0.0 0.0 0.0 LFRAC 0.0 0.0 1.0000 1.0000 1.0000 SFRAC 0.0 0.0 0.0 0.0 0.0 ENTHALPY: BTU/LBMOL -9609.4611 -1.6763+04 -1.2190+05 -1.2137+05 -1.2208+05 BTU/LB -346.0763 -620.6729 -6766.2371 -6737.8567 -6776.5742 BTU/HR -1.0031+07 -1.8966+07 -1.5851+08 -1.2137 -1.2208 ENTROPY: BTU/LBMOL-R 0.1280 0.6287 -37.1067 -36.5091 -37.4502 BTU/LB-R 4.6099-03 2.3278-02 -2.0597 -2.0268 -2.0788 DENSITY: LBMOL/CUFT 5.0262-03 2.5761-03 3.4107 3.3855 3.4209 LB/CUFT 0.1396 6.9577-02 61.4448 60.9846 61.6291 AVG MW 27.7669 27.0084 18.0154 18.0136 18.0153 ASPEN PLUS PLAT: WINDOWS VER: 36.0 04/17/2018 PAGE 18 STREAM SECTION S11 S12 S13 S14 S15 ------------------- STREAM ID S11 S12 S13 S14 S15 FROM : STRIPPER STRIPPER STRIPPER STRIPPER STRIPPER TO : ---- ---- ---- ---- ---- SUBSTREAM: MIXED PHASE: LIQUID LIQUID LIQUID LIQUID LIQUID COMPONENTS: LBMOL/HR H2O 9.9980-06 9.9983-06 9.9986-06 9.9988-06 9.9990-06 H2S 5.8110-14 6.8936-14 7.9139-14 8.7291-14 9.2003-14 NH3 1.6925-09 1.3724-09 1.1093-09 8.9262-10 7.1396-10

Section 28: Appendix
Frederick | Leach | Nayandi
185 | P a g e
N2 7.8359-11 7.8732-11 7.9093-11 7.9447-11 7.9797-11 O2 3.8318-11 3.8488-11 3.8652-11 3.8810-11 3.8967-11 H3O+ 3.8016-17 4.4421-17 5.1692-17 5.9684-17 6.8207-17 NH4+ 1.1286-10 1.0616-10 9.9042-11 9.1237-11 8.2664-11 HS- 5.8921-11 5.9805-11 5.9002-11 5.6369-11 5.1984-11 OH- 5.3932-11 4.6351-11 4.0035-11 3.4864-11 3.0676-11 S-- 3.4114-15 2.9788-15 2.5414-15 2.1168-15 1.7192-15 COMPONENTS: LB/HR H2O 1.8012-04 1.8012-04 1.8013-04 1.8013-04 1.8013-04 H2S 1.9805-12 2.3495-12 2.6972-12 2.9751-12 3.1356-12 NH3 2.8824-08 2.3373-08 1.8892-08 1.5202-08 1.2159-08 N2 2.1951-09 2.2056-09 2.2157-09 2.2256-09 2.2354-09 O2 1.2261-09 1.2316-09 1.2368-09 1.2419-09 1.2469-09 H3O+ 7.2317-16 8.4501-16 9.8331-16 1.1354-15 1.2975-15 NH4+ 2.0358-09 1.9149-09 1.7865-09 1.6457-09 1.4911-09 HS- 1.9488-09 1.9780-09 1.9515-09 1.8644-09 1.7193-09 OH- 9.1726-10 7.8833-10 6.8091-10 5.9296-10 5.2174-10 S-- 1.0939-13 9.5522-14 8.1497-14 6.7879-14 5.5130-14 TOTAL FLOW: LBMOL/HR 1.0000-05 1.0000-05 1.0000-05 1.0000-05 1.0000-05 LB/HR 1.8015-04 1.8015-04 1.8015-04 1.8015-04 1.8015-04 CUFT/HR 2.9232-06 2.9234-06 2.9235-06 2.9237-06 2.9238-06 STATE VARIABLES: TEMP F 124.8789 125.0987 125.3450 125.6061 125.8752 PRES PSIA 17.9000 18.0000 18.1000 18.2000 18.3000 VFRAC 0.0 0.0 0.0 0.0 0.0 LFRAC 1.0000 1.0000 1.0000 1.0000 1.0000 SFRAC 0.0 0.0 0.0 0.0 0.0 ENTHALPY: BTU/LBMOL -1.2208+05 -1.2208+05 -1.2208+05 -1.2208+05 -1.2207+05 BTU/LB -6776.5770 -6776.5038 -6776.3804 -6776.2236 -6776.0439 BTU/HR -1.2208 -1.2208 -1.2208 -1.2208 -1.2207 ENTROPY: BTU/LBMOL-R -37.4450 -37.4384 -37.4310 -37.4231 -37.4149 BTU/LB-R -2.0785 -2.0781 -2.0777 -2.0773 -2.0768 DENSITY:

Section 28: Appendix
Frederick | Leach | Nayandi
186 | P a g e
LBMOL/CUFT 3.4209 3.4207 3.4206 3.4204 3.4202 LB/CUFT 61.6279 61.6256 61.6227 61.6192 61.6155 AVG MW 18.0153 18.0154 18.0154 18.0154 18.0154 ASPEN PLUS PLAT: WINDOWS VER: 36.0 04/17/2018 PAGE 19 STREAM SECTION S16 S2 S3 S4 S5 --------------- STREAM ID S16 S2 S3 S4 S5 FROM : STRIPPER STRIPPER STRIPPER STRIPPER STRIPPER TO : ---- ---- ---- ---- ---- SUBSTREAM: MIXED PHASE: LIQUID LIQUID LIQUID LIQUID LIQUID COMPONENTS: LBMOL/HR H2O 9.9992-06 9.9866-06 9.9899-06 9.9921-06 9.9936-06 H2S 9.2312-14 1.0797-14 1.1748-14 1.3606-14 1.6330-14 NH3 5.6618-10 1.2793-08 9.5574-09 7.4352-09 5.9143-09 N2 8.0143-11 6.6658-11 7.0696-11 7.3091-11 7.4628-11 O2 3.9121-11 3.1874-11 3.4173-11 3.5536-11 3.6399-11 H3O+ 7.7092-17 1.7480-17 1.6086-17 1.6217-17 1.7231-17 NH4+ 7.3428-11 2.3584-10 2.0642-10 1.8493-10 1.6828-10 HS- 4.6136-11 2.9741-11 3.2149-11 3.4997-11 3.8260-11 OH- 2.7290-11 2.0608-10 1.7425-10 1.4992-10 1.3001-10 S-- 1.3582-15 8.3477-15 6.8521-15 6.0499-15 5.5468-15 COMPONENTS: LB/HR H2O 1.8014-04 1.7991-04 1.7997-04 1.8001-04 1.8004-04 H2S 3.1462-12 3.6797-13 4.0038-13 4.6373-13 5.5654-13 NH3 9.6423-09 2.1787-07 1.6277-07 1.2662-07 1.0072-07 N2 2.2451-09 1.8673-09 1.9805-09 2.0475-09 2.0906-09 O2 1.2518-09 1.0199-09 1.0935-09 1.1371-09 1.1647-09 H3O+ 1.4665-15 3.3251-16 3.0599-16 3.0850-16 3.2778-16 NH4+ 1.3245-09 4.2541-09 3.7234-09 3.3357-09 3.0354-09 HS- 1.5259-09 9.8367-10 1.0633-09 1.1575-09 1.2654-09 OH- 4.6414-10 3.5051-09 2.9637-09 2.5498-09 2.2112-09

Section 28: Appendix
Frederick | Leach | Nayandi
187 | P a g e
S-- 4.3554-14 2.6769-13 2.1973-13 1.9400-13 1.7787-13 TOTAL FLOW: LBMOL/HR 1.0000-05 1.0000-05 1.0000-05 1.0000-05 1.0000-05 LB/HR 1.8015-04 1.8014-04 1.8014-04 1.8015-04 1.8015-04 CUFT/HR 2.9240-06 2.9386-06 2.9314-06 2.9276-06 2.9255-06 STATE VARIABLES: TEMP F 126.1507 140.8701 133.1894 129.0372 126.7526 PRES PSIA 18.4000 17.0000 17.1000 17.2000 17.3000 VFRAC 0.0 0.0 0.0 0.0 0.0 LFRAC 1.0000 1.0000 1.0000 1.0000 1.0000 SFRAC 0.0 0.0 0.0 0.0 0.0 ENTHALPY: BTU/LBMOL -1.2207+05 -1.2170+05 -1.2186+05 -1.2196+05 -1.2201+05 BTU/LB -6775.8457 -6755.5715 -6764.7157 -6769.8269 -6772.7987 BTU/HR -1.2207 -1.2170 -1.2186 -1.2196 -1.2201 ENTROPY: BTU/LBMOL-R -37.4066 -36.9570 -37.1890 -37.3158 -37.3861 BTU/LB-R -2.0764 -2.0516 -2.0644 -2.0714 -2.0753 DENSITY: LBMOL/CUFT 3.4199 3.4030 3.4114 3.4158 3.4183 LB/CUFT 61.6112 61.3024 61.4542 61.5347 61.5794 AVG MW 18.0154 18.0142 18.0145 18.0147 18.0149 ASPEN PLUS PLAT: WINDOWS VER: 36.0 04/17/2018 PAGE 20 STREAM SECTION S6 S7 S8 S9 SOURWATR -------------------- STREAM ID S6 S7 S8 S9 SOURWATR FROM : STRIPPER STRIPPER STRIPPER STRIPPER ---- TO : ---- ---- ---- ---- STRIPPER SUBSTREAM: MIXED PHASE: LIQUID LIQUID LIQUID LIQUID LIQUID COMPONENTS: LBMOL/HR H2O 9.9948-06 9.9957-06 9.9965-06 9.9971-06 1383.4956 H2S 2.0023-14 2.4858-14 3.1025-14 3.8670-14 2.2300-06 NH3 4.7632-09 3.8619-09 3.1414-09 2.5581-09 4.3550 N2 7.5680-11 7.6445-11 7.7040-11 7.7533-11 0.0 O2 3.6975-11 3.7381-11 3.7685-11 3.7928-11 0.0

Section 28: Appendix
Frederick | Leach | Nayandi
188 | P a g e
H3O+ 1.8919-17 2.1241-17 2.4231-17 2.7966-17 6.0758-09 NH4+ 1.5489-10 1.4385-10 1.3458-10 1.2662-10 4.8883-02 HS- 4.1883-11 4.5759-11 4.9707-11 5.3462-11 3.6621-03 OH- 1.1299-10 9.8083-11 8.4868-11 7.3152-11 4.5214-02 S-- 5.1775-15 4.8580-15 4.5408-15 4.1991-15 3.2583-06 COMPONENTS: LB/HR H2O 1.8006-04 1.8008-04 1.8009-04 1.8010-04 2.4924+04 H2S 6.8241-13 8.4720-13 1.0574-12 1.3180-12 7.6004-05 NH3 8.1120-08 6.5771-08 5.3501-08 4.3566-08 74.1675 N2 2.1200-09 2.1415-09 2.1582-09 2.1720-09 0.0 O2 1.1831-09 1.1961-09 1.2059-09 1.2136-09 0.0 H3O+ 3.5990-16 4.0405-16 4.6093-16 5.3200-16 1.1558-07 NH4+ 2.7938-09 2.5948-09 2.4276-09 2.2840-09 0.8817 HS- 1.3853-09 1.5134-09 1.6440-09 1.7682-09 0.1211 OH- 1.9218-09 1.6682-09 1.4434-09 1.2442-09 0.7690 S-- 1.6603-13 1.5578-13 1.4561-13 1.3465-13 1.0448-04 TOTAL FLOW: LBMOL/HR 1.0000-05 1.0000-05 1.0000-05 1.0000-05 1387.9483 LB/HR 1.8015-04 1.8015-04 1.8015-04 1.8015-04 2.5000+04 CUFT/HR 2.9243-06 2.9236-06 2.9233-06 2.9232-06 415.4715 STATE VARIABLES: TEMP F 125.5196 124.9002 124.6456 124.6097 190.0000 PRES PSIA 17.4000 17.5000 17.6000 17.7000 25.0000 VFRAC 0.0 0.0 0.0 0.0 0.0 LFRAC 1.0000 1.0000 1.0000 1.0000 1.0000 SFRAC 0.0 0.0 0.0 0.0 0.0 ENTHALPY: BTU/LBMOL -1.2204+05 -1.2206+05 -1.2207+05 -1.2208+05 -1.2065+05 BTU/LB -6774.5514 -6775.5774 -6776.1567 -6776.4551 -6697.9781 BTU/HR -1.2204 -1.2206 -1.2207 -1.2208 -1.6745+08 ENTROPY: BTU/LBMOL-R -37.4242 -37.4435 -37.4516 -37.4529 -35.5415 BTU/LB-R -2.0774 -2.0785 -2.0789 -2.0790 -1.9732 DENSITY: LBMOL/CUFT 3.4196 3.4204 3.4208 3.4209 3.3407 LB/CUFT 61.6046 61.6186 61.6257 61.6287 60.1726 AVG MW 18.0150 18.0151 18.0152 18.0152 18.0122

Section 28: Appendix
Frederick | Leach | Nayandi
189 | P a g e
ASPEN PLUS PLAT: WINDOWS VER: 36.0 04/17/2018 PAGE 21 PROBLEM STATUS SECTION BLOCK STATUS ------------ **************************************************************************** * * * Calculations were completed normally * * * * All Unit Operation blocks were completed normally * * * * All streams were flashed normally * * * * All Convergence blocks were completed normally * * * ****************************************************************************

Section 28: Appendix
Frederick | Leach | Nayandi
190 | P a g e
A.5.3: Natural Gas Stripping Column Simulation without Acid
A.5.3.1: Input File
o This is an example of an ASPEN simulation that helped us optimize the stripping column. Since there is no one perfect simulation, the inputs and results from this
simulation may not match the specifications, required outputs, or column sizing data; and this is expected. This specific run is for the 17-tray column with 25% Murphree Efficiency, Design Specified to reduce ammonia to 15 ppm (so that
ammonia plus ammonium are together less than 20 ppm), ), for the maximum sour water flow rate and ammonia concentration.
; ;Input Summary created by Aspen Plus Rel. 36.0 at 04:06:59 Tue Apr 17, 2018 ;Directory \\nestor\leconnor\CBE459 Filename C:\Users\leconnor\AppData\Local\Temp\~ap484d.txt ; DYNAMICS DYNAMICS RESULTS=ON IN-UNITS ENG SHORT-LENGTH=in DEF-STREAMS CONVEN ALL MODEL-OPTION DESCRIPTION " Electrolytes Simulation with English Units : F, psi, lb/hr, lbmol/hr, Btu/hr, cuft/hr. Property Method: ELECNRTL Flow basis for input: Mass Stream report composition: Mass flow " DATABANKS 'APV100 ASPENPCD' / 'APV100 AQUEOUS' / 'APV100 SOLIDS' & / 'APV100 INORGANIC' / 'APV100 PURE36' PROP-SOURCES 'APV100 ASPENPCD' / 'APV100 AQUEOUS' / & 'APV100 SOLIDS' / 'APV100 INORGANIC' / 'APV100 PURE36' COMPONENTS H2O H2O / H2S H2S / NH3 H3N / N2 N2 / O2 O2 / H3O+ H3O+ / NH4+ NH4+ / HS- HS- / OH- OH- / S-- S-2 / CH4 CH4

Section 28: Appendix
Frederick | Leach | Nayandi
191 | P a g e
HENRY-COMPS GLOBAL H2S NH3 O2 N2 CH4 SOLVE RUN-MODE MODE=SIM CHEMISTRY GLOBAL PARAM GAMMA-BASIS=UNSYMMETRIC STOIC 1 NH3 -1 / H2O -1 / OH- 1 / NH4+ 1 STOIC 2 H2O -1 / HS- -1 / H3O+ 1 / S-- 1 STOIC 3 H2O -1 / H2S -1 / H3O+ 1 / HS- 1 STOIC 4 H2O -2 / OH- 1 / H3O+ 1 K-STOIC 1 A=-1.256563 B=-3335.699951 C=1.4971 D=-0.037057 K-STOIC 2 A=-9.741963 B=-8585.469727 C=0 D=0 K-STOIC 3 A=214.582443 B=-12995.400391 C=-33.5471 D=0 K-STOIC 4 A=132.89888 B=-13445.900391 C=-22.477301 D=0 FLOWSHEET BLOCK STRIPPER IN=SOURWATR AIRFEED OUT=EXTRACT RAFINATE & S1 PROPERTIES ENRTL-RK HENRY-COMPS=GLOBAL CHEMISTRY=GLOBAL & TRUE-COMPS=NO PROPERTIES ELECNRTL PROP-DATA HOCETA-1 IN-UNITS ENG SHORT-LENGTH=in PROP-LIST HOCETA BPVAL H2O H2O 1.700000000 BPVAL H2O H2S .7000000000 BPVAL H2O NH3 .2000000000 BPVAL H2S H2O .7000000000 BPVAL H2S NH3 .1500000000 BPVAL NH3 H2O .2000000000 BPVAL NH3 H2S .1500000000 PROP-DATA HENRY-1 IN-UNITS ENG PRESSURE=psi PDROP=psi SHORT-LENGTH=in PROP-LIST HENRY BPVAL H2S H2O 381.6601370 -23826.24000 -55.05510000 & .0330916666 31.73000000 301.7300000 0.0 BPVAL NH3 H2O -158.8183807 -283.5936000 28.10010000 & -.0273483333 31.73000000 436.7300000 0.0 BPVAL N2 H2O 180.3399883 -15178.98600 -21.55800000 & -4.6868000E-3 31.73000000 163.1300000 0.0 BPVAL O2 H2O 157.8962298 -13995.10800 -18.39740000 & -5.2464111E-3 33.53000000 166.7300000 0.0 BPVAL N2 NH3 10.80598441 0.0 0.0 0.0 67.73000000 & 67.73000000 0.0 BPVAL O2 NH3 11.20948341 0.0 0.0 0.0 67.73000000 & 67.73000000 0.0 BPVAL CH4 H2O 201.1724271 -16401.00600 -25.03790000 & 7.96855556E-5 35.33000000 175.7300000 0.0 PROP-DATA NRTL-1 IN-UNITS ENG SHORT-LENGTH=in PROP-LIST NRTL BPVAL H2O H2S -3.674000000 2080.620000 .2000000000 0.0 0.0 & 0.0 32.00000000 302.0000000 BPVAL H2S H2O -3.674000000 2080.620000 .2000000000 0.0 0.0 & 0.0 32.00000000 302.0000000 BPVAL H2O NH3 -.5440720000 3021.244200 .2000000000 0.0 0.0 & 0.0 32.00000000 392.0000000 BPVAL NH3 H2O -.1642422000 -1849.545000 .2000000000 0.0 & 0.0 0.0 32.00000000 392.0000000
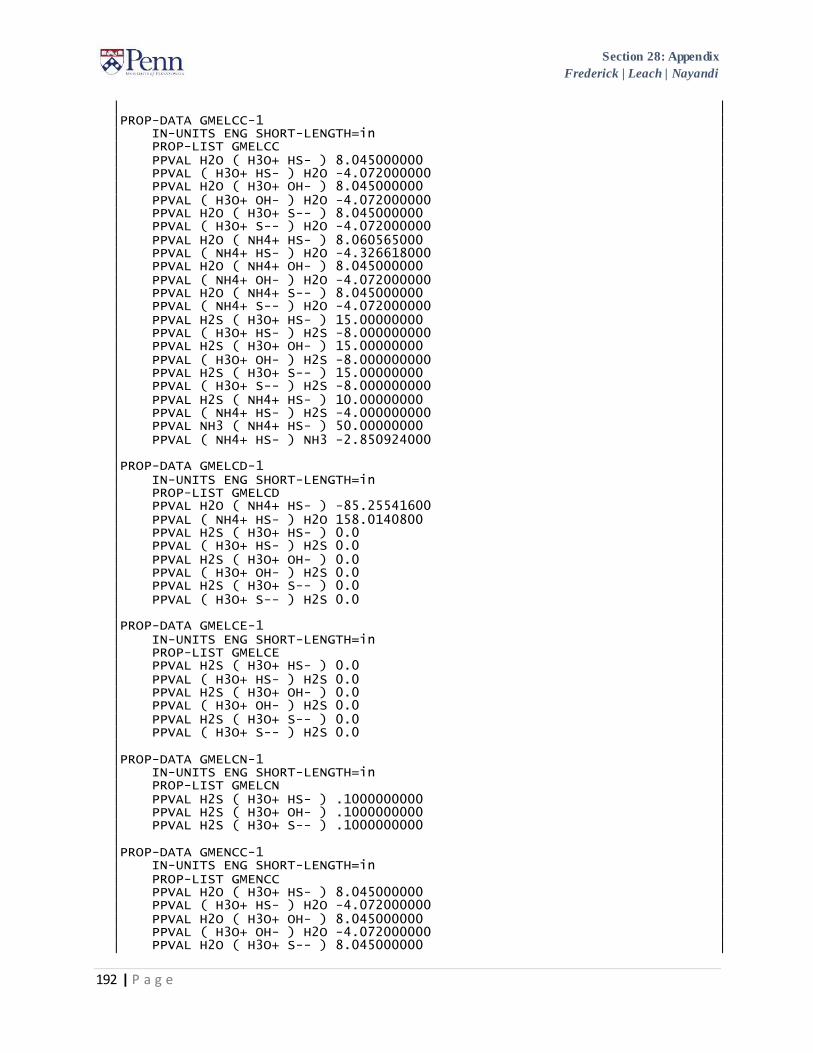
Section 28: Appendix
Frederick | Leach | Nayandi
192 | P a g e
PROP-DATA GMELCC-1 IN-UNITS ENG SHORT-LENGTH=in PROP-LIST GMELCC PPVAL H2O ( H3O+ HS- ) 8.045000000 PPVAL ( H3O+ HS- ) H2O -4.072000000 PPVAL H2O ( H3O+ OH- ) 8.045000000 PPVAL ( H3O+ OH- ) H2O -4.072000000 PPVAL H2O ( H3O+ S-- ) 8.045000000 PPVAL ( H3O+ S-- ) H2O -4.072000000 PPVAL H2O ( NH4+ HS- ) 8.060565000 PPVAL ( NH4+ HS- ) H2O -4.326618000 PPVAL H2O ( NH4+ OH- ) 8.045000000 PPVAL ( NH4+ OH- ) H2O -4.072000000 PPVAL H2O ( NH4+ S-- ) 8.045000000 PPVAL ( NH4+ S-- ) H2O -4.072000000 PPVAL H2S ( H3O+ HS- ) 15.00000000 PPVAL ( H3O+ HS- ) H2S -8.000000000 PPVAL H2S ( H3O+ OH- ) 15.00000000 PPVAL ( H3O+ OH- ) H2S -8.000000000 PPVAL H2S ( H3O+ S-- ) 15.00000000 PPVAL ( H3O+ S-- ) H2S -8.000000000 PPVAL H2S ( NH4+ HS- ) 10.00000000 PPVAL ( NH4+ HS- ) H2S -4.000000000 PPVAL NH3 ( NH4+ HS- ) 50.00000000 PPVAL ( NH4+ HS- ) NH3 -2.850924000 PROP-DATA GMELCD-1 IN-UNITS ENG SHORT-LENGTH=in PROP-LIST GMELCD PPVAL H2O ( NH4+ HS- ) -85.25541600 PPVAL ( NH4+ HS- ) H2O 158.0140800 PPVAL H2S ( H3O+ HS- ) 0.0 PPVAL ( H3O+ HS- ) H2S 0.0 PPVAL H2S ( H3O+ OH- ) 0.0 PPVAL ( H3O+ OH- ) H2S 0.0 PPVAL H2S ( H3O+ S-- ) 0.0 PPVAL ( H3O+ S-- ) H2S 0.0 PROP-DATA GMELCE-1 IN-UNITS ENG SHORT-LENGTH=in PROP-LIST GMELCE PPVAL H2S ( H3O+ HS- ) 0.0 PPVAL ( H3O+ HS- ) H2S 0.0 PPVAL H2S ( H3O+ OH- ) 0.0 PPVAL ( H3O+ OH- ) H2S 0.0 PPVAL H2S ( H3O+ S-- ) 0.0 PPVAL ( H3O+ S-- ) H2S 0.0 PROP-DATA GMELCN-1 IN-UNITS ENG SHORT-LENGTH=in PROP-LIST GMELCN PPVAL H2S ( H3O+ HS- ) .1000000000 PPVAL H2S ( H3O+ OH- ) .1000000000 PPVAL H2S ( H3O+ S-- ) .1000000000 PROP-DATA GMENCC-1 IN-UNITS ENG SHORT-LENGTH=in PROP-LIST GMENCC PPVAL H2O ( H3O+ HS- ) 8.045000000 PPVAL ( H3O+ HS- ) H2O -4.072000000 PPVAL H2O ( H3O+ OH- ) 8.045000000 PPVAL ( H3O+ OH- ) H2O -4.072000000 PPVAL H2O ( H3O+ S-- ) 8.045000000

Section 28: Appendix
Frederick | Leach | Nayandi
193 | P a g e
PPVAL ( H3O+ S-- ) H2O -4.072000000 PPVAL H2O ( NH4+ HS- ) 8.060565000 PPVAL ( NH4+ HS- ) H2O -4.326618000 PPVAL H2O ( NH4+ OH- ) 8.045000000 PPVAL ( NH4+ OH- ) H2O -4.072000000 PPVAL H2O ( NH4+ S-- ) 8.045000000 PPVAL ( NH4+ S-- ) H2O -4.072000000 PROP-DATA GMENCD-1 IN-UNITS ENG SHORT-LENGTH=in PROP-LIST GMENCD PPVAL H2O ( NH4+ HS- ) -85.25541600 PPVAL ( NH4+ HS- ) H2O 158.0140800 STREAM AIRFEED SUBSTREAM MIXED TEMP=190. PRES=35. MASS-FLOW=22347. MOLE-FRAC H2O 0.1 / CH4 0.9 STREAM SOURWATR SUBSTREAM MIXED TEMP=190. PRES=25. MASS-FLOW=25000. MASS-FRAC H2O 0.996995 / H2S 5E-006 / NH3 0.003 BLOCK STRIPPER RADFRAC SUBOBJECTS INTERNALS = CS-1 PARAM NSTAGE=17 ALGORITHM=STANDARD EFF=MURPHREE ABSORBER=YES & HYDRAULIC=NO MAXOL=200 DAMPING=NONE PARAM2 STATIC-DP=YES COL-CONFIG CONDENSER=NONE REBOILER=NONE CA-CONFIG=INT-1 FEEDS SOURWATR 1 / AIRFEED 17 ON-STAGE PRODUCTS RAFINATE 17 L / EXTRACT 1 V PSEUDO-STREA S1 1 MOLE-FLOW=1E-005 P-SPEC 1 17. COL-SPECS DP-STAGE=0.1 PROPERTIES ENRTL-RK HENRY-COMPS=GLOBAL CHEMISTRY=GLOBAL & FREE-WATER=STEAM-TA SOLU-WATER=3 TRUE-COMPS=YES REPORT NOHYDRAULIC STEFF-SEC SECNO=1 1 17 0.25 INTERNALS CS-1 STAGE1=1 STAGE2=17 P-UPDATE=NO TRAY-SIZE 1 1 17 SIEVE DESIGN-SPEC DS-1 DEFINE NH3 MASS-FRAC STREAM=RAFINATE SUBSTREAM=MIXED & COMPONENT=NH3 SPEC "NH3" TO "15e-06" TOL-SPEC ".1e-07" VARY STREAM-VAR STREAM=AIRFEED SUBSTREAM=MIXED & VARIABLE=MASS-FLOW UOM="lb/hr" LIMITS "8000" "45000" EO-CONV-OPTI CONV-OPTIONS PARAM TEAR-METHOD=BROYDEN TOL=0.001 SPEC-METHOD=BROYDEN STREAM-REPOR MOLEFLOW MASSFLOW ; ; ; ;

Section 28: Appendix
Frederick | Leach | Nayandi
194 | P a g e
A.5.3.2: Output File
+ + + + + + + + + + + + + + + + + + + + + + + + + + + + + + + + + + + + + + + + + + + + + + + + + + + + + + + + + + + + + + + + + + + + + + + + + + + + + + + + + + + + + + ASPEN PLUS CALCULATION REPORT + + + + + + + + + + + + + + + + + + + + + + + + + + + + + + + + + + + + + + + + + + + + + + + + + + + + + + + + + + + + + + + + + + + + + + + + + + + + + + + + + + + + + + ASPEN PLUS IS A TRADEMARK OF HOTLINE: ASPEN TECHNOLOGY, INC. U.S.A. 888/996-7100 781/221-6400 EUROPE (44) 1189-226555 PLATFORM: WINDOWS APRIL 17, 2018 VERSION: 36.0 Build 249 TUESDAY INSTALLATION: 4:05:29 A.M. ASPEN PLUS PLAT: WINDOWS VER: 36.0 04/17/2018 PAGE I ASPEN PLUS (R) IS A PROPRIETARY PRODUCT OF ASPEN TECHNOLOGY, INC. (ASPENTECH), AND MAY BE USED ONLY UNDER AGREEMENT WITH ASPENTECH. RESTRICTED RIGHTS LEGEND: USE, REPRODUCTION, OR DISCLOSURE BY THE U.S. GOVERNMENT IS SUBJECT TO RESTRICTIONS SET FORTH IN (i) FAR 52.227-14, Alt. III, (ii) FAR 52.227-19, (iii) DFARS 252.227-7013(c)(1)(ii), or (iv) THE ACCOMPANYING LICENSE AGREEMENT, AS APPLICABLE. FOR PURPOSES OF THE FAR, THIS SOFTWARE SHALL BE DEEMED TO BE "UNPUBLISHED" AND LICENSED WITH DISCLOSURE PROHIBITIONS. CONTRACTOR/SUBCONTRACTOR: ASPEN TECHNOLOGY, INC. 20 CROSBY DRIVE, BEDFORD, MA 01730. TABLE OF CONTENTS RUN CONTROL SECTION.................................... 1 RUN CONTROL INFORMATION........................... 1 DESCRIPTION....................................... 1 FLOWSHEET SECTION...................................... 2 FLOWSHEET CONNECTIVITY BY STREAMS................. 2 FLOWSHEET CONNECTIVITY BY BLOCKS.................. 2 CONVERGENCE STATUS SUMMARY........................ 2 DESIGN-SPEC: DS-1................................ 2 CONVERGENCE BLOCK: $OLVER01...................... 2 COMPUTATIONAL SEQUENCE............................ 3 OVERALL FLOWSHEET BALANCE......................... 3 PHYSICAL PROPERTIES SECTION............................ 5 COMPONENTS........................................ 5 U-O-S BLOCK SECTION.................................... 6

Section 28: Appendix
Frederick | Leach | Nayandi
195 | P a g e
BLOCK: STRIPPER MODEL: RADFRAC................... 6 STREAM SECTION......................................... 16 AIRFEED EXTRACT RAFINATE S1 SOURWATR.............. 16 PROBLEM STATUS SECTION................................. 17 BLOCK STATUS...................................... 17 ASPEN PLUS PLAT: WINDOWS VER: 36.0 04/17/2018 PAGE 1 RUN CONTROL SECTION RUN CONTROL INFORMATION ----------------------- THIS COPY OF ASPEN PLUS LICENSED TO UNIVERSITY OF PENNSYLVAN TYPE OF RUN: NEW INPUT FILE NAME: _4249vil.inm OUTPUT PROBLEM DATA FILE NAME: _4249vil LOCATED IN: PDF SIZE USED FOR INPUT TRANSLATION: NUMBER OF FILE RECORDS (PSIZE) = 0 NUMBER OF IN-CORE RECORDS = 256 PSIZE NEEDED FOR SIMULATION = 256 CALLING PROGRAM NAME: apmain LOCATED IN: C:\Program Files (x86)\AspenTech\Aspen Plus V10.0\Engine\\xeq SIMULATION REQUESTED FOR ENTIRE FLOWSHEET DESCRIPTION ----------- Electrolytes Simulation with English Units : F, psi, lb/hr, lbmol/hr, Btu/hr, cuft/hr. Property Method: ELECNRTL Flow basis for input: Mass Stream report composition: Mass flow ASPEN PLUS PLAT: WINDOWS VER: 36.0 04/17/2018 PAGE 2 FLOWSHEET SECTION FLOWSHEET CONNECTIVITY BY STREAMS --------------------------------- STREAM SOURCE DEST STREAM SOURCE DEST AIRFEED ---- STRIPPER SOURWATR ---- STRIPPER EXTRACT STRIPPER ---- RAFINATE STRIPPER ---- S1 STRIPPER ---- FLOWSHEET CONNECTIVITY BY BLOCKS -------------------------------- BLOCK INLETS OUTLETS STRIPPER SOURWATR AIRFEED EXTRACT RAFINATE S1 CONVERGENCE STATUS SUMMARY

Section 28: Appendix
Frederick | Leach | Nayandi
196 | P a g e
-------------------------- DESIGN-SPEC SUMMARY =================== DESIGN CONV SPEC ERROR TOLERANCE ERR/TOL VARIABLE STAT BLOCK ------ ----- --------- ------- -------- ---- ----- DS-1 -0.64981E-08 0.10000E-07 -0.64981 18533. # $OLVER01 # = CONVERGED * = NOT CONVERGED LB = AT LOWER BOUNDS UB = AT UPPER BOUNDS DESIGN-SPEC: DS-1 ------------------ SAMPLED VARIABLES: NH3 : NH3 MASSFRAC IN STREAM RAFINATE SUBSTREAM MIXED SPECIFICATION: MAKE NH3 APPROACH 0.150000-04 WITHIN 0.100000-07 MANIPULATED VARIABLES: VARY : TOTAL MASSFLOW IN STREAM AIRFEED SUBSTREAM MIXED LOWER LIMIT = 8,000.00 LB/HR UPPER LIMIT = 45,000.0 LB/HR FINAL VALUE = 18,532.9 LB/HR VALUES OF ACCESSED FORTRAN VARIABLES: VARIABLE VALUE AT START FINAL VALUE UNITS OF LOOP -------- -------------- ----------- ----- NH3 0.505179E-05 0.149935E-04 ASPEN PLUS PLAT: WINDOWS VER: 36.0 04/17/2018 PAGE 3 FLOWSHEET SECTION CONVERGENCE BLOCK: $OLVER01 ---------------------------- SPECS: DS-1 MAXIT = 30 PERTURBATION SIZE (% OF RANGE): DS-1 1.0000 MAXIMUM STEP SIZE (% OF RANGE): DS-1 100.00 METHOD: BROYDEN STATUS: CONVERGED TOTAL NUMBER OF ITERATIONS: 8 *** FINAL VALUES *** VAR# MANIPUL/TEAR-VAR VARIABLE DESCRIPTION UNIT VALUE PREV VALUE ERR/TOL ---- ---------------- ------------------------- ----------- ------------ ------------ ------------ 1 TOTAL MASSFLOW AIRFEED.MIXED.TOTAL.MASSFLOW LB/HR 1.8533+04 1.8568+04 -0.6498 *** ITERATION HISTORY ***

Section 28: Appendix
Frederick | Leach | Nayandi
197 | P a g e
DESIGN-SPEC ID: DS-1 ITERATED: TOTAL MASSFLOW IN STREAM AIRFEED SUBSTREAM MIXED ITERATION VARIABLE ERROR ERR/TOL --------- -------- ----- ------- 1 0.2235E+05 -0.9948E-05 -994.8 2 0.2272E+05 -0.1045E-04 -1045. 3 0.1506E+05 0.2729E-04 2729. 4 0.2040E+05 -0.6196E-05 -619.6 5 0.1941E+05 -0.3336E-05 -333.6 6 0.1826E+05 0.1218E-05 121.8 7 0.1857E+05 -0.1574E-06 -15.74 8 0.1853E+05 -0.6498E-08 -0.6498 COMPUTATIONAL SEQUENCE ---------------------- SEQUENCE USED WAS: $OLVER01 STRIPPER (RETURN $OLVER01) OVERALL FLOWSHEET BALANCE ------------------------- *** MASS AND ENERGY BALANCE *** IN OUT GENERATION RELATIVE DIFF. CONVENTIONAL COMPONENTS (LBMOL/HR) H2O 1497.61 1497.66 0.428934E-01 -0.910917E-14 H2S 0.223004E-05 0.203265E-02 0.203042E-02 0.439515E-13 NH3 4.35497 4.39989 0.449271E-01 -0.327019E-13 N2 0.00000 0.00000 -0.810465E-12 0.00000 O2 0.00000 0.00000 -0.490343E-06 0.00000 H3O+ 0.607576E-08 0.222512E-07 0.167233E-07 0.246183E-01 NH4+ 0.488827E-01 0.395559E-02 -0.449271E-01 0.418241E-08 ASPEN PLUS PLAT: WINDOWS VER: 36.0 04/17/2018 PAGE 4 FLOWSHEET SECTION OVERALL FLOWSHEET BALANCE (CONTINUED) *** MASS AND ENERGY BALANCE *** IN OUT GENERATION RELATIVE DIFF. CONVENTIONAL COMPONENTS (LBMOL/HR) HS- 0.366215E-02 0.163495E-02 -0.202720E-02 -0.252063E-06 OH- 0.452141E-01 0.232059E-02 -0.428930E-01 0.108404E-04 S-- 0.325827E-05 0.365875E-07 -0.322131E-05 0.115435E-03

Section 28: Appendix
Frederick | Leach | Nayandi
198 | P a g e
CH4 1027.07 1027.07 0.00000 0.135043E-13 TOTAL BALANCE MOLE(LBMOL/HR) 2529.14 2529.14 -0.105151E-12 0.00000 MASS(LB/HR ) 43532.9 43532.9 -0.501411E-15 ENTHALPY(BTU/HR ) -0.211274E+09 -0.211274E+09 0.228005E-07 *** CO2 EQUIVALENT SUMMARY *** FEED STREAMS CO2E 411925. LB/HR PRODUCT STREAMS CO2E 411925. LB/HR NET STREAMS CO2E PRODUCTION 0.00000 LB/HR UTILITIES CO2E PRODUCTION 0.00000 LB/HR TOTAL CO2E PRODUCTION 0.00000 LB/HR ASPEN PLUS PLAT: WINDOWS VER: 36.0 04/17/2018 PAGE 5 PHYSICAL PROPERTIES SECTION COMPONENTS ---------- ID TYPE ALIAS NAME H2O C H2O WATER H2S C H2S HYDROGEN-SULFIDE NH3 C H3N AMMONIA N2 C N2 NITROGEN O2 C O2 OXYGEN H3O+ C H3O+ H3O+ NH4+ C NH4+ NH4+ HS- C HS- HS- OH- C OH- OH- S-- C S-2 S-- CH4 C CH4 METHANE LISTID SUPERCRITICAL COMPONENT LIST GLOBAL H2S NH3 O2 N2 CH4 ASPEN PLUS PLAT: WINDOWS VER: 36.0 04/17/2018 PAGE 6 U-O-S BLOCK SECTION BLOCK: STRIPPER MODEL: RADFRAC ------------------------------- INLETS - SOURWATR STAGE 1 AIRFEED STAGE 17 OUTLETS - EXTRACT STAGE 1 RAFINATE STAGE 17 S1 STAGE 1 PROPERTY OPTION SET: ENRTL-RK ELECTROLYTE NRTL / REDLICH-KWONG HENRY-COMPS ID: GLOBAL CHEMISTRY ID: GLOBAL - TRUE SPECIES *** MASS AND ENERGY BALANCE *** IN OUT GENERATION RELATIVE DIFF. TOTAL BALANCE MOLE(LBMOL/HR) 2529.14 2529.14 -0.105151E-12 0.179804E-15

Section 28: Appendix
Frederick | Leach | Nayandi
199 | P a g e
MASS(LB/HR ) 43532.9 43532.9 -0.334274E-15 ENTHALPY(BTU/HR ) -0.211274E+09 -0.211274E+09 0.228005E-07 *** CO2 EQUIVALENT SUMMARY *** FEED STREAMS CO2E 411925. LB/HR PRODUCT STREAMS CO2E 411925. LB/HR NET STREAMS CO2E PRODUCTION 0.00000 LB/HR UTILITIES CO2E PRODUCTION 0.00000 LB/HR TOTAL CO2E PRODUCTION 0.00000 LB/HR ASPEN PLUS PLAT: WINDOWS VER: 36.0 04/17/2018 PAGE 7 U-O-S BLOCK SECTION BLOCK: STRIPPER MODEL: RADFRAC (CONTINUED) ********************** **** INPUT DATA **** ********************** **** INPUT PARAMETERS **** NUMBER OF STAGES 17 ALGORITHM OPTION STANDARD INITIALIZATION OPTION STANDARD HYDRAULIC PARAMETER CALCULATIONS NO INSIDE LOOP CONVERGENCE METHOD NEWTON DESIGN SPECIFICATION METHOD NESTED MAXIMUM NO. OF OUTSIDE LOOP ITERATIONS 200 MAXIMUM NO. OF INSIDE LOOP ITERATIONS 10 MAXIMUM NUMBER OF FLASH ITERATIONS 30 FLASH TOLERANCE 0.000100000 OUTSIDE LOOP CONVERGENCE TOLERANCE 0.000100000 **** COL-SPECS **** MOLAR VAPOR DIST / TOTAL DIST 1.00000 CONDENSER DUTY (W/O SUBCOOL) BTU/HR 0.0 REBOILER DUTY BTU/HR 0.0 **** REAC-STAGES SPECIFICATIONS **** STAGE TO STAGE REACTIONS/CHEMISTRY ID 1 17 GLOBAL ***** CHEMISTRY PARAGRAPH GLOBAL ***** **** REACTION PARAMETERS **** RXN NO. TYPE PHASE CONC. TEMP APP TO EQUIL CONVERSION BASIS F 1 EQUILIBRIUM LIQUID MOLE-GAMMA 0.0000 2 EQUILIBRIUM LIQUID MOLE-GAMMA 0.0000 3 EQUILIBRIUM LIQUID MOLE-GAMMA 0.0000 4 EQUILIBRIUM LIQUID MOLE-GAMMA 0.0000

Section 28: Appendix
Frederick | Leach | Nayandi
200 | P a g e
ASPEN PLUS PLAT: WINDOWS VER: 36.0 04/17/2018 PAGE 8 U-O-S BLOCK SECTION BLOCK: STRIPPER MODEL: RADFRAC (CONTINUED) ** STOICHIOMETRIC COEFFICIENTS ** RXN NO. H2O H2S NH3 H3O+ NH4+ 1 -1.000 0.000 -1.000 0.000 1.000 2 -1.000 0.000 0.000 1.000 0.000 3 -1.000 -1.000 0.000 1.000 0.000 4 -2.000 0.000 0.000 1.000 0.000 RXN NO. HS- OH- S-- CH4 1 0.000 1.000 0.000 0.000 2 -1.000 0.000 1.000 0.000 3 1.000 0.000 0.000 0.000 4 0.000 1.000 0.000 0.000 ** COEFFICIENTS OF EQUILIBRIUM CONSTANT EXPRESSION ** RXN NO. A B C D E 1 -1.2566 -3335.7 1.4971 -0.37057E-01 0.0000 2 -9.7420 -8585.5 0.0000 0.0000 0.0000 3 214.58 -12995. -33.547 0.0000 0.0000 4 132.90 -13446. -22.477 0.0000 0.0000 **** PROFILES **** P-SPEC STAGE 1 PRES, PSIA 17.0000 **** TRAY MURPHREE EFFICIENCY **** SEGMENT 1 17 EFFICIENCY 0.25000 ******************* **** RESULTS **** ******************* *** COMPONENT SPLIT FRACTIONS *** OUTLET STREAMS -------------- EXTRACT RAFINATE COMPONENT: H2O .13354 .86646 H2S .99680 .32049E-02 NH3 .99532 .46779E-02 H3O+ 0.0000 1.0000 NH4+ 0.0000 1.0000 HS- 0.0000 1.0000 OH- 0.0000 1.0000 S-- 0.0000 1.0000 CH4 .99998 .22016E-04

Section 28: Appendix
Frederick | Leach | Nayandi
201 | P a g e
ASPEN PLUS PLAT: WINDOWS VER: 36.0 04/17/2018 PAGE 9 U-O-S BLOCK SECTION BLOCK: STRIPPER MODEL: RADFRAC (CONTINUED) *** SUMMARY OF KEY RESULTS *** TOP STAGE TEMPERATURE F 154.251 BOTTOM STAGE TEMPERATURE F 138.841 TOP STAGE LIQUID FLOW LBMOL/HR 1,346.79 BOTTOM STAGE LIQUID FLOW LBMOL/HR 1,297.71 TOP STAGE VAPOR FLOW LBMOL/HR 1,231.42 BOILUP VAPOR FLOW LBMOL/HR 1,158.08 CONDENSER DUTY (W/O SUBCOOL) BTU/HR 0.0 REBOILER DUTY BTU/HR 0.0 **** MAXIMUM FINAL RELATIVE ERRORS **** BUBBLE POINT 0.77011E-07 STAGE= 6 COMPONENT MASS BALANCE 0.20716E-12 STAGE= 1 COMP=H2S ENERGY BALANCE 0.17551E-09 STAGE= 1 **** PROFILES **** **NOTE** REPORTED VALUES FOR STAGE LIQUID AND VAPOR RATES ARE THE FLOWS FROM THE STAGE INCLUDING ANY SIDE PRODUCT. ENTHALPY STAGE TEMPERATURE PRESSURE BTU/LBMOL HEAT DUTY F PSIA LIQUID VAPOR BTU/HR 1 154.25 17.000 -0.12141E+06 -43165. 2 139.43 17.100 -0.12173E+06 -41349. 16 129.86 18.500 -0.12201E+06 -40027. 17 138.84 18.600 -0.12185E+06 -39802. STAGE FLOW RATE FEED RATE PRODUCT RATE LBMOL/HR LBMOL/HR LBMOL/HR LIQUID VAPOR LIQUID VAPOR MIXED LIQUID VAPOR 1 1347. 1231. 1387.9483 1231.4210 2 1331. 1190. 16 1315. 1161. 17 1298. 1158. 1141.1867 1297.7139 ASPEN PLUS PLAT: WINDOWS VER: 36.0 04/17/2018 PAGE 10 U-O-S BLOCK SECTION BLOCK: STRIPPER MODEL: RADFRAC (CONTINUED) **** MASS FLOW PROFILES **** STAGE FLOW RATE FEED RATE PRODUCT RATE LB/HR LB/HR LB/HR LIQUID VAPOR LIQUID VAPOR MIXED LIQUID VAPOR 1 0.2426E+05 0.2015E+05 .25000+05 .20154+05

Section 28: Appendix
Frederick | Leach | Nayandi
202 | P a g e
2 0.2398E+05 0.1941E+05 16 0.2368E+05 0.1889E+05 17 0.2338E+05 0.1884E+05 .18533+05 .23379+05 **** MOLE-X-PROFILE **** STAGE H2O H2S NH3 H3O+ NH4+ 1 0.99813 0.11234E-08 0.17990E-02 0.21891E-11 0.27660E-04 2 0.99872 0.11246E-08 0.12133E-02 0.17231E-11 0.23059E-04 16 0.99995 0.60756E-08 0.25025E-04 0.11276E-10 0.42085E-05 17 0.99996 0.50200E-08 0.15860E-04 0.17146E-10 0.30481E-05 **** MOLE-X-PROFILE **** STAGE HS- OH- S-- CH4 1 0.28321E-05 0.24826E-04 0.11552E-08 0.13460E-04 2 0.30925E-05 0.19964E-04 0.82409E-09 0.15726E-04 16 0.21343E-05 0.20742E-05 0.49528E-10 0.18697E-04 17 0.12599E-05 0.17882E-05 0.28194E-10 0.17424E-04 **** MOLE-Y-PROFILE **** STAGE H2O H2S NH3 H3O+ NH4+ 1 0.16241 0.16454E-05 0.35563E-02 0.0000 0.0000 2 0.13507 0.18281E-05 0.20463E-02 0.0000 0.0000 16 0.11513 0.19064E-05 0.24793E-04 0.0000 0.0000 17 0.11311 0.10123E-05 0.11996E-04 0.0000 0.0000 **** MOLE-Y-PROFILE **** STAGE HS- OH- S-- CH4 1 0.0000 0.0000 0.0000 0.83403 2 0.0000 0.0000 0.0000 0.86288 16 0.0000 0.0000 0.0000 0.88484 17 0.0000 0.0000 0.0000 0.88687 **** K-VALUES **** STAGE H2O H2S NH3 H3O+ NH4+ 1 0.24489 976.75 4.4949 0.0000 0.0000 2 0.16825 875.59 3.3333 0.0000 0.0000 16 0.12119 755.25 2.5248 0.0000 0.0000 17 0.15246 806.60 3.0255 0.0000 0.0000 **** K-VALUES **** STAGE HS- OH- S-- CH4 1 0.0000 0.0000 0.0000 55535. 2 0.0000 0.0000 0.0000 52645. 16 0.0000 0.0000 0.0000 46999. 17 0.0000 0.0000 0.0000 48638. ASPEN PLUS PLAT: WINDOWS VER: 36.0 04/17/2018 PAGE 11 U-O-S BLOCK SECTION BLOCK: STRIPPER MODEL: RADFRAC (CONTINUED) **** RATES OF GENERATION **** LBMOL/HR STAGE H2O H2S NH3 H3O+ NH4+ HS- 1 0.1178E-01 -.1505E-03 0.1163E-01 -.3127E-08 -.1163E-01 0.1522E-03

Section 28: Appendix
Frederick | Leach | Nayandi
203 | P a g e
2 0.6864E-02 -.3012E-03 0.6563E-02 -.6550E-09 -.6563E-02 0.3016E-03 16 0.3640E-03 0.1039E-02 0.1403E-02 0.2373E-08 -.1403E-02 -.1039E-02 17 0.4061E-03 0.1171E-02 0.1577E-02 0.7427E-08 -.1577E-02 -.1171E-02 **** RATES OF GENERATION **** LBMOL/HR STAGE OH- S-- CH4 1 -.1178E-01 -.1702E-05 0.000 2 -.6864E-02 -.4590E-06 0.000 16 -.3640E-03 -.3389E-07 0.000 17 -.4061E-03 -.2852E-07 0.000 **** MASS-X-PROFILE **** STAGE H2O H2S NH3 H3O+ NH4+ 1 0.99823 0.21255E-08 0.17008E-02 0.23118E-11 0.27698E-04 2 0.99879 0.21276E-08 0.11471E-02 0.18195E-11 0.23089E-04 16 0.99995 0.11494E-07 0.23657E-04 0.11907E-10 0.42139E-05 17 0.99996 0.94970E-08 0.14994E-04 0.18105E-10 0.30520E-05 **** MASS-X-PROFILE **** STAGE HS- OH- S-- CH4 1 0.52001E-05 0.23440E-04 0.20564E-08 0.11987E-04 2 0.56780E-05 0.18849E-04 0.14670E-08 0.14005E-04 16 0.39184E-05 0.19582E-05 0.88159E-10 0.16650E-04 17 0.23130E-05 0.16882E-05 0.50185E-10 0.15517E-04 **** MASS-Y-PROFILE **** STAGE H2O H2S NH3 H3O+ NH4+ 1 0.17877 0.34263E-05 0.37006E-02 0.0000 0.0000 2 0.14918 0.38197E-05 0.21365E-02 0.0000 0.0000 16 0.12748 0.39934E-05 0.25952E-04 0.0000 0.0000 17 0.12528 0.21210E-05 0.12560E-04 0.0000 0.0000 **** MASS-Y-PROFILE **** STAGE HS- OH- S-- CH4 1 0.0000 0.0000 0.0000 0.81753 2 0.0000 0.0000 0.0000 0.84868 16 0.0000 0.0000 0.0000 0.87249 17 0.0000 0.0000 0.0000 0.87471 **** MURPHREE EFF **** STAGE H2O H2S NH3 H3O+ NH4+ 1 0.25000 0.25000 0.25000 0.25000 0.25000 2 0.25000 0.25000 0.25000 0.25000 0.25000 16 0.25000 0.25000 0.25000 0.25000 0.25000 17 0.25000 0.25000 0.25000 0.25000 0.25000 ASPEN PLUS PLAT: WINDOWS VER: 36.0 04/17/2018 PAGE 12 U-O-S BLOCK SECTION BLOCK: STRIPPER MODEL: RADFRAC (CONTINUED) **** MURPHREE EFF **** STAGE HS- OH- S-- CH4 1 0.25000 0.25000 0.25000 0.25000

Section 28: Appendix
Frederick | Leach | Nayandi
204 | P a g e
2 0.25000 0.25000 0.25000 0.25000 16 0.25000 0.25000 0.25000 0.25000 17 0.25000 0.25000 0.25000 0.25000 ******************************** ***** HYDRAULIC PARAMETERS ***** ******************************** *** DEFINITIONS *** MARANGONI INDEX = SIGMA - SIGMATO FLOW PARAM = (ML/MV)*SQRT(RHOV/RHOL) QR = QV*SQRT(RHOV/(RHOL-RHOV)) F FACTOR = QV*SQRT(RHOV) WHERE: SIGMA IS THE SURFACE TENSION OF LIQUID FROM THE STAGE SIGMATO IS THE SURFACE TENSION OF LIQUID TO THE STAGE ML IS THE MASS FLOW OF LIQUID FROM THE STAGE MV IS THE MASS FLOW OF VAPOR TO THE STAGE RHOL IS THE MASS DENSITY OF LIQUID FROM THE STAGE RHOV IS THE MASS DENSITY OF VAPOR TO THE STAGE QV IS THE VOLUMETRIC FLOW RATE OF VAPOR TO THE STAGE TEMPERATURE F STAGE LIQUID FROM VAPOR TO 1 154.25 139.43 2 139.43 132.43 16 129.86 138.84 17 138.84 189.23 MASS FLOW VOLUME FLOW MOLECULAR WEIGHT LB/HR CUFT/HR STAGE LIQUID FROM VAPOR TO LIQUID FROM VAPOR TO LIQUID FROM VAPOR TO 1 24260. 19415. 397.58 0.44645E+06 18.014 16.311 2 23976. 19130. 390.93 0.43281E+06 18.014 16.289 16 23683. 18837. 384.80 0.39894E+06 18.015 16.266 17 23379. 18533. 380.81 0.42650E+06 18.015 16.240 ASPEN PLUS PLAT: WINDOWS VER: 36.0 04/17/2018 PAGE 13 U-O-S BLOCK SECTION BLOCK: STRIPPER MODEL: RADFRAC (CONTINUED) DENSITY VISCOSITY SURFACE TENSION LB/CUFT CP DYNE/CM STAGE LIQUID FROM VAPOR TO LIQUID FROM VAPOR TO LIQUID FROM 1 61.021 0.43487E-01 0.41938 0.12591E-01 64.337 2 61.330 0.44199E-01 0.47581 0.12445E-01 65.941 16 61.546 0.47218E-01 0.51955 0.12541E-01 67.017 17 61.392 0.43453E-01 0.47906 0.13407E-01 66.062 MARANGONI INDEX FLOW PARAM QR REDUCED F-FACTOR

Section 28: Appendix
Frederick | Leach | Nayandi
205 | P a g e
STAGE DYNE/CM CUFT/HR (LB-CUFT)**.5/HR 1 0.33359E-01 11923. 93100. 2 1.6038 0.33645E-01 11623. 90993. 16 -.19391 0.34824E-01 11054. 86688. 17 -.95503 0.33561E-01 11351. 88906. ************************************ ***** TRAY SIZING CALCULATIONS ***** ************************************ ******************* *** SECTION 1 *** ******************* STARTING STAGE NUMBER 1 ENDING STAGE NUMBER 17 FLOODING CALCULATION METHOD GLITSCH6 DESIGN PARAMETERS ----------------- PEAK CAPACITY FACTOR 1.00000 SYSTEM FOAMING FACTOR 1.00000 FLOODING FACTOR 0.80000 MINIMUM COLUMN DIAMETER FT 1.00000 MINIMUM DC AREA/COLUMN AREA 0.100000 HOLE AREA/ACTIVE AREA 0.100000 TRAY SPECIFICATIONS ------------------- TRAY TYPE SIEVE NUMBER OF PASSES 1 TRAY SPACING FT 2.00000 ASPEN PLUS PLAT: WINDOWS VER: 36.0 04/17/2018 PAGE 14 U-O-S BLOCK SECTION BLOCK: STRIPPER MODEL: RADFRAC (CONTINUED) ***** SIZING RESULTS @ STAGE WITH MAXIMUM DIAMETER ***** STAGE WITH MAXIMUM DIAMETER 1 COLUMN DIAMETER FT 4.19142 DC AREA/COLUMN AREA 0.100000 DOWNCOMER VELOCITY FT/SEC 0.080040 FLOW PATH LENGTH FT 2.87971 SIDE DOWNCOMER WIDTH FT 0.65586 SIDE WEIR LENGTH FT 3.04553 CENTER DOWNCOMER WIDTH FT 0.0 CENTER WEIR LENGTH FT MISSING OFF-CENTER DOWNCOMER WIDTH FT 0.0 OFF-CENTER SHORT WEIR LENGTH FT MISSING OFF-CENTER LONG WEIR LENGTH FT MISSING TRAY CENTER TO OCDC CENTER FT 0.0 **** SIZING PROFILES ****

Section 28: Appendix
Frederick | Leach | Nayandi
206 | P a g e
STAGE DIAMETER TOTAL AREA ACTIVE AREA SIDE DC AREA FT SQFT SQFT SQFT 1 4.1914 13.798 11.038 1.3798 2 4.1914 13.798 11.038 1.3798 3 4.1914 13.798 11.038 1.3798 4 4.1914 13.798 11.038 1.3798 5 4.1914 13.798 11.038 1.3798 6 4.1914 13.798 11.038 1.3798 7 4.1914 13.798 11.038 1.3798 8 4.1914 13.798 11.038 1.3798 9 4.1914 13.798 11.038 1.3798 10 4.1914 13.798 11.038 1.3798 11 4.1914 13.798 11.038 1.3798 12 4.1914 13.798 11.038 1.3798 13 4.1914 13.798 11.038 1.3798 14 4.1914 13.798 11.038 1.3798 15 4.1914 13.798 11.038 1.3798 16 4.1914 13.798 11.038 1.3798 17 4.1914 13.798 11.038 1.3798 **** ADDITIONAL SIZING PROFILES **** FLOODING DC BACKUP/ STAGE FACTOR PRES. DROP DC BACKUP (TSPC+WHT) PSI FT 1 80.00 0.1466 0.6772 31.26 2 77.81 0.1426 0.6608 30.50 3 76.64 0.1405 0.6526 30.12 4 75.92 0.1392 0.6478 29.90 5 75.44 0.1384 0.6447 29.75 6 75.06 0.1377 0.6424 29.65 7 74.76 0.1372 0.6406 29.57 8 74.48 0.1367 0.6390 29.49 9 74.23 0.1363 0.6376 29.43 10 73.99 0.1359 0.6363 29.37 11 73.75 0.1355 0.6350 29.31 12 73.53 0.1351 0.6337 29.25 13 73.30 0.1347 0.6325 29.19 14 73.10 0.1343 0.6314 29.14 ASPEN PLUS PLAT: WINDOWS VER: 36.0 04/17/2018 PAGE 15 U-O-S BLOCK SECTION BLOCK: STRIPPER MODEL: RADFRAC (CONTINUED) FLOODING DC BACKUP/ STAGE FACTOR PRES. DROP DC BACKUP (TSPC+WHT) PSI FT 15 72.98 0.1341 0.6307 29.11 16 73.29 0.1345 0.6320 29.17 17 76.19 0.1384 0.6454 29.79 HEIGHT DC REL TR LIQ REL FRA APPR TO STAGE OVER WEIR FROTH DENS FROTH DENS SYS LIMIT FT 1 0.1718 0.6083 0.1749 36.81 2 0.1685 0.6083 0.1765 35.71 3 0.1669 0.6083 0.1774 35.15 4 0.1660 0.6083 0.1779 34.83 5 0.1655 0.6083 0.1783 34.62 6 0.1652 0.6083 0.1786 34.48

Section 28: Appendix
Frederick | Leach | Nayandi
207 | P a g e
7 0.1650 0.6083 0.1789 34.36 8 0.1648 0.6083 0.1791 34.27 9 0.1647 0.6083 0.1793 34.18 10 0.1645 0.6083 0.1795 34.10 11 0.1644 0.6083 0.1797 34.02 12 0.1643 0.6083 0.1799 33.95 13 0.1642 0.6083 0.1801 33.87 14 0.1641 0.6083 0.1802 33.80 15 0.1640 0.6083 0.1803 33.77 16 0.1640 0.6083 0.1801 33.88 17 0.1640 0.6083 0.1782 34.86 ASPEN PLUS PLAT: WINDOWS VER: 36.0 04/17/2018 PAGE 16 STREAM SECTION AIRFEED EXTRACT RAFINATE S1 SOURWATR ------------------------------------ STREAM ID AIRFEED EXTRACT RAFINATE S1 SOURWATR FROM : ---- STRIPPER STRIPPER STRIPPER ---- TO : STRIPPER ---- ---- ---- STRIPPER SUBSTREAM: MIXED PHASE: VAPOR VAPOR LIQUID LIQUID LIQUID COMPONENTS: LBMOL/HR H2O 114.1187 199.9943 1297.6628 9.9813-06 1383.4956 H2S 0.0 2.0261-03 6.5145-06 1.1234-14 2.2300-06 NH3 0.0 4.3793 2.0582-02 1.7990-08 4.3550 N2 0.0 0.0 0.0 0.0 0.0 O2 0.0 0.0 0.0 0.0 0.0 H3O+ 0.0 0.0 2.2251-08 2.1891-17 6.0758-09 NH4+ 0.0 0.0 3.9556-03 2.7660-10 4.8883-02 HS- 0.0 0.0 1.6349-03 2.8321-11 3.6621-03 OH- 0.0 0.0 2.3206-03 2.4826-10 4.5214-02 S-- 0.0 0.0 3.6587-08 1.1552-14 3.2583-06 CH4 1027.0680 1027.0454 2.2612-02 1.3460-10 0.0 COMPONENTS: LB/HR H2O 2055.8798 3602.9536 2.3378+04 1.7982-04 2.4924+04 H2S 0.0 6.9055-02 2.2203-04 3.8288-13 7.6004-05 NH3 0.0 74.5821 0.3505 3.0638-07 74.1675 N2 0.0 0.0 0.0 0.0 0.0 O2 0.0 0.0 0.0 0.0 0.0 H3O+ 0.0 0.0 4.2328-07 4.1643-16 1.1558-07 NH4+ 0.0 0.0 7.1351-02 4.9894-09 0.8817 HS- 0.0 0.0 5.4075-02 9.3672-10 0.1211

Section 28: Appendix
Frederick | Leach | Nayandi
208 | P a g e
OH- 0.0 0.0 3.9468-02 4.2224-09 0.7690 S-- 0.0 0.0 1.1733-06 3.7044-13 1.0448-04 CH4 1.6477+04 1.6477+04 0.3628 2.1593-09 0.0 TOTAL FLOW: LBMOL/HR 1141.1867 1231.4211 1297.7140 1.0000-05 1387.9483 LB/HR 1.8533+04 2.0154+04 2.3379+04 1.8014-04 2.5000+04 CUFT/HR 2.2658+05 4.7609+05 380.8089 2.9520-06 415.4715 STATE VARIABLES: TEMP F 190.0000 154.2507 138.8412 154.2507 190.0000 PRES PSIA 35.0000 17.0000 18.6000 17.0000 25.0000 VFRAC 1.0000 1.0000 0.0 0.0 0.0 LFRAC 0.0 0.0 1.0000 1.0000 1.0000 SFRAC 0.0 0.0 0.0 0.0 0.0 ENTHALPY: BTU/LBMOL -3.8403+04 -4.3165+04 -1.2185+05 -1.2141+05 -1.2065+05 BTU/LB -2364.7094 -2637.3452 -6763.4667 -6739.8708 -6697.9781 BTU/HR -4.3825+07 -5.3154+07 -1.5812+08 -1.2141 -1.6745+08 ENTROPY: BTU/LBMOL-R -17.7959 -16.0709 -37.0214 -36.5602 -35.5415 BTU/LB-R -1.0958 -0.9819 -2.0550 -2.0296 -1.9732 DENSITY: LBMOL/CUFT 5.0366-03 2.5865-03 3.4078 3.3875 3.3407 LB/CUFT 8.1795-02 4.2332-02 61.3920 61.0205 60.1726 AVG MW 16.2400 16.3667 18.0152 18.0135 18.0122 ASPEN PLUS PLAT: WINDOWS VER: 36.0 04/17/2018 PAGE 17 PROBLEM STATUS SECTION BLOCK STATUS ------------ **************************************************************************** * * * Calculations were completed normally * * * * All Unit Operation blocks were completed normally * * * * All streams were flashed normally *

Section 28: Appendix
Frederick | Leach | Nayandi
209 | P a g e
* * * All Convergence blocks were completed normally * * * ****************************************************************************

Section 28: Appendix
Frederick | Leach | Nayandi
210 | P a g e
A.6: Material Safety Data Sheets
A.6.1: Hydrogen Sulfide

Section 28: Appendix
Frederick | Leach | Nayandi
211 | P a g e

Section 28: Appendix
Frederick | Leach | Nayandi
212 | P a g e
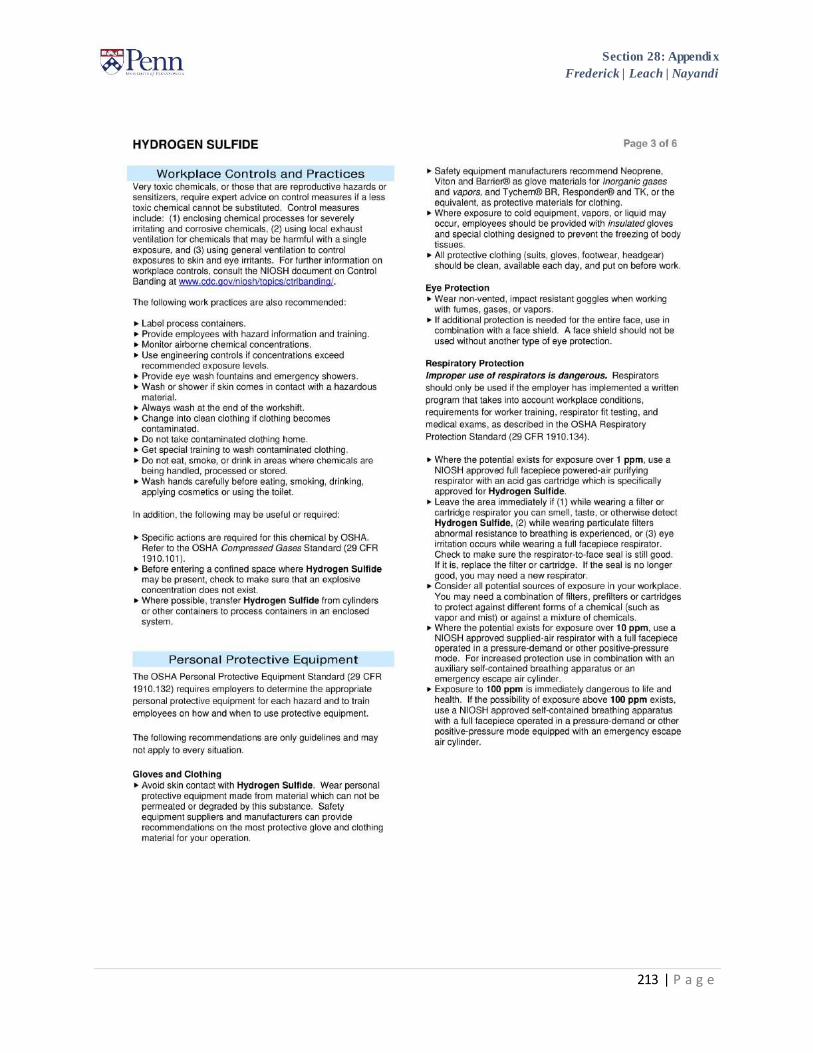
Section 28: Appendix
Frederick | Leach | Nayandi
213 | P a g e

Section 28: Appendix
Frederick | Leach | Nayandi
214 | P a g e

Section 28: Appendix
Frederick | Leach | Nayandi
215 | P a g e

Section 28: Appendix
Frederick | Leach | Nayandi
216 | P a g e

Section 28: Appendix
Frederick | Leach | Nayandi
217 | P a g e
A.6.2: Ammonia

Section 28: Appendix
Frederick | Leach | Nayandi
218 | P a g e

Section 28: Appendix
Frederick | Leach | Nayandi
219 | P a g e

Section 28: Appendix
Frederick | Leach | Nayandi
220 | P a g e

Section 28: Appendix
Frederick | Leach | Nayandi
221 | P a g e

Section 28: Appendix
Frederick | Leach | Nayandi
222 | P a g e
A.6.3: Sulfuric Acid

Section 28: Appendix
Frederick | Leach | Nayandi
223 | P a g e

Section 28: Appendix
Frederick | Leach | Nayandi
224 | P a g e

Section 28: Appendix
Frederick | Leach | Nayandi
225 | P a g e

Section 28: Appendix
Frederick | Leach | Nayandi
226 | P a g e
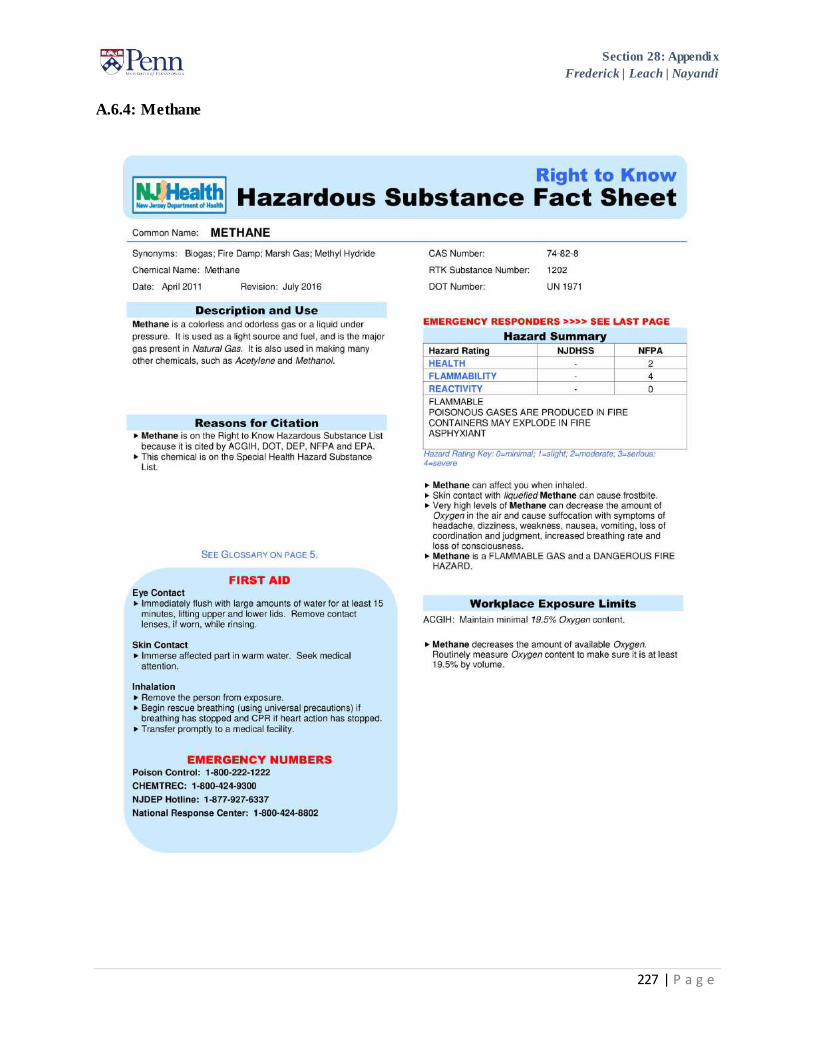
Section 28: Appendix
Frederick | Leach | Nayandi
227 | P a g e
A.6.4: Methane

Section 28: Appendix
Frederick | Leach | Nayandi
228 | P a g e

Section 28: Appendix
Frederick | Leach | Nayandi
229 | P a g e

Section 28: Appendix
Frederick | Leach | Nayandi
230 | P a g e

Section 28: Appendix
Frederick | Leach | Nayandi
231 | P a g e

Section 28: Appendix
Frederick | Leach | Nayandi
232 | P a g e
A.6.5: Propane

Section 28: Appendix
Frederick | Leach | Nayandi
233 | P a g e

Section 28: Appendix
Frederick | Leach | Nayandi
234 | P a g e

Section 28: Appendix
Frederick | Leach | Nayandi
235 | P a g e

Section 28: Appendix
Frederick | Leach | Nayandi
236 | P a g e

Section 28: Appendix
Frederick | Leach | Nayandi
237 | P a g e
A.6.6: Sulfur Dioxide

Section 28: Appendix
Frederick | Leach | Nayandi
238 | P a g e

Section 28: Appendix
Frederick | Leach | Nayandi
239 | P a g e

Section 28: Appendix
Frederick | Leach | Nayandi
240 | P a g e

Section 28: Appendix
Frederick | Leach | Nayandi
241 | P a g e

Section 28: Appendix
Frederick | Leach | Nayandi
242 | P a g e
A.6.7: Nitrogen Dioxide

Section 28: Appendix
Frederick | Leach | Nayandi
243 | P a g e

Section 28: Appendix
Frederick | Leach | Nayandi
244 | P a g e

Section 28: Appendix
Frederick | Leach | Nayandi
245 | P a g e

Section 28: Appendix
Frederick | Leach | Nayandi
246 | P a g e