alumni network analysis - innovation...
TRANSCRIPT

1
Alumni Network AnalysisNeil Rubens1,2, Martha Russell1,3, Rafael Perez2, Jukka Huhtamäki1,4, Kaisa Still1,5, Dain Kaplan6
Abstract—Alumni connections are important resources thatcontribute to university evaluation. Even though alumni con-nections represent networks, they have been mostly evaluatedas tabular data (e.g. by providing average salary, employmentrate, etc.). This ironically disregards all qualities of a network,from which an alumni network gets its name. It is desirable toevaluate an alumni network as a network, because networks havethe potential to provide very insightful information. Evaluation ofalumni networks as a network has not been feasible in the pastdue to data fragmentation (neither universities nor companieswilling to share meaningfully significant data in its entirety).Recently the feasibility of such an analysis has changed, due tonew trends towards democratization of information, acceleratedby the Web 2.0 user-generated content phenomenon and crowd-sourcing mentality. Utilizing web-crawlers, we actively harvesteddata and assembled a dataset on alumni in leadership positionsin technology-based industries. Moreover, we include a highproportion of startup companies, which allowed us to evaluatealumni networks with respect to entrepreneurial as well astechnology involvement. We show that by analyzing alumniconnections as networks, it is possible to uncover new patterns,as well as provide a new way of examining the old.
Index Terms—alumni networks, university metrics, networkanalysis, network visualization, entrepreneurship, engineering
I. INTRODUCTION
Rankings of universities and their programs abound. Somerankings are based on numerical scores; some are based onexpert judgment. Generally, the rankings are endorsed by thoseat the top and held in suspect by some of the others. Thefactors that contribute to the preeminence of educational insti-tutions are complex, and controversies surround nearly everyranking. The top-ranked institutions leverage rankings in theirrecruitment of faculty and students, in their appeals to donors,in outreach to prospective employers of their graduates, andin their requests for program and research funding. Aroundthe world, national innovation policy groups use measures ofalumni impact in their analysis and policy recommendations.
Data on alumni has been used to estimate quality and impactof educational institutions. Tabular data about individuals’starting salaries, employment rate, and donation have beenused to determine averages and comparisons. Some analysesrefer conceptually to the network of an institution’s alumni,even though the analyses disregard the relationships qualitiesof a network, from which an alumni network gets its name.Our objective, therefore, is to provide a much overdue evalu-ation of the relationship characteristics of alumni networks.
http://innovation-ecosystems.org/alumni-network1 Innovation Ecosystems Network, Media X, Stanford University, USA2 University of Electro-Communications, Japan3 HSTAR Institute, Media X, Stanford University, USA4 Tampere University of Technology, Finland5 VTT Technical Research Centre, Finland6 Tokyo Institute of Technology, Japan
We take two complementary approaches for this analysis:(1) visual: by providing a visualization of the network fora comprehensive and explorative view; and (2) numerical: byproviding metrics that capture salient features of the network.
In defense of traditional approaches, the network analysis ofalumni has been hindered by lack of data suitable for networkanalysis. Gathering data about alumni is time-intensive; andthe limited data available on alumni is considered a preciousresource and is closely guarded by universities. To exacerbatethe problem, the release of corporate information about em-ployees and their education is limited, as well. The availabledata lacks standardized units of measure, is disjointed, andis problematic for analysis. It is therefore no wonder thatuniversities have used their data in a very limited manner,namely, self-benchmarking or in support of the fund-raisingefforts of their development offices.
Due to recent trends towards democratization of knowledgeand information, accelerated by the Web 2.0 user-generatedcontent phenomenon and crowd-sourcing mentality, a signifi-cant amount of data on alumni is becoming available, thoughstill scattered throughout the web. Utilizing web-crawlers, weactively harvested data and assembled a dataset on alumni inexecutive, investor and board level positions in technology-based industries (including many startup companies) and theservice sectors that support them [1] (Section II-C). Thiscombination provides information about both entrepreneurialand technological involvement of alumni. In order to capturenetwork properties, we have collected not only data aboutthe direct university alumni connections, but also data abouttheir employment histories, company information, financialorganizations, investment activities, and most importantly re-lations/links that interconnect these entities.
We propose a novel approach to evaluate the connectivityof alumni based on their leadership roles in technology-based businesses. As the available data increases, the proposedapproach can be more widely applied to gain broader anddeeper insights into alumni networks. The goal of this paper isto demonstrate ways in which this could be accomplished. Forexample, we investigate the role an alumni network plays inenhancing a personal network (Section III-B), comparing thealumni networks of different universities (Section III-A), etc.The rest of this paper focuses on providing a brief overviewof these possibilities.
II. METHOD
A. Conceptual Approach
Our approach is based on a network analysis of alumni inleadership roles in technology-based companies, the serviceagencies that support them, and their investment firms. The
2
term network refers to a pattern of relationships created by theinterconnection of several actors. Alumni and their affiliatedorganizations are of special interest for this analysis.
By leadership we refer to individuals who are key personnel,executives, or board members of technology-based companiesor the service organizations that support them. In some casesindividuals have invested in companies – a role we alsodesignate as a leadership role.
B. Network AnalysisThe analysis of the overall network structure, the character
of the network, and the roles of the network actors areseveral of the measures of interest in network analysis. Inthis analysis there are four types of actors – alumni, theeducational institutions from which they have graduated, andthe companies in which they have held leadership roles –executive, board, investor. Investment firms and venture capitalfirms are segmented as a unique class of company.
The network of relationships between actors, shown asnodes, can be modeled either as one-mode or two-mode. Inone-mode networks all the nodes are of same type. In analumni network, for example, connections could be establishedamong alumni who attended the same educational institution.In two-mode networks, there are two types of nodes – alumniand the organizations in which they have participated. Thistwo-mode network of alumni and their organizations segmentsthose organization into three classes: educational institutions,companies, investment and venture firms.
Edges represent relationships between nodes: a person is analumni of educational institution, a person works at a company,person invested in a company or in a financial organizationthat invested in a company, etc. Edges may be directed, inwhich an arrow indicates the direction of the relationship, orundirected. Edge direction depends on semantics e.g. personworks at a company or company employs a person. Fromour web-crawled data, this clarity might be determined withdeeper analysis; in the analysis reported here, we consider bothdirections and represent the relationships through undirectededges.
C. DataThe Innovation Ecosystems (IEN) Dataset [1] is a collec-
tion of over 140,000 records built by web-crawling Englishlanguage, socially constructed data about technology-orientedcompanies; it is updated quarterly. As of August 2010, itincludes data about more than 44,000 companies (includinga high proportion of startup companies), their executivesand board personnel (over 60,000 records), investment or-ganizations (over 5,100 records), and financial transactionstotaling over US$ 410 billion. People included in the datasetare the key employees in their respective companies (e.g.founders, executives, lead engineers, etc.), members of boardsof advisors, or investors. We have further enhanced this databy adding data about 2,100 educational institutions and 5,800personal educational affiliations; these additions were obtainedfrom the biographical references and notes describing theindividuals. Note, that the dataset inherits both advantages
and disadvantages of socially constructed data. Some of theadvantages are large coverage, timeliness, and communityverification of data quality. Some of the disadvantages arepotentially erroneous data and public bias (vs. the editorialbias often extant in traditional data settings).
III. ANALYSIS
Two different yet complimentary approaches were used toanalyze the data: (1) preparing a graphic representation ofthe network for visual analysis of patterns and (2) analyzingnumeric features of the networks. The number of patternscould be very large, and what one reader finds most interestingmay be of lesser interest to others. We highlight some ofthe patterns that we have found interesting and encouragereaders to discover additional patterns based on their personalpreferences and objectives. This analysis is intended to bedemonstrative. Since our data describe leadership roles intechnology-based businesses, it is not intended to be docu-mentary or prescriptive. Nonetheless, due to a large numberrecords and to the interconnected nature of the records, thisanalysis does identify several interesting patterns. It posesseveral opportunities for further research.
A. Visual AnalysisThe use of graphic images to represent network configura-
tions is important because it allows investigators to gain newinsights into the patterning of connections [2]. We use Gephi[3] for graph visualization and layout. We performed networklayout in two stages: (1) cluster-based stage, (2) relation-basedcompacting stage. In the cluster-based stage we use OpenOrdlayout algorithm [4], since it produces layout that allowsto better distinguish clusters based on the interconnectionsbetween the nodes. We then apply ForceAtlas [3], to compactthe graph (nodes that are connected are pulled closer together).The network figures are embedded in the document by usingscalable vector graphics (svg), so it is possible to look atnetwork details by zooming in.
1) Intra-University Network : A graphic analysis of intra-university alumni networks is produced in the followingmanner. First, the university node is selected, then all ofthe nodes that are connected to it are added (in this case,the university’s alumni), finally all of the nodes to whichalumni are connected are added (in this case, the companies atwhich alumni have worked, invested in, or served on advisoryboards). In the intra-university network, other universitiesmay also be present (a person may be an alum of severaluniversities). A noticeable portion of alumni from MIT haveassociations with other universities, Harvard alumni to a lesserdegree, followed by Stanford, and finally UC Berkeley alumnishow the fewest associations with other universities. The inter-university relationships are described further in Section III-A2.
Intra-university networks were produced for Stanford Uni-versity, Harvard University, University of California (Berke-ley), and MIT. The alumni networks produced for eachindependent educational institution were equally interesting,in comparison Figure 1. Three differences are immediatelyapparent across the intra-university networks. First, number

3
University Alumnus Company
Size (degree log-scaled)
(a) Stanford University. (b) Harvard University. (c) MIT. (d) UC Berkeley.
Figure 1: Intra-University Networks. Networks of the above universities are expanded in a breadth first manner up to the depthof 2, (showing university, alumni and companies they are associated with through employment, investment or other activities)(Section III-A1). Size of the node reflects degree of the node (scaled logarithmically).
of company nodes in relation to number of alumni nodesdiffers. Stanford university has a significantly higher ratio ofcompanies per alumni in leadership roles, followed by Har-vard, trailed by Berkeley, and MIT. A high ratio of companynodes indicates that alumni have been involved with multiplecompanies - either through employment, advisory or invest-ment activities. In addition, the number of highly connectedalumni (large nodes with many connections located on theperimeter) differs significantly between universities (we furtherexplore this in Section III-B). One particular characteristic ofhighly connected alumni stands out, namely their collaborationpatterns. Stanford’s densely connected alumni are highly likelyto collaborate with fellow alumni (indicated by the companynodes being pulled away from highly connected alumnustowards other less-connected alumni in the center). In thenetworks of other universities, the collaboration of highlyconnected individuals with their fellow alumni is evidencedbut to a lesser degree.
Harvard alumni appear active in leadership positions intechnology-based startups, even more so than MIT alumni(Figure 1b vs. 1c). A possible explanation for the relativelylower level of MIT alumni may be attributable to the focus ofthis dataset on leadership positions in the organizations. Whileengineers play a key role, they often do so in a technologydevelopment capacity rather than in the leadership positionsthat are visible in public relations communications. Somesupport for this explanation may be seen in the Figure 2relatively large distance between Microsoft and Universityof Washington, even though a large number of engineers atMicrosoft are indeed from University of Washington.
2) Inter-University Network: A graphic representation ofthe alumni-based inter-relations between universities, shownin Figure 2, was produced as follows. Four universitieswere selected for analysis: Stanford University, University ofCalifornia (Berkeley), Harvard University and MassachusettsInstitute of Technology (MIT). From these nodes we haveperformed breadth-first expansion up to the depth of three:1st level being alumni of these corresponding universities, 2ndlevel are companies with which alumni have relations, and 3rd
University
Size (Centrality log-scaled)
Stanford
MIT
Harvard
Berkeley
Financial Org.
Company
Person
University & Alumni Other Nodes
Figure 2: Inter-University Network (between Stanford, Har-vard, MIT, Berkeley) (Section III-A2). Network is obtainedby starting with the nodes of the above mentioned universitiesand performing a breadth-first expansion up to the depth of 3.
level entities/nodes that are linked to previous levels includingfinancial organizations, company employees, etc. Since weare primarily interested in relationships among alumni, all ofother entities are faded out, except for the above mentioneduniversities and their alumni. In addition, we glimpse atthe relations between alumni and investment firms (a veryimportant factor for entrepreneurism). Therefore, nodes offinancial organizations are not faded out.
Two distinct groups – universities (in the lower left corner)and financials (in the upper right corner) – are visible in thesubdued edges in Figure 2. The distance from the universities

4
to the cloud of ‘financial’ clusters also varies. In particular,Stanford and Berkeley are rather close to the financial cloud.This may be explained by the geographical proximity ofthese universities to one of the largest sources of venturefunding – Silicon Valley. While universities themselves arenot embedded within the financial clusters, a noticeable pro-portion of alumni are deeply connected within the financialclusters by having direct or indirect relations with multiplefinancial organizations. Stanford has the largest number ofalumni connected to the financial cluster, followed by Harvard(even though university itself is relatively distant from thefinancial cluster); followed by Berkeley, and only a few alumnifrom MIT. The proximity between alumni and their almamatters appear to differ significantly. Berkeley alumni tendto be clustered together, MIT to somewhat lesser degree, andStanford and Harvard alumni are rather dispersed. Proximitybetween universities differs as well. Stanford and Berkeleyare close together (many alumni hold leadership positionsin the same companies). One of the likely explanations forthis network proximity is the geographical proximity of bothuniversities to Silicon Valley where many of the investmentfirms and startup companies are located. Harvard and MIT donot appear to have as strong relations with other universitiesin these settings.
University
Other Entities (Company, People, Financial Org.)
Size (Centrality degree log-scaled)
Figure 3: Universities within the Business Network (partialsnapshot) (Section III-A3). Note that nodes locations differsignificantly from Figure 2 due to additional forces exerted bya very large number of nodes and links of the complete net-work (144,685 nodes and 129,423 links). For better visibilityof the entity types except for universities are faded out.
3) Universities Within the Technology-Based Business Net-work : Through alumni, universities become indirectly linkedto a variety of business entities – technology-based companies,the service organizations that support them, and investment
firms. The positions of universities within the technology-based business network Figure 3 are determined by theirdirect links only to the alumni. However the proximity andlocation of universities within the business network Figure3 differ from those of the inter-university network [fig:Inter-University-Network]. It should be noted that a large number ofnodes and links that were not included in the inter-universitynetwork are, in fact, included in the full network layout of thenodes. The cluster and forced based layout algorithms used inthis analysis produce nodes that have many interconnectionsand tend to be close together. Moreover, both the direct andindirect links influence position of nodes within the network.Hence, the patterns of nodes differs significantly between theBusiness Network and the Inter-University Network.
Let us look at the proximity between universities andcompanies. While Microsoft and Yahoo are close to manymajor universities, Google appears to be distant from them.Discovering the precise explanation for this warrants furtherinvestigation, but let us suggest two hypotheses. As we brieflydiscussed in Section III-A2 and Section II-C, our dataset isfocused on ‘key’ people within the company (e.g. mentionedin press releases). Unlike many of other companies, Googletends to give credit to its engineers, e.g. names of engineersare mentioned in press releases. In addition, Google hadexperienced very rapid employee growth, which has requiredestablishing relationships with many universities to meet hiringgoals.
B. Data Analysis
In addition to examining networks visually, we use severalnetwork measures to reveal the characteristics and patternsof the underlying network. One of the biggest advantages ofnumerical analysis of network data is the ability to analyzevery large networks; in visual analysis patterns in large net-works quickly become difficult to discern (Figure 2, 3). For thenumerical analysis, we used the full set of data as described inSection II-C; constructed network contains 144,685 nodes and129,423 links; including over 2,100 educational institutions.Due to space limitations, we have selected to report networkproperties of 20 universities with the largest number of alumniincluded in our dataset.
Social Network Metrics: Network metrics numericallyexpress characteristics and patterns of the underlying network.For this analysis, we have chosen to use the following networkmeasures: centrality (betweenness centrality and closenesscentrality), and eccentricity. Centrality reflects the relativeimportance of a node within the graph. Betweenness andcloseness centrality are typical measures of centrality [5],[3]. Betweenness centrality can be thought of as a kind ofbridge/broker score, a measure of how much the connectionsbetween other nodes in the network would be disruptedby removing that node. If an alum has a very novel andhighly desired expertise, s/he may provide crucial and ratherexclusive links for doing business in that domain. Moreprecisely betweenness centrality measures how frequently anode appears on shortest paths between nodes in the network.On the other hand, closeness centrality indicates how ‘central’

5
the node is, i.e. how close the node is to all of the othernodes in the network. More precisely, it is the inverse of theaverage distances from the nodes to all other nodes within thenetwork. For example, a person that knows many other peopledirectly or indirectly (not necessarily as exclusively as inbetweenness centrality) would have high closeness centrality.Another feature of the network that we use is eccentricity.Eccentricity is somewhat inverse of the centrality measure,indicating the isolation distance, i.e. how far a node is fromthe node most distant from it in the graph.
Normalization: While it is recognized that institutionalsize may play a role in the numbers of alumni taking leadershippositions in technology-based companies, as well as in thenumber of relationships established among alumni, the metricsin this analysis were not normalized for size of the educationalinstitution for the reasons outlined bellow (supplemental,alumnus-centered metrics are provided in Section III-B1).Normalizing with respect to number of alumni would diminishthe influence of networks with many members. The size of thenetwork does matter, so it may not be warranted to disregardit. In addition, the relationship between the number of alumniand network metrics is non-linear and is different for eachmetric, so there appears to be no clear argument in favor ofnormalization. For these reasons we have used raw numbers.
1) Alumni-centered Networks: Several properties of alumniare essential components of these networks. To investigateproperties of alumni networks, we have removed universitiesnodes from the network, using university affiliation as aproperty of alumni rather than as a connection (in the laterSection III-B2, we analyze and compare it with the fullnetwork), this way we can examine the actual connectionsthat alumni have.
Table I shows numeric values for number of alumni records,median betweenness centrality, closeness centrality, and eccen-tricity (median value is resilient to outliers, and is indicativeof a typical alum in our data). In an examination of medianeccentricity, universities cluster into two groups. One grouphas a median eccentricity of about 20, another group haseccentricity close to 3. The low value of eccentricity (i.e. 3)occurs when the longest path goes through only three nodes.This is indicative of the network being fragmented (i.e. notinterconnected). Similar patterns are revealed with respect tocloseness centrality.
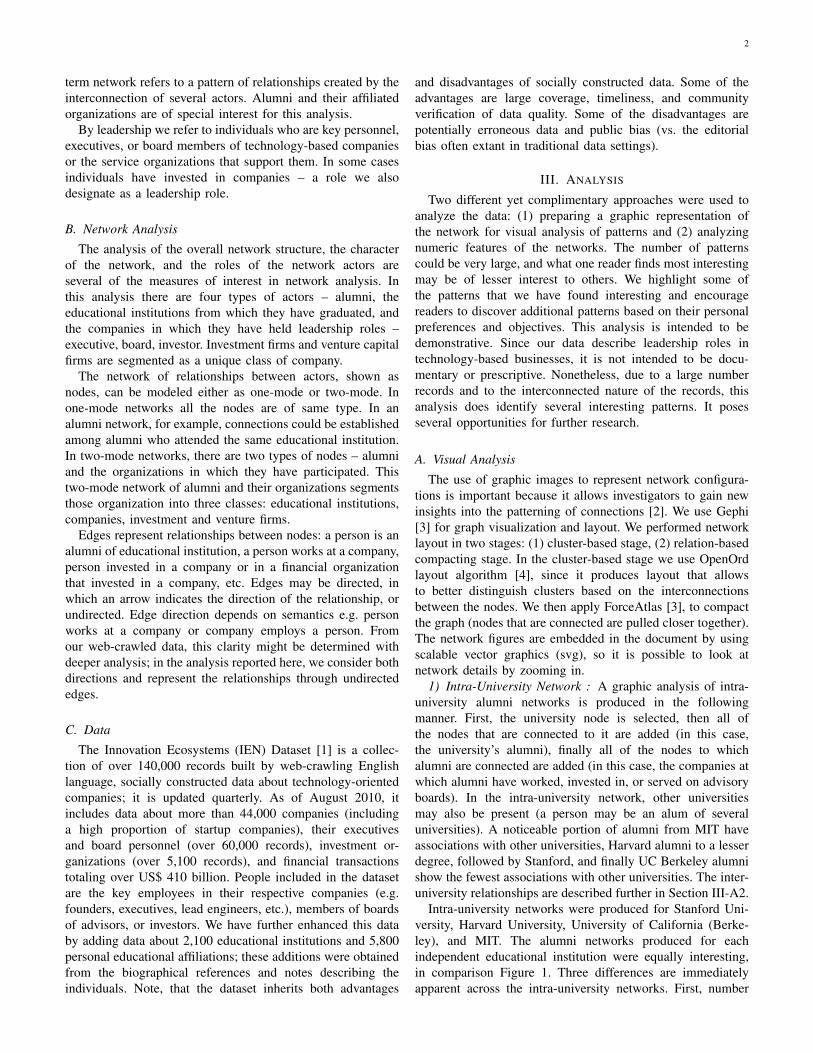
Figure 4a shows the graph of alumni’s betweenness cen-trality. People with maximum centrality have similar values,which then drop very quickly following the long-tailed distri-bution. Stanford University has a significant higher centralityscore (many people w/ very high betweenness centrality), withthe other group of universities led by Harvard but rather closeto each other.
2) University-centered Networks: In Section III-B1, welooked at the network metrics of alumni without the presenceof their affiliated universities. By adding the university node,connecting it to the alumni, and comparing how this effectsmetrics, we can see the potential network effect of a universityand its alumni. The actual impact would most likely besmaller, since the assumption that all alumni are connectedto each other through university (made for this analysis) is
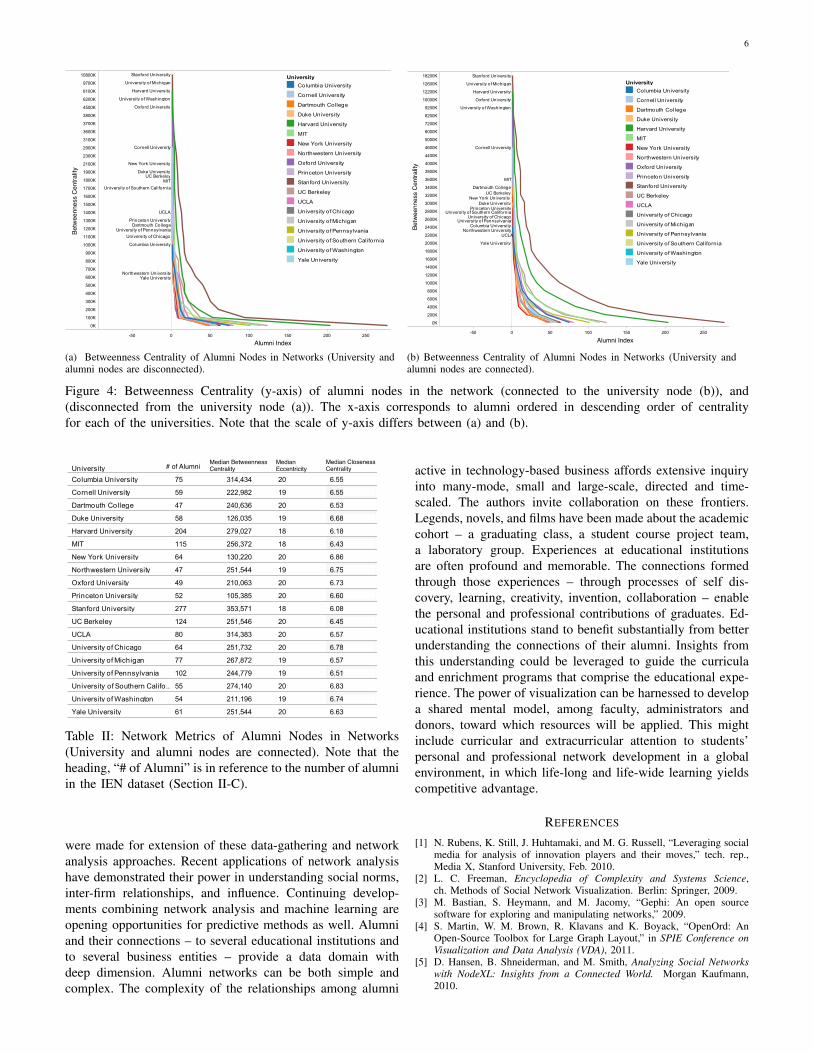
not realistic.Table II shows numeric values for number of alumni
records, median betweenness centrality, closeness centrality,and eccentricity. Comparing this data with Table I and Sec-tion III-B1, a very interesting revelation is the potential thatuniversity network has to remedy low eccentricity of 3 andbring it to par with the rest of the universities (eccentricityclose to 20). High eccentricity implies that a person can followa long path of connections and be indirectly connected to alarger network, and by the same token, a university connectionmay have a smaller relationship influence for alumni with higheccentricity. The presence or absence of the university nodesin the network analysis has similar affect on median closenesscentrality.
Figure 4b shows the graph of alumni betweenness centrality.Interestingly, in comparison with the network in which univer-sity was not present, Figure 4a; the order of the most ‘con-nected’ individuals remained remarkably similar (only Oxfordand University of Washington changed places); As in Figure4b, Stanford still has a significantly higher metric. However,Harvard takes a strong second position. Overall the magnitudeof betweenness centrality changed by a factor of 1.8; showingthat even ‘connected’ individuals may significantly benefitfrom the university network.
5
On the other hand, closeness centrality indicates how ‘central’the node is, i.e. how close the node is to all of the othernodes in a network. More precisely, it is the inverse of theaverage distances from the nodes to all other nodes within thenetwork. For example, a person that knows many other peopledirectly or indirectly (not necessarily as exclusively as inbetweenness centrality) would have high closeness centrality.Another feature of the network that we use is eccentricity.Eccentricity is somewhat inverse of the centrality measure,indicating the isolation distance, i.e. how far a node is fromthe node most distant from it in the graph.
Normalization: While it is recognized that institutionalsize may play a role in the numbers of alumni taking leadershippositions in technology-based companies, as well as in thenumber of relationships established among alumni, the metricsin this analysis were not normalized for size of the educationalinstitution for the reasons outlined bellow (supplemental,alumnus-centered metrics are provided in Section III-B1).Normalizing with respect to number of alumni would diminishthe impact of networks with many members; but the size of thenetwork does matter, so it may not be warranted to disregardit. In addition, the relationship between the number of alumniand network metrics is non-linear and is different for eachmetric, so there is no one right way of doing it. For thesereasons we have decided not to normalize network metrics.
1) Alumni-centered Networks: Before starting to analyzeuniversity networks, let us look at the properties of alumnithat are essential components of these networks. To investigateproperties of alumni, we have removed universities nodes fromthe network, as to isolate the strong influence that universitynodes exert on the properties of alumni nodes (in the laterSection III-B2, we analyze and compare it with the fullnetwork), this way we can examine the actual connectionsthat alumni have.
Table I shows numeric values for number of alumni records,median betweenness centrality, closeness centrality, and eccen-tricity (median value is resilient to outliers, and is indicativeof an ’average’ alumnus). Median eccentricity, clusters uni-versities into two groups; one group with median eccentricityof about 20, with eccentricity of close to 3. The low value ofeccentricity i.e. 3, occurs when the longest path goes throughonly three nodes. In this case, it is indicative of network beingrather fragmented (i.e. not interconnected). Similar behaviorhappens also with respect to closeness centrality. Figure 4ashows the graph of alumni’s betweenness centrality. Peoplewith maximum centrality have similar values, which then dropvery quickly following the long-tailed distribution. StanfordUniversity has a significant lead (many people w/ very highbetweenness centrality), with the other group of universitiesbeing lead by Harvard with many universities being ratherclose to each other.
2) University-centered Networks: In Section III-B1, wehave looked at metrics of alumni on their own. By adding theuniversity node and connecting it to the alumni, and comparinghow this effects metrics, we can see the potential impact thatuniversity can have on its alumni (or the other way around,how alumni may influence metrics of a university). The actualimpact would most likely be smaller, since the assumption that
all alumni are connected to each other through university isnot realistic; but some of the alumni may indeed form theseconnections through a university.
Table II shows numeric values for number of alumnirecords, median betweenness centrality, closeness centrality,and eccentricity. Comparing this data with Table I and SectionIII-B1, a very interesting phenomena is that university has apotential of not only completely eliminating previously loweccentricity of 3, by bring it to par with the rest of theuniversities (eccentricity close to 20); where high eccentricityimplies that a person can follow a long path of connectionsand no longer be disconnected from a larger network. On theother hand, university has very little effect on alumni withhigh eccentricity. Adding university node, has similar affecton median closeness centrality. Figure 4b shows the graphof alumni betweenness centrality. Interestingly, in compari-son with the network in which university was not presentFigure 4a; the order of the most ‘connected’ individualsdid not change almost at all (only Oxford and Universityof Washington changed places); As in Figure 4b, Stanfordstill has a significant lead. However, Harvard was able toseparate itself from the rest of the universities and to take astrong second position. Overall the magnitude of betweenesscentrality changed by about a factor of 1.8; showing thateven ‘connected’ individuals may significantly benefit fromthe university network. University has a wonderful opportunityto play a role of the connector, and by connecting it’s alumniwill become more central and connected itself.
# of AlumniMedian Betweenness Centrality
MedianEccentricity
Median Closeness Centrality
<<< TODO: take out University of California; comment on Stanford’s non-zero betweenness >>>
Table I: Metrics of Alumni nodes (disconnected from theuniversity nodes).
IV. CONCLUSION
This analysis proposed and demonstrated a new method-ological lens for understanding the role alumni play in thereputation of educational institutions. Using four well-knownuniversities as examples, this demonstration has shown howonline web-crawling can produce data about alumni and theiralma maters, as well as about the companies they have
Table I: Network Metrics of Alumni Nodes in Networks(University and alumni nodes are disconnected). Note that theheading, “# of Alumni” is in reference to the number of alumniin the IEN dataset (Section II-C).
IV. CONCLUSION
This analysis proposed and demonstrated a new method-ological lens for understanding the role alumni play in thereputation of educational institutions. Using four well-knownuniversities as examples, this demonstration has shown howonline web-crawling can produce data about alumni and theiralma maters, as well as about the companies they havefounded, funded and led. Network metrics and social networkanalysis were used to demonstrate alumni-centric, institution-centric, and business cluster-centric analyses. Suggestions
66
Betw
eenn
ess
Cen
tralit
y
Alumni Index
(a) University and Alumni nodes are disconnected.
Betw
eenn
ess
Cen
tralit
y
Alumni Index
(b) University and Alumni nodes are connected.<<< TODO: adjust leveling: see extra white line in graffle/pdf; (a) remove partial y-caption; add U caption (max) ... >>>
Figure 4: Betweenness Centrality (y-axis) of alumni nodes in the network (connected to the university node (b)), and(disconnected from the university node (a)). The x-axis corresponds to alumni index within university (ordered in descendingorder of centrality). Note that the scale of y-axis differs between (a) and (b).
# of Alumni Median Betweenness Centrality
MedianEccentricity
Median Closeness Centrality
Table II: Metrics of of Alumni nodes (connected to theuniversity nodes).
online web-crawling can produce data about alumni and theiralma maters, as well as about the companies they havefounded, funded and led. Network metrics and social networkanalysis were used to demonstrate alumni-centric, institution-centric, and business cluster-centric analyses. Suggestionswere made for extension of these data-gathering and networkanalysis approaches.
Opportunities for further development of data-gatheringmethods, as well as for data curation and data federation.
[more here]Recent applications of network analysis have demonstrated
their power in understanding social norms, inter-firm relation-ships, and influence. Continuing developments combining net-work analysis and machine learning are opening opportunitiesfor predictive methods as well. Alumni and their connections- to several educational institutions and to several businessentities – provide a data domain with deep dimension. Alumninetworks can be both simple and complex. The complexityof the relationships among alumni active in technology-basedbusiness affords extensive inquiry into many-mode, smalland large-scale, directed and time-scaled. The authors invitecollaboration on these frontiers.
Legends, novels, and films have been made about theacademic cohort – a graduating class, a student course projectteam, a laboratory group. Experiences at educational insti-tutions are often profound and memorable. The connectionsformed through those experiences – through processes of selfdiscovery, learning, creativity, invention, collaboration - enablethe personal and professional contributions of graduates.
Educational institutions stand to benefit substantially frombetter understanding the connections of their alumni. Insightsfrom this understanding could be leveraged to guide the cur-ricula and enrichment programs that comprise the educationalexperience. The power of visualization can be harnessed todevelop a shared mental model, among faculty, administratorsand donors, toward which resources will be applied. Thismight include curricular and extracurricular attention to stu-dents’ personal and professional network development in aglobal environment, in which life-long and life-wide learning
(a) Betweenness Centrality of Alumni Nodes in Networks (University andalumni nodes are disconnected).
6
Betw
eenn
ess
Cen
tralit
y
Alumni Index
(a) University and Alumni nodes are disconnected.
Betw
eenn
ess
Cen
tralit
y
Alumni Index
(b) University and Alumni nodes are connected.<<< TODO: adjust leveling: see extra white line in graffle/pdf; (a) remove partial y-caption; add U caption (max) ... >>>
Figure 4: Betweenness Centrality (y-axis) of alumni nodes in the network (connected to the university node (b)), and(disconnected from the university node (a)). The x-axis corresponds to alumni index within university (ordered in descendingorder of centrality). Note that the scale of y-axis differs between (a) and (b).
# of Alumni Median Betweenness Centrality
MedianEccentricity
Median Closeness Centrality
Table II: Metrics of of Alumni nodes (connected to theuniversity nodes).
online web-crawling can produce data about alumni and theiralma maters, as well as about the companies they havefounded, funded and led. Network metrics and social networkanalysis were used to demonstrate alumni-centric, institution-centric, and business cluster-centric analyses. Suggestionswere made for extension of these data-gathering and networkanalysis approaches.
Opportunities for further development of data-gatheringmethods, as well as for data curation and data federation.
[more here]Recent applications of network analysis have demonstrated
their power in understanding social norms, inter-firm relation-ships, and influence. Continuing developments combining net-work analysis and machine learning are opening opportunitiesfor predictive methods as well. Alumni and their connections- to several educational institutions and to several businessentities – provide a data domain with deep dimension. Alumninetworks can be both simple and complex. The complexityof the relationships among alumni active in technology-basedbusiness affords extensive inquiry into many-mode, smalland large-scale, directed and time-scaled. The authors invitecollaboration on these frontiers.
Legends, novels, and films have been made about theacademic cohort – a graduating class, a student course projectteam, a laboratory group. Experiences at educational insti-tutions are often profound and memorable. The connectionsformed through those experiences – through processes of selfdiscovery, learning, creativity, invention, collaboration - enablethe personal and professional contributions of graduates.
Educational institutions stand to benefit substantially frombetter understanding the connections of their alumni. Insightsfrom this understanding could be leveraged to guide the cur-ricula and enrichment programs that comprise the educationalexperience. The power of visualization can be harnessed todevelop a shared mental model, among faculty, administratorsand donors, toward which resources will be applied. Thismight include curricular and extracurricular attention to stu-dents’ personal and professional network development in aglobal environment, in which life-long and life-wide learning
(b) Betweenness Centrality of Alumni Nodes in Networks (University andalumni nodes are connected).
Figure 4: Betweenness Centrality (y-axis) of alumni nodes in the network (connected to the university node (b)), and(disconnected from the university node (a)). The x-axis corresponds to alumni ordered in descending order of centralityfor each of the universities. Note that the scale of y-axis differs between (a) and (b).
# of Alumni Median Betweenness Centrality
MedianEccentricity
Median Closeness Centrality
Table II: Network Metrics of Alumni Nodes in Networks(University and alumni nodes are connected). Note that theheading, “# of Alumni” is in reference to the number of alumniin the IEN dataset (Section II-C).
were made for extension of these data-gathering and networkanalysis approaches. Recent applications of network analysishave demonstrated their power in understanding social norms,inter-firm relationships, and influence. Continuing develop-ments combining network analysis and machine learning areopening opportunities for predictive methods as well. Alumniand their connections – to several educational institutions andto several business entities – provide a data domain withdeep dimension. Alumni networks can be both simple andcomplex. The complexity of the relationships among alumni
active in technology-based business affords extensive inquiryinto many-mode, small and large-scale, directed and time-scaled. The authors invite collaboration on these frontiers.Legends, novels, and films have been made about the academiccohort – a graduating class, a student course project team,a laboratory group. Experiences at educational institutionsare often profound and memorable. The connections formedthrough those experiences – through processes of self dis-covery, learning, creativity, invention, collaboration – enablethe personal and professional contributions of graduates. Ed-ucational institutions stand to benefit substantially from betterunderstanding the connections of their alumni. Insights fromthis understanding could be leveraged to guide the curriculaand enrichment programs that comprise the educational expe-rience. The power of visualization can be harnessed to developa shared mental model, among faculty, administrators anddonors, toward which resources will be applied. This mightinclude curricular and extracurricular attention to students’personal and professional network development in a globalenvironment, in which life-long and life-wide learning yieldscompetitive advantage.
REFERENCES
[1] N. Rubens, K. Still, J. Huhtamaki, and M. G. Russell, “Leveraging socialmedia for analysis of innovation players and their moves,” tech. rep.,Media X, Stanford University, Feb. 2010.
[2] L. C. Freeman, Encyclopedia of Complexity and Systems Science,ch. Methods of Social Network Visualization. Berlin: Springer, 2009.
[3] M. Bastian, S. Heymann, and M. Jacomy, “Gephi: An open sourcesoftware for exploring and manipulating networks,” 2009.
[4] S. Martin, W. M. Brown, R. Klavans and K. Boyack, “OpenOrd: AnOpen-Source Toolbox for Large Graph Layout,” in SPIE Conference onVisualization and Data Analysis (VDA), 2011.
[5] D. Hansen, B. Shneiderman, and M. Smith, Analyzing Social Networkswith NodeXL: Insights from a Connected World. Morgan Kaufmann,2010.