alzgps: a genome-wide positioning systems platform to ... · 17/09/2020 · 1 1 alzgps: a...
TRANSCRIPT
1
AlzGPS: A Genome-wide Positioning Systems Platform to Catalyze 1
Multi-omics for Alzheimer's Therapeutic Discovery 2
3
Yadi Zhou1,#, Jiansong Fang1,#, Lynn Bekris1,2, Young Heon Kim1, Andrew A. Pieper3-8, 4
James B. Leverenz9, Jeffrey Cummings10,11, Feixiong Cheng1,2,12,* 5
6
1Genomic Medicine Institute, Lerner Research Institute, Cleveland Clinic, Cleveland, OH 7
44195, USA 8
2Department of Molecular Medicine, Cleveland Clinic Lerner College of Medicine, Case 9
Western Reserve University, Cleveland, OH 44195, USA 10
3Harrington Discovery Institute, University Hospitals Cleveland Medical Center, 11
Cleveland, OH 44106, USA 12
4Department of Psychiatry, Case Western Reserve University, Cleveland, OH 44106, 13
USA 14
5Geriatric Psychiatry, GRECC, Louis Stokes Cleveland VA Medical Center; Cleveland, 15
OH 44106, USA 16
6Institute for Transformative Molecular Medicine, School of Medicine, Case Western 17
Reserve University, Cleveland 44106, OH, USA 18
7Weill Cornell Autism Research Program, Weill Cornell Medicine of Cornell University, 19
New York, NY 10065, USA 20
8Department of Neuroscience, Case Western Reserve University, School of Medicine, 21
Cleveland, OH 44106, USA 22
9Lou Ruvo Center for Brain Health, Neurological Institute, Cleveland Clinic, 23
Zhou e
t al. 2
020

2
Cleveland, Ohio 44195, USA 1
10Cleveland Clinic Lou Ruvo Center for Brain Health, Las Vegas, NV 89106, USA 2
11Chambers-Grundy Center for Transformative Neuroscience, Department of Brain 3
Health, School of Integrated Health Sciences, UNLV, Las Vegas, 4
Nevada 89154, USA 5
12Case Comprehensive Cancer Center, Case Western Reserve University School of 6
Medicine, Cleveland, OH 44106, USA 7
8
#These authors contributed equally to this work. 9
10
*Correspondence to: Feixiong Cheng, PhD 11
Lerner Research Institute, Cleveland Clinic 12
Tel: 216-444-7654; Fax: 216-636-0009 13
Email: [email protected] 14
15
16
17
Zhou e
t al. 2
020

3
Abstract 1
Background: Over15 million family members and caregivers have expended $220 2
billion for care of patients with AD and other dementias, and the attrition rate for AD 3
clinical trials (2002-2012) is estimated at 99.6%. While recent DNA/RNA sequencing 4
and other multi-omics technologies have advanced the understanding of the biology and 5
pathophysiology of AD, no effective disease-modifying or preventive therapies, for AD 6
have emerged in the past two decades. A new approach to integration of the genome, 7
transcriptome, proteome, and human interactome in the drug discovery and 8
development process is essential for this endeavor. 9
Methods: In this study, we developed AlzGPS (Genome-wide Positioning Systems 10
platform for Alzheimer's Therapeutic Discovery, https://alzgps.lerner.ccf.org), a 11
comprehensive systems biology tool to enable searching, visualizing, and analyzing 12
multi-omics, various types of heterogeneous biological networks, and clinical databases 13
for target identification and effective prevention and treatment of AD. 14
Results: Via AlzGPS: (1) we curated more than 100 AD multi-omics data sets capturing 15
DNA, RNA, protein, and small molecules’ profiles underlying AD pathogenesis (e.g., 16
early vs. late stage and tau vs. amyloid endophenotype); (2) we constructed 17
endophenotype disease modules by incorporating multi-omics findings and human 18
protein-protein interactome networks; (3) we identified repurposable drugs from ~3,000 19
FDA approved/investigational drugs for AD using state-of-the-art network proximity 20
analyses; (4) we curated 300 literature references for highly repurposable drugs; (5) we 21
included information from over 200 ongoing AD clinicals noting drug mechanisms and 22
primary drug targets, and linking them to our integrated multi-omics view for targets and 23
Zhou e
t al. 2
020

4
network analyses results for the drugs; (6) we implemented a highly interactive web-1
interface for database browsing and network visualization. 2
Conclusions: Network visualization enabled by the AlzGPS includes brain-specific 3
neighborhood networks for genes-of-interest, endophenotype disease module networks 4
for data sets-of-interest, and mechanism-of-action networks for drugs targeting disease 5
modules. By virtue of combining systems pharmacology and network-based integrative 6
analysis of multi-omics data, the AlzGPS offers actionable systems biology tools for 7
accelerating therapeutic development in AD. 8
9
Keywords: Alzheimer’s disease, network medicine, database, drug repurposing, clinical 10
trial, transcriptomics 11
12
13
Background 14
Alzheimer’s disease (AD) is a progressive neurodegenerative disorder accounting for 15
60-80% of dementia cases (1). In addition to cognitive decline, AD patients have 16
extensive neuropathological changes including deposition of extracellular amyloid 17
plaques, intracellular neurofibrillary tangles, and neuronal death (2, 3). It is estimated 18
that the number of AD patients will reach 16 million by 2050 in the United States alone 19
(4, 5). Effective treatments are needed, as there are no disease-modifying treatments 20
for AD and no new drugs have been approved since 2003 by the US Food and Drug 21
Administration (FDA). There are several possible explanations for the high failure rate in 22
AD drug discovery. For example, transgenic rodent models used to test drugs may not 23
Zhou e
t al. 2
020

5
fully represent human AD pathobiology (6). Also, there is a lack of sensitive measures 1
for outcomes in clinical trials. Other potential immediate causes for clinical trial failures 2
include targeting the wrong pathobiological or pathophysiological mechanisms, 3
attempted intervention at the wrong stage (too early or too late), unfavorable 4
pharmacodynamic and pharmacokinetic characteristics of the drug (e.g., poor brain 5
penetration), lack of target engagement by drug candidates, and hypothesis that fail to 6
incorporate the great complexity of AD (6, 7). 7
Multiple types of omics data have greatly facilitated our understanding of the 8
pathobiology of AD. For example, using single-cell RNA-seq, a novel microglia type 9
(termed disease-associated microglia, DAM) was discovered to be associated with AD, 10
understanding of whose molecular mechanism could offer new therapeutic targets (8). 11
Using large-scale genome-wide association studies (GWAS), twenty loci showed 12
genome-wide significant association with Alzheimer's disease, among which 11 were 13
newly discovered (9). A recent study using deep profiling of proteome and 14
phosphoproteome prioritized proteins and pathways associated with AD, and it was 15
shown that protein changes and their corresponding RNA levels only partially coincide 16
(10). The large amount of multi-omics data and recent advances in network-based 17
methodologies for drug repurposing today present unprecedented opportunities for 18
accelerating target identification for drug discovery for AD, and this potential has also 19
been demonstrated in other complex diseases as well, such as cancer (11), 20
cardiovascular disease (12), and schizophrenia (13), and are beginning to be exploited 21
in AD (6, 14). Drug repurposing offers a rapid and cost-effective solution for drug 22
discovery for complex disease, such as the current global pandemic of coronavirus 23
Zhou e
t al. 2
020

6
disease 2019 (COVID-19) (15, 16) and AD (6). The central idea of network-based drug 1
repurposing is that for a drug to be able to affect a disease, the drug targets must 2
directly overlap with or be in the immediate vicinity of the disease modules, which can 3
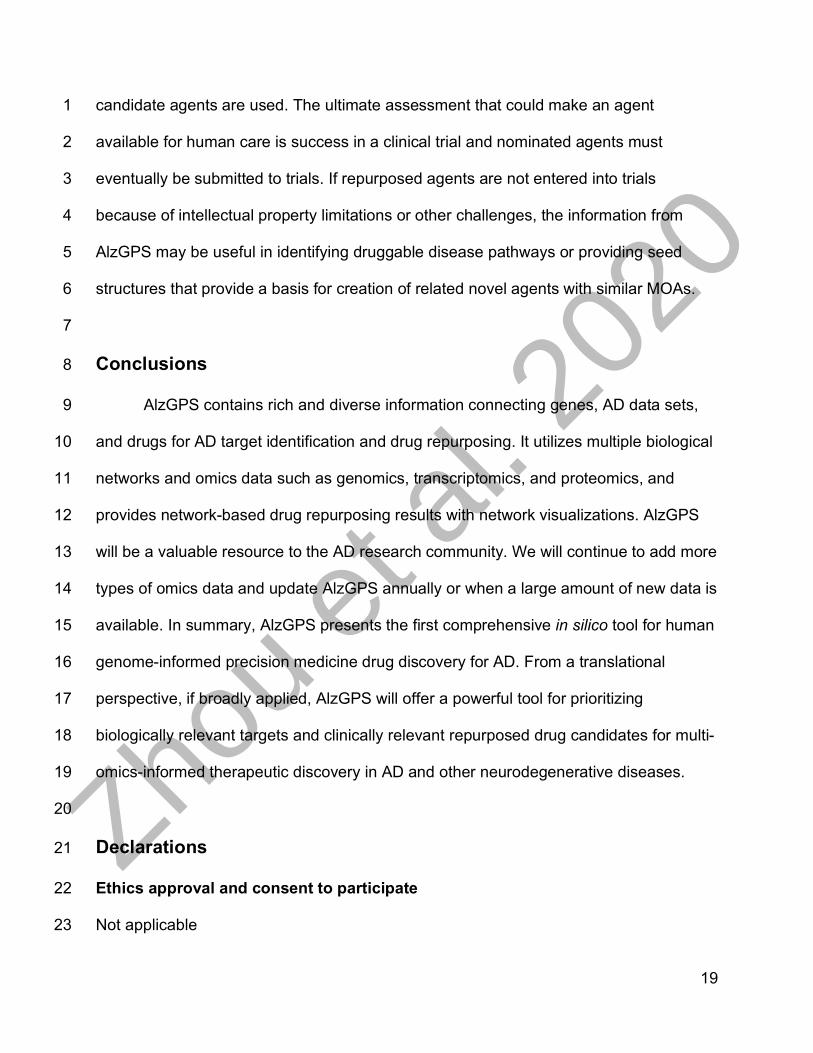
be identified using the vast amount of high-throughput sequencing data (Figure 1A). 4
Our recent efforts using network-based methodologies and AD omics data have led to 5
the discovery of two drugs that show efficacy in network models in AD: sildenafil and 6
pioglitazone (14). Network analysis provides potential mechanisms for these drugs and 7
facilitates experimental validation. Therefore, we believe posit that a comprehensive 8
systems biology tool in the framework of network-based multi-omics analysis could 9
inform Alzheimer's patient care and therapeutic development. 10
To this end, we present a new freely-available database and tool, named AlzGPS 11
(A Genome-wide Positioning Systems platform for Alzheimer's Therapeutic Discovery), 12
for target identification and drug repurposing for AD. AlzGPS was built with large scale 13
diverse information, including multi-omics (genomics, (bulk and single cell) 14
transcriptomics, proteomics, and interactomics) of human and other species, drug-target 15
network, literature-derived evidence, AD clinical trials information, and network proximity 16
analysis (Figure 1B). Our hope is that AlzGPS will be a valuable resource for the AD 17
research community for several reasons. First, AlzGPS contains abundant multi-domain 18
information types all coalesced in one location. The manually curated data, such as the 19
literaturederived information for the most promising repurposable drugs and more than 20
100 multi-omics AD data sets, are of high quality and relevance. Second, using state-of-21
the-art network proximity approaches, AlzGPS provides a systemic evaluation of 3000 22
FDA approved or investigational drugs against the AD data sets. These results (along 23
Zhou e
t al. 2
020

7
with various network visualizations) will provide insights for potential repurposable drugs 1
with clear network-based footprints in the context of the human protein interactome. The 2
drug-data set associations can be further explored in AlzGPS for individual drug targets 3
or genes associated with AD. Lastly, AlzGPS offers a highly interactive and intuitive 4
modern web interface. The relational nature of these data was embedded in the design 5
to help the user easily navigate through different types of information. In addition, 6
AlzGPS provides three types of network visualizations for the tens of thousands of 7
networks in the database, including brain-specific neighbor networks for genes, disease 8
modules for data sets, and inferred mechanism-of-action (MOA) networks for drugs and 9
data set pairs with significant proximity. AlzGPS is freely available to the public without 10
registration requirement at https://alzgps.lerner.ccf.org. 11
12
13
Methods 14
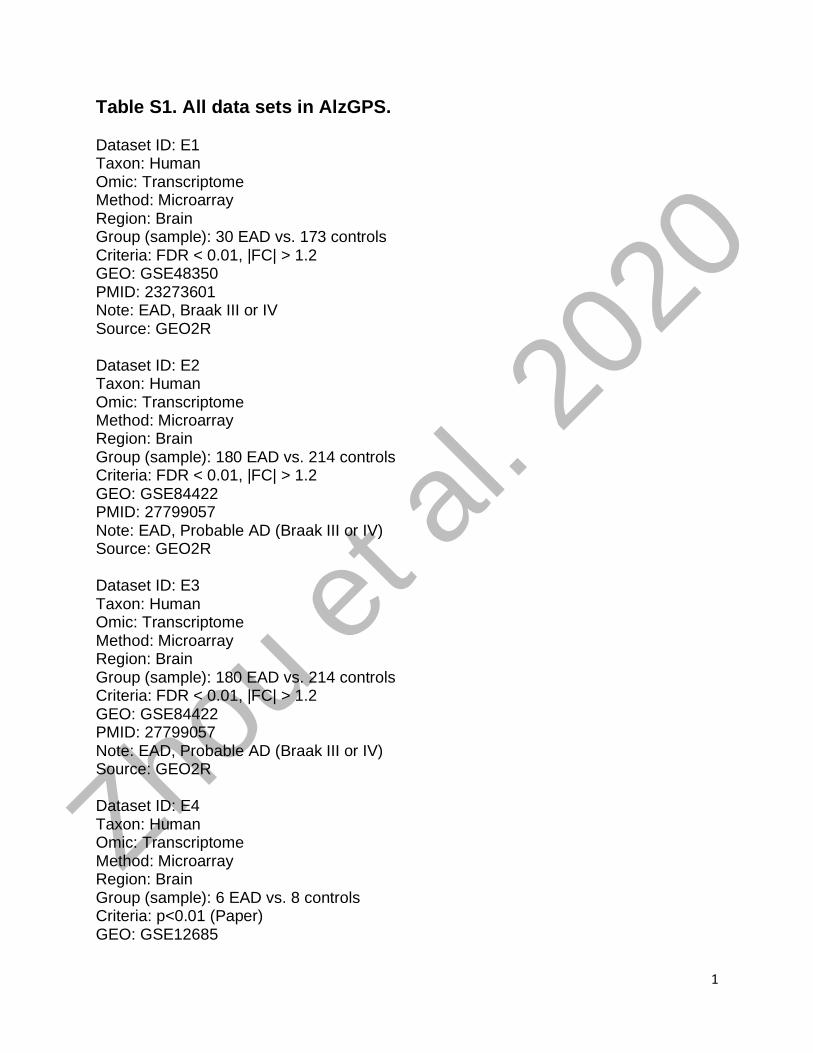
Data collection and preprocessing 15
AD data sets. A data set is defined as either (1) genes/proteins/metabolites that are 16
differentially expressed in AD patients/mice versus controls; or (2) genes that have 17
known associations with risks of AD from literature or other databases. We retrieved 18
expression data sets underlying AD pathogenesis capturing transcriptomics (microarray, 19
bulk or single-cell RNA-Seq) and proteomics across human, mouse, and model 20
organisms (e.g. fruit fly and C. elegans). All the samples of the data sets were derived 21
from total brain, specific brain regions (including hippocampus, cortex, and cerebellum), 22
and brain-derived single cells, such as microglial cells. For some of the expression data 23
Zhou e
t al. 2
020
8
sets, the differentially expressed genes/proteins were obtained from the original 1
publications (from main tables or supplemental tables). For other data sets that did not 2
have such differential expression results available, the original brain microarray/RNA-3
Seq data were obtained from Gene Expression Omnibus (GEO) (17) and differential 4
expression analysis was performed using the tool GEO2R (18). GEO2R performs the 5
differential expression analysis for the sample groups defined by the user using the 6
limma R package (19). All differentially expressed genes identified in mouse were 7
further mapped to unique human-orthologous genes using the NCBI HomoloGene 8
database (https://www.ncbi.nlm.nih.gov/homologene). The details for all the data sets, 9
including organism, genetic model (for mouse), brain region, cell type (for single-cell 10
RNA-Seq), PubMed ID, GEO ID, and the sources (e.g., supplemental table or GEO2R), 11
etc., can be found in Table S1. 12
Genes and Proteins. We retrieved the gene information from the HUGO Gene 13
Nomenclature Committee (HGNC, https://www.genenames.org/) (20), including gene 14
symbol, name, type (e.g., coding and non-coding), chromosome, synonyms, and 15
identification (ID) mapping in various other databases such as National Center for 16
Biotechnology Information (NCBI) Gene, ENSEMBL, and UniProt. All proteins from the 17
AD proteomics data sets were mapped to genes using the mapping information from 18
HGNC. 19
Single-nucleotide polymorphisms (SNPs). We found 3,321 AD-associated genetic 20
records for 1,268 genes mapped to 1,629 SNPs, by combining results from GWAS 21
Catalog (https://www.ebi.ac.uk/gwas/) (21) using the trait “Alzheimer's disease” and 22
published studies. The PubMed IDs for the genetic evidence are provided on AlzGPS. 23
Zhou e
t al. 2
020

9
Tissue expression specificity. We downloaded RNA-Seq data (Reads Per Kilobase 1
Million [RPKM] value) of 32 tissues from GTEx V6 release (accessed on April 01, 2016, 2
https://gtexportal.org/home/). We defined the genes with RPKM≥1 in over 80% of 3
samples as tissue-expressed genes and the other genes as tissue-unexpressed. To 4
quantify the expression significance of tissue-expressed gene 𝑖 in tissue 𝑡, we 5
calculated the average expression ⟨𝐸(𝑖)⟩ and the standard deviation 𝛿)(𝑖) of a gene’s 6
expression across all included tissues. The significance of gene expression in tissue 𝑡 is 7
defined as 8
𝑧)(𝑖, 𝑡) =𝐸(𝑖, 𝑡) − ⟨𝐸(𝑖)⟩
𝛿)(𝑖)(1) 9
10
Drugs. We retrieved drug information from the DrugBank database (v4.3) (22), 11
including name, type, group (approved, investigational, etc.), Simplified Molecular-Input 12
Line Entry System (SMILES) and Anatomical Therapeutic Chemical (ATC) code(s). We 13
also evaluated the pharmacokinetic properties (such as blood–brain barrier [BBB] 14
penetration) of the drugs using admetSAR (23, 24). 15
Drug literature information for AD treatment. For the top 300 repurposable drugs 16
(i.e., drugs with the highest number of significant proximities to the AD data sets), we 17
manually searched and curated the literature for their therapeutic efficacy against AD 18
using PubMed. In addition to the title, journal, and PubMed ID, we summarized the 19
types (clinical and non-clinical), experimental settings (e.g., mouse/human and 20
transgenic line for non-clinical studies; patient groups, randomization type, length, and 21
control type of clinical studies), and results of these studies. In total, we found 292 22
studies for 147 drugs. 23
Zhou e
t al. 2
020
10
Drug-target network. To build a high-quality drug-target network, several databases 1
were accessed, including the DrugBank database (v4.3) (22), Therapeutic Target 2
Database (TTD) (25), PharmGKB database, ChEMBL (v20) (26), BindingDB (27), and 3
IUPHAR/BPS Guide to PHARMACOLOGY (28). Only biophysical drug-target 4
interactions involving human proteins were included. To ensure data quality, we kept 5
only interactions that have inhibition constant/potency (Ki), dissociation constant (Kd), 6
median effective concentration (EC50), or median inhibitory concentration (IC50) ≤ 10 7
µM. The final drug-target network contains 21,965 interactions among 2,892 drugs and 8
2,847 human genes. 9
Clinical trials. The AD intervention clinical trials were retrieved from Cummings et al. 10
2018 (29) & 2019 (30). Information including phase, posted date, status, and agent(s) 11
was obtained from https://clinicaltrials.gov. Drugs were mapped to the DrugBank IDs. 12
Proposed mechanism and therapeutic purpose were from Cummings et al. 2018 (29) & 13
2019 (30). 14
Human protein interactome. We used our previously built high-quality comprehensive 15
human protein interactome which contains 351,444 unique protein-protein interactions 16
(PPIs, edges) among 17,706 proteins (nodes) (11, 12, 31, 32). Briefly, five types of 17
evidence were considered for building the interactome: physical PPIs from protein 18
three-dimensional (3D) structures, binary PPIs revealed by high-throughput yeast-two-19
hybrid (Y2H) systems, kinase-substrate interactions by literature-derived low-throughput 20
or high-throughput experiments, signaling networks by literature-derived low-throughput 21
experiments, and literature-curated PPIs identified by affinity purification followed by 22 Zhou e
t al. 2
020

11
mass spectrometry (AP-MS), Y2H, or by literature-derived low-throughput experiments. 1
No inferred PPIs were included. 2
3
Network proximity quantification of drugs and AD data sets 4
To quantify the associations between drugs and AD-related gene sets from the data 5
sets, we adopted the “closest” network proximity measure: 6
⟨𝑑12⟩ =1
3|𝐴|3 + ‖𝐵‖9:𝑚𝑖𝑛=∈2?∈1
𝑑(𝑎, 𝑏) +:𝑚𝑖𝑛?∈1=∈2
𝑑(𝑎, 𝑏)B(2) 7
where 𝑑(𝑎, 𝑏) is the shortest path length between gene 𝑎 and 𝑏 from gene list 𝐴 (drug 8
targets) and 𝐵 (AD genes), respectively. To evaluate whether such proximity was 9
significant, we performed z score normalization using a permutation test of 1,000 10
repeats. In each repeat, two randomly generated gene lists that have similar degree 11
distributions to 𝐴 and 𝐵 were measure for the proximity. The z score was calculated as: 12
𝑧D =𝑑 − 𝑑̅𝜎D
(3) 13
P value was calculated according the permutation test. Drug-data set pairs with Z < -1.5 14
and P < 0.05 were considered significantly proximal. In addition to network proximity, we 15
calculated two additional metrics, overlap coefficient 𝐶 and Jaccard index 𝐽, to quantify 16
the overlap and similarity of 𝐴 and 𝐵: 17
𝐶 =|𝐴 ∩ 𝐵|
min(|𝐴|, |𝐵|)(4) 18
𝐽 =|𝐴 ∩ 𝐵||𝐴 ∪ 𝐵|
(5) 19
20
Zhou e
t al. 2
020

12
Generation of networks 1
We offer three types of networks on AlzGPS: brain-specific neighborhood (EGO) 2
network for the genes, largest connected component (LCC) network for the data sets, 3
and inferred MOA network for significantly proximal drug-data set pairs. The three 4
networks differ by inclusion criteria of the nodes (genes/proteins). The edges are PPIs 5
colored by their types (e.g., 3D, Y2H, and literature). All networks are colored by 6
whether they can be targeted by the drugs in our database. 7
For the EGO networks, we filtered genes by their brain expression specificity and 8
generated only the network for those with positive brain specificity. We used the 9
ego_graph function from NetworkX (33) to generate the EGO networks. The networks 10
are centered around the genes-of-interest. An LCC network was generated for each AD 11
data set using the subgraph function from networkx. For MOA, we examined the 12
connections (PPIs) among the drug targets and the data sets. 13
14
Website implementation 15
AlzGPS was implemented with the Django v2.2.2 framework (www.djangoproject.com). 16
The website frontend was implemented with HTML, CSS, and JavaScript. The frontend 17
was designed to be highly interactive and integrative. It uses AJAX to asynchronously 18
acquire data in JSON format based on user requests to dynamically update the frontend 19
interface. This architecture can therefore be integrated into end users’ own pipelines. 20
Network visualizations were implemented using Cytoscape.js (34). 21
22
23
Zhou e
t al. 2
020

13
Results and Discussion 1
Information architecture and statistics 2
One key feature of AlzGPS is the highly diverse yet interconnected data types (Figure 3
1). The three main data types are genes, drugs, and AD-relevant omics data sets. More 4
than 100 omics data sets were processed, including 84 expression data sets (Table S1) 5
from AD transgenic animal models or patient-derived samples and 27 data sets from the 6
literature or acquired from other databases. The expression data sets contain 7
transcriptomic and proteomic data of human and rodent samples. Comparative sample 8
groups were available in these data sets, such as early stage vs. late stage, healthy vs. 9
AD. The differentially expressed genes/proteins were calculated for each data set. 10
The statistics and relations of the database are shown in Figure 1B. We 11
collected and processed all the basic information (see Methods) and then constructed 12
the relationships among the data types. For example, for genes and drugs, the 13
relationship is drugs targeting proteins (genes); for gene and data set, the relationship is 14
genes being differentially expressed in the expression data sets or included in other 15
types of data sets, such as literature-based; for drug and data set, the proximity 16
between each pair was calculated (see Methods) to identify the drugs that are 17
significantly proximal to a data set, and vice versa. 18
Additional data types were collected or generated. For genes, these included 19
genetic evidence (variants associated with AD) and tissue expression specificity to 20
provide additional information for target gene identification. For drugs, we collected the 21
data from ongoing clinical trials, including the proposed mechanism and therapeutic 22
purpose (29) & (30). The trials were mapped to drugs. The BBB probability was 23
Zhou e
t al. 2
020

14
computed (23, 24). For the top 300 drugs with the highest number of significant 1
proximities to all the data sets, we manually curated the available literature. A total of 2
292 studies were found for 147 drugs (49%) that reported the associations of the drugs 3
and AD. We grouped these studies into clinical and non-clinical, and extracted trial 4
information for clinical type and experimental setting (number and type of patients) for 5
both types. We also summarized and provide the study results. 6
7
Web interface and network visualizations 8
A highly interactive web interface was implemented (Figure 2). On the home page 9
(Figure 2A), the user can search for drugs, genes, metabolites, and gene variants. The 10
user can directly list all drugs by their first-level ATC code, all AD data sets available, 11
and all the ongoing clinical trials (Figure 2B). The search results are displayed in the 12
“DATA TABLE” tab and switched with their associated buttons in the “RESULT” section 13
on the left. Each data entity has its own data table for the associated information in the 14
“DATA TABLE” tab. For example, on the gene page of APP (Figure 2B) is the basic 15
information (green rows), such as name, type, chromosome, and synonym; descriptions 16
for the derived data (purple rows), such as tissue specificity and number of genetic 17
records; and external links (red row). Data for the relations of APP and other entities 18
can be loaded by clicking the button in “DETAIL” (blue row). For example, the 19
expression data sets in which APP is differentially expressed can be found by clicking 20
the “Dataset” button (Figure 2B). Any data loaded will be added to the same explorer. 21
The buttons in the “RESULT” are organized in trees. For example, APP is included in 22
the “V1 AD-seed” data set, which contains 144 AD-associated genes with strong 23
Zhou e
t al. 2
020

15
literature evidence. When the user clicks this data set in the APP gene table, a new 1
data table for the “V1 AD-seed” data set will replace the the APP gene page, and a new 2
button with indentation will appear below the APP button in “RESULT” (Figure 2B). 3
An all-in-one interactive explorer that minimizes the need for navigation of 4
information using the relational nature of these data is a major feature of the web 5
interface. Another major feature is the network visualizations. We offer three types of 6
networks, (1) the brain-specific neighborhood network (EGO) for a gene-of-interest that 7
shows the PPIs with its neighbors (Figure 2C); (2) the largest connected component 8
(LCC) network for a data set that shows the largest module formed by the genes in this 9
data set (Figure 2D); and (3) inferred MOA network for a significantly proximal drug-10
data set pair, which is illustrated in the case studies below. 11
12
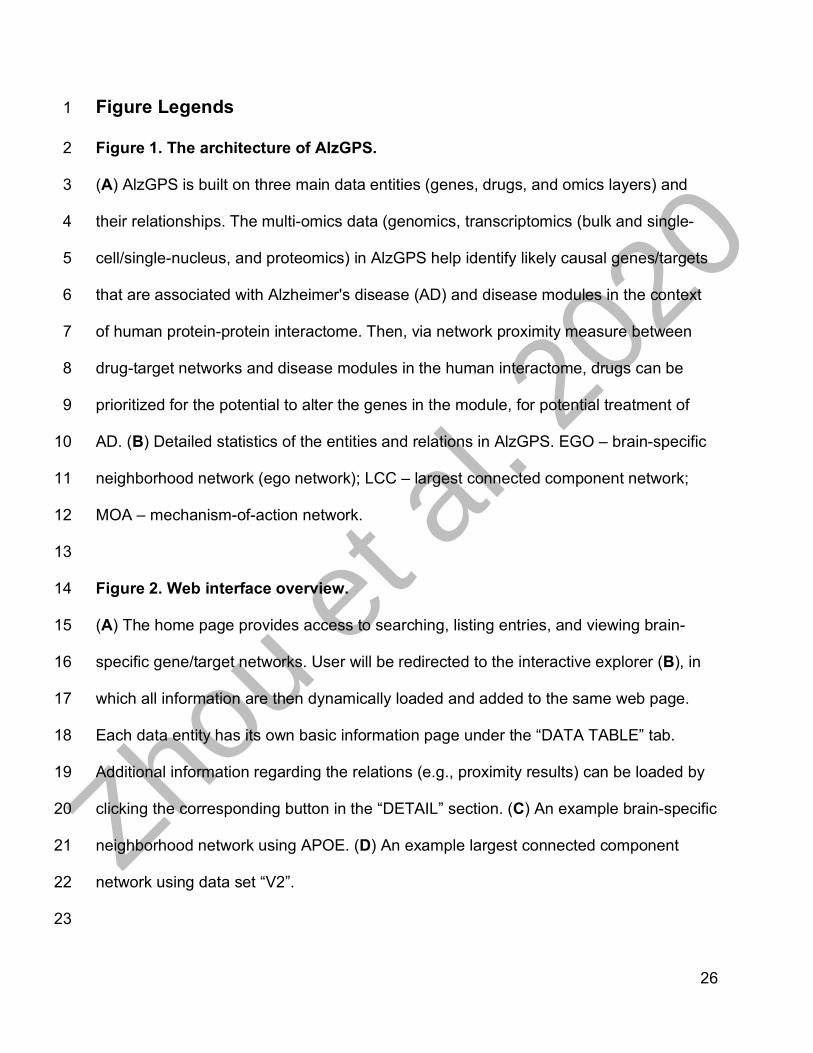
Case study – target identification 13
Generally, using AlzGPS for AD target identification starts with selecting one or a set of 14
data sets (Figure 2B, “DATASET” tab). Users can select a data set based on 15
organisms, methods (e.g., single-cell/nuclei RNA-Seq), brain regions, and comparisons 16
(e.g., early-onset AD vs healthy control) for the expression data sets. Additionally, we 17
have collected data sets from the literature, other databases, or computationally 18
predicted results. Here, we use the “V1 AD-seed” data set as a starting point. This data 19
set was from our recent study which contains 144 AD-associated genes based on 20
literature-derived evidence. We found that 118 genes were differentially expressed as 21
shown in at least one data set. By browsing these genes, we selected four examples, 22
microtubule associated protein tau (MAPT), bridging integrator 1 (BIN1), apolipoprotein 23
Zhou e
t al. 2
020

16
E (APOE), and β-secretase 1 (BACE1) based on positive brain expression specificity 1
and number of data sets that include them. 2
MAPT. MAPT encodes the tau protein, modification of which is one of the main 3
neuropathological hallmarks of AD (35, 36). Mutations and alternative splicing of MAPT 4
are associated with risk of AD (37). MAPT is differentially expressed in five expression 5
data sets (Figure 3A) and has high brain specificity. Five pieces of genetic evidence 6
were found for MAPT. MAPT can be targeted by 27 drugs. In addition, many of its direct 7
PPI neighbors are targetable, suggesting a potential treatment strategy by targeting 8
MAPT and its neighbors. 9
BIN1. BIN1 is one of the most important susceptibility genes for late-onset AD (38), and 10
can modulate tau pathology (39). Higher levels of BIN1 expression are associated with 11
a delayed age of AD onset (40). Differentially manifested in five data sets, BIN1 has 47 12
genetic record associations (Figure 3B). Although no drugs are known to target BIN1, 13
many of the BIN1’s PPI neighbors can be targeted. 14
APOE. The ε4 allele of APOE is the main genetic risk factor of AD (41). Apolipoprotein 15
E ε4 plays an important role in Aβ deposition (41), a major pathological hallmark of AD. 16
APOE is differentially expressed in 22 data sets (Figure 3C). It has a high number of 17
associated genetic records – 91. Both APOE and its PPI partners can be targeted. 18
BACE1. β-secretase 1 (BACE1) cleaves APP and generates amyloid-β peptides (42), 19
whose aggregation is another pathological hallmark of AD. The inhibition of BACE1 has 20
been a popular target for AD drug development. Shown in Figure 3D, BACE1 is 21
differentially expressed in 4 data sets. 22
23
Zhou e
t al. 2
020

17
Case study – drug repurposing 1
In this section, we use sildenafil and pioglitazone as two examples. In our recent 2
studies, we found that both sildenafil and pioglitazone were associated with a reduced 3
risk of AD using network proximity analysis and retrospective case-control validation 4
(14). Mechanistically, in vitro assays showed that both drugs were able to downregulate 5
cyclin-dependent kinase 5 (CDK5) and glycogen synthase kinase 3 beta (GSK3B) in 6
human microglia cells. These drugs were discovered using different data sets. Sildenafil 7
was found using a high-quality literature-based AD endophenotype module (available as 8
AlzGPS data set “V1 AD-seed”) containing 144 genes. Pioglitazone was found using 9
103 high-confidence AD risk genes (available as AlzGPS data set “V4 AD-inferred-10
GWAS-risk-genes”) identified by GWAS (13). 11
AlzGPS provides a list-view of the network proximity results of all the drugs 12
organized by their first-level ATC code, which can be found in the “DRUG CLASS” tab 13
(Figure 2B). The drugs are ranked by the number of significant proximities to the data 14
sets. Sildenafil is the top four of the 148 drugs under the ATC code G “Genito-urinary 15
system and sex hormones” with network proximity results, the top three being 16
vardenafil, ibuprofen, and gentian violet cation. Pioglitazone is the top sixth of the 226 17
drugs under the ATC code A “Alimentary tract and metabolism”, following tetracycline, 18
human insulin, epinephrine, cholecalciferol, and teduglutide. Both drugs achieved high 19
numbers of significant proximities to the expression data set. Next, we examined the 20
basic information of these drugs (Figure 4A and 4E). Both drugs are predicted to be 21
BBB penetrable. Sildenafil has 20 known targets and is significantly proximal to 27 of 22
the 111 data sets (Figure 4A). We found one non-clinical study that reported that 23
Zhou e
t al. 2
020
18
sildenafil treatment improves cognition and memory of vascular dementia in aged rats 1
(43) (Figure 4C). As noted, we identified the potential of sildenafil against AD using the 2
AD endophenotype module (Figure 4B, Z = -2.44, P = 0.003). Then, clicking the 3
corresponding “MOA (mechanism-of-action)” button opened the inferred MOA network 4
for sildenafil and the data set (Figure 4D). Although sildenafil does not target the genes 5
in the data set (green) directly, it can potentially alter them through PPIs with its targets 6
(blue). 7
Pioglitazone has 8 known targets and is significantly proximal to 34 data sets 8
(Figure 4E). Five studies, containing both clinical and non-clinical data were found to be 9
related to treating AD with pioglitazone. For example, a clinical study showed that 10
pioglitazone can improve cognition in AD patients with type II diabetes (44) (Figure 4G). 11
Similarly, network results and associated MOA networks suggested that pioglitazone 12
can affect AD risk genes through PPIs (Figure 4F and Figure 4H). 13
14
Validation studies 15
Once candidate agents are identified on AlzGPS, a variety of validation steps can be 16
pursued (6). The agent can be tested in animal model systems of AD pathology to 17
evaluate the predicted MOA of behavioral and biological effects. Since these are 18
repurposed agents and have been used for other indications in human healthcare, 19
electronic medical records can be interrogated to determine if there are notable effects 20
on AD incidence, prevalence, or rate of progression. Both these methods are imperfect 21
since animal models have rarely been predictive of human response, and doses and 22
duration of exposures may be different for indications of other then AD in which the 23
Zhou e
t al. 2
020
19
candidate agents are used. The ultimate assessment that could make an agent 1
available for human care is success in a clinical trial and nominated agents must 2
eventually be submitted to trials. If repurposed agents are not entered into trials 3
because of intellectual property limitations or other challenges, the information from 4
AlzGPS may be useful in identifying druggable disease pathways or providing seed 5
structures that provide a basis for creation of related novel agents with similar MOAs. 6
7
Conclusions 8
AlzGPS contains rich and diverse information connecting genes, AD data sets, 9
and drugs for AD target identification and drug repurposing. It utilizes multiple biological 10
networks and omics data such as genomics, transcriptomics, and proteomics, and 11
provides network-based drug repurposing results with network visualizations. AlzGPS 12
will be a valuable resource to the AD research community. We will continue to add more 13
types of omics data and update AlzGPS annually or when a large amount of new data is 14
available. In summary, AlzGPS presents the first comprehensive in silico tool for human 15
genome-informed precision medicine drug discovery for AD. From a translational 16
perspective, if broadly applied, AlzGPS will offer a powerful tool for prioritizing 17
biologically relevant targets and clinically relevant repurposed drug candidates for multi-18
omics-informed therapeutic discovery in AD and other neurodegenerative diseases. 19
20
Declarations 21
Ethics approval and consent to participate 22
Not applicable 23
Zhou e
t al. 2
020

20
1
Consent for publication 2
Not applicable 3
4
Availability of data and materials 5
All the data in AlzGPS can be freely accessed without registration requirement at 6
https://alzgps.lerner.ccf.org. 7
8
Competing interests 9
Dr. Cummings has provided consultation to Acadia, Actinogen, Alkahest, Alzheon, 10
Annovis, Avanir, Axsome, Biogen, BioXcel, Cassava, Cerecin, Cerevel, Cortexyme, 11
Cytox, EIP Pharma, Eisai, Foresight, GemVax, Genentech, Green Valley, Grifols, 12
Karuna, Merck, Novo Nordisk, Otsuka, Resverlogix, Roche, Samumed, Samus, Signant 13
Health, Suven, Third Rock, and United Neuroscience pharmaceutical and assessment 14
companies.Dr. Cummings has stock options in ADAMAS, AnnovisBio, MedAvante, 15
BiOasis. Dr Cummings is supported by Keep Memory Alive (KMA); NIGMS grant 16
P20GM109025; NINDS grant U01NS093334; and NIA grant R01AG053798. 17
18
Funding: This work was supported by the National Institute of Aging (NIA) under Award 19
Number R01AG066707 and 3R01AG066707-01S1 to F.C. This work was supported in 20
part by the NIA under Award Number R56AG063870 (L.B.) and P20GM109025 (J.C.). 21
A.A.P., L.B., J.C., J.B.L., and F.C. are supported together by the Translational 22
Therapeutics Core of the Cleveland Alzheimer's Disease Research Center (NIH/NIA: 1 23
Zhou e
t al. 2
020

21
P30 AGO62428-01). A.A.P. is also supported by the Brockman Foundation, Project 1
19PABH134580006-AHA/Allen Initiative in Brain Health and Cognitive Impairment, the 2
Elizabeth Ring Mather & William Gwinn Mather Fund, S. Livingston Samuel Mather 3
Trust, G.R. Lincoln Family Foundation, Wick Foundation, Gordon & Evie Safran, the 4
Leonard Krieger Fund of the Cleveland Foundation, the Maxine and Lester Stoller 5
Parkinson’s Research Fund, and Louis Stokes VA Medical Center resources and 6
facilities. 7
8
Authors' contributions 9
F.C. conceived the study. Y.Z. constructed the database and developed the website. 10
J.F., Y.Z., and Y.H.K. performed data gathering and processing. L.B., A.A.P., J.B.L., 11
and J.C. discussed and interpreted all results. Y.Z. F.C., and J.C. wrote and all authors 12
critically revised the manuscript and gave final approval. 13
14
Acknowledgements 15
We thank the Lerner Research Institute Computing Services for hosting AlzGPS. 16
17
References 18
1. 2020 Alzheimer's disease facts and figures. Alzheimer's & Dementia. 19
2020;16(3):391-460. 20
2. Long JM, Holtzman DM. Alzheimer Disease: An update on pathobiology and 21
treatment strategies. Cell. 2019;179(2):312-39. 22
3. Masters CL, Bateman R, Blennow K, Rowe CC, Sperling RA, Cummings JL. 23
Alzheimer's disease. Nat Rev Dis Primers. 2015;1:15056. 24
Zhou e
t al. 2
020
22
4. Kodamullil AT, Zekri F, Sood M, Hengerer B, Canard L, McHale D, et al. Trial 1
watch: Tracing investment in drug development for Alzheimer disease. Nat Rev Drug 2
Discov. 2017;16(12):819. 3
5. Alteri E, Guizzaro L. Be open about drug failures to speed up research. Nature. 4
2018;563(7731):317-9. 5
6. Fang J, Pieper AA, Nussinov R, Lee G, Bekris L, Leverenz JB, et al. Harnessing 6
endophenotypes and network medicine for Alzheimer's drug repurposing. Med Res Rev. 7
Published online 2020 Jul 13. doi: 10.1002/med.21709. 8
7. Cummings J, Feldman HH, Scheltens P. The "rights" of precision drug 9
development for Alzheimer's disease. Alzheimers Res Ther. 2019;11(1):76. 10
8. Keren-Shaul H, Spinrad A, Weiner A, Matcovitch-Natan O, Dvir-Szternfeld R, 11
Ulland TK, et al. A unique microglia type associated with restricting development of 12
Alzheimer's disease. Cell. 2017;169(7):1276-90 e17. 13
9. Lambert JC, Ibrahim-Verbaas CA, Harold D, Naj AC, Sims R, Bellenguez C, et 14
al. Meta-analysis of 74,046 individuals identifies 11 new susceptibility loci for 15
Alzheimer's disease. Nat Genet. 2013;45(12):1452-8. 16
10. Bai B, Wang X, Li Y, Chen PC, Yu K, Dey KK, et al. Deep multilayer brain 17
proteomics identifies molecular networks in Alzheimer's disease progression. Neuron. 18
2020;105(6):975-91 e7. 19
11. Cheng F, Lu W, Liu C, Fang J, Hou Y, Handy DE, et al. A genome-wide 20
positioning systems network algorithm for in silico drug repurposing. Nat Commun. 21
2019;10(1):3476. 22
12. Cheng F, Desai RJ, Handy DE, Wang R, Schneeweiss S, Barabasi AL, et al. 23
Network-based approach to prediction and population-based validation of in silico drug 24
repurposing. Nat Commun. 2018;9(1):2691. 25
13. Wang Q, Chen R, Cheng F, Wei Q, Ji Y, Yang H, et al. A Bayesian framework 26
that integrates multi-omics data and gene networks predicts risk genes from 27
schizophrenia GWAS data. Nat Neurosci. 2019;22(5):691-9. 28
14. Fang J, Zhang P, Wang Q, Zhou Y, Chiang WC, Cheng R, et al. Network-based 29
translation of GWAS findings to pathobiology and drug repurposing for Alzheimer's 30
Zhou e
t al. 2
020

23
disease. medRxiv. Published online January 18, 2020. 1
https://doi.org/10.1101/2020.01.15.20017160 2
15. Zhou Y, Hou Y, Shen J, Huang Y, Martin W, Cheng F. Network-based drug 3
repurposing for novel coronavirus 2019-nCoV/SARS-CoV-2. Cell Discov. 2020;6:14. 4
16. Zhou Y, Wang F, Tang J, Nussinov R, Cheng F. Artificial intelligence in COVID-5
19 drug repurposing. The Lancet Digital Health. in press. doi: 6
https://doi.org/10.1016/S2589-7500(20)30192-8 7
17. Edgar R, Domrachev M, Lash AE. Gene Expression Omnibus: NCBI gene 8
expression and hybridization array data repository. Nucleic Acids Res. 2002;30(1):207-9
10. 10
18. Barrett T, Wilhite SE, Ledoux P, Evangelista C, Kim IF, Tomashevsky M, et al. 11
NCBI GEO: archive for functional genomics data sets--update. Nucleic Acids Res. 12
2013;41(Database issue):D991-5. 13
19. Ritchie ME, Phipson B, Wu D, Hu Y, Law CW, Shi W, et al. limma powers 14
differential expression analyses for RNA-sequencing and microarray studies. Nucleic 15
Acids Res. 2015;43(7):e47. 16
20. Braschi B, Denny P, Gray K, Jones T, Seal R, Tweedie S, et al. Genenames.org: 17
the HGNC and VGNC resources in 2019. Nucleic Acids Res. 2019;47(D1):D786-D92. 18
21. Buniello A, MacArthur JAL, Cerezo M, Harris LW, Hayhurst J, Malangone C, et 19
al. The NHGRI-EBI GWAS Catalog of published genome-wide association studies, 20
targeted arrays and summary statistics 2019. Nucleic Acids Res. 2019;47(D1):D1005-21
D12. 22
22. Law V, Knox C, Djoumbou Y, Jewison T, Guo AC, Liu Y, et al. DrugBank 4.0: 23
shedding new light on drug metabolism. Nucleic Acids Res. 2014;42(Database 24
issue):D1091-7. 25
23. Cheng F, Li W, Zhou Y, Shen J, Wu Z, Liu G, et al. admetSAR: a comprehensive 26
source and free tool for assessment of chemical ADMET properties. J Chem Inf Model. 27
2012;52(11):3099-105. 28 Zho
u et a
l. 202
0

24
24. Cheng F, Li W, Zhou Y, Shen J, Wu Z, Liu G, et al. Correction to "admetSAR: A 1
Comprehensive Source and Free Tool for Assessment of Chemical ADMET Properties". 2
J Chem Inf Model. 2019;59(11):4959. 3
25. Yang H, Qin C, Li YH, Tao L, Zhou J, Yu CY, et al. Therapeutic target database 4
update 2016: enriched resource for bench to clinical drug target and targeted pathway 5
information. Nucleic Acids Res. 2016;44(D1):D1069-74. 6
26. Gaulton A, Bellis LJ, Bento AP, Chambers J, Davies M, Hersey A, et al. 7
ChEMBL: a large-scale bioactivity database for drug discovery. Nucleic Acids Res. 8
2012;40(Database issue):D1100-D7. 9
27. Liu T, Lin Y, Wen X, Jorissen RN, Gilson MK. BindingDB: a web-accessible 10
database of experimentally determined protein-ligand binding affinities. Nucleic Acids 11
Res. 2007;35(Database issue):D198-D201. 12
28. Pawson AJ, Sharman JL, Benson HE, Faccenda E, Alexander SP, Buneman OP, 13
et al. The IUPHAR/BPS Guide to PHARMACOLOGY: an expert-driven knowledgebase 14
of drug targets and their ligands. Nucleic Acids Res. 2014;42(Database issue):D1098-15
D106. 16
29. Cummings J, Lee G, Ritter A, Zhong K. Alzheimer's disease drug development 17
pipeline: 2018. Alzheimers Dement (N Y). 2018;4:195-214. 18
30. Cummings J, Lee G, Ritter A, Sabbagh M, Zhong K. Alzheimer's disease drug 19
development pipeline: 2019. Alzheimers Dement (N Y). 2019;5:272-93. 20
31. Cheng F, Kovacs IA, Barabasi AL. Network-based prediction of drug 21
combinations. Nat Commun. 2019;10(1):1197. 22
32. Smith IN, Thacker S, Seyfi M, Cheng F, Eng C. Conformational dynamics and 23
allosteric regulation landscapes of germline PTEN mutations associated with autism 24
compared to those associated with cancer. Am J Hum Genet. 2019;104(5):861-78. 25
33. Hagberg AA, Schult DA, Swart PJ. Exploring network structure, dynamics, and 26
function using NetworkX. Proceedings of the 7th Python in Science Conference 27
(SciPy2008). 2008:11-5. 28
34. Franz M, Lopes CT, Huck G, Dong Y, Sumer O, Bader GD. Cytoscape.js: a 29
graph theory library for visualisation and analysis. Bioinformatics. 2016;32(2):309-11. 30
Zhou e
t al. 2
020

25
35. Kosik KS, Joachim CL, Selkoe DJ. Microtubule-associated protein tau (tau) is a 1
major antigenic component of paired helical filaments in Alzheimer disease. Proc Natl 2
Acad Sci U S A. 1986;83(11):4044-8. 3
36. Goedert M, Wischik CM, Crowther RA, Walker JE, Klug A. Cloning and 4
sequencing of the cDNA encoding a core protein of the paired helical filament of 5
Alzheimer disease: identification as the microtubule-associated protein tau. Proc Natl 6
Acad Sci U S A. 1988;85(11):4051-5. 7
37. Kovacs GG. Invited review: Neuropathology of tauopathies: principles and 8
practice. Neuropathol Appl Neurobiol. 2015;41(1):3-23. 9
38. Tan MS, Yu JT, Tan L. Bridging integrator 1 (BIN1): form, function, and 10
Alzheimer's disease. Trends Mol Med. 2013;19(10):594-603. 11
39. Chapuis J, Hansmannel F, Gistelinck M, Mounier A, Van Cauwenberghe C, 12
Kolen KV, et al. Increased expression of BIN1 mediates Alzheimer genetic risk by 13
modulating tau pathology. Mol Psychiatry. 2013;18(11):1225-34. 14
40. Karch CM, Jeng AT, Nowotny P, Cady J, Cruchaga C, Goate AM. Expression of 15
novel Alzheimer's disease risk genes in control and Alzheimer's disease brains. PLoS 16
One. 2012;7(11):e50976. 17
41. Liu CC, Kanekiyo T, Xu H, Bu G. Apolipoprotein E and Alzheimer disease: risk, 18
mechanisms and therapy. Nat Rev Neurol. 2013;9(2):106-18. 19
42. Cai H, Wang Y, McCarthy D, Wen H, Borchelt DR, Price DL, et al. BACE1 is the 20
major beta-secretase for generation of Abeta peptides by neurons. Nat Neurosci. 21
2001;4(3):233-4. 22
43. Venkat P, Chopp M, Zacharek A, Cui C, Landschoot-Ward J, Qian Y, et al. 23
Sildenafil treatment of vascular dementia in aged rats. Neurochem Int. 2019;127:103-24
12. 25
44. Sato T, Hanyu H, Hirao K, Kanetaka H, Sakurai H, Iwamoto T. Efficacy of PPAR-26
gamma agonist pioglitazone in mild Alzheimer disease. Neurobiol Aging. 27
2011;32(9):1626-33. 28
29
30
Zhou e
t al. 2
020
26
Figure Legends 1
Figure 1. The architecture of AlzGPS. 2
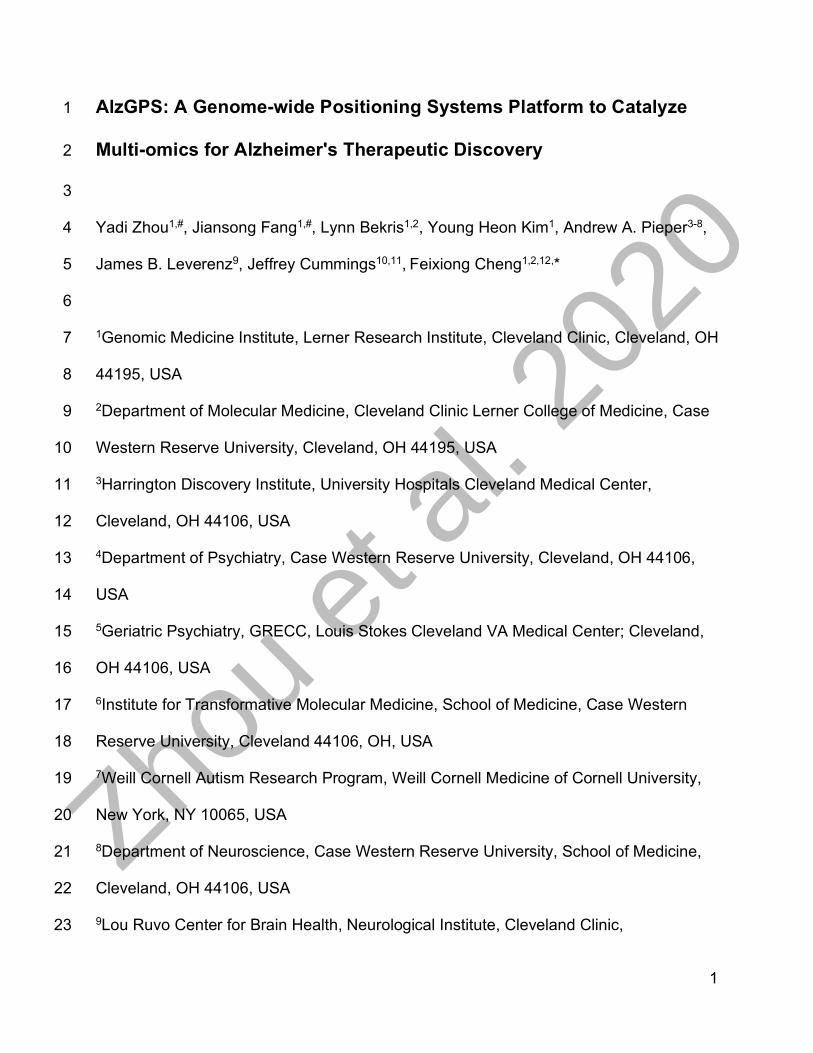
(A) AlzGPS is built on three main data entities (genes, drugs, and omics layers) and 3
their relationships. The multi-omics data (genomics, transcriptomics (bulk and single-4
cell/single-nucleus, and proteomics) in AlzGPS help identify likely causal genes/targets 5
that are associated with Alzheimer's disease (AD) and disease modules in the context 6
of human protein-protein interactome. Then, via network proximity measure between 7
drug-target networks and disease modules in the human interactome, drugs can be 8
prioritized for the potential to alter the genes in the module, for potential treatment of 9
AD. (B) Detailed statistics of the entities and relations in AlzGPS. EGO – brain-specific 10
neighborhood network (ego network); LCC – largest connected component network; 11
MOA – mechanism-of-action network. 12
13
Figure 2. Web interface overview. 14
(A) The home page provides access to searching, listing entries, and viewing brain-15
specific gene/target networks. User will be redirected to the interactive explorer (B), in 16
which all information are then dynamically loaded and added to the same web page. 17
Each data entity has its own basic information page under the “DATA TABLE” tab. 18
Additional information regarding the relations (e.g., proximity results) can be loaded by 19
clicking the corresponding button in the “DETAIL” section. (C) An example brain-specific 20
neighborhood network using APOE. (D) An example largest connected component 21
network using data set “V2”. 22
23
Zhou e
t al. 2
020

27
Figure 3. Case study – target identification. 1
Four genes, MAPT (A), BIN1 (B), APOE (C), and BACE1 (D) are used as examples to 2
show the gene page. On the gene page, we show a summary of several statistics of the 3
gene in AlzGPS, including the number of drugs that can target it, number of data sets of 4
omics in which the target/protein coding gene is differentially expressed, number of 5
genetic records, and the brain-expression specificity. Detailed information can be 6
loaded by clicking corresponding buttons. Examples of detailed differential expression 7
results and genetic records are shown for these four genes. In addition, a brain-specific 8
neighborhood network is available that centers around the gene-of-interest and show 9
the targetability of its neighborhood. 10
11
Figure 4. Case study – drug repurposing. 12
Sildenafil and pioglitazone are used as examples to demonstrate how to use AlzGPS for 13
drug repurposing. (A) Basic information for sildenafil. (B) Network proximity results for 14
sildenafil. (C) Literature evidence for sildenafil. (D) Inferred mechanism-of-action for 15
sildenafil targeting the “V1 AD-seed” data set, which contains 144 high-quality literature-16
based Alzheimer's disease (AD) endophenotype genes. (E) Basic information for 17
pioglitazone. (F) Network proximity results for pioglitazone. (G) Five studies were found 18
that were related to treating AD with pioglitazone. (H) Inferred mechanism-of-action for 19
pioglitazone targeting the “V4 AD-inferred-GWAS-risk-genes” data set which contains 20
103 high-confidence AD risk genes identified using genome-wide association studies. 21 Zhou e
t al. 2
020

Figure 1. The architecture of AlzGPS.
Human proteininteractome
Targetidentification
Disease moduleidentification
Drugrepurposing
312
A
B
GENE DRUG
DATA SET
Multi-omicsdata sets
Zhou e
t al. 2
020

Figure 2. Web interface overview.
Search forDrugs (by name or DrugBank ID)Genes (by Entrez ID or symbol)Metabolites (by name or PubChem/HMDB ID)Variants (by variant ID)
List entriesDrugs by first-level ATCAD data setsAD clinical trials (ongoing)
Net visualization
1
1
2
2 2 2
3
3
A
B
C D
Zhou e
t al. 2
020
Figure 3. Case study – target identification.
A B
C D
Zhou e
t al. 2
020
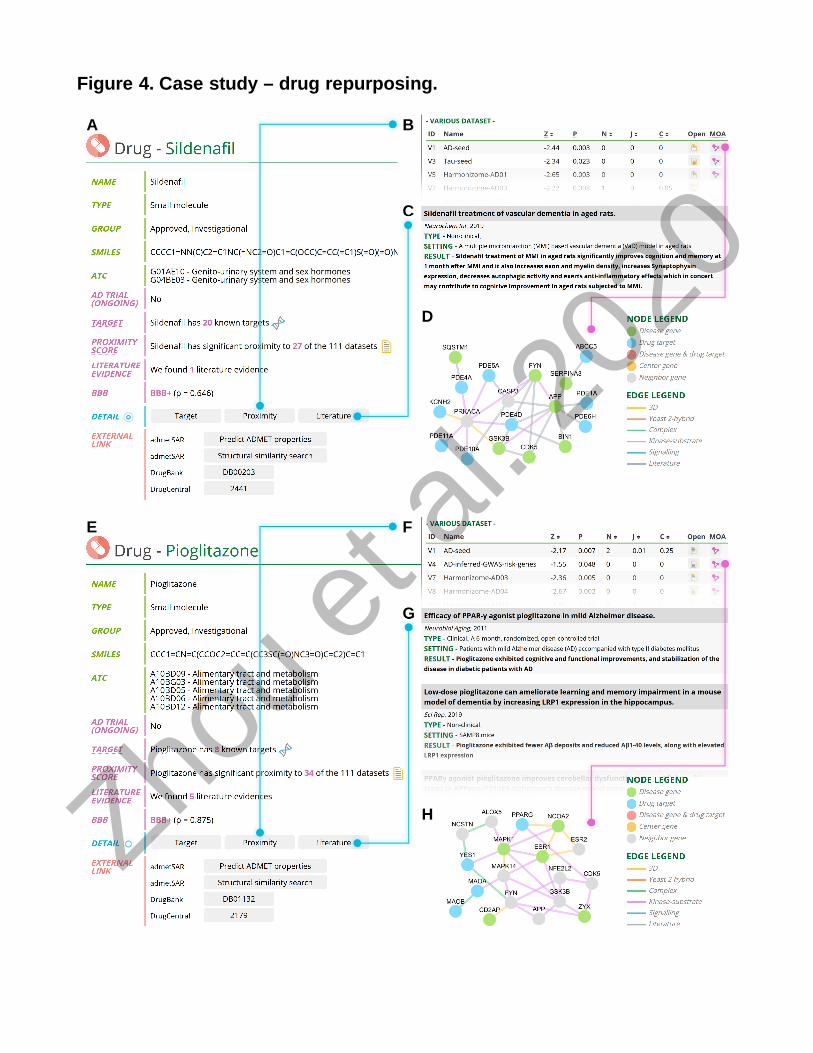
Figure 4. Case study – drug repurposing.
A B
C
D
E F
G
HZhou e
t al. 2
020
1
Table S1. All data sets in AlzGPS. Dataset ID: E1 Taxon: Human Omic: Transcriptome Method: Microarray Region: Brain Group (sample): 30 EAD vs. 173 controls Criteria: FDR < 0.01, |FC| > 1.2 GEO: GSE48350 PMID: 23273601 Note: EAD, Braak III or IV Source: GEO2R Dataset ID: E2 Taxon: Human Omic: Transcriptome Method: Microarray Region: Brain Group (sample): 180 EAD vs. 214 controls Criteria: FDR < 0.01, |FC| > 1.2 GEO: GSE84422 PMID: 27799057 Note: EAD, Probable AD (Braak III or IV) Source: GEO2R Dataset ID: E3 Taxon: Human Omic: Transcriptome Method: Microarray Region: Brain Group (sample): 180 EAD vs. 214 controls Criteria: FDR < 0.01, |FC| > 1.2 GEO: GSE84422 PMID: 27799057 Note: EAD, Probable AD (Braak III or IV) Source: GEO2R Dataset ID: E4 Taxon: Human Omic: Transcriptome Method: Microarray Region: Brain Group (sample): 6 EAD vs. 8 controls Criteria: p<0.01 (Paper) GEO: GSE12685
Zhou e
t al. 2
020

2
PMID: 19295912 Note: controls (MMSE 30-25) and "Incipient AD" (MMSE 21-26, with MCI 24-26 and mild AD 21-23) Source: Table S2 Dataset ID: E5 Taxon: Human Omic: Transcriptome Method: Microarray Region: Hippocampus Group (sample): 31 LAD vs. 32 controls Criteria: FDR < 0.01, |FC| > 1.2 GEO: GSE29378 PMID: 23705665 Note: LAD, Braak V or VI Source: GEO2R Dataset ID: E6 Taxon: Human Omic: Transcriptome Method: Microarray Region: Brain Group (sample): 42 LAD vs. 173 controls Criteria: FDR < 0.01, |FC| > 1.2 GEO: GSE48350 PMID: 23273601 Note: LAD, Braak V or VI Source: GEO2R Dataset ID: E7 Taxon: Human Omic: Transcriptome Method: Microarray Region: Brain Group (sample): 328 LAD vs. 214 controls Criteria: FDR < 0.01, |FC| > 1.2 GEO: GSE84422 PMID: 27799057 Note: LAD, Definite AD (Braak V or VI) Source: GEO2R Dataset ID: E8 Taxon: Human Omic: Transcriptome Method: Microarray Region: Brain
Zhou e
t al. 2
020

3
Group (sample): 328 LAD vs. 214 controls Criteria: FDR < 0.01, |FC| > 1.2 GEO: GSE84422 PMID: 27799057 Note: LAD, Definite AD (Braak V or VI) Source: GEO2R Dataset ID: E9 Taxon: Human Omic: Transcriptome Method: Bulk RNA-seq Region: Hippocampus Group (sample): 4 LAD vs. 4 controls Criteria: PFP<0.1 (Paper) GEO: GSE67333 PMID: 26402107 Note: LAD, Braak V or VI Source: File S2 Dataset ID: E10 Taxon: Human Omic: Transcriptome Method: Bulk RNA-seq Region: Hippocampus Group (sample): 6 LAD vs. 6 controls Criteria: |log2(FC)|> 1 and corrected P value < 0.05 (Paper) PMID: 29523845 Note: LAD, Braak V or VI Source: Table S2 Dataset ID: E11 Taxon: Human Omic: Transcriptome Method: Bulk RNA-seq Region: Hippocampus Group (sample): 20 LAD vs. 10 controls Criteria: DE score >0.1 PMID: 30497016 Note: LAD, Braak V or VI Source: Table S1 Dataset ID: E12 Taxon: Human Omic: Transcriptome Method: Single Cell Region: Brain
Zhou e
t al. 2
020

4
Cell type: Excitatory neurons (Ex) Group (sample): 24 AD vs. 24 controls Criteria: FDR < 0.01, |FC| > 1.2, Poisson mixed-model FDR < 0.05 PMID: 31042697 Note: A spectrum of mild to severe Aβ and other pathologies (AD-pathology) Source: Table S2 Dataset ID: E13 Taxon: Human Omic: Transcriptome Method: Single Cell Region: Brain Cell type: Inhibitory neurons (In) Group (sample): 24 AD vs. 24 controls Criteria: FDR < 0.01, |FC| > 1.2, Poisson mixed-model FDR < 0.05 PMID: 31042697 Note: A spectrum of mild to severe Aβ and other pathologies (AD-pathology) Source: Table S2 Dataset ID: E14 Taxon: Human Omic: Transcriptome Method: Single Cell Region: Brain Cell type: Astrocytes (Ast) Group (sample): 24 AD vs. 24 controls Criteria: FDR < 0.01, |FC| > 1.2, Poisson mixed-model FDR < 0.05 PMID: 31042697 Note: A spectrum of mild to severe Aβ and other pathologies (AD-pathology) Source: Table S2 Dataset ID: E15 Taxon: Human Omic: Transcriptome Method: Single Cell Region: Brain Cell type: Oligodendrocytes (Oli) Group (sample): 24 AD vs. 24 controls Criteria: FDR < 0.01, |FC| > 1.2, Poisson mixed-model FDR < 0.05 PMID: 31042697 Note: A spectrum of mild to severe Aβ and other pathologies (AD-pathology) Source: Table S2 Dataset ID: E16 Taxon: Human Omic: Transcriptome
Zhou e
t al. 2
020

5
Method: Single Cell Region: Brain Cell type: Microglia (Mic) Group (sample): 24 AD vs. 24 controls Criteria: FDR < 0.01, |FC| > 1.2, Poisson mixed-model FDR < 0.05 PMID: 31042697 Note: A spectrum of mild to severe Aβ and other pathologies (AD-pathology) Source: Table S2 Dataset ID: E17 Taxon: Human Omic: Transcriptome Method: Single Cell Region: Brain Cell type: Oligodendrocyte precursor cells (OPC) Group (sample): 24 AD vs. 24 controls Criteria: FDR < 0.01, |FC| > 1.2, Poisson mixed-model FDR < 0.05 PMID: 31042697 Note: A spectrum of mild to severe Aβ and other pathologies (AD-pathology) Source: Table S2 Dataset ID: E18 Taxon: Human Omic: Transcriptome Method: Single Cell Region: Brain Cell type: Excitatory neurons (Ex) Group (sample): EAD vs. controls Criteria: FDR < 0.01, |FC| > 1.2, Poisson mixed-model FDR < 0.05 PMID: 31042697 Note: EAD, amyloid burden, but modest neurofibrillary tangles and cognitive impairment Source: Table S2 Dataset ID: E19 Taxon: Human Omic: Transcriptome Method: Single Cell Region: Brain Cell type: Inhibitory neurons (In) Group (sample): EAD vs. controls Criteria: FDR < 0.01, |FC| > 1.2, Poisson mixed-model FDR < 0.05 PMID: 31042697 Note: EAD, amyloid burden, but modest neurofibrillary tangles and cognitive impairment Source: Table S2 Dataset ID: E20
Zhou e
t al. 2
020

6
Taxon: Human Omic: Transcriptome Method: Single Cell Region: Brain Cell type: Astrocytes (Ast) Group (sample): EAD vs. controls Criteria: FDR < 0.01, |FC| > 1.2, Poisson mixed-model FDR < 0.05 PMID: 31042697 Note: EAD, amyloid burden, but modest neurofibrillary tangles and cognitive impairment Source: Table S2 Dataset ID: E21 Taxon: Human Omic: Transcriptome Method: Single Cell Region: Brain Cell type: Oligodendrocytes (Oli) Group (sample): EAD vs. controls Criteria: FDR < 0.01, |FC| > 1.2, Poisson mixed-model FDR < 0.05 PMID: 31042697 Note: EAD, amyloid burden, but modest neurofibrillary tangles and cognitive impairment Source: Table S2 Dataset ID: E22 Taxon: Human Omic: Transcriptome Method: Single Cell Region: Brain Cell type: Microglia (Mic) Group (sample): EAD vs. controls Criteria: FDR < 0.01, |FC| > 1.2, Poisson mixed-model FDR < 0.05 PMID: 31042697 Note: EAD, amyloid burden, but modest neurofibrillary tangles and cognitive impairment Source: Table S2 Dataset ID: E23 Taxon: Human Omic: Transcriptome Method: Single Cell Region: Brain Cell type: Oligodendrocyte precursor cells (OPC) Group (sample): EAD vs. controls Criteria: FDR < 0.01, |FC| > 1.2, Poisson mixed-model FDR < 0.05 PMID: 31042697 Note: EAD, amyloid burden, but modest neurofibrillary tangles and cognitive impairment Source: Table S2
Zhou e
t al. 2
020

7
Dataset ID: E24 Taxon: Human Omic: Transcriptome Method: Single Cell Region: Brain Cell type: Excitatory neurons (Ex) Group (sample): LAD vs. EAD Criteria: FDR < 0.01, |FC| > 1.2, Poisson mixed-model FDR < 0.05 PMID: 31042697 Note: LAD, higher amyloid, and also elevated neurofibrillary tangles, global pathology, and cognitive impairment Source: Table S2 Dataset ID: E25 Taxon: Human Omic: Transcriptome Method: Single Cell Region: Brain Cell type: Inhibitory neurons (In) Group (sample): LAD vs. EAD Criteria: FDR < 0.01, |FC| > 1.2, Poisson mixed-model FDR < 0.05 PMID: 31042697 Note: LAD, higher amyloid, and also elevated neurofibrillary tangles, global pathology, and cognitive impairment Source: Table S2 Dataset ID: E26 Taxon: Human Omic: Transcriptome Method: Single Cell Region: Brain Cell type: Astrocytes (Ast) Group (sample): LAD vs. EAD Criteria: FDR < 0.01, |FC| > 1.2, Poisson mixed-model FDR < 0.05 PMID: 31042697 Note: LAD, higher amyloid, and also elevated neurofibrillary tangles, global pathology, and cognitive impairment Source: Table S2 Dataset ID: E27 Taxon: Human Omic: Transcriptome Method: Single Cell Region: Brain Cell type: Oligodendrocytes (Oli)
Zhou e
t al. 2
020
8
Group (sample): LAD vs. EAD Criteria: FDR < 0.01, |FC| > 1.2, Poisson mixed-model FDR < 0.05 PMID: 31042697 Note: LAD, higher amyloid, and also elevated neurofibrillary tangles, global pathology, and cognitive impairment Source: Table S2 Dataset ID: E28 Taxon: Human Omic: Transcriptome Method: Single Cell Region: Brain Cell type: Microglia (Mic) Group (sample): LAD vs. EAD Criteria: FDR < 0.01, |FC| > 1.2, Poisson mixed-model FDR < 0.05 PMID: 31042697 Note: LAD, higher amyloid, and also elevated neurofibrillary tangles, global pathology, and cognitive impairment Source: Table S2 Dataset ID: E29 Taxon: Human Omic: Transcriptome Method: Single Cell Region: Brain Cell type: Oligodendrocyte precursor cells (OPC) Group (sample): LAD vs. EAD Criteria: FDR < 0.01, |FC| > 1.2, Poisson mixed-model FDR < 0.05 PMID: 31042697 Note: LAD, higher amyloid, and also elevated neurofibrillary tangles, global pathology, and cognitive impairment Source: Table S2 Dataset ID: E30 Taxon: Human Omic: Transcriptome Method: Microarray Region: Human fibroblasts cell Cell type: Neural progenitor cells Group (sample): 5 sporadic AD vs. 5 controls Criteria: FDR < 0.05, |FC| > 1.5 GEO: GSE117589 PMID: 30699343 Note: Sporadic AD Source: Table S3
Zhou e
t al. 2
020
9
Dataset ID: E31 Taxon: Human Omic: Transcriptome Method: Microarray Region: Human fibroblasts cell Cell type: Neural cells Group (sample): 6 sporadic AD vs. 5 controls Criteria: FDR < 0.05, |FC| > 1.5 GEO: GSE117589 PMID: 30699343 Note: Sporadic AD Source: Table S4 Dataset ID: E32 Taxon: Mouse Omic: Transcriptome Method: Microarray Genetic BG: C57Bl/6J Model: HO-TASTPM Age: 4 months Region: Hippocampus Group (sample): 4 AD mice vs. 9 controls Criteria: FDR < 0.05, |FC| > 1.5 GEO: GSE64398 PMID: 25620700 Note: Mouse genes converted to human orthologs Source: GEO2R Dataset ID: E33 Taxon: Mouse Omic: Transcriptome Method: Microarray Genetic BG: C57Bl/6J Model: HO-TASTPM Age: 8 months Region: Hippocampus Group (sample): 4 AD mice vs. 9 controls Criteria: FDR < 0.05, |FC| > 1.5 GEO: GSE64398 PMID: 25620700 Note: Mouse genes converted to human orthologs Source: GEO2R Dataset ID: E34 Taxon: Mouse Omic: Transcriptome
Zhou e
t al. 2
020
10
Method: Microarray Genetic BG: C57Bl/6J Model: HO-TASTPM Age: 18 months Region: Hippocampus Group (sample): 4 AD mice vs. 9 controls Criteria: FDR < 0.05, |FC| > 1.5 GEO: GSE64398 PMID: 25620700 Note: Mouse genes converted to human orthologs Source: GEO2R Dataset ID: E35 Taxon: Mouse Omic: Transcriptome Method: Microarray Genetic BG: C57Bl/6J Model: HO-TASTPM Age: 4 months Region: Frontal cortex Group (sample): 4 AD mice vs. 9 controls Criteria: FDR < 0.05, |FC| > 1.5 GEO: GSE64398 PMID: 25620700 Note: Mouse genes converted to human orthologs Source: GEO2R Dataset ID: E36 Taxon: Mouse Omic: Transcriptome Method: Microarray Genetic BG: C57Bl/6J Model: HO-TASTPM Age: 8 months Region: Frontal cortex Group (sample): 4 AD mice vs. 9 controls Criteria: FDR < 0.05, |FC| > 1.5 GEO: GSE64398 PMID: 25620700 Note: Mouse genes converted to human orthologs Source: GEO2R Dataset ID: E37 Taxon: Mouse Omic: Transcriptome Method: Microarray
Zhou e
t al. 2
020

11
Genetic BG: C57Bl/6J Model: HO-TASTPM Age: 18 months Region: Frontal cortex Group (sample): 3 AD mice vs. 7 controls Criteria: FDR < 0.05, |FC| > 1.5 GEO: GSE64398 PMID: 25620700 Note: Mouse genes converted to human orthologs Source: GEO2R Dataset ID: E38 Taxon: Mouse Omic: Transcriptome Method: Microarray Genetic BG: C57Bl/6J Model: APP/PS1 Age: 8 months Region: Brain Cell type: Microglia (Mic) Group (sample): 5 AD mice vs. 5 controls Criteria: FDR < 0.05, |FC| > 1.5 GEO: GSE65067 PMID: 25728668 Note: Mouse genes converted to human orthologs Source: GEO2R Dataset ID: E39 Taxon: Mouse Omic: Transcriptome Method: Microarray Genetic BG: C57Bl/6J Model: APP/PS1 Age: 5 months Region: Frontal cortex Group (sample): 9 AD mice vs. 12 controls Criteria: FDR < 0.05, |FC| > 1.5 GEO: GSE74438 Note: Mouse genes converted to human orthologs Source: GEO2R Dataset ID: E40 Taxon: Mouse Omic: Transcriptome Method: Microarray Genetic BG: C57Bl/6J
Zhou e
t al. 2
020
12
Model: APP/PS1 Age: 5 months Region: Hippocampus Group (sample): 9 AD mice vs. 12 controls Criteria: FDR < 0.05, |FC| > 1.5 GEO: GSE74438 Note: Mouse genes converted to human orthologs Source: GEO2R Dataset ID: E41 Taxon: Mouse Omic: Transcriptome Method: Microarray Genetic BG: C57Bl/6J Model: APP/PS1 Age: 5 months Region: Hippocampus Group (sample): 8 AD mice vs. 11 controls Criteria: FDR < 0.05, |FC| > 1.5 GEO: GSE74437 Note: Mouse genes converted to human orthologs Source: GEO2R Dataset ID: E42 Taxon: Mouse Omic: Transcriptome Method: Microarray Genetic BG: C57Bl/6J Model: APP/PS1 Age: 5 months Region: Frontal cortex Group (sample): 8 AD mice vs. 11 controls Criteria: FDR < 0.05, |FC| > 1.5 GEO: GSE74437 Note: Mouse genes converted to human orthologs Source: GEO2R Dataset ID: E43 Taxon: Mouse Omic: Transcriptome Method: Microarray Genetic BG: A cross between C57BL/6J and C3H/HeJ Model: APP/PS1 Age: 15-18 months Region: Brain Cell type: Microglia (Mic)
Zhou e
t al. 2
020

13
Group (sample): 7 AD mice vs. 7 controls Criteria: FDR < 0.05, |FC| > 1.5 GEO: GSE74615 PMID: 25002035 Note: Mouse genes converted to human orthologs Source: GEO2R Dataset ID: E44 Taxon: Mouse Omic: Transcriptome Method: Microarray Genetic BG: A cross between FVB/N(TRE-Tau) and 129S6(CaMKIIα-tTA) Model: rTg4510 Age: 4 months Region: Hippocampus Group (sample): 4 AD mice vs. 4 controls Criteria: FDR < 0.05, |FC| > 1.5 GEO: GSE53480 PMID: 25069841 Note: Mouse genes converted to human orthologs Source: GEO2R Dataset ID: E45 Taxon: Mouse Omic: Transcriptome Method: Microarray Genetic BG: A cross between FVB/N(TRE-Tau) and 129S6(CaMKIIα-tTA) Model: rTg4510 Age: 4-6 months Region: Hippocampus Group (sample): 16 AD mice vs. 20 controls Criteria: FDR < 0.05, |FC| > 1.5 GEO: GSE56772 Note: Mouse genes converted to human orthologs Source: GEO2R Dataset ID: E46 Taxon: Mouse Omic: Transcriptome Method: Microarray Genetic BG: A cross between FVB/N(TRE-Tau) and 129S6(CaMKIIα-tTA) Model: rTg4510 Age: 6 months Region: Hippocampus Group (sample): 17 AD mice vs. 17 controls Criteria: FDR < 0.05, |FC| > 1.5
Zhou e
t al. 2
020

14
GEO: GSE57583 Note: Mouse genes converted to human orthologs Source: GEO2R Dataset ID: E47 Taxon: Mouse Omic: Transcriptome Method: Microarray Genetic BG: C57Bl/6J Model: Tau P301L Age: 18 months Region: Hippocampus Group (sample): 3 AD mice vs. 7 controls Criteria: FDR < 0.05, |FC| > 1.5 GEO: GSE64398 PMID: 25620700 Note: Mouse genes converted to human orthologs Source: GEO2R Dataset ID: E48 Taxon: Mouse Omic: Transcriptome Method: Microarray Genetic BG: C57Bl/6J Model: Tau P301L Age: 18 months Region: Frontal cortex Group (sample): 3 AD mice vs. 7 controls Criteria: FDR < 0.05, |FC| > 1.5 GEO: GSE64398 PMID: 25620700 Note: Mouse genes converted to human orthologs Source: GEO2R Dataset ID: E49 Taxon: Mouse Omic: Transcriptome Method: Microarray Genetic BG: C57Bl/6J Model: Tau P301L Age: 18 months Region: Cerebellum Group (sample): 3 AD mice vs. 7 controls Criteria: FDR < 0.05, |FC| > 1.5 GEO: GSE64398 PMID: 25620700
Zhou e
t al. 2
020

15
Note: Mouse genes converted to human orthologs Source: GEO2R Dataset ID: E50 Taxon: Mouse Omic: Transcriptome Method: Bulk RNA-seq Genetic BG: A cross between C57BL/6J females (B6) and C3H/HeJ males (C3) Model: TgCRND8 Age: 1.5 months Region: Cortex Group (sample): 4 AD mice vs. 6 controls Criteria: T-test, P < 0.01 PMID: 30189875 Note: Mouse genes converted to human orthologs Source: Table S1 Dataset ID: E51 Taxon: Mouse Omic: Transcriptome Method: Bulk RNA-seq Genetic BG: A cross between C57BL/6J females (B6) and C3H/HeJ males (C3) Model: TgCRND8 Age: 3 months Region: Cortex Group (sample): 6 AD mice vs. 6 controls Criteria: T-test, P < 0.01 PMID: 30189875 Note: Mouse genes converted to human orthologs Source: Table S1 Dataset ID: E52 Taxon: Mouse Omic: Transcriptome Method: Bulk RNA-seq Genetic BG: A cross between C57BL/6J females (B6) and C3H/HeJ males (C3) Model: TgCRND8 Age: 4.5 months Region: Cortex Group (sample): 3 AD mice vs. 4 controls Criteria: T-test, P < 0.01 PMID: 30189875 Note: Mouse genes converted to human orthologs Source: Table S1 Dataset ID: E53
Zhou e
t al. 2
020

16
Taxon: Mouse Omic: Transcriptome Method: Bulk RNA-seq Genetic BG: A cross between C57BL/6Boy mice to SJL/J mice Model: Tg2576 Age: 3 months Region: Cortex Group (sample): 4 AD mice vs. 4 controls Criteria: T-test, P < 0.01 PMID: 30189875 Note: Mouse genes converted to human orthologs Source: Table S1 Dataset ID: E54 Taxon: Mouse Omic: Transcriptome Method: Bulk RNA-seq Genetic BG: C57Bl/6J Model: 5XFAD Age: 3-6 months Region: Brain Group (sample): Young WT vs. young 5XFAD Criteria: FDR < 0.05, |FC| > 1.5 PMID: 24795628 Note: Mouse genes converted to human orthologs Source: Table 2 Dataset ID: E55 Taxon: Mouse Omic: Transcriptome Method: Bulk RNA-seq Genetic BG: C57Bl/6J Model: APP_PS1KI Age: 6 months Region: Brain Group (sample): 5 AD mice vs. 5 controls Criteria: FDR < 0.05 PMID: 26639971 Note: Mouse genes converted to human orthologs Source: Table S2 Dataset ID: E56 Taxon: Mouse Omic: Transcriptome Method: Bulk RNA-seq Genetic BG: A cross between C57BL/6J females (B6) and C3H/HeJ males (C3)
Zhou e
t al. 2
020

17
Model: TgCRND8 Age: 6 months Region: Cortex Group (sample): 5 AD mice vs. 5 controls Criteria: T-test, P < 0.01 PMID: 30189875 Note: Mouse genes converted to human orthologs Source: Table S1 Dataset ID: E57 Taxon: Mouse Omic: Transcriptome Method: Bulk RNA-seq Genetic BG: A cross between C57BL/6Boy mice to SJL/J mice Model: Tg2576 Age: 6 months Region: Cortex Group (sample): 4 AD mice vs. 4 controls Criteria: T-test, P < 0.01 PMID: 30189875 Note: Mouse genes converted to human orthologs Source: Table S1 Dataset ID: E58 Taxon: Mouse Omic: Transcriptome Method: Bulk RNA-seq Genetic BG: C57Bl/6J Model: APP/PSEN1 Age: 8 months Region: Prefrontal cortex Group (sample): 4 AD mice vs. 4 controls Criteria: FDR < 0.05, |FC| > 1.2 PMID: 30283032 Note: Mouse genes converted to human orthologs Source: Table S1 Dataset ID: E59 Taxon: Mouse Omic: Transcriptome Method: Bulk RNA-seq Genetic BG: C57Bl/6J Model: 5xFAD Age: 6 months Region: Brain Cell type: Microglia (Mic)
Zhou e
t al. 2
020

18
Group (sample): Amyloid plaque-containing (XO4+) vs non-containing (XO4-) microglia Criteria: FDR < 0.05, |FC| > 1.2 Note: Mouse genes converted to human orthologs Source: doi.org/10.1101/639054 Dataset ID: E60 Taxon: Mouse Omic: Transcriptome Method: Bulk RNA-seq Genetic BG: A cross between C57BL/6Boy mice to SJL/J mice Model: Tg2576 Age: 9 months Region: Cortex Group (sample): 4 AD mice vs. 4 controls Criteria: T-test, P < 0.01 PMID: 30189875 Note: Mouse genes converted to human orthologs Source: Table S1 Dataset ID: E61 Taxon: Mouse Omic: Transcriptome Method: Bulk RNA-seq Genetic BG: A cross between C57BL/6J females (B6) and C3H/HeJ males (C3) Model: TgCRND8 Age: 10 months Region: Cortex Group (sample): 7 AD mice vs. 6 controls Criteria: T-test, P < 0.01 PMID: 30189875 Note: Mouse genes converted to human orthologs Source: Table S1 Dataset ID: E62 Taxon: Mouse Omic: Transcriptome Method: Bulk RNA-seq Genetic BG: A cross between C57BL/6Boy mice to SJL/J mice Model: Tg2576 Age: 12 months Region: Cortex Group (sample): 4 AD mice vs. 4 controls Criteria: T-test, P < 0.01 PMID: 30189875 Note: Mouse genes converted to human orthologs Source: Table S1
Zhou e
t al. 2
020

19
Dataset ID: E63 Taxon: Mouse Omic: Transcriptome Method: Bulk RNA-seq Genetic BG: A cross between C57BL/6Boy mice to SJL/J mice Model: Tg2576 Age: 15 months Region: Cortex Group (sample): 4 AD mice vs. 4 controls Criteria: T-test, P < 0.01 PMID: 30189875 Note: Mouse genes converted to human orthologs Source: Table S1 Dataset ID: E64 Taxon: Mouse Omic: Transcriptome Method: Bulk RNA-seq Genetic BG: C57Bl/6J Model: 5XFAD Age: 12 months Region: Brain Group (sample): Aged WT vs. aged 5XFAD Criteria: FDR < 0.05, |FC| > 1.5 PMID: 24795628 Note: Mouse genes converted to human orthologs Source: Table 5 Dataset ID: E65 Taxon: Mouse Omic: Transcriptome Method: Bulk RNA-seq Genetic BG: C57Bl/6J Model: Tg4_42 Age: 12 months Region: Brain Group (sample): Aged WT vs. aged Tg4–42 Criteria: FDR < 0.05, |FC| > 1.5 PMID: 24795628 Note: Mouse genes converted to human orthologs Source: Table 3 Dataset ID: E66 Taxon: Mouse Omic: Transcriptome
Zhou e
t al. 2
020

20
Method: Bulk RNA-seq Genetic BG: A cross between FVB/N(TRE-Tau) and 129S6(CaMKIIα-tTA) Model: rTg4510 Age: 2 months Region: Brain Cell type: Microglia (Mic) Group (sample): 4 AD mice vs. 4 controls Criteria: FDR<0.05 and |FC|>1.5 GEO: GSE123467 PMID: 30558641 Note: Mouse genes converted to human orthologs Source: Table S1 Dataset ID: E67 Taxon: Mouse Omic: Transcriptome Method: Bulk RNA-seq Genetic BG: A cross between FVB/N(TRE-Tau) and 129S6(CaMKIIα-tTA) Model: rTg4510 Age: 4 months Region: Brain Cell type: Microglia (Mic) Group (sample): 3 AD mice vs. 3 controls Criteria: FDR<0.05 and |FC|>1.5 GEO: GSE123467 PMID: 30558641 Note: Mouse genes converted to human orthologs Source: Table S1 Dataset ID: E68 Taxon: Mouse Omic: Transcriptome Method: Bulk RNA-seq Genetic BG: A cross between FVB/N(TRE-Tau) and 129S6(CaMKIIα-tTA) Model: rTg4510 Age: 6 months Region: Brain Cell type: Microglia (Mic) Group (sample): 4 AD mice vs. 4 controls Criteria: FDR<0.05 and |FC|>1.5 GEO: GSE123467 PMID: 30558641 Note: Mouse genes converted to human orthologs Source: Table S1 Dataset ID: E69
Zhou e
t al. 2
020

21
Taxon: Mouse Omic: Transcriptome Method: Bulk RNA-seq Genetic BG: A cross between FVB/N(TRE-Tau) and 129S6(CaMKIIα-tTA) Model: rTg4510 Age: 8 months Region: Brain Cell type: Microglia (Mic) Group (sample): 3 AD mice vs. 3 controls Criteria: FDR<0.05 and |FC|>1.5 GEO: GSE123467 PMID: 30558641 Note: Mouse genes converted to human orthologs Source: Table S1 Dataset ID: E70 Taxon: Mouse Omic: Proteome Method: 10-plex tandem mass tag Genetic BG: Crossing the 5XFAD strain with JNPL3 tau animals Model: ADLPAPT Age: 4 months Region: Hippocampus Group (sample): 3 AD mice vs. 3 controls Criteria: p-value<0.05 for the Student’s t-test; FDR<0.05 for the ANOVA test. PMID: 29338754 Note: Mouse genes converted to human orthologs. Differentially expressed proteins represented by genes Source: Table S3 Dataset ID: E71 Taxon: Mouse Omic: Proteome Method: 10-plex tandem mass tag Genetic BG: Crossing the 5XFAD strain with JNPL3 tau animals Model: ADLPAPT Age: 7 months Region: Hippocampus Group (sample): 3 AD mice vs. 3 controls Criteria: p-value<0.05 for the Student’s t-test; FDR<0.05 for the ANOVA test. PMID: 29338754 Note: Mouse genes converted to human orthologs. Differentially expressed proteins represented by genes Source: Table S3 Dataset ID: E72
Zhou e
t al. 2
020

22
Taxon: Mouse Omic: Proteome Method: 10-plex tandem mass tag Genetic BG: Crossing the 5XFAD strain with JNPL3 tau animals Model: ADLPAPT Age: 10 months Region: Hippocampus Group (sample): 3 AD mice vs. 3 controls Criteria: p-value<0.05 for the Student’s t-test; FDR<0.05 for the ANOVA test. PMID: 29338754 Note: Mouse genes converted to human orthologs. Differentially expressed proteins represented by genes Source: Table S3 Dataset ID: E73 Taxon: Mouse Omic: Proteome Method: 10-plex tandem mass tag Genetic BG: C57BL6 Model: 5XFAD Age: 4 months Region: Hippocampus Group (sample): 3 AD mice vs. 3 controls Criteria: p-value<0.05 for the Student’s t-test; FDR<0.05 for the ANOVA test. PMID: 29338754 Note: Mouse genes converted to human orthologs. Differentially expressed proteins represented by genes Source: Table S3 Dataset ID: E74 Taxon: Mouse Omic: Proteome Method: 10-plex tandem mass tag Genetic BG: C57BL6 Model: 5XFAD Age: 7 months Region: Hippocampus Group (sample): 3 AD mice vs. 3 controls Criteria: p-value<0.05 for the Student’s t-test; FDR<0.05 for the ANOVA test. PMID: 29338754 Note: Mouse genes converted to human orthologs. Differentially expressed proteins represented by genes Source: Table S3 Dataset ID: E75 Taxon: Mouse
Zhou e
t al. 2
020

23
Omic: Proteome Method: 10-plex tandem mass tag Genetic BG: C57BL6 Model: 5XFAD Age: 10 months Region: Hippocampus Group (sample): 3 AD mice vs. 3 controls Criteria: p-value<0.05 for the Student’s t-test; FDR<0.05 for the ANOVA test. PMID: 29338754 Note: Mouse genes converted to human orthologs. Differentially expressed proteins represented by genes Source: Table S3 Dataset ID: E76 Taxon: Mouse Omic: Proteome Method: Tandem mass spectrometry Genetic BG: C57BL6 Model: 5XFAD Age: 3 months Region: Brain Group (sample): 5XFAD_3M vs controls_3M Criteria: FDR < 0.05 PMID: 29186695 Note: Mouse genes converted to human orthologs. Differentially expressed proteins represented by genes Source: Integrated DEPs from 5XFAD-3M-Hip, 5XFAD-3M-Cere, and 5XFAD-3M-FC. (Table S2) Dataset ID: E77 Taxon: Mouse Omic: Proteome Method: Tandem mass spectrometry Genetic BG: C57BL6 Model: 5XFAD Age: 12 months Region: Brain Group (sample): 5XFAD_12M vs controls_12M Criteria: FDR < 0.05 PMID: 29186695 Note: Mouse genes converted to human orthologs. Differentially expressed proteins represented by genes Source: Integrated DEPs from 5XFAD-12M-Hip, 5XFAD-12M-Cere, and 5XFAD-12M-FC. (Table S2) Dataset ID: E78
Zhou e
t al. 2
020

24
Taxon: Mouse Omic: Proteome Method: Tandem mass spectrometry Genetic BG: C57BL6 Model: hAPP Age: 3 months Region: Brain Group (sample): hAPP_3M vs controls_3M Criteria: FDR < 0.05 PMID: 29186695 Note: Mouse genes converted to human orthologs. Differentially expressed proteins represented by genes Source: Integrated DEPs from hAPP-3M-Hip, hAPP-3M-Cere, and hAPP-3M-FC. (Table S1) Dataset ID: E79 Taxon: Mouse Omic: Proteome Method: Tandem mass spectrometry Genetic BG: C57BL6 Model: hAPP Age: 12 months Region: Brain Group (sample): hAPP_12M vs controls_12M Criteria: FDR < 0.05 PMID: 29186695 Note: Mouse genes converted to human orthologs. Differentially expressed proteins represented by genes Source: Integrated DEPs from hAPP-12M-Hip, hAPP-12M-Cere, and hAPP-12M-FC.(Table S1) Dataset ID: E80 Taxon: Fruit fly Omic: Transcriptome Method: Microarray Criteria: FDR < 0.05 GEO: GSE48681 PMID: 24336499 Note: Fruit fly genes converted to human orthologs Source: Table S1, 233 (day-matched) and 636 (survival-matched) DEGs, with a total of 712 genes combined Dataset ID: E81 Taxon: Fruit fly Omic: Transcriptome Method: Bulk RNA-seq
Zhou e
t al. 2
020

25
Group (sample): eGRL_Aß42 vs eGRL_Control Criteria: FDR < 0.05, |FC| > 1.5 PMID: 29598827 Note: Fruit fly genes converted to human orthologs Source: eGRL_Aß42 vs eGRL_Control, Table S1 Dataset ID: E82 Taxon: Fruit fly Omic: Transcriptome Method: Bulk RNA-seq Group (sample): GGRL_Tau vs GGRL_Control Criteria: FDR < 0.05, |FC| > 1.5 PMID: 29598827 Note: Fruit fly genes converted to human orthologs Source: GGRL_Tau vs GGRL_Control, Table S1 Dataset ID: E83 Taxon: C. elegans Omic: Transcriptome Method: Bulk RNA-seq Criteria: FDR < 0.05, |FC| > 2 PMID: 28982592 Note: C. elegans genes converted to human orthologs Source: Significant differential expressed genes between N2 and UM0002 (Aβ1–42 + anti-aggregating tau), Table S3 Dataset ID: E84 Taxon: C. elegans Omic: Transcriptome Method: Bulk RNA-seq Criteria: FDR < 0.05, |FC| > 2 PMID: 28982592 Note: C. elegans genes converted to human orthologs Source: Significant differential expressed genes between N2 and UM0001(Aβ1–42 + pro-aggregating tau) , Tabel S3 Dataset ID: V1 Note: These genes were composed of amyloid seed genes, tauopathy seed genes; late-onset AD common risk genes identified by large-scale genetic studies, and high quailty disease gene integration. Source: Literature Dataset ID: V2 Note: These genes satisfied at least one of the following conditions: i) gene validation in large-scale amyloid GWAS studies; ii) in vivo experimental model evidence that knockdown or overexpression of the gene leads to AD-like amyloid pathology.
Zhou e
t al. 2
020

26
Source: Literature Dataset ID: V3 Note: These genes satisfied at least one of the following conditions: i) gene validation in large-scale tauopathy GWAS studies; ii) in vivo experimental model evidence that knockdown or overexpression of the gene leads to AD-like tau pathology. Source: Literature Dataset ID: V4 Note: The 103 risk genes were predicted based on the hypothesis that the true risk genes are more densely linked with each other in a biological network. Nat Neurosci. 2019;22(5):691-699. Source: Literature Dataset ID: V5 Note: 404 genes co-occuring with the biological term Alzheimer in literature-supported statements describing functions of genes from the GeneRIF Biological Term Annotations dataset. Source: GeneRIF-Biological-Term-Annotations Dataset ID: V6 Note: 15 genes associated with Alzheimer's disease; Alzheimer's disease in GWAS and other genetic association datasets from the GAD Gene-Disease Associations dataset. Source: GAD Gene-Disease Associations Dataset ID: V7 Note: Alzheimer's Disease CNS - Brain - Hippocampus (MMHCC) GSE1297 Source: GEO Signatures of Differentially Expressed Genes for Diseases Dataset ID: V8 Note: Alzheimer's Disease Entorhinal Cortex GSE5281 Source: GEO Signatures of Differentially Expressed Genes for Diseases Dataset ID: V9 Note: 33 genes associated with Alzheimer's disease phenotype in GWAS datasets from the GWAS Catalog SNP-Phenotype Associations dataset. Source: GWAS Catalog SNP-Phenotype Associations Dataset ID: V10 Note: 34 genes associated with Alzheimer's disease (late onset) phenotype in GWAS datasets from the GWAS Catalog SNP-Phenotype Associations dataset. Source: GWAS Catalog SNP-Phenotype Associations Dataset ID: V11 Note: 41 genes associated with Alzheimer's disease (cognitive decline) phenotype in GWAS datasets from the GWAS Catalog SNP-Phenotype Associations dataset.
Zhou e
t al. 2
020

27
Source: GWAS Catalog SNP-Phenotype Associations Dataset ID: V12 Note: 28 proteins participating in Alzheimer's disease pathway from the KEGG Pathways dataset. Source: KEGG Pathways Dataset ID: V13 Note: 55 proteins participating in Alzheimer's disease-amyloid secretase pathway from the PANTHER Pathways dataset. Source: PANTHER Pathways Dataset ID: V14 Note: 98 proteins participating in Alzheimer's disease-presenilin pathway from the PANTHER Pathways dataset. Source: PANTHER Pathways Dataset ID: V15 Note: 66 proteins co-occuring with the biological term Alzheimer in the abstracts of publications describing phosphosites from the Phosphosite Textmining Biological Term Annotations dataset. Source: Phosphosite Text-mining Biological Term Annotations Dataset ID: V16 Note: 226 proteins co-occuring with Alzheimer's disease specific cell type in the abstracts of biomedical publications from the TISSUES Text-mining Tissue Protein Expression Evidence Scores dataset. Source: TISSUES Text-mining Tissue Protein Expression Evidence Scores Dataset ID: V17 Note: 79 proteins participating in Alzheimers Disease (Homo sapiens) pathway from the Wikipathways Pathways dataset. Source: Wikipathways Pathways Dataset ID: V18 Note: 73 proteins participating in Alzheimers Disease (Mus musculus) pathway from the Wikipathways Pathways dataset. Source: Wikipathways Pathways Dataset ID: V19 Note: 17 proteins associated with Alzheimer's disease from the curated PhosphoSitePlus Phosphosite-Disease Associations dataset. Source: PhosphoSitePlus Phosphosite-Disease Associations Dataset ID: V20 Note: Overall score>0.3 and S_literature>0. Retrieve on Nov 18th, 2019.
Zhou e
t al. 2
020

28
Source: Open Targets Dataset ID: V21 Note: C0002395, Score_gda>0.3. Retrieve on Nov 18th, 2019. Source: DisGenet Dataset ID: V22 Note: C0494463, Score_gda>0.3. Retrieve on Nov 18th, 2019. Source: DisGenet Dataset ID: V23 Note: C0750901, Score_gda>0.3. Retrieve on Nov 18th, 2019. Source: DisGenet Dataset ID: V24 Note: C0276496, Score_gda>0.3. Retrieve on Nov 18th, 2019. Source: DisGenet Dataset ID: V25 Note: Retrieve on Nov 18th, 2019. Source: ClinVar Dataset ID: V26 Note: All genes have at least 3 related publications. Retrieve on Nov 18th, 2019. Source: Phenopedia Dataset ID: V27 Note: D000544, excludinng the gene without direct evidence. Retrieve on Nov 18th, 2019. Source: The Comparative Toxicogenomics Database (CTD) Dataset ID: M1 Taxon: Human Omic: Metabolomics Method: UPLC-HRMS + HILIC Region: Brain Group (sample): 21 late AD vs 19 controls Criteria: p < 0.05 PMID: 26717242 Note: Semi quantification Dataset ID: M2 Taxon: Human Omic: Metabolomics Method: LC-MS/MS + C18 Region: Serum
Zhou e
t al. 2
020

29
Group (sample): 305 late AD vs 370 controls Criteria: p < 0.05 PMID: 30337153 Note: Absolute quantification
Zhou e
t al. 2
020