am website presentation february 2015
TRANSCRIPT
Partnership OverviewFebruary 2015
FORWARD-LOOKING STATEMENTS
This presentation contains forward-looking statements. All statements, other than statements of historical facts, included in this presentation that address activities, events or developments that Antero Midstream Partners LP, and its subsidiaries (collectively, the “Partnership”) expect, believe or anticipate will or may occur in the future are forward-looking statements. The words “believe,” “expect,” “anticipate,” “plan,” “intend,” “estimate,” “project,” “foresee,” “should,” “would,” “could,” or other similar expressions are intended to identify forward-looking statements. However, the absence of these words does not mean that the statements are not forward-looking. Without limiting the generality of the foregoing, forward-looking statements contained in this presentation specifically include expectations of plans, strategies, objectives, and anticipated financial and operating results of the Partnership and Antero Resources Corporation (“Antero”). These statements are based on certain assumptions made by the Partnership and Antero based on management’s experience and perception of historical trends, current conditions, anticipated future developments and other factors believed to be appropriate. Such statements are subject to a number of assumptions, risks and uncertainties, many of which are beyond the control of the Partnership, which may cause actual results to differ materially from those implied or expressed by the forward-looking statements.
The Partnership cautions you that these forward-looking statements are subject to risks and uncertainties that may cause these statements to be inaccurate, and readers are cautioned not to place undue reliance on such statements. These risks include, but are not limited to, Antero’s ability to meet its drilling and development plan, commodity price volatility, inflation, environmental risks, drilling and completion and other operating risks, regulatory changes, the uncertainty inherent in projecting future rates ofproduction, cash flow and access to capital, the timing of development expenditures, and the other risks discussed in the registration statement on Form S-1 (No. 333-193798) filed by the Partnership under the heading “Risk Factors.”
Any forward-looking statement speaks only as of the date on which such statement is made, and the Partnership undertakes no obligation to correct or update any forward-looking statement, whether as a result of new information, future events or otherwise, except as required by applicable law.
1
ANTERO MIDSTREAM – A GROWTH FOCUSED MLP
2
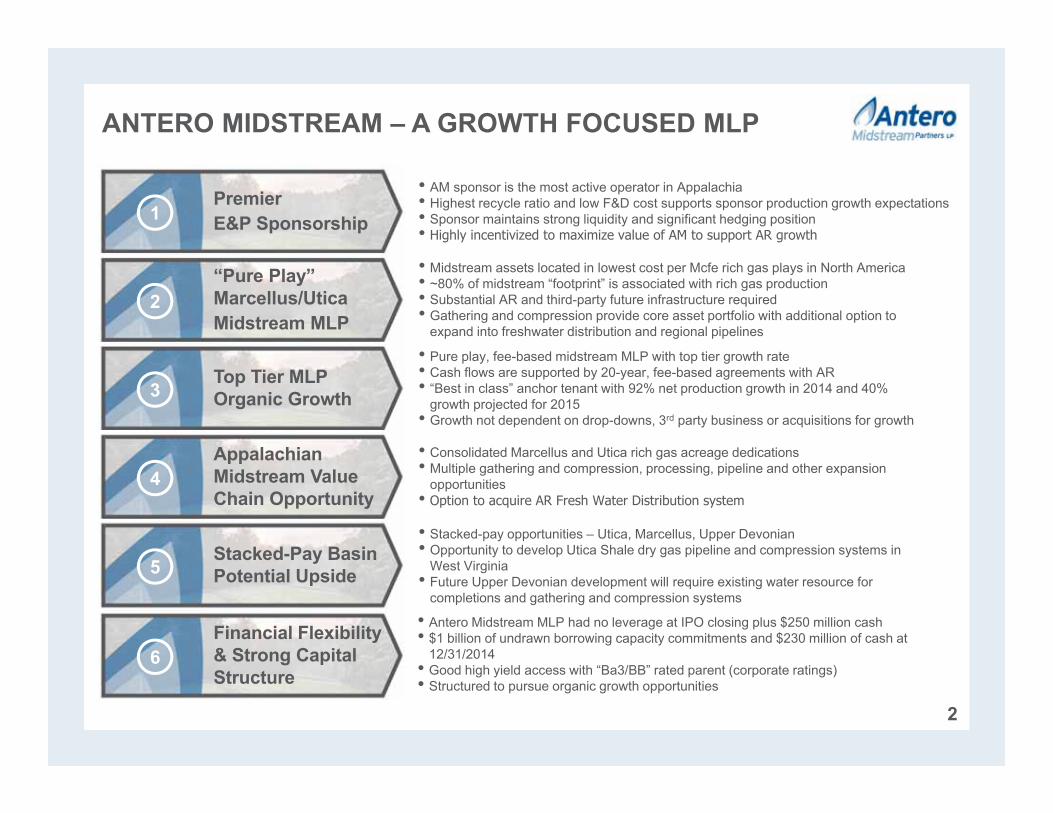
• AM sponsor is the most active operator in Appalachia• Highest recycle ratio and low F&D cost supports sponsor production growth expectations• Sponsor maintains strong liquidity and significant hedging position• Highly incentivized to maximize value of AM to support AR growth
• Midstream assets located in lowest cost per Mcfe rich gas plays in North America• ~80% of midstream “footprint” is associated with rich gas production• Substantial AR and third-party future infrastructure required• Gathering and compression provide core asset portfolio with additional option to
expand into freshwater distribution and regional pipelines
• Pure play, fee-based midstream MLP with top tier growth rate• Cash flows are supported by 20-year, fee-based agreements with AR• “Best in class” anchor tenant with 92% net production growth in 2014 and 40%
growth projected for 2015• Growth not dependent on drop-downs, 3rd party business or acquisitions for growth
• Consolidated Marcellus and Utica rich gas acreage dedications• Multiple gathering and compression, processing, pipeline and other expansion
opportunities• Option to acquire AR Fresh Water Distribution system
• Antero Midstream MLP had no leverage at IPO closing plus $250 million cash • $1 billion of undrawn borrowing capacity commitments and $230 million of cash at
12/31/2014• Good high yield access with “Ba3/BB” rated parent (corporate ratings)• Structured to pursue organic growth opportunities
PremierE&P Sponsorship1
“Pure Play” Marcellus/UticaMidstream MLP
2
Top Tier MLP Organic Growth3
Appalachian Midstream Value Chain Opportunity
4
Stacked-Pay Basin Potential Upside5
Financial Flexibility & Strong Capital Structure
6
• Stacked-pay opportunities – Utica, Marcellus, Upper Devonian• Opportunity to develop Utica Shale dry gas pipeline and compression systems in
West Virginia• Future Upper Devonian development will require existing water resource for
completions and gathering and compression systems
ANTERO MIDSTREAM – 2015 GUIDANCE
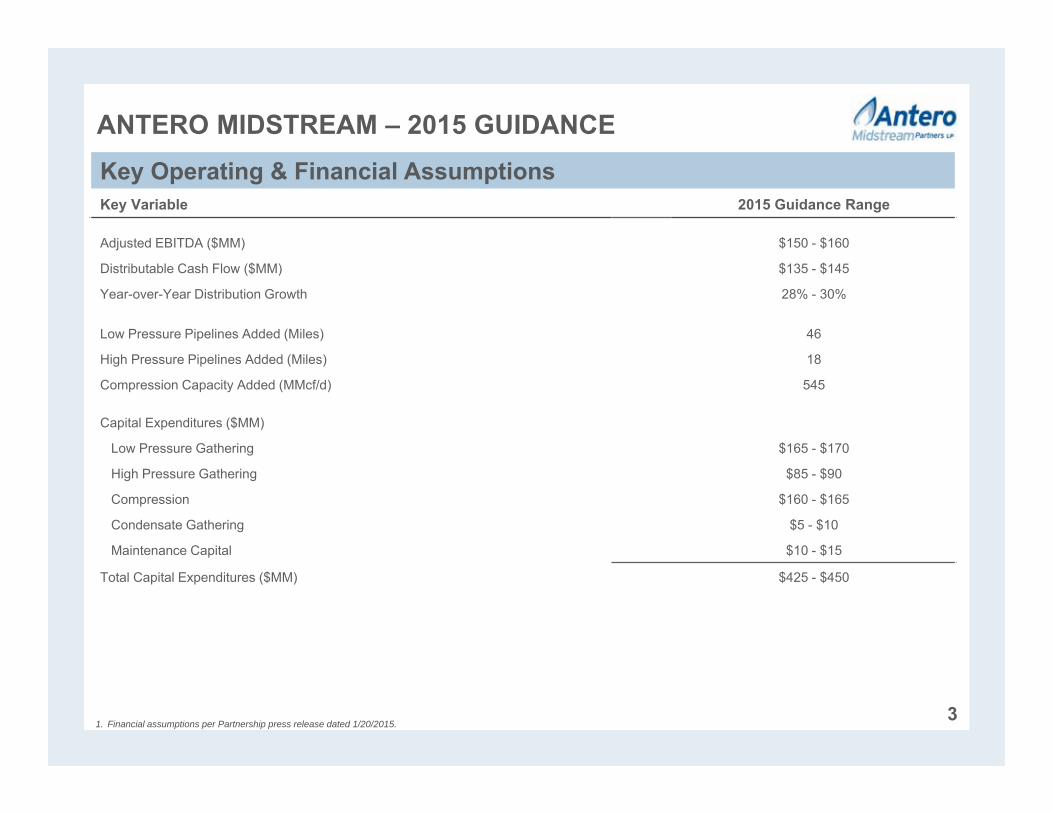
Key Variable 2015 Guidance Range
Adjusted EBITDA ($MM) $150 - $160
Distributable Cash Flow ($MM) $135 - $145
Year-over-Year Distribution Growth 28% - 30%
Low Pressure Pipelines Added (Miles) 46
High Pressure Pipelines Added (Miles) 18
Compression Capacity Added (MMcf/d) 545
Capital Expenditures ($MM)
Low Pressure Gathering $165 - $170
High Pressure Gathering $85 - $90
Compression $160 - $165
Condensate Gathering $5 - $10
Maintenance Capital $10 - $15
Total Capital Expenditures ($MM) $425 - $450
1. Financial assumptions per Partnership press release dated 1/20/2015.
Key Operating & Financial Assumptions
3
AnteroMidstream Management
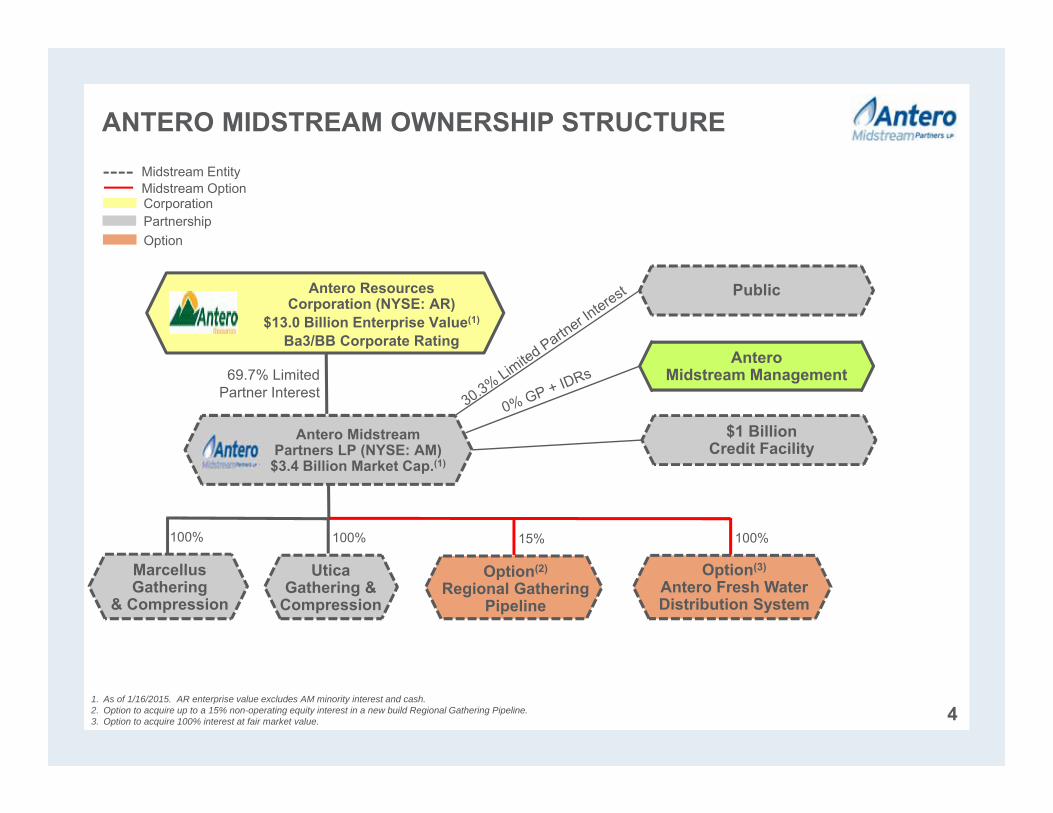
ANTERO MIDSTREAM OWNERSHIP STRUCTURE
4
Antero ResourcesCorporation (NYSE: AR)
$13.0 Billion Enterprise Value(1)
Ba3/BB Corporate Rating
Antero MidstreamPartners LP (NYSE: AM)
$3.4 Billion Market Cap.(1)
Public
$1 BillionCredit Facility
Midstream Entity
PartnershipCorporation
MarcellusGathering
& Compression
UticaGathering &
Compression
Option(3)
Antero Fresh WaterDistribution System
Option
69.7% Limited Partner Interest
1. As of 1/16/2015. AR enterprise value excludes AM minority interest and cash. 2. Option to acquire up to a 15% non-operating equity interest in a new build Regional Gathering Pipeline.3. Option to acquire 100% interest at fair market value.
100% 100% 100%
Option(2)
Regional GatheringPipeline
15%
Midstream Option

1. Represents inception to date actuals as of 6/30/2014 and 2015 midpoint guidance.2. Includes $12.5 million of maintenance capex at 2015 midpoint guidance.
5
• Gathering and compression assets in core of rapidly growing Marcellus and Utica Shale plays
– Acreage dedication of ~412,000 net leasehold acres for gathering and compression services
– 100% fixed fee long term contracts
UticaShale
MarcellusShale
Projected Midstream Infrastructure(1)
Marcellus Shale
Utica Shale Total
YE 2014E Cumulative Gathering/ Compression Capex ($MM) $850 $350 $1,200
Gathering Pipelines(Miles) 153 80 233
Compression Capacity(MMcf/d) 375 - 375
Condensate Gathering Pipelines (Miles) - 16 16
YE 2015E Gathering/ Compression Capex ($MM)(2) $256 $182 $438
Gathering Pipelines (Miles) 46 18 64
Compression Capacity(MMcf/d) 425 120 545
Condensate Gathering Pipelines (Miles) - 4 4
Midstream Assets
ANTERO MIDSTREAM PARTNERS OVERVIEW

ANTERO MIDSTREAM ASSETS – RICH GAS MARCELLUS
6
• Provides Marcellus gathering and compression services − Liquids-rich gas is delivered to MWE’s Sherwood
Complex for processing• Significant growth projected over the next twelve
months as set out below:
• Antero sold the Harrison County portion of its gathering system to a 3rd party midstream company in 2012, which is now recognized as the 3rd Party Gathering and Compression Dedication area
• Development upside as AR continues to drill, step-out and add acreage
Marcellus Gathering & Compression
Note: Antero acreage position reflects tax districts in which greater than 3,000 net acres are owned.
YE 2014 YE 2015
Gathering Pipelines (Miles) 153 199
Compression Capacity (MMcf/d) 375 800
WV/PA Utica Dry Gas Gathering & Compression
• Further development upside in 170,000 net acres of Utica deep rights beneath the Marcellus Shale− Will require a separate dry gas gathering system
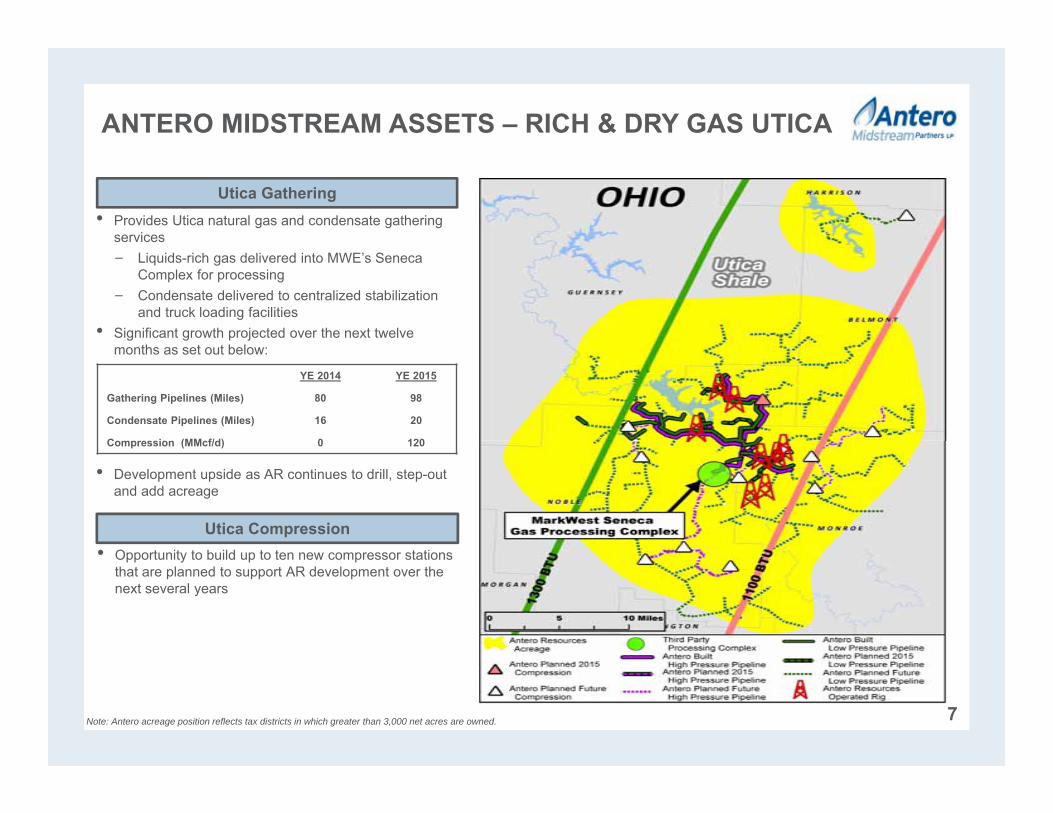
7
• Provides Utica natural gas and condensate gathering services− Liquids-rich gas delivered into MWE’s Seneca
Complex for processing− Condensate delivered to centralized stabilization
and truck loading facilities• Significant growth projected over the next twelve
months as set out below:
• Development upside as AR continues to drill, step-out and add acreage
Utica Gathering
Note: Antero acreage position reflects tax districts in which greater than 3,000 net acres are owned.
ANTERO MIDSTREAM ASSETS – RICH & DRY GAS UTICA
YE 2014 YE 2015
Gathering Pipelines (Miles) 80 98
Condensate Pipelines (Miles) 16 20
Compression (MMcf/d) 0 120
Utica Compression• Opportunity to build up to ten new compressor stations
that are planned to support AR development over the next several years
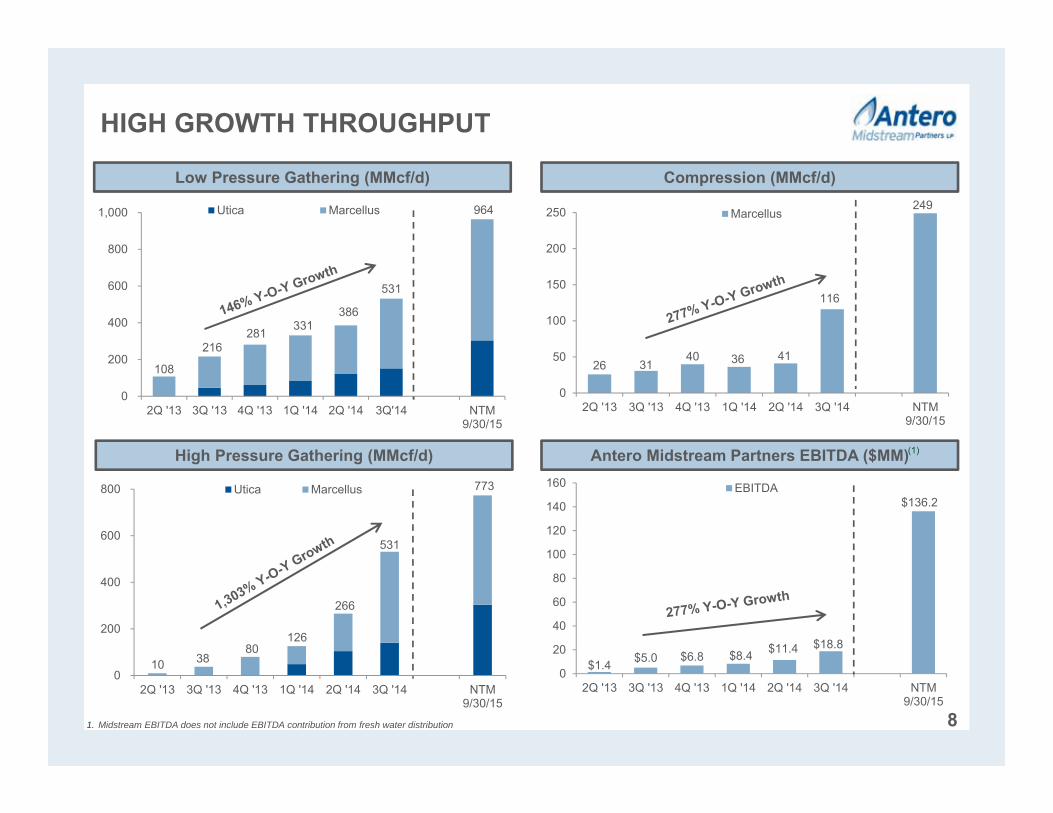
108
216 281 331
386
531
964
0
200
400
600
800
1,000
2Q '13 3Q '13 4Q '13 1Q '14 2Q '14 3Q'14 NTM9/30/15
Utica Marcellus
$1.4 $5.0 $6.8 $8.4 $11.4 $18.8
$136.2
0
20
40
60
80
100
120
140
160
2Q '13 3Q '13 4Q '13 1Q '14 2Q '14 3Q '14 NTM9/30/15
EBITDA
HIGH GROWTH THROUGHPUT
Low Pressure Gathering (MMcf/d) Compression (MMcf/d)
High Pressure Gathering (MMcf/d) Antero Midstream Partners EBITDA ($MM)
1. Midstream EBITDA does not include EBITDA contribution from fresh water distribution
(1)
8
26 31 40 36 41
116
249
0
50
100
150
200
250
2Q '13 3Q '13 4Q '13 1Q '14 2Q '14 3Q '14 NTM9/30/15
Marcellus
10 38 80
126
266
531
773
0
200
400
600
800
2Q '13 3Q '13 4Q '13 1Q '14 2Q '14 3Q '14 NTM9/30/15
Utica Marcellus
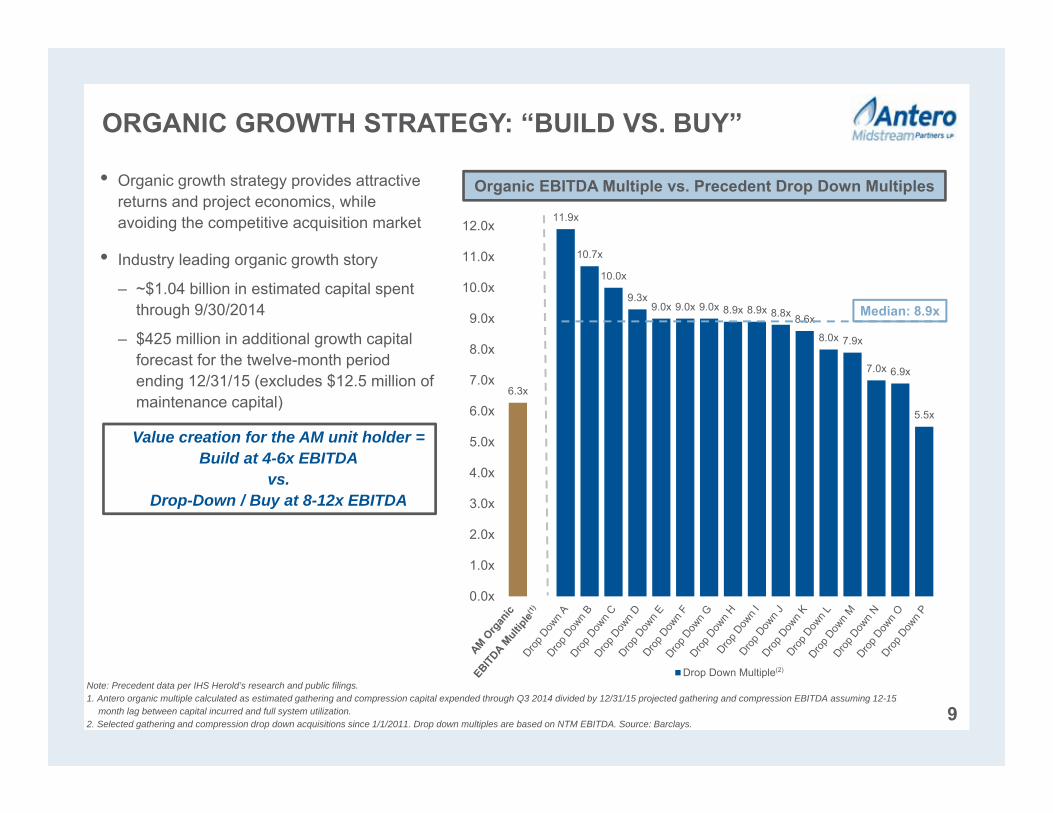
ORGANIC GROWTH STRATEGY: “BUILD VS. BUY”
9
• Organic growth strategy provides attractive returns and project economics, while avoiding the competitive acquisition market
• Industry leading organic growth story
– ~$1.04 billion in estimated capital spent through 9/30/2014
– $425 million in additional growth capital forecast for the twelve-month period ending 12/31/15 (excludes $12.5 million of maintenance capital)
Note: Precedent data per IHS Herold’s research and public filings.1. Antero organic multiple calculated as estimated gathering and compression capital expended through Q3 2014 divided by 12/31/15 projected gathering and compression EBITDA assuming 12-15
month lag between capital incurred and full system utilization.2. Selected gathering and compression drop down acquisitions since 1/1/2011. Drop down multiples are based on NTM EBITDA. Source: Barclays.
6.3x
11.9x
10.7x
10.0x
9.3x9.0x 9.0x 9.0x 8.9x 8.9x 8.8x 8.6x
8.0x 7.9x
7.0x 6.9x
5.5x
0.0x
1.0x
2.0x
3.0x
4.0x
5.0x
6.0x
7.0x
8.0x
9.0x
10.0x
11.0x
12.0x
Drop Down Multiple(2)
Organic EBITDA Multiple vs. Precedent Drop Down Multiples
Median: 8.9x
Value creation for the AM unit holder =Build at 4-6x EBITDA
vs.Drop-Down / Buy at 8-12x EBITDA
Fresh Water
Distribution(1)
Regional Gas Pipelines
Miles Capacity In-Service
Unnamed Regional Pipeline
50 1.4 Bcf/d 4Q 2015
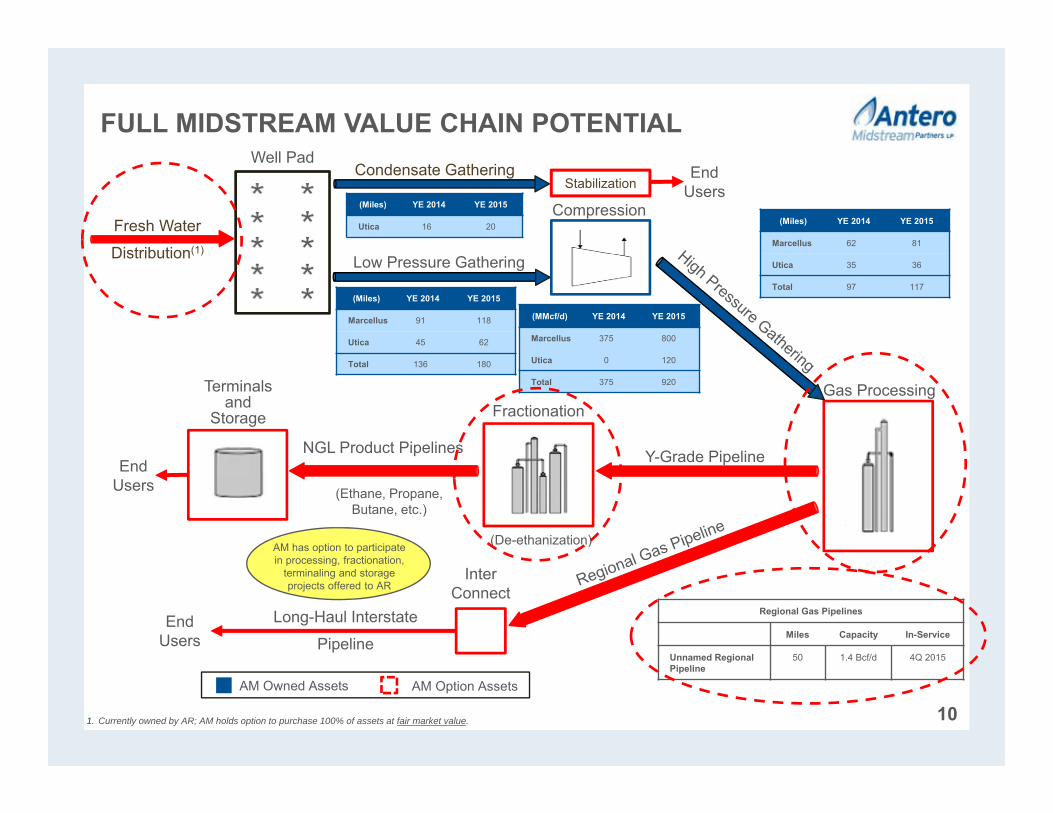
101. Currently owned by AR; AM holds option to purchase 100% of assets at fair market value.
EndUsers
EndUsers
Gas Processing
Y-Grade Pipeline
Long-Haul Interstate
Pipeline
InterConnect
NGL Product Pipelines
Fractionation
Compression
Low Pressure Gathering
Well Pad
Terminalsand
Storage
(Miles) YE 2014 YE 2015
Marcellus 91 118
Utica 45 62
Total 136 180
AM has option to participate in processing, fractionation,
terminaling and storage projects offered to AR
FULL MIDSTREAM VALUE CHAIN POTENTIAL
(Miles) YE 2014 YE 2015
Marcellus 62 81
Utica 35 36
Total 97 117
(MMcf/d) YE 2014 YE 2015
Marcellus 375 800
Utica 0 120
Total 375 920
AM Owned Assets
Condensate GatheringStabilization
(Miles) YE 2014 YE 2015
Utica 16 20
EndUsers
AM Option Assets
(Ethane, Propane, Butane, etc.)
(De-ethanization)
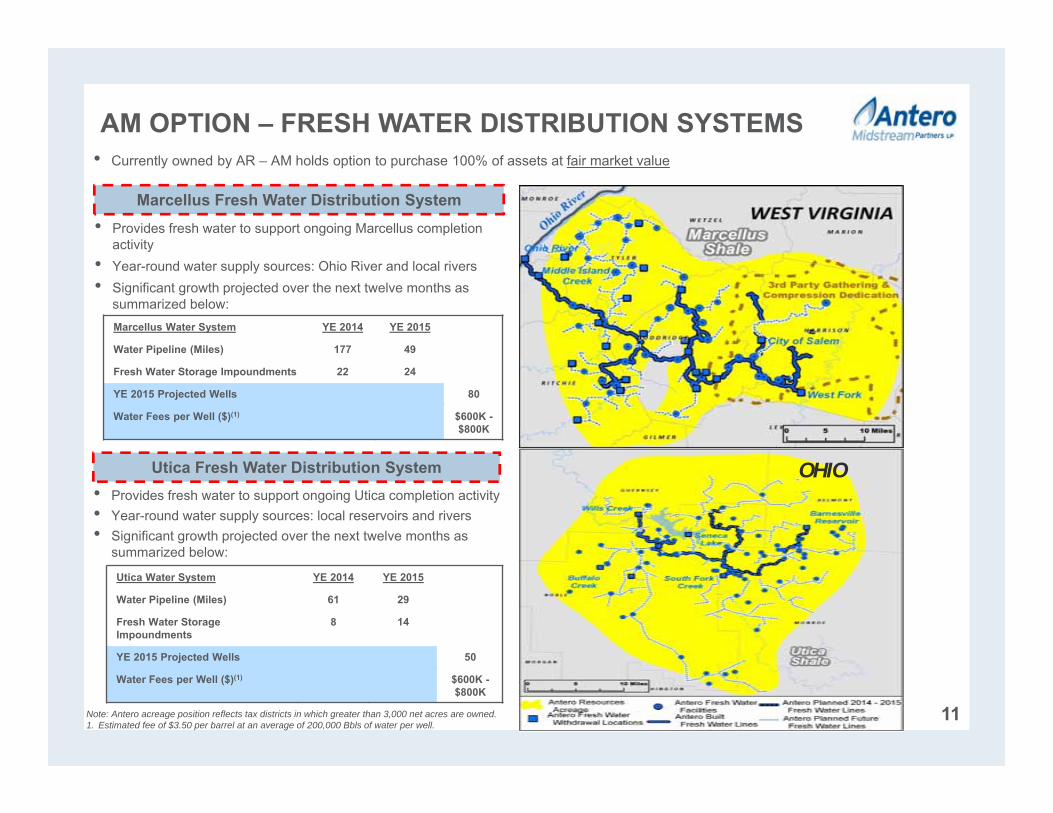
AM OPTION – FRESH WATER DISTRIBUTION SYSTEMS
11
Marcellus Fresh Water Distribution System• Provides fresh water to support ongoing Marcellus completion
activity • Year-round water supply sources: Ohio River and local rivers• Significant growth projected over the next twelve months as
summarized below:
Note: Antero acreage position reflects tax districts in which greater than 3,000 net acres are owned.1. Estimated fee of $3.50 per barrel at an average of 200,000 Bbls of water per well.
Utica Fresh Water Distribution System• Provides fresh water to support ongoing Utica completion activity • Year-round water supply sources: local reservoirs and rivers• Significant growth projected over the next twelve months as
summarized below:
• Currently owned by AR – AM holds option to purchase 100% of assets at fair market value
Marcellus Water System YE 2014 YE 2015
Water Pipeline (Miles) 177 49
Fresh Water Storage Impoundments 22 24
YE 2015 Projected Wells 80
Water Fees per Well ($)(1) $600K -$800K
Utica Water System YE 2014 YE 2015
Water Pipeline (Miles) 61 29
Fresh Water Storage Impoundments
8 14
YE 2015 Projected Wells 50
Water Fees per Well ($)(1) $600K -$800K
OHIO
25%
15%
10%
25%
30%
15% 15%
35%
25%
20%
35%
25%20%
40%
0%
10%
20%
30%
40%
Inte
rnal
Rat
e of
Ret
urn
12
DRY GAS LOCATIONS RICH GAS LOCATIONS
HIGHLY RICH GAS
LOCATIONS
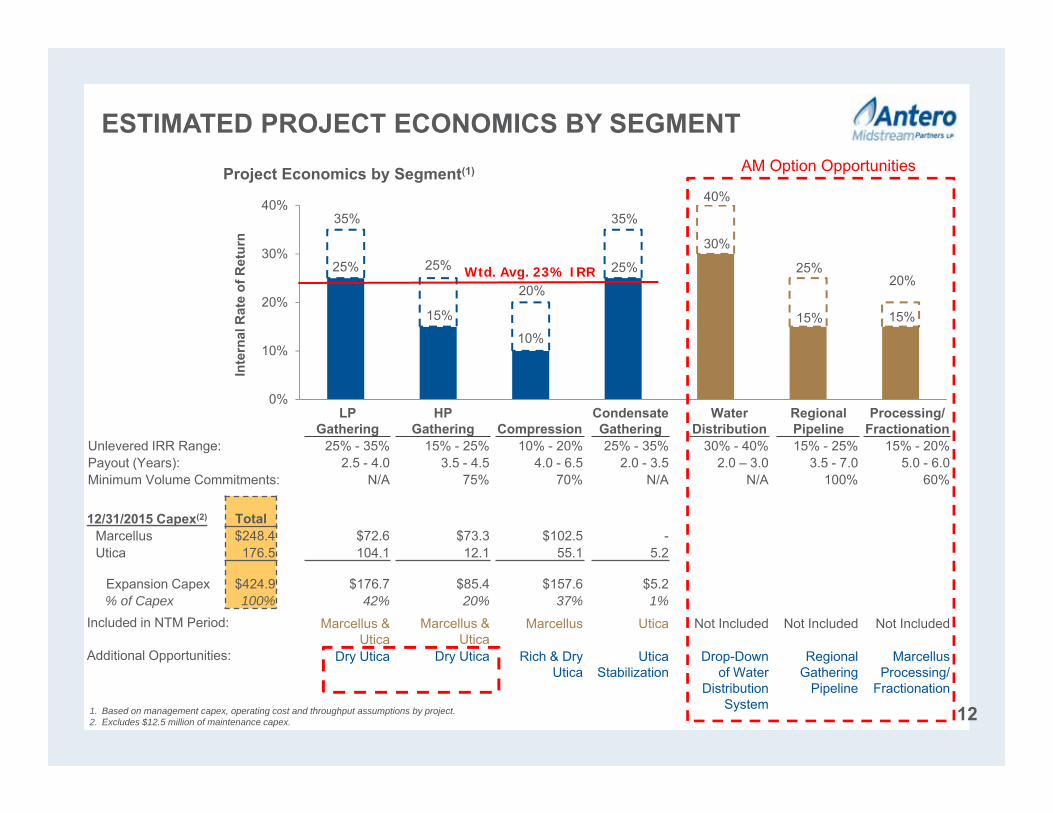
Project Economics by Segment(1)
ESTIMATED PROJECT ECONOMICS BY SEGMENT
LPGathering
HPGathering Compression
CondensateGathering
Water Distribution
RegionalPipeline
Processing/Fractionation
Unlevered IRR Range: 25% - 35% 15% - 25% 10% - 20% 25% - 35% 30% - 40% 15% - 25% 15% - 20% Payout (Years): 2.5 - 4.0 3.5 - 4.5 4.0 - 6.5 2.0 - 3.5 2.0 – 3.0 3.5 - 7.0 5.0 - 6.0 Minimum Volume Commitments: N/A 75% 70% N/A N/A 100% 60%
12/31/2015 Capex(2) TotalMarcellus $248.4 $72.6 $73.3 $102.5 -Utica 176.5 104.1 12.1 55.1 5.2
Expansion Capex $424.9 $176.7 $85.4 $157.6 $5.2 % of Capex 100% 42% 20% 37% 1%
Included in NTM Period: Marcellus & Utica
Marcellus & Utica
Marcellus Utica Not Included Not Included Not Included
Additional Opportunities: Dry Utica Dry Utica Rich & Dry Utica
Utica Stabilization
Drop-Downof Water
Distribution System
Regional Gathering
Pipeline
Marcellus Processing/
Fractionation1. Based on management capex, operating cost and throughput assumptions by project.2. Excludes $12.5 million of maintenance capex.
Wtd. Avg. 23% IRR
AM Option Opportunities
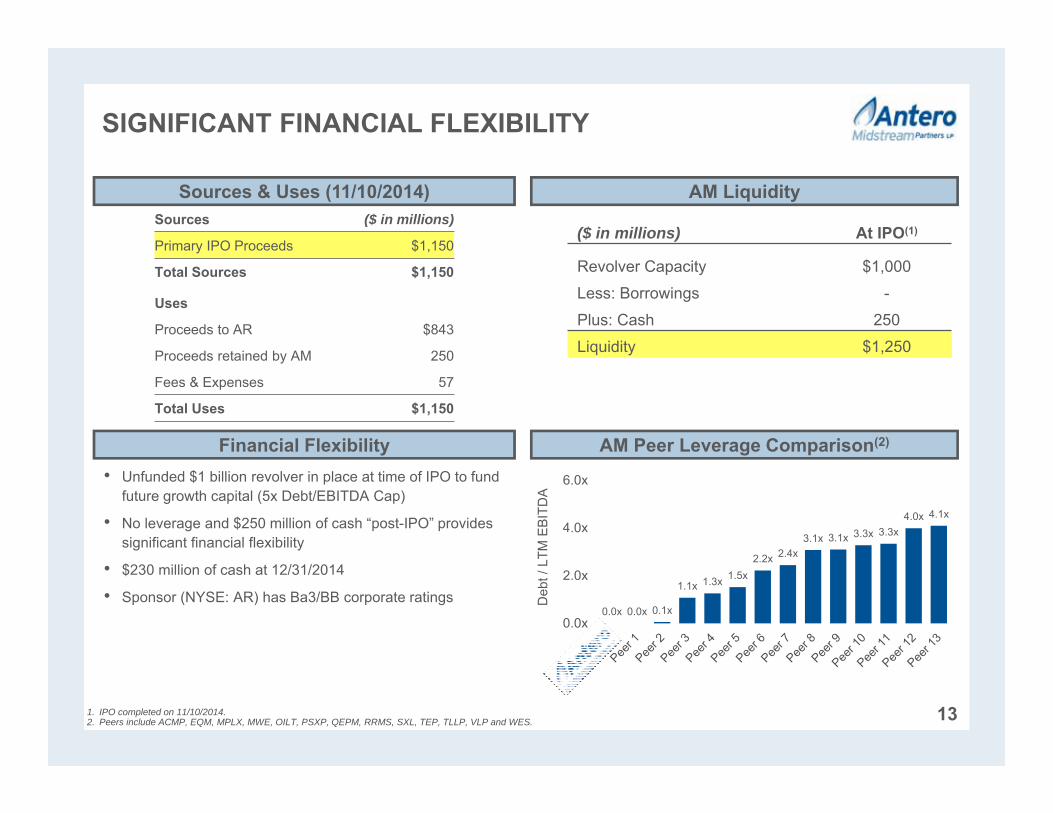
SIGNIFICANT FINANCIAL FLEXIBILITY
13
• Unfunded $1 billion revolver in place at time of IPO to fund future growth capital (5x Debt/EBITDA Cap)
• No leverage and $250 million of cash “post-IPO” provides significant financial flexibility
• $230 million of cash at 12/31/2014
• Sponsor (NYSE: AR) has Ba3/BB corporate ratings
AM Liquidity
AM Peer Leverage Comparison(2)
($ in millions) At IPO(1)
Revolver Capacity $1,000
Less: Borrowings -
Plus: Cash 250
Liquidity $1,250
0.0x 0.0x 0.1x
1.1x 1.3x 1.5x2.2x 2.4x
3.1x 3.1x 3.3x 3.3x4.0x 4.1x
0.0x
2.0x
4.0x
6.0x
Deb
t / L
TM E
BIT
DA
1. IPO completed on 11/10/2014. 2. Peers include ACMP, EQM, MPLX, MWE, OILT, PSXP, QEPM, RRMS, SXL, TEP, TLLP, VLP and WES.
Sources ($ in millions)
Primary IPO Proceeds $1,150
Total Sources $1,150
Uses
Proceeds to AR $843
Proceeds retained by AM 250
Fees & Expenses 57
Total Uses $1,150
Sources & Uses (11/10/2014)
Financial Flexibility
14
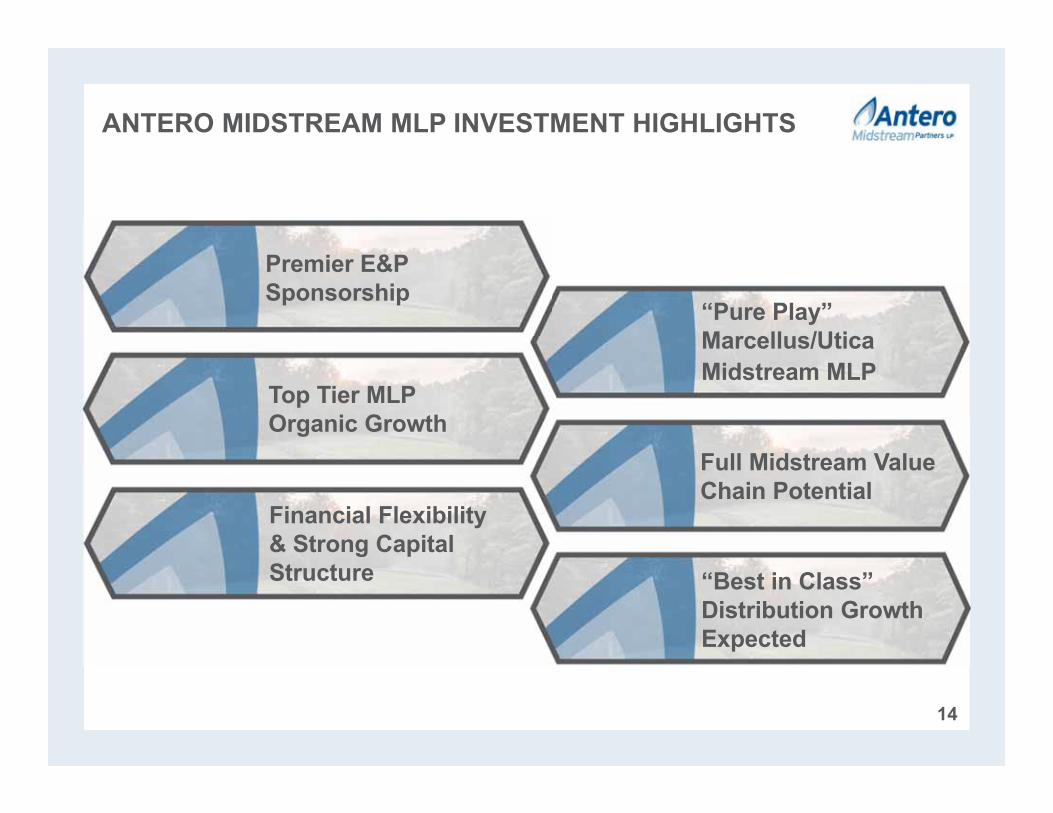
ANTERO MIDSTREAM MLP INVESTMENT HIGHLIGHTS
Premier E&P Sponsorship
“Pure Play” Marcellus/UticaMidstream MLP
Top Tier MLP Organic Growth
Full Midstream Value Chain Potential
Financial Flexibility & Strong Capital Structure “Best in Class”
Distribution Growth Expected
15
Antero Resources (NYSE: AR)Overview
16
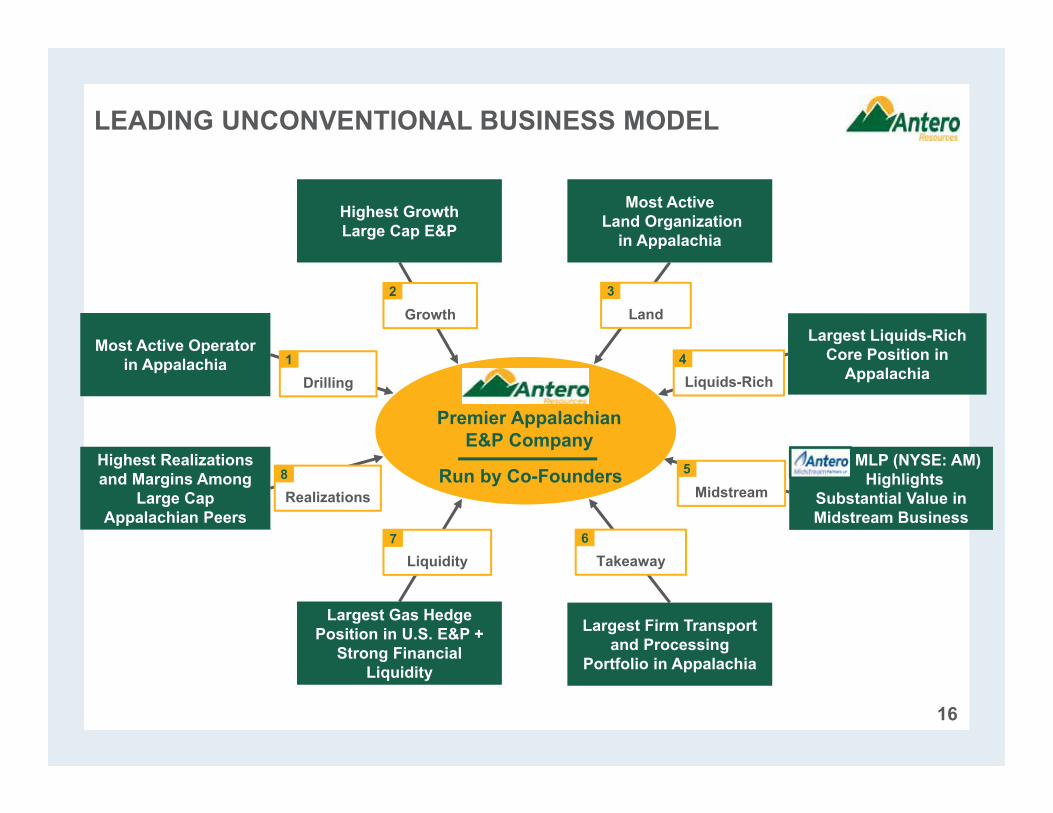
Most Active Operatorin Appalachia
Most ActiveLand Organization
in Appalachia
Largest Firm Transport and Processing
Portfolio in Appalachia
Largest Gas Hedge Position in U.S. E&P +
Strong Financial Liquidity
Highest Growth Large Cap E&P
Largest Liquids-Rich Core Position in
Appalachia
Highest Realizations and Margins Among
Large Cap Appalachian Peers
Growth Land
Liquidity
Midstream
Drilling
LEADING UNCONVENTIONAL BUSINESS MODEL
MLP (NYSE: AM)Highlights
Substantial Value in Midstream Business
Realizations
Takeaway
Liquids-Rich1
2 3
4
5
67
8
Premier AppalachianE&P Company
Run by Co-Founders
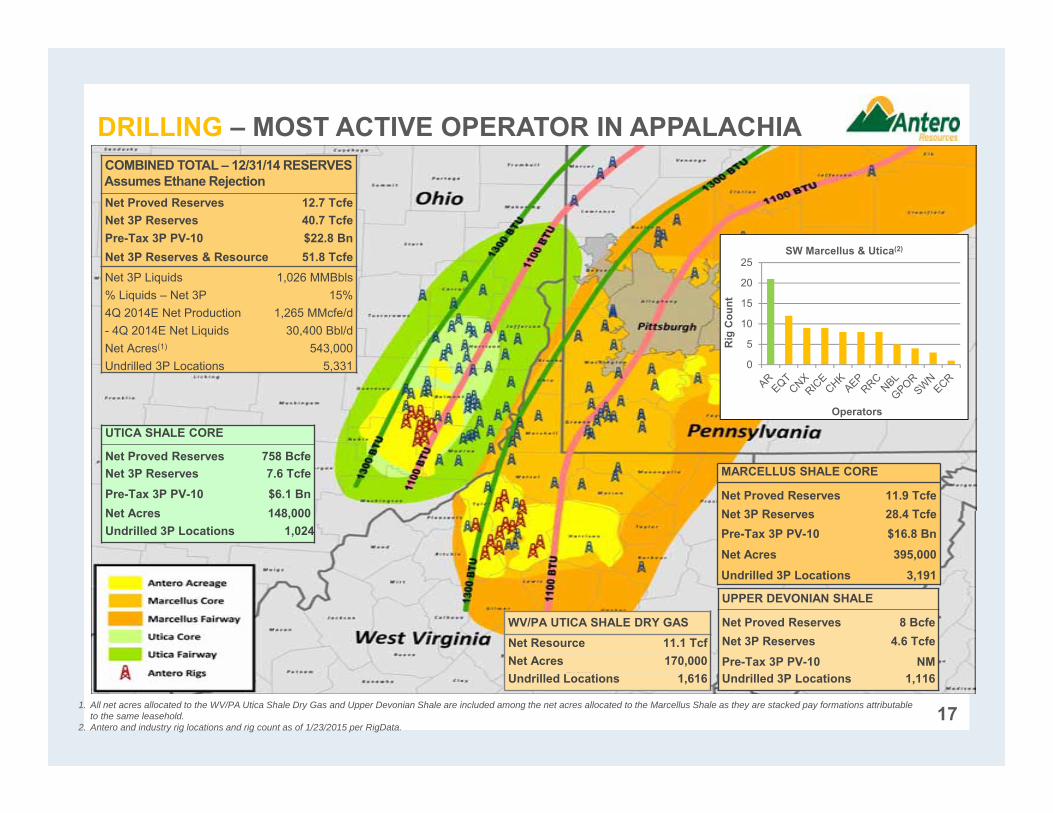
DRILLING – MOST ACTIVE OPERATOR IN APPALACHIA
1. All net acres allocated to the WV/PA Utica Shale Dry Gas and Upper Devonian Shale are included among the net acres allocated to the Marcellus Shale as they are stacked pay formations attributable to the same leasehold.
2. Antero and industry rig locations and rig count as of 1/23/2015 per RigData. 17
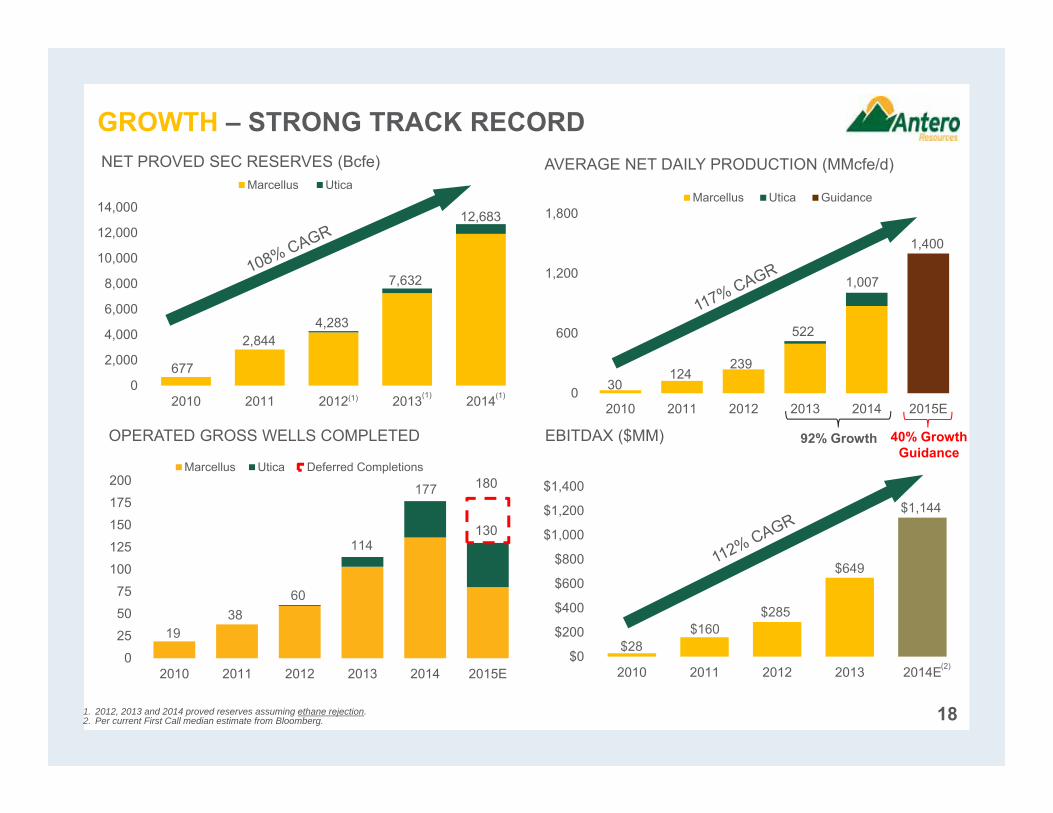
COMBINED TOTAL – 12/31/14 RESERVESAssumes Ethane RejectionNet Proved Reserves 12.7 TcfeNet 3P Reserves 40.7 TcfePre-Tax 3P PV-10 $22.8 BnNet 3P Reserves & Resource 51.8 TcfeNet 3P Liquids 1,026 MMBbls% Liquids – Net 3P 15%4Q 2014E Net Production 1,265 MMcfe/d- 4Q 2014E Net Liquids 30,400 Bbl/dNet Acres(1) 543,000Undrilled 3P Locations 5,331
UTICA SHALE CORE
Net Proved Reserves 758 BcfeNet 3P Reserves 7.6 TcfePre-Tax 3P PV-10 $6.1 BnNet Acres 148,000Undrilled 3P Locations 1,024
MARCELLUS SHALE CORE
Net Proved Reserves 11.9 TcfeNet 3P Reserves 28.4 TcfePre-Tax 3P PV-10 $16.8 BnNet Acres 395,000Undrilled 3P Locations 3,191
UPPER DEVONIAN SHALE
Net Proved Reserves 8 BcfeNet 3P Reserves 4.6 TcfePre-Tax 3P PV-10 NMUndrilled 3P Locations 1,116
WV/PA UTICA SHALE DRY GASNet Resource 11.1 TcfNet Acres 170,000Undrilled Locations 1,616
0
5
10
15
20
25
Rig
Cou
nt
Operators
SW Marcellus & Utica(2)
0
600
1,200
1,800
2010 2011 2012 2013 2014 2015E
Marcellus Utica Guidance
30124
239
522
1,400
1,007
1. 2012, 2013 and 2014 proved reserves assuming ethane rejection.2. Per current First Call median estimate from Bloomberg.
0
2,000
4,000
6,000
8,000
10,000
12,000
14,000
2010 2011 2012 2013 2014
Marcellus Utica
677
2,8444,283
7,632
(1) (1) (1)
12,683
18
AVERAGE NET DAILY PRODUCTION (MMcfe/d)NET PROVED SEC RESERVES (Bcfe)
0
25
50
75
100
125
150
175
200
2010 2011 2012 2013 2014 2015E
Marcellus Utica Deferred Completions
1938
60
114
177 180
130
GROWTH – STRONG TRACK RECORD
OPERATED GROSS WELLS COMPLETED EBITDAX ($MM)
$0
$200
$400
$600
$800
$1,000
$1,200
$1,400
2010 2011 2012 2013 2014E
$28$160
$285
$649
$1,144
(2)
40% GrowthGuidance
92% Growth
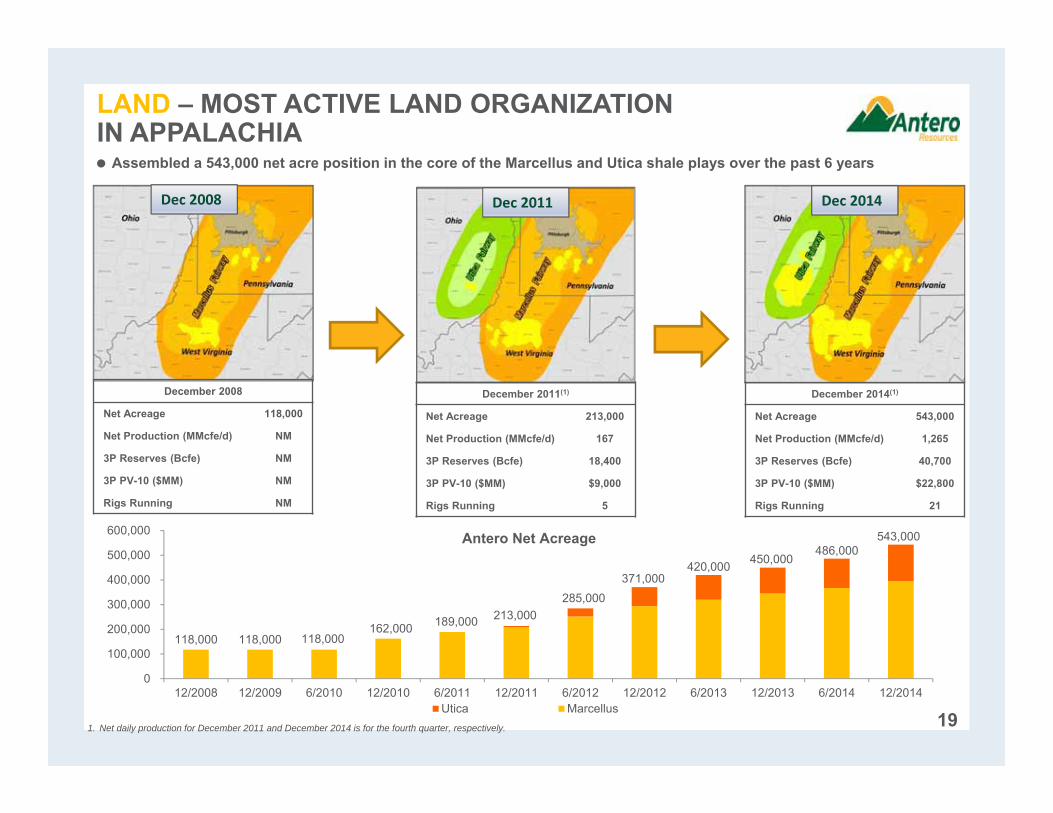
Assembled a 543,000 net acre position in the core of the Marcellus and Utica shale plays over the past 6 years
December 2008
Net Acreage 118,000
Net Production (MMcfe/d) NM
3P Reserves (Bcfe) NM
3P PV-10 ($MM) NM
Rigs Running NM
Dec 2008 Dec 2011 Dec 2014
December 2011(1)
Net Acreage 213,000
Net Production (MMcfe/d) 167
3P Reserves (Bcfe) 18,400
3P PV-10 ($MM) $9,000
Rigs Running 5
December 2014(1)
Net Acreage 543,000
Net Production (MMcfe/d) 1,265
3P Reserves (Bcfe) 40,700
3P PV-10 ($MM) $22,800
Rigs Running 21
1. Net daily production for December 2011 and December 2014 is for the fourth quarter, respectively.
LAND – MOST ACTIVE LAND ORGANIZATIONIN APPALACHIA
19
118,000 118,000 118,000 162,000 189,000 213,000
285,000 371,000
420,000 450,000 486,000
543,000
0
100,000
200,000
300,000
400,000
500,000
600,000
12/2008 12/2009 6/2010 12/2010 6/2011 12/2011 6/2012 12/2012 6/2013 12/2013 6/2014 12/2014
Antero Net Acreage
Utica Marcellus

20
LIQUIDS-RICH – LARGEST CORE POSITION
Source: Core outlines and peer net acreage positions based on peer presentations, news releases and 10-K/10-Qs.
Antero has the largest liquids-rich core position in Appalachia ≈371,000 net acres
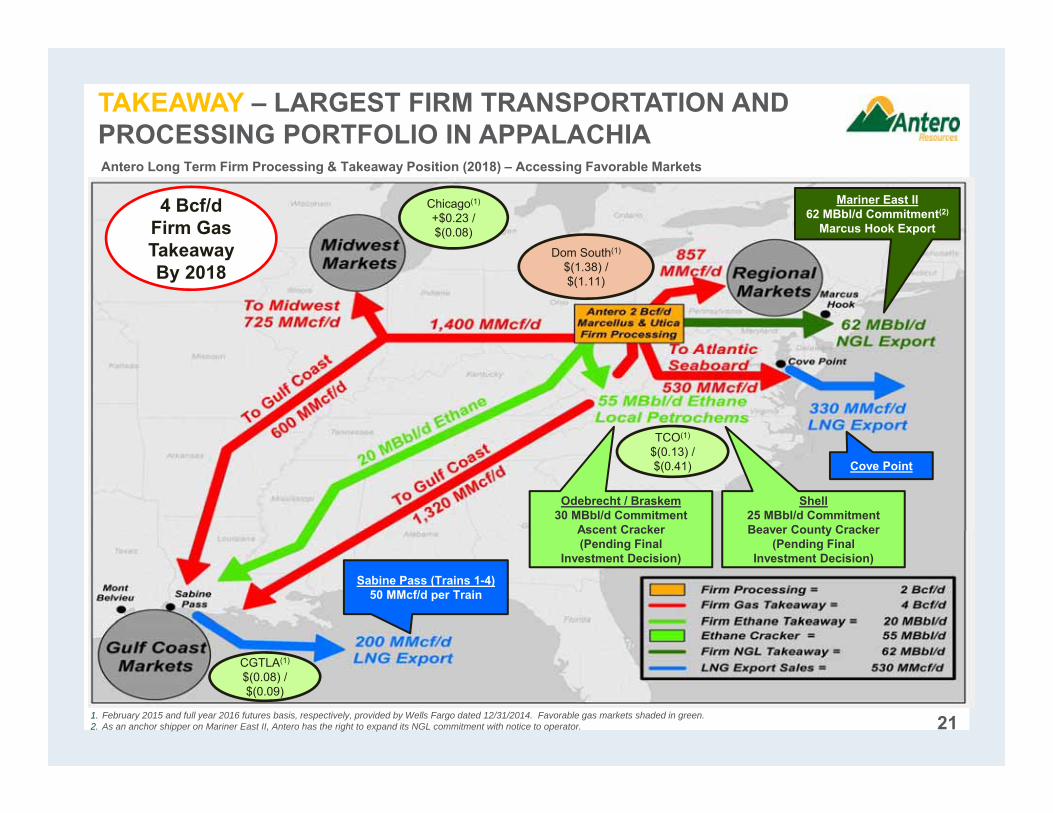
TAKEAWAY – LARGEST FIRM TRANSPORTATION AND PROCESSING PORTFOLIO IN APPALACHIA
Odebrecht / Braskem30 MBbl/d Commitment
Ascent Cracker(Pending Final
Investment Decision)
Antero Long Term Firm Processing & Takeaway Position (2018) – Accessing Favorable Markets
Mariner East II62 MBbl/d Commitment(2)
Marcus Hook Export
Shell25 MBbl/d CommitmentBeaver County Cracker
(Pending FinalInvestment Decision)
Sabine Pass (Trains 1-4)50 MMcf/d per Train
1. February 2015 and full year 2016 futures basis, respectively, provided by Wells Fargo dated 12/31/2014. Favorable gas markets shaded in green.2. As an anchor shipper on Mariner East II, Antero has the right to expand its NGL commitment with notice to operator.
Chicago(1)
+$0.23 / $(0.08)
CGTLA(1)
$(0.08) / $(0.09)
Dom South(1)
$(1.38) / $(1.11)
TCO(1)
$(0.13) / $(0.41)
21
4 Bcf/dFirm Gas TakeawayBy 2018
Cove Point
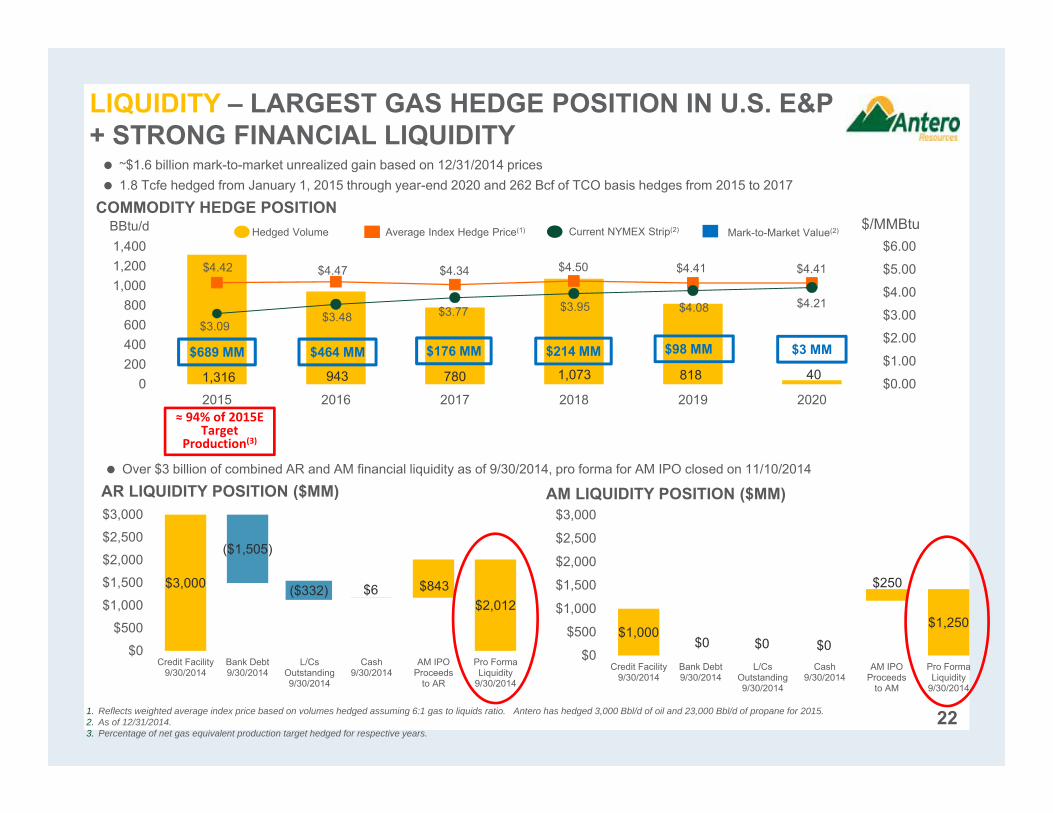
1,316 943 780 1,073 818 40
$4.42 $4.47 $4.34 $4.50 $4.41 $4.41
$3.09$3.48 $3.77 $3.95 $4.08 $4.21
$0.00
$1.00
$2.00
$3.00
$4.00
$5.00
$6.00
0200400600800
1,0001,2001,400
2015 2016 2017 2018 2019 2020
BBtu/d $/MMBtu
22
Average Index Hedge Price(1)Hedged Volume Current NYMEX Strip(2)
COMMODITY HEDGE POSITION
1. Reflects weighted average index price based on volumes hedged assuming 6:1 gas to liquids ratio. Antero has hedged 3,000 Bbl/d of oil and 23,000 Bbl/d of propane for 2015. 2. As of 12/31/2014.3. Percentage of net gas equivalent production target hedged for respective years.
~$1.6 billion mark-to-market unrealized gain based on 12/31/2014 prices 1.8 Tcfe hedged from January 1, 2015 through year-end 2020 and 262 Bcf of TCO basis hedges from 2015 to 2017
$689 MM $464 MM $176 MM $214 MM $98 MM $3 MM
Mark-to-Market Value(2)
LIQUIDITY – LARGEST GAS HEDGE POSITION IN U.S. E&P + STRONG FINANCIAL LIQUIDITY
$3,000
$2,012
($1,505)
($332) $6 $843
$0
$500
$1,000
$1,500
$2,000
$2,500
$3,000
Credit Facility9/30/2014
Bank Debt9/30/2014
L/Cs Outstanding9/30/2014
Cash9/30/2014
AM IPOProceeds
to AR
Pro FormaLiquidity
9/30/2014
AR LIQUIDITY POSITION ($MM) AM LIQUIDITY POSITION ($MM)
$1,000$1,250
$0 $0 $0
$250
$0
$500
$1,000
$1,500
$2,000
$2,500
$3,000
Credit Facility9/30/2014
Bank Debt9/30/2014
L/Cs Outstanding9/30/2014
Cash9/30/2014
AM IPO Proceeds
to AM
Pro FormaLiquidity
9/30/2014
≈ 94% of 2015ETarget
Production(3)
Over $3 billion of combined AR and AM financial liquidity as of 9/30/2014, pro forma for AM IPO closed on 11/10/2014
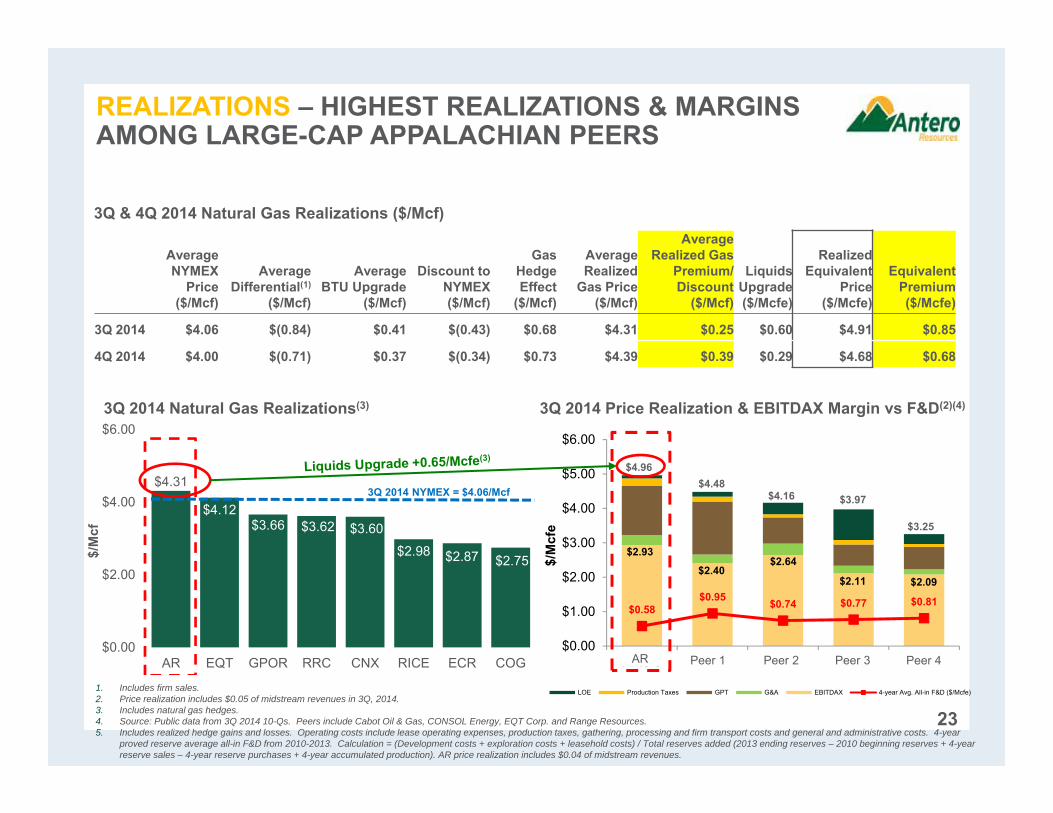
1. Includes firm sales. 2. Price realization includes $0.05 of midstream revenues in 3Q, 2014. 3. Includes natural gas hedges.4. Source: Public data from 3Q 2014 10-Qs. Peers include Cabot Oil & Gas, CONSOL Energy, EQT Corp. and Range Resources. 5. Includes realized hedge gains and losses. Operating costs include lease operating expenses, production taxes, gathering, processing and firm transport costs and general and administrative costs. 4-year
proved reserve average all-in F&D from 2010-2013. Calculation = (Development costs + exploration costs + leasehold costs) / Total reserves added (2013 ending reserves – 2010 beginning reserves + 4-year reserve sales – 4-year reserve purchases + 4-year accumulated production). AR price realization includes $0.04 of midstream revenues.
$4.16 $3.97
$0.58 $0.95 $0.74 $0.77 $0.81
$0.00
$1.00
$2.00
$3.00
$4.00
$5.00
$6.00
Antero Peer 1 Peer 2 Peer 3 Peer 4
$/M
cfe
LOE Production Taxes GPT G&A EBITDAX 4-year Avg. All-in F&D ($/Mcfe)
$4.96
$3.25
$4.48
$2.93
$2.40$2.64
$2.11 $2.09
23
REALIZATIONS – HIGHEST REALIZATIONS & MARGINSAMONG LARGE-CAP APPALACHIAN PEERS
3Q & 4Q 2014 Natural Gas Realizations ($/Mcf)
3Q 2014 Natural Gas Realizations(3) 3Q 2014 Price Realization & EBITDAX Margin vs F&D(2)(4)
$4.31
$4.12$3.66 $3.62 $3.60
$2.98 $2.87 $2.75
$0.00
$2.00
$4.00
$6.00
AR EQT GPOR RRC CNX RICE ECR COG
$/M
cf
3Q 2014 NYMEX = $4.06/Mcf
AR Peer 1 Peer 2 Peer 3 Peer 4
Average NYMEX
Price($/Mcf)
AverageDifferential(1)
($/Mcf)
AverageBTU Upgrade
($/Mcf)
Discount to NYMEX($/Mcf)
GasHedgeEffect
($/Mcf)
AverageRealized
Gas Price($/Mcf)
AverageRealized Gas
Premium/ Discount
($/Mcf)
Liquids Upgrade($/Mcfe)
Realized Equivalent
Price($/Mcfe)
Equivalent Premium($/Mcfe)
3Q 2014 $4.06 $(0.84) $0.41 $(0.43) $0.68 $4.31 $0.25 $0.60 $4.91 $0.85
4Q 2014 $4.00 $(0.71) $0.37 $(0.34) $0.73 $4.39 $0.39 $0.29 $4.68 $0.68
DOM S 22%
DOM S - 9% DOM S - 6%
TETCO M2 - 7%
TETCO M2 - 6%
TCO 24%
TCO 16%
TCO - 9%
NYMEX8%
NYMEX11%
NYMEX10%
Gulf Coast18%
Gulf Coast38%
Gulf Coast56%
Chicago21%
Chicago20%
Chicago19%
0%
10%
20%
30%
40%
50%
60%
70%
80%
90%
100%
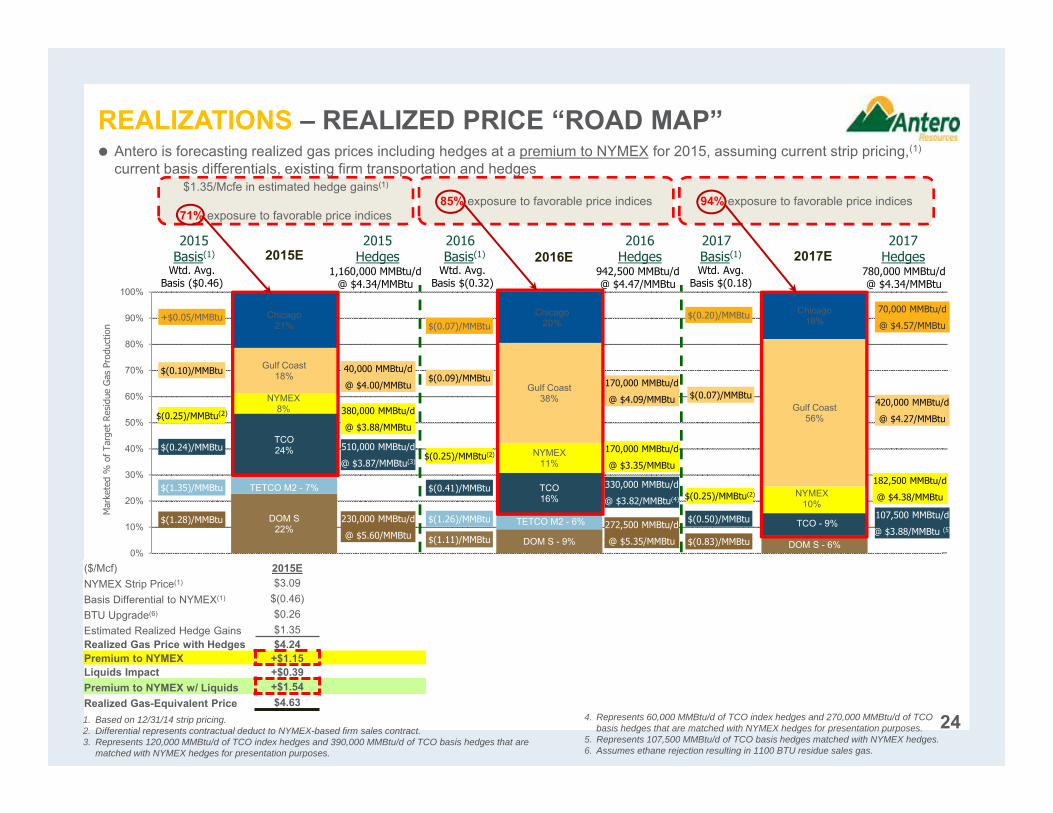
($/Mcf) 2015ENYMEX Strip Price(1) $3.09Basis Differential to NYMEX(1) $(0.46)BTU Upgrade(6) $0.26 Estimated Realized Hedge Gains $1.35 Realized Gas Price with Hedges $4.24 Premium to NYMEX +$1.15Liquids Impact +$0.39Premium to NYMEX w/ Liquids +$1.54Realized Gas-Equivalent Price $4.63
4. Represents 60,000 MMBtu/d of TCO index hedges and 270,000 MMBtu/d of TCO basis hedges that are matched with NYMEX hedges for presentation purposes.
5. Represents 107,500 MMBtu/d of TCO basis hedges matched with NYMEX hedges.6. Assumes ethane rejection resulting in 1100 BTU residue sales gas.
REALIZATIONS – REALIZED PRICE “ROAD MAP”
1. Based on 12/31/14 strip pricing. 2. Differential represents contractual deduct to NYMEX-based firm sales contract.3. Represents 120,000 MMBtu/d of TCO index hedges and 390,000 MMBtu/d of TCO basis hedges that are
matched with NYMEX hedges for presentation purposes.
2015Basis(1)
2016 Basis(1)
2017 Basis(1)
2015Hedges
2016Hedges
2017Hedges
Mar
kete
d %
of T
arge
t Re
sidu
e G
as P
rodu
ctio
n
+$0.05/MMBtu
$(0.25)/MMBtu(2)
$(1.28)/MMBtu
$(0.24)/MMBtu
$(0.07)/MMBtu
$(0.25)/MMBtu(2)
$(1.11)/MMBtu
$(0.41)/MMBtu
$(0.20)/MMBtu
$(0.25)/MMBtu(2)
$(0.83)/MMBtu
$(0.50)/MMBtu
$(0.09)/MMBtu
$(0.07)/MMBtu
182,500 MMBtu/d
@ $4.38/MMBtu
107,500 MMBtu/d
@ $3.88/MMBtu (5)
40,000 MMBtu/d
@ $4.00/MMBtu
230,000 MMBtu/d
@ $5.60/MMBtu
510,000 MMBtu/d
@ $3.87/MMBtu(3)
170,000 MMBtu/d
@ $4.09/MMBtu
272,500 MMBtu/d
@ $5.35/MMBtu
330,000 MMBtu/d
@ $3.82/MMBtu(4)
85% exposure to favorable price indices$1.35/Mcfe in estimated hedge gains(1)
71% exposure to favorable price indices94% exposure to favorable price indices
Antero is forecasting realized gas prices including hedges at a premium to NYMEX for 2015, assuming current strip pricing,(1)
current basis differentials, existing firm transportation and hedges
$(1.35)/MMBtu
$(1.26)/MMBtu
Wtd. Avg.Basis ($0.46)
Wtd. Avg.Basis $(0.32)
1,160,000 MMBtu/d@ $4.34/MMBtu
Wtd. Avg.Basis $(0.18)
942,500 MMBtu/d@ $4.47/MMBtu
420,000 MMBtu/d
@ $4.27/MMBtu
2015E 2016E 2017E
24
380,000 MMBtu/d
@ $3.88/MMBtu
170,000 MMBtu/d
@ $3.35/MMBtu
70,000 MMBtu/d
@ $4.57/MMBtu
780,000 MMBtu/d@ $4.34/MMBtu
$(0.10)/MMBtu
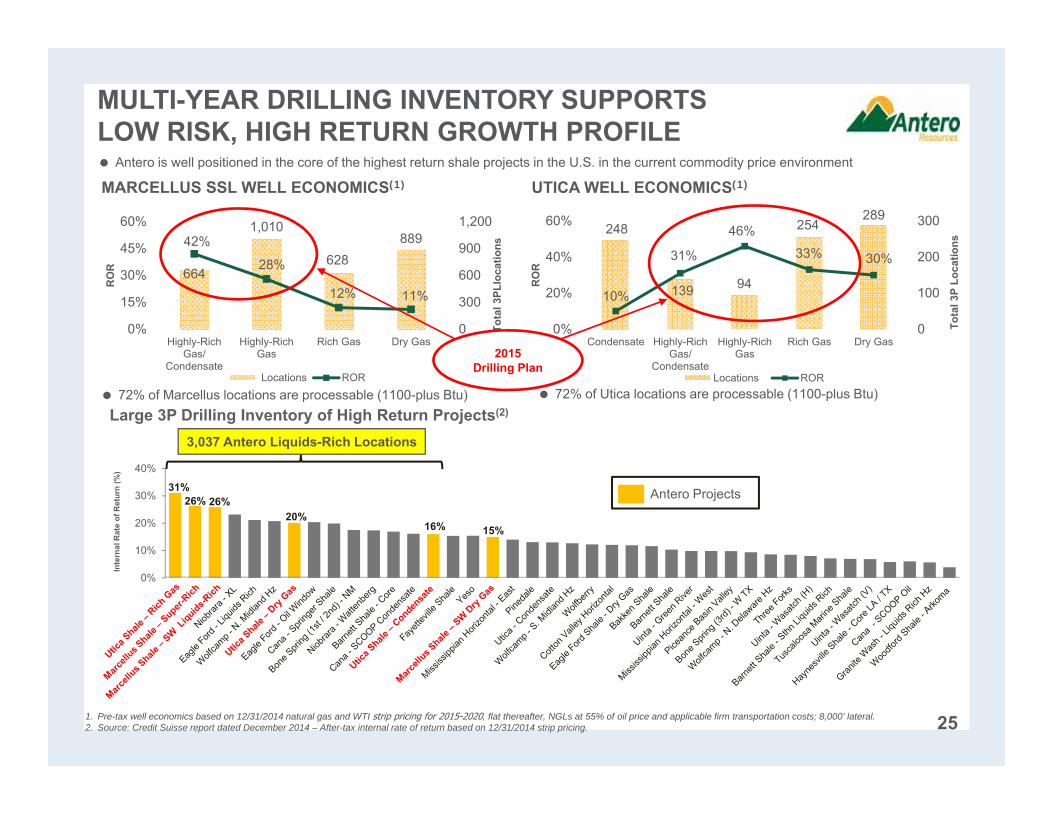
0%
10%
20%
30%
40%
248
139 94
254289
10%
31%
46%
33% 30%
0
100
200
300
0%
20%
40%
60%
Condensate Highly-RichGas/
Condensate
Highly-RichGas
Rich Gas Dry Gas
Tota
l 3P
Loca
tions
RO
R
Locations ROR
MARCELLUS SSL WELL ECONOMICS(1)
664
1,010
62888942%
28%
12% 11%
0
300
600
900
1,200
0%
15%
30%
45%
60%
Highly-RichGas/
Condensate
Highly-RichGas
Rich Gas Dry Gas
Tota
l 3PL
loca
tions
RO
R
Locations ROR
MULTI-YEAR DRILLING INVENTORY SUPPORTS LOW RISK, HIGH RETURN GROWTH PROFILE
Large 3P Drilling Inventory of High Return Projects(2)
1. Pre-tax well economics based on 12/31/2014 natural gas and WTI strip pricing for 2015-2020, flat thereafter, NGLs at 55% of oil price and applicable firm transportation costs; 8,000’ lateral. 2. Source: Credit Suisse report dated December 2014 – After-tax internal rate of return based on 12/31/2014 strip pricing.
26% 26%31%
15%
Inte
rnal
Rat
e of
Ret
urn
(%)
20%
25
UTICA WELL ECONOMICS(1)
72% of Marcellus locations are processable (1100-plus Btu) 72% of Utica locations are processable (1100-plus Btu)
3,037 Antero Liquids-Rich Locations
16%
2015Drilling Plan
Antero Projects
Antero is well positioned in the core of the highest return shale projects in the U.S. in the current commodity price environment
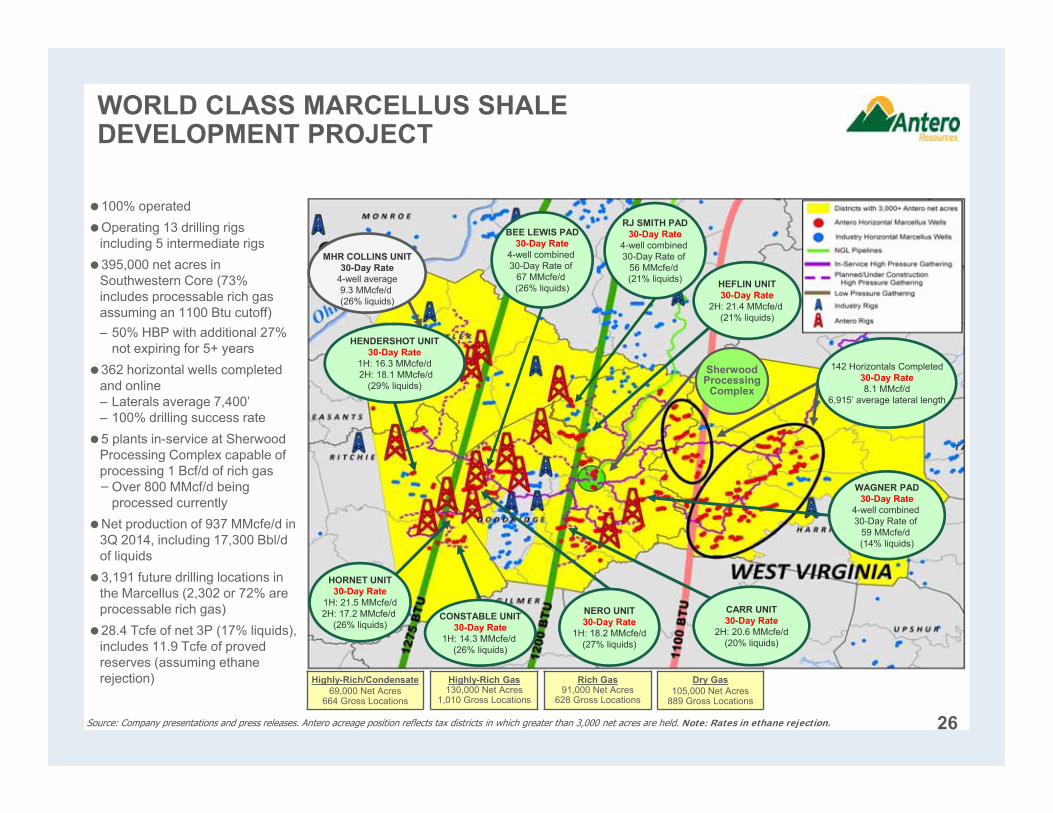
WORLD CLASS MARCELLUS SHALE DEVELOPMENT PROJECT
100% operatedOperating 13 drilling rigs
including 5 intermediate rigs395,000 net acres in
Southwestern Core (73% includes processable rich gas assuming an 1100 Btu cutoff)– 50% HBP with additional 27%
not expiring for 5+ years362 horizontal wells completed
and online– Laterals average 7,400’– 100% drilling success rate5 plants in-service at Sherwood
Processing Complex capable of processing 1 Bcf/d of rich gas−Over 800 MMcf/d being
processed currentlyNet production of 937 MMcfe/d in
3Q 2014, including 17,300 Bbl/d of liquids 3,191 future drilling locations in
the Marcellus (2,302 or 72% are processable rich gas)28.4 Tcfe of net 3P (17% liquids),
includes 11.9 Tcfe of proved reserves (assuming ethane rejection) Highly-Rich Gas
130,000 Net Acres1,010 Gross Locations
Rich Gas91,000 Net Acres
628 Gross Locations
Dry Gas105,000 Net Acres
889 Gross Locations
Highly-Rich/Condensate69,000 Net Acres
664 Gross Locations
HEFLIN UNIT30-Day Rate
2H: 21.4 MMcfe/d (21% liquids)
CONSTABLE UNIT30-Day Rate
1H: 14.3 MMcfe/d (26% liquids)
142 Horizontals Completed30-Day Rate8.1 MMcf/d
6,915’ average lateral length
SherwoodProcessing
Complex
Source: Company presentations and press releases. Antero acreage position reflects tax districts in which greater than 3,000 net acres are held. Note: Rates in ethane rejection.
NERO UNIT30-Day Rate
1H: 18.2 MMcfe/d(27% liquids)
BEE LEWIS PAD30-Day Rate
4-well combined 30-Day Rate of
67 MMcfe/d (26% liquids)
RJ SMITH PAD30-Day Rate
4-well combined 30-Day Rate of
56 MMcfe/d (21% liquids)
26
MHR COLLINS UNIT30-Day Rate
4-well average9.3 MMcfe/d (26% liquids)
HENDERSHOT UNIT30-Day Rate
1H: 16.3 MMcfe/d2H: 18.1 MMcfe/d
(29% liquids)
HORNET UNIT30-Day Rate
1H: 21.5 MMcfe/d2H: 17.2 MMcfe/d
(26% liquids)CARR UNIT30-Day Rate
2H: 20.6 MMcfe/d(20% liquids)
WAGNER PAD30-Day Rate
4-well combined 30-Day Rate of
59 MMcfe/d (14% liquids)
Source: Company presentations and press releases. Note: Antero acreage position reflects townships in which greater than 3,000 net acres are held. Note: Third party peak rates assume ethane recovery; Antero 30-day rates in ethane rejection.1. For non-Antero wells, Antero has converted rich gas rates where BTU has been disclosed to NGLs, assuming ethane recovery. Where BTU has not been disclosed, Antero has estimated BTU and gas
composition.2. 30-day rate reflects restricted choke regime.
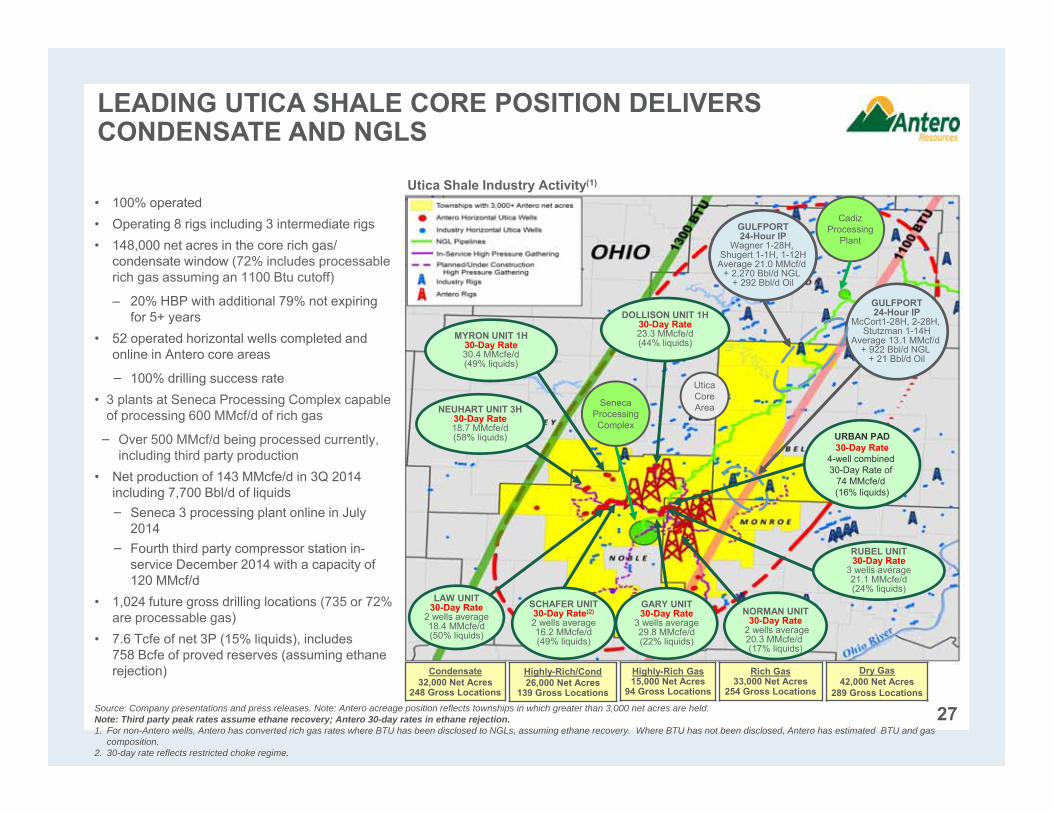
• 100% operated• Operating 8 rigs including 3 intermediate rigs• 148,000 net acres in the core rich gas/
condensate window (72% includes processable rich gas assuming an 1100 Btu cutoff)
– 20% HBP with additional 79% not expiring for 5+ years
• 52 operated horizontal wells completed and online in Antero core areas
− 100% drilling success rate• 3 plants at Seneca Processing Complex capable
of processing 600 MMcf/d of rich gas
− Over 500 MMcf/d being processed currently, including third party production
• Net production of 143 MMcfe/d in 3Q 2014 including 7,700 Bbl/d of liquids− Seneca 3 processing plant online in July
2014− Fourth third party compressor station in-
service December 2014 with a capacity of 120 MMcf/d
• 1,024 future gross drilling locations (735 or 72% are processable gas)
• 7.6 Tcfe of net 3P (15% liquids), includes 758 Bcfe of proved reserves (assuming ethane rejection)
LEADING UTICA SHALE CORE POSITION DELIVERS CONDENSATE AND NGLS
27
Utica Shale Industry Activity(1)
CadizProcessing
Plant
NORMAN UNIT30-Day Rate
2 wells average20.3 MMcfe/d (17% liquids)
RUBEL UNIT30-Day Rate
3 wells average21.1 MMcfe/d(24% liquids)
GULFPORT24-Hour IP
McCort1-28H, 2-28H, Stutzman 1-14H
Average 13.1 MMcf/d + 922 Bbl/d NGL
+ 21 Bbl/d Oil
GULFPORT24-Hour IP
Wagner 1-28H, Shugert 1-1H, 1-12H
Average 21.0 MMcf/d + 2,270 Bbl/d NGL
+ 292 Bbl/d Oil
Utica Core Area
GARY UNIT30-Day Rate
3 wells average29.8 MMcfe/d(22% liquids)
Highly-Rich/Cond26,000 Net Acres
139 Gross Locations
Highly-Rich Gas15,000 Net Acres
94 Gross Locations
Rich Gas33,000 Net Acres
254 Gross Locations
Dry Gas42,000 Net Acres
289 Gross Locations
NEUHART UNIT 3H30-Day Rate18.7 MMcfe/d(58% liquids)
Condensate32,000 Net Acres
248 Gross Locations
DOLLISON UNIT 1H30-Day Rate23.3 MMcfe/d(44% liquids)
MYRON UNIT 1H30-Day Rate30.4 MMcfe/d(49% liquids)
SenecaProcessingComplex
LAW UNIT30-Day Rate
2 wells average18.4 MMcfe/d(50% liquids)
SCHAFER UNIT30-Day Rate(2)
2 wells average16.2 MMcfe/d(49% liquids)
URBAN PAD30-Day Rate
4-well combined 30-Day Rate of
74 MMcfe/d (16% liquids)
APPENDIX
28
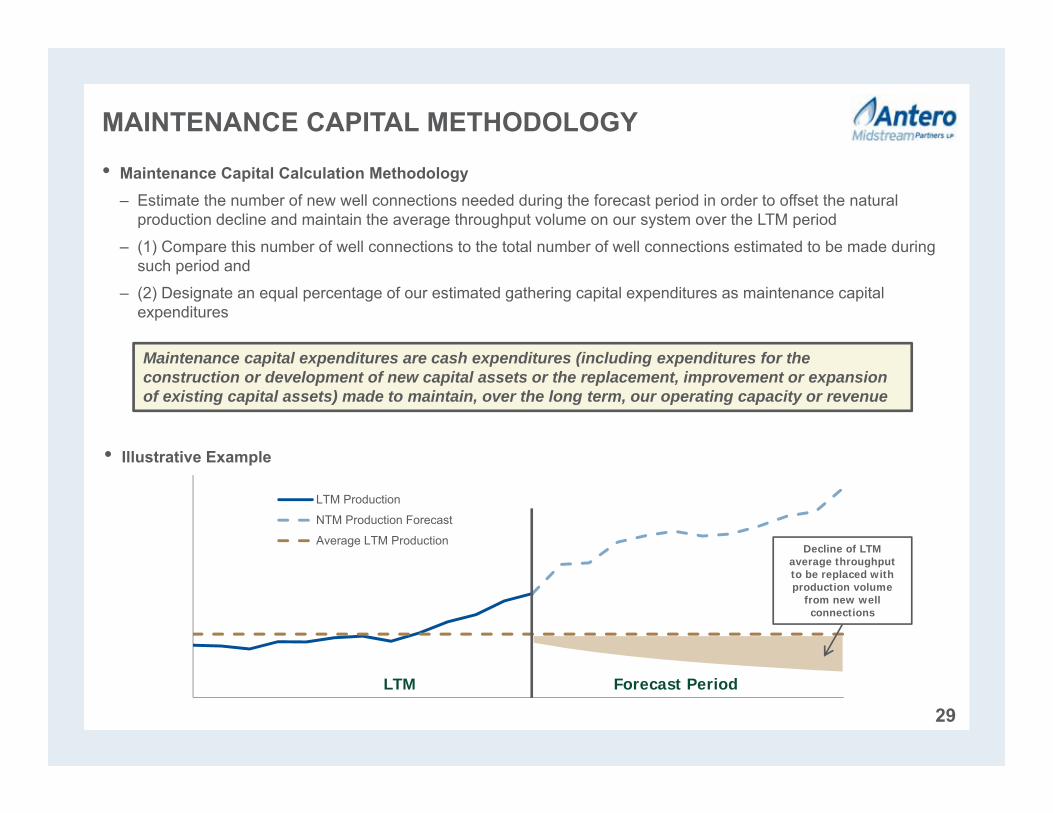
LTM Production
NTM Production Forecast
Average LTM Production
MAINTENANCE CAPITAL METHODOLOGY
• Maintenance Capital Calculation Methodology– Estimate the number of new well connections needed during the forecast period in order to offset the natural
production decline and maintain the average throughput volume on our system over the LTM period
– (1) Compare this number of well connections to the total number of well connections estimated to be made during such period and
– (2) Designate an equal percentage of our estimated gathering capital expenditures as maintenance capital expenditures
29
Maintenance capital expenditures are cash expenditures (including expenditures for the construction or development of new capital assets or the replacement, improvement or expansion of existing capital assets) made to maintain, over the long term, our operating capacity or revenue
• Illustrative Example
LTM Forecast Period
Decline of LTM average throughput to be replaced with production volume
from new well connections
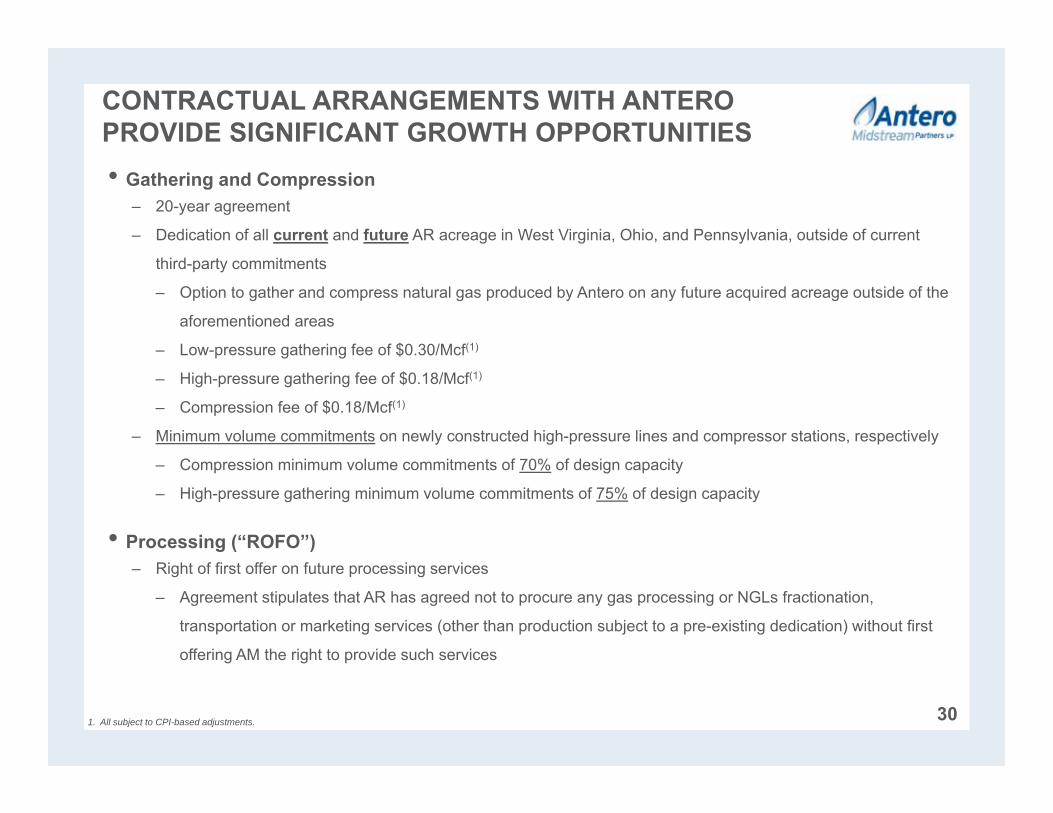
CONTRACTUAL ARRANGEMENTS WITH ANTERO PROVIDE SIGNIFICANT GROWTH OPPORTUNITIES
30
• Gathering and Compression – 20-year agreement
– Dedication of all current and future AR acreage in West Virginia, Ohio, and Pennsylvania, outside of current
third-party commitments
– Option to gather and compress natural gas produced by Antero on any future acquired acreage outside of the
aforementioned areas
– Low-pressure gathering fee of $0.30/Mcf(1)
– High-pressure gathering fee of $0.18/Mcf(1)
– Compression fee of $0.18/Mcf(1)
– Minimum volume commitments on newly constructed high-pressure lines and compressor stations, respectively
– Compression minimum volume commitments of 70% of design capacity
– High-pressure gathering minimum volume commitments of 75% of design capacity
• Processing (“ROFO”)– Right of first offer on future processing services
– Agreement stipulates that AR has agreed not to procure any gas processing or NGLs fractionation,
transportation or marketing services (other than production subject to a pre-existing dedication) without first
offering AM the right to provide such services
1. All subject to CPI-based adjustments.
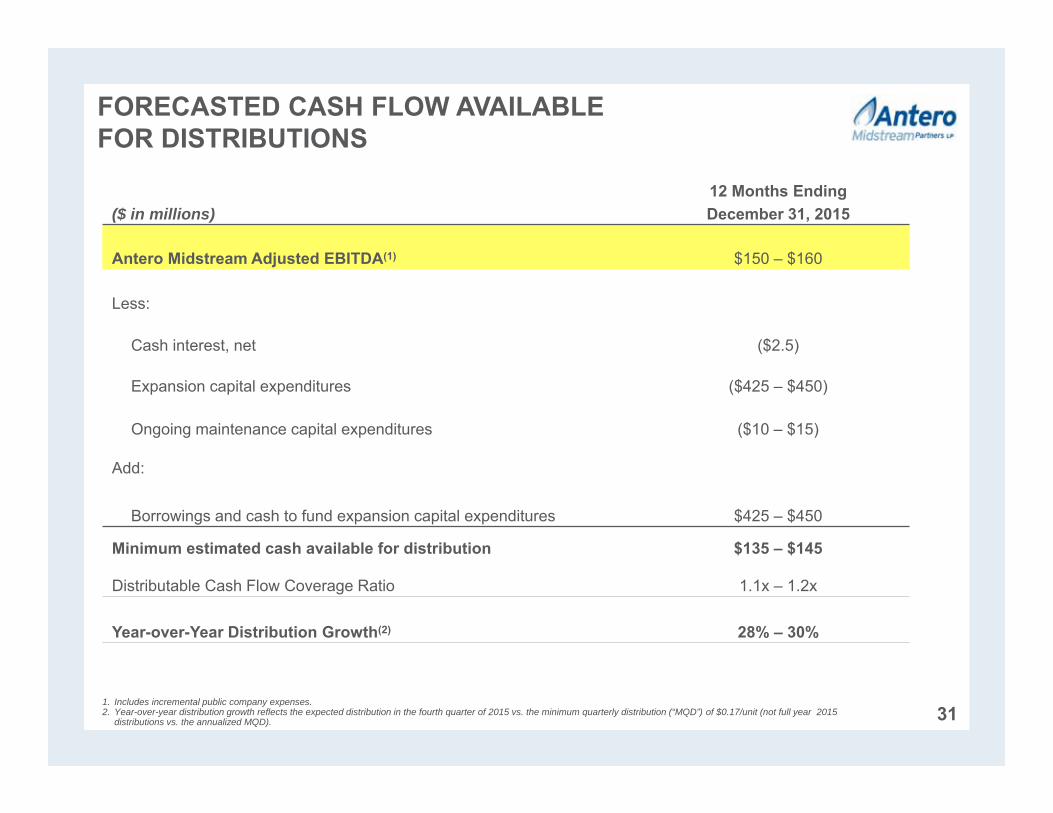
FORECASTED CASH FLOW AVAILABLEFOR DISTRIBUTIONS
31
12 Months Ending($ in millions) December 31, 2015
Antero Midstream Adjusted EBITDA(1) $150 – $160
Less:
Cash interest, net ($2.5)
Expansion capital expenditures ($425 – $450)
Ongoing maintenance capital expenditures ($10 – $15)
Add:
Borrowings and cash to fund expansion capital expenditures $425 – $450
Minimum estimated cash available for distribution $135 – $145
Distributable Cash Flow Coverage Ratio 1.1x – 1.2x
Year-over-Year Distribution Growth(2) 28% – 30%
1. Includes incremental public company expenses.2. Year-over-year distribution growth reflects the expected distribution in the fourth quarter of 2015 vs. the minimum quarterly distribution (“MQD”) of $0.17/unit (not full year 2015
distributions vs. the annualized MQD).
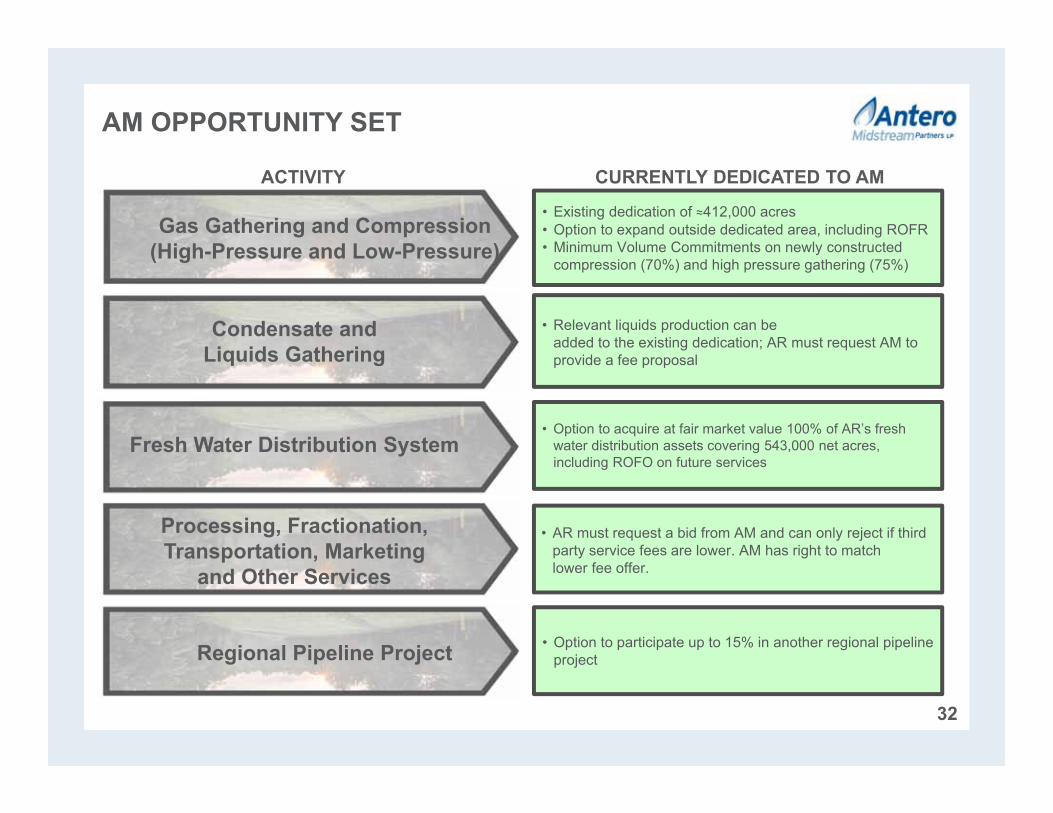
AM OPPORTUNITY SET
32
ACTIVITY CURRENTLY DEDICATED TO AM
Gas Gathering and Compression (High-Pressure and Low-Pressure)
Condensate and Liquids Gathering
Fresh Water Distribution System
Processing, Fractionation, Transportation, Marketing
and Other Services
• Existing dedication of ≈412,000 acres• Option to expand outside dedicated area, including ROFR• Minimum Volume Commitments on newly constructed
compression (70%) and high pressure gathering (75%)
Regional Pipeline Project • Option to participate up to 15% in another regional pipeline project
• Relevant liquids production can be added to the existing dedication; AR must request AM to provide a fee proposal
• Option to acquire at fair market value 100% of AR’s fresh water distribution assets covering 543,000 net acres, including ROFO on future services
• AR must request a bid from AM and can only reject if third party service fees are lower. AM has right to match lower fee offer.
0%
20%
40%
60%
80%
100%
$3.00 $3.50 $4.00 $4.50 $5.00 $5.50 $6.00
Pre-
Tax
RO
R (%
)
Highly-Rich Gas/Condensate Highly-Rich Gas Rich Gas Dry Gas
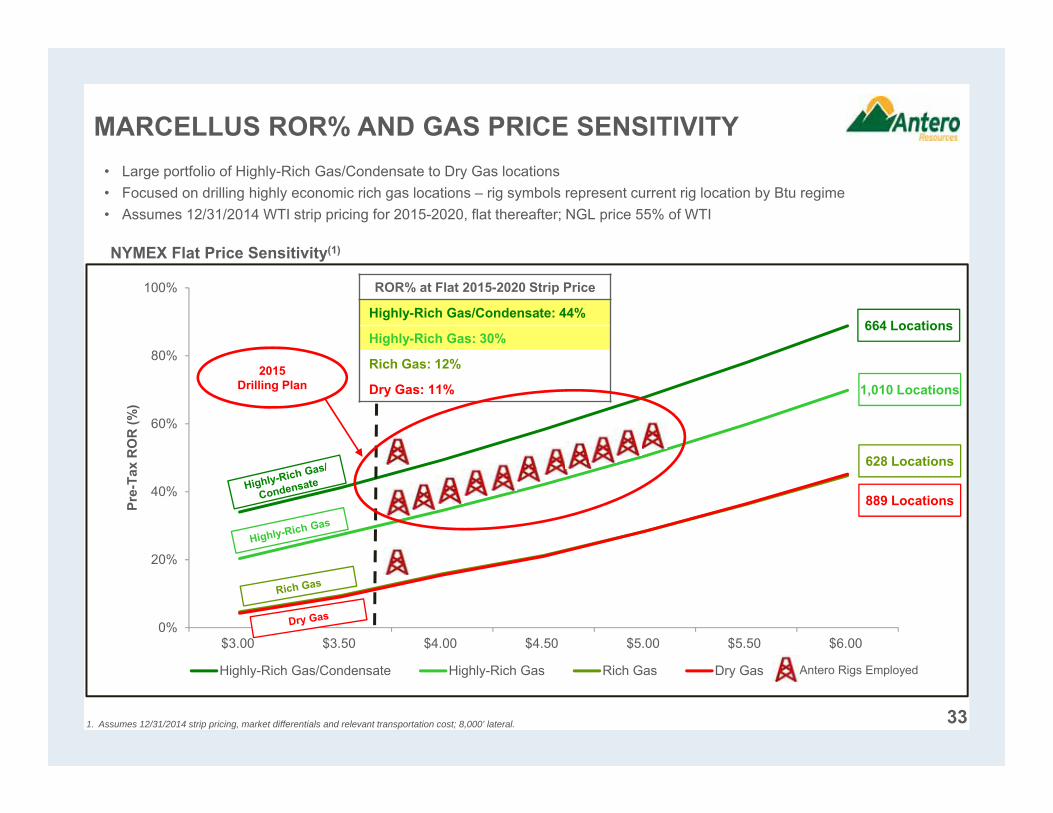
MARCELLUS ROR% AND GAS PRICE SENSITIVITY
331. Assumes 12/31/2014 strip pricing, market differentials and relevant transportation cost; 8,000’ lateral.
• Large portfolio of Highly-Rich Gas/Condensate to Dry Gas locations• Focused on drilling highly economic rich gas locations – rig symbols represent current rig location by Btu regime• Assumes 12/31/2014 WTI strip pricing for 2015-2020, flat thereafter; NGL price 55% of WTI
NYMEX Flat Price Sensitivity(1)
ROR% at Flat 2015-2020 Strip Price
Highly-Rich Gas/Condensate: 44%
Highly-Rich Gas: 30%
Rich Gas: 12%
Dry Gas: 11%
664 Locations
1,010 Locations
628 Locations
889 Locations
Antero Rigs Employed
2015Drilling Plan
0%
20%
40%
60%
80%
100%
120%
140%
160%
180%
200%
$3.00 $3.50 $4.00 $4.50 $5.00 $5.50 $6.00
Pre-
Tax
RO
R (%
)
Condensate Highly-Rich Gas/Condensate Highly-Rich Gas Rich Gas Dry Gas
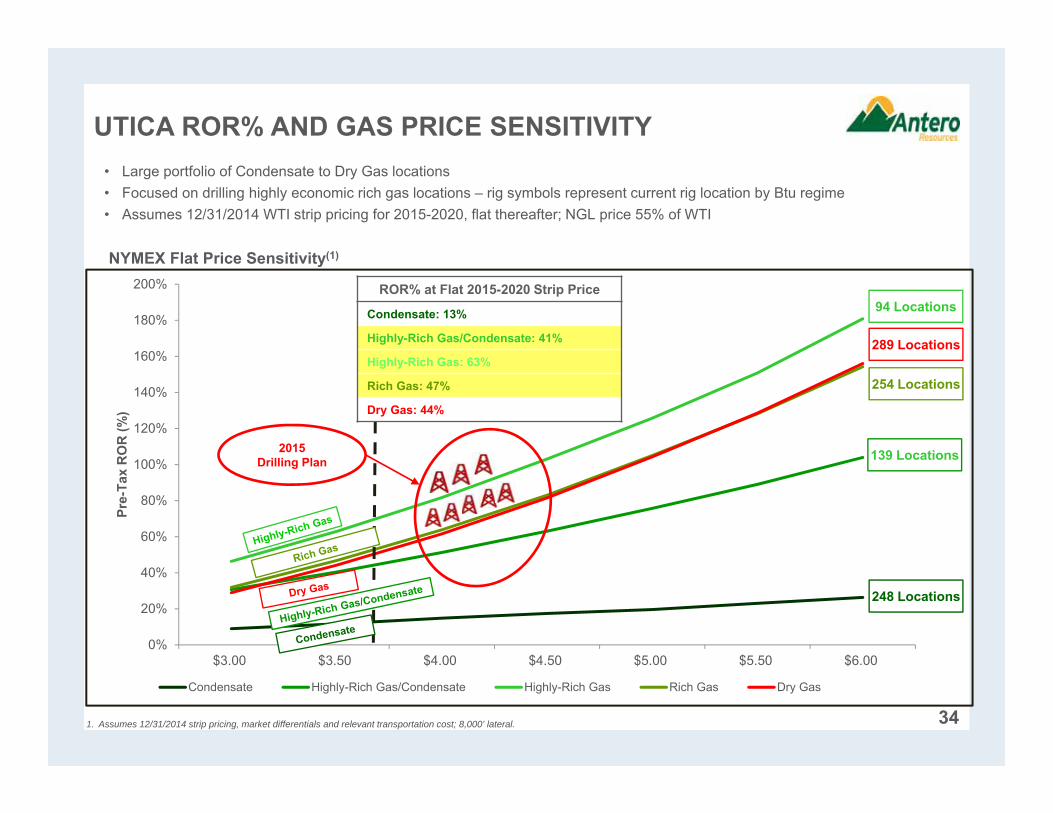
UTICA ROR% AND GAS PRICE SENSITIVITY
34
NYMEX Flat Price Sensitivity(1)
94 LocationsROR% at Flat 2015-2020 Strip Price
Condensate: 13%
Highly-Rich Gas/Condensate: 41%
Highly-Rich Gas: 63%
Rich Gas: 47%
Dry Gas: 44%
• Large portfolio of Condensate to Dry Gas locations• Focused on drilling highly economic rich gas locations – rig symbols represent current rig location by Btu regime• Assumes 12/31/2014 WTI strip pricing for 2015-2020, flat thereafter; NGL price 55% of WTI
1. Assumes 12/31/2014 strip pricing, market differentials and relevant transportation cost; 8,000’ lateral.
254 Locations
139 Locations
289 Locations
248 Locations
2015Drilling Plan
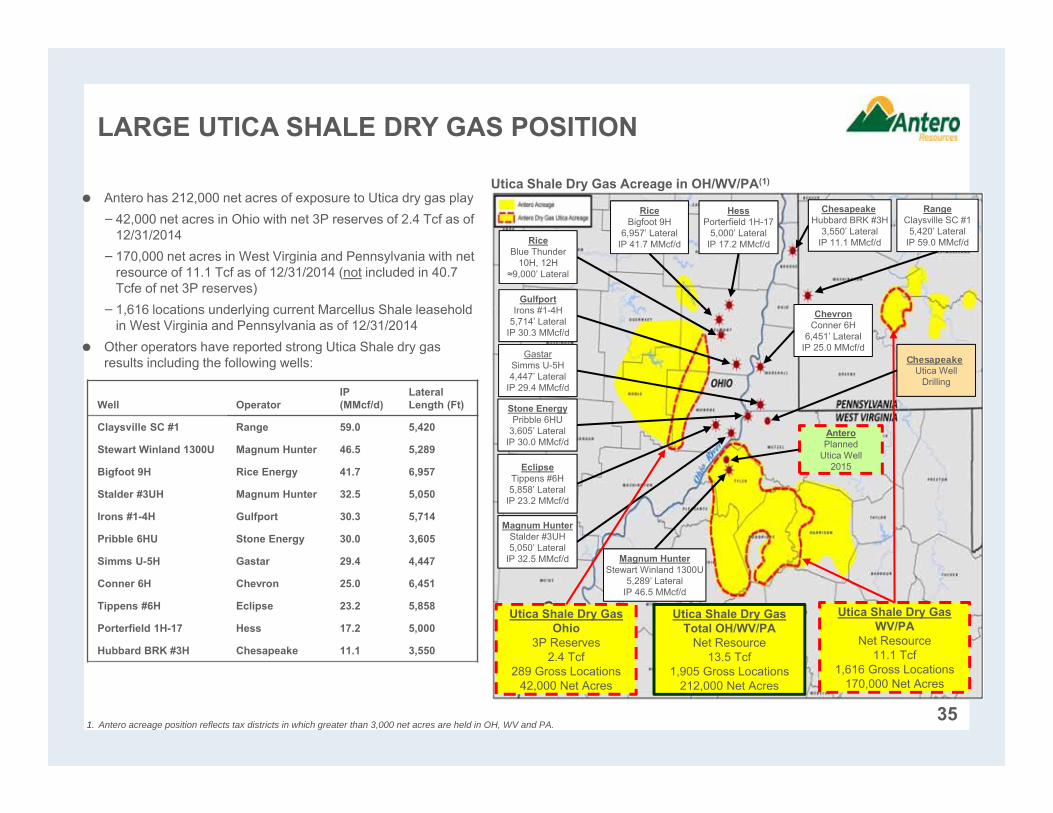
LARGE UTICA SHALE DRY GAS POSITION
35
Antero has 212,000 net acres of exposure to Utica dry gas play− 42,000 net acres in Ohio with net 3P reserves of 2.4 Tcf as of
12/31/2014− 170,000 net acres in West Virginia and Pennsylvania with net
resource of 11.1 Tcf as of 12/31/2014 (not included in 40.7 Tcfe of net 3P reserves)
− 1,616 locations underlying current Marcellus Shale leasehold in West Virginia and Pennsylvania as of 12/31/2014
Other operators have reported strong Utica Shale dry gas results including the following wells:
ChesapeakeHubbard BRK #3H
3,550’ LateralIP 11.1 MMcf/d
HessPorterfield 1H-17
5,000’ LateralIP 17.2 MMcf/d
GulfportIrons #1-4H
5,714’ LateralIP 30.3 MMcf/d
EclipseTippens #6H5,858’ Lateral
IP 23.2 MMcf/d
Magnum HunterStalder #3UH5,050’ Lateral
IP 32.5 MMcf/d
AnteroPlanned
Utica Well2015
Well OperatorIP(MMcf/d)
Lateral Length (Ft)
Claysville SC #1 Range 59.0 5,420
Stewart Winland 1300U Magnum Hunter 46.5 5,289
Bigfoot 9H Rice Energy 41.7 6,957
Stalder #3UH Magnum Hunter 32.5 5,050
Irons #1-4H Gulfport 30.3 5,714
Pribble 6HU Stone Energy 30.0 3,605
Simms U-5H Gastar 29.4 4,447
Conner 6H Chevron 25.0 6,451
Tippens #6H Eclipse 23.2 5,858
Porterfield 1H-17 Hess 17.2 5,000
Hubbard BRK #3H Chesapeake 11.1 3,550
1. Antero acreage position reflects tax districts in which greater than 3,000 net acres are held in OH, WV and PA.
Magnum HunterStewart Winland 1300U
5,289’ LateralIP 46.5 MMcf/d
RangeClaysville SC #1
5,420’ LateralIP 59.0 MMcf/d
ChevronConner 6H
6,451’ LateralIP 25.0 MMcf/d
GastarSimms U-5H4,447’ Lateral
IP 29.4 MMcf/d
Utica Shale Dry Gas Acreage in OH/WV/PA(1)
RiceBigfoot 9H
6,957’ LateralIP 41.7 MMcf/d
Utica Shale Dry GasWV/PA
Net Resource11.1 Tcf
1,616 Gross Locations170,000 Net Acres
Utica Shale Dry GasOhio
3P Reserves2.4 Tcf
289 Gross Locations42,000 Net Acres
Utica Shale Dry GasTotal OH/WV/PA
Net Resource13.5 Tcf
1,905 Gross Locations212,000 Net Acres
Stone EnergyPribble 6HU
3,605’ LateralIP 30.0 MMcf/d
ChesapeakeUtica Well
Drilling
RiceBlue Thunder
10H, 12H≈9,000’ Lateral
Needed to make up for base declines in conventional and GOM production
? ??
3,000 Antero Drilling Locations
Perm
ian
Nio
brar
a
Gra
nite
Was
h
Bar
nett
Hay
nesv
ille
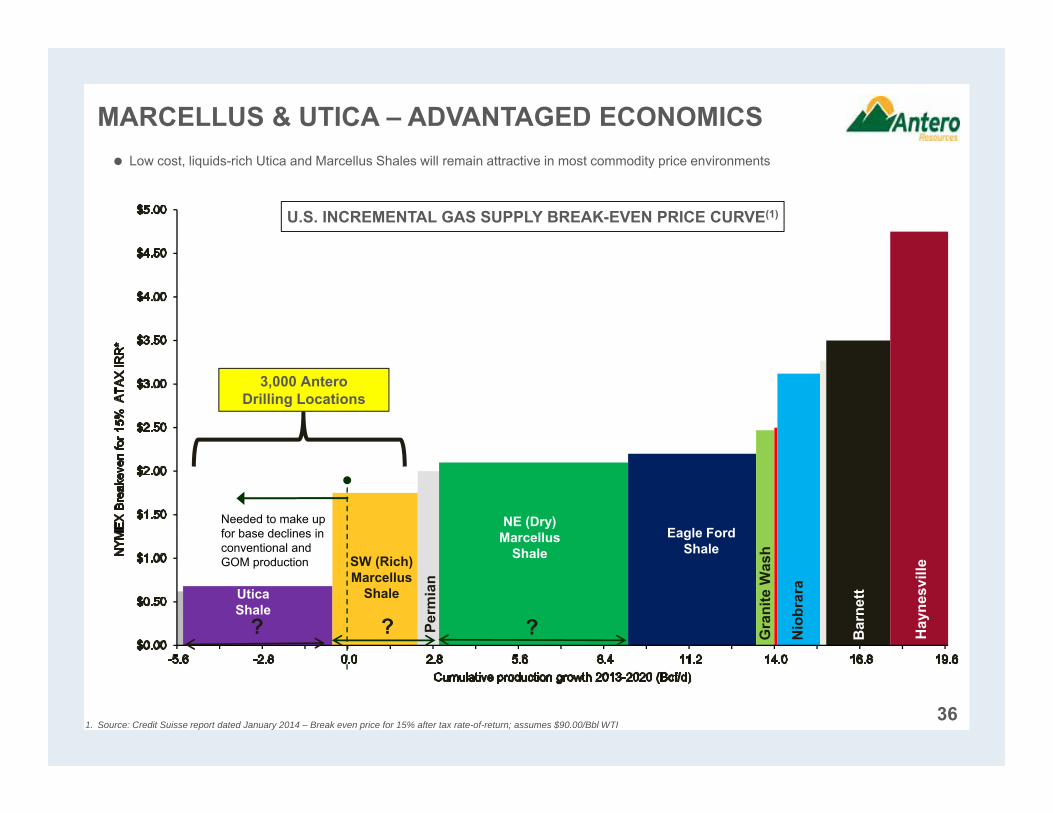
U.S. INCREMENTAL GAS SUPPLY BREAK-EVEN PRICE CURVE(1)
36
Low cost, liquids-rich Utica and Marcellus Shales will remain attractive in most commodity price environments
Utica Shale
SW (Rich) Marcellus
Shale
1. Source: Credit Suisse report dated January 2014 – Break even price for 15% after tax rate-of-return; assumes $90.00/Bbl WTI
NE (Dry) Marcellus
ShaleEagle Ford
Shale
MARCELLUS & UTICA – ADVANTAGED ECONOMICS
CAUTIONARY NOTE
The SEC permits oil and gas companies, in their filings with the SEC, to disclose only proved, probable and possible reserve estimates (collectively, “3P”). Antero has provided internally generated estimates for proved, probable and possible reserves in this presentation in accordance with SEC guidelines and definitions, which have been audited by Antero’s third-party engineers. Unless otherwise noted, reserve estimates as of December 31, 2014 assume ethane rejection and strip pricing.
Actual quantities that may be ultimately recovered from Antero’s interests may differ substantially from the estimates in this presentation. Factors affecting ultimate recovery include the scope of Antero’s ongoing drilling program, which will be directly affected by commodity prices, the availability of capital, drilling and production costs, availability of drilling services and equipment, drilling results, lease expirations, transportation constraints, regulatory approvals and other factors, and actual drilling results, including geological and mechanical factors affecting recovery rates.
In this presentation:
• “3P reserves” refer to Antero’s estimated aggregate proved, probable and possible reserves as of December 31, 2014. The SEC prohibits companies from aggregating proved, probable and possible reserves in filings with the SEC due to the different levels of certainty associated with each reserve category.
• “EUR,” or “Estimated Ultimate Recovery,” refers to Antero’s internal estimates of per well hydrocarbon quantities that may bepotentially recovered from a hypothetical future well completed as a producer in the area. These quantities do not necessarily constitute or represent reserves within the meaning of the Society of Petroleum Engineer’s Petroleum Resource Management System or the SEC’s oil and natural gas disclosure rules.
• “Condensate” refers to gas having a heat content between 1250 BTU and 1300 BTU in the Utica Shale.
• “Highly-rich gas/condensate” refers to gas having a heat content between 1275 BTU and 1350 BTU in the Marcellus Shale and 1225 BTU and 1250 BTU in the Utica Shale.
• “Highly-rich gas” refers to gas having a heat content between 1200 BTU and 1275 BTU in the Marcellus Shale and 1200 BTU and 1225 BTU in the Utica Shale.
• “Rich gas” refers to gas having a heat content of between 1100 BTU and 1200 BTU.
• “Dry gas” refers to gas containing insufficient quantities of hydrocarbons heavier than methane to allow their commercial extraction or to require their removal in order to render the gas suitable for fuel use.
37
Regarding Hydrocarbon Quantities