am11: diagnostics for measuring and modelling dispersion in nanoparticulate reinforced...
TRANSCRIPT
AM11: Diagnostics for Measuring and Modelling Dispersion in Nanoparticulate Reinforced
Polymers
Polymers: Multiscale Properties
8 November 2007

Friday, 16 November 2007
2
AimsProvide diagnostic tools for quantitative measurement of nanoparticle dispersion in components for production and service inspection purposesProvide predictive models for determining thermal and mechanical properties of nanoparticulate reinforced polymers
RationalePrimary industrial impetus is ensuring sustainability of material properties and functionality ofnanoparticulate reinforced polymeric materials throughout product lifetime through ensuring thatnanoparticles remain in a highly dispersed uniform state, independent of external forces

Friday, 16 November 2007
3
Current Status
No (direct) method available for production or service inspection that can provide accurate quantitative data on the nano-level of size, orientation and spatial distribution of nanoparticles No predictive models for determining the effects of non-uniformity on thermal and mechanical properties.

Friday, 16 November 2007
4
Polymer-Layered Silicate Structure
Conventional Intercalated Exfoliated

Friday, 16 November 2007
5
Polymer-Layered Silicate Structure
Conventional composite Intercalated nanocomposite
Ordered exfoliated nanocomposite Disordered exfoliated nanocomposite

Friday, 16 November 2007
6
Functionality
Dependent on the following:
Spatial and compositional nature of thenanoparticulate fillerSize, orientation and spatial distribution of thenanoparticles in the matrixInterfacial region between filler and matrix

Friday, 16 November 2007
7
Characteristics
Low percolation threshold (~0.1-2.0 vol%)Particle-particle interactions arising at low volume fractions affecting orientation and position of adjacent particles (short range order or correlation)High particle density per particle volume (106-108
particles/mm3)High surface (interfacial) area to volume ratio (103-104
m2/ml)Short inter-particle separation (~10-50 nm for 1-8 vol%)Comparable dimensions for particulate particle separation and relaxation volume of polymer chains

Friday, 16 November 2007
8
Concern
Electrical, thermal or chemical exposure, or subsequent processing activities may cause nanoparticle clustering, thus compromising the beneficial effects, such as improved thermal stability, stiffness, strength and impact resistance through the addition of small volumes of nanoparticles (1-5 vol %)
clustering
Silica reinforced PMMA
(1.2% w/w)

Friday, 16 November 2007
9
Deliverables
D1: Critique of techniques and predictive analysis for characterising nanoparticle dispersion and thermal and mechanical properties of nanocomposite materials NPL Report (December 2007)D2: Dispersion monitoring technique to enable rapid quantifiable spatial and temporal distribution data ofnanoparticles in polymeric materials (inc. case study)Scientific paper (March 2010)D3: Predictive model(s) for characterising dispersednanoparticulate polymeric materials.Scientific paper/CoDA module (February 2010)

Friday, 16 November 2007
10
Work Programme
D2: Dispersion Monitoring TechniqueDevelopment of a new measurement tool to enable rapid quantifiable spatial and temporal distribution data of nanoparticlesin polymeric materials resulting from post-processing migration due to electrical, thermal and chemical effects. Evaluation to include a number of industrial supplied nanoparticulate polymeric systems (case study) exposed to controlled test environments.
D3: Predictive ModelsDevelopment of structure-property relationships for characterisation of thermal and mechanical properties of dispersed nanoparticulate polymeric materials. Modelling to accommodate various degrees of dispersion (i.e. clustering). Predictive analysis to be compared with case study results to becarried out in D2.

Friday, 16 November 2007
11
Dispersion Measurement TechniquesLaboratory Based
Atomic force microscopy (AFM)Nuclear magnetic resonance (NMR)Raman spectroscopyScanning electron microscopy (SEM)Small angle neutron scattering (SANS)Transmission electron microscopy (TEM)X-ray diffraction (XRD)
Wide-angle X-ray spectroscopy (WAXS)Small-angle X-ray spectroscopy (SAXS)
In-situ MeasurementsDielectric spectroscopyOptical (diffraction – dynamic light scattering (DLS))Raman spectroscopyThermal (rheology)UltrasonicsX-ray diffraction (XRD) - possibly

Friday, 16 November 2007
12
Dielectric SpectroscopyMeasures the capacitive and conductive properties of materials as a function of temperature, time and frequency under controlled environmentsProvides information on molecular mobility (relaxation) of materials, and can measure permittivity, loss factor and ionic conductivity of solidsDielectric dispersion parameters sensitive to percolation structure, state of dispersion and degree of exfoliation

Friday, 16 November 2007
13
Clay/Polyamide Loading
Material Weight Fraction (%)
Volume Fraction (%)
Density (kg/m3)
Nylon 6 PA-6 - - 1,123 ± 1 PNC1 1.37 ± 0.05 0.76 ± 0.08 1,130 ± 1 PNC2 2.79 ± 0.01 1.67 ± 0.05 1,136 ± 1
Slight increase in density with loading

Friday, 16 November 2007
14
Clay/Polyamide Mechanical Properties
Material Tensile Strength (MPa)
Tensile Modulus (GPa)
Poisson’s Ratio Failure Strain (%)
Nylon 6 PA-6 64.9 ± 2.0 2.93 ± 0.06 0.44 ± 0.01 228 ± 84 PNC1 81.3 ± 1.5 3.91 ± 0.04 0.43 ± 0.01 180 ± 57 PNC2 84.8 ± 0.7 4.52 ± 0.02 0.42 ± 0.01 30.8 ± 1.9
Material Flexure Strength (MPa)
Flexure Modulus (GPa)
Nylon 6 PA-6 109.9 ± 1.0 2.89 ± 0.04 PNC1 137.9 ± 1.5 3.73 ± 0.11 PNC2 143.6 ± 0.9 4.29 ± 0.04 Increase in tensile/flexure strength/modulus with loading
Modulus more sensitive to small changes in loading

Friday, 16 November 2007
15
DMA Results – Clay/PolyamideGlass Transition Temperature (Tg)
Nylon 6 PA-6
(42.6 °C)
PNC2
(52.3 °C)
PNC1
(46.9 °C)
Tg increases with an increase in loading

Friday, 16 November 2007
16
DSC Results – Clay/PolyamideTmelt and Tcrystallinity
Nylon 6 PA-6
(219.7/210.4 °C)
PNC2
(218.9/207.2 °C)
PNC1
(219.2/206.2 °C)
Decrease in Tmelt and Tcrystallinity with addition of clay nanoparticles

Friday, 16 November 2007
17
DMA Results – Silica/PMMAGlass Transition Temperature (Tg)
Tg higher with addition of silica nanoparticles
PMMA
(119.6 °C)
Silica/PMMA
(121.5 °C)

Friday, 16 November 2007
18
DSC Results – Silica/PMMAGlass transition Temperature (Tg)
PMMA
(119.9 °C)
Silica/PMMA
(120.4 °C)
Tg higher with addition of silica nanoparticles

Friday, 16 November 2007
19
x ox o
P K Valavala and G M Odegard
Modelling Approaches

Friday, 16 November 2007
20
Composite Models
Multiple concentric cylinder model (NPL)
Continuum mechanics
Micromechanics
Energy-based models
FEA and BEM
Nanocomposites
Atomistic/molecular dynamics
Continuum mechanics
Micromechanics
Statistical analysis
Modelling Approaches

Friday, 16 November 2007
21
Maxwell’s Far-Field Methodology - Properties of Multi-Phase Isotropic Particulate Composites
Friday, 16 November 2007
22
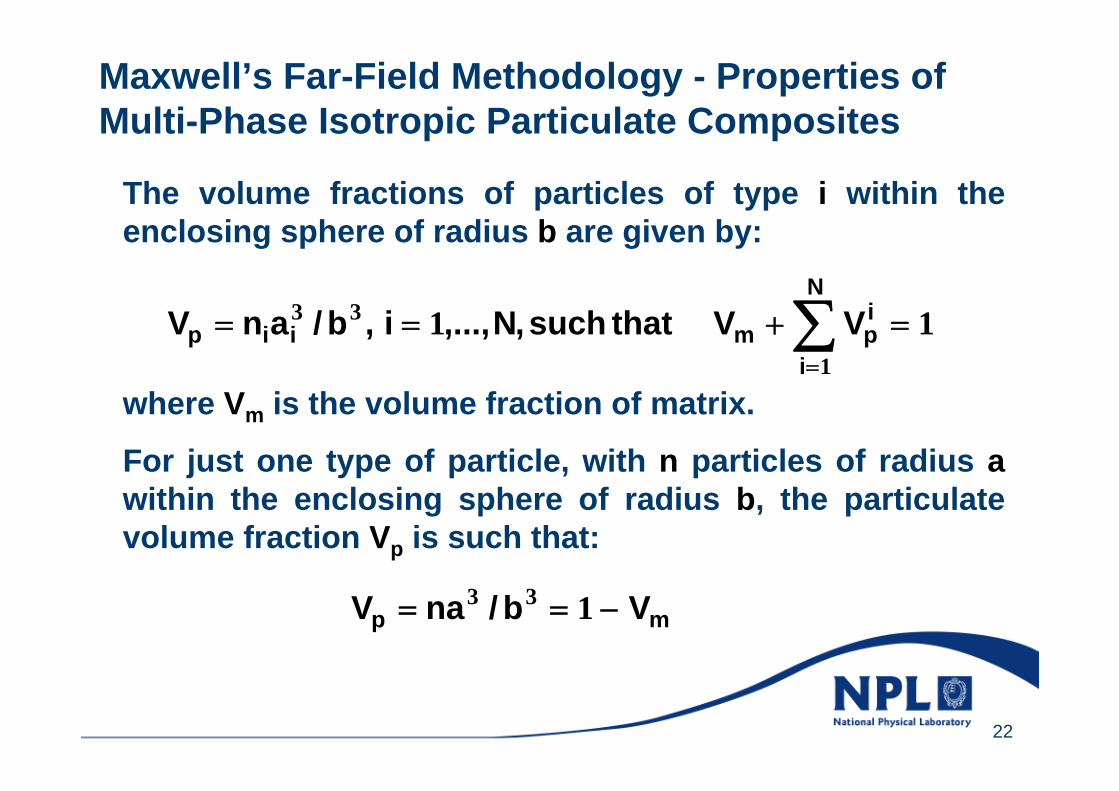
The volume fractions of particles of type i within the enclosing sphere of radius b are given by:
where Vm is the volume fraction of matrix.
For just one type of particle, with n particles of radius awithin the enclosing sphere of radius b, the particulate volume fraction Vp is such that:
111
33 =+== ∑=
N
i
ipmiip VVthatsuch,N,...,i,b/anV
mp Vb/naV −== 133
Maxwell’s Far-Field Methodology - Properties of Multi-Phase Isotropic Particulate Composites

Friday, 16 November 2007
23
Maxwell’s Far-Field Methodology – Bulk Modulus of Silicon Carbide Composite

Friday, 16 November 2007
24
Maxwell’s Far-Field Methodology – Coefficient of Thermal Expansion of Silicon Carbide Composite

Friday, 16 November 2007
25
Case Study: Nanocomposite
PNCs: Clay and silica nanoparticle reinforced PMMA compositesWeight additional levels (wt %)Mechanical properties:
Fracture toughness (impact resistance)Tensile propertiesPermeation
Supplier: Lucite International UK Ltd
Others are welcome

Friday, 16 November 2007
26
Thank you for listening
Any Questions?
Case Studies?

Traceable Size and Shape Measurement on Nanoparticles
and
Dispersion in Polymeric Nano-composites
A project proposal for the Knowledge based programme
Contact: Martin Rides 8 November 2007

Friday, 16 November 2007
28
Traceable Size and Shape Measurements
Particle imaging in concentrated suspensionsSize, shape and distribution
TEM to provide calibration standards for metrology of nanoparticles
3-D Dynamic Light Scattering (DLS)
Surface properties/activiation

Friday, 16 November 2007
29
A problem – how well are nano-fillers dispersed?
Measurements for dispersion
TEM of nylon 6-clay nano-composite
volume ≈ 10-18 m3
mass ≈ 10-15 kg
"Polymer-clay nano-composites" Eds. T J Pinnavaia and G W Beall, Wiley, 2001.
Good dispersion (exfoliation) essential to achieve beneficial properties

Friday, 16 November 2007
30
Dispersion in Polymeric Nano-composites
Investigation of thermal and rheological techniques for assessing dispersion
Thermal: DSC measurement of crystallisation behaviour and glass transition temperature
Rheological: Dynamic rheological measurements
Other properties
Case Studies

Friday, 16 November 2007
31
DSC test data of nylon 6 unfilled (blue) and nano-clay filled (pink) materials: 5, 20 and 80°C/min cooling rates.
-14
-12
-10
-8
-6
-4
-2
130 140 150 160 170 180 190 200 210 220
Temperature, °C
Nor
mal
ized
Hea
t Flo
w E
ndo
Up
(W/g
)
20°C/min Cooling
80°C/min Cooling
Peak 171.683°C
Delta H -46.465 J/g
Peak 185.162°C
Delta H -59.725 J/g
Peak 165.945°CDelta H -58.974 J/g
Peak 155.862°CDelta H -43.686 J/g
5°C/min cooling
Peak 181.733°CDelta H -52.378J/g
Peak 198.930°CDelta H -84.854J/g
U
U
U
F
F
F
Crystallisation Behaviour

Friday, 16 November 2007
32
Dispersion
Measurements for dispersion
Crystallisation temperature/Tgcombined with rheometry, …
QC techniques
TEM of nylon 6-clay nano-composite
"Polymer-clay nano-composites" Eds. T J Pinnavaia and G W Beall, Wiley, 2001.
Your input to development of this proposal welcomed